Article

Backwater Effects in Rivers and Lakes: Case Study of Dongping Lake in China

1
School of Water Conservancy, North China University of Water Resources and Electric Power, Zhengzhou 450046, China
2
Henan Key Laboratory of Hydrosphere and Basin Water Safety, Zhengzhou 450046, China
3
Dongping Lake Authority of Shandong Yellow River Bureau, Tai’an 271018, China
4
Nanjing Hydraulic Research Institute, Nanjing 210029, China
*
Author to whom correspondence should be addressed.
Water 2023, 15(21), 3850; https://doi.org/10.3390/w15213850
Submission received: 13 October 2023 / Revised: 30 October 2023 / Accepted: 2 November 2023 / Published: 4 November 2023

Abstract

:
In the context of global climate change, the frequency of watershed flooding events resulting from extreme rainfall has significantly increased. Especially at river or lake confluences, the presence of backwater effects greatly amplifies the flood risk. To investigate the influence of backwater effects on the hydraulic characteristics of rivers and lakes, this study focuses on the Dongping Lake in China. An enhanced two-dimensional hydrodynamic model was employed to simulate and analyze three different degrees of backwater effects. The results indicate that, compared to the working conditions without the backwater effect, the highest lake water level increased by 1.0 m and 0.1 m under severe and moderate backwater effect conditions, respectively. The total outflow flood volume decreased by 30.1% and 2.3%, respectively. The demolition time for the Jinshan Dam needs to be advanced by 12.5 h and 10.0 h, respectively, and the inundation area in the western region expanded by 2.73% and 0.32%. Additionally, the average inundation depth increased by 0.93 m and 0.08 m, respectively. These results provide valuable data support for the safe operation of Dongping Lake, the formulation of flood defense strategies, and, likewise, offer valuable insights into the risk management of flood events in other rivers and lakes with backwater effects.

1. Introduction

In recent years, in the context of global climate change, there has been a significant increase in extreme hydrological events. Events such as flood disasters caused by hurricanes in the United States [1] and flooding in the Yangtze River basin in China [2] have raised concerns about water-related disasters and flood risks. Within watershed flooding, risks such as riverbank inundation, levee breaches, and dam failures are prevalent, particularly at the confluence of main and tributary channels or at the confluence of rivers and lakes. A unique hydraulic phenomenon known as the backwater effect can occur, leading to a reversal of flow from the main channel to the tributaries or inadequate discharge from the tributaries, consequently elevating flood risk. This poses a significant challenge for the management of watershed flood risks.
Through a review of the literature, it has been found that the backwater effect exists in many watersheds worldwide. For example, in 2020, Lake Victoria in the Nile River Basin experienced severe backwater effects during a Nile River flood event. The elevated water level in the Nile River hindered the outflow of floodwater from Lake Victoria, posing a threat to the surrounding communities and fisheries, resulting in significant losses [3]. In 2001, the Assiniboine River in Canada experienced a flood, and the backwater effect from the Assiniboine River impacted Lake Manitoba and Lake St., leading to a rare flood disaster that turned lakeside areas into wetlands and forced thousands of local residents to evacuate their homes [4]. The three major floods in the Yangtze River in China in 2016, 2017, and 2019 were the result of interactions between the main river channel and lake floods, leading to a regional flood due to mutual backwater effects, placing enormous pressure on the flood control systems in the middle and lower reaches of the Yangtze River [5]. Additionally, some urban flooding events are closely associated with the backwater effect. For example, Jakarta, Indonesia, frequently faces flood threats, partially due to the backwater effect in the river channels. Jakarta experiences frequent urban flooding during the rainy season due to its geographical location and issues with river channels and drainage systems [6].
The backwater effect is an undeniable phenomenon that poses a serious threat to lakes, tributaries, and downstream areas and has been recorded worldwide. These events demonstrate that the backwater effect is an important subject for in-depth research. In previous studies, various flood management measures, including flood control structures, flood forecasting, and other strategies, have been adopted to mitigate and avoid the dangers posed by backwater effects. For example, the completion of the Aswan High Dam on the Nile River in Egypt successfully protected millions of people downstream from the flood threat posed by main and tributary backwater effects [7]. Karunanayake et al. proposed an artificial neural network model based on upstream catchment rainfall to predict the inflow flood of Iranamadu Reservoir in Sri Lanka, significantly improving flood control and water supply in the reservoir, providing effective technical support for the prediction of backwater effects [8]. Jiao et al. introduced a reservoir scheduling strategy based on the CFD-MOEA/D optimization algorithm, making flood control scheduling strategies for reservoirs more intelligent, efficient, and secure, which can provide strategic support for reducing or avoiding backwater effects [9]. In China, Dongping Lake in the Yellow River basin is a typical region affected by backwater effects. This is because the Yellow River is a well-known alluvial river, and downstream of the Yellow River has become a ground-hanging river due to sediment accumulation. Dongping Lake serves as an essential point of connection between the Yellow River and its tributary, the Dawen River. During the flood season, severe backwater effects are present in Dongping Lake.
Based on this, this paper takes China’s Dongping Lake as a case study, introducing the geographical background of the area and exploring the impact of the Yellow River’s backwater effect on the operation of Dongping Lake. By establishing an improved two-dimensional hydrodynamic model, the paper simulates the challenges posed by varying degrees of backwater effects on flood safety in Dongping Lake and provides improvement measures and recommendations. The numerical model introduced in this paper offers a practical, accurate, and effective method for studying the impact of backwater effects. Through this research, we aim to provide strong support for addressing the impact of backwater effects in Dongping Lake and offer valuable experience and insights for researchers in other countries and regions facing similar issues.

2. Study Area

Dongping Lake (116°1′–116°34′ E, 35°43′–36°8′ N) is situated on the right bank at the confluence of the transitional and meandering sections of the lower Yellow River [10], adjacent to the alluvial plain of the lower Yellow River and the Dawen River (Figure 1). The lake is located in Dongping County, Shandong Province, China, and the lake’s main function is to store and regulate floodwaters from the Dawen River. Floodwaters from the Dawen River reach this lake after traveling through an inlet channel of approximately 30 km in length from the Daicun Dam. Excess floodwaters are discharged into the main stream of the Yellow River through the Chenshankou Gate and the Qinghemen Gate, with both gates having a maximum designed discharge capacity of 2500 m3/s. Additionally, the river section downstream of the Daicun Dam in the Dawen River, approximately 30 km in length, is characterized by a very small slope (measured at 0.07‰ in 2021) and is considered part of Dongping Lake, as it has become the backwater area of the lake. Under normal conditions, floodwater from the Dawen River enters the Dongping Lake and is discharged into the Yellow River through the Chenshankou Gate and the Qinghemen Gate. But elevated Yellow River water levels can cause a backwater effect, affecting outflow and impeding the operation of this lake. Therefore, a thorough investigation of the impact of the Yellow River water backwater effect on the operation of the Lake is of utmost importance.
The designed flood control water level for Dongping Lake is 44.72 m (China 1985 National Height Datum). Correspondingly, the storage capacity is 12.28 × 10⁸ m3. After the 1960s, the local residents spontaneously constructed a 5.4 km-long dam (referred to as Jinshan Dam) in Dongping Lake for land reclamation (Figure 2). Eventually, after comprehensive considerations by the local government, Jinshan Dam was retained. Meanwhile, to ensure the safety of the residents living west of Jinshan Dam, risk removal and reinforcement measures were implemented for Jinshan Dam, setting the dam crest elevation at 43.72 m. Additionally, a 300 m-long section on the dam was reserved for controlled blasting to cope with excessive floodwaters that cannot be accommodated in the eastern area of Jinshan Dam. Due to the existence of the Jinshan Dam, Dongping Lake has effectively entered a tiered utilization status. According to the flood control contingency plan, when the water level of Dongping Lake exceeds 43.22 m, the area west of Jinshan Dam will be considered for use.

3. Modeling

3.1. Description of Numerical Models

3.1.1. Governing Equations

In the natural environment, the flow of water bodies is often in three-dimensional form. However, three-dimensional hydrodynamic numerical models are currently limited to small-scale and small-area applications due to their complexity and significant computational workload, and they have not been widely utilized for large-scale water body computations. For common rivers and lakes, the scale along the water depth direction is much smaller than that in the horizontal direction, and the variations of fluid along the water depth are much smaller than those in the horizontal direction. As a result, the flow characteristics of the fluid can be considered to be uniformly distributed along the water depth. Based on this, the governing equations for three-dimensional fluid flow can be integrated along the water depth direction, and after simplification, they can be transformed into the shallow water equations in the following differential form [11]:
The continuity equation is
t ( h ) + x ( h u ) + y ( h v ) = q s
The momentum equation in the direction of x is
t ( h u ) + x ( h u 2 + 1 2 g h 2 ) + y ( h u v ) = 2 h v t u x + h v t ( u y + v x ) + h f v + g h ( S b x S f x )
The momentum equation in the direction of y is
t ( h v ) + y ( h v 2 + 1 2 g h 2 ) + x ( h u v ) = 2 h v t v y + h v t ( u y + v x ) h f u + g h ( S b y S f y )
where h is water depth; t is time; x and y are the two directions of the cartesian coordinate system; u and v are the flow velocities in the x and y directions; qs is the flow source term per unit area; g is gravitational acceleration; f is Coriolis force; Sbx and Sby are the bed slope term in the x and y directions; S b x = Z b / x , S b y = Z b / y , Zb is the elevation of the river bed; Sfx and Sfy are the bed friction term in the x and y directions; S f x = n 2 u u 2 + v 2 / h 4 / 3 , S f y = n 2 v u 2 + v 2 / h 4 / 3 , n is the Manning roughness coefficients; vt is the turbulent viscosity coefficient of water flow; v t = β u h , u* is frictional velocity; β = 0.5.

3.1.2. Numerical Method

In this study, Dongping Lake is divided into two parts, east and west, by Jinshan Dam. When the water level in the east region reaches a certain threshold, it requires urgent opening of a breach through controlled detonation to discharge floodwater into the west region, ensuring the flood safety of the entire lake. Thus, the simulation involves the modeling of the dam breach. For water dynamic simulations involving dam breach or dam failure scenarios, the Total Variation Diminishing (TVD) characteristic is typically essential. In this model, the Finite Volume Method (FVM) based on a non-structured triangular grid is employed to solve Equations (1)–(3).
The use of non-structured triangular grids allows for accurate fitting of complex boundaries found in natural rivers and lakes. The coordinates and elevation information of three vertices in each triangular computational cell facilitate the handling of plane functions and bed slope terms on the grid [12,13]. Additionally, the successful application of the FVM in the model ensures the unconditional satisfaction of conservation [14,15]. The variables are placed at the center of the triangular computational cells, and the boundaries of the computational cells are located on the interfaces between adjacent cells. The Monotone Upstream Scheme for Conservation Laws (MUSCL) method, in combination with the Roe approximate Riemann solver, is utilized in the Roe-MUSCL format to calculate water flux at the interfaces between adjacent computational cells. The MUSCL format with a piecewise linear approximation is used to reconstruct spatial variables accurately, effectively capturing shock interfaces. Moreover, the minmod function is introduced as a flux limiter to eliminate numerical oscillations near water jumps and other discontinuous flows, enabling the calculation to achieve second-order spatial accuracy while maintaining high stability. To discretize the time, the Runge-Kutta prediction-correction method is employed, providing second-order accuracy in time [16,17].

3.1.3. Treatment of Boundary Conditions

The solution of the numerical model relies on the specification of boundary conditions, which are generally classified into two types: land boundaries and open boundaries. Land boundaries refer to the boundaries where no flow is allowed to enter or exit the model domain. When dealing with such boundaries, two principles are followed: Firstly, the no-penetration principle considers the solid boundary as impermeable, resulting in a normal flow velocity of zero at the closed boundary. Secondly, the no-slip principle assumes zero tangential flow velocity at the closed boundary. Open boundaries, permit various material exchanges, including water flow, between the model domain and the outside environment. For open boundaries, water level, discharge, or water level-discharge relationships can be specified based on actual requirements [18]. Additionally, for free outflow type open boundaries, the normal gradients of variables at the boundary can be directly assumed to be zero.

3.1.4. Treatment of Wet-Dry Varying Boundary

In the computational process of the numerical model, as the boundary conditions at model inlets and outlets continuously change, the area of submerged regions within the simulation domain varies. When the water depth increases, the submerged area expands, and when the water levels decrease, certain previously submerged areas re-emerge [19]. In practice, if a location has never been submerged or was submerged in the previous time step but reappears in the current calculation due to a drop in water levels, both flow velocity and water depth at that particular location should be set to zero. However, assigning water depth or flow velocity values of zero or values very close to zero in numerical computations may lead to errors, such as division by zero, computer value overflow, or non-convergence of iterative calculations. These issues can ultimately cause the numerical model computation to terminate or the program to crash. Therefore, specific methods need to be adopted to handle these varying boundary condition problems. In many past numerical models, researchers have utilized the minimum water depth on computational cells to define their wet-dry properties [20]. In this study, this approach is applied to a non-structured triangular grid, and the specific steps are as follows:
(a)
Definition of Wet and Dry Grids. A threshold value, hdw, is defined to determine wet and dry grids, and in this case, hdw is set to 0.1 m.
(b)
Determination of Wet-Dry Property for Each Computational Cell. Before commencing the computation at each time step, the wet-dry property of each computational cell is assessed. Firstly, the minimum water depth, hmin, of a specific computational cell is calculated using Equation (4):
h m i n = min ( h 1 , h 2 , h 3 )
where h1, h2, and h3 represent the water depths at the three vertices of the triangular computational cell.
Next, the wet-dry property flag, DWcode, for the cell is determined using Equation (5):
D W c o d e = { 0 i f ( h m i n h d w ) 1 i f ( h m i n > h d w )
If DWcode = 0, the computational cell will be directly excluded from the numerical computation in the subsequent time step and will not participate in the calculation. Conversely, if DWcode = 1, the computational cell will be included in the computation. By employing this method, not only can the aforementioned issues be resolved effectively, but also the number of participating computational cells is reduced, significantly reducing the computational time expenditure.

3.1.5. Methodology for Dam Breach Simulation

As the dam breach in this case involves a rapid artificial blasting process, the development of the breach shape is extremely brief. Therefore, the complex natural development of the breach can be directly neglected, and the numerical simulation of instantaneous dam breach can be achieved through the following steps:
(a)
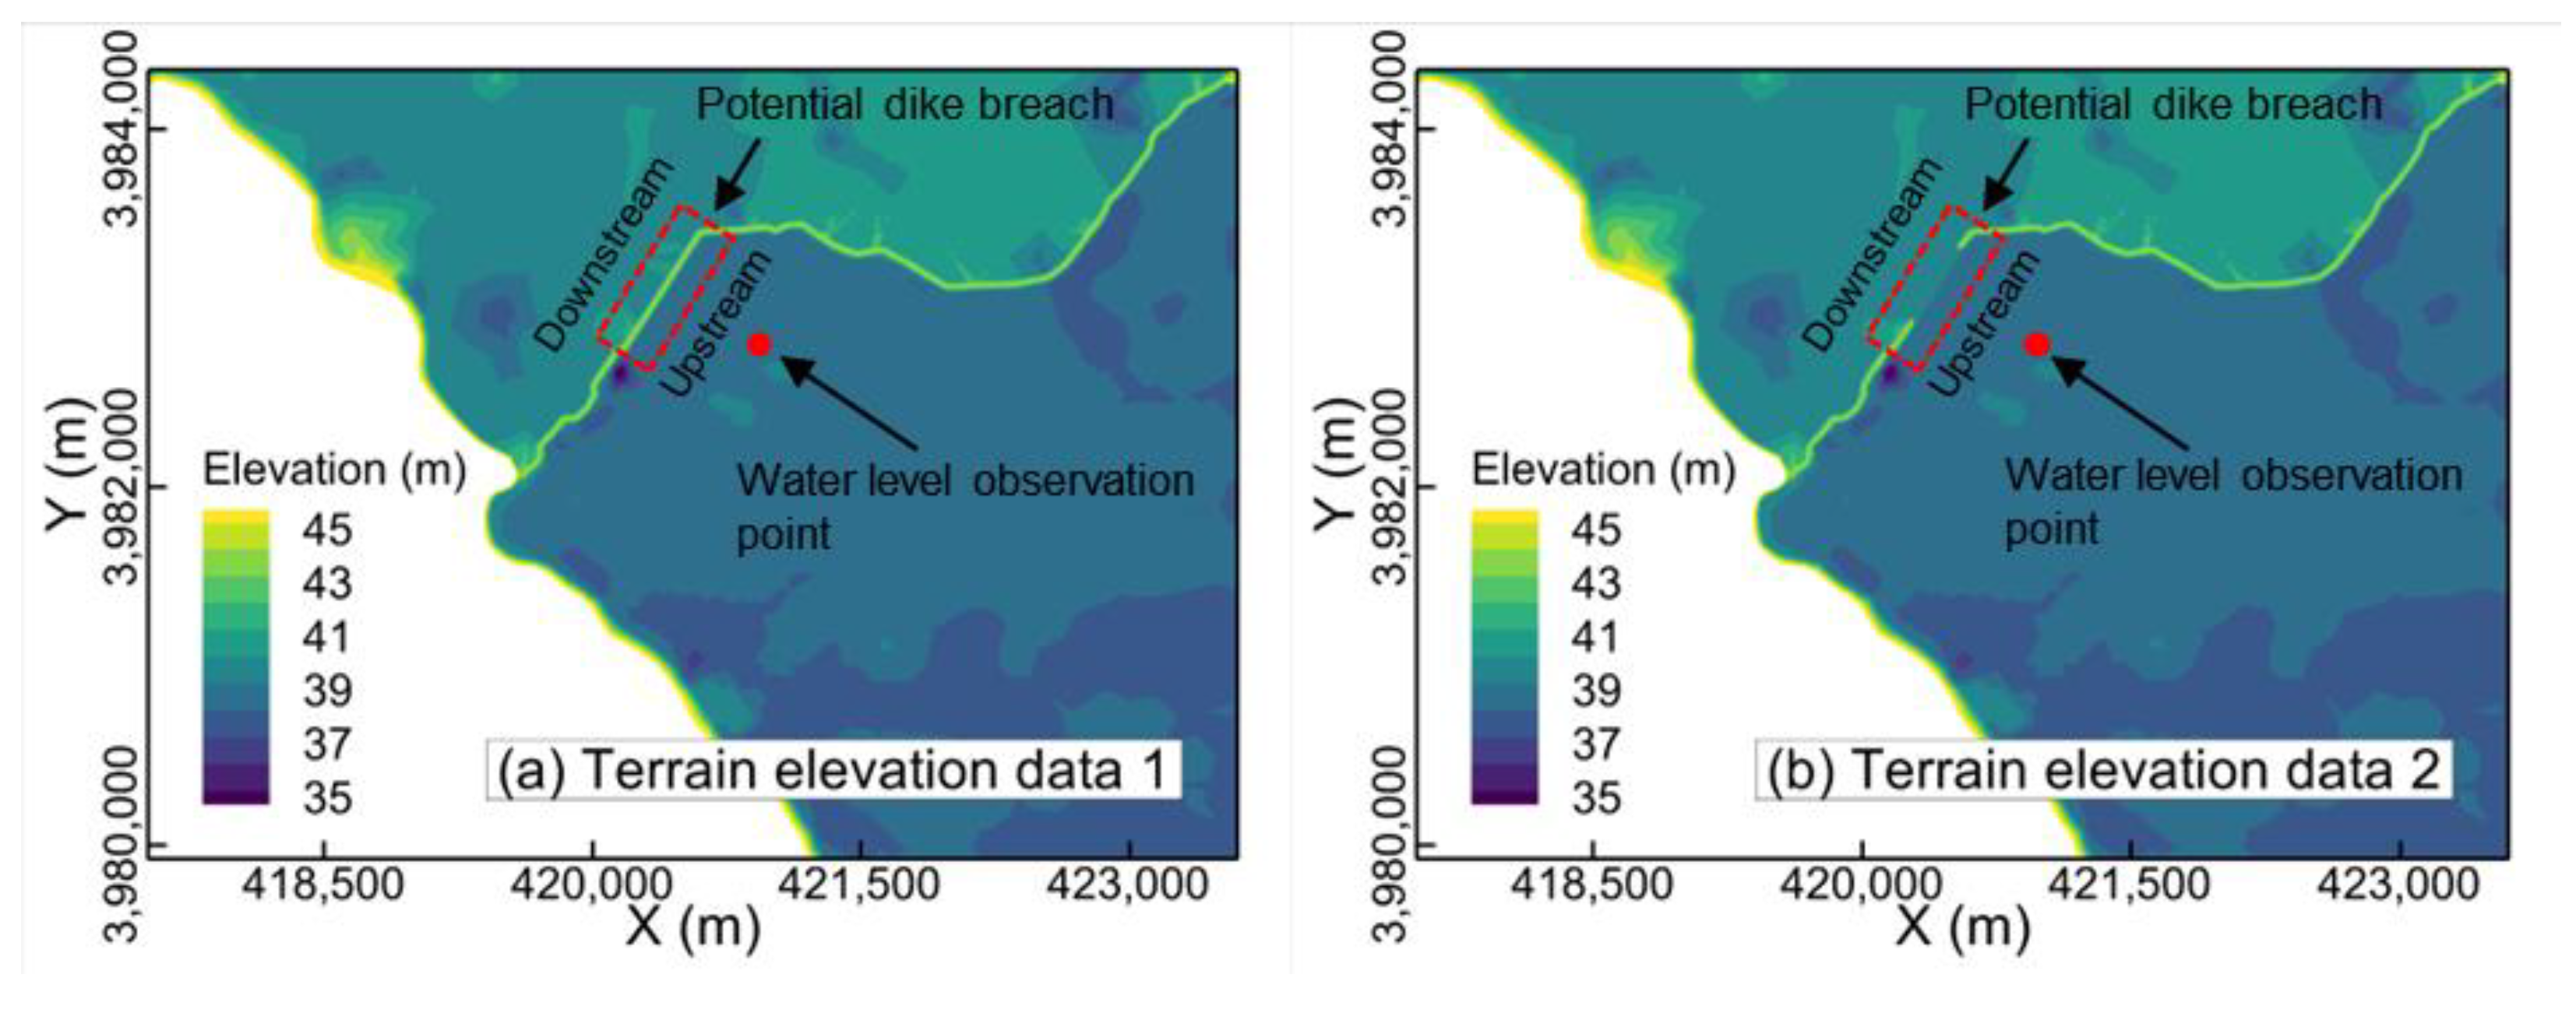
Set up a water level observation point upstream of the pre-defined blasting point on the dam crest;
(b)
Introduce a second set of topographical data in the input file, where the shape of the breached dam has been modified. Apart from this modification, all other information in the second set of topographical data remains identical to the first set;
(c)
Before the commencement of the actual computation process in each time step, assess whether the water level has reached the pre-defined breach water level;
(d)
If the water level at the observation point meets or exceeds the breach water level, update the topographical data to the second set of data (Figure 3). Moreover, to ensure the smooth flow of water through the breach and downstream, this updating process is scheduled before the grid wet-dry determination step.

3.2. Design of Working Conditions

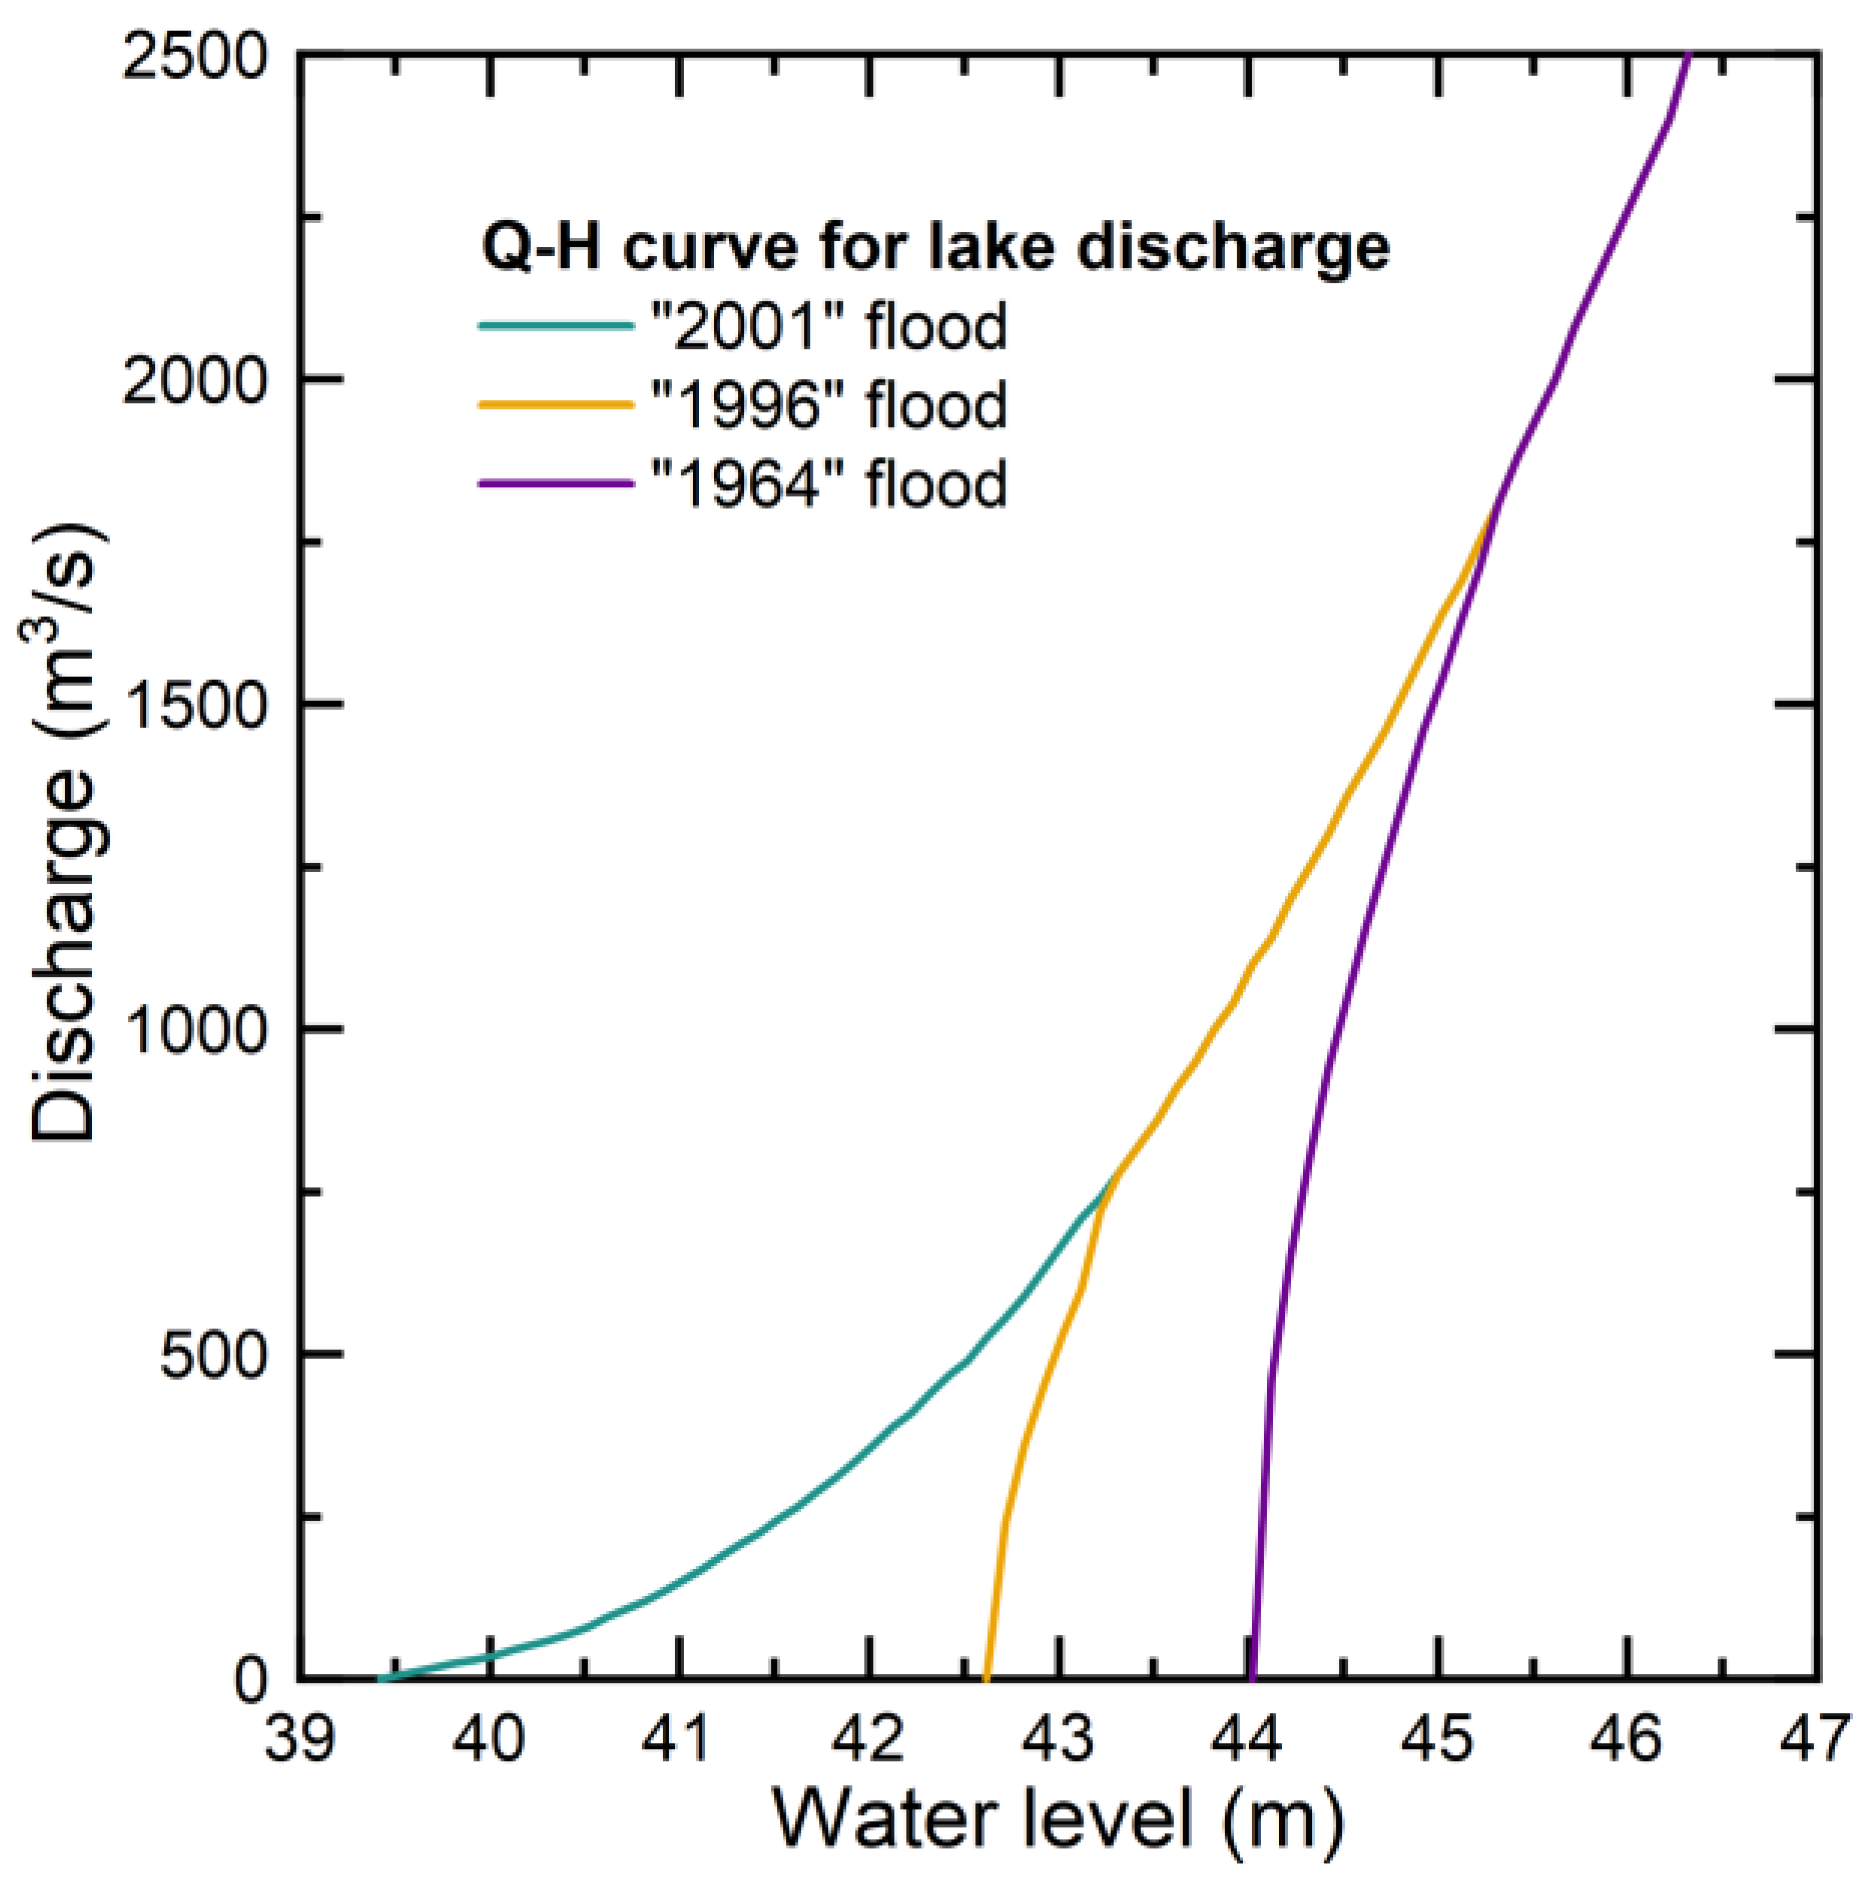
To investigate the impact of the Yellow River backwater effect on the operation of Dongping Lake, three different degrees of influence are designed: non-backwater effect, moderate backwater effect, and severe backwater effect for Dongping Lake outflow. These effects were based on three typical years of Yellow River flood conditions, as reported by Yang et al. [21]. These specific years of flood include the “2001 flood”, “1996 flood”, and “1964 flood”, each resulting in no, moderate and severe impact on the outflow discharge of Dongping Lake. For this study, we obtained the relationship curves between the lake water level and outflow discharge for Chenshankou Gate and Qinghemen Gate when both gates are fully open, corresponding to the three aforementioned levels of flood influence. These curves are shown in Figure 4. As the Yellow River has the highest sediment concentration among the world’s rivers, its strong erosion and sedimentation changes result in rapid fluctuations in water level and discharge behind the gates [22]. Therefore, the lake water level and outflow discharge relationship curves need frequent calibration. The data used in this study was calibrated in June 2023.
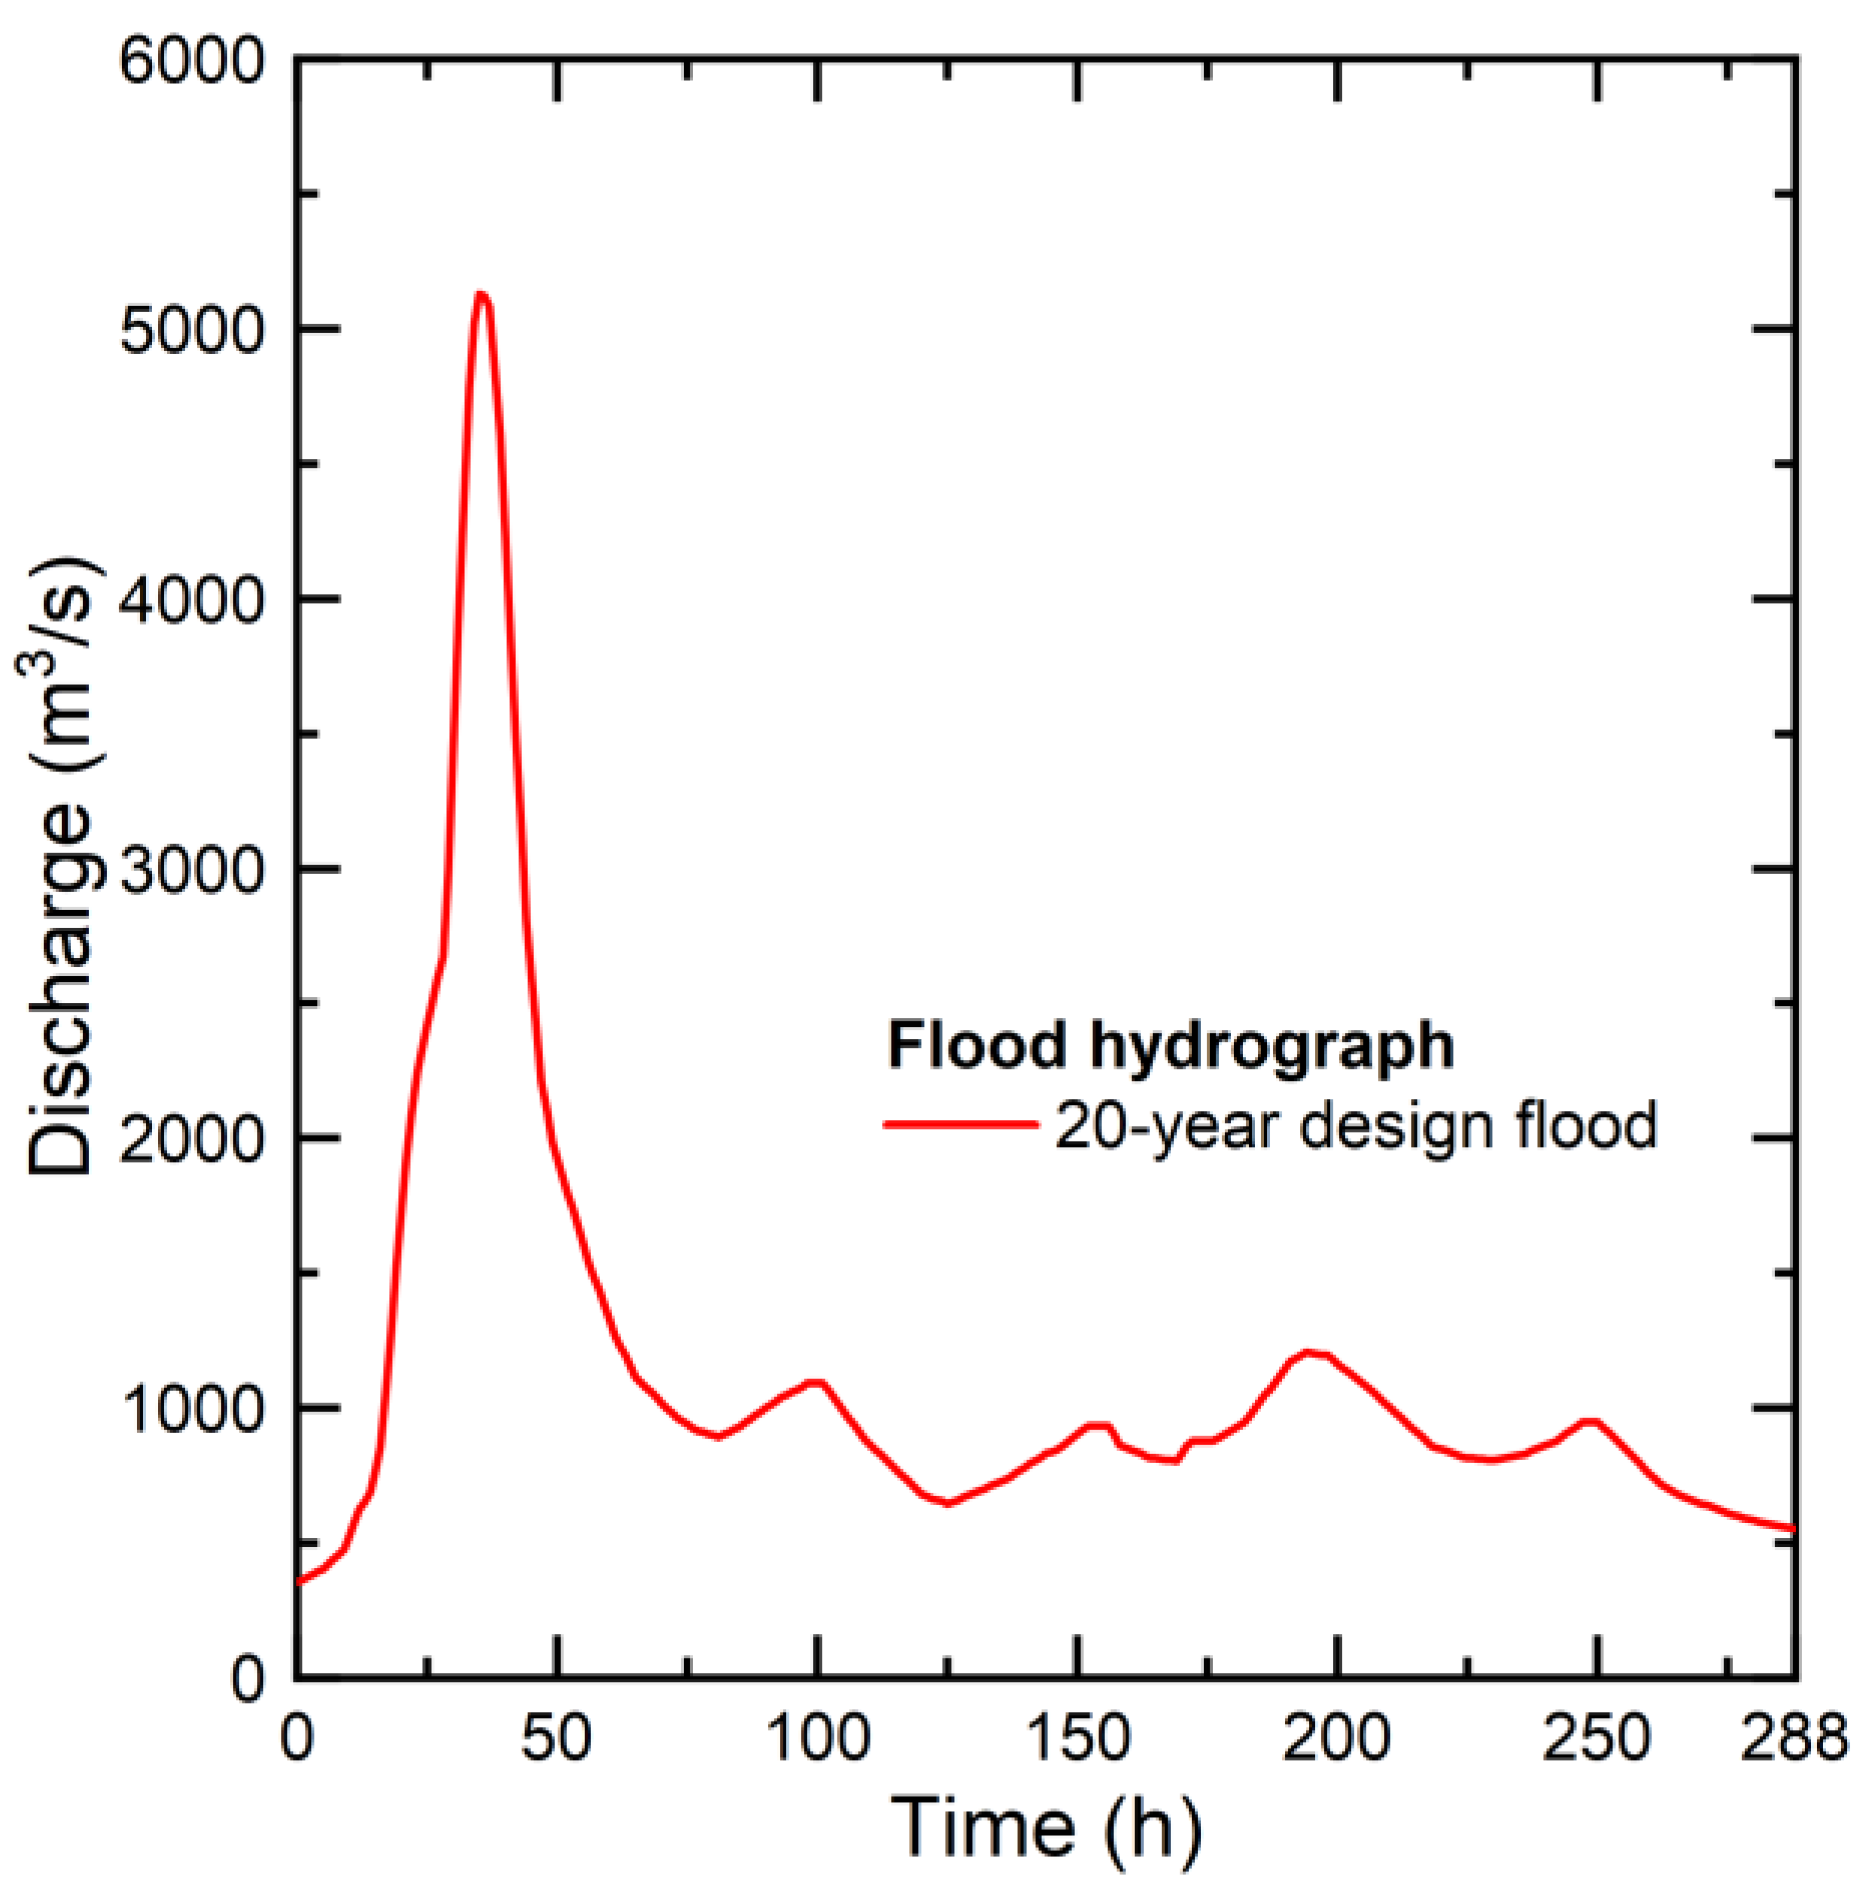
In addition, the flood control capacity of Dongping Lake is designed to accommodate a Dawen River inflow corresponding to a 20-year design flood. To control for a single variable, the inflow condition of the Dawen River is set to the 20-year design flood. The 20-year design flood hydrograph is in Figure 5. The flood duration is 288 h, with a peak discharge of 5130 m3/s and a total flood volume of 11.88 × 10⁸ m3. The data presented in Figure 4 and Figure 5 were provided by the Shandong Yellow River Water Conservancy Bureau Dongping Lake Management Bureau. The specific working conditions are shown in Table 1.

3.3. Terrain and Mesh Generation

The Digital Elevation Model (DEM) data used in this study for Dongping Lake is provided by the Yellow River Conservancy Commission, with a resolution of 5 m, measured in June 2021 (Figure 6). Since 2021, the area west of Jinshan Dam has never been submerged, and the relatively low sediment concentration of the Dawen River (average sediment concentration of 0.92 kg/m3) results in minimal changes in the lake bed east of Jinshan Dam. Therefore, it is reasonable to assume that this DEM data does not significantly differ from the most recent data and can be used for this study.
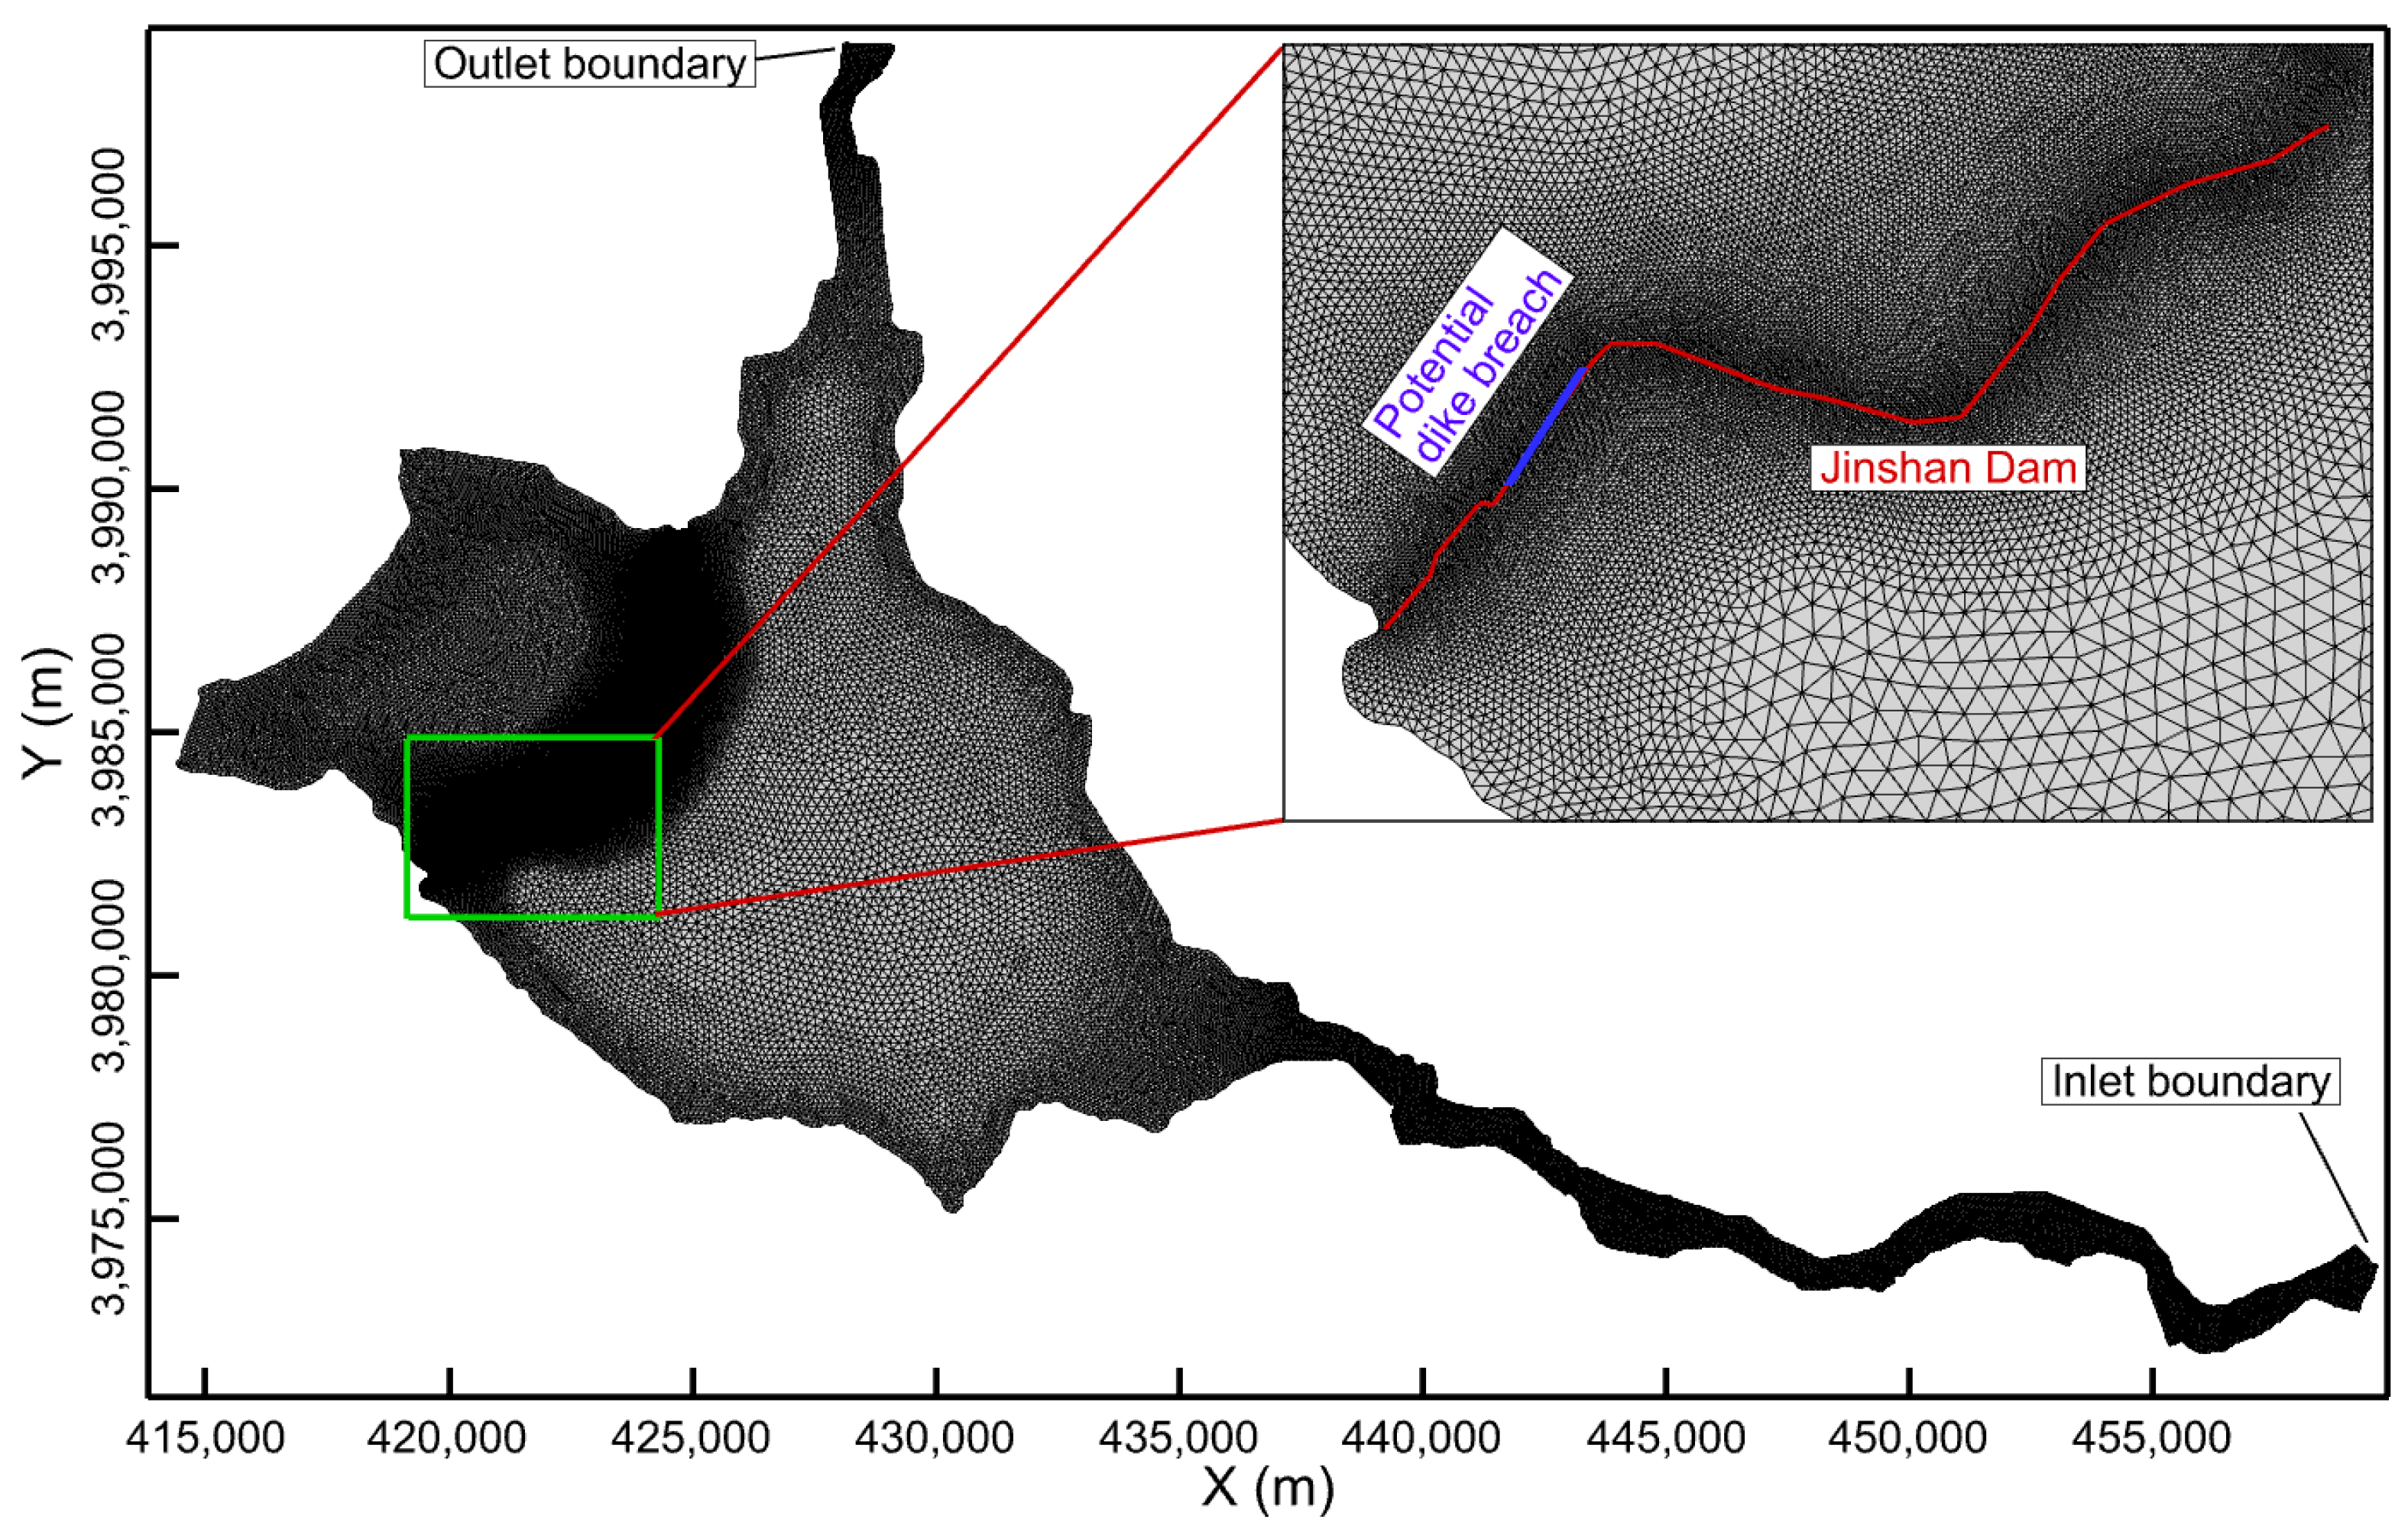
The entire study area is partitioned into 107,223 computational elements using a triangular unstructured mesh. The central computational elements in Dongping Lake have an average area of approximately 4800 m2, while the computational elements in the sections downstream of Daicun Dam, the area west of Jinshan Dam, and the outflow channel have an average area of approximately 550 m2. Specifically, to accurately depict the shape and elevation of Jinshan Dam in the terrain, a higher-resolution mesh with an average element area of approximately 25 m2 is used in the vicinity of Jinshan Dam (Figure 7).

3.4. Boundary Conditions and Initial Conditions

The model includes two open boundaries, one inlet boundary, and one outlet boundary (in Figure 7). The inlet boundary is located at the Daicun Dam and is characterized as a discharge boundary. The outlet boundary is situated at the Chenshankou Gate and Qinghemen Gate, with its characteristics defined as a water level-discharge relationship boundary. The initial condition for the model simulation is set to the flood control limit water level of Dongping Lake (40.72 m).

3.5. Model Calibration and Validation

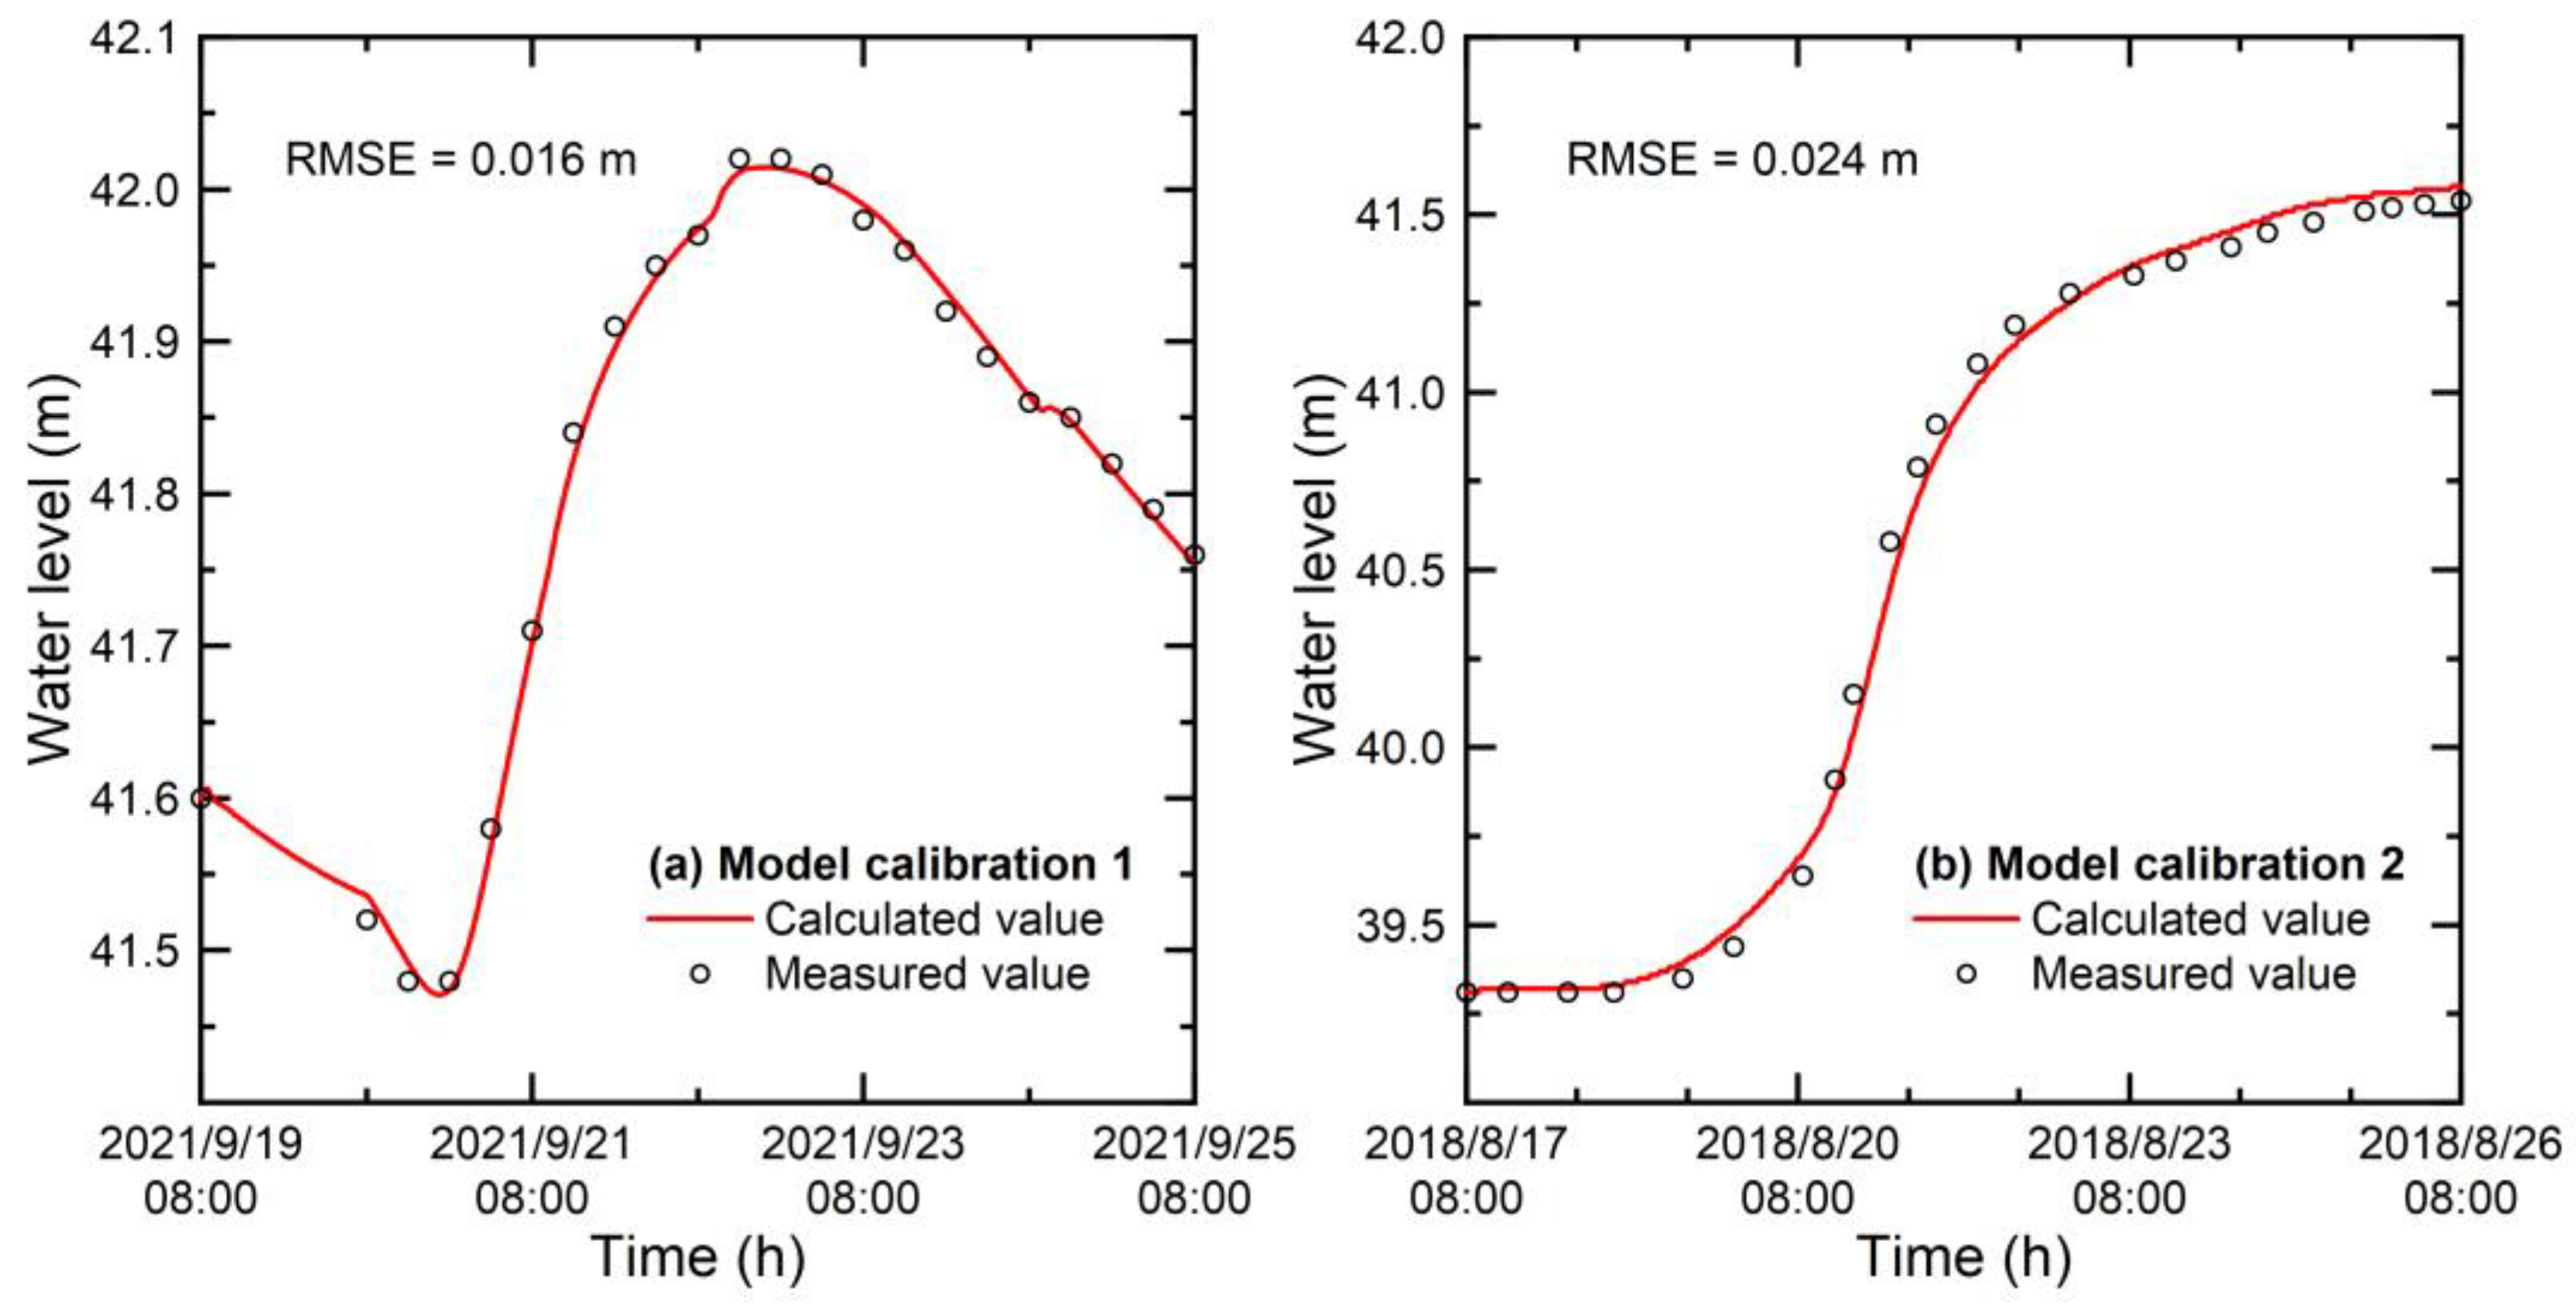
Two measured flood events at Daicun Dam hydrological station (Model calibration 1: “20210919” flood; Model calibration 2: “20180817” flood) were used to calibrate the established model. The terrain data and mesh division used in the model calibration were consistent with the previous introduction. The outlet boundary conditions for these two measured flood events were the measured outflow discharge at Chenshankou Gate and Qinghemen Gate during the corresponding periods. The model calibration was performed by comparing the calculated water levels in Dongping Lake with the measured values, and the measured values come from the average of three water level stations (in Figure 1). Through iterative adjustments, the final determination of the main parameter settings in the model is shown in Table 2. Figure 8 shows the calibration results for the two different flood events, demonstrating a high level of agreement between the calculated and measured values, the root mean square errors (RMSE) for Model Calibration 1 and Model Calibration 2 are 0.016 m and 0.024 m, respectively.
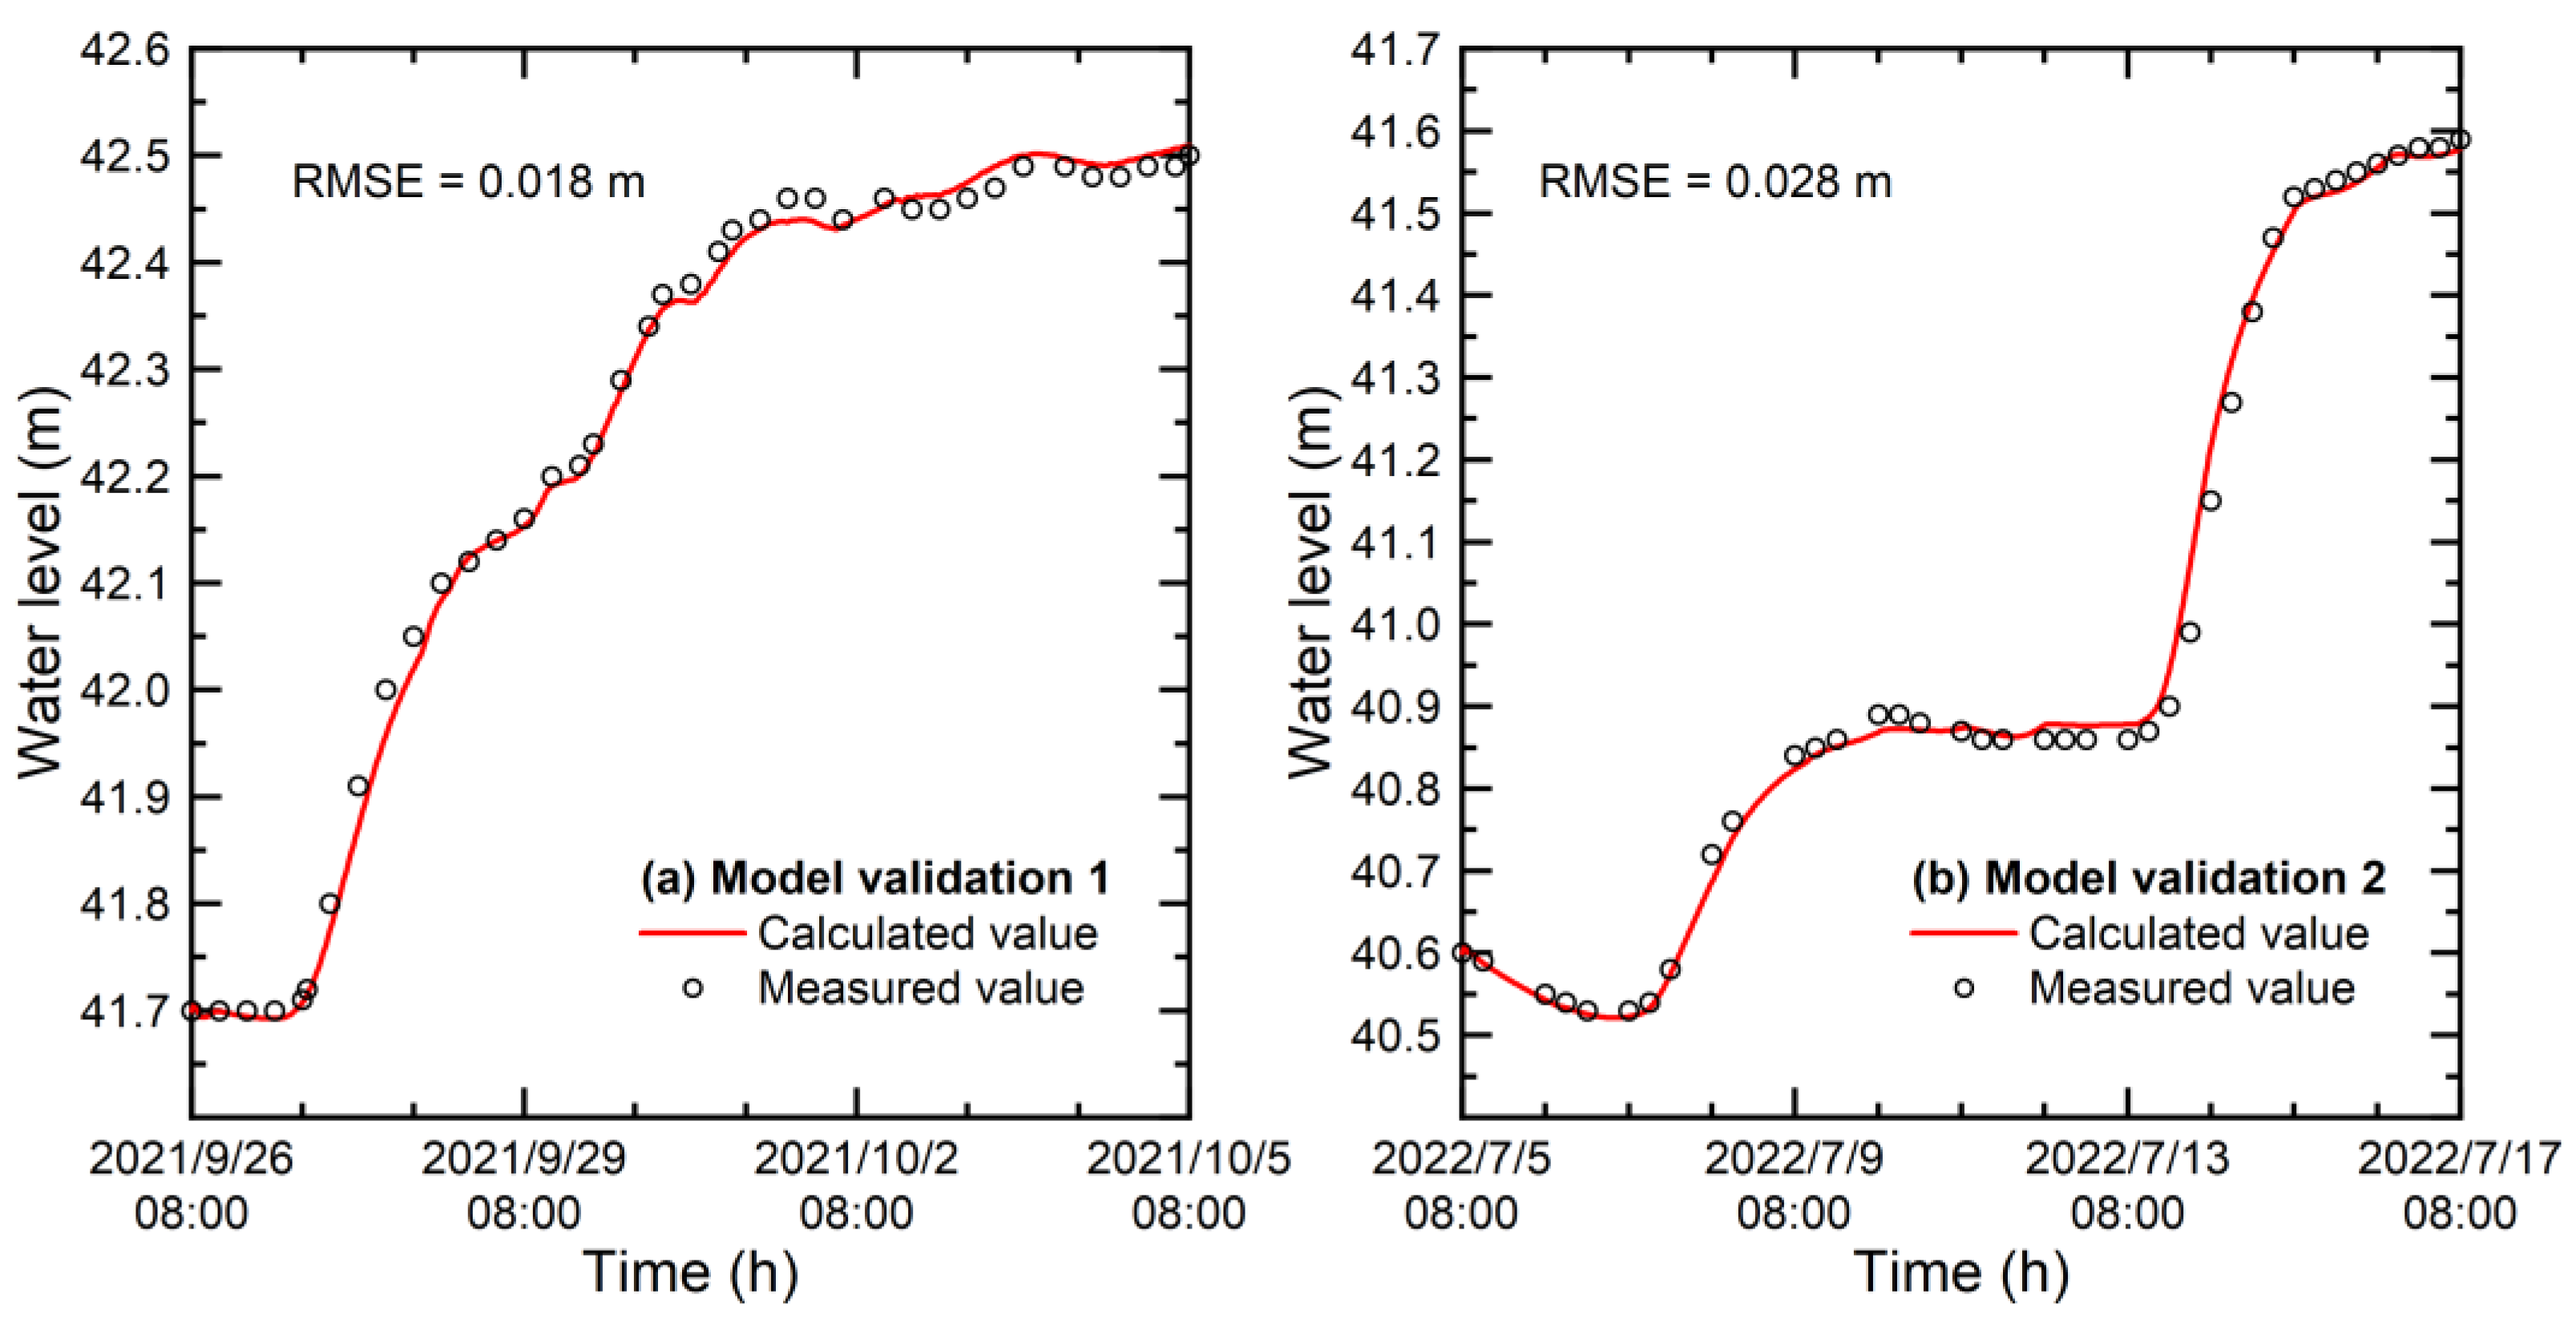
Similarly, two other measured flood events at Daicun Dam hydrological station (Model validation 1: “20210926” flood; Model validation 2: “20220705” flood) and their corresponding outflow discharges were used to validate the established model and the calibrated parameters. Figure 9 presents the validation results for these two different flood events, showing a good agreement between the calculated and measured values, RMSE for Model Validation 1 and Model Validation 2 are 0.018 m and 0.028 m, respectively. Therefore, indicating that the selected parameter values are reasonable, and this model can be concluded that the established model is reasonable and can be used to investigate the impact of the Yellow River backwater effect on the operation of Dongping Lake.

4. Results and Analysis

Through model computations, we obtained hydraulic parameters within Dongping Lake under three different scenarios of backwater effects, including water levels, outflow rates, total outflow flood volumes, and inundation areas. In Section 2, we mentioned the presence of Jinshan Dam, which divides Dongping Lake into its eastern and western sections. Due to the existence of Jinshan Dam, the hydraulic conditions in these two areas vary throughout the computation process. Therefore, in the following results, we analyze flood characteristics separately for the area east of Jinshan Dam and the area west of Jinshan Dam.

4.1. Impact on the Area East of Jinshan Dam

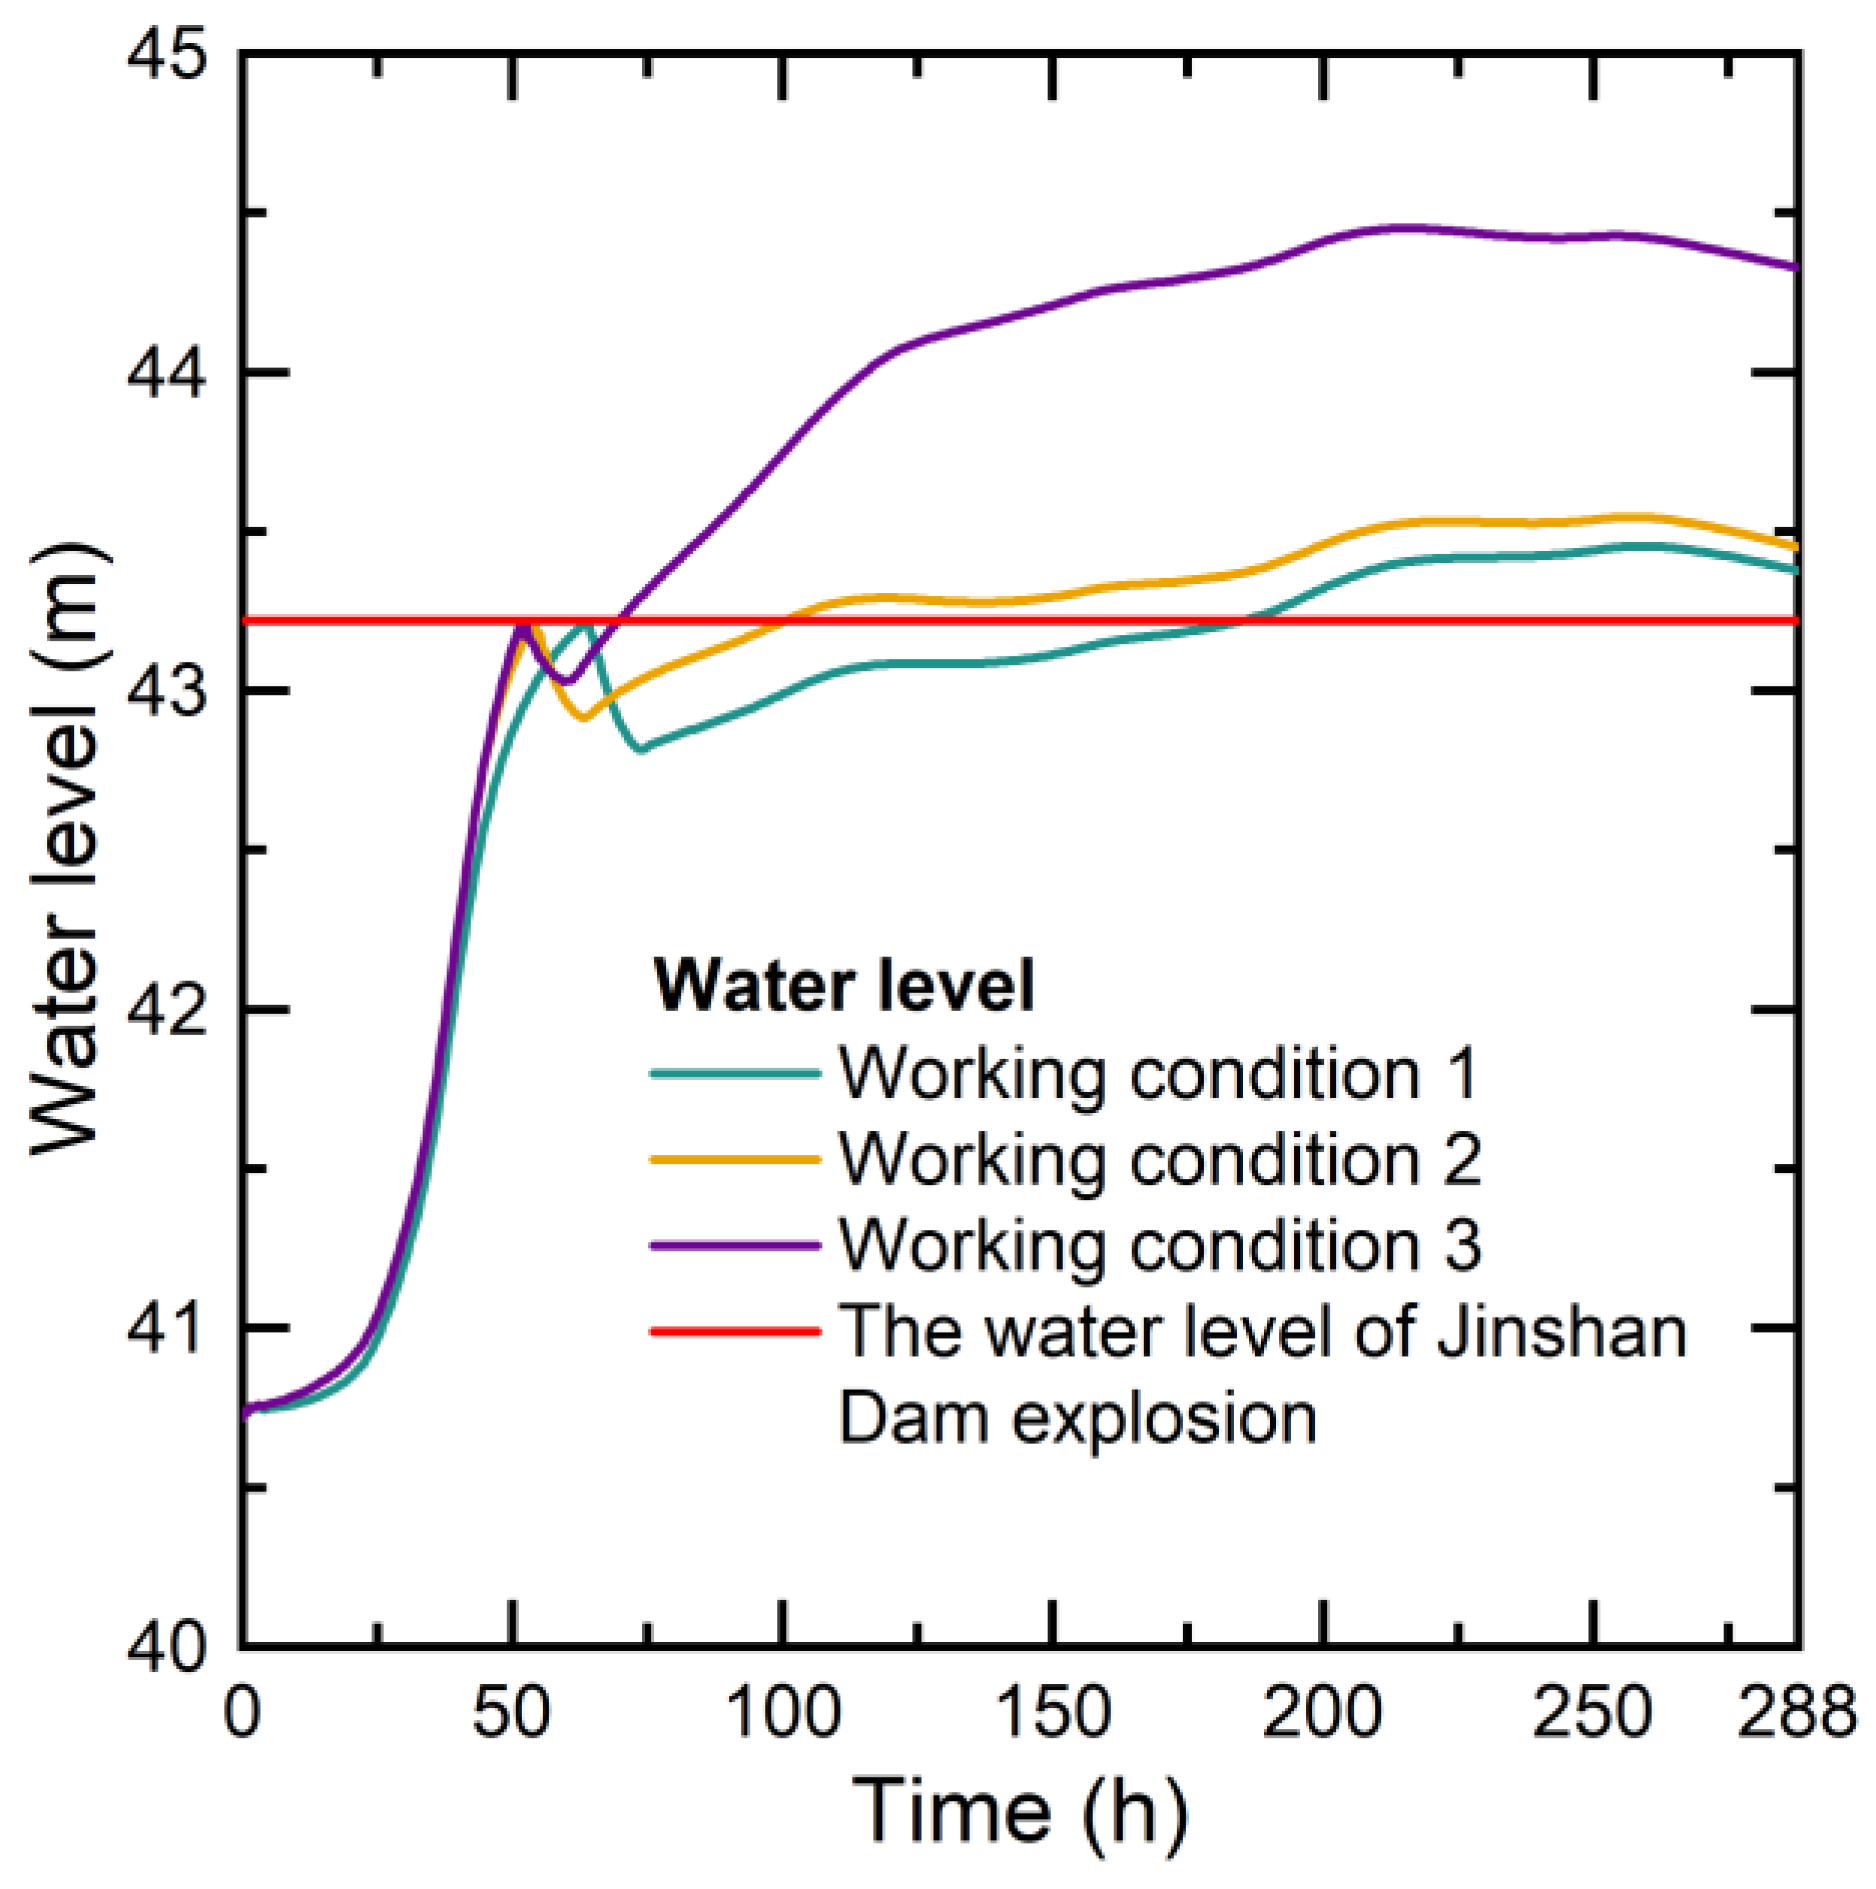
When Dongping Lake experiences a 20-year return period flood event from the Dawen River, the water level variations under different outflow conditions for each working condition are shown in Figure 10. Overall, the water level variations in the three working conditions can be divided into four stages:
  • Rapid water level rise stage:
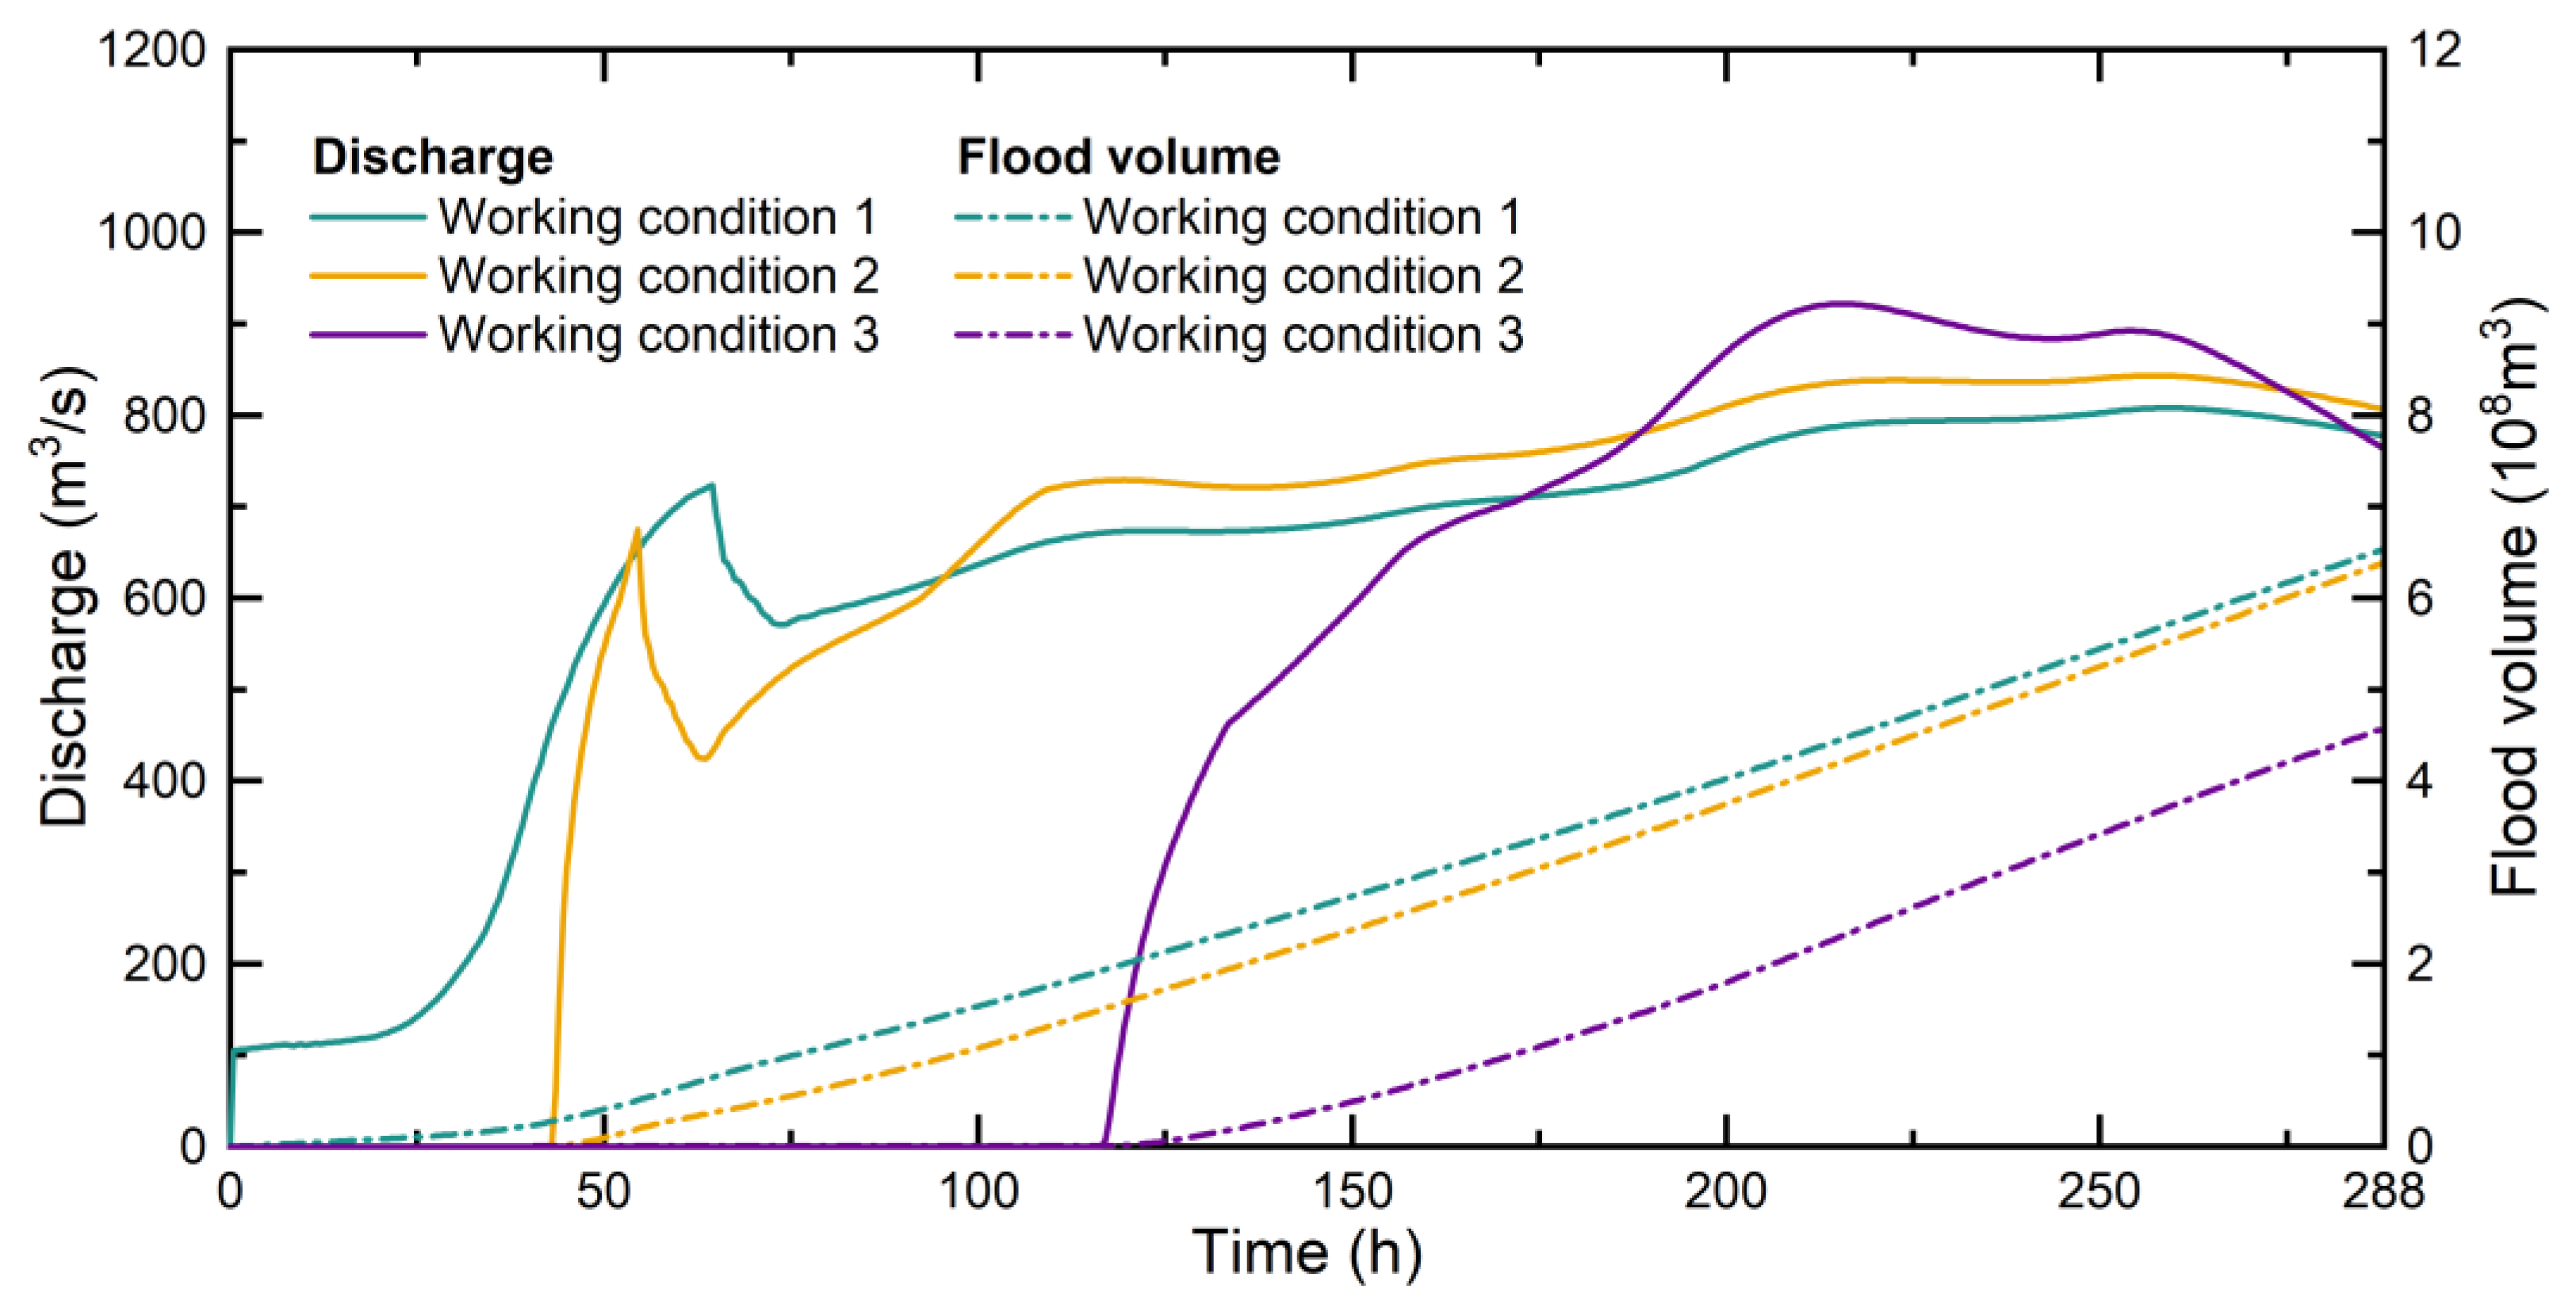
This stage starts at 0.0 h and ends at the moment of the Jinshan Dam breach. The breach times for working conditions 1, 2, and 3 are 64.5 h, 54.5 h, and 52.0 h, respectively. As the outflow conditions become more challenging in these working conditions, the time it takes for the water level to reach 43.22 m decreases. In working condition 1, before the Jinshan Dam breach, the rate of water level rise has noticeably slowed down. There are two main reasons for this: first, the lake discharge conditions are favorable, and as the water level increases, the outflow capacity also increases, reaching 723.5 m3/s by the time of the Jinshan Dam breach (Figure 11); second, the peak flow has mostly passed after about 50.0 h, resulting in a gradual reduction in inflow to the lake. In working conditions 2 and 3, there was no apparent slowing down of the water level increase before the Jinshan Dam breach. This is due to the earlier breach times in both working conditions compared to working condition 1, resulting in higher inflow rates of 1639.2 m3/s and 1798.1 m3/s, respectively, compared to 1136.0 m3/s in working condition 1. Moreover, the impact of the Yellow River backwater effect on outflow is more significant in working conditions 2 and 3, with outflow rates of 674.5 m3/s and 0.0 m3/s, respectively, both lower than working condition 1’s outflow rate. In these working conditions, inflow still dominates, leading to no significant slowing down of the water level increase.
  • Water level decline stage:
With the breach of Jinshan Dam, a large amount of floodwater was discharged to the area west of Jinshan Dam, causing the water level in Dongping Lake to decline to different extents, reaching 42.82 m, 42.92 m, and 43.03 m for working conditions 1, 2, and 3, respectively. The differences in water level decline are due to the variations in inflow and outflow. This stage lasts for approximately 8.0 h in all working conditions since the breach of the dam results in a consistent and substantial outflow, which dominates over inflow.
  • Slow water level rise stage:
As the water level rises in the western area of Jinshan Dam, the water level difference between the two sides of the dam gradually decreases, and the outflow discharge reduces. In working conditions 1 and 2, the inflow still exceeds the outflow. However, compared to the first stage, the outflow increases noticeably with the rising water level, and the inflow decreases. Hence, the water level rises more slowly in this stage. In working condition 3, outflow starts only when the water level reaches 44.02 m, but inflow has already reduced, resulting in a slow water level rise. In all working conditions, the water level reaches 43.22 m again at 184.0 h, 100.0 h, and 69.5 h, respectively. Finally, the maximum water levels in Dongping Lake are 43.45 m, 43.54 m, and 44.45 m for working conditions 1, 2, and 3, respectively.
  • Slow water level decline stage:
After reaching the maximum water level, outflow becomes greater than inflow, and the water level in Dongping Lake gradually declines to 43.38 m, 43.45 m, and 44.33 m for working conditions 1, 2, and 3, respectively.
In summary, for the three different working conditions involving various degrees of Yellow River backwater effect, the eastern area of Jinshan Dam cannot independently accommodate the 20-year return period flood from Dawen River. It requires the use of the western area of Jinshan Dam as a flood detention area. The more severe the Yellow River backwater effect, the earlier the Jinshan Dam will breach, and the higher the maximum water level in Dongping Lake will be. Compared to the working conditions without the backwater effect, the severe effect and moderate effect working conditions result in breach times advanced by 12.5 h and 10.0 h, respectively, and the maximum water levels in Dongping Lake increase by 1.0 m and 0.1 m, respectively.
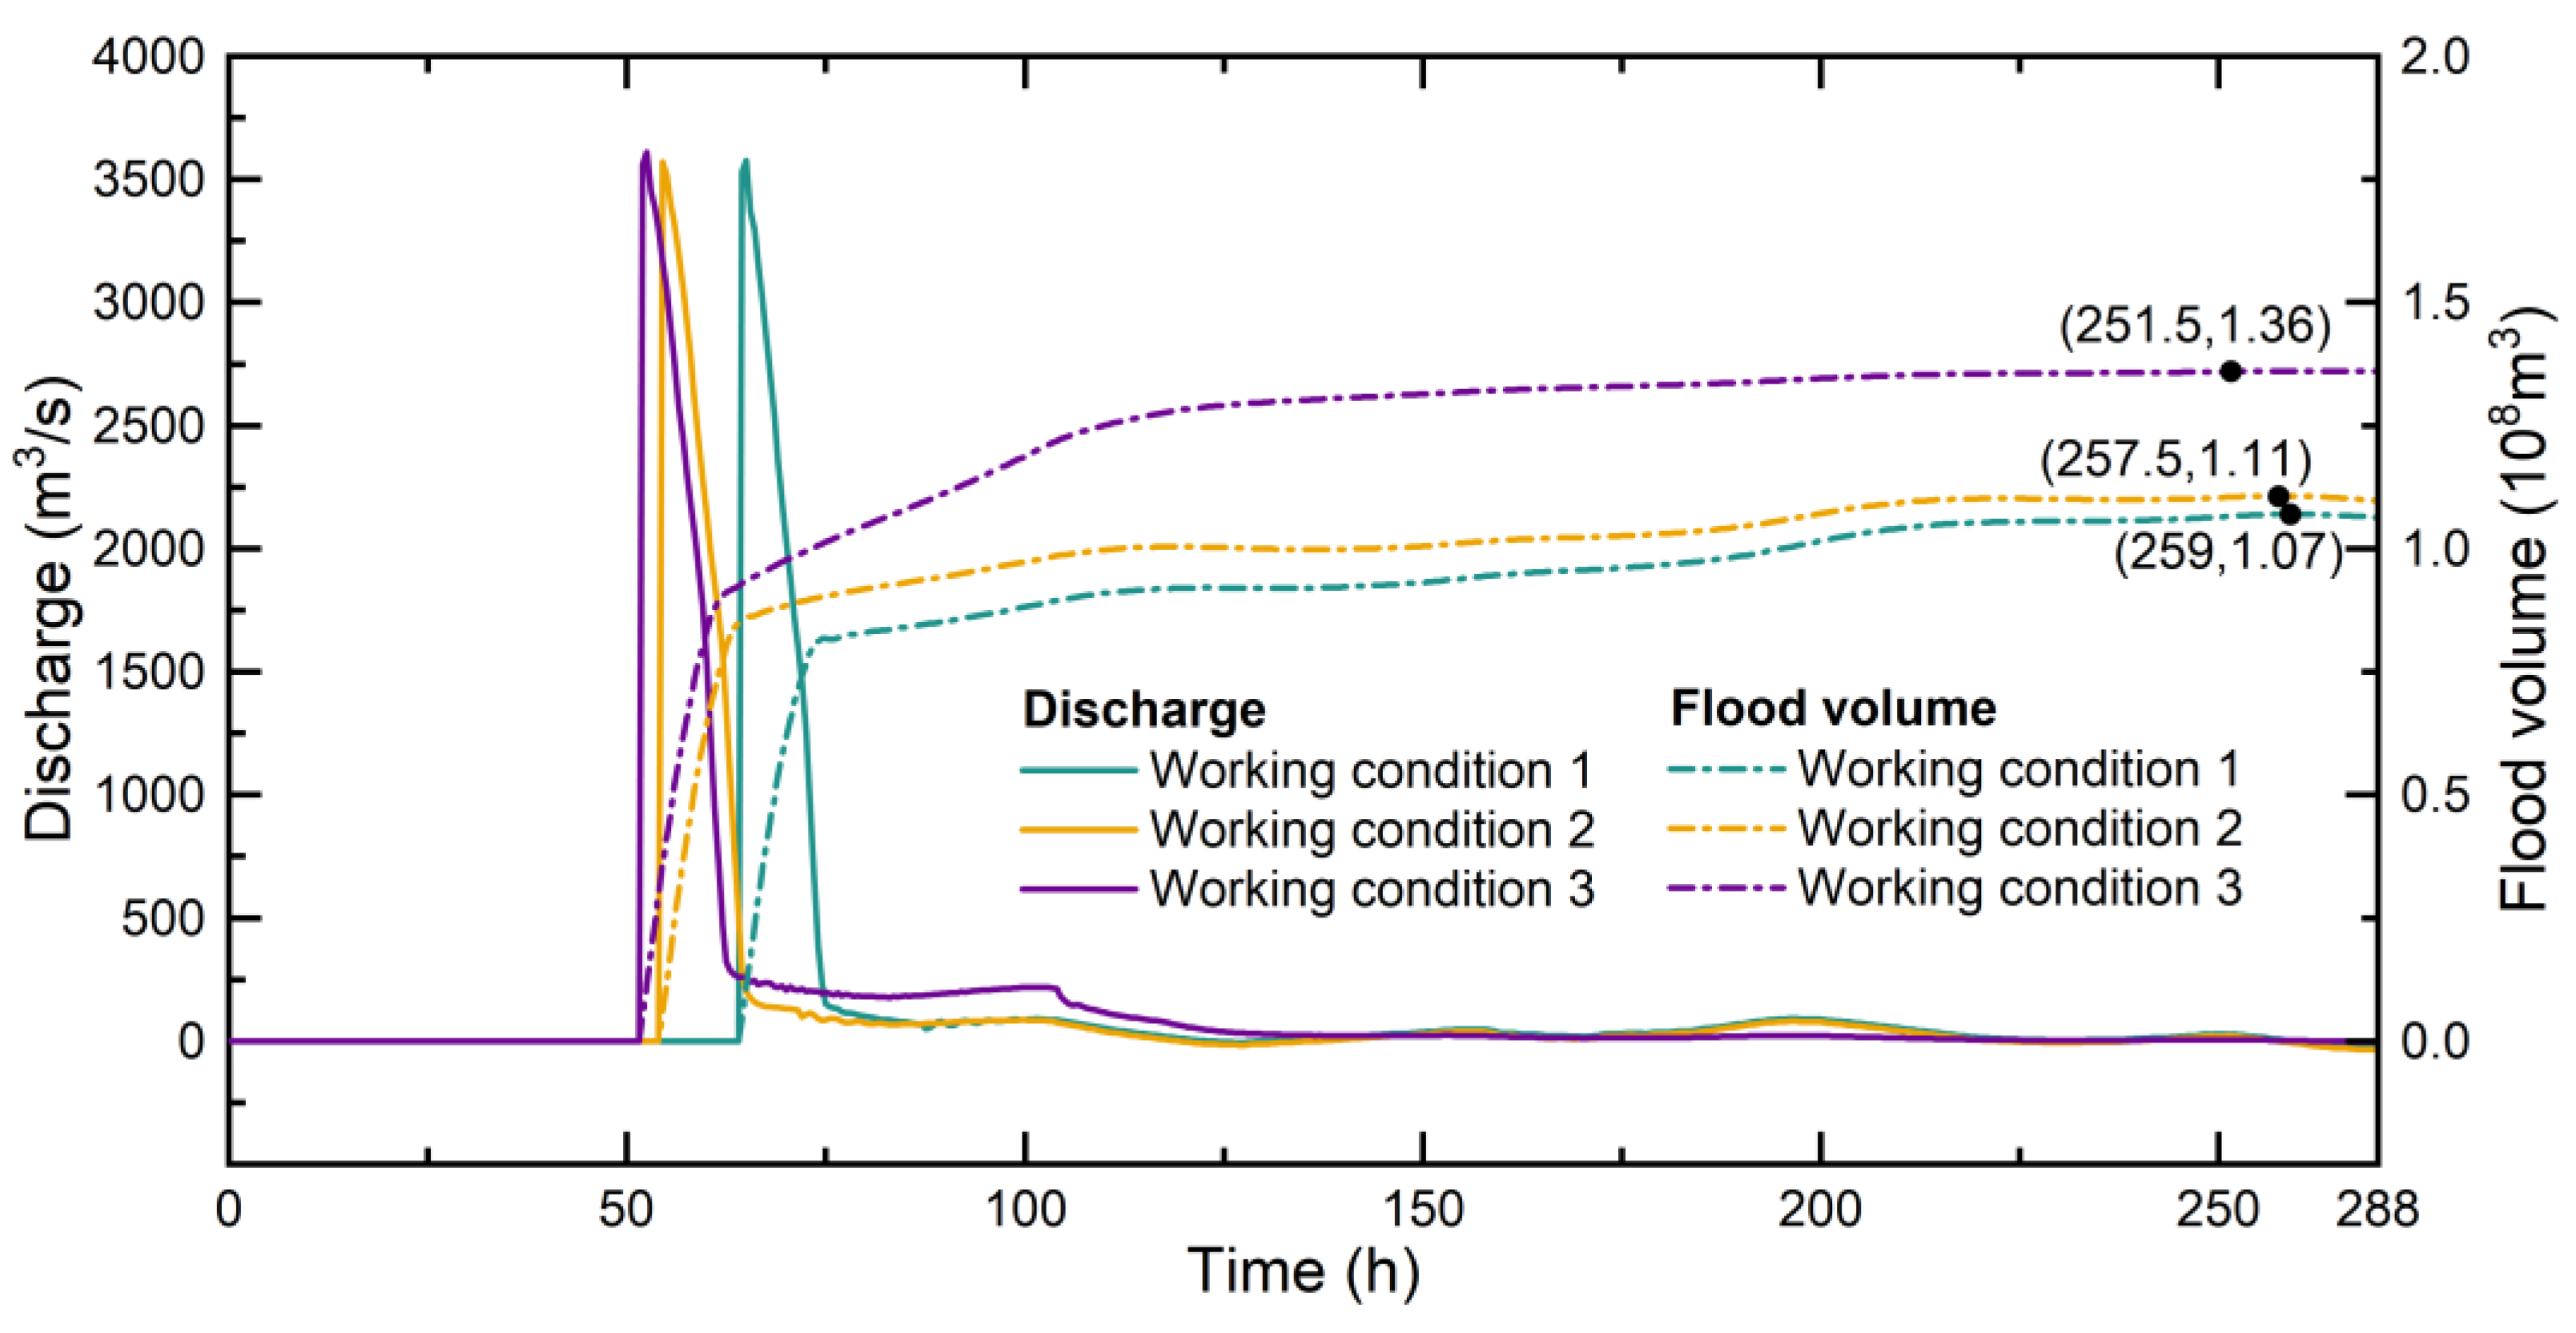
In addition to the outflow process, Figure 11 also presents the cumulative outflow volume hydrographs for the three working conditions. At 0.0 h, 43.0 h, and 116.5 h, the floodwater starts to be discharged to the mainstream of the Yellow River in working conditions 1, 2, and 3, respectively, with a total outflow volume of 6.54 × 10⁸ m3, 6.39 × 10⁸ m3, and 4.57 × 10⁸ m3. Severe backwater effect conditions result in a more challenging outflow of floodwater. Compared to the working conditions without the backwater effect, the severe effect and moderate effect working conditions reduce the total outflow volume by 30.1% and 2.3%, respectively, and delay the commencement of outflow by 116.5 h and 43.0 h, respectively.

4.2. Impact on the Area West of Jinshan Dam

The flow process through the breach and the cumulative flood volume entering the western area of Jinshan Dam are shown in Figure 12. The breach times for working conditions 1, 2, and 3 are 64.5 h, 54.5 h, and 52.0 h, respectively, with the maximum diversion flood volume being 1.07 × 10⁸ m3, 1.11 × 10⁸ m3, and 1.36 × 10⁸ m3, respectively. Compared to working condition 1, working conditions 3 and 2 have advanced breach times by 12.5 h and 10.0 h, respectively, and the maximum diversion flood volume has increased by 26.17% and 3.74%, respectively. As the breach outflow peak for all working conditions is approximately 3550 m3/s due to the same water head during the breach, the major difference lies in the cumulative process of flood volume through the breach. In working conditions 1 and 2, the diversion flood volume rapidly increases within approximately 10.0 h, reaching 0.81 × 10⁸ m3 and 0.86 × 10⁸ m3, respectively, and then the increase rate slows down. In contrast, working condition 3 shows a similar rapid increase within approximately 10.0 h, reaching 0.90 × 10⁸ m3, but the increase rate slows down slightly until 116.5 h when it significantly decreases. The reason is that working condition 3 experiences severe Yellow River backwater effect, delaying the diversion flow into the main stream of the Yellow River until 116.5 h. With the improvement in outflow conditions, the water level rise in the lake slows down, resulting in a reduction in the diversion flood volume through the breach, and consequently, the increase rate of the cumulative flood volume through the breach slows down. The maximum cumulative flood volumes entering the western area of Jinshan Dam for the three working conditions are reached at 251.5 h, 257.5 h, and 215.5 h, respectively, when the water levels on both sides of the breach become equal. After that, as the outflow exceeds the inflow, the water level starts to decline, and the floodwater in the western area of Jinshan Dam begins to flow back into the lake. At 288.0 h, the final stored volumes of floodwater in the western area of Jinshan Dam are 1.04 × 10⁸ m3, 1.07 × 10⁸ m3, and 1.35 × 10⁸ m3 for working conditions 1, 2, and 3, respectively, representing reductions of 2.8%, 3.6%, and 0.74%, respectively, compared to the maximum values.
Figure 13a–c presents the water depth distribution in the western area of Jinshan Dam under the three working conditions when the cumulative flood volume through the breach is at its maximum. Using a water depth threshold of 0.1 m to determine submergence, the maximum submerged areas for the three working conditions are 40.25 km2, 40.38 km2, and 41.35 km2, with corresponding average water depths of 3.15 m, 3.23 m, and 4.08 m, respectively. It is evident that the more severe the backwater effect caused by the Yellow River water level, the greater the disaster in the western area of Jinshan Dam. Compared to the working condition without backwater effect, the submerged areas for severe backwater effect and moderate backwater effect have increased by 2.73% and 0.32%, respectively, while the average submerged water depth has increased by 0.93 m and 0.08 m, respectively.

5. Discussions

5.1. Improvement and Applicability of Numerical Models

Numerical models are essential tools for studying hydrodynamic simulations. In previous studies, structural square grids were commonly employed [23,24], which made it difficult to locally refine structures such as embankments and water gates. Additionally, these grids were inadequate in achieving perfect boundary fitting for complex geometries, leading to distortions in the simulated flow fields and other information at certain locations. The finite difference method (FDM) has long been used as one of the earliest and most widely applied numerical methods in river hydrodynamics due to their advantages of fast computation and simple programming [25,26]. However, these methods may fail to ensure conservation during calculations [27]. Among FDM, the Alternating Direction Implicit method (ADI) is the most commonly used and is usually paired with the aforementioned structural grids, yielding satisfactory results in terms of numerical computation speed, accuracy, and stability [28,29]. Nevertheless, the lack of conservation guarantee and the absence of TVD characteristics in the ADI prevent it from capturing shock interfaces and eliminating numerical oscillations near discontinuous flows, making it unsuitable for simulating scenarios involving dam breaches [30]. In this study, a hydrodynamic model was developed using the FVM with a non-structured triangular mesh and TVD scheme. The non-structured triangular mesh demonstrated excellent adaptability to complex boundaries and facilitated local grid refinement in the areas of interest. The successful application of the Roe-MUSCL scheme and Runge-Kutta predictor-corrector method provided second-order accuracy in both time and space for the model calculations. Additionally, a novel approach for dam break simulation and treatment of wet-dry boundaries was introduced in this model.

5.2. Measures to Address the Backwater Effect

The impact of the backwater effect presents complex challenges to flood management in the Dongping Lake region. By observing the situations in the eastern and western areas of Jinshan Dam, we can gain a clearer understanding of how the backwater effect threatens the lives and property of residents and influences flood management strategies. In the area west of Jinshan Dam, the effects of the backwater effect result in the need for earlier removal of Jinshan Dam and an expanded inundation area. In comparison to situations without the backwater effect, moderate and severe backwater effects cause Jinshan Dam to require removal 10.0 h and 12.5 h in advance, respectively, which means a corresponding reduction in evacuation time for residents. Furthermore, the increased inflow of floodwater and larger inundation areas in this area imply a threat to more residents. For the area east of Jinshan Dam, the backwater effect leads to a prolonged period of high water levels, exacerbating the vulnerability of embankments and increasing the likelihood of problems like seepage and piping. Hence, these potential risks should receive sufficient attention from watershed management authorities, and measures should be taken to address this issue. For instance, strengthening monitoring and early warning systems to provide early alerts for potential backwater effects, allowing adequate time for preparation. Developing and refining flood emergency plans, which should include evacuation plans for residents west of Jinshan Dam, including aspects related to transportation, routes, and personnel arrangements. Recommending a reassessment of the flood discharge capacity of Chenshankou Gate and Qinghemen Gate to ensure their adaptability under different circumstances. Finally, we suggest the construction of pumping stations near the main stream of the Yellow River for forced drainage during critical times to alleviate the challenges posed by the backwater effect. These comprehensive measures can better address the complexities associated with the backwater effect in flood management, ensuring the safety of residents’ lives and property, as well as the integrity of related infrastructure.

5.3. The Referential Value of the Case

A well-conducted study should be a source of reference. In the case of Dongping Lake, it was observed that backwater effects from the Yellow River pose significant challenges to the lake. Similarly, in the study conducted by Kuok et al. [31] regarding the impact of rising sea levels on the Sarawak River, it was noted that the increased sea level elevates flood risks for the Sarawak River and its adjacent urban areas. The higher sea level adversely affects the river’s capacity to handle extreme rainfall events. This is also actually a specific manifestation of the impact of backwater effects on river systems. This commonality underscores the universal and critical nature of backwater effects across different scales and geographical locations. Nevertheless, there are also certain differences between our research and that of Kuok et al., primarily in terms of geographical settings and the underlying causes of backwater effects. Kuok et al.’s study primarily concentrates on coastal regions, whereas our study focuses on inland rivers and lakes. Hence, when addressing such issues, it is imperative to tailor approaches according to the local context and thereby propose context-specific measures to mitigate the challenges posed by backwater effects. For instance, the Netherlands, known as a low-lying coastal nation, faces threats from both marine and inland river systems, making effective management of backwater effects a crucial component of their flood management strategy. The local government has undertaken extensive river modification and governance projects, aimed at enhancing river drainage capabilities [32]. Furthermore, they have established a wide array of flood prevention infrastructure, including sluices, pumping stations, and embankments [33]. Implementing these measures is vital to mitigate the threat posed by backwater effects on urban areas and agricultural lands.

6. Conclusions

To investigate the influence of the backwater effect on the hydrodynamic characteristics of rivers and lakes, this paper takes China’s Dongping Lake as a case study and employs an improved two-dimensional hydrodynamic model to simulate three different levels of backwater effects. The main conclusions are as follows:
(1)
A hydrodynamic model was established based on a non-structured triangular mesh and the FVM with TVD characteristics. The successful application of the Roe-MUSCL scheme and the Runge-Kutta predictor-corrector method provided the model with second-order accuracy in both time and space. This model also introduced an approach to handle dam breaks and treatment of wet-dry varying boundaries;
(2)
The more severe the backwater effect faced by Dongping Lake, the greater the challenges it presents for flood control. The presence of the backwater effect leads to varying degrees of reduced outflow flood volumes and increased lake water levels. Residents west of Jinshan Dam face higher flood risks and have less time for flood evacuation;
(3)
The negative impacts resulting from the backwater effect can be reduced or eliminated through measures such as strengthening monitoring and early warning systems, developing and improving flood emergency plans, reassessing the suitability of flood control facilities, constructing pumping stations, and so on.
The challenges posed by the backwater effect are significant, but they have also driven continuous improvements and innovations in flood management. The findings and recommendations of this study not only provide strong support for addressing the backwater effect in Dongping Lake but also offer valuable insights for tackling similar issues globally.

Author Contributions

The research idea is mainly provided by X.Z.; numerical model construction was completed by Z.B. and Z.X.; data collection and analysis were performed by X.S., P.W. and B.J.; the first draft of the manuscript was written by Z.B. and all authors commented on previous versions of the manuscript. All authors have read and agreed to the published version of the manuscript.

Funding

This research was funded by the National Natural Science Foundation of China, grant number U2243220; Project of Study on Dawen River Flood Forecast and Dongping Lake (Old Lake) Operation Mode, grant number 20220002; the Research Fund of Key Laboratory of Water Management and Water Security for Yellow River Basin, Ministry of Water Resources (under construction), grant number 2022-SYSJJ-10.

Data Availability Statement

The data that support the findings of this study are available from the corresponding author upon reasonable request.

Conflicts of Interest

The authors declare no conflict of interest.

References

  1. Mayo, T.L.; Lin, N. Climate change impacts to the coastal flood hazard in the northeastern United States. Weather Clim. Extrem. 2022, 36, 100453. [Google Scholar] [CrossRef]
  2. Cui, L.; He, M.; Zou, Z.; Yao, C.; Wang, S.; An, J.; Wang, X. The influence of climate change on Droughts and floods in the Yangtze River basin from 2003 to 2020. Sensors 2022, 22, 8178. [Google Scholar] [CrossRef] [PubMed]
  3. PIETROIUSTIR Was the 2020 Lake Victoria Flooding ‘Caused’by Anthropogenic Climate Change? Vrije Universiteit Brussel: Ixelles, Belgium, 2022.
  4. Ahmed, T.; Geebu, R.; Thompson, S. Assessing Land Loss from Flooding in the Lake St. Martin Basin in Manitoba, Canada. J. Geosci. Environ. Prot. 2019, 7, 171. [Google Scholar] [CrossRef]
  5. Shang, H.; Hu, C.; Xia, J.; Zhou, M. Influence of Dongting Lake inflow on the degree and range of backwater effect in the Jingjiang reach. Adv. Water Sci. 2023, 34, 431–441. [Google Scholar]
  6. Wicaksono, A.; Herdiansyah, H. The impact analysis of flood disaster in DKI jakarta: Prevention and control perspective. J. Phys. Conf. Ser. 2019, 1339, 012092. [Google Scholar] [CrossRef]
  7. Mohamed, N.N. Importance of Aswan High Dam to Egypt. In Grand Ethiopian Renaissance Dam Versus Aswan High Dam: A View from Egypt; Springer: Cham, Switzerland, 2019; pp. 53–72. [Google Scholar]
  8. Karunanayake, C.; Gunathilake, M.B.; Rathnayake, U. Inflow forecast of iranamadu reservoir, Sri Lanka, under projected climate scenarios using artificial neural networks. Appl. Comput. Intell. Soft Comput. 2020, 2020, 8821627. [Google Scholar] [CrossRef]
  9. Jiao, H.; Wei, H.; Yang, Q.; Li, M. Application Research of CFD-MOEA/D Optimization Algorithm in Large-Scale Reservoir Flood Control Scheduling. Processes 2022, 10, 2318. [Google Scholar] [CrossRef]
  10. Guo, W.; Yue, J.; Zhao, Q.; Li, J.; Yu, X.; Mao, Y. A 110 Year Sediment Record of Polycyclic Aromatic Hydrocarbons Related to Economic Development and Energy Consumption in Dongping Lake, North China. Molecules 2021, 26, 6828. [Google Scholar] [CrossRef]
  11. Bacopoulos, P.; Hagen, S.C. Physics-based sizing functions for ocean-to-estuary shallow-water models. Ocean Model. 2022, 176, 102061. [Google Scholar] [CrossRef]
  12. Wang, W.; Chen, W.; Huang, G.; Liu, J.; Zhang, D.; Wang, F. A hybrid shallow water approach with unstructured triangular grids for urban flood modeling. Environ. Model. Softw. 2023, 166, 105748. [Google Scholar] [CrossRef]
  13. Ye, R.; Zhang, C.; Kong, J.; Jin, G.; Zhao, H.; Song, Z.; Li, L. A non-negative and high-resolution finite volume method for the depth-integrated solute transport equation using an unstructured triangular mesh. Environ. Fluid Mech. 2018, 18, 1379–1411. [Google Scholar] [CrossRef]
  14. Xu, Y.; Yang, G.; Hu, D. A three-dimensional ISPH-FVM coupling method for simulation of bubble rising in viscous stagnant liquid. Ocean Eng. 2023, 278, 114497. [Google Scholar] [CrossRef]
  15. Faroux, D.; Washino, K.; Tsuji, T.; Tanaka, T. Coupling non-local rheology and volume of fluid (VOF) method: A finite volume method (FVM) implementation. In EPJ Web of Conferences; EDP Sciences: Les Ulis, France, 2021; Volume 249, p. 03025. [Google Scholar]
  16. Bidadi, S.; Rani, S.L. On the stability and diffusive characteristics of Roe-MUSCL and Runge–Kutta schemes for inviscid Taylor–Green vortex. J. Comput. Phys. 2015, 299, 339–351. [Google Scholar] [CrossRef]
  17. Bidadi, S.; Rani, S.L. Corrigendum to “On the stability and diffusive characteristics of Roe-MUSCL and Runge-Kutta schemes for inviscid Taylor-Green vortex” [Journal of Computational Physics 299 (2015) 339-351]. J. Comput. Phys. 2016, 305, 1172. [Google Scholar] [CrossRef]
  18. Figuérez, J.A.; Galán, Á.; González, J. An enhanced treatment of boundary conditions for 2D RANS streamwise velocity models in open channel flow. Water 2021, 13, 1001. [Google Scholar] [CrossRef]
  19. Monnier, J.; Couderc, F.; Dartus, D.; Larnier, K.; Madec, R.; Vila, J.P. Inverse algorithms for 2D shallow water equations in presence of wet dry fronts: Application to flood plain dynamics. Adv. Water Resour. 2016, 97, 11–24. [Google Scholar] [CrossRef]
  20. Wintermeyer, N.; Winters, A.R.; Gassner, G.J.; Warburton, T. An entropy stable discontinuous Galerkin method for the shallow water equations on curvilinear meshes with wet/dry fronts accelerated by GPUs. J. Comput. Phys. 2018, 375, 447–480. [Google Scholar] [CrossRef]
  21. Yang, C.; Yang, L.; Xie, X. Study on the Time of Jinshan Dam Breaking when Dongping Lake Retains Dawen River Flood. Yellow River 2008, 30, 99–100. (In Chinese) [Google Scholar]
  22. Chen, C.; Fu, J.; Wu, M.; Gao, X.; Ma, L. High-efficiency sediment-transport requirements for operation of the Xiaolangdi Reservoir in the Lower Yellow River. Water Supply 2022, 22, 8572–8586. [Google Scholar] [CrossRef]
  23. Sparks, T.D.; Bockelmann-Evans, B.N.; Falconer, R.A. Development and analytical verification of an integrated 2-D surface water—Groundwater model. Water Resour. Manag. 2013, 27, 2989–3004. [Google Scholar] [CrossRef]
  24. Gupta, I.; Dhage, S.; Jacob, N.; Navada, S.V.; Kumar, R. Calibration and validation of far field dilution models for outfall at Worli, Mumbai. Environ. Monit. Assess. 2006, 114, 199–209. [Google Scholar] [CrossRef]
  25. Othata, P.; Pochai, N. A Mathematical Model of Salinity Control in a River with an Effect of Internal Waves using Two Explicit Finite Difference Methods. Engineering Letters 2021, 29, EL_29_2_37. [Google Scholar]
  26. Mohit MA, A.; Yamashiro, M.; Hashimoto, N.; Mia, M.B.; Ide, Y.; Kodama, M. Impact assessment of a major river basin in Bangladesh on storm surge simulation. J. Mar. Sci. Eng. 2018, 6, 99. [Google Scholar] [CrossRef]
  27. Kaptsov, E.I.; Dorodnitsyn, V.A.; Meleshko, S.V. Conservative invariant finite-difference schemes for the modified shallow water equations in Lagrangian coordinates. Stud. Appl. Math. 2022, 149, 729–761. [Google Scholar] [CrossRef]
  28. Tang, S.P.; Huang, Y.M. A fast ADI based matrix splitting preconditioning method for the high dimensional space fractional diffusion equations in conservative form. Comput. Math. Appl. 2023, 144, 210–220. [Google Scholar] [CrossRef]
  29. He, M.; Liao, W. A compact ADI finite difference method for 2D reaction–diffusion equations with variable diffusion coefficients. J. Comput. Appl. Math. 2024, 436, 115400. [Google Scholar] [CrossRef]
  30. Xu, R.; Borthwick, A.G.; Xu, B. Application of Large Time Step TVD High Order Scheme to Shallow Water Equations. Atmosphere 2022, 13, 1856. [Google Scholar] [CrossRef]
  31. Kuok, K.K.; Mersal, M.; Chiu, P.C.; Chin, M.Y.; Rahman, M.R.; Bakri, M.K.B. Climate change impacts on sea level rise to flood depth and extent of Sarawak River. Front. Water 2022, 4, 870936. [Google Scholar] [CrossRef]
  32. van Alphen, J.; Haasnoot, M.; Diermanse, F. Uncertain accelerated sea-level rise, potential consequences, and adaptive strategies in the Netherlands. Water 2022, 14, 1527. [Google Scholar] [CrossRef]
  33. De Bruijn, K.M.; Diermanse, F.L.; Weiler, O.M.; De Jong, J.S.; Haasnoot, M. Protecting the Rhine-Meuse delta against sea level rise: What to do with the river’s discharge? J. Flood Risk Manag. 2022, 15, e12782. [Google Scholar] [CrossRef]
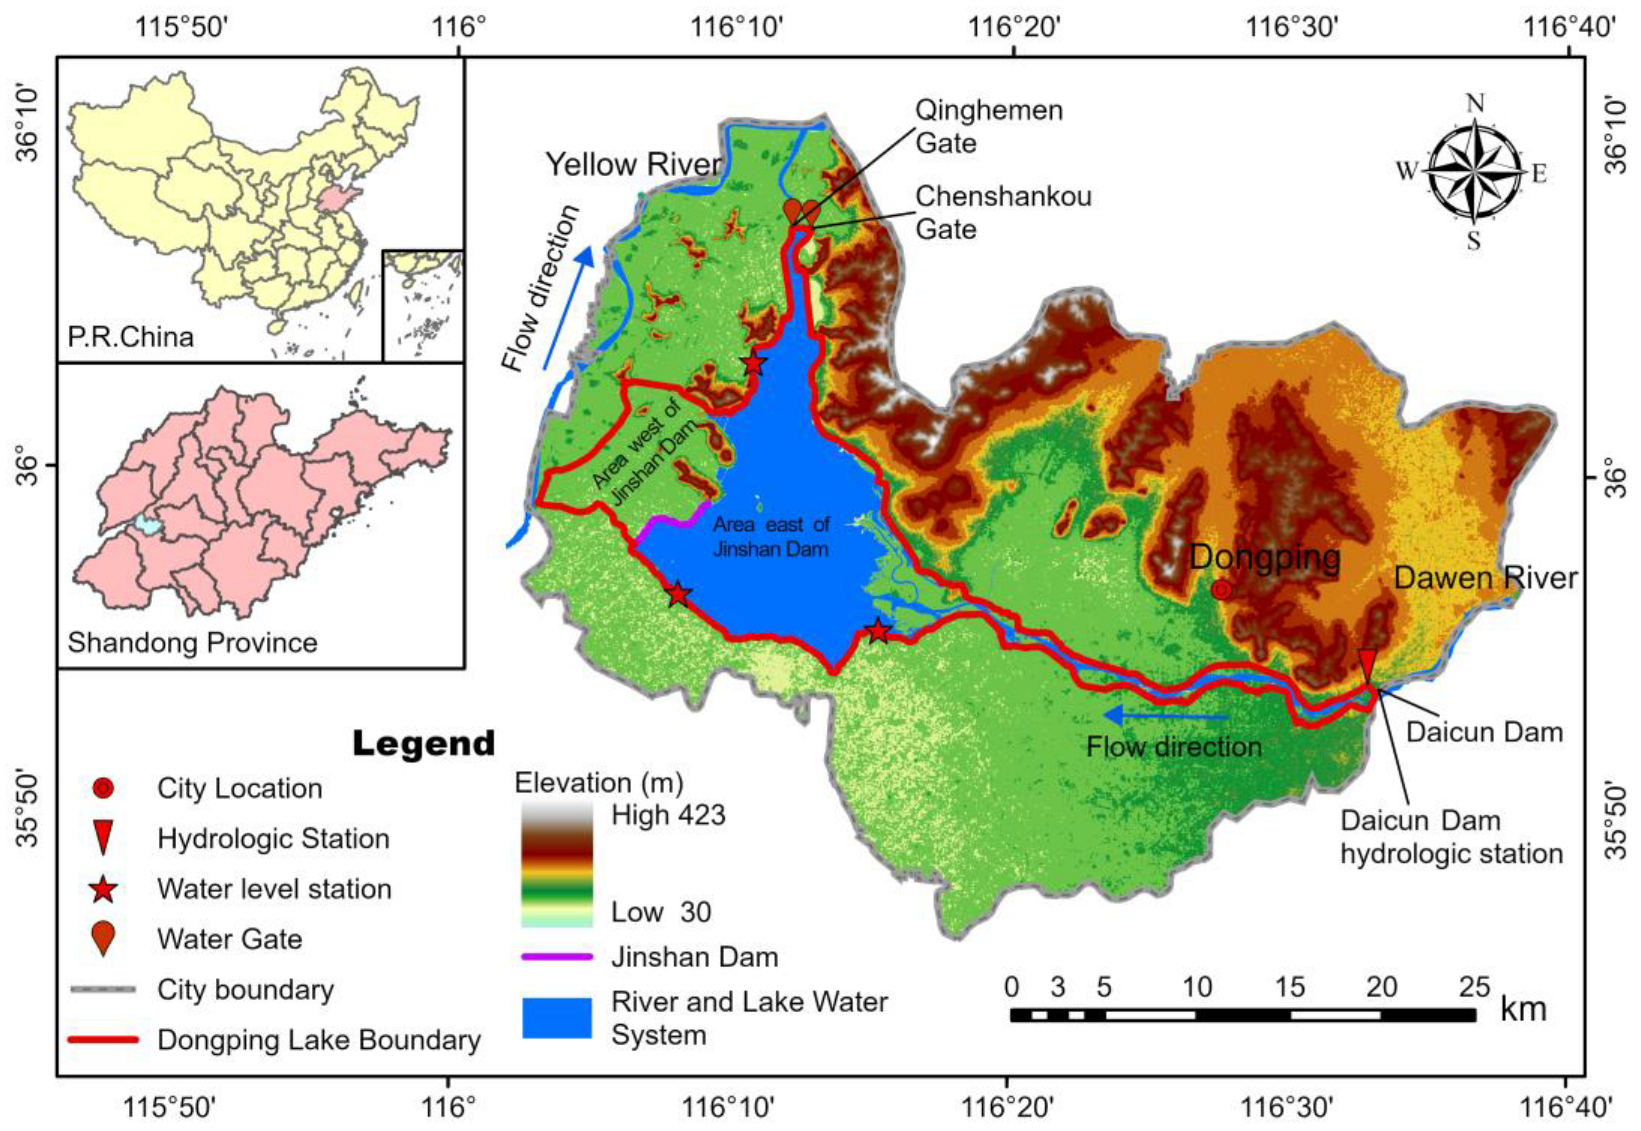
Figure 1. Study area and main structures.
Water 15 03850 g001
Figure 2. Actual photo of Jinshan Dam.
Water 15 03850 g002
Figure 3. Update of breach terrain.
Water 15 03850 g003
Figure 4. The relationship curves between lake water level and outflow discharge for Chenshankou Gate and Qinghemen Gate.
Water 15 03850 g004
Figure 5. The 20-year design flood hydrograph at Daicun Dam.
Water 15 03850 g005
Figure 6. The Digital Elevation Model (DEM) data used in this study for Dongping Lake.
Water 15 03850 g006
Figure 7. Mesh division in this study.
Water 15 03850 g007
Figure 8. Model calibration.
Water 15 03850 g008
Figure 9. Model validation.
Water 15 03850 g009
Figure 10. The water level variations under different outflow conditions for each working condition. (The water level values come from the average value of the output values corresponding to the positions of the three water level stations in the mode).
Water 15 03850 g010
Figure 11. Outflow process and cumulative outflow volume hydrographs for every working condition. (The statistical values of outflow are the sum of the discharge from the Chenshankou Gate and the Qinghemen Gate).
Water 15 03850 g011
Figure 12. The flow process through the breach and the cumulative flood volume entering the western region of Jinshan. (The statistical values of flow are the discharge entering the western area of Jinshan Dam from upstream through the breach).
Water 15 03850 g012
Figure 13. The water depth distribution in the western area of Jinshan Dam. (The water depth distribution in the western area of Jinshan Dam when the cumulative flood volume through the breach is at its maximum).
Water 15 03850 g013
Table 1. The specific working conditions in this study.
Working ConditionsThe Extent of
Backwater Effect
Yellow River Flood
Conditions (Model Outlet)
Dawen River Inflow
Conditions (Model Inlet)
Working condition 1No“2001” flood20-year design flood
Working condition 2Moderate“1996” flood
Working condition 3Serious“1964” flood
Table 2. The main parameters in the model.
Main ParametersParameters Values
The composite Manning’s roughness coefficient0.032
The computational time step (s)0.025
Viscosity (N·s/m2)0.001
Disclaimer/Publisher’s Note: The statements, opinions and data contained in all publications are solely those of the individual author(s) and contributor(s) and not of MDPI and/or the editor(s). MDPI and/or the editor(s) disclaim responsibility for any injury to people or property resulting from any ideas, methods, instructions or products referred to in the content.