Abstract
Cutoff walls are widely used to limit seepage, piping, and the uplift under hydraulic structures. Therefore, this study focused on a numerical investigation of the hydraulic performance of cutoff walls beneath hydraulic structures during both static and dynamic conditions, considering location and inclination angle influences. The results confirmed that placing the cutoff wall at the upstream heel was more effective in reducing uplift pressure compared to other placements during static conditions. The inclination angles for the different placements of the cutoff wall had a significant impact on the total uplift pressure, exit hydraulic gradient, and seepage discharge during both static and dynamic states. The earthquakes had a noticeable effect on uplift pressure, seepage discharge, and exit hydraulic gradient. During static conditions, the inclination angle of 90° was the most effective angle for decreasing seepage discharge, irrespective of the cutoff wall position. During an earthquake, the seepage discharge values were high regardless of the inclination angle. In the case of placing a cutoff wall at the upstream heel, the maximum seepage discharge value occurred at an inclination angle of 45°. This study provided insights into the behavior of cutoff walls under different conditions and can inform the design and construction of such structures for effective seepage control. The experimental feed-forward neural network (FFNN) was also successfully built. According to the following criteria (uplift pressure, seepage, and exit hydraulic gradient), the hydraulic performance of cutoff walls beneath hydraulic structures under static conditions can be examined. The FFNN can make predictions with root mean square errors (RMSE) of 0.0697, 0.0021, and 0.0059, respectively, and R2 values of 1.00, 0.9994, and 0.9997.
1. Introduction
Hydraulic and diversion structures such as dams, weirs, and levees are considered vital components of water resources management systems, designed to regulate water flow, store water for irrigation, generate electricity, and provide other benefits. However, these structures face several challenges, such as seepage, piping, uplift, and natural disasters such as flash floods and earthquakes, which can lead to instability and failure, causing significant economic and social impacts. To mitigate the challenges and impacts, various measures are utilized, including the use of cutoff walls and drainage systems [1,2,3,4]. Seepage occurs beneath the foundation of hydraulic structures constructed on permeable foundations due to the difference in water levels upstream and downstream. The seepage impacts on the permeable foundation can be categorized into uplift force, seepage discharge, and exit gradient. Uplift force reduces the shear resistance between the dam and its foundation, leading to tension stress and a decrease in the factor of safety against overturning and sliding of the hydraulic structure. Meanwhile, exit gradient serves as the primary design parameter for ensuring the safety of hydraulic structures against piping phenomena [5].
Excess uplift pressure and piping phenomena are considered the primary causes of hydraulic structure failure [6]. To mitigate these effects, reducing the total uplift pressure and exit gradient is crucial for ensuring hydraulic structure safety. To achieve this goal, cutoff walls at the foundation sides of hydraulic structures are implemented [2]. These walls are impermeable and consist of steel sheet piles, concrete trenches, grout curtains, or impervious blankets. The placement of these walls reduces seepage discharge and/or exit gradient, providing the necessary protection against uplift pressure and piping [1,2,7,8]. To manage and dominate seepage flow and mitigate its adverse impacts, hydraulic structures commonly employ comprehensive drainage systems consisting of drainage galleries, drainage tunnels, and draining wells [2,9].
Seepage under hydraulic structures has been a topic of extensive research, and several theories have been developed [10,11,12]. Bligh [10] proposed the creep length theory to explain the flow of water under hydraulic structures. This theory defines the creep length as the path of the first seepage line contacting the foundation. In Bligh’s theory, the uplift pressure distribution is assumed to be linear under the foundation, and energy loss along the creep line varies proportionally with its length. Lane [11] found that there are variations between horizontal and vertical creep paths and developed the weighted creep theory, in which coefficients of 0.33 and 1.0 were considered for total horizontal and vertical percolation lengths, respectively. On the other hand, Khosla et al. [12] examined the flow network under a hydraulic structure on a permeable foundation. A technique for calculating uplift pressure distribution under foundations was proposed based on hypothesizing that the flow and potential lines are concentric ellipses and hyperbolas.
Compared to the creep line theories of Bligh and Lane, Khosla’s theory is generally more dependable. However, when a complicated foundation is present, solving highly complex equations is needed; also, accuracy could be low in the case of dealing with anisotropic foundations [5]. An analytical solution based on the Laplace equation can also be used to calculate an exact uplift pressure distribution for different boundary conditions. Nevertheless, the equation is difficult for complicated engineering practices, so difficult integrals were present [13]. Thus, to overcome the complexity of solving Laplace equations and the low accuracy of other methods, particularly when dealing with complex boundary conditions, numerical solutions based on a finite element approach have been widely used recently [14,15]. Numerical solutions based on the finite element method have proven to be an effective technique for calculating uplift pressure, seepage flow, and exit gradient under hydraulic structures. These methods involve dividing the foundation soil into finite elements, allowing for a detailed analysis of the flow and deformation behavior of the hydraulic structure [7].
Recently, there have been various studies dealing with uplift pressure, seepage flow, and exit gradient calculations using numerical solutions based on a finite element approach. Those studies investigated different placements of the cutoff wall and different inclination angles under the static conditions [1,2,3,5,8]. A combination of finite element modeling and a genetic algorithm (GA) model was developed to determine the ideal cutoff position and inclination angle for a hydraulic structure with a specific cutoff depth to floor length ratio under static conditions [16,17]. The study conducted by Javanmard et al. [18] explored the interaction between the core and foundation with the cutoff wall under various static and dynamic loading conditions. Despite the abundance of studies focused on cutoff walls under hydraulic structures during static conditions [1,5,8,19], there remains a significant dearth of research on the hydraulic response of cutoff walls during dynamic states.
In actuality, artificial neural networks (ANNs) are frequently utilized in a variety of civil and environmental engineering applications to test the consistency between the measured and projected concentrations of key parameters [20,21,22]. The acceptable performance of ANNs in modeling has two aspects: first, it enables theoretical analysis, and second, it offers a useful model to forecast the level of output parameters given comparable input data. In terms of investigating the hydraulic performance of cutoff walls beneath hydraulic structures during static conditions, ANN modeling is an alternate data analysis to achieve quick results utilizing a less involved method with satisfactory results [23,24,25]. The solution based on the radial basis function method (RBF) also had acceptable accuracy [26].
The purpose of this study is to investigate the hydraulic characteristics, including uplift pressure and exit gradient, at different placements and inclination angles of the cutoff wall during static and dynamic loading conditions. Investigating the behavior during earthquake shaking is recently considered an urgent need, particularly after the frequent earthquakes and their subsequent aftershocks. This study aims to fill this gap and provide a more comprehensive understanding of the hydraulic behavior of cutoff walls in different conditions, consequently assessing the stability of water structures under both static and dynamic conditions to protect lives and property in neighborhood regions. To achieve this objective, this study focused on modeling a diversion dam with a preamble foundation and a cutoff wall using the finite element Geo-Studio (2019 R2) software. An artificial neural network (ANN) approach was also employed to predict the parameter measurement.
2. Materials and Methods
2.1. Governing Equations
Seepage flow through porous media follows Darcy’s law and Poisson’s equation (Equations (1) and (2), respectively). It is worth mentioning that water flows from the position of a high total head to a low total head under the effect of a hydraulic gradient.
where q is the seepage discharge (m3/s), k is the hydraulic conductivity coefficient (m/s), A is the area of the cross section (m2), ∂h/∂l is hydraulic gradient, Kx and Ky are hydraulic conductivity in horizontal and vertical directions, respectively (m/s), h is the total water head (m), Q is the applied boundary flux, θ is the volumetric water content, and t is time.
2.2. Numerical Simulation
The Geo-Studio (2019 R2) commercial software, including Seep/w [27], Sigma/w [28], and Quake/w [29], was used in this study to determine uplift pressure, exit gradient, and seepage flow during both static and dynamic loading conditions. Seep/w is finite element software that is specifically designed to analyze water seepage and pressure problems in porous media, whereas Sigma/w and Quake/w are utilized for stress, deformation, and dynamic modeling, respectively. Both steady-state and transient flow problems in a plane strain domain can be analyzed using Seep/w. In this study, the foundation soil was assumed to be isotropic and homogeneous with a saturated hydraulic conductivity of 10−5 m/s, and a steady-state seepage analysis was performed for all cutoff wall systems during the static condition. The cutoff wall was simulated as an impermeable interface. Moreover, a fully saturated analysis was considered for all materials in the hydraulic structure foundation’s model during the static condition, while a transient analysis was performed during the earthquake shaking (i.e., dynamic loading condition).
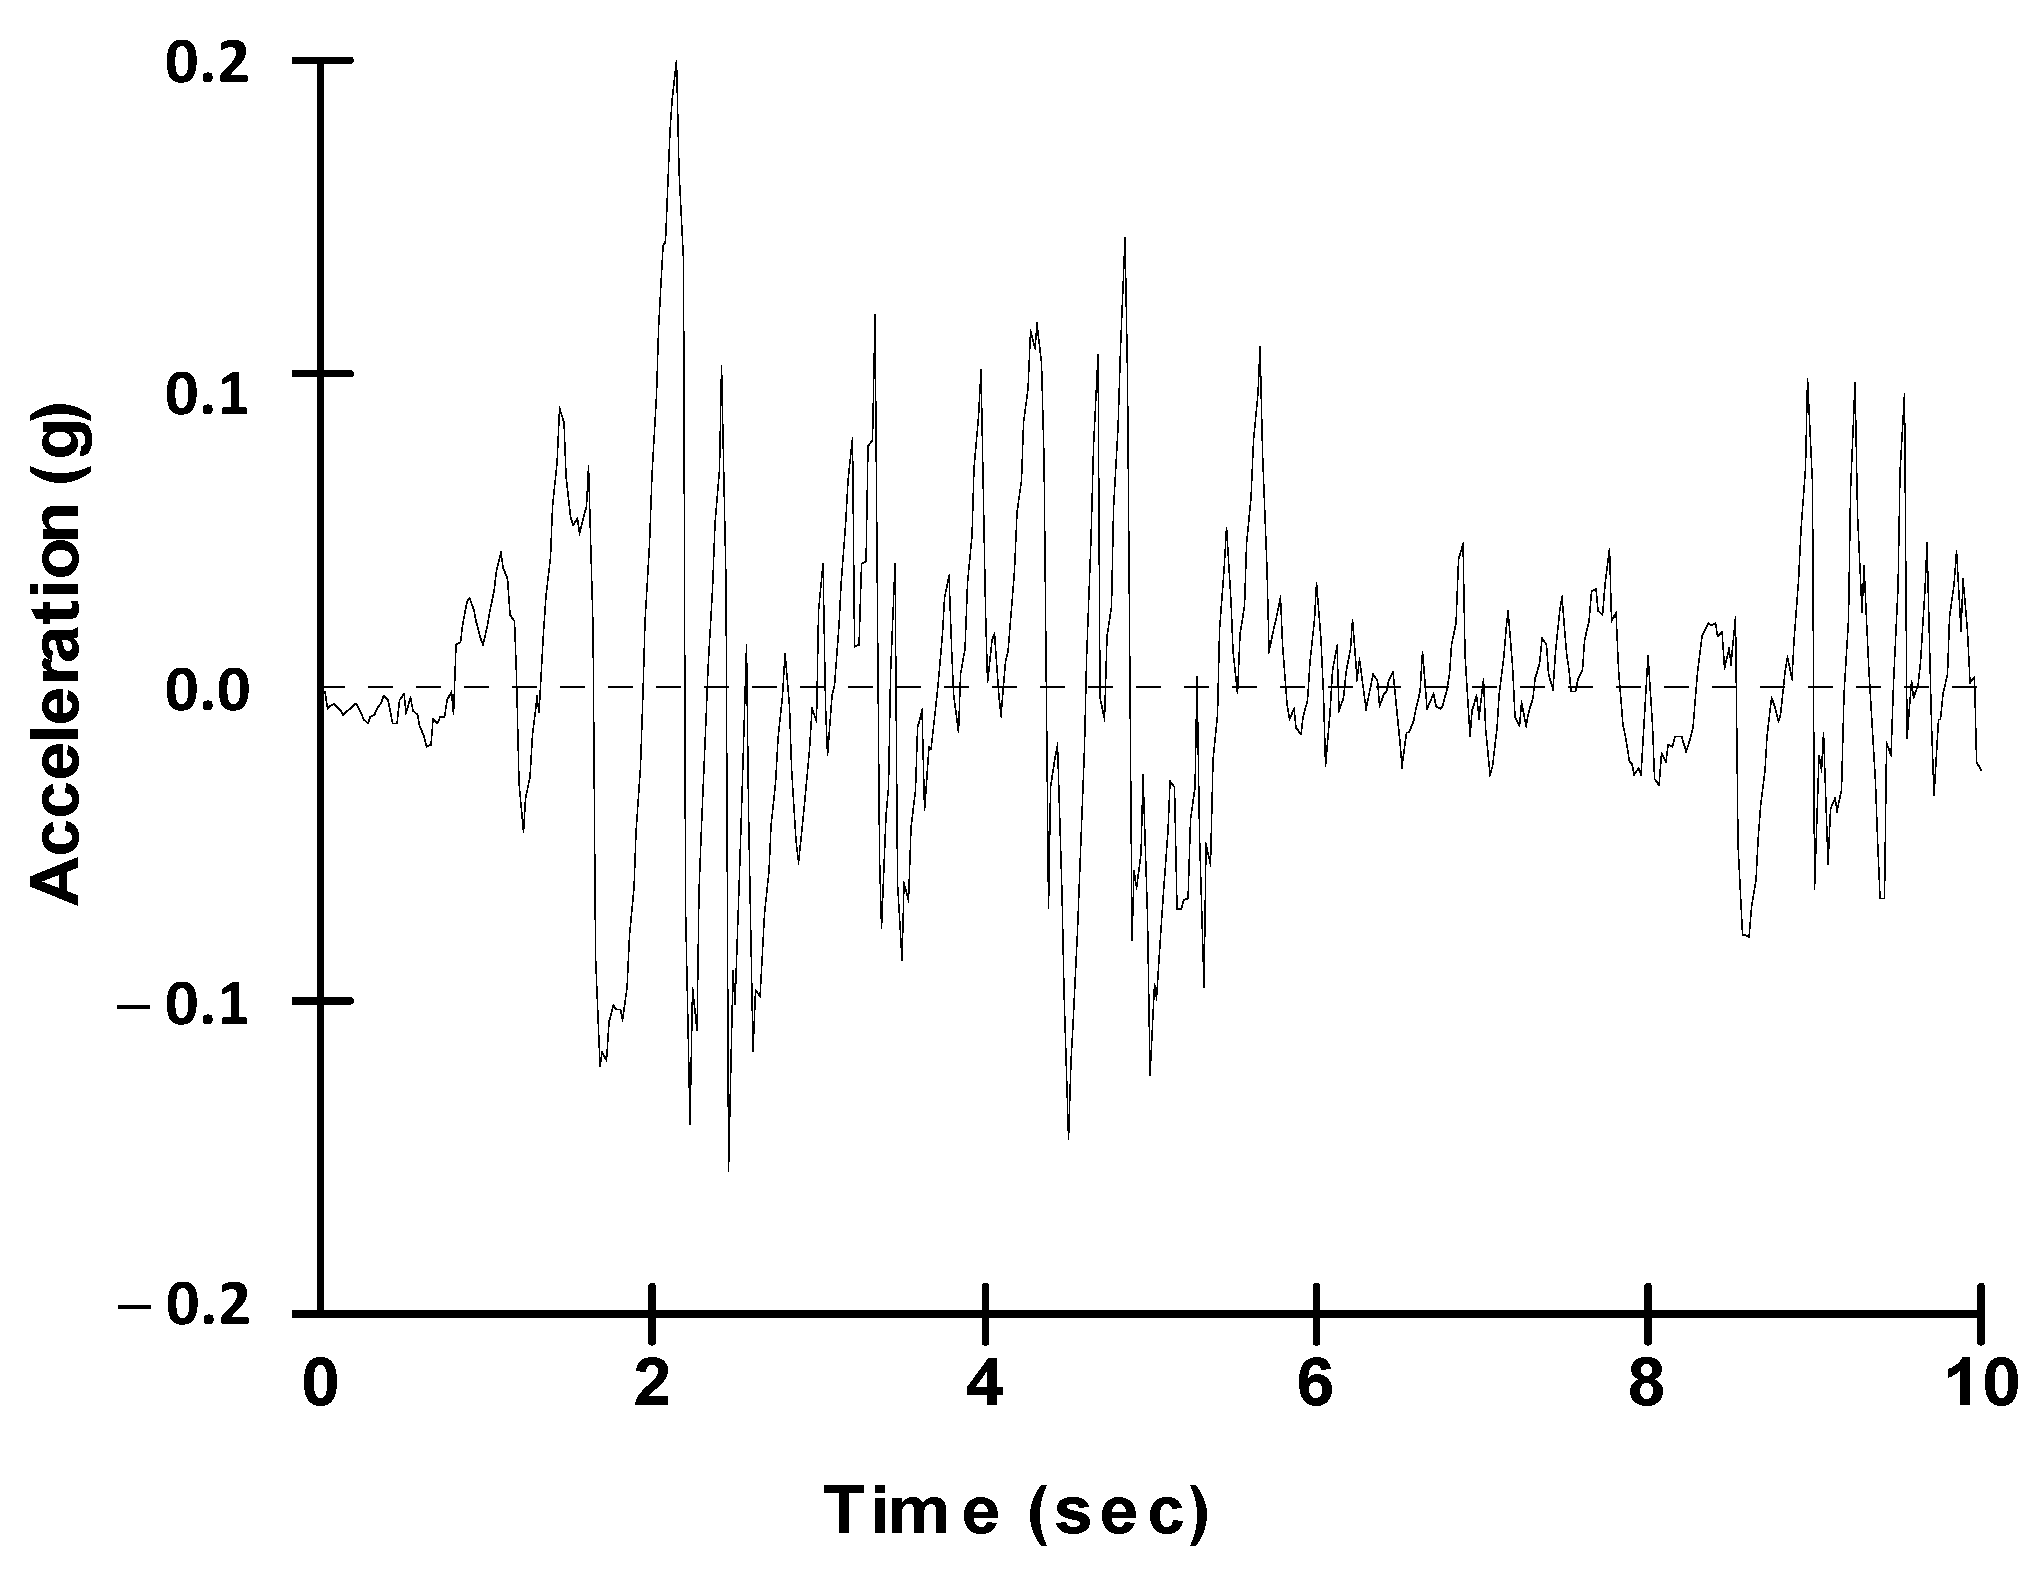
The boundary conditions were defined for upstream and downstream sides as a pressure head, where the values for upstream and downstream were 10.0 m and 0.0 m, respectively. For stress, deformation, and dynamic analyses conducted by Sigma/w and Quake/w, respectively, the boundary conditions were also defined, and the initial pore water pressure was defined from the Seep/w parent analysis. The foundation material was also defined for Sigma/w and Quake/w analyses as linear elastic. It is worth mentioning that the definition of material properties differs based on the analysis type. For example, in Seep/w analysis, the hydraulic properties were defined, while in Sigma/w and Quake/w analyses, the mechanical and engineering properties were defined. A 0.2 g peak shaking acceleration of an earthquake was used in the numerical simulation, and the acceleration versus time was indicated in Figure 1. According to the Instrumental Intensity Scale developed by the United States Geological Survey based on a peak ground acceleration of 0.2 g, the earthquake can be categorized as grade IV [30]. This study investigated the dam shown in Figure 2 without a cutoff wall (i.e., the base case), besides placing the cutoff wall in three positions in the upstream heel (US), midpoint of the dam base (Middle), and downstream toe (DS). In addition to the three different placements of the cutoff wall, various inclination angles were also investigated, including 15, 30, 45, 60, 75, 90, 105, 120, 135, 150, and 165.
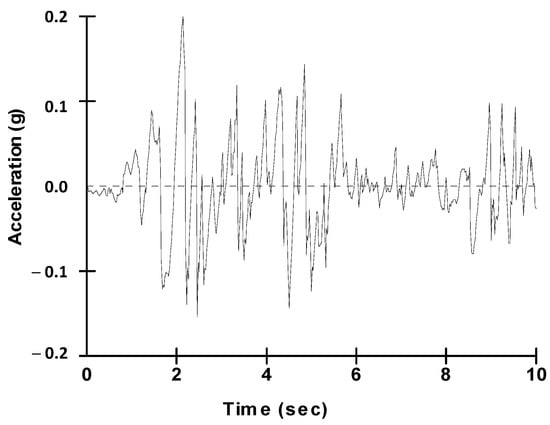
Figure 1.
Earthquake acceleration versus time.
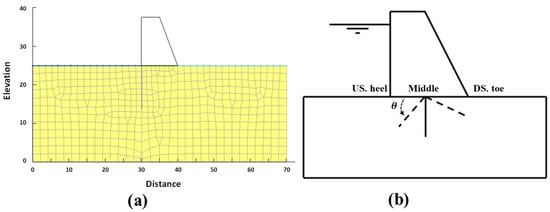
Figure 2.
(a) Base case and (b) schematic diagrams indicating different positions and inclination angles.
2.3. Artificial Neural Networks
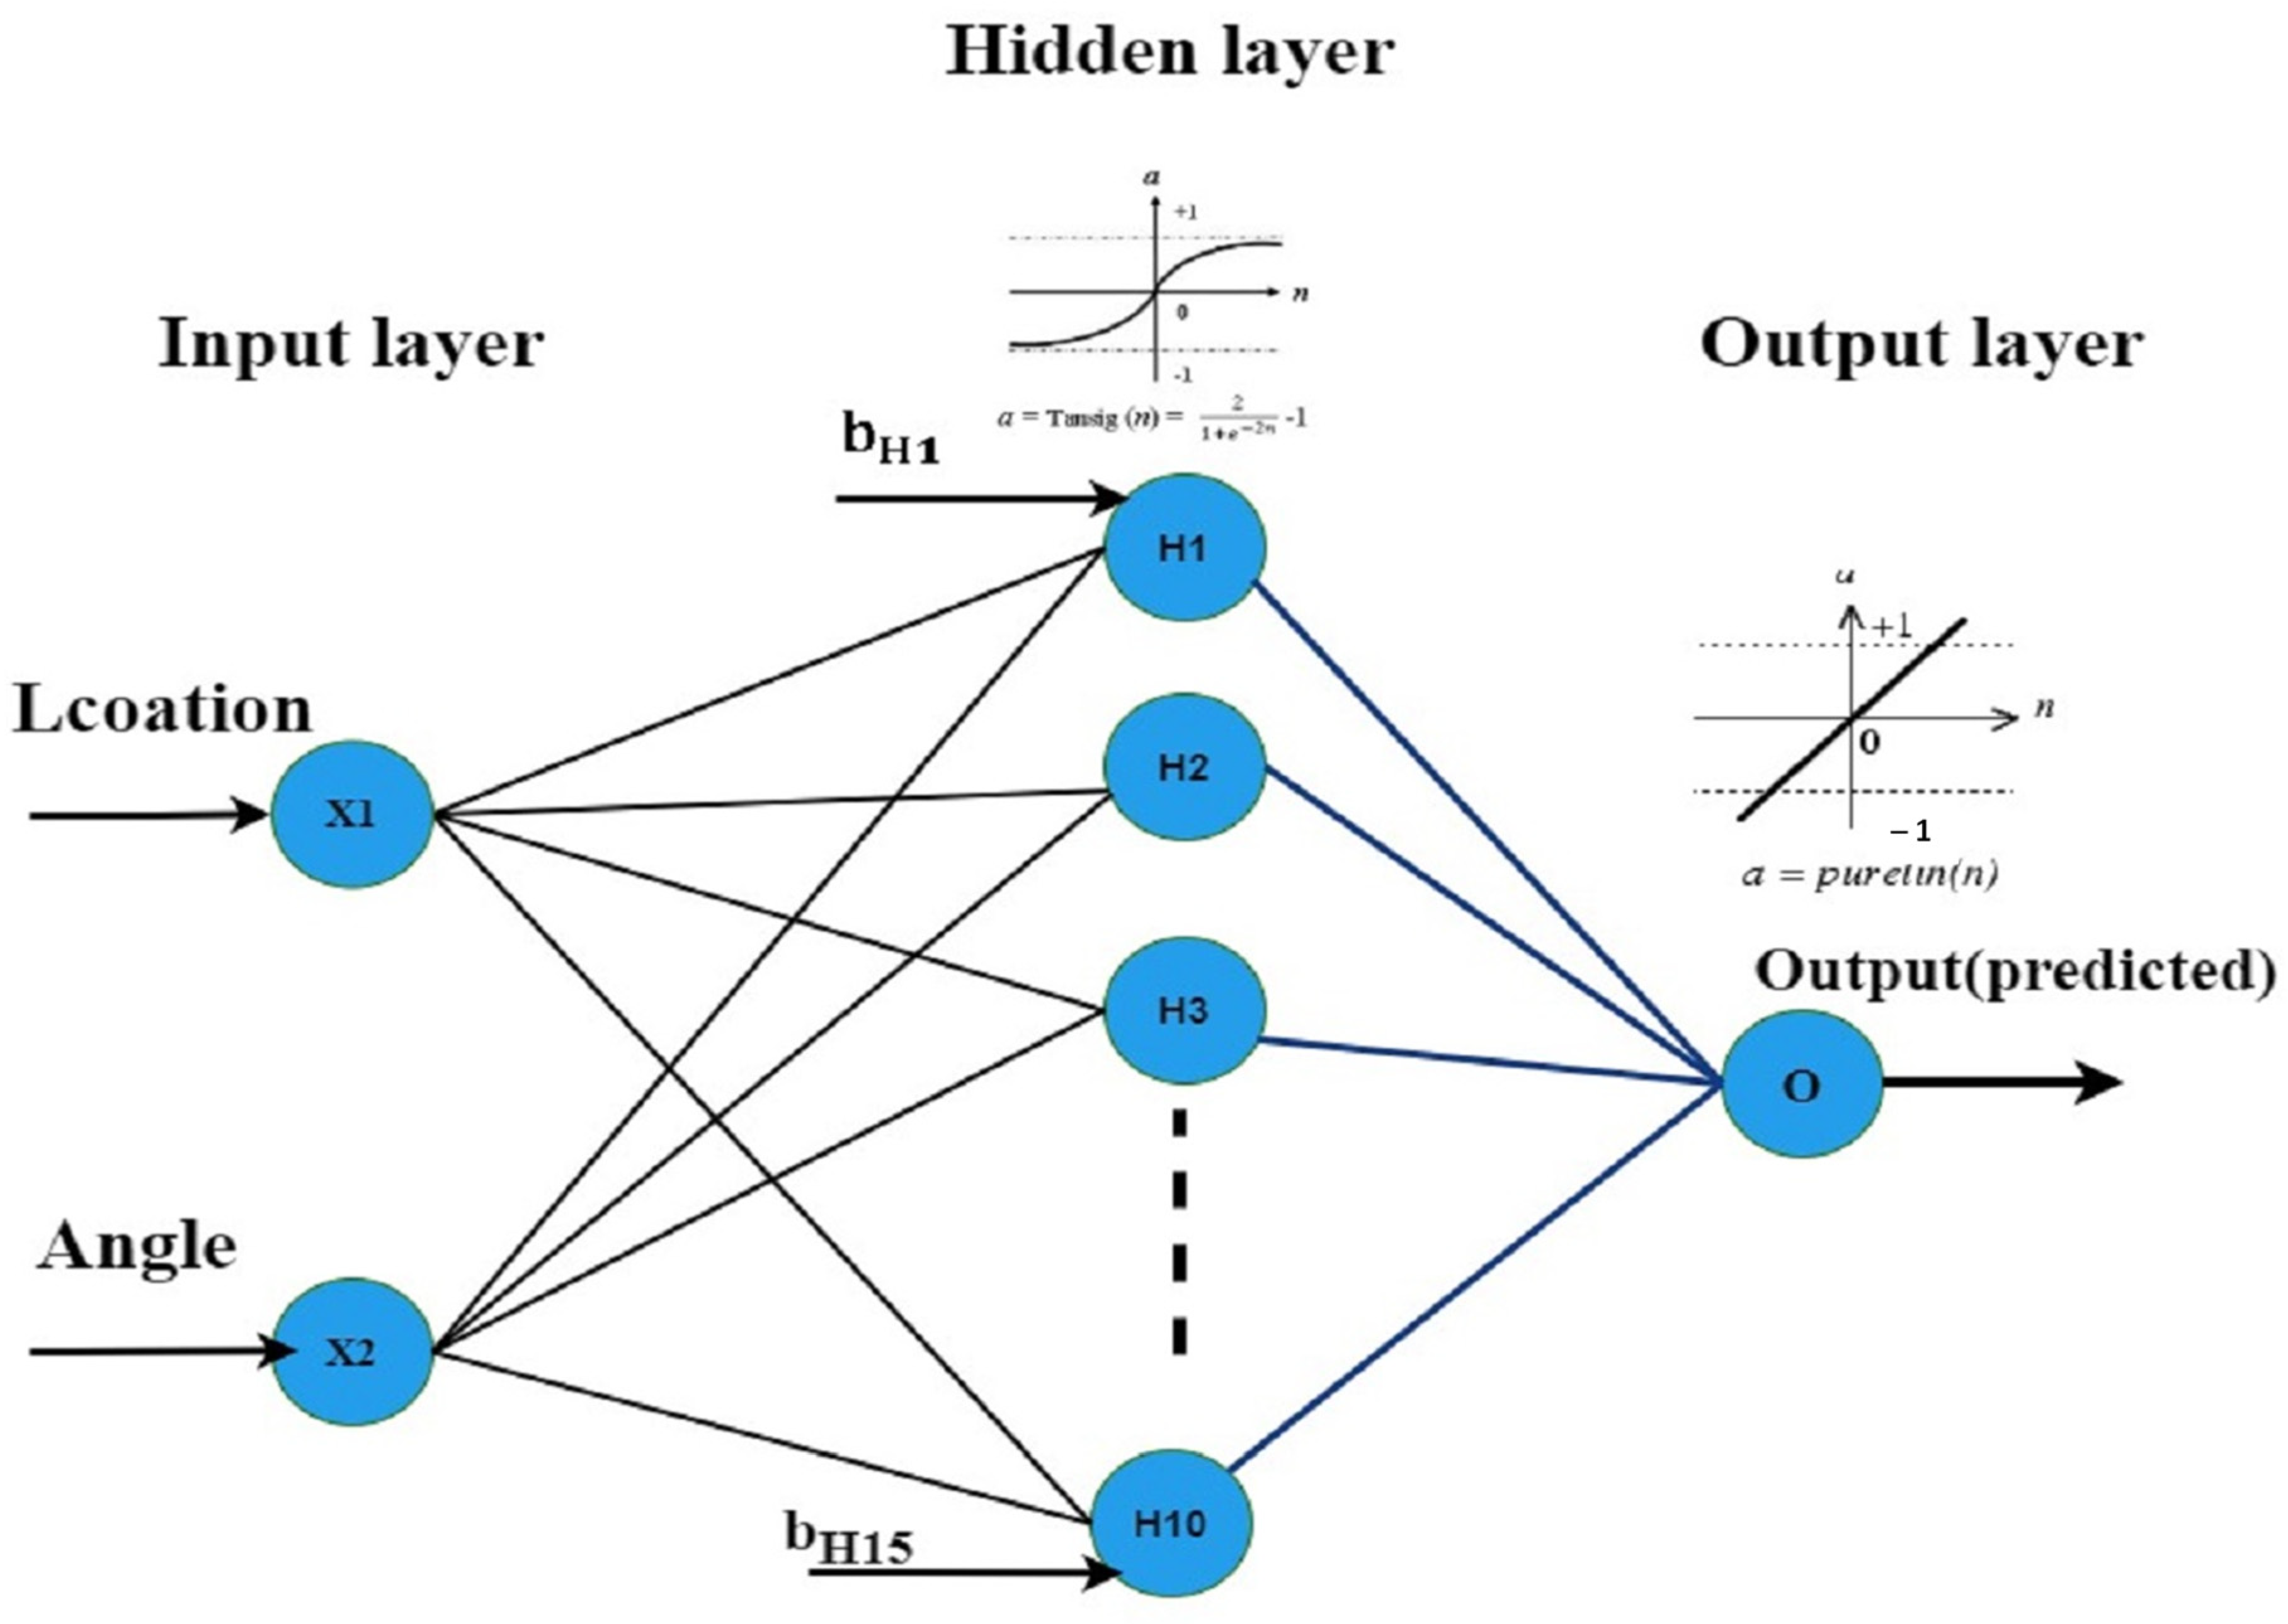
In a number of engineering applications, artificial neural networks (ANNs) simulate and forecast diverse environmental issues using statistical modeling [20,21,22,23]. According to Figure 3, the feed-forward neural network (FFNN) used in this study includes three layers and three levels. The input layer is the one from which the model’s inputs are derived. These inputs are provided by the analysis of the slope angles for the various cutoff wall positions in terms of location and slope angle. Based on the uplift pressure, seepage, and exit hydraulic gradient in the static state, the most effective location and impacts of the slope angle to limit leachate discharge were estimated. The Tansig equation (Equation (3)) states that there are M neurons with a specific level of activity in the hidden layer.

Figure 3.
A hidden layer in the FFNN structure.
The goal of network training, where n is the input to this function, is to determine the best weights and biases for the connections between the layers of the network. The neural output is often expressed as in Equation (4):
where stands for the y-th neuron in the output of a layer that is not an input (). f (.) stands for the activation function, by stands for the bias value, and denotes the weight of the connection between the x-th neuron in the previous layer preceding.
The flowchart in Figure 4 represents the training procedure for an FFNN-based predictive model. The data samples are randomly divided into a training group (70%), a validation group (15%), and a test group (15%). A typical test criterion for neural network models in a variety of applications is in the range of 70–30%. It has been widely used in other studies with similar focus [22,23]. The FFNN is trained with a set of weights and biases for all connections selected randomly. The performance of the model is evaluated using the root mean square error (RMSE) given in Equation (5) and the R-squared coefficient R2 (Equation (6)).
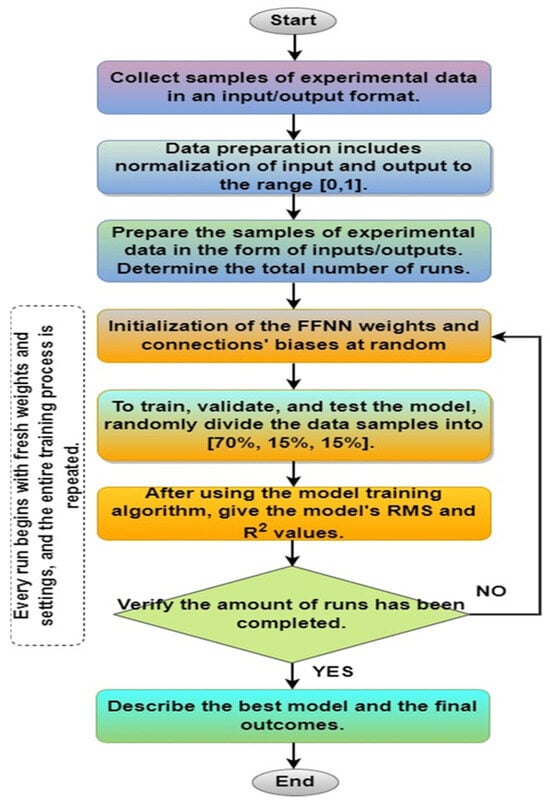
Figure 4.
Flowchart for predicting the suitability for uplift pressure, seepage, and exit hydraulic gradient supply using FFNN.
N stands for the sample size (training, validation, or test), stands for the target value (i.e., the result of the experiment), denotes the average of the target values, and stands for the model output for that particular target value. The RMSE is calculated for both the training set and the validation set in order to monitor model behavior and prevent overfitting. The RMSE for the test set is calculated following the training phase. To find the typical model behavior, the entire process is repeated a predetermined number of times.
3. Results and Discussion
3.1. Uplift Pressure
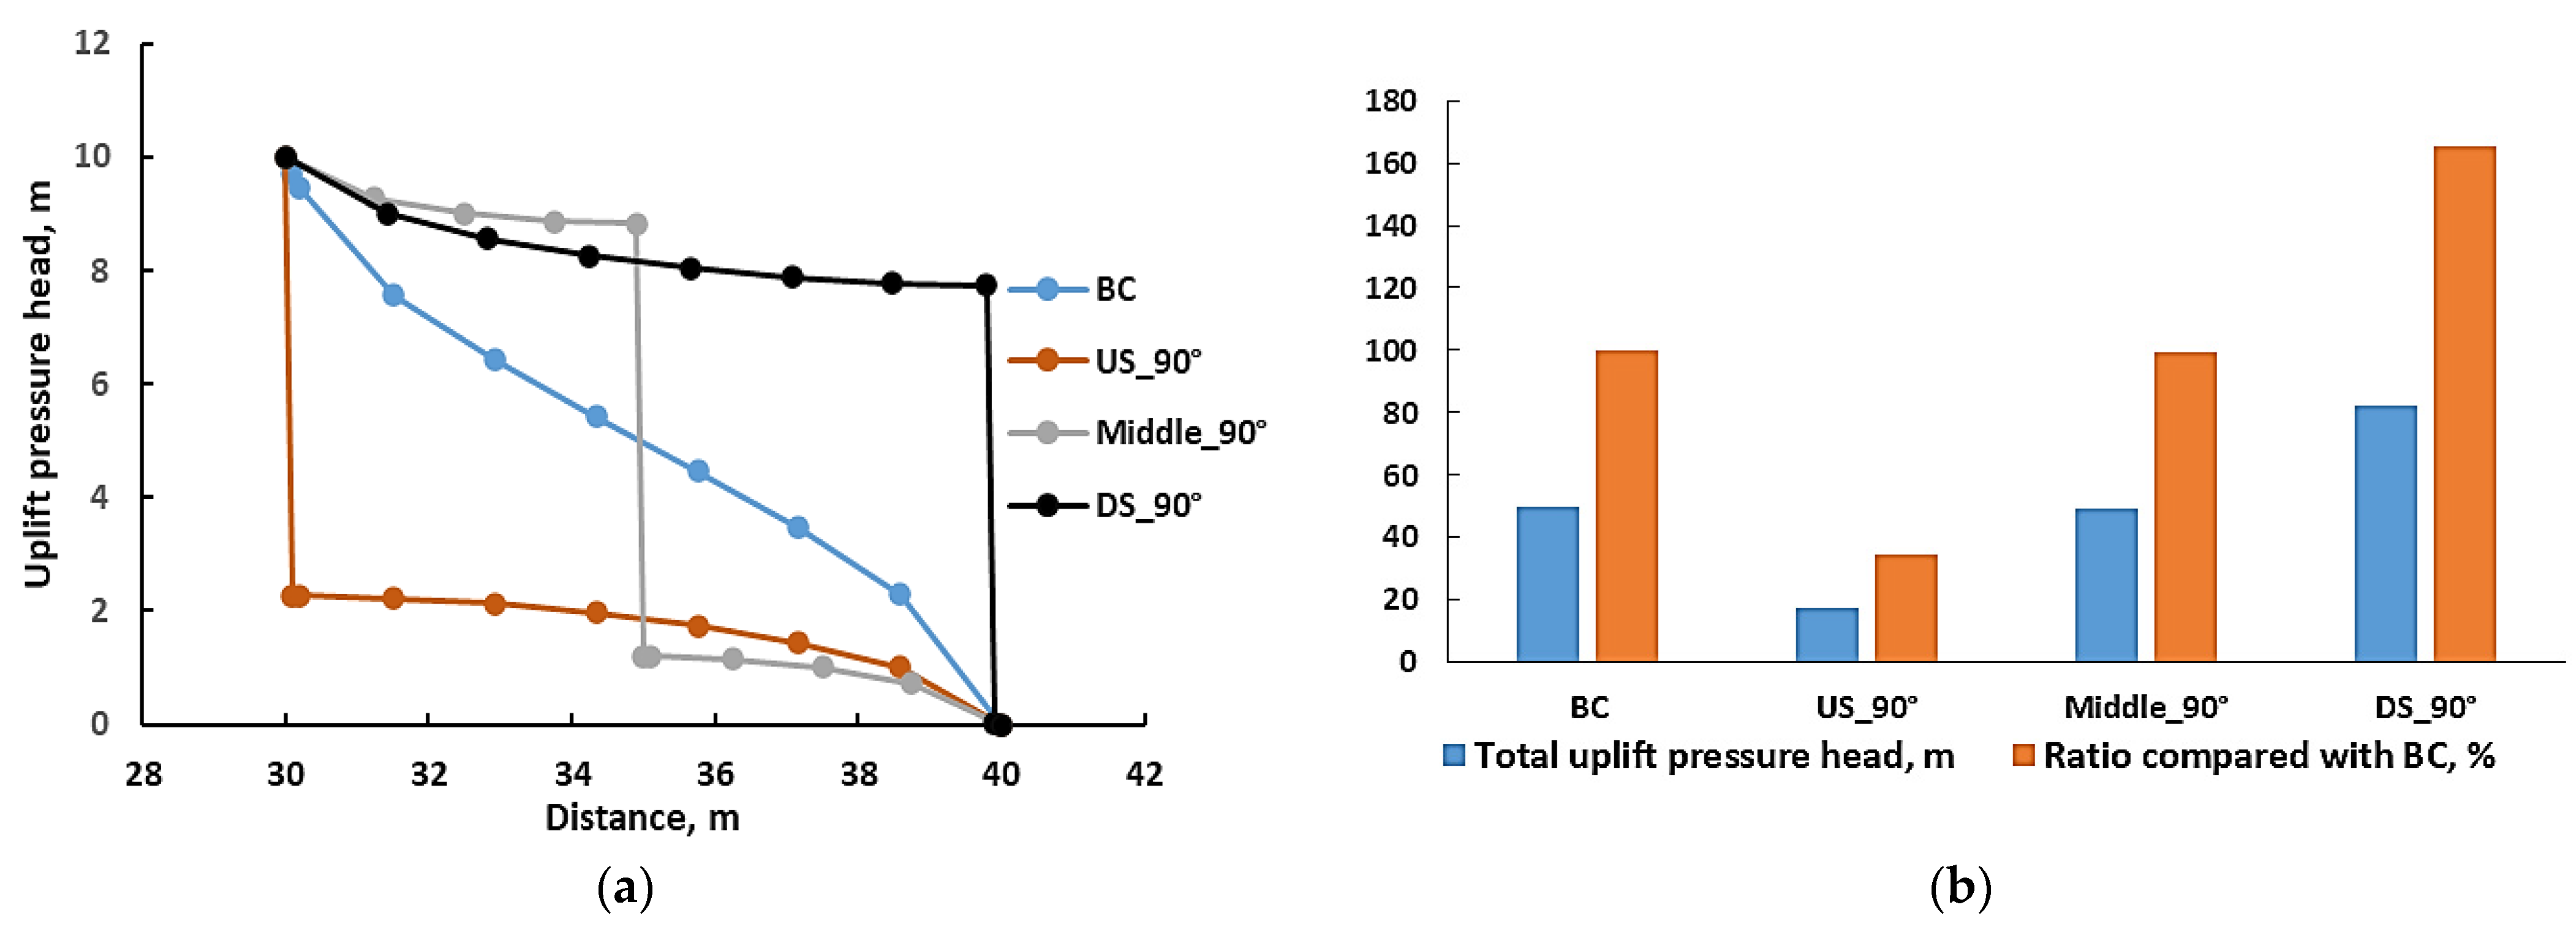
Uplift pressure is a key factor to be considered in the design and stability of hydraulic structures such as diversion dams. It refers to the pressure exerted by groundwater below the dam structure, which can cause the structure to uplift and potentially fail. Determining the value of uplift pressure is crucial in ensuring the safety and stability of hydraulic structures, as it helps to determine the required thickness of the structure’s foundation and the location and design of cutoff walls to prevent seepage flow. In addition, uplift pressure can also have a significant effect on the overall structural stability of the hydraulic structures, causing deformation or cracks and leading to potential failure. Therefore, accurately determining the uplift pressure distribution and understanding its effect on the stability of the diversion dam is essential for designing safe and effective structures. Thus, in this section, uplift pressure is investigated during static and dynamic conditions by using a cutoff wall at three different positions and various inclination angles. Figure 5 indicates the uplift pressure distribution under the diversion dam. It can be clearly seen that placing the cutoff wall at the heel (i.e., upstream side US) had the lowest value of uplift pressure in comparison with the base case (i.e., without the cutoff wall BC) and another two cases in the middle and in the toe (i.e., downstream side DS). Where the total uplift pressure values decreased by almost 65% in the case of placing the cutoff wall in the upstream heel at an inclination angle of 90° (i.e., US_90°). While the total uplift pressure increased greatly by almost 165% when the cutoff wall was placed at the downstream toe at an angle of 90° (i.e., DS_90°) in comparison with the base case, this finding matched closely with Mansuri et al. [1] and Moharrami et al. [8]. It is worth mentioning that water flows from upstream to downstream through the porous foundation under the effect of a change in total energy. Therefore, using a cutoff wall at the upstream heel leads to dissipating most of the seeped water energy at the beginning of the structure’s floor. While using a cutoff wall downstream toe let the seeped water dissipate its energy at the end of the structure’s floor. Therefore, installing a cutoff wall at the upstream heel is more effective than that placement in the downstream toe.

Figure 5.
(a) Uplift pressure distribution; (b) the total uplift pressure ratio compared with the base case for a static condition at an inclination angle of 90°.
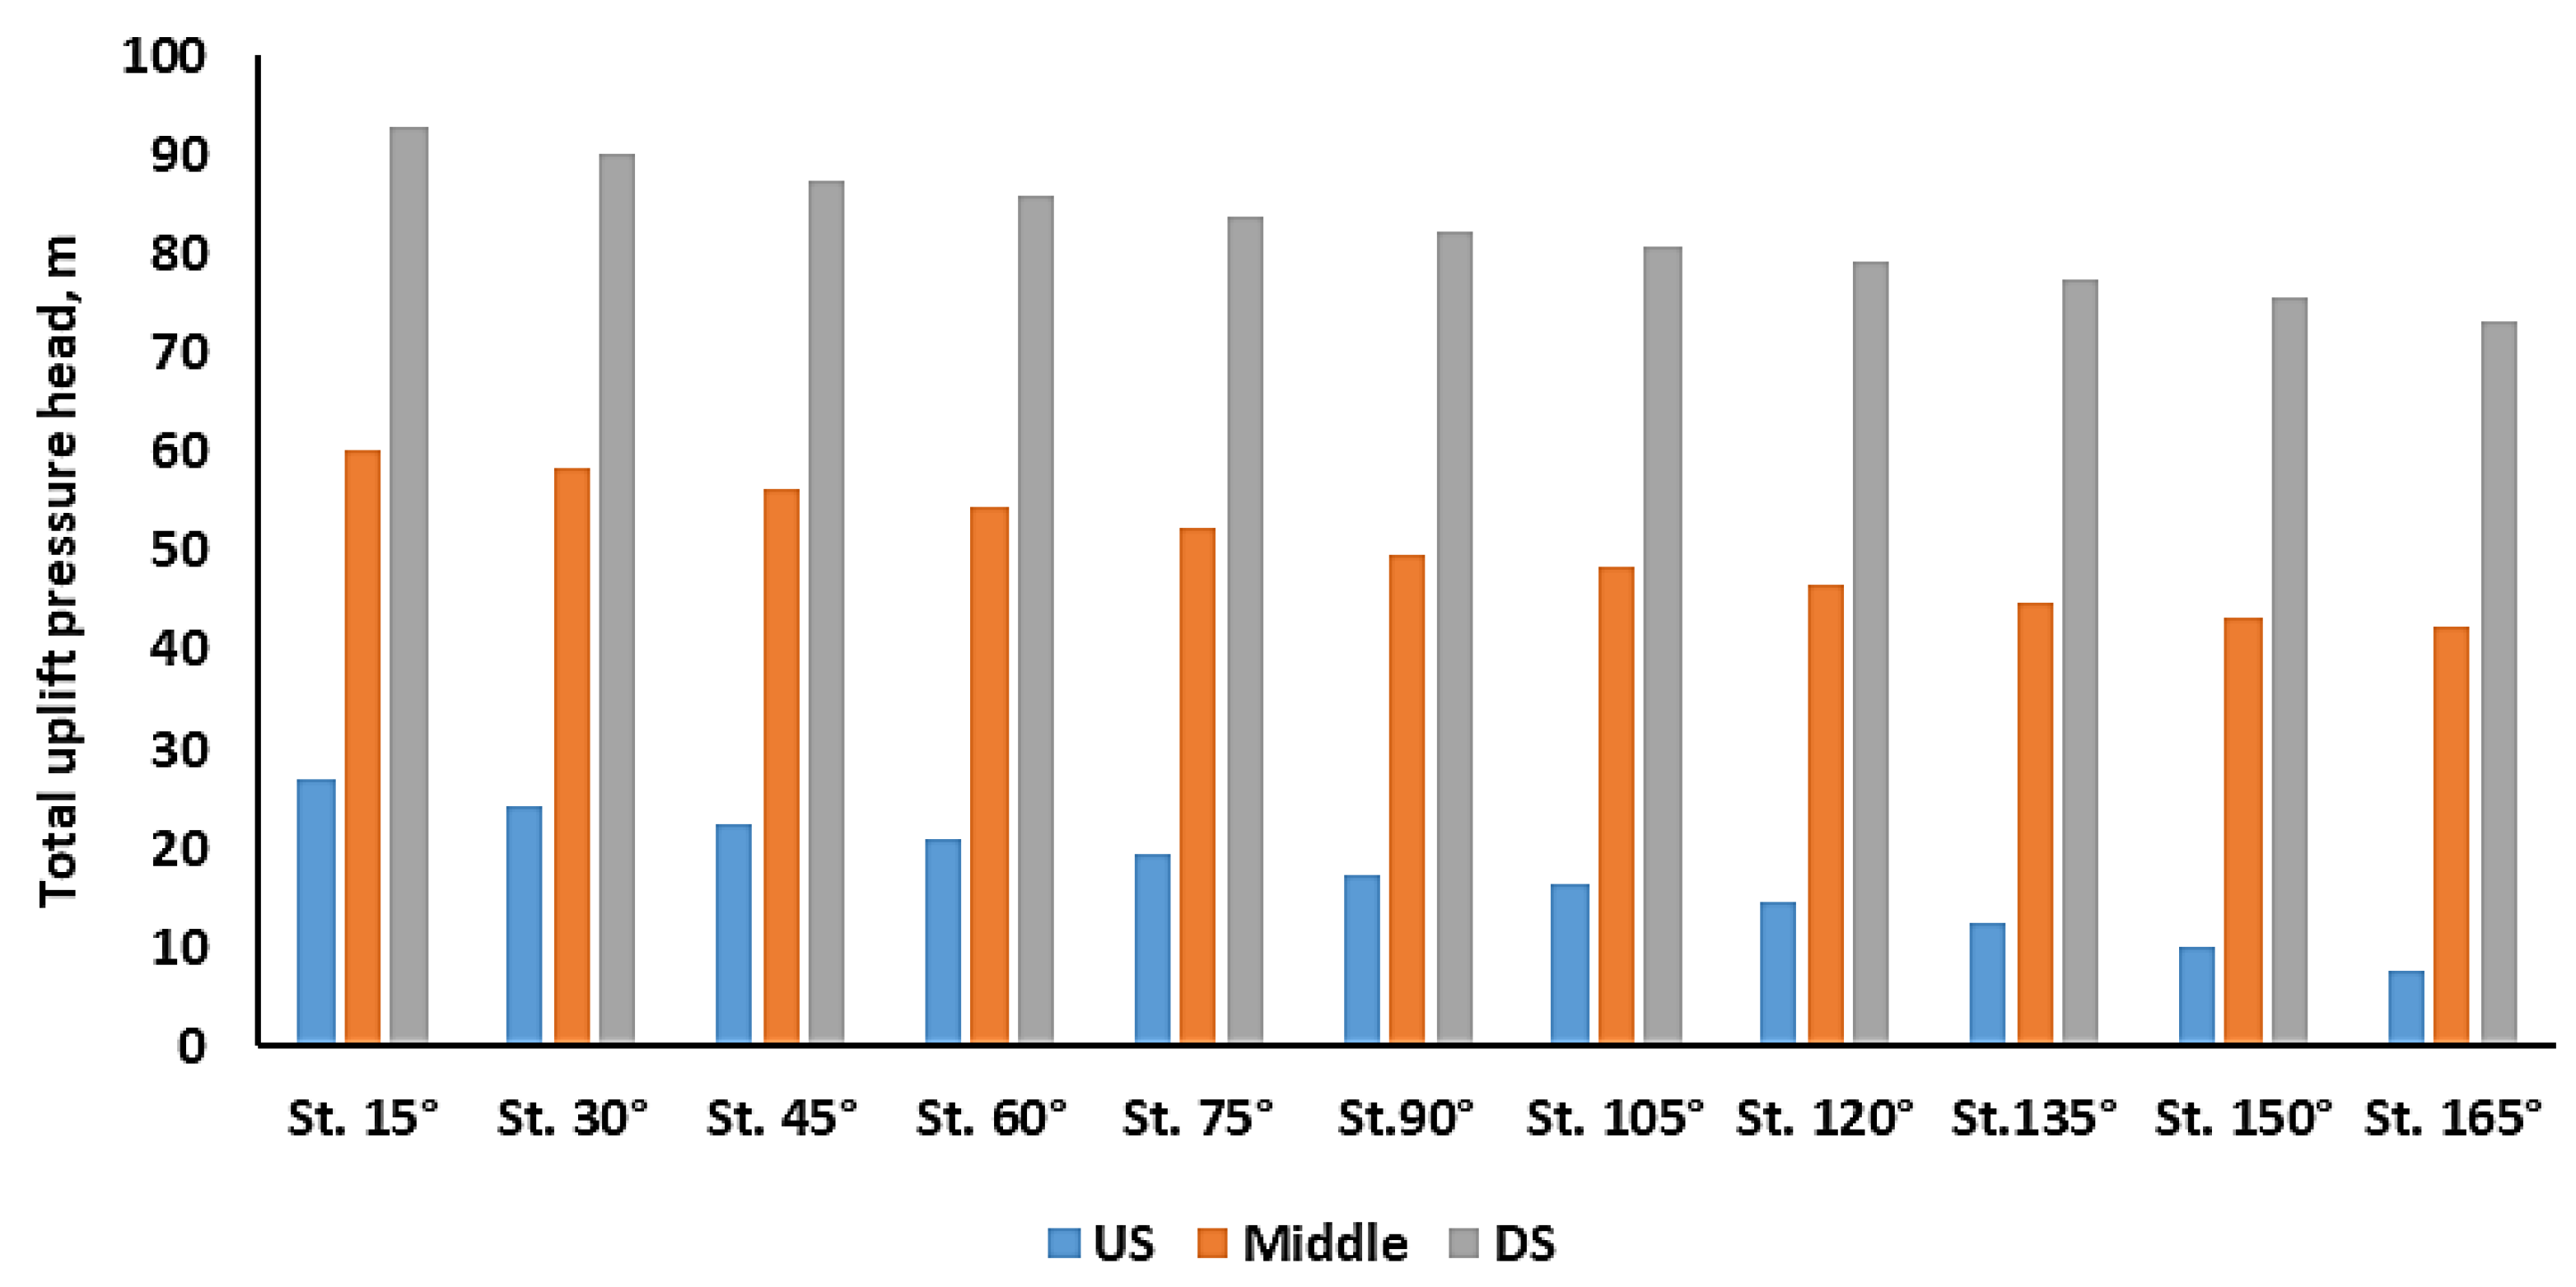
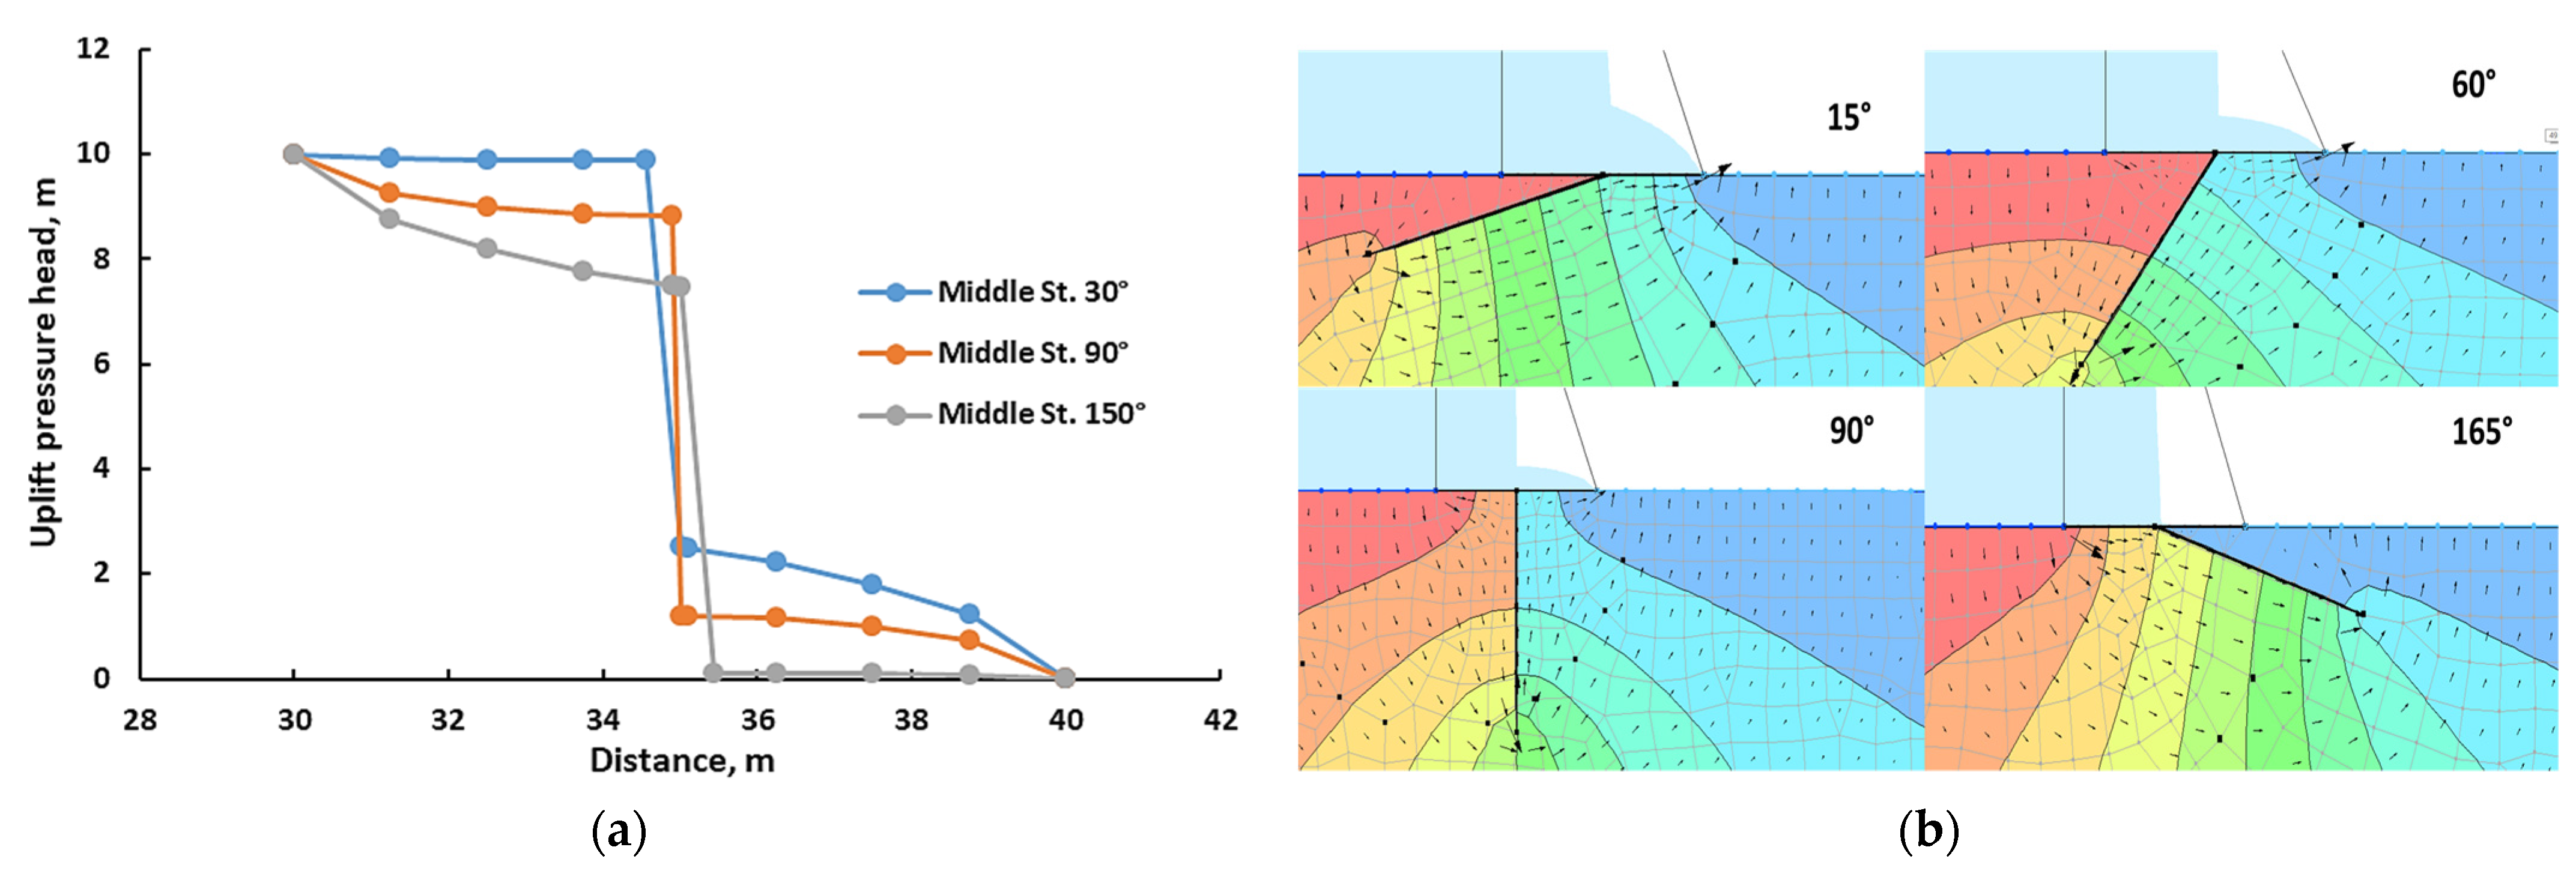
The inclination angles for the different placements of the cutoff wall had a significant impact on the total uplift pressure, as shown in Figure 6. As the inclination angle increased, the total uplift pressure decreased, irrespective of the cutoff wall position. This observation also matches Mansuri et al. [1] and Moharrami et al. [8]. It can be clearly noticed that the decreasing rate of the total uplift pressure increased as the inclination angle increased. The decreasing rates in total uplift pressure were almost 72%, 29%, and 21% for the placements US, Middle, and DS, respectively, when the inclination angle was increased from 15° to 165°. This can be explained as follows: The inclination angle of the cutoff wall affects the direction and intensity of the seepage water flow through the foundation soil. When the angle of inclination is small, then the seepage water flow is parallel to the structure foundation, which may result in high uplift pressure. On the other hand, when the angle of inclination increases, the seepage water flow is directed away from the hydraulic structure foundation, which may decrease the uplift pressure, as indicated in Figure 7. Therefore, the inclination angle of the cutoff wall is an important factor to be considered during the design of hydraulic structures to ensure their stability and longevity.
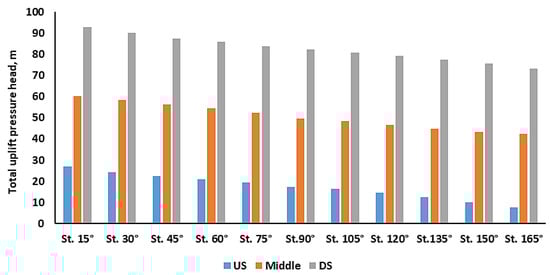
Figure 6.
Total uplift pressure head for different positions and inclination angles during static conditions.
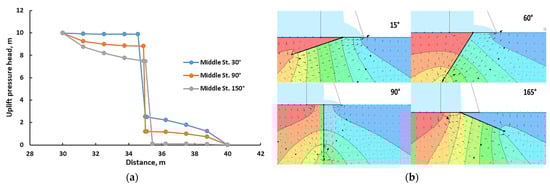
Figure 7.
(a) Uplift pressure distributions for inclination angles of 30°, 90°, and 150° at the middle position during the static condition; (b) seepage water flow at the middle position and various inclination angles.
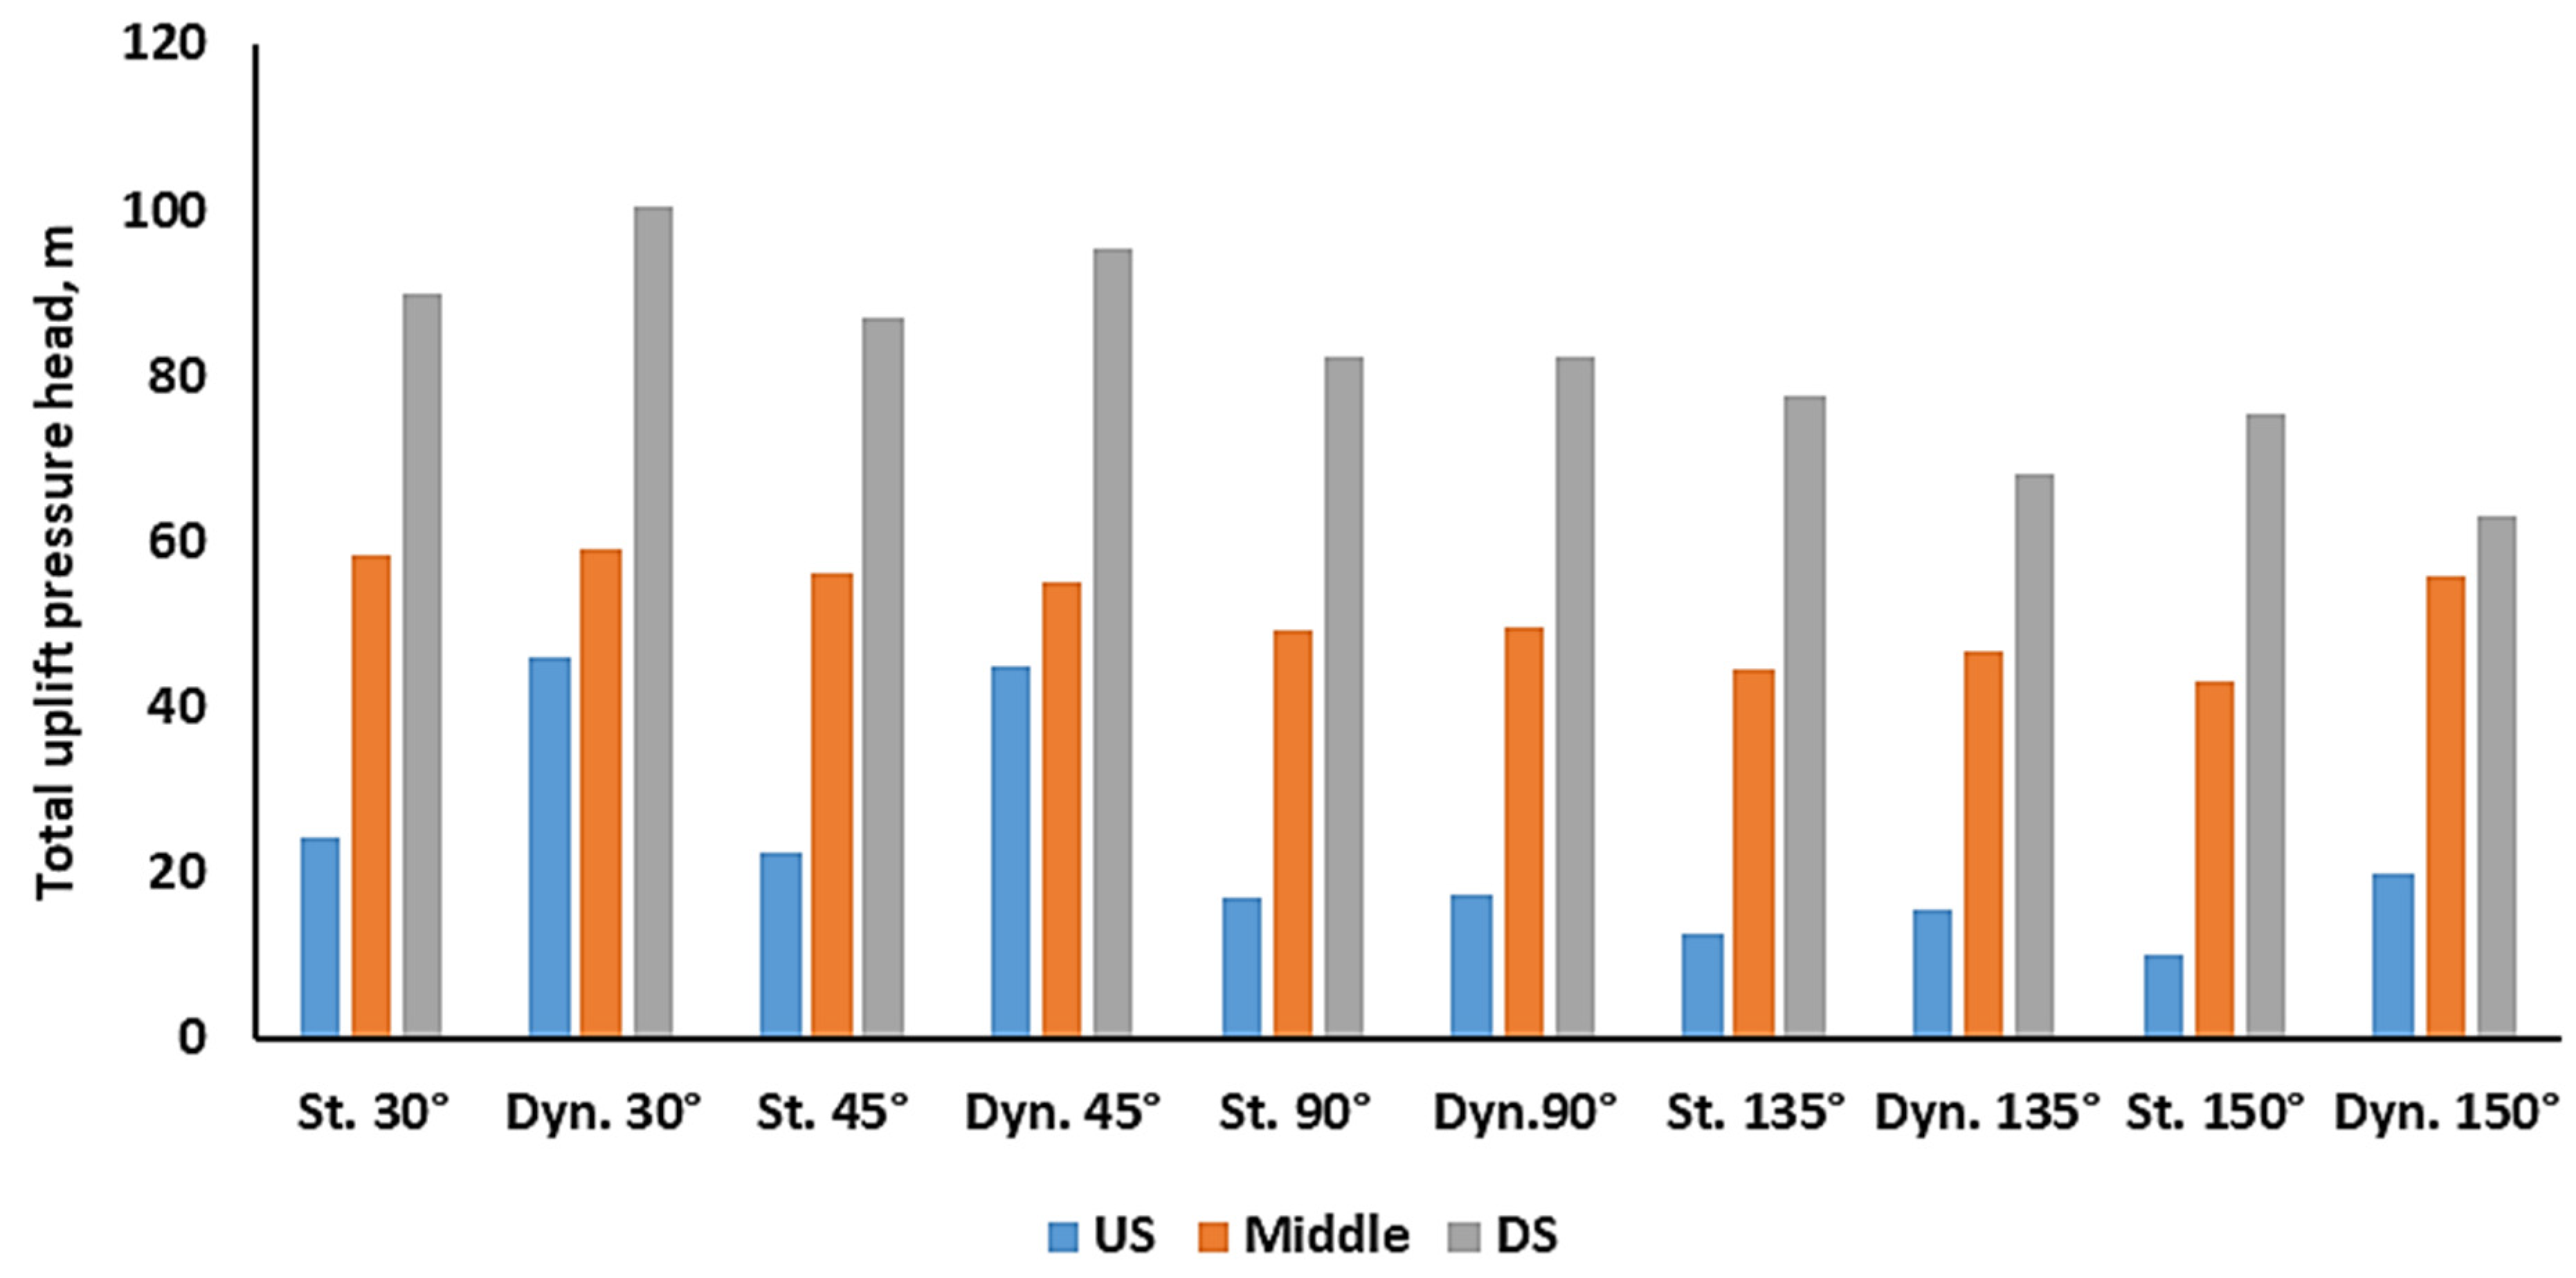
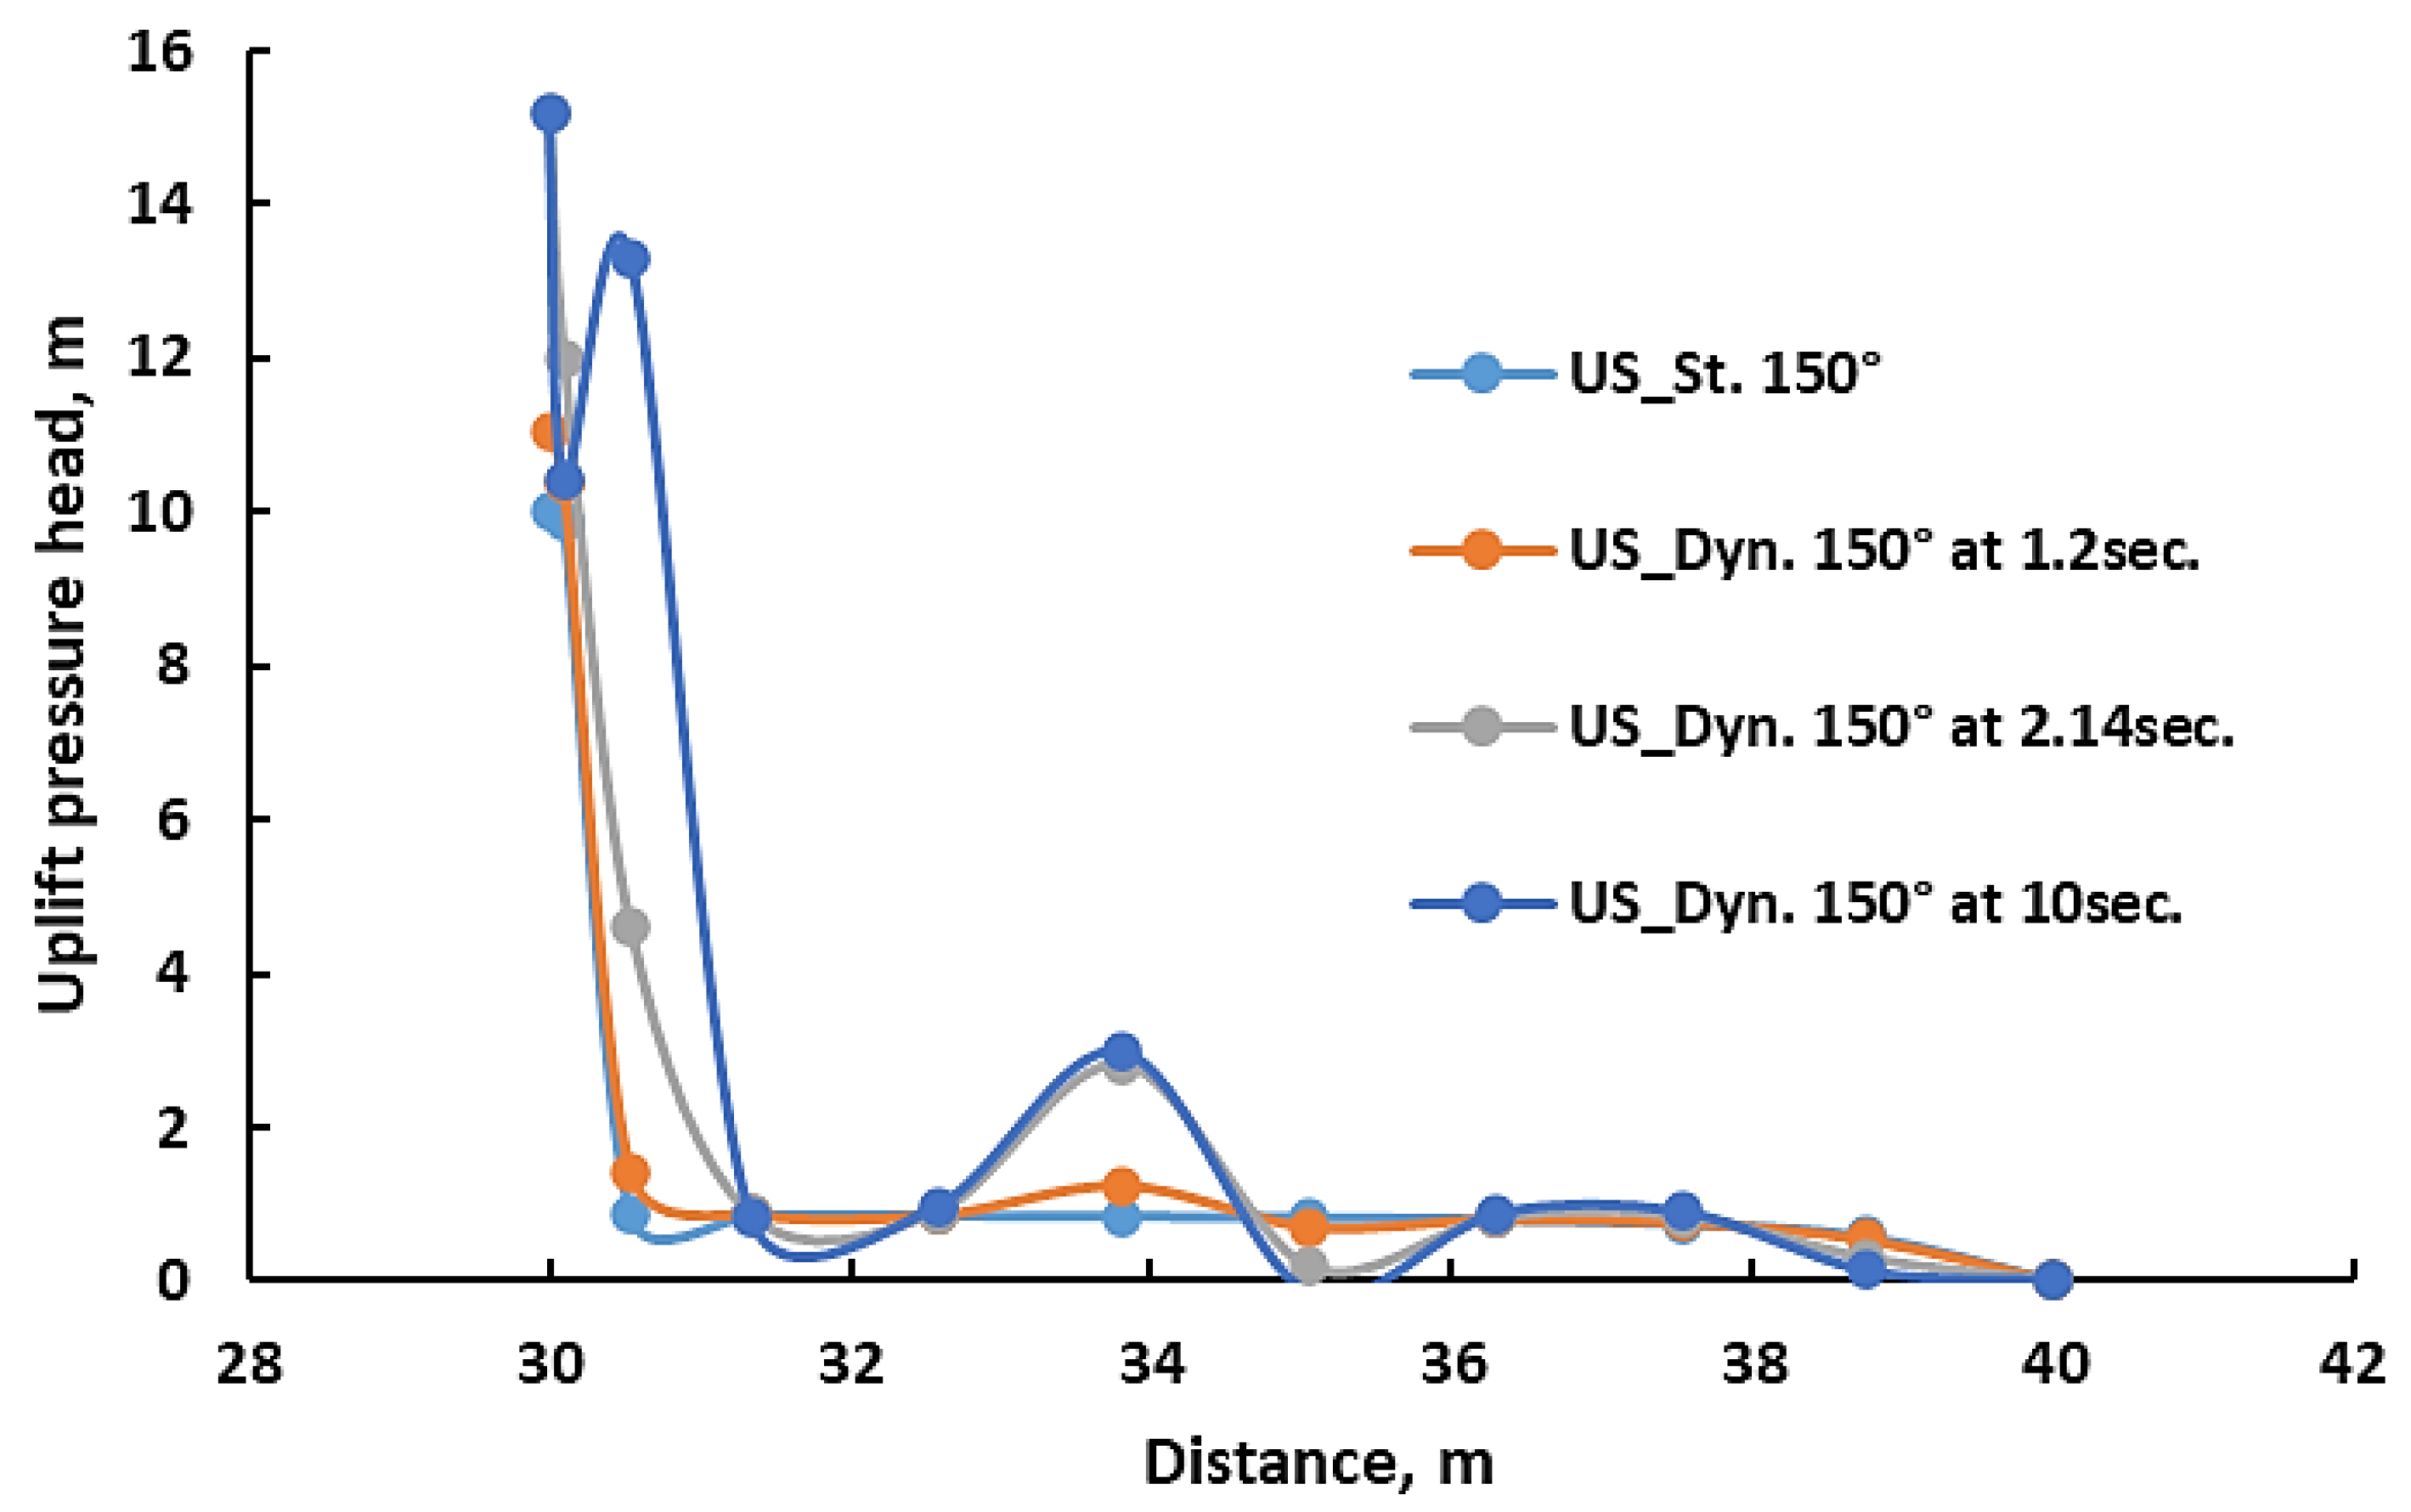
Earthquakes can have a significant impact on the uplift pressure underneath hydraulic structures. The total uplift pressure for different placements and inclination angles of the cutoff wall during static and dynamic conditions is therefore depicted in Figure 8 to identify the impact of an earthquake on the uplift pressure during different scenarios (i.e., inclination angle and position of the cutoff wall). It is worth mentioning that different scenarios during the static condition were numerically analyzed as a steady state, while dynamic scenarios were transient analyses, meaning that the uplift pressure distribution was varying during the shaking period as indicated in Figure 9, therefore the uplift pressure values were determined at the end of the shaking (i.e., at 10 s). It can be clearly seen that the earthquake had a noticeable effect, particularly on heel and toe placements during the shaking period. This can be attributed to the excess pore water pressure induced by shaking in Figure 10. It is worth noting that excess pore water pressure behavior cannot be specifically identified during the shaking period, in which it may increase or decrease rapidly based on the earthquake acceleration versus time (see Figure 1), and time is not enough to dissipate. The increase in the total uplift pressure triggered by an earthquake can decrease the safety against sliding and may cause damage to the hydraulic structures, leading to their failure; thus, it must be carefully considered during design.

Figure 8.
Total uplift pressure head for different positions and inclination angles of the cutoff wall during the static condition and at 10 s for the dynamic condition.
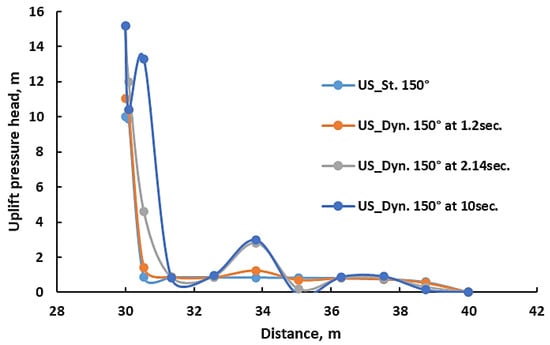
Figure 9.
Uplift pressure distribution for US position and 150° inclination angle during static and dynamic conditions at different times.
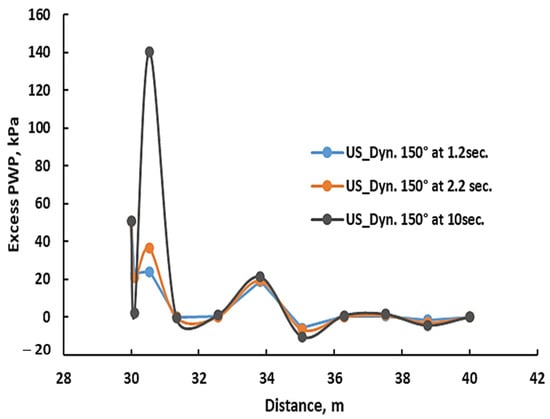
Figure 10.
Excess pore water pressure distribution for US position and 150° inclination angle during dynamic conditions.
3.2. Exit Hydraulic Gradient
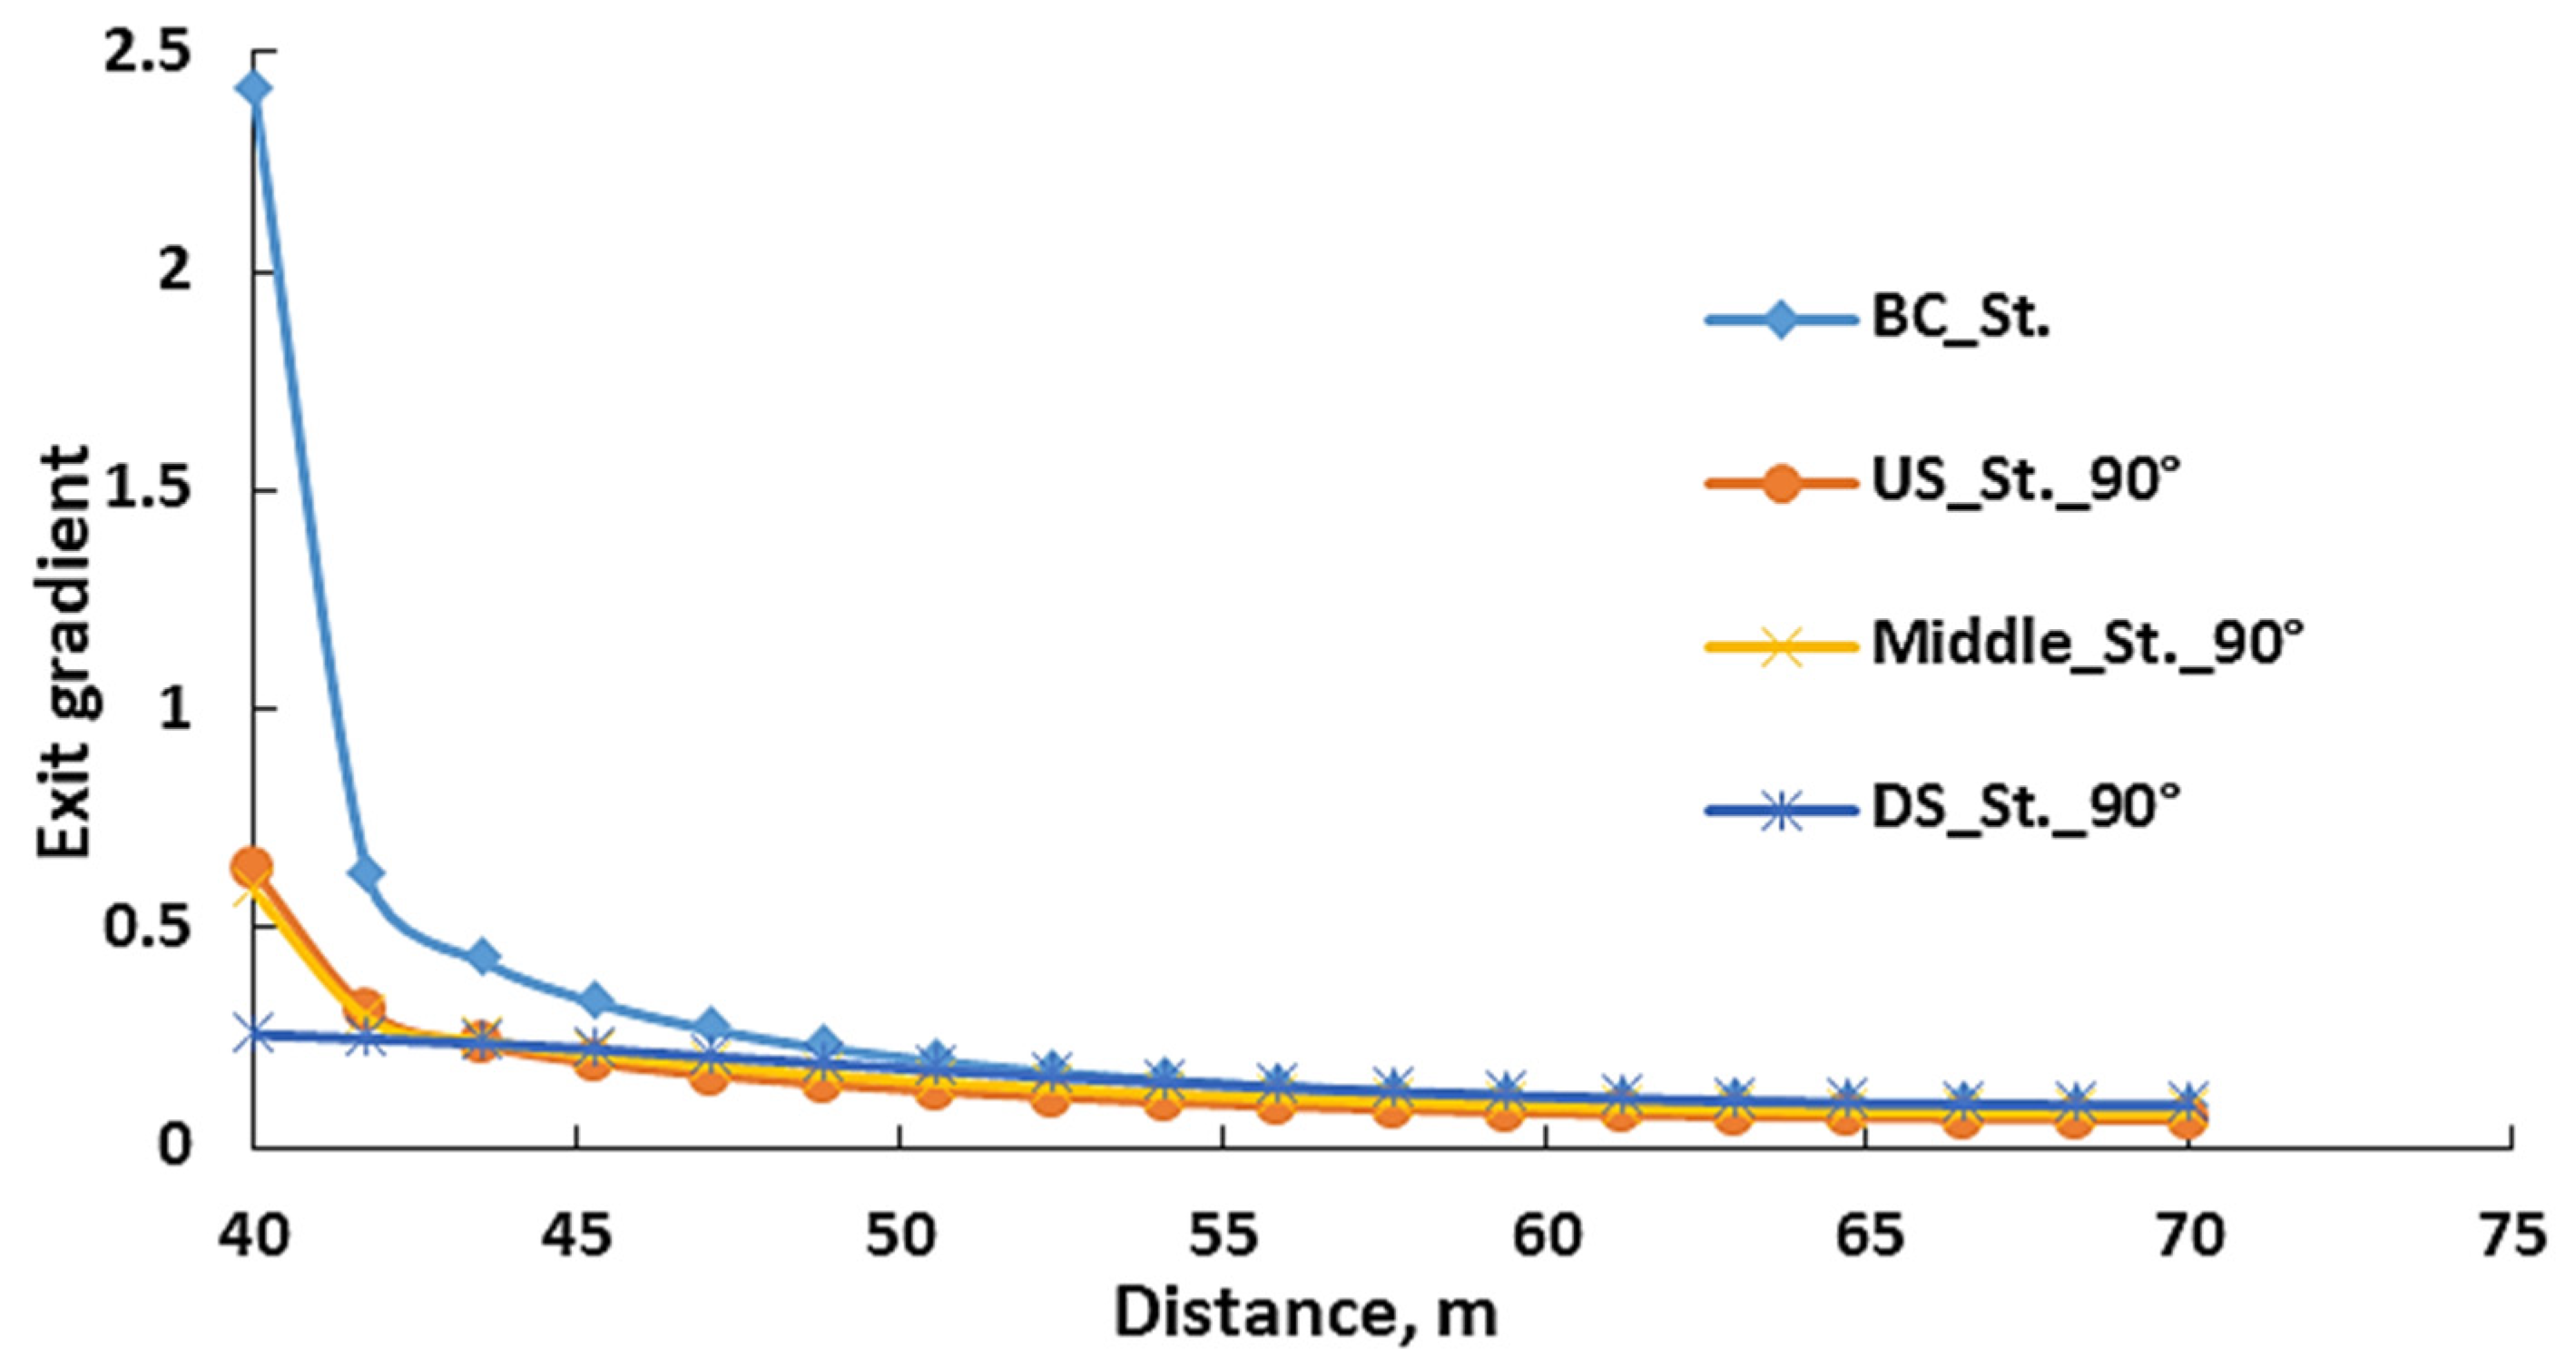
The exit hydraulic gradient refers to the gradient of water at the exit beneath a hydraulic structure. This gradient is considered an important factor in designing safe and stable hydraulic structures, where the exit hydraulic gradient directly affects the flow velocity and pressure at the exit. If the exit hydraulic gradient is too high, it can cause soil erosion and instability in the structure, leading to potential failure and compromising the functionality and longevity of the hydraulic structure. Therefore, it is crucial to ensure that the exit hydraulic gradient remains below the critical hydraulic gradient to maintain the safety and stability of the hydraulic structure. Figure 11 indicates the distribution of the exit hydraulic gradient versus the distance measured from the toe of the hydraulic structure to the end of the model domain for the base case and cutoff wall installed at three different placements with an angle of 90° during the static condition. As expected, the maximum value of the exit hydraulic gradient occurred at the hydraulic structure’s toe, regardless of the position of the cutoff wall. The hydraulic gradient at the toe of the structure was steep due to the rapid decrease in pressure head as the water exited the structure, while the hydraulic gradient gradually decreased as the water moved away from the toe of the structure. The presence of a cutoff wall had a considerable impact on the exit hydraulic gradient, particularly at the toe. Whereas the exit hydraulic gradient decreased from 2.4 at the base case (i.e., without using a cutoff wall) to 0.63, 0.58, and 0.25 in the case of using a cutoff wall at US heel, middle, and DS toe placements, respectively, at an angle of 90°. In other words, using the cutoff wall at US, middle, and DS positions resulted in decreasing the exit gradient by ratios of 0.73, 0.76, and 0.89, respectively. Using a cutoff wall at the toe is more effective in reducing the exit gradient compared to using a cutoff wall at the heel and in the middle. This is because the exit gradient is primarily influenced by the dissipation of energy represented in the total energy head along the flow path. The cutoff wall installed at the toe of the hydraulic structure can intercept the water flow and prevent it from flowing beneath the structure, which can significantly enhance total energy dissipation before exit and then decrease the exit gradient. In contrast, a cutoff wall installed at the heel can only intercept the water flow from the reservoir side, and the water that has already passed may still contribute to the seepage forces and the exit gradient.
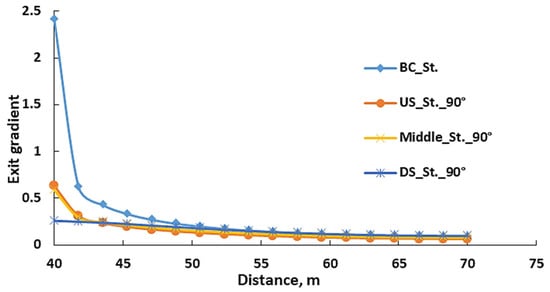
Figure 11.
Exit hydraulic gradient distribution for the base case and with a cutoff wall at an inclination angle of 90° during the static condition.
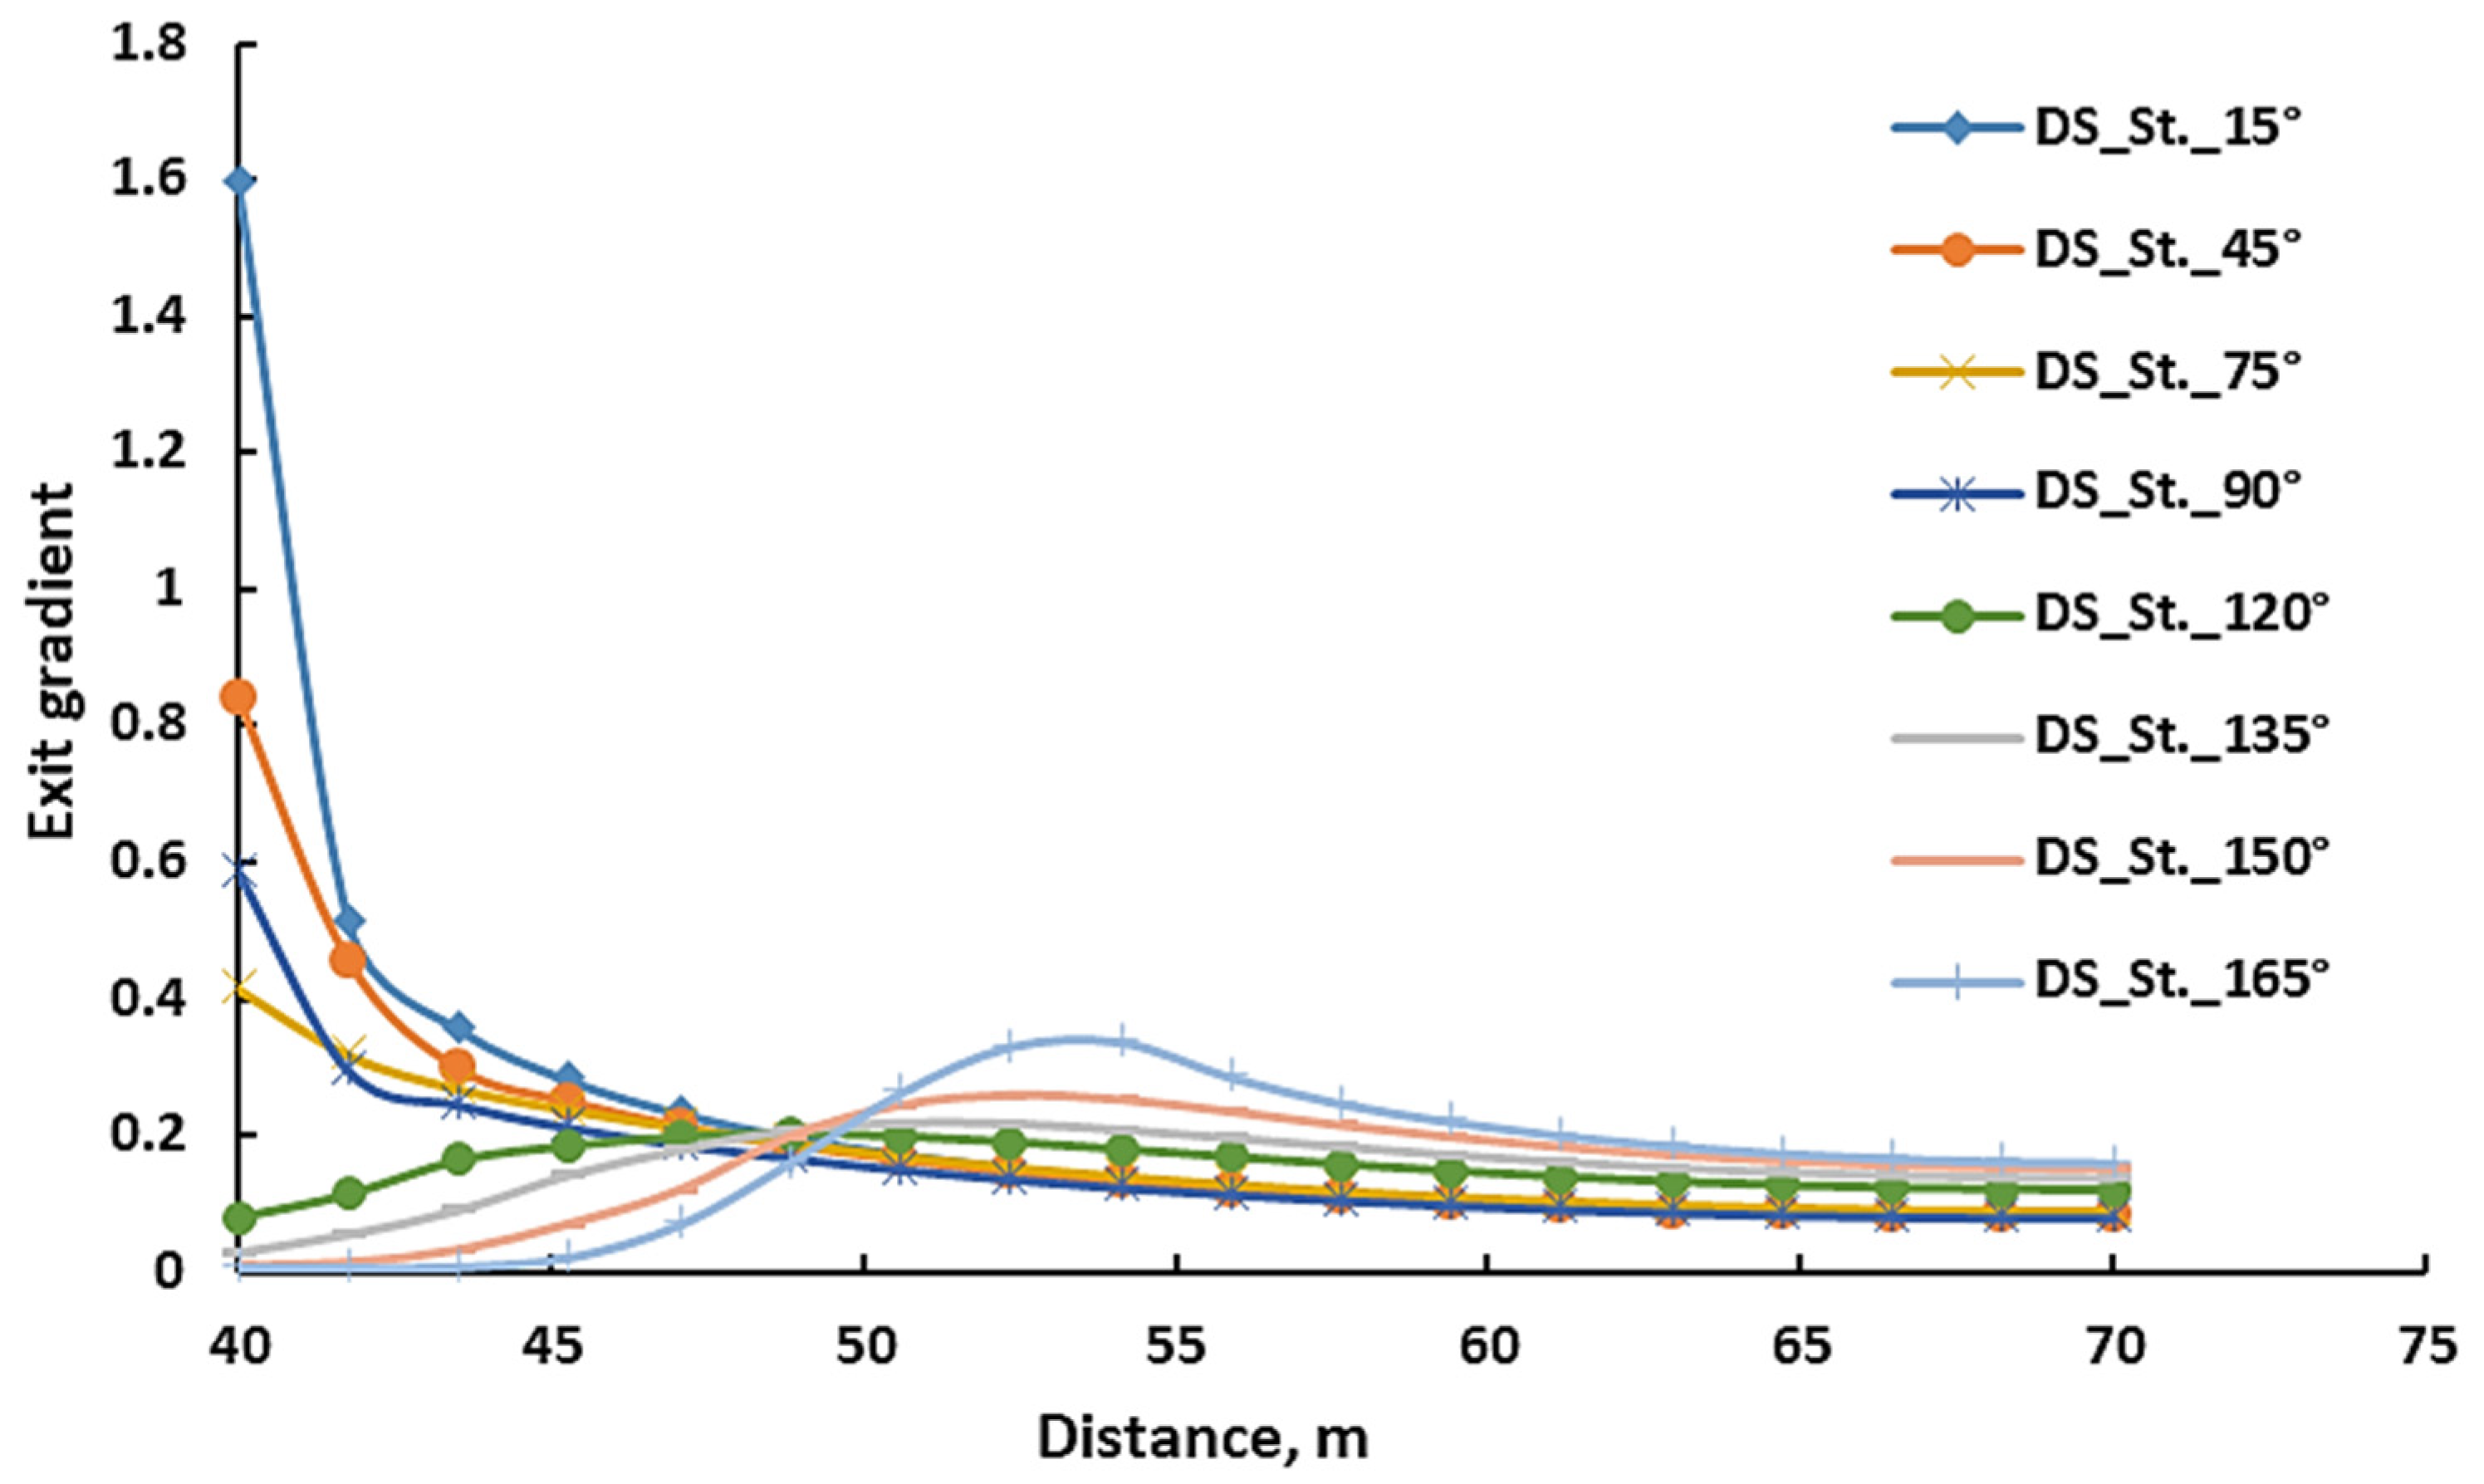
The inclination angle of a cutoff wall also had a significant impact on the exit hydraulic gradient, as indicated in Figure 12. It can be clearly seen that as the inclination angle increased, the exit gradient at the toe decreased significantly. However, in the case of angles 135°, 150°, and 165°, the exit gradient increased and then decreased after reaching peak points. This outcome can be explained by the protrusion of the cutoff wall beyond the toe, causing the seepage water flow to deviate from the toe and exit at other points, resulting in an increase in exit hydraulic gradients at those points (i.e., peak points). Therefore, it is crucial to carefully consider the angle of the cutoff wall when designing and constructing water structures to ensure the safety and stability of the structure, in which case the advantages of both the inclination angle and position of the cutoff wall can be taken advantage of. To avoid increasing the gradient again, the wall can be formed so that there is no protrusion beyond the toe, achieving maximum benefit in reducing the gradient of the exit and ensuring that it is not increased after that in any other place.
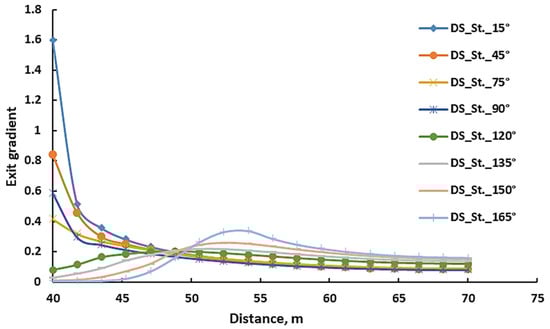
Figure 12.
Exit hydraulic gradient distribution for different inclination angles of the cutoff wall at the middle position during the static condition.
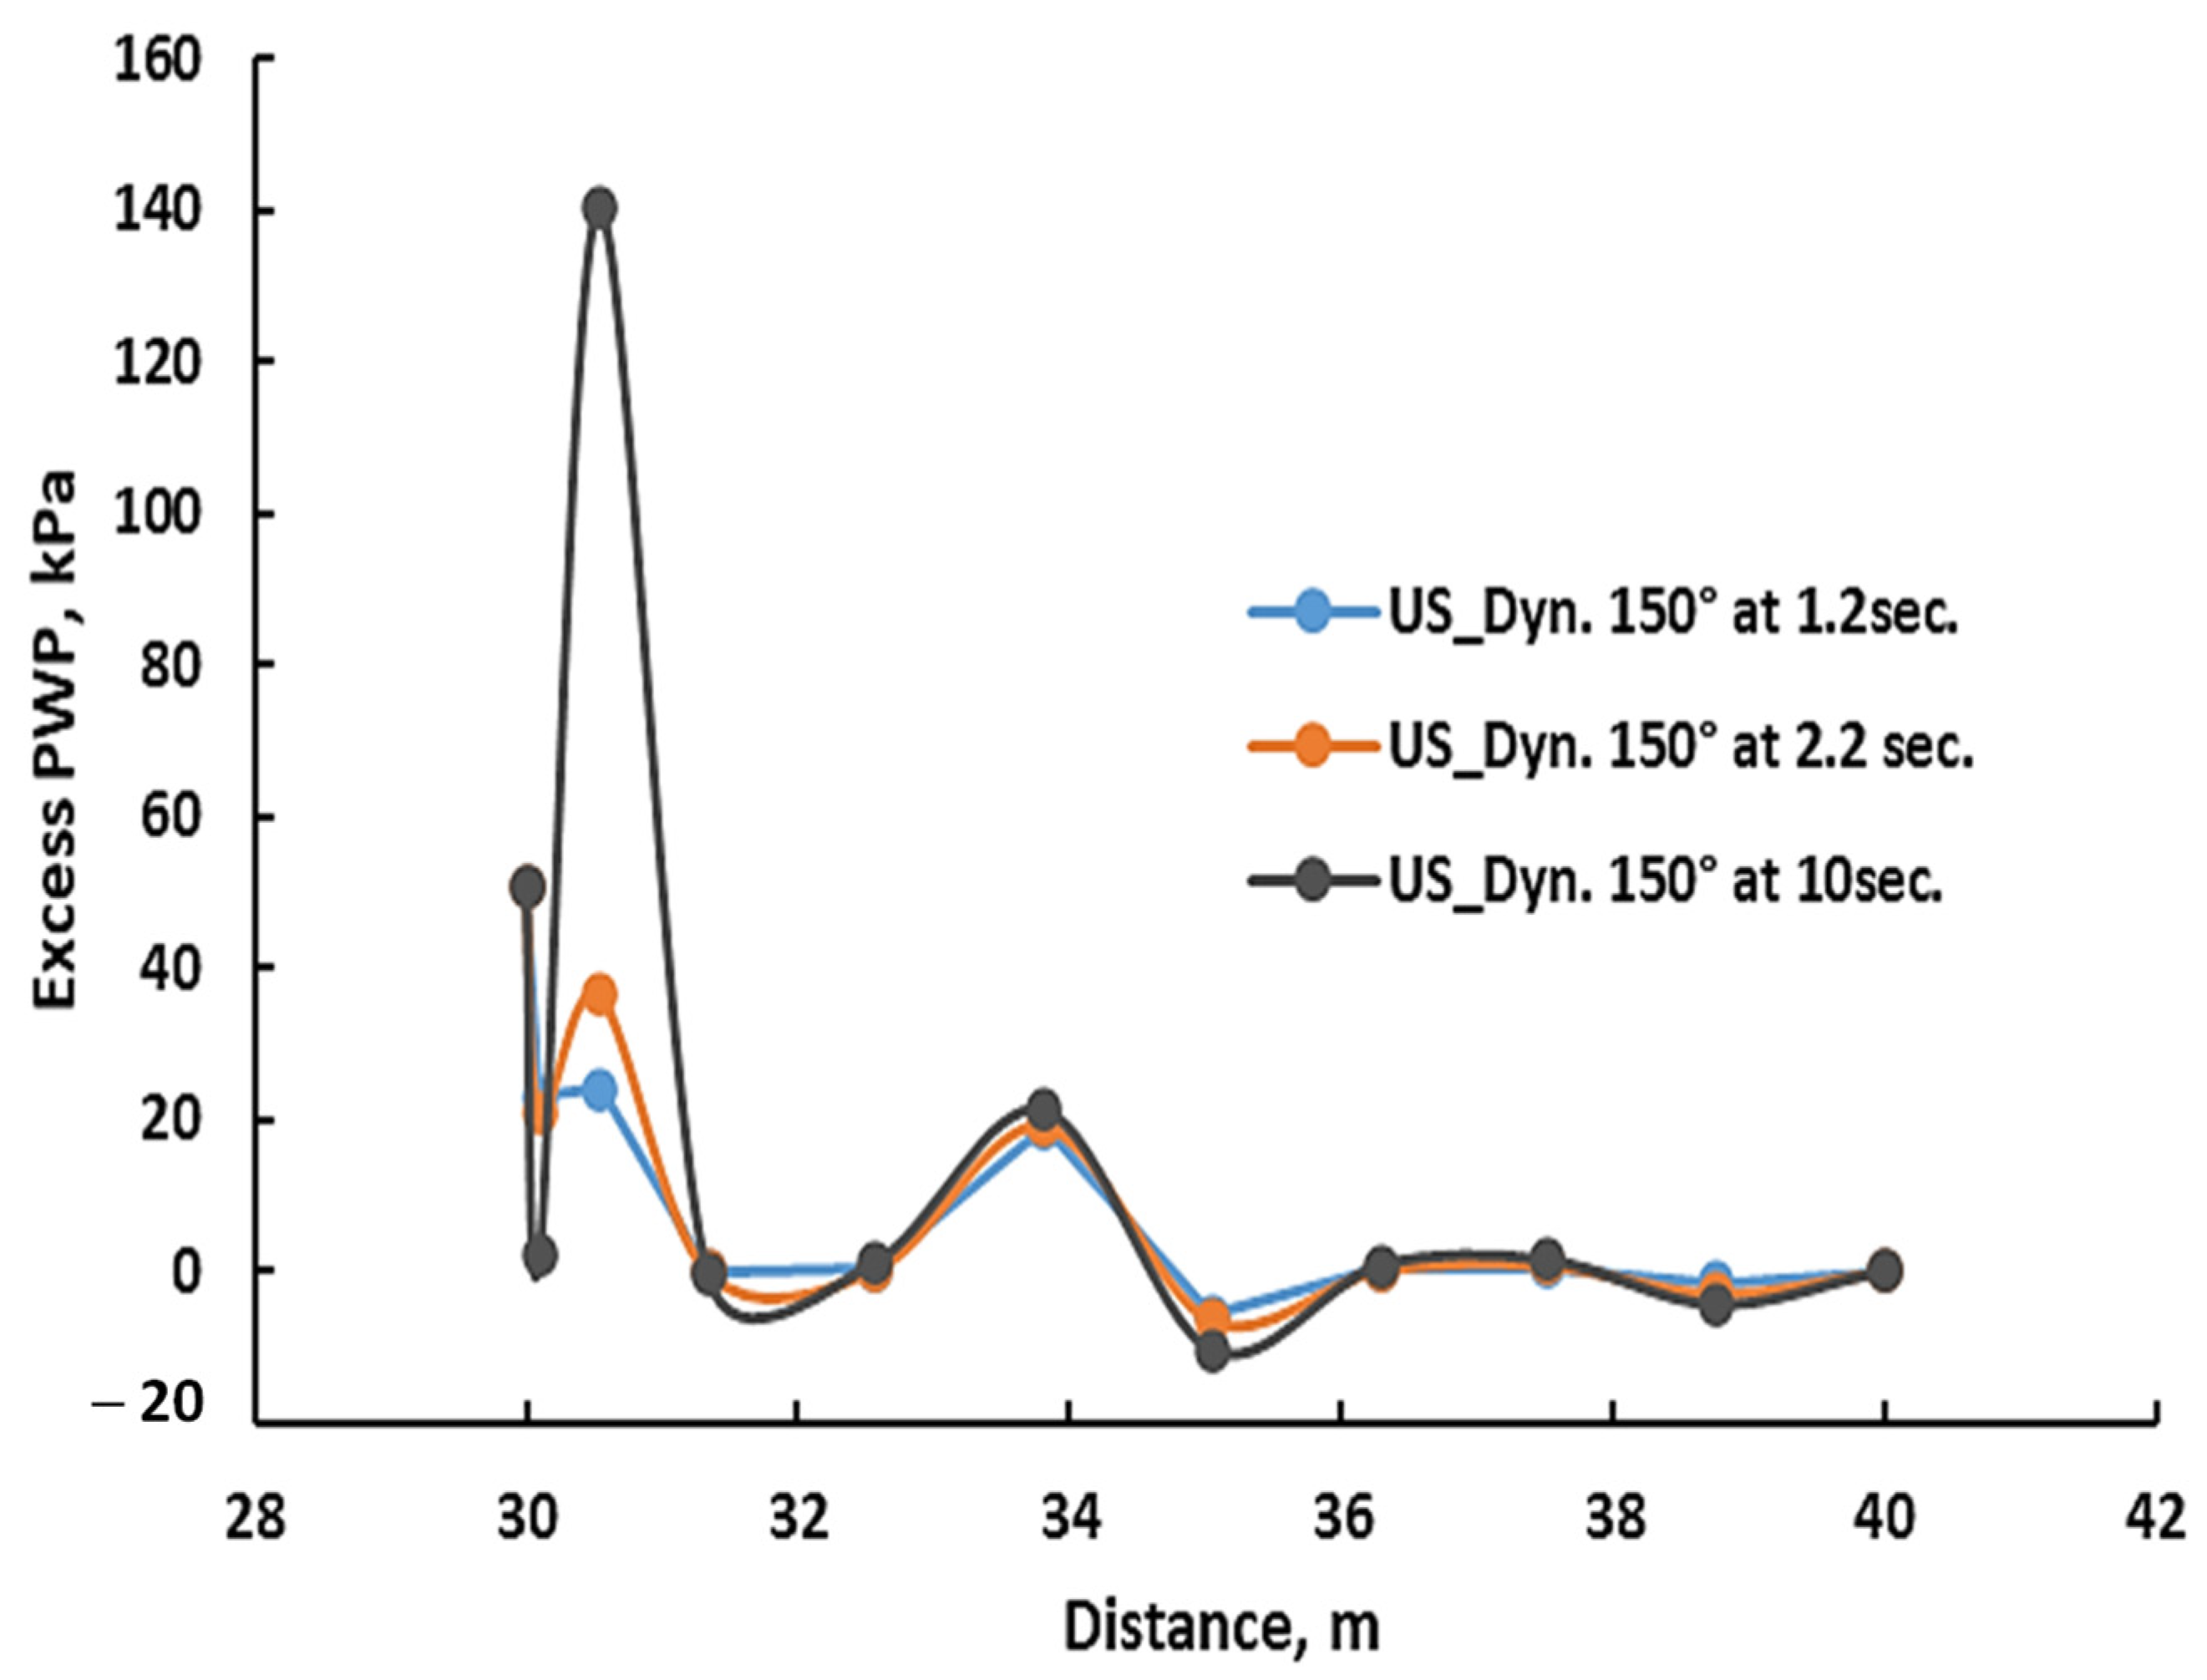
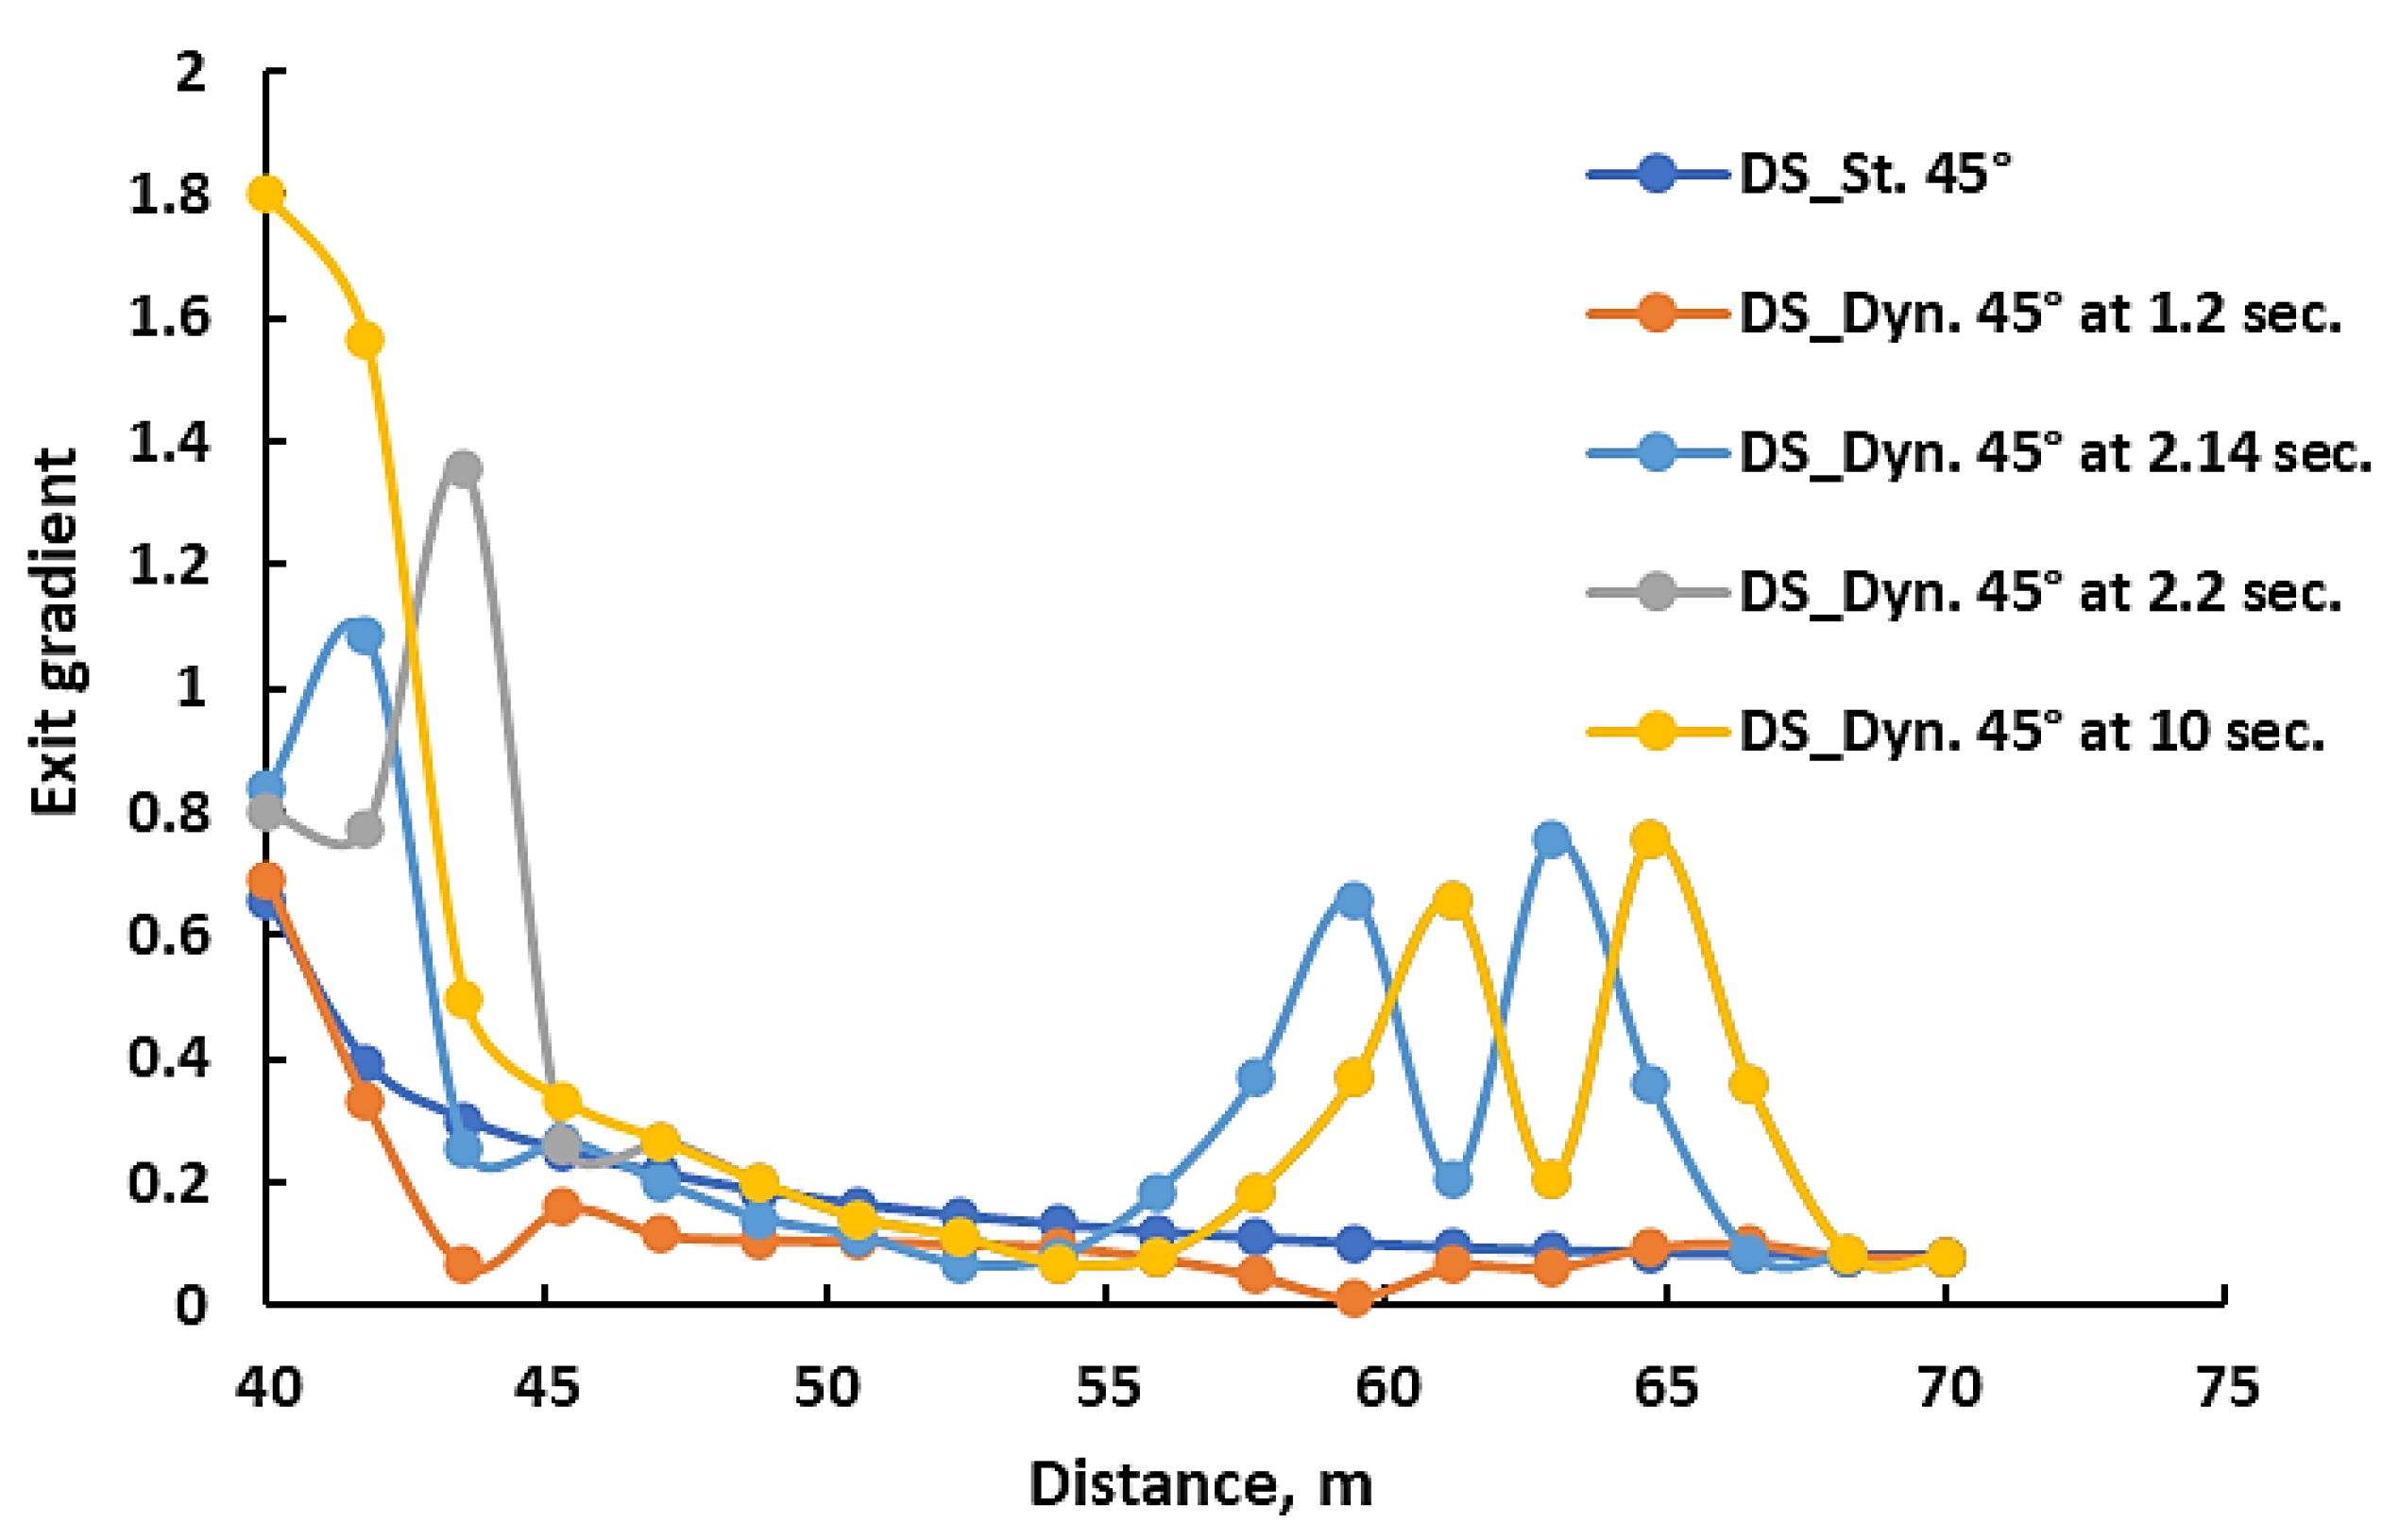
The earthquake had a significant impact on the exit hydraulic gradient. During an earthquake, the ground motion can cause the soil to rapidly compress and dilate, resulting in rapid changes in the pore pressure within the soil. The excess pore water pressure triggered by an earthquake affects the total energy head, which then changes the exit gradient as indicated in Figure 13. When the excess pore water pressure is high, it can lead to a steeper exit gradient and higher water velocities, and the hydraulic structure could be damaged. The excess pore water pressure induced by shaking changes spatially and temporally, and the total water head is consequently changed spatially and temporally. Therefore, the gradient of exiting water is not only dependent on the location but also changes over the shaking period.
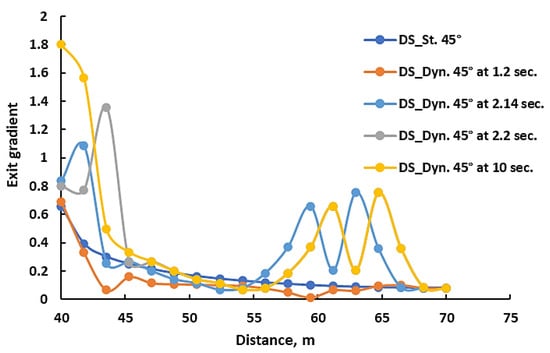
Figure 13.
Exit hydraulic gradient distribution for the cutoff wall at US position with a 45° inclination angle during the static and dynamic conditions at 1.2, 2.14, 2.2, and 10 s.
During an earthquake, the presence of a cutoff wall in a hydraulic structure had a considerable impact on the exit gradient, and the effect varied depending on the location and inclination angle of the cutoff wall, as indicated in Figure 14 and Figure 15, respectively. After 10 s of shaking time, for a cutoff wall installed at different locations with a 90° inclination angle, the DS toe position of the cutoff wall showed a lower exit gradient distribution, followed by the middle and US heel positions. This trend matched closely with what happened during the static condition mentioned earlier. However, as we moved away from the toe of the hydraulic structure, there was no consistent pattern of the exit hydraulic gradient. The inclination angles also had a significant impact, where the exit hydraulic gradient at the toe of the hydraulic structure increased as the inclination angle decreased, while no clear trend can also be discerned as farther away from the toe. This can be attributed to the spatial and temporal changes in the excess pore water pressure induced by the earthquake over the shaking time. When the shift in the exit hydraulic gradient occurs at a safe distance from the toe, it poses minimal risk to the hydraulic structure. While the hydraulic gradient reaches a critical level at the toe of the dam and the surrounding region, it poses a direct and significant threat to the stability and safety of the hydraulic structure. Therefore, it is essential to consider earthquake forces when designing hydraulic structures and to ensure that they can withstand the potential shifts in the exit gradient that may occur.
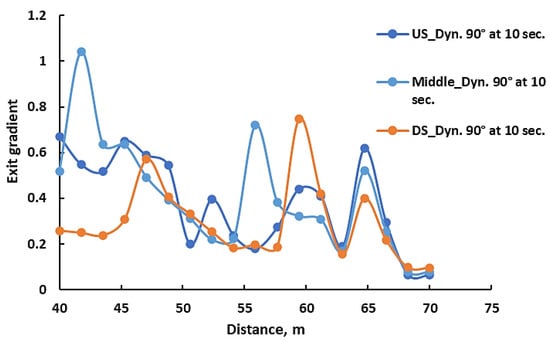
Figure 14.
Exit hydraulic gradient distribution for a cutoff wall with a 90° inclination angle at different positions during the dynamic state at 10 s.
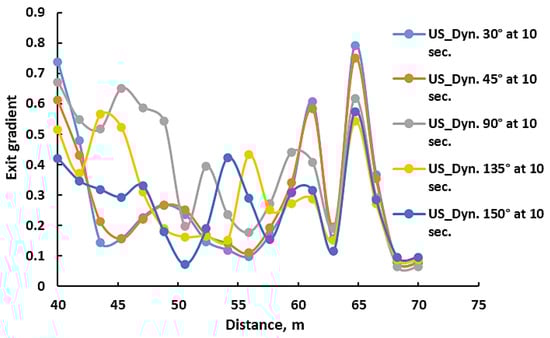
Figure 15.
Exit hydraulic gradient distribution for a cutoff wall at US position with different inclination angles during the dynamic state at 10 s.
3.3. Seepage Discharge
Seepage discharge is also a key factor to be considered during the design of hydraulic structures, as it can have a significant impact on the stability of the structure. Uncontrolled seepage can cause erosion and undermine structures, leading to potential failure. Seepage can also increase the uplift pressure, which can further reduce the stability of the structure. In addition to the previously mentioned impacts, seepage can also have environmental consequences, particularly when it comes to mine waste levees. In such cases, seepage can potentially contaminate downstream water sources, posing a significant threat to both the environment and public health. The presence of a cutoff wall beneath the hydraulic structure had a noticeable influence on reducing seepage discharge, as indicated in Figure 16. During the static condition, as the inclination angle was raised, the seepage discharge diminished until reaching an angle of 90°. Beyond that point, as the inclination angle continued to increase, the seepage discharge also increased, irrespective of the cutoff position, as illustrated in Figure 17. This implies that an inclination angle of 90° was the most effective angle for decreasing seepage discharge. The ratios of seepage discharge compared to the base case were 58.5%, 61.0%, and 58.5% for the upstream heel, middle, and downstream toe locations, respectively. Furthermore, it was found that with an inclination angle of 90°, the placement of the cutoff wall at both the upstream heel and downstream toe positions had an equivalent impact on the seepage discharge; this observation matches closely with Mansuri et al. [1]. It is worth mentioning that during static conditions, different scenarios were numerically analyzed as steady states, meaning that the inflow (i.e., from the upstream) and outflow (i.e., to the downstream) seepage discharges are equal and constant (i.e., time-independent).
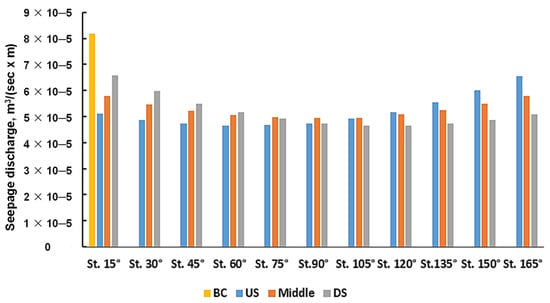
Figure 16.
Seepage discharge without a cutoff wall (BC) and with a cutoff wall at different locations and inclination angles during static conditions.
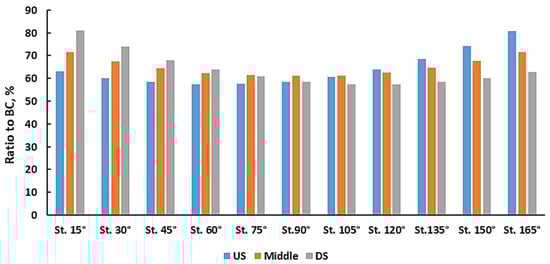
Figure 17.
Seepage discharge changing ratios with cutoff walls at different locations and inclination angles during static conditions compared to BC.
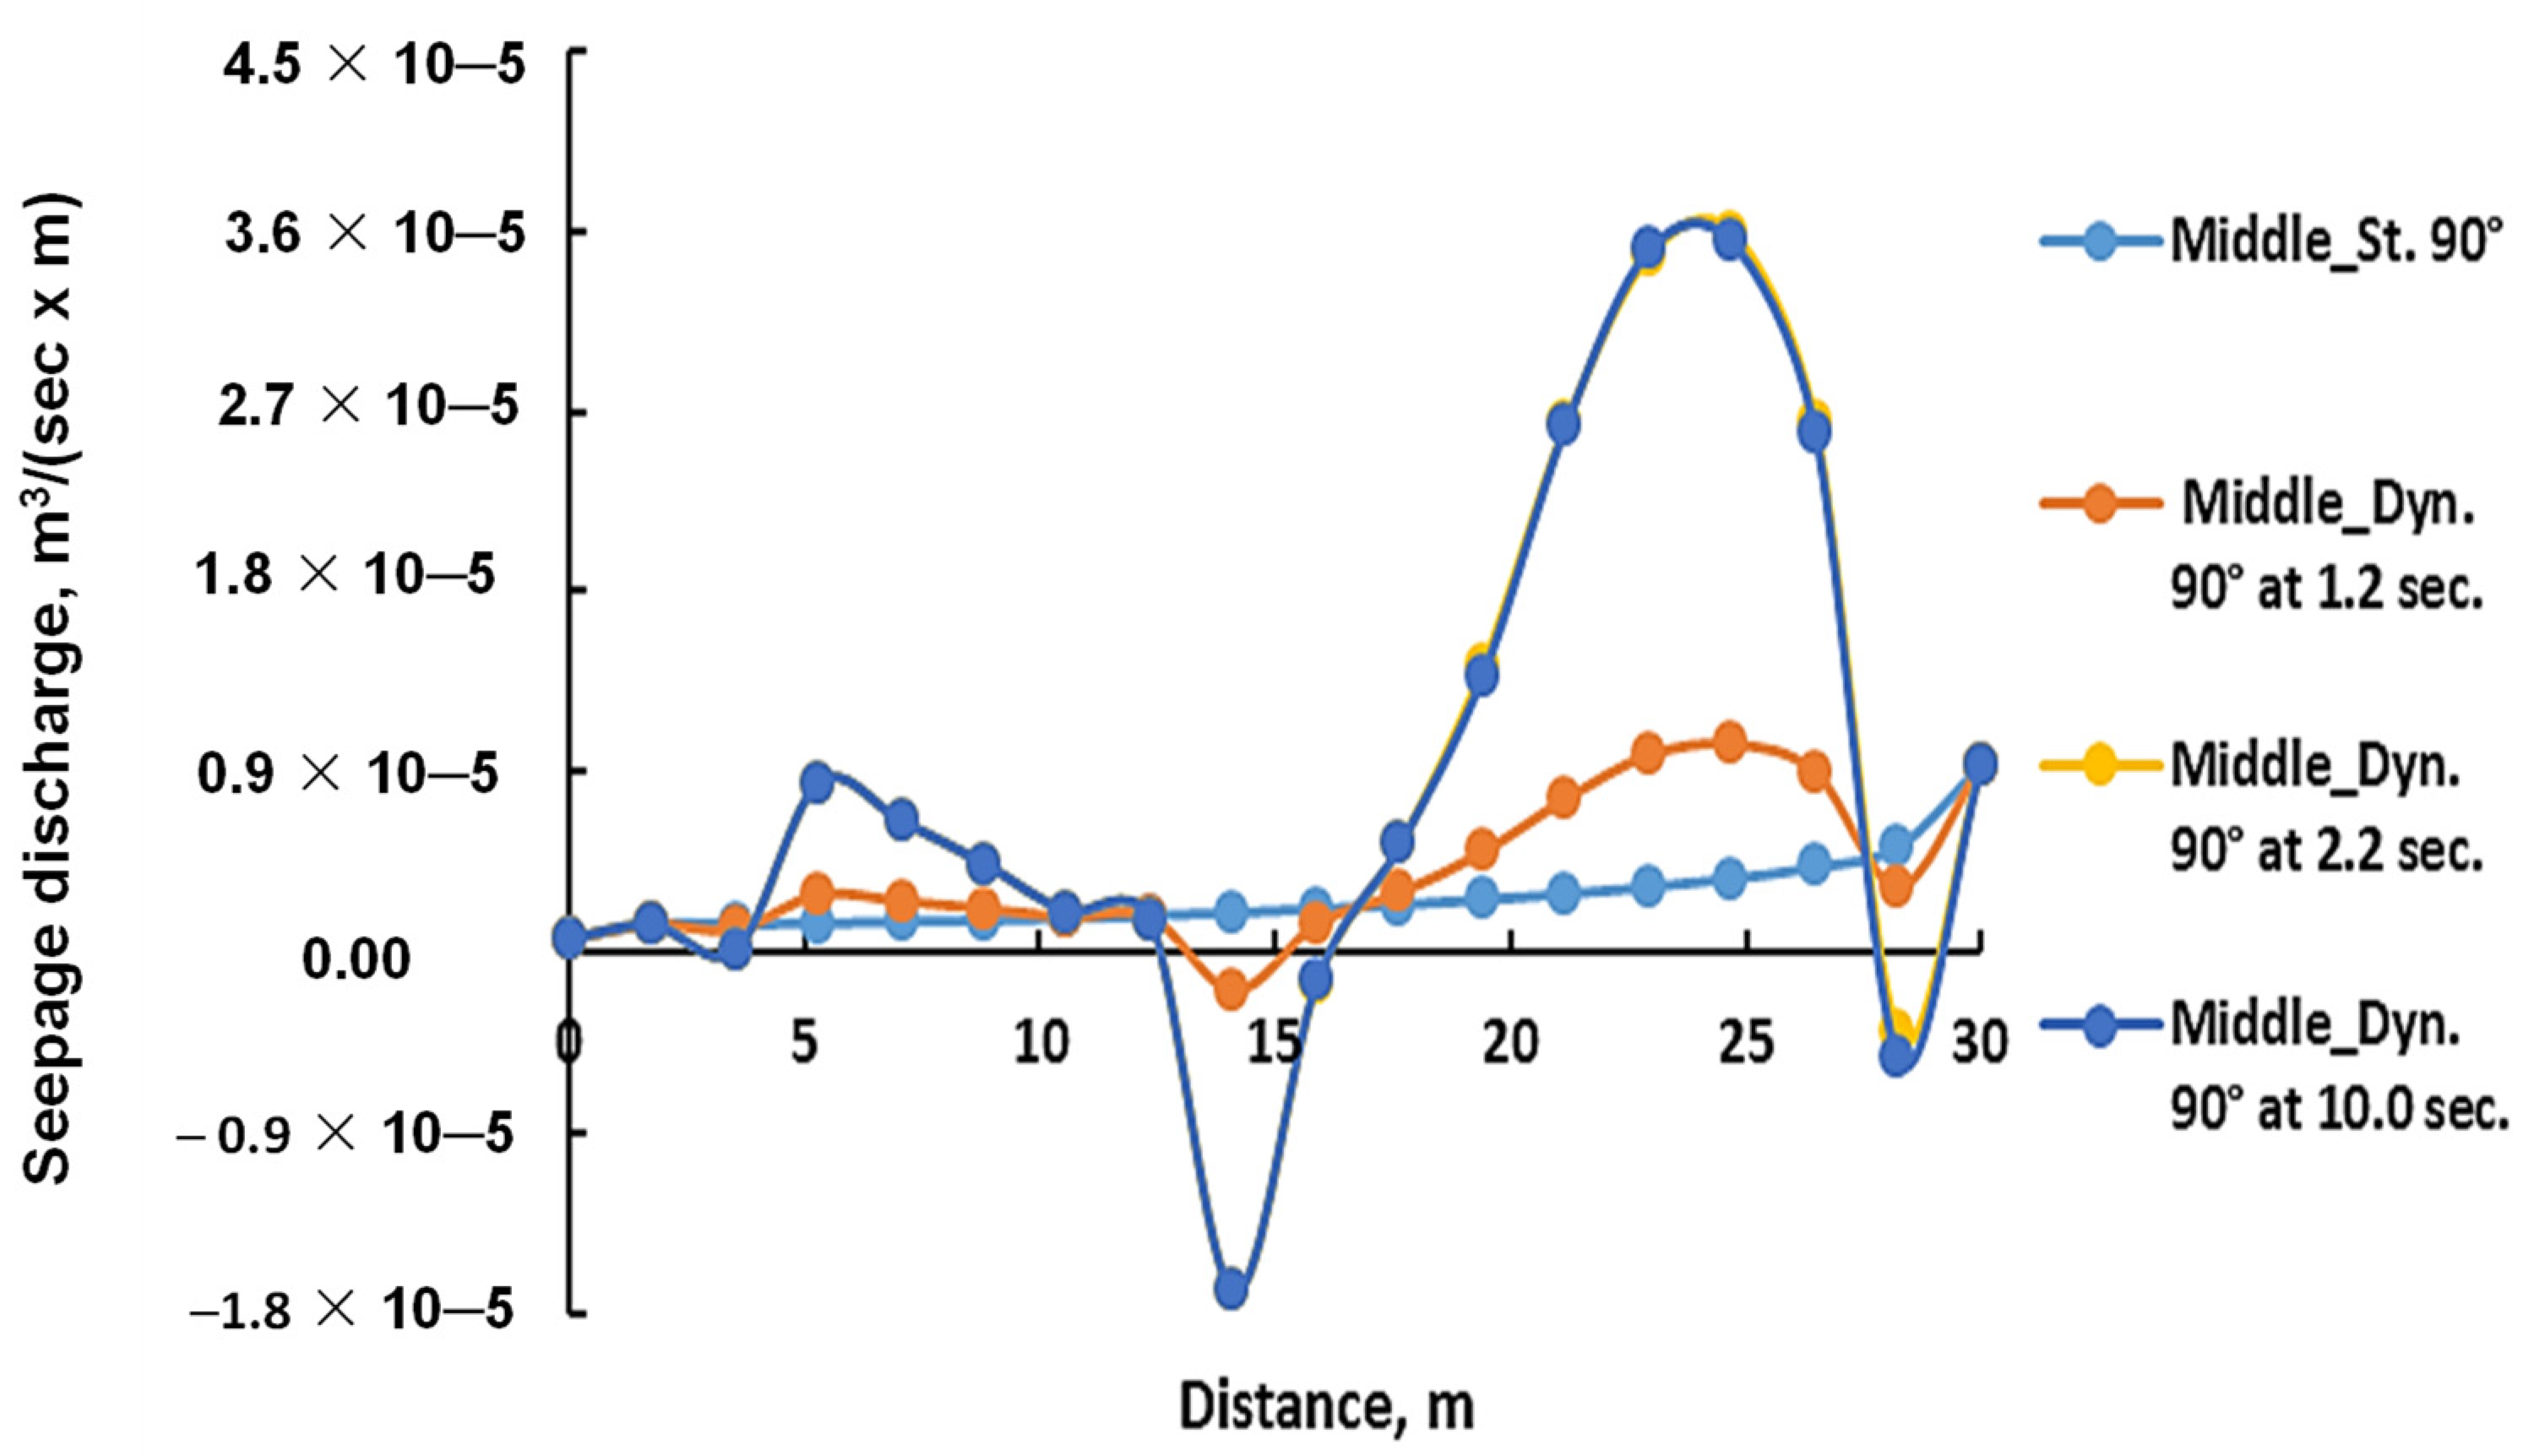
During earthquakes, the ground shaking induces an excess pore water pressure; consequently, the water total head is greatly affected. Since water flows under the effect of changes in water total heads, seepage discharge is also affected by earthquakes. It is worth noting that dynamic scenarios were transient analyses, meaning that the seepage discharge was varying during the shaking period, as indicated in Figure 18, and therefore the seepage discharge values were determined at the end of the shaking period (i.e., at 10 s). Figure 19 indicates seepage discharge for different positions and inclination angles during the static condition and at 10 s for the dynamic condition. The effect of earthquakes on seepage discharge was evident, as the values of seepage discharges are significantly higher during dynamic conditions compared to static ones. In the case of placing a cutoff wall at the upstream heel, seepage discharge values were found to be high regardless of the inclination angle. The maximum seepage discharge value was observed at an inclination angle of 45°. In conclusion, for both static and dynamic scenarios, the most favorable location for placing the cutoff wall from a seepage discharge perspective is at the downstream toe. Eventually, designers must consider the potential impact of earthquakes on seepage discharge when designing and maintaining hydraulic structures to ensure their stability and safety.
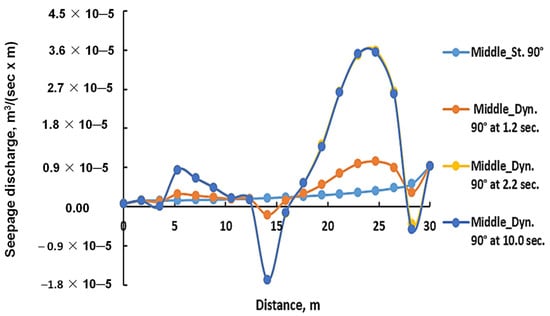
Figure 18.
Inflow seepage discharge distribution for a cutoff wall in the middle position with 90° inclination angles during static and dynamic conditions.
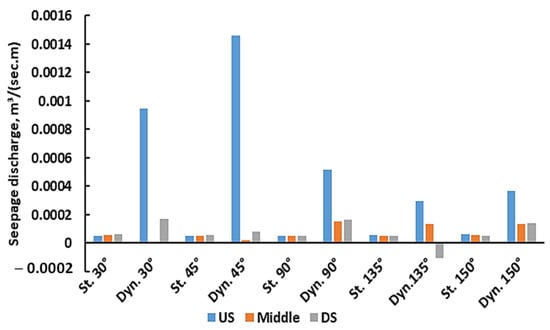
Figure 19.
Seepage discharge for different positions and inclination angles during the static condition and at 10 s for the dynamic condition.
3.4. Neural Network Modeling
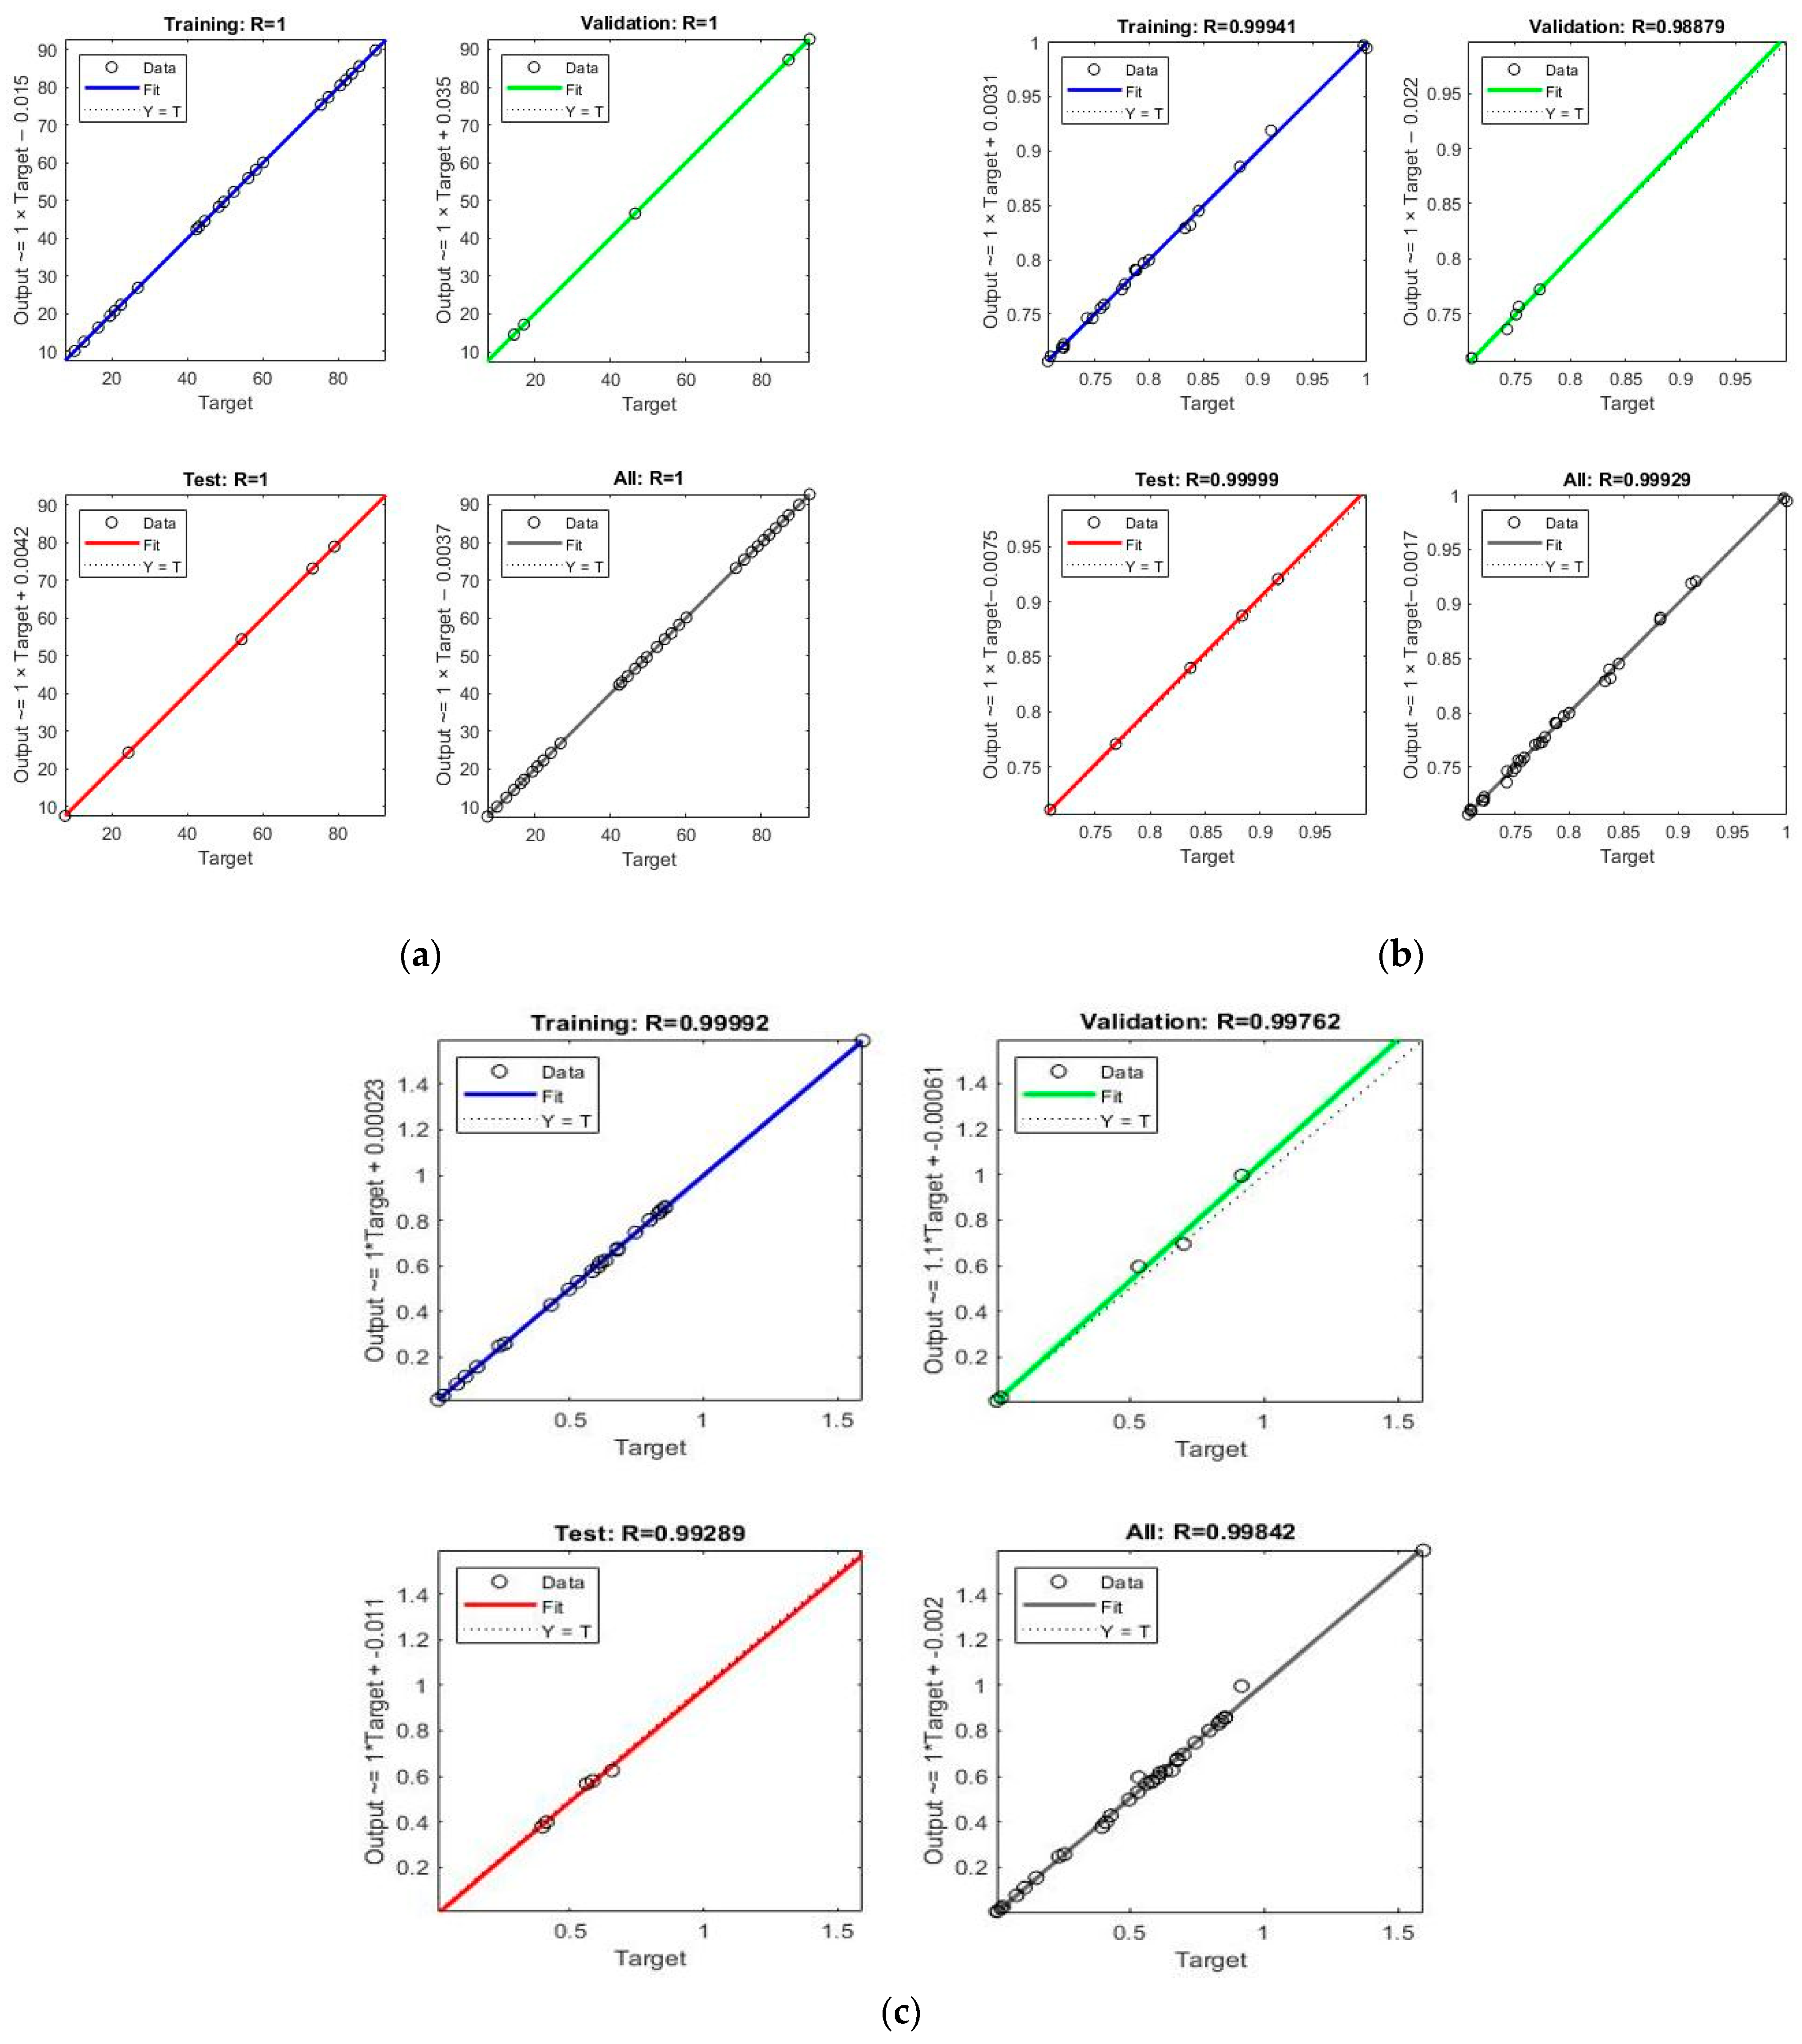
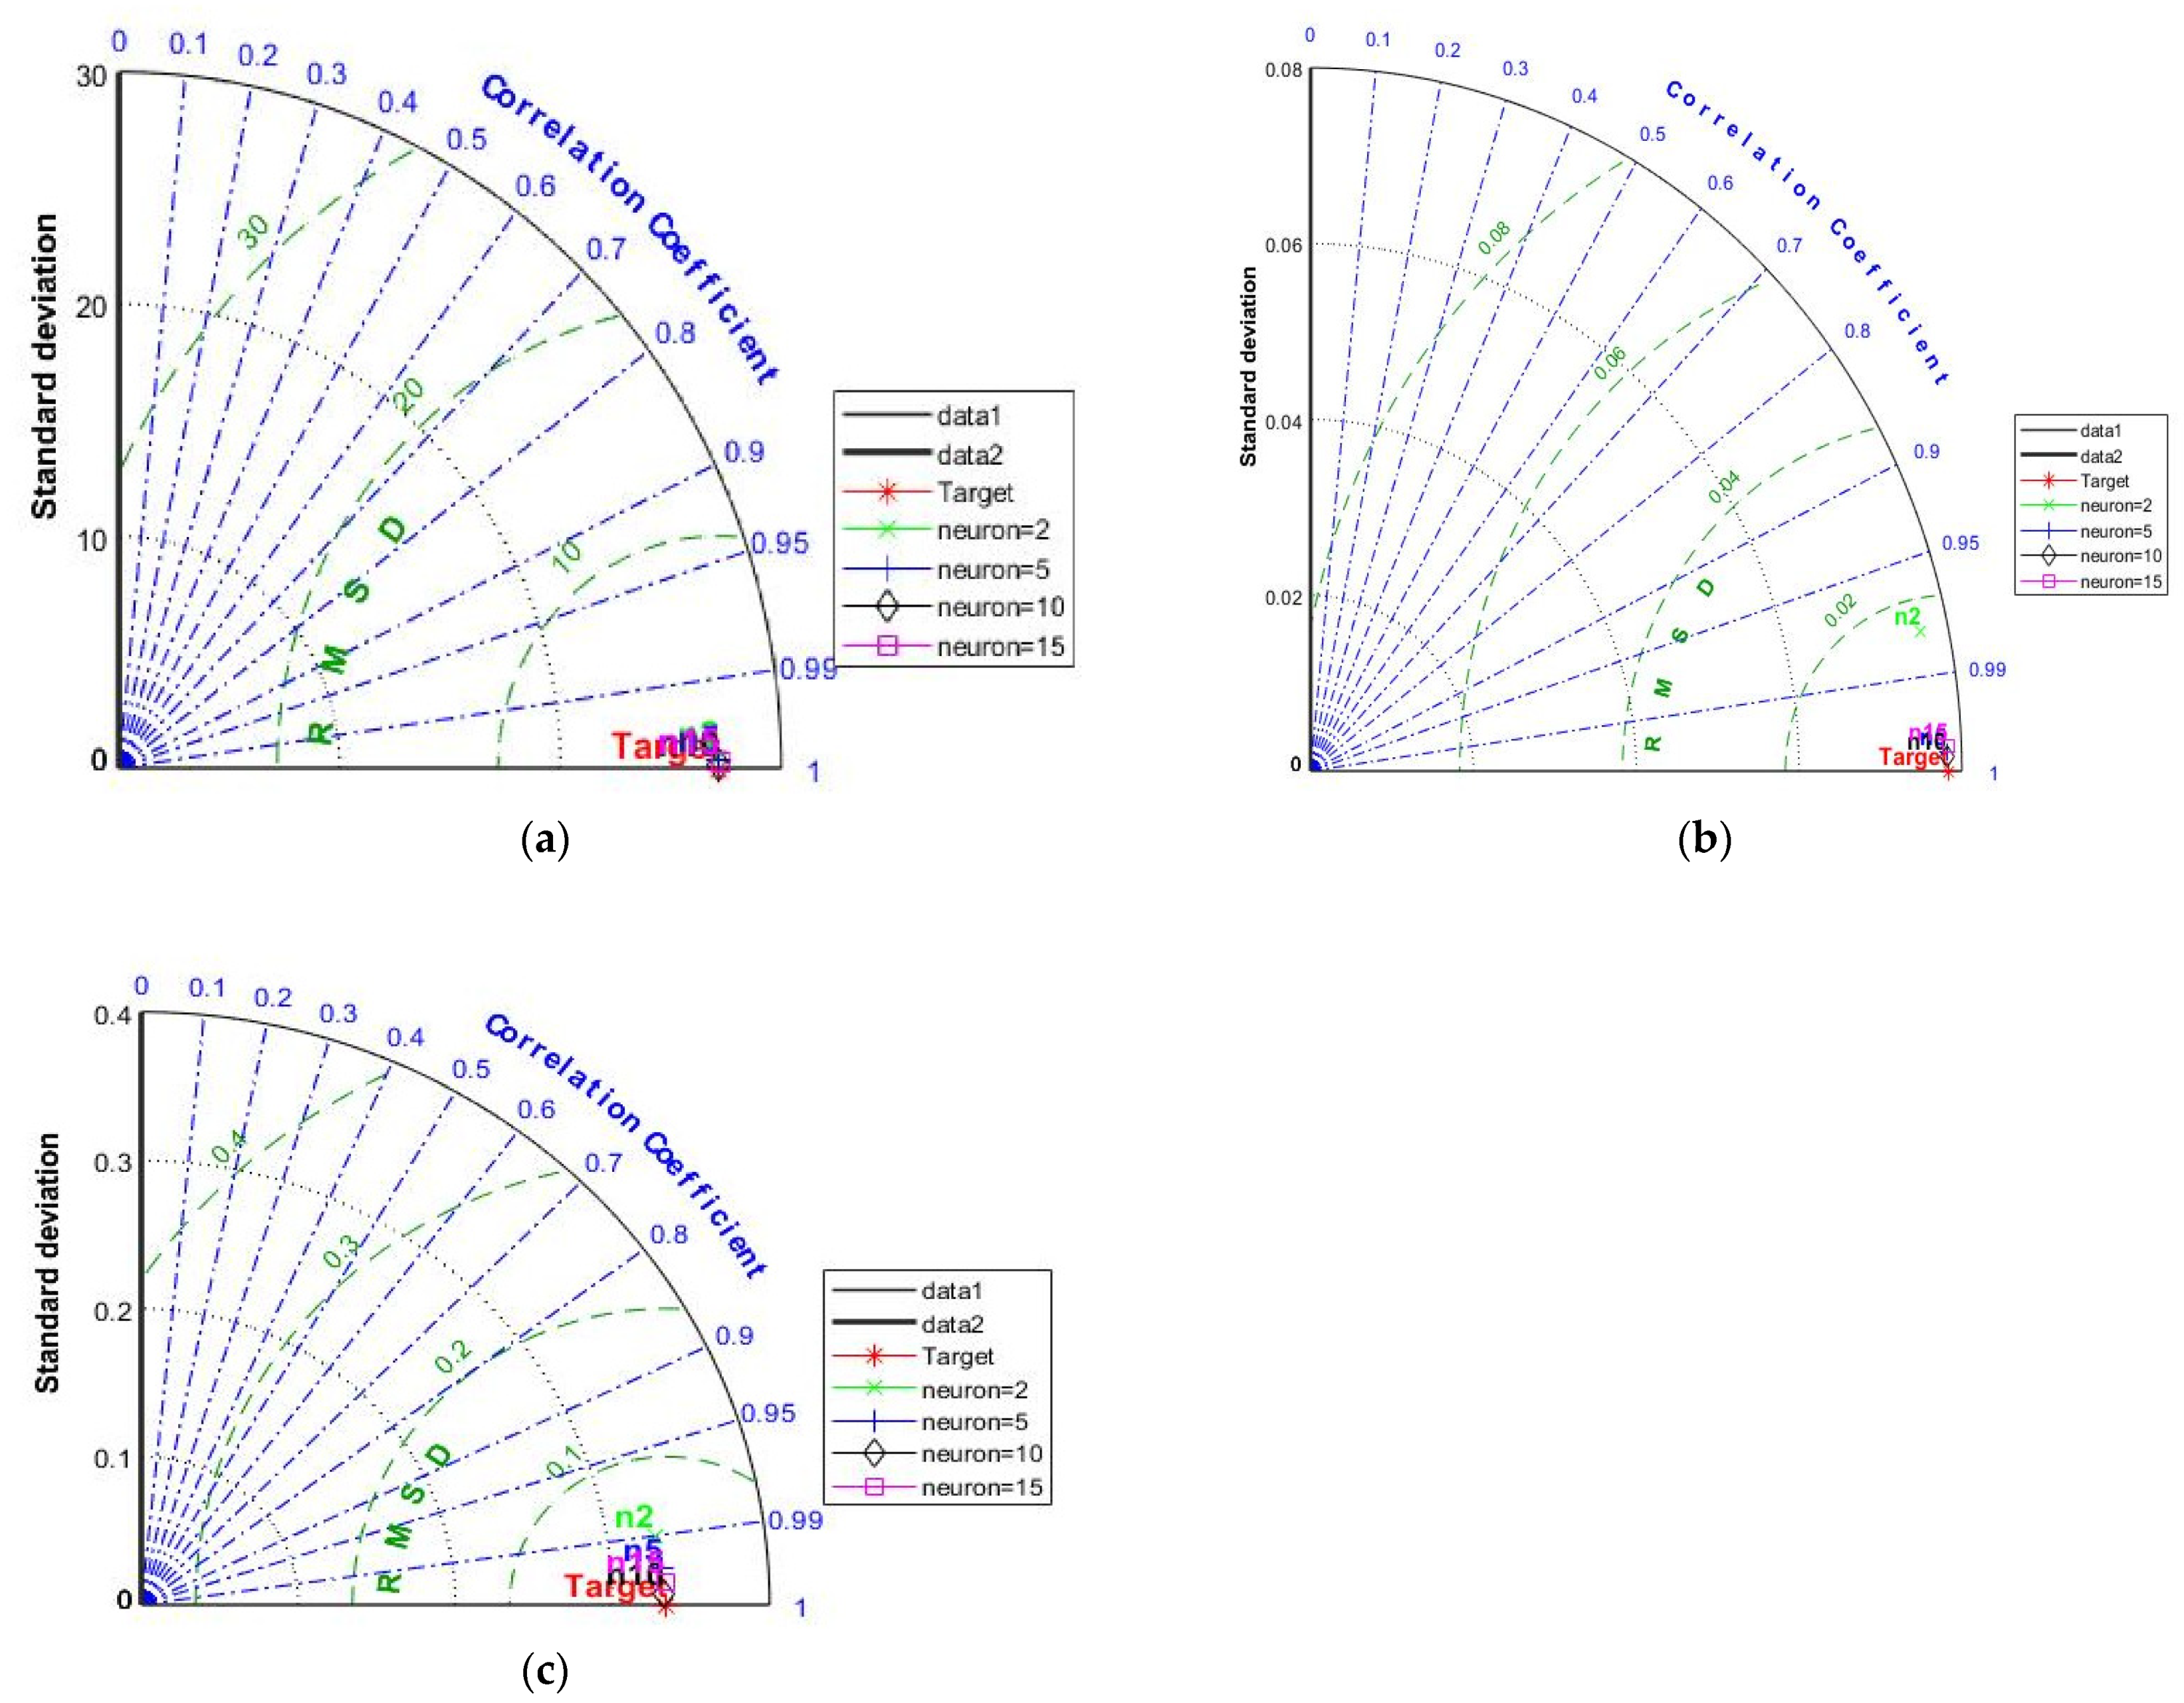
FFNN has been utilized for estimating the uplift pressure, exit hydraulic gradient, and water seepage discharge under static conditions. Given that the model begins by assigning random weights for connections and randomly dividing data patterns, it is best to evaluate model performance over a number of runs. The best, average, and standard deviation values of RMSE are shown after completing the complete training procedure in Figure 4 for 20 different computer runs. The studied models are trained on a PC with 8 GB of memory and a 2.8 GHz core i5 processor. Simulation is carried out using Matlab R2020a’s ANN Toolbox [20]. The simulations show how well the FFNN with 15 neurons in the hidden layer can simulate the process. The activation function of the hidden layer is the hyperbolic tangent sigmoid (tansig) (trainbr), and the training method is Bayesian regularization backpropagation. The model needs to be trained for an average of 25 epochs to avoid overfitting. Figure 20 shows that each pattern’s training, validation, test, and overall regression coefficients are all greater than 0.999. Because they closely match the experimental patterns, the FFNN predictions for the whole data set are emphasized in Figure 21. Figure 22 displays the experimental findings and the FFNN forecasts for the test patterns. The FFNN hyperparameters are also researched in order to select the optimum network and training configurations. Table 1 and Figure 23 (Taylor diagram) display the numerical outcomes of the test set’s hidden layer size evaluation for a range of values (2, 5, 10, and 15). The use of 20 neurons and 25 neurons in the hidden layer results in a minor gain in model performance when compared to only 15 neurons, but the cost of training complexity rises. The hidden layer performs considerably worse when there are 10 fewer neurons present (higher RMSE compared to utilizing 20 neurons).
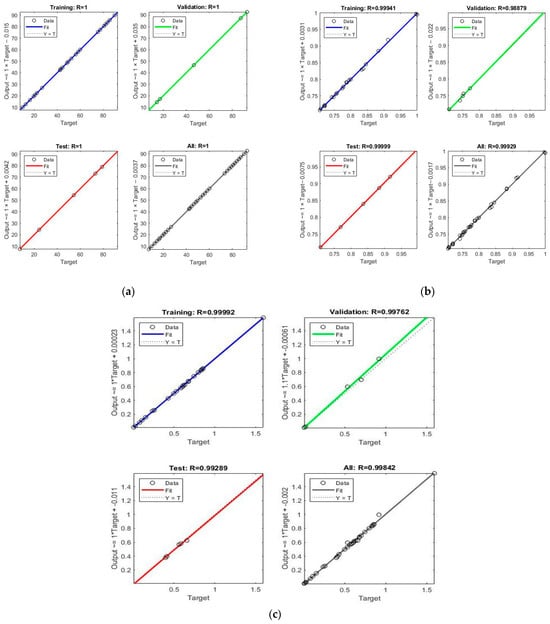
Figure 20.
The FFNN model’s (a) uplift, (b) seepage, and (c) exit hydraulic gradient calculated linear regression relationships for training, validation, testing, and overall, per model.
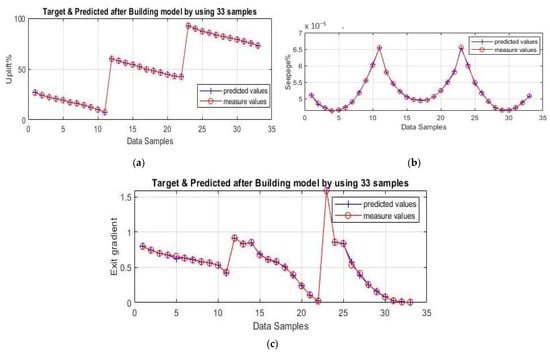
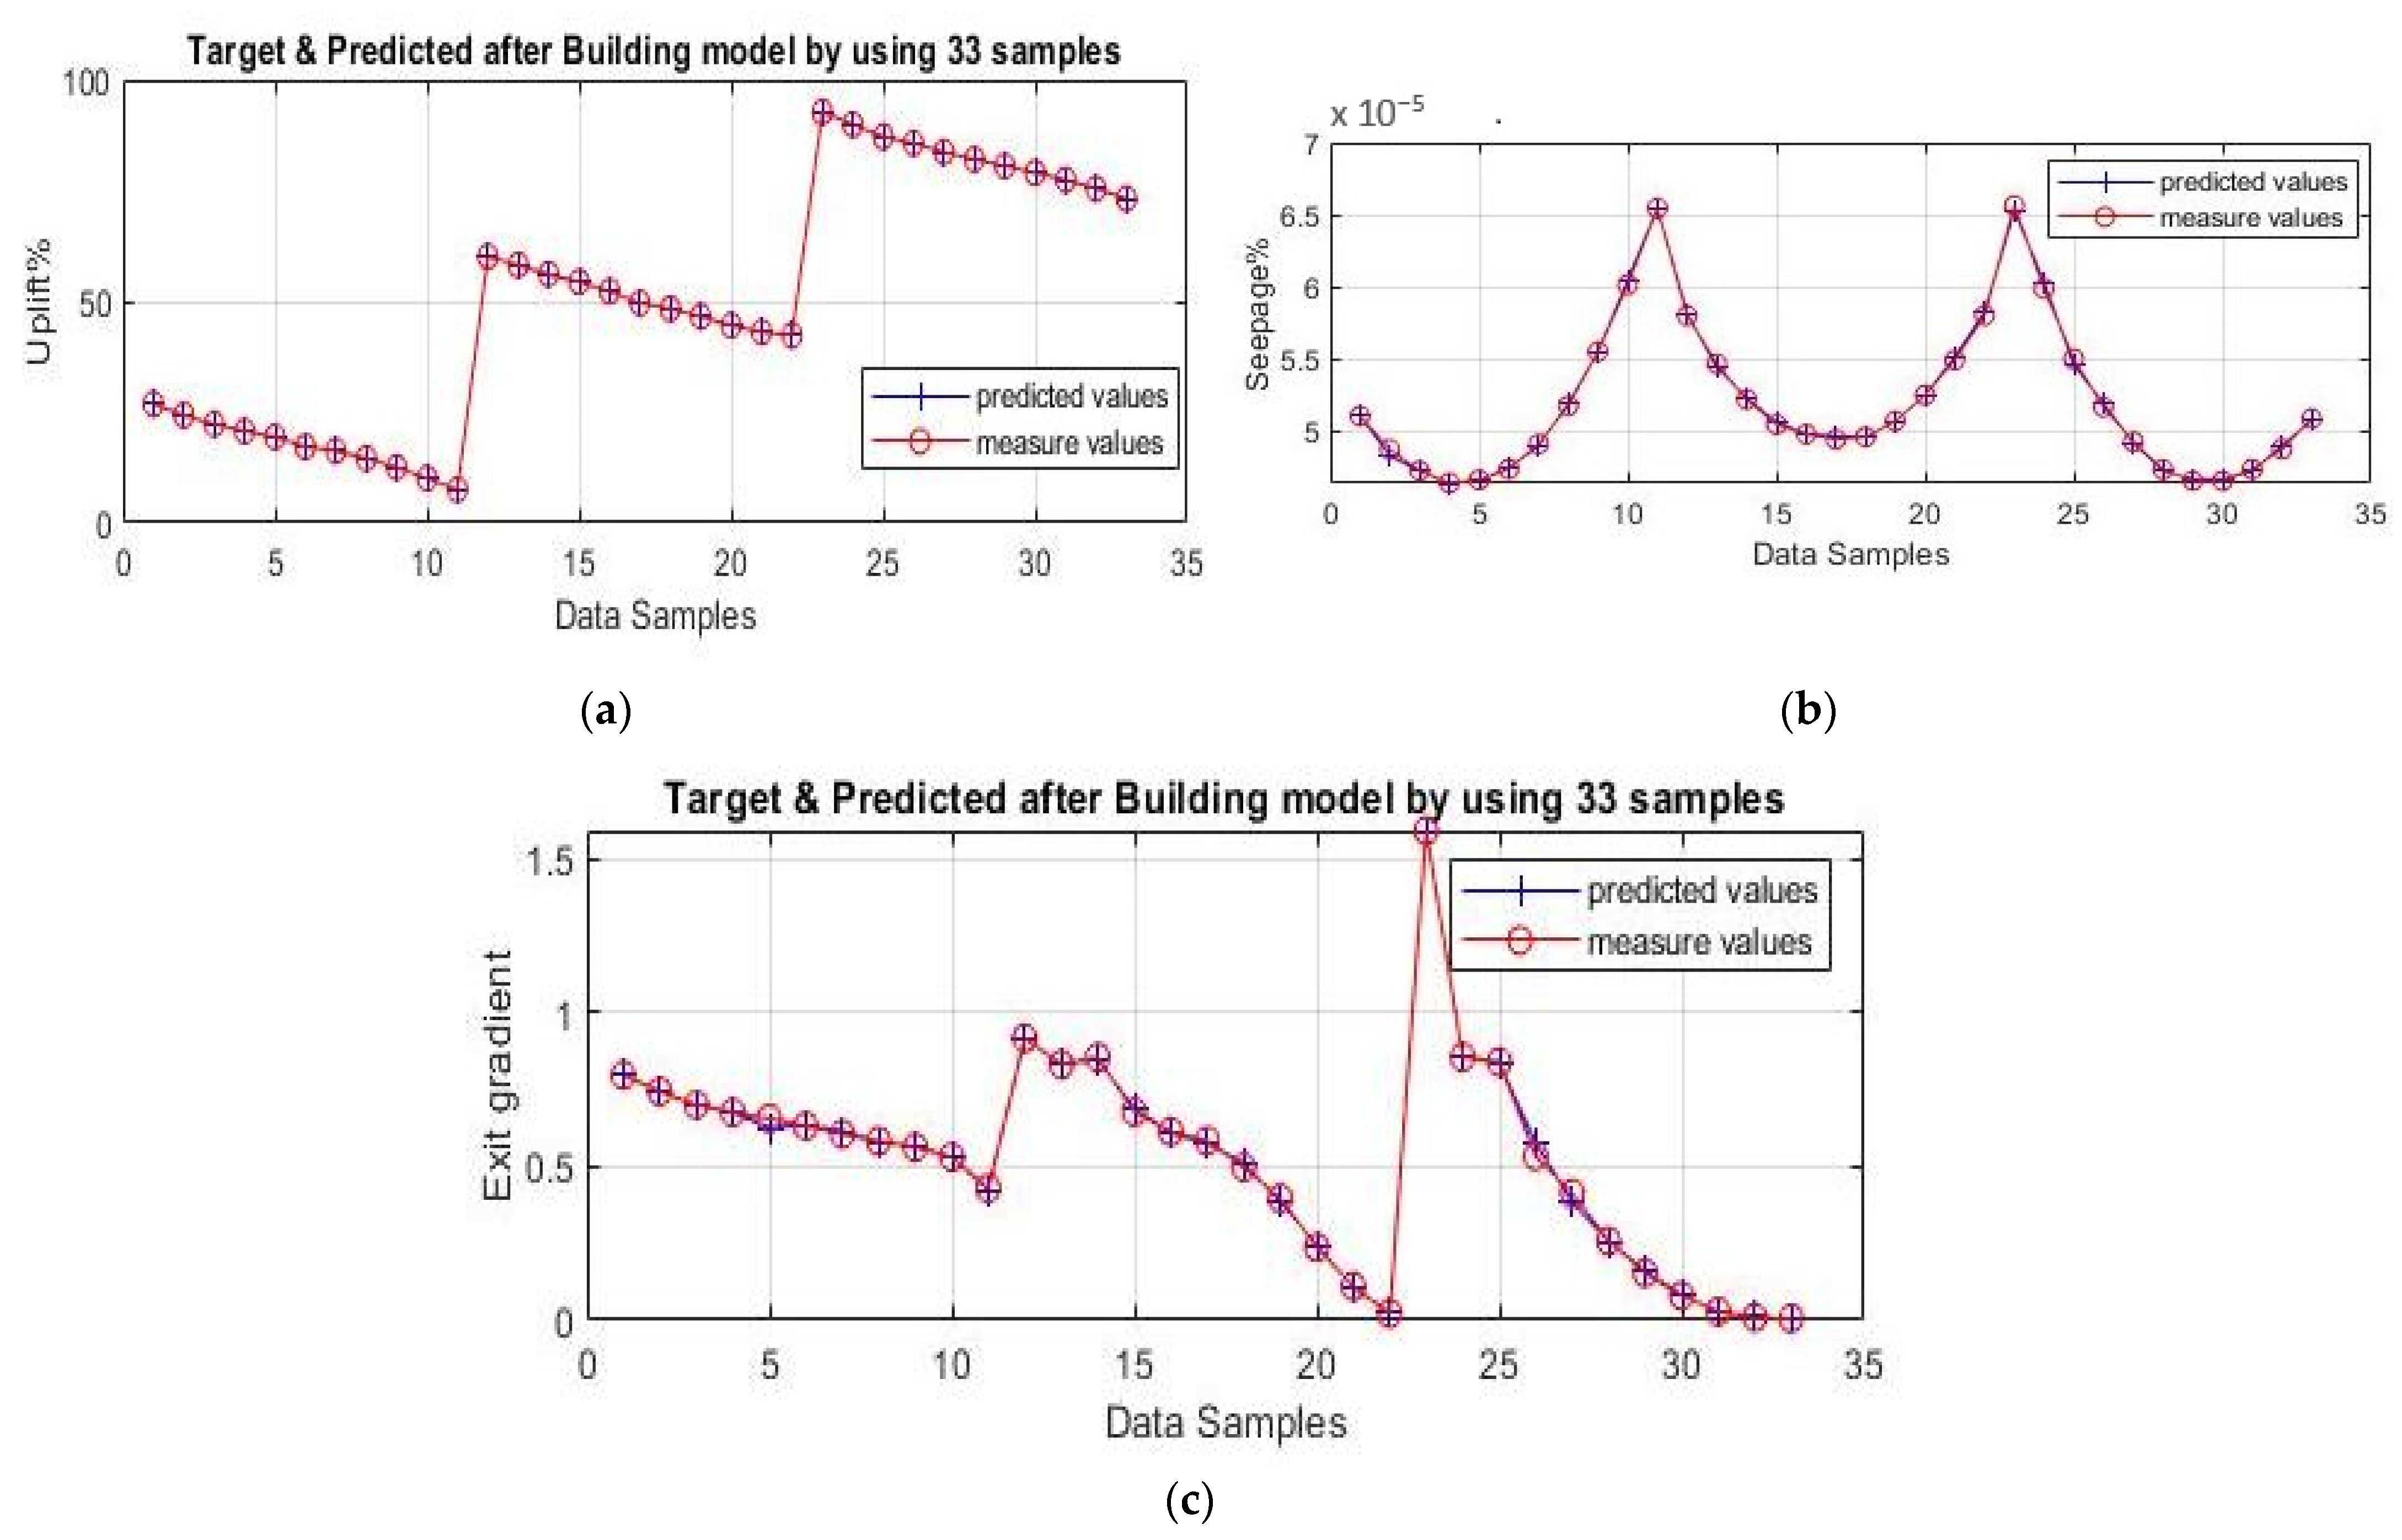
Figure 21.
FFNN predictions for each model for the entire set of experimental data samples for (a) uplift, (b) seepage, and (c) exit hydraulic gradient.
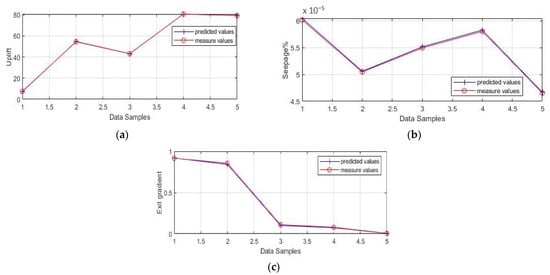
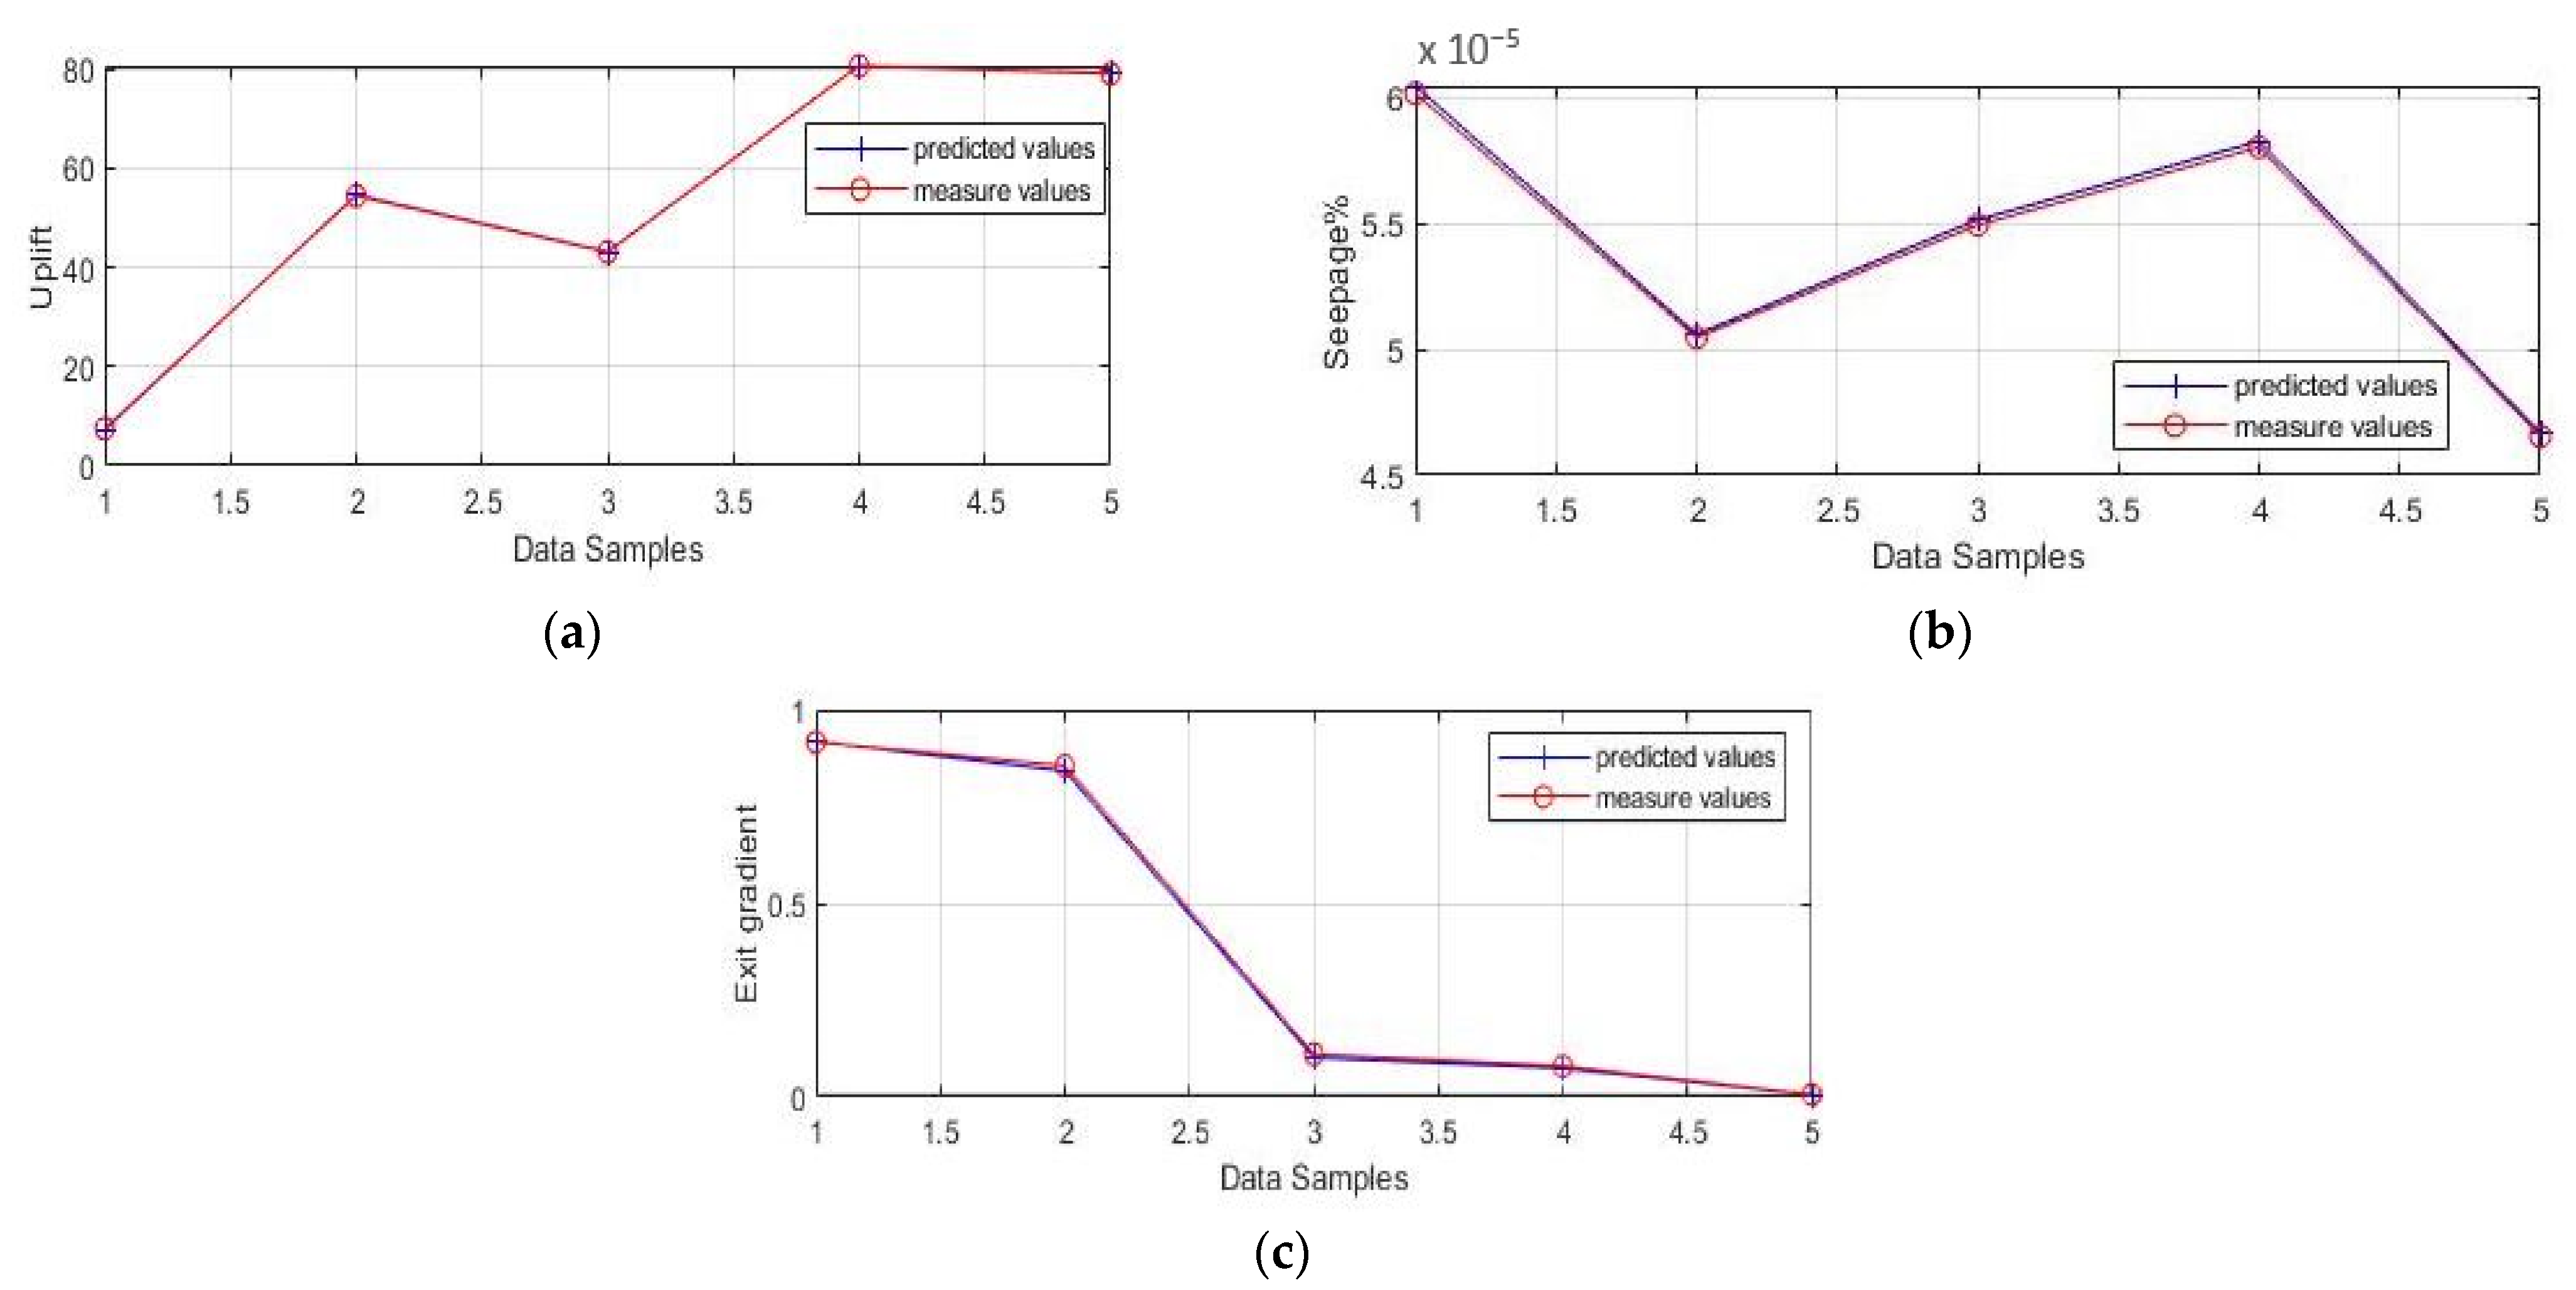
Figure 22.
The test set of experimental data samples for (a) uplift, (b) seepage, and (c) exit hydraulic gradient are predicted by FFNN for each model.

Table 1.
Effect of the number of neurons used in the hidden layer of each model.
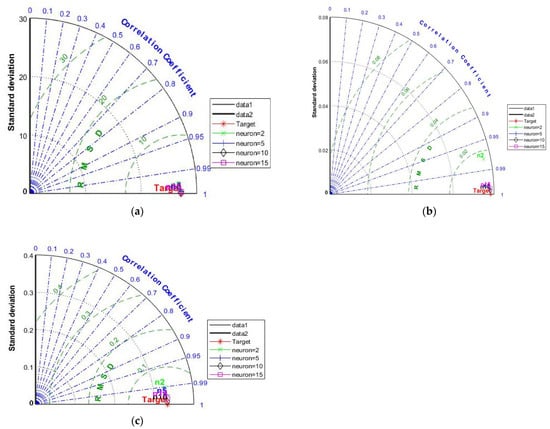
Figure 23.
Taylor diagram for (a) uplift, (b) seepage, and (c) exit hydraulic gradient.
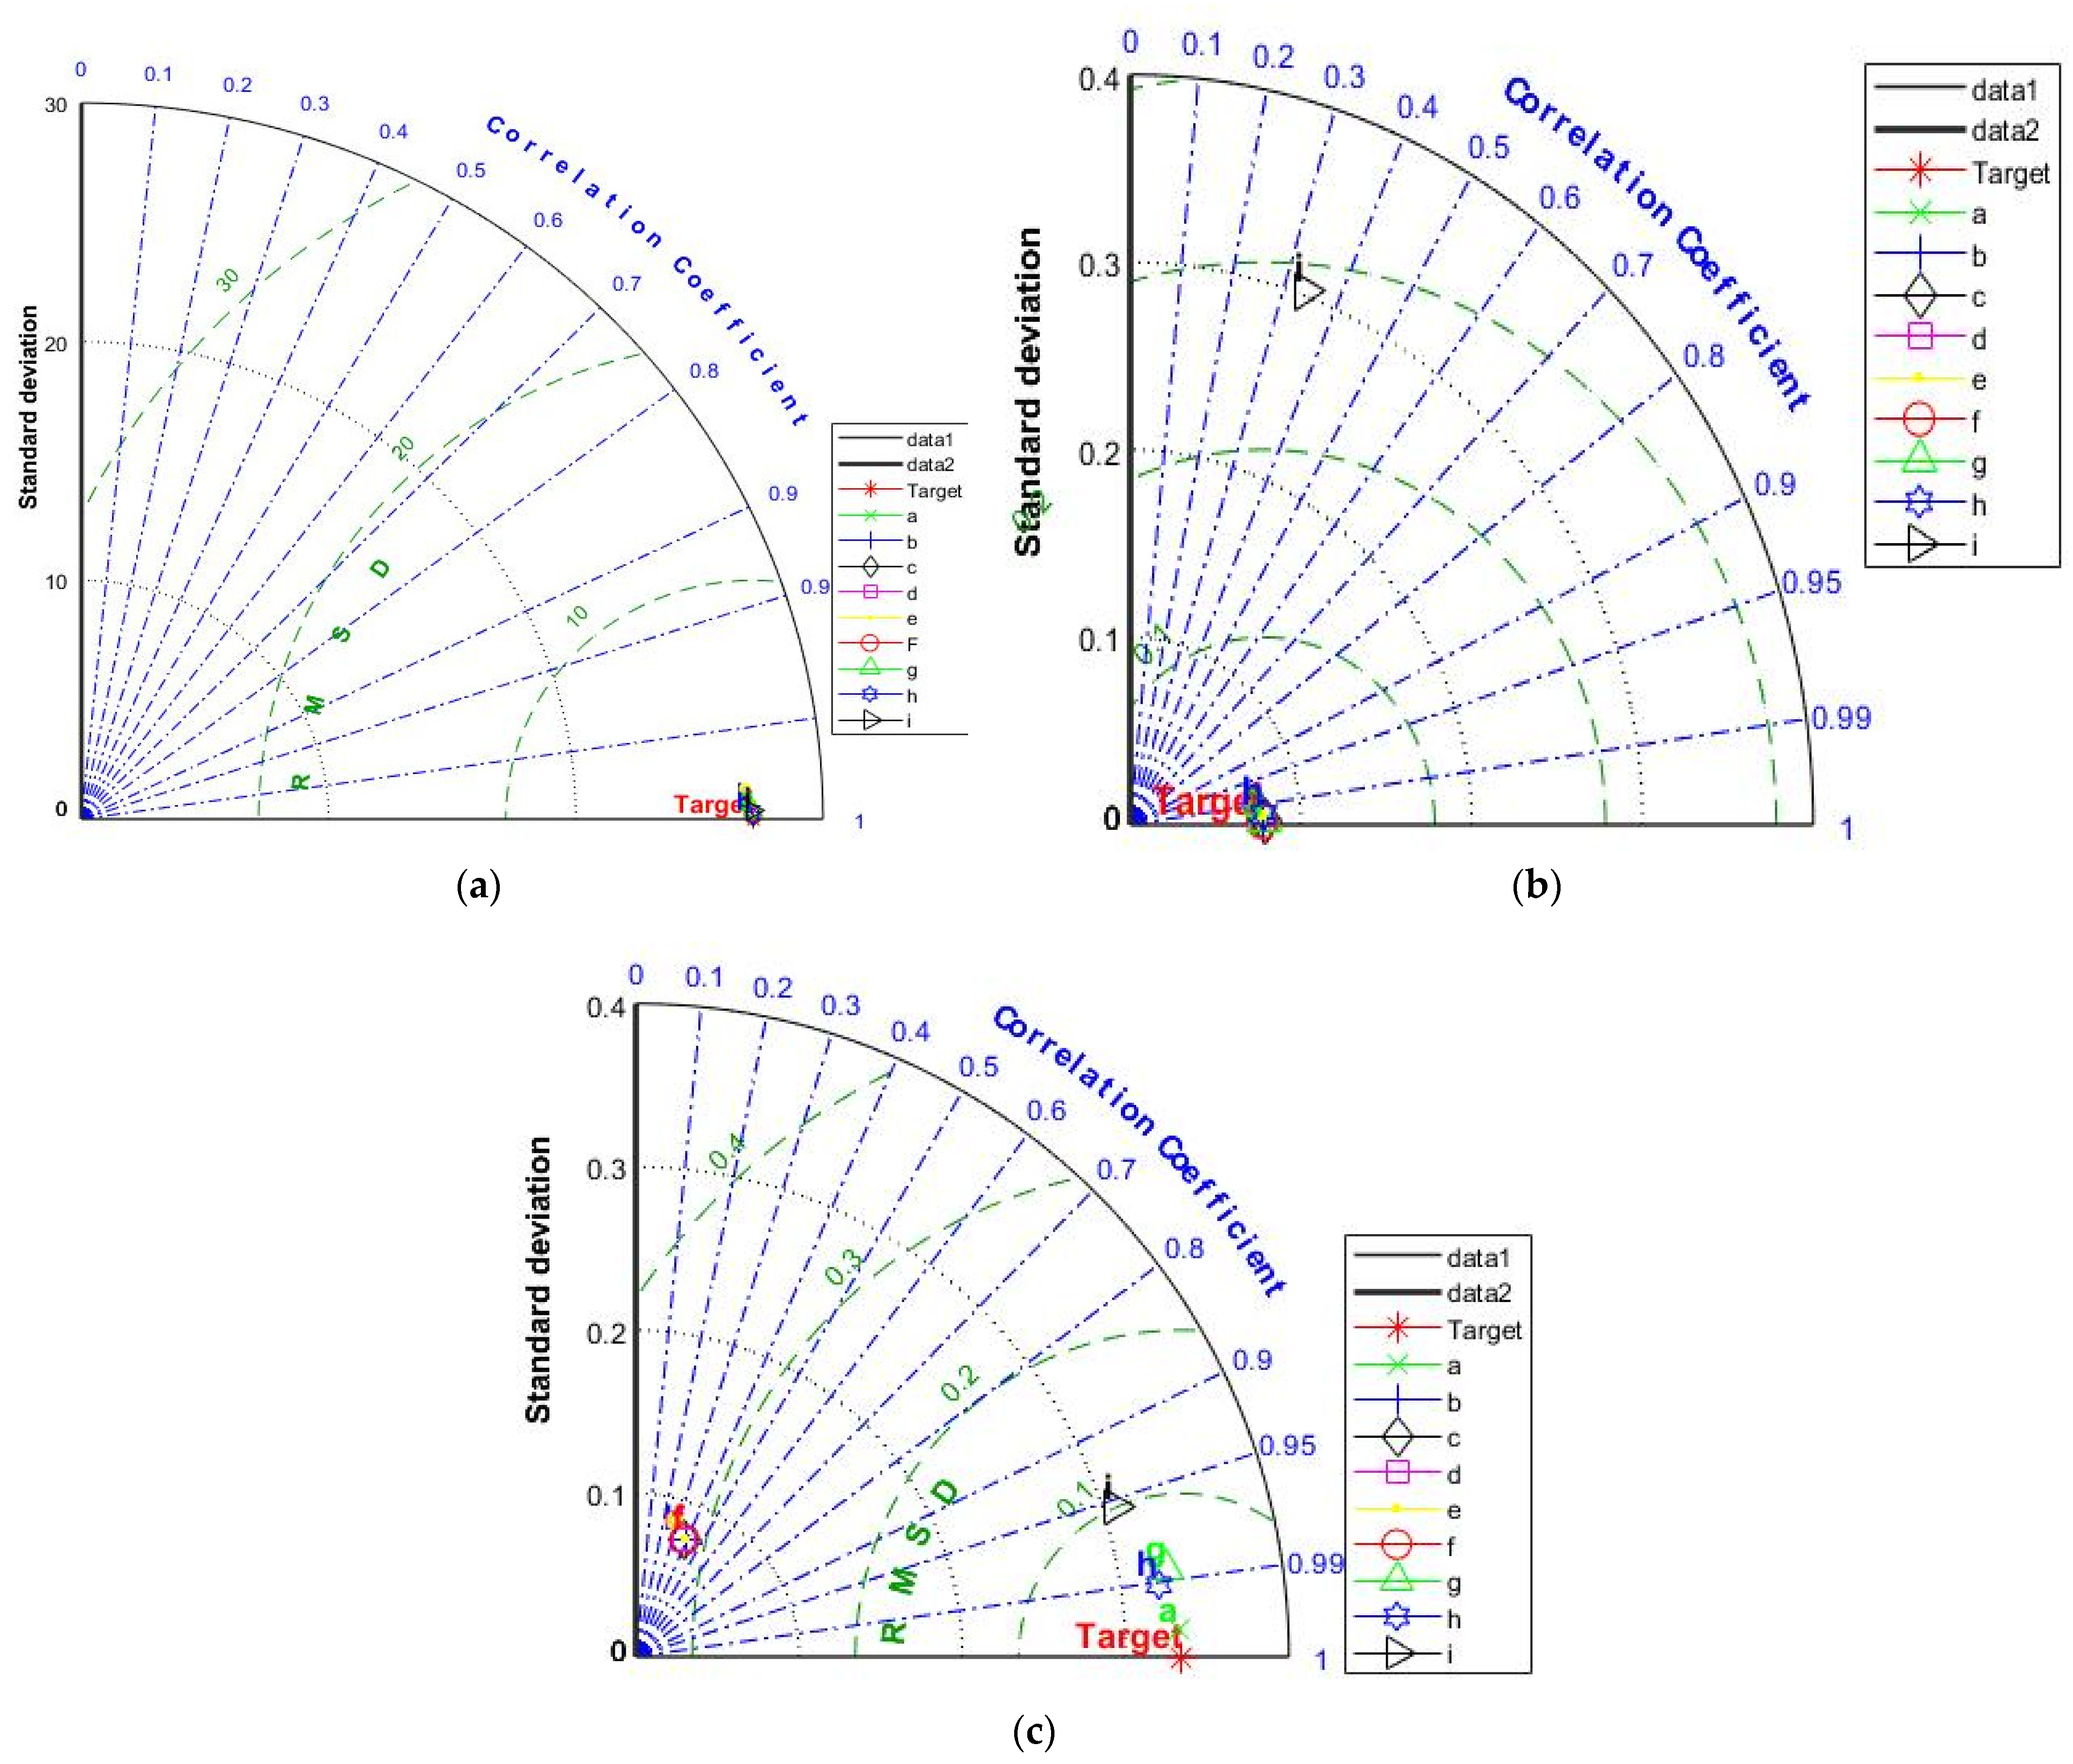
As demonstrated in Table 2 and Figure 24 (Taylor diagram), tansig is the best option for the activation function, whereas (radbas) or the triangular basis transfer function (tribas) produce worse RMSE results. In conclusion, a variety of options were taken into consideration while choosing the best FFNN training settings. The appropriateness of the constructed FFNN for the existing experimental data demonstrate that the model may be utilized to precisely forecast the output of inputs in related experimental circumstances. If the experimental parameters or inputs change, the model might also need to be retrained and its structure altered. However, the process outlined above for choosing the best regression model will be helpful.
Table 2.
Effect of the training algorithm and hidden layer’s activation function in each model.
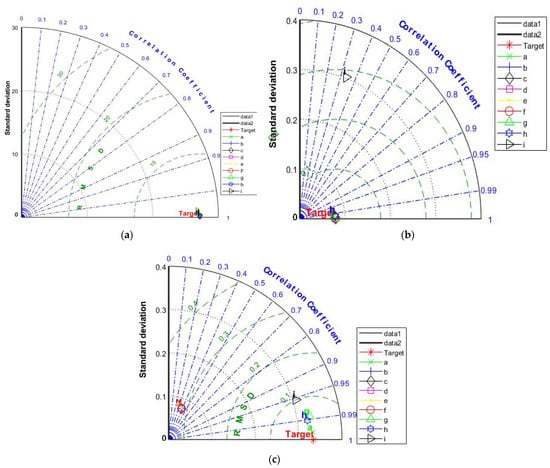
Figure 24.
Taylor diagram for (a) uplift, (b) seepage, and (c) exit hydraulic gradient.
4. Conclusions
Uplift pressure, seepage flow, and exit hydraulic gradient are critical factors that must be taken into consideration during the design of hydraulic structures such as diversion dams. Cutoff walls are commonly used to mitigate the negative impacts of seepage beneath hydraulic structures. Consequently, this study focused on the investigation of their hydraulic impacts under both static and dynamic conditions, which is essential in designing hydraulic structures for safe and reliable performance. This study showed that placing the cutoff wall at the upstream heel was more effective in reducing uplift pressure compared to other placements during static conditions. Therefore, placing a cutoff wall at the upstream heel is recommended to dissipate the seeped water’s energy at the beginning of the structure’s floor and improve the hydraulic structure’s stability. The inclination angles for the different placements of the cutoff wall had a significant impact on the total uplift pressure during the static state, in which as the inclination angle increased, the total uplift pressure decreased, irrespective of the cutoff wall position. The earthquake had a noticeable effect on uplift pressure, particularly for heel and toe placements during the shaking period, because of the excess pore water pressure induced by shaking.
The exit hydraulic gradient was considerably affected by the presence of a cutoff wall, particularly at the toe. Whereas the exit hydraulic gradient decreased from 2.4 at the base case (i.e., without using a cutoff wall) to 0.63, 0.58, and 0.25 in the case of using a cutoff wall with an inclination angle of 90° at US heel, middle, and DS toe placements, respectively. The inclination angle of a cutoff wall also had a significant impact on the exit hydraulic gradient; whereas the inclination angle increased, the exit gradient at the toe decreased significantly. Therefore, it is crucial to carefully consider the angle of the cutoff wall when designing and constructing water structures to ensure the safety and stability of the structure, in which case the advantages of both the inclination angle and position of the cutoff wall can be taken advantage of. During an earthquake, the cutoff wall had a considerable impact on the exit gradient, and the effect was dependent on the location and inclination angle of the cutoff wall. The DS toe position of the cutoff wall showed a lower exit gradient distribution, followed by the middle and US heel positions. However, as we moved away from the toe of the structure, there was no consistent pattern of the exit hydraulic gradient. The inclination angles also had a significant impact, where the exit hydraulic gradient at the toe of the hydraulic structure increased as the inclination angle decreased. While no clear trend can also be discerned as farther away from the toe due to the spatial and temporal changes in the excess pore water pressure induced by the earthquake over the shaking time.
The presence of a cutoff wall beneath the hydraulic structure had a noticeable influence on reducing seepage discharge. During static conditions, the inclination angle of 90° was the most effective angle for decreasing seepage discharge, irrespective of position. The ratios of seepage discharge compared to the base case were 58.5%, 61.0%, and 58.5% for the upstream heel, middle, and downstream toe locations, respectively. The effect of earthquakes on seepage discharge was evident, as the values of seepage discharges were significantly higher during dynamic conditions compared to static states. During an earthquake, the seepage discharge values were high regardless of the inclination angle in the case of placing a cutoff wall at the upstream heel, and the maximum seepage discharge value occurred at an inclination angle of 45°.
Additionally, the implemented FFNN demonstrated great accuracy in predicting the indices of uplift pressure, seepage, and exit hydraulic gradient under static conditions. R2 for most of the output parameters achieved 1.00, although RMSE values varied between 0.0021 and 0.06. Overall, this study highlighted the importance of considering both static and dynamic conditions in the design and analysis of hydraulic structures with cutoff walls. However, further studies are needed to improve our knowledge of the hydraulic response of cutoff walls installed beneath hydraulic structures during seismic loads.
Author Contributions
All authors whose names appear on the submission made substantial contributions. Conceptualization, R.A., B.A., M.T.B., B.M.N., A.G. and E.E.; methodology, R.A. and E.E.; numerical modeling and validation, B.M.N. and E.E.; writing—original draft preparation, B.A., M.T.B., A.G. and E.E.; writing—review and editing, R.A., B.M.N. and E.E.; project administration and funding, R.A. All authors have read and agreed to the published version of the manuscript.
Funding
This work was funded by the Deanship of Scientific Research at Jouf University under Grant Number (DSR2022-RG-0106).
Data Availability Statement
Data for this work can be found within the article, and for further data, contact the corresponding authors.
Conflicts of Interest
The authors declare no conflict of interest.
References
- Mansuri, B.; Salmasi, F.; Oghati, B. Effect of Location and Angle of Cutoff Wall on Uplift Pressure in Diversion Dam. Geotech. Geol. Eng. 2014, 32, 1165–1173. [Google Scholar] [CrossRef]
- Nourani, B.; Salmasi, F.; Abbaspour, A.; Oghati Bakhshayesh, B. Numerical Investigation of the Optimum Location for Vertical Drains in Gravity Dams. Geotech. Geol. Eng. 2017, 35, 799–808. [Google Scholar] [CrossRef]
- Norouzi, R.; Salmasi, F.; Arvanaghi, H. Uplift pressure and hydraulic gradient in Sabalan Dam. Appl. Water Sci. 2020, 10, 111. [Google Scholar] [CrossRef]
- Salmasi, F.; Khatibi, R.; Nourani, B. Investigating reduction of uplift forces by longitudinal drains with underlined canals. ISH J. Hydraul. Eng. 2018, 24, 81–91. [Google Scholar] [CrossRef]
- Tokaldany, E.A.; Shayan, H.K. Uplift force, seepage, and exit gradient under diversion dams. Proc. Inst. Civ. Eng. Water Manag. 2013, 166, 452–462. [Google Scholar] [CrossRef]
- Okeke, A.C.-U.; Wang, F. Critical hydraulic gradients for seepage-induced failure of landslide dams. Geoenviron. Disasters 2016, 3, 9. [Google Scholar] [CrossRef]
- Sivakumar, S.; Begum, N.A.; Premalatha, P.V. Deformation analysis of suspended type cut off wall of diversion structures. Heliyon 2019, 5, e02213. [Google Scholar] [CrossRef]
- Moharrami, A.; Moradi, G.; Bonab, M.H.; Katebi, J.; Moharrami, G. Performance of Cutoff Walls Under Hydraulic Structures Against Uplift Pressure and Piping Phenomenon. Geotech. Geol. Eng. 2015, 33, 95–103. [Google Scholar] [CrossRef]
- Chen, Y.; Zhou, C.; Zheng, H. A numerical solution to seepage problems with complex drainage systems. Comput. Geotech. 2008, 35, 383–393. [Google Scholar] [CrossRef]
- Bligh, W. Dams, barrages and weirs on porous foundations. Eng. News 1910, 64, 708–710. [Google Scholar]
- Lane, E.W. Security from under-seepage-masonry dams on earth foundations. Trans. Am. Soc. Civ. Eng. 1935, 100, 1235–1272. [Google Scholar] [CrossRef]
- Khosla, R.B.A.; Bose, N.K.; Taylor, E.M. Design of Weirs on Permeable Foundations; Central Board of Irrigation and Power: New Delhi, India, 1936. [Google Scholar]
- Harr, M. Groundwater and Seepage; McGraw-Hill Book Co. Inc.: New York, NY, USA, 1962; p. 249. [Google Scholar]
- Elkamhawy, E.; Wang, H.; Zhou, B.; Yang, Z. Failure mechanism of a slope with a thin soft band triggered by intensive rainfall. Environ. Earth Sci. 2018, 77, 340. [Google Scholar] [CrossRef]
- Elkamhawy, E.; Zelenakova, M.; Abd-Elaty, I. Numerical canal seepage loss evaluation for different lining and crack techniques in arid and semi-arid regions: A case study of the river Nile, Egypt. Water 2021, 13, 3135. [Google Scholar] [CrossRef]
- Hassan, W.H. Application of a genetic algorithm for the optimization of a cutoff wall under hydraulic structures. J. Appl. Water Eng. Res. 2017, 5, 22–30. [Google Scholar] [CrossRef]
- Hassan, W.H. Application of a Genetic Algorithm for the Optimization of a Location and Inclination Angle of a Cut-Off Wall for Anisotropic Foundations Under Hydraulic Structures. Geotech. Geol. Eng. 2019, 37, 883–895. [Google Scholar] [CrossRef]
- Javanmard, M.; Mottaghi, R.; Hosseini, S.M.M. Investigating the influence of penetration length of cut-off wall on its dynamic interaction with core and foundation of earth dam. Civ. Eng. J. 2018, 4, 3019–3026. [Google Scholar] [CrossRef]
- Armanuos, A.M.; Negm, A.M.; Javadi, A.A.; Abraham, J.; Gado, T.A. Impact of inclined double-cutoff walls under hydraulic structures on uplift forces, seepage discharge and exit hydraulic gradient. Ain Shams Eng. J. 2022, 13, 101531. [Google Scholar] [CrossRef]
- Beale, M.H.; Hagan, M.T.; Demuth, H.B. Neural network toolbox. In User’s Guide MathWorks; The MathWorks, Inc.: Natick, MA, USA, 2010; Volume 2, pp. 77–81. [Google Scholar]
- Alrowais, R.; Abdel daiem, M.M.; Li, R.; Maklad, M.A.; Helmi, A.M.; Nasef, B.M.; Said, N. Groundwater Quality Assessment for Drinking and Irrigation Purposes at Al-Jouf Area in KSA Using Artificial Neural Network, GIS, and Multivariate Statistical Techniques. Water 2023, 15, 2982. [Google Scholar] [CrossRef]
- Abdel Daiem, M.M.; Hatata, A.; El-Gohary, E.H.; Abd-Elhamid, H.F.; Said, N. Application of an artificial neural network for the improvement of agricultural drainage water quality using a submerged biofilter. Environ. Sci. Pollut. Res. 2021, 28, 5854–5866. [Google Scholar] [CrossRef]
- Abdel Daiem, M.M.; Hatata, A.; Galal, O.H.; Said, N.; Ahmed, D. Prediction of biogas production from anaerobic co-digestion of waste activated sludge and wheat straw using two-dimensional mathematical models and an artificial neural network. Renew. Energy 2021, 178, 226–240. [Google Scholar] [CrossRef]
- Abdel Daiem, M.M.; Hatata, A.; Said, N. Modeling and optimization of semi-continuous anaerobic co-digestion of activated sludge and wheat straw using Nonlinear Autoregressive Exogenous neural network and seagull algorithm. Energy 2022, 241, 122939. [Google Scholar] [CrossRef]
- Adib, A.; Poorveis, D.; Mehraban, F. Comparison between results of solution of Burgers’ equation and Laplace’s equation by Galerkin and least-square finite element methods. Appl. Water Sci. 2018, 8, 42. [Google Scholar] [CrossRef]
- Daneshfaraz, R.; Sadeghfam, S.; Adami, R.; Abbaszadeh, H. Numerical Analysis of Seepage in Steady and Transient Flow State by the Radial Basis Function Method. Numer. Methods Civ. Eng. 2023, 8, 58–68. [Google Scholar]
- Krahn, J. Seepage Modeling with SEEP/W: An Engineering Methodology; GEO-SLOPE International Ltd.: Calgary, AL, Canada, 2004. [Google Scholar]
- Krahn, J. Stress and Deformation Modeling with SIGMA/W: An Engineering Methodology; GEO-SLOPE International Ltd.: Calgary, AL, Canada, 2004. [Google Scholar]
- Krahn, J. Dynamic Modeling with QUAKE/W: An Engineering Methodology; GEO-SLOPE International Ltd.: Calgary, AL, Canada, 2004. [Google Scholar]
- Allen, T.I.; Wald, D.J.; Hotovec, A.J.; Lin, K.; Earle, P.S.; Marano, K.D. An Atlas of ShakeMaps for Selected Global Earthquakes; US Department of the Interior, US Geological Survey: Reston, VA, USA, 2008.


Disclaimer/Publisher’s Note: The statements, opinions and data contained in all publications are solely those of the individual author(s) and contributor(s) and not of MDPI and/or the editor(s). MDPI and/or the editor(s) disclaim responsibility for any injury to people or property resulting from any ideas, methods, instructions or products referred to in the content. |
© 2023 by the authors. Licensee MDPI, Basel, Switzerland. This article is an open access article distributed under the terms and conditions of the Creative Commons Attribution (CC BY) license (https://creativecommons.org/licenses/by/4.0/).