1. Introduction
Reservoirs are crucial infrastructures for comprehensive water resource utilization [
1], and they can play an important role in energy production, water supply, and shipping. In a constructed multireservoir system, the multiobjective joint optimal operation is an effective approach for fully exploiting the entire system’s synergistic revenue and improving the utilization efficiency of water resources [
2,
3,
4,
5]. For reservoirs located in the middle and downstream reaches of a river system, under the complementarity mechanisms of hydrological, reservoir storage, and hydraulic conditions, synergistic revenue not only is generated through the joint operation of the reservoirs within the subsystem but also directly influenced by streamflow regulation in the upstream reservoirs. For a complex reservoir system, the assessment of the synergistic revenue of middle and downstream reservoirs (compensated reservoirs) contributed by upstream reservoirs (compensating reservoirs) can further clarify the potential synergistic revenue. In particular, for optimal operation in terms of power generation, increased energy production from joint operation not only generates substantial economic gains but also provides dual support for socioeconomic development in terms of renewable energy production and greenhouse gas reduction [
4].
The joint operation of reservoirs not only generates synergistic revenue to the total [
6,
7,
8] but also incurs operation costs for some individual members [
9]. The total revenue of compensated reservoirs (often downstream) can be increased, and the added value compared to the separate operation is defined as synergistic revenue. The compensating reservoirs (often upstream) change their expected optimal operation, resulting in revenue loss, which is defined as the operation cost. Meanwhile, the large basin can be divided into mainstream and multiple tributary systems based on their structure. Typically, reservoirs on different tributary systems are regulated and managed by local stakeholders, forming a multistakeholder reservoir system [
10]. Joint operation requires the coordination of the synergistic revenue and operation cost relationships among the multistakeholders. Therefore, it is necessary to propose a comprehensive model for assessing synergistic revenue–cost for joint operation of a multistakeholder reservoir system.
Currently, with rapid developments in the hydropower energy industry, the model of construction and the operation of reservoirs under multistakeholder and marketization management environments has become universal [
11,
12,
13,
14]. Theoretically, implementing multiobjective joint operations in a large-sized reservoir system can be achieved if all reservoirs are owned by the same stakeholder such that all operational information can be shared. In contrast, in real-world cases, reservoirs belong to different stakeholders, and marketing systems often face conflicts of interest. Consequently, critical information related to revenues and costs, such as hydropower generation, is often not shared. Therefore, the assessment of the synergistic revenue contributed by the upstream compensating reservoirs of other stakeholders can be formulated as a joint multiobjective reservoir operation modeling problem under incomplete information. Challenges confronted in such a modeling process include the following: a. Many operation objectives are involved, and both revenue and cost objectives should be considered [
15,
16,
17,
18,
19,
20,
21]. b. Information related to energy production by other stakeholders cannot be obtained. c. The computational effort required in large system modeling is expensive [
22,
23]. d. Various synergistic revenue results can be obtained under different combinational scenarios. These challenges ultimately represent a multiobjective, multistakeholder, high-dimensional, and combinational joint optimal reservoir operation modeling problem.
Studies in multiobjective reservoir optimization generally include modeling and solving techniques, wherein the number of objectives gradually increases from low dimensional (=2) to high dimensional (≥4), and the solving method develops from classical scalar optimization methods to vector optimization methods. Scalar optimization methods convert multiple objectives into a single objective by treating the remaining objectives as constraints or integrating them as an augmented objective function. Huang et al. [
24] used penalty factors to equate the multiple objectives of energy, flood control, and ecology into an integrated single objective to handle the flood optimization operation problem of the Three Gorges Reservoir (China). Converting a highly nonlinear augmented objective function can reduce the computational effort, but determining reasonable weights for decision making could be difficult [
25]. Because scalar optimization can find only one solution in a single run, vector optimization algorithms, such as evolutionary algorithms that provide noninferior solutions in one run, provide advantages in examining the entire spectrum. Giuliani et al. [
26] developed an optimal operation model that considered six objectives in relation to the Conowingo Dam (USA), which included power generation, water supply, tourism, and ecological protection, and solved the model using the Borg MOEA algorithm to obtain the solutions. Xu et al. [
27] established a multiobjective robust optimization model that considered the minimization of risk probabilities, vulnerability of ecological protection, water–energy supply, and energy revenue loss, and solved it using the evolutionary algorithm NSGA-III to obtain a large number of nondominated solutions under a complex multiobjective space. However, in high-dimensional multiobjective optimization problems with more than four objectives, there are substantial challenges in presenting the noninferior solution frontier and comparing solutions. Because the objective space is excessively large, the dominance relationship is difficult to explore, and the noninferior relationship is exceptionally complex.
With the gradual increase in the size of reservoir systems, research into large-sized system decomposition and algorithms for dimensionality reduction is ever more valuable in solving optimization problems of complex hydropower systems incorporating large numbers of reservoirs. High dimensionality, multiple constraints, and nonlinear optimization problems could hinder the systematic analysis of synergistic revenue via joint reservoir operation. To overcome these problems, large-system decomposition–coordination methods could effectively reduce the computational effort and alleviate the curse of dimensionality. Jia et al. [
28] proposed a third-level hierarchical optimization decomposition–coordination model, which was applied to real-time flood control operations in the middle reaches of the Huaihe River (China). The model decomposed the complex flood control system into multiple subsystems with different optimization objectives and solving algorithms. Although this method can consider the physical conditions of all the reservoirs and the entire system together, it is difficult to apply in a multistakeholder reservoir system where information sharing is lacking. Li et al. [
29] proposed an intelligent inference method for identifying effective reservoirs from the entire set of all 14 reservoirs in the Huaihe River Basin. They established a dynamic structured model for real-time hybrid operation based on joint operation of the effective reservoirs. Subsequent studies have proposed various modeling approaches for identifying effective reservoirs, including the random forest method [
30]. Research has shown that such a method can substantially reduce the dimensionality and decision complexity while ensuring effective joint operation in flood control. However, such methods cannot be applied to a hydropower system because noneffective reservoirs still contribute a high percentage of synergistic revenue in terms of energy production within a large reservoir system. In addition to improving model structure, the parallel computing method is able to reduce the joint operation complexity of a large reservoir system in terms of reducing the required processing time. Ma et al. [
31] proposed a cloud computing method called Spark-based parallel dynamic programming and applied it to a system of eight reservoirs. Their results showed that the method could efficiently solve the joint optimal operation problem of a large-sized reservoir system. Yao et al. [
32] applied a large-sized multiobjective evolutionary algorithm to the system of 14 reservoirs on the Yellow River (China) and found that it exhibited advantages in improving diversity, convergence, and efficiency in multiobjective optimization. To the best of our knowledge, studies on multireservoir systems generally involve fewer than 15 reservoirs, although a small number of studies have reported on joint operations involving over 20 reservoirs.
To address the above challenges in relation to multiobjective, multistakeholder, high-dimensional, and combinational joint optimal reservoir operation modeling and to evaluate the synergistic revenue and cost, this study is proposed to address these knowledge gaps: (1) simplify the modeling structure and enhance the modeling efficiency, (2) explore the relationship between synergistic revenue and cost, (3) find the key compensating reservoir(s) within a complex multistakeholder system, (4) explain the mechanism or theory of compensation in a multistakeholder reservoirs system. For these gaps, we proposed a comprehensive model. First, in evaluating the synergistic revenue of the compensated (downstream) reservoirs system that covers the objectives of energy production, water supply, ecological protection, and shipping, all objectives other than energy production are converted into constraints, and an optimization problem for investigating synergistic revenue in terms of energy production is formulated without reducing the reliability of others. Second, to tackle the problem of incomplete information owing to the fact that synergistic revenue in energy production (from downstream reservoirs) and cost (from upstream reservoirs) are generated by different stakeholders, the approximate positive correlation between the cost and the change in outflow from upstream reservoirs is considered, and the maximum changed degree in outflow is used as a surrogate of operation cost. Thereafter, this converts the high-dimensional multiobjective optimization problem under incomplete information into a revenue–cost dual-objective optimization problem. Finally, the concept of “aggregated reservoirs” is proposed to aggregate the upstream reservoirs into a single reservoir according to the topology of the river system and the stakeholders of the reservoir system. By realizing the complementarity effect of streamflow through regulation from the upstream reservoirs to the downstream reservoirs, the influence of aggregated reservoirs can be formulated as a constraint such that the multiobjective joint optimal model of a large-sized reservoir system (nearly 30 reservoirs) can be successfully reduced to an equivalent small-sized reservoir system (11 reservoirs) without loss of precision. The model has achieved dual economic and technological improvements that greatly improve the computational efficiency and interpretability of the synergistic revenue results.
2. Methodology
From the perspective of the downstream reservoir group, this study focused on analyzing the synergistic revenue and operation cost generated when the upstream reservoirs in the system synergistically compensate the downstream reservoirs.
Figure 1 depicts the classification of the reservoirs in the entire system; these reservoirs are divided into two categories.
a. Upstream compensating reservoirs: Assume there are M upstream tributary river systems in the basin, and each system is owned by a stakeholder, Nm reservoirs on the m-th tributary, and the sub-reservoir i is denoted by .
b. Downstream compensated reservoirs: Assume there are J reservoirs in the downstream cascade reservoir, where sub-reservoir j is denoted by , and these reservoirs are owned by stakeholder F.
The inflow of the leading reservoir (F1) in the downstream cascade and the lateral inflow of downstream reservoir Fj are influenced by the streamflow regulation of the upstream reservoir system. On the one hand, when the upstream reservoir system conducts joint operations for complementing the downstream reservoirs, synergistic revenue will be generated downstream. On the other hand, deviation from the individual optimal operation strategy of upstream reservoirs owing to joint operation will reduce revenue, corresponding to operation cost. Moreover, revenue and cost could be totally different under various combinational scenarios of the upstream stakeholders. Therefore, this study focused on evaluating the synergistic revenue and operation cost corresponding to joint scenarios of individual and combinational stakeholders. An equivalent aggregated reservoir model based on the topology of the river system is proposed, which aggregates the upstream compensating reservoirs into a group of M aggregated reservoirs.
The model structure is outlined as follows. The revenue and cost indexes of multiobjective joint operation are constructed in
Section 2.1, and the generalization method of the compensating reservoir system based on the equivalent aggregated reservoir theory is proposed in
Section 2.2. An equivalent dual-objective joint optimal operation model is established in
Section 2.3, and the method for evaluation of synergistic revenue and operation cost is introduced in
Section 2.4.
Figure 2 depicts a flowchart of the entire model and the experimental setup.
2.1. Construction and Simplification of Multiobjective Joint Operation Indexes
Reservoirs in a river basin are characterized by varied hydrological conditions, storage capacity, and power supply users, and, therefore, a potential complementarity condition exists with regard to the above factors. Owing to the complementarity mechanisms, joint optimal operation of a reservoir system increases the total revenue, and the added value relative to individual operation is defined as the synergistic revenue. This section introduces the revenue indexes of energy production, water supply, ecological protection, and shipping and cost.
a. Revenue indexes of compensated reservoirs
According to the actual conditions of multiobjective joint operation in the downstream reservoir system, synergistic revenue in energy production (
), water supply (
), ecological protection (
), and shipping (
) are measured by their increases:
where
T is the number of operation periods;
is the scenario of joint operation, i.e., {A} denotes that reservoir A participates in compensation, {A,B} indicates that reservoirs A and B participate in compensation, and
denotes individual operation (i.e., status quo);
is the time interval (10d);
and
are the energy production of compensated reservoir
j in period
t in the joint operation scenario (superscript
) and the individual operation scenario (superscript
), respectively;
is the power output of compensated reservoir
j in period
t in scenario
(kW); and
,
, and
are the reliability of water supply, ecological protection, and shipping in period
t in scenario
(%).
To reduce model complexity and avoid exploring the tradeoff relationship of high-dimensional synergistic revenue, this study focused on the results of synergistic revenue in energy production, and the remaining three indexes were considered in the constraints; that is, constraining the joint operation should not diminish the reliability of water supply, ecological protection, and shipping of the compensated reservoirs below that realized under status quo.
b. Cost index of compensating reservoirs
Synergistic revenues in the energy production of the downstream compensated reservoirs are generated because the optimized outflow process of the compensating upstream reservoirs changes the spatial and temporal distribution of the downstream inflow, such that spillage and water head can be optimized. However, for compensating reservoirs, participating in joint operations changes their individual optimal operation, which results in revenue loss or cost. Because the stakeholders of the downstream compensated reservoirs are unable to obtain the revenue information of the stakeholders of the upstream reservoirs, a surrogate index should be used to measure the cost.
For rational decision makers, if there is no mechanism for sharing the synergistic revenue, upstream reservoir groups could operate to optimize their own operation revenues. Therefore, when each upstream reservoir system operates independently under status quo, they have the lowest operation cost. In contrast, when the upstream reservoir systems change their operation to complement the downstream reservoirs, the cost is broadly positively correlated with the degree of change in outflow. Therefore, the maximum change degree in the outflow of the upstream reservoirs is selected as the surrogate of cost, and the corresponding equation can be expressed as follows:
where
is the maximum change degree in outflow of the upstream reservoirs in scenario
;
and
are the average outflow of aggregated reservoir
m (detailed information about the aggregated reservoir is introduced in
Section 2.2) in the joint and individual operation scenarios in period
t (m
3/s); and
is the sum of the average outflow of all aggregated reservoirs in the individual operation scenario in period
t (m
3/s).
2.2. Generalization Method for Equivalent Aggregated Reservoirs
Developing a joint operational model for a complex reservoir system operated by many stakeholders faces the problems of huge computational effort and incomplete information. Therefore, building a model that considers the impact of streamflow regulation of a complex reservoir system with an acceptable level of computational effort and less information is critical.
Addressing the influence of the operation of upstream reservoirs on streamflow, the concept of an equivalent aggregated reservoir is proposed, which aggregates the storage and inflow of the upstream reservoirs to simulate the overall influence of the entire system with their internal regulation effect simplified [
33,
34]. The equivalent aggregated reservoirs model can be applied to cascade, parallel, and mixed reservoirs by ignoring complex inter-reservoir regulation processes, such that the influence of all reservoirs in a given upstream river system can be represented as a singular reservoir operation. Consequently, the inflow of the compensated reservoirs can be derived either with or without the joint operation of the aggregated reservoirs. A schematic depicting various forms of aggregated reservoirs is shown in
Figure 3.
The calculation methods for the following terms are established.
a. Inflow of aggregated reservoir
where
is the inflow of aggregated reservoir
m in period
t (m
3/s), and
is the lateral inflow of sub-reservoir
i in period
t (m
3/s).
b. Storage of aggregated reservoir
where
is the storage of aggregated reservoir
m in scenario
and period
t (m
3), and
is the storage of sub-reservoir
i in scenario
and period
t (m
3).
c. Outflow of aggregated reservoir
where
is the outflow of aggregated reservoir
m in scenario
and period
t (m
3/s), and
is the joint reservoir operation model or function for calculating the specific outflow of each aggregated reservoir under a specified level of complementarity (the corresponding model is established in
Section 2.3).
d. Inflow of a compensated reservoir
The inflow of compensated reservoir
j is the sum of the lateral inflow and the outflow of its upstream reservoirs, where the upstream reservoirs include the upstream aggregated reservoirs and the upstream compensated reservoir. The formula for calculating the inflow of compensated reservoir
j can be expressed as follows:
where
is the inflow of compensated reservoir
j in scenario
and period
t (m
3/s), and
is the set of aggregated reservoirs with direct hydraulic connection to compensated reservoir
j.
Clearly, an aggregated reservoir considers the effects of all sub-reservoirs on streamflow regulation, and the proposed modeling approach substantially reduces the computational complexity by aggregating the state variables and decision variables of each sub-reservoir. After aggregation, the model allows the stakeholders of the downstream reservoirs to quickly assess the synergistic revenue in energy production, cost, and specific contribution. However, biases remain in the calculation of streamflow regulation after aggregating multiple reservoirs as one. This is because the simplification of an aggregated reservoir weakens the consideration of the spatial distribution of streamflow. For example, if the downstream sub-reservoirs in an equivalence reservoir have low storage, when the streamflow downstream is wet, the calculation of the outflow from the model of the aggregated reservoir might underestimate the spillage in the wet season. Consequently, this also causes overestimation of synergistic revenue in energy production. The biases can be successfully corrected using the following approaches. In model calibration, the error of streamflow regulation can be checked before and after aggregation via experiment. If the error exceeds an acceptable level, the number of aggregated reservoirs in the river system should be increased. For example, more aggregated reservoirs should be introduced to represent the downstream sub-reservoirs with low storage capacity; thus, the spatial variability of streamflow and its influence can be simulated more precisely.
2.3. Equivalent Aggregated Multiobjective Joint Optimal Operation Model for a Complex Reservoir System
The downstream reservoirs’ stakeholder wishes to assess the synergistic revenue and cost of joint optimal operation of a multistakeholder reservoir system and analyze their tradeoffs because this helps quantify the revenue and identify the stakeholder that could be the optimal partner. On the basis of the methods introduced above, synergistic revenue in energy production () is selected as the major revenue index, and the maximum change degree in the outflow of the upstream reservoirs () is determined as the cost index. The reliability indexes of water supply, ecological protection, and shipping are transformed into constraints, while the regulation of the upstream reservoirs is addressed by the modeling constraint of the equivalent aggregated reservoir, such that the entire model for a complex reservoir system is established as described in the following.
2.3.1. Objective Functions
Using the proposed two objectives that quantify synergistic “revenue” and “cost” in joint operation under different scenarios, optimization is targeted as the following:
2.3.2. Constraints
a. Water balance constraints
where
and
are the power release and non-power release (spillage) of compensated reservoir
j in scenario
and period
t (m
3/s).
b. Storage bounds constraints
where
and
are the lower and upper storage limits, respectively, of aggregated reservoir
m, which are calculated as the sum of the lower and upper limits of the representative sub-reservoirs at the beginning of period
t (m
3), and
and
are the lower and upper storage limits, respectively, of compensated reservoir
j at the beginning of period
t (m
3).
c. Initial and boundary storage conditions
where
and
are the initial storage of aggregated reservoir
m and compensated reservoir
j, respectively (m
3), and
and
are the end storage of aggregated reservoir
m and compensated reservoir
j, respectively (m
3).
d. Aggregated reservoir outflow constraints
where
and
are the lower and upper outflow limits, respectively, of aggregated reservoir
m, which are calculated as the sum of the lower and upper storage limits of all the most downstream sub-reservoirs in aggregated reservoir
m and period
t (m
3/s).
e. Reliability constraints of water supply, ecological protection, and shipping
f. Constraints of power output of compensated reservoirs
where
and
are the lower and upper power output limits, respectively, of compensated reservoir
j in period
t (kW).
2.3.3. Solving Method
When two objectives are considered contradictory, a Pareto frontier with noninferior solutions can be obtained. In particular, the epsilon constraint method is used to convert multiobjective optimization into single-objective optimization via transformation of partial objectives to epsilon constraints, which leaves only one objective to be optimized. In this study, the limitation of the maximum change degree in outflow (
) within a given threshold is represented as an epsilon constraint, and then the single-objective optimization problem for maximizing the increase in energy production (
) is solved under varied thresholds on the constraint:
where
is an acceptable threshold variable on the maximum change degree in outflow of the upstream reservoirs, and the thresholds are between 0% and 100%.
2.4. Synergistic Revenue and Cost Assessment
Synergistic revenue varies under different combinational joint operation scenarios; thus, the results under different combinations of
M aggregated reservoirs are systematically analyzed. There are
combinational scenarios in total. In one scenario, a Pareto frontier is generated such that the tradeoffs of revenue and cost under different scenarios formulate a cluster of frontiers, as illustrated in
Figure 4. By comparing and analyzing the results of revenue–cost tradeoff curves, the key river system and compensating reservoir with the highest synergistic revenue in energy production can be identified.
3. Case Study
The case study considered a system with 27 large reservoirs distributed on five tributaries and the mainstream, and the topological relationship is shown in
Figure 5. In particular, 21 reservoirs (compensating reservoirs) are distributed on the five tributaries, while the mainstream has six reservoirs (compensated reservoirs group:
F1–
F6). The 21 upstream reservoirs are converted to aggregated reservoirs on each tributary, namely A, B, C, D, and E, which belong to five different stakeholders. Aggregated reservoirs A and B are located upstream of the entire compensated reservoir system, while aggregated reservoirs C, D, and E are located downstream tributaries.
Table 1 and
Table 2 list the various constraints such as storage and flow of each aggregated reservoir and compensated reservoir.
A joint optimal operation model was constructed with a planning period of 1 year and a time interval of 10 d. Continuous and differentiable nonlinear functions were used to fit the characteristic curves of the reservoirs, and the sub-gradient method was applied to solve the model. The synergistic revenue in energy production and the cost of the system were then evaluated within the pattern of the hydrological year of 2017 (considered a normal year).
3.1. Analysis of Model Precision of Aggregated Reservoir Operation and Computational Effort
3.1.1. Model Precision
The aggregation of reservoirs could change the effect of actual reservoir operation on streamflow, especially by altering the spatial distribution of streamflow, leading to differences in the calculation of outflow sequences of the compensating reservoir system. To examine the model precision in simulating outflow, the comparison of outflow with and without the aggregation model was conducted. The calculation errors of the five aggregated reservoirs and the entire system are shown in
Figure 6.
In comparison with the actual outflow processes, the average relative errors of simulation by generalization through aggregated reservoirs A–E are 0.89%, 3.17%, 0.74%, 4.59%, and 1.15%, respectively. The average relative error of the entire reservoir system is 1.69%, which is relatively low and validates the precision of the aggregated model simulation.
3.1.2. Computational Effort
The computational effort required for the equivalent joint operation model was compared with that required for the traditional grand optimization model without aggregation. The indexes of the computational effort of the two models, evaluated on a workstation with an Intel i7-10700F CPU and 32 GB RAM, are shown in
Table 3.
3.2. Multiobjective Synergistic Revenue Assessment and Cost Analysis of a Reservoir System
Table 4 presents the corresponding indexes of the downstream compensated reservoirs group under the status quo.
For comparison with the calculation results under the status quo, the synergistic revenue in energy production and operation cost obtained via the multiobjective optimal operation model under different combinational scenarios is shown in
Figure 7, from which the following observations can be made.
a. The synergistic revenue in energy production of the complex multistakeholder reservoirs system increases with operation cost. Under the scenario of being complemented by a single aggregated reservoir, aggregated reservoir B contributes most to the synergistic revenue in energy production, which varies between 0 and 80.41 × 10⁸ kWh.
b. Increasing the number of aggregated reservoirs participating in joint operation can further enhance the synergistic revenue in energy production, but the increment of the synergistic revenue decreases with an increase in the number of compensating reservoirs. The comparison of the average synergistic revenue in energy production under different combinational scenarios reveals that the maximum synergistic revenue of a single aggregated reservoir combinational scenario is 80.41 × 10⁸ kWh, while the maximum synergistic revenue under combinational scenarios with two–five aggregated reservoirs is 90.93 × 10⁸, 98.80 × 10⁸, 102.70 × 10⁸, and 105.04 × 10⁸ kWh, respectively. In comparison with the maximum synergistic revenue in energy production contributed by a single aggregated reservoir, the synergistic revenue increases by 13.08%, 22.87%, 27.72%, and 30.63%, and the incremental increase from each additional aggregated reservoir is reduced from 10.52 × 10⁸ to 2.34 × 10⁸ kWh.
3.3. Multiobjective Joint Operation Strategy for a Reservoir System
The synergistic revenue in energy production of each compensated reservoir under scenario {B} (i.e., the best scenario for a single aggregated reservoir) and combinational scenario {A,B,C,D,E} (i.e., all aggregated reservoirs participate in joint operation) is listed in
Table 5. Among the compensated reservoirs, reservoir
F3 generates the highest synergistic revenue in energy production, accounting for 34.73% and 28.95% of the total under the two scenarios.
The mechanism for generating synergistic revenue in energy production arises from the fact that the compensating aggregated reservoirs provide the storage capacity to regulate the natural inflow process such that optimized streamflow conditions can facilitate energy production in the downstream compensated reservoirs. To analyze the multiobjective joint operation strategy, reservoirs
F5 and
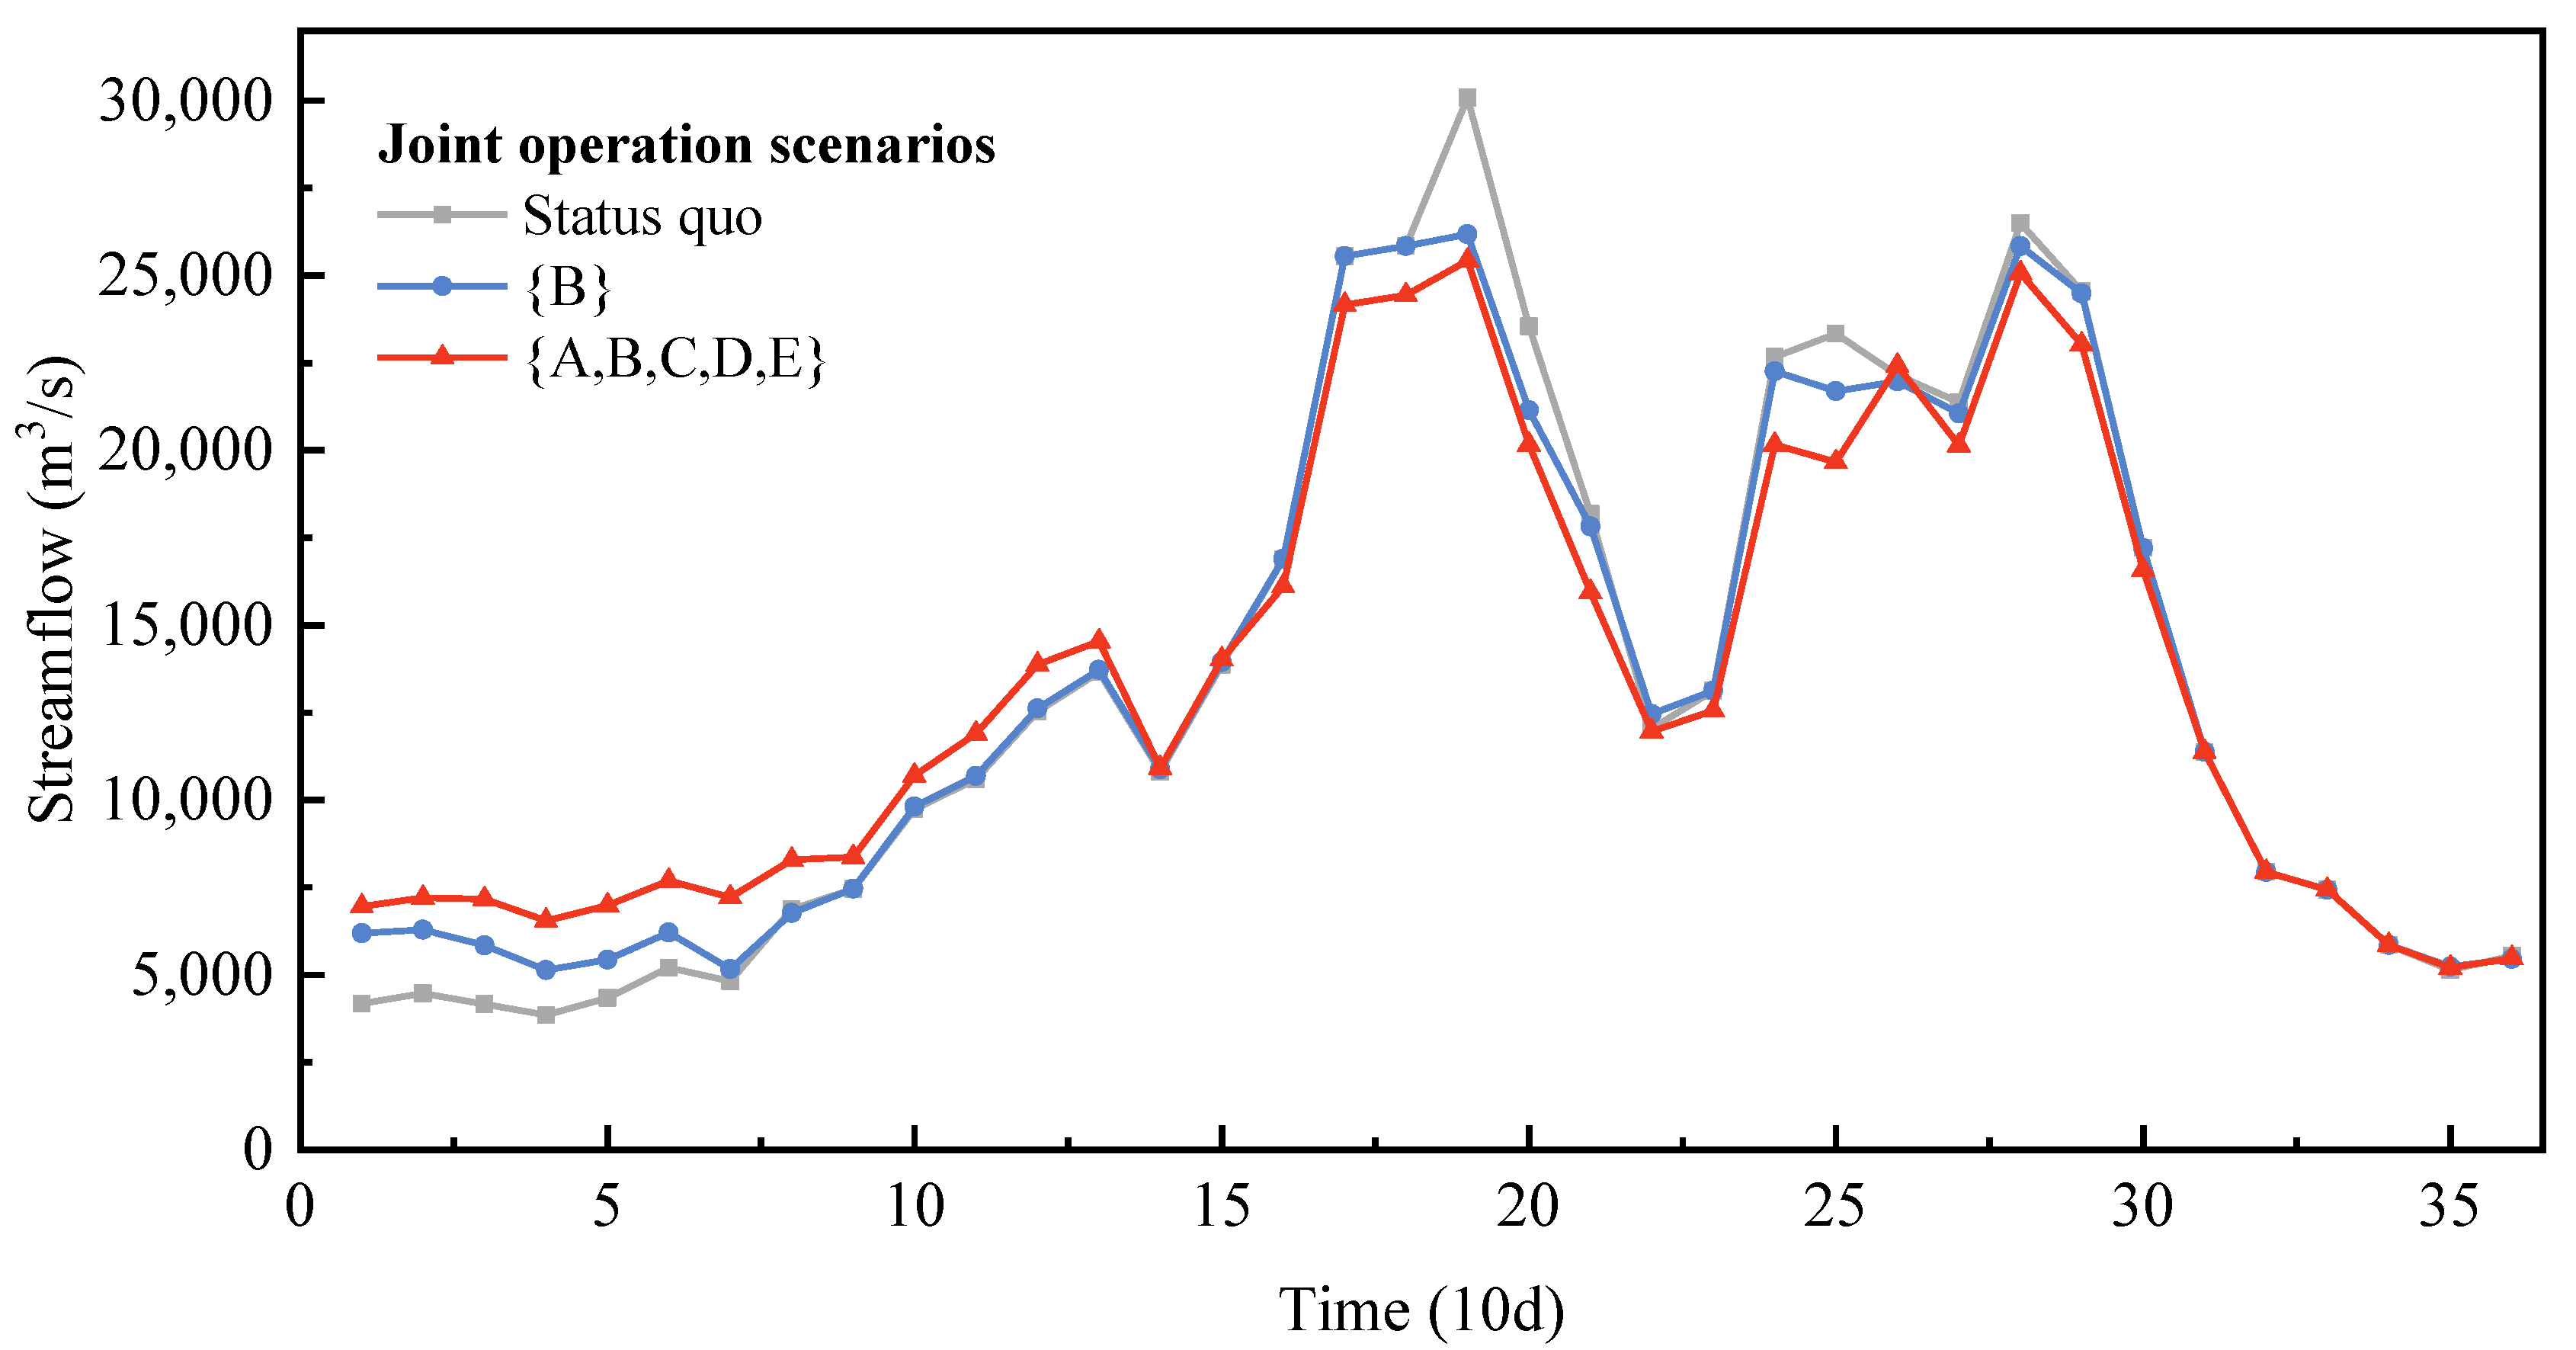
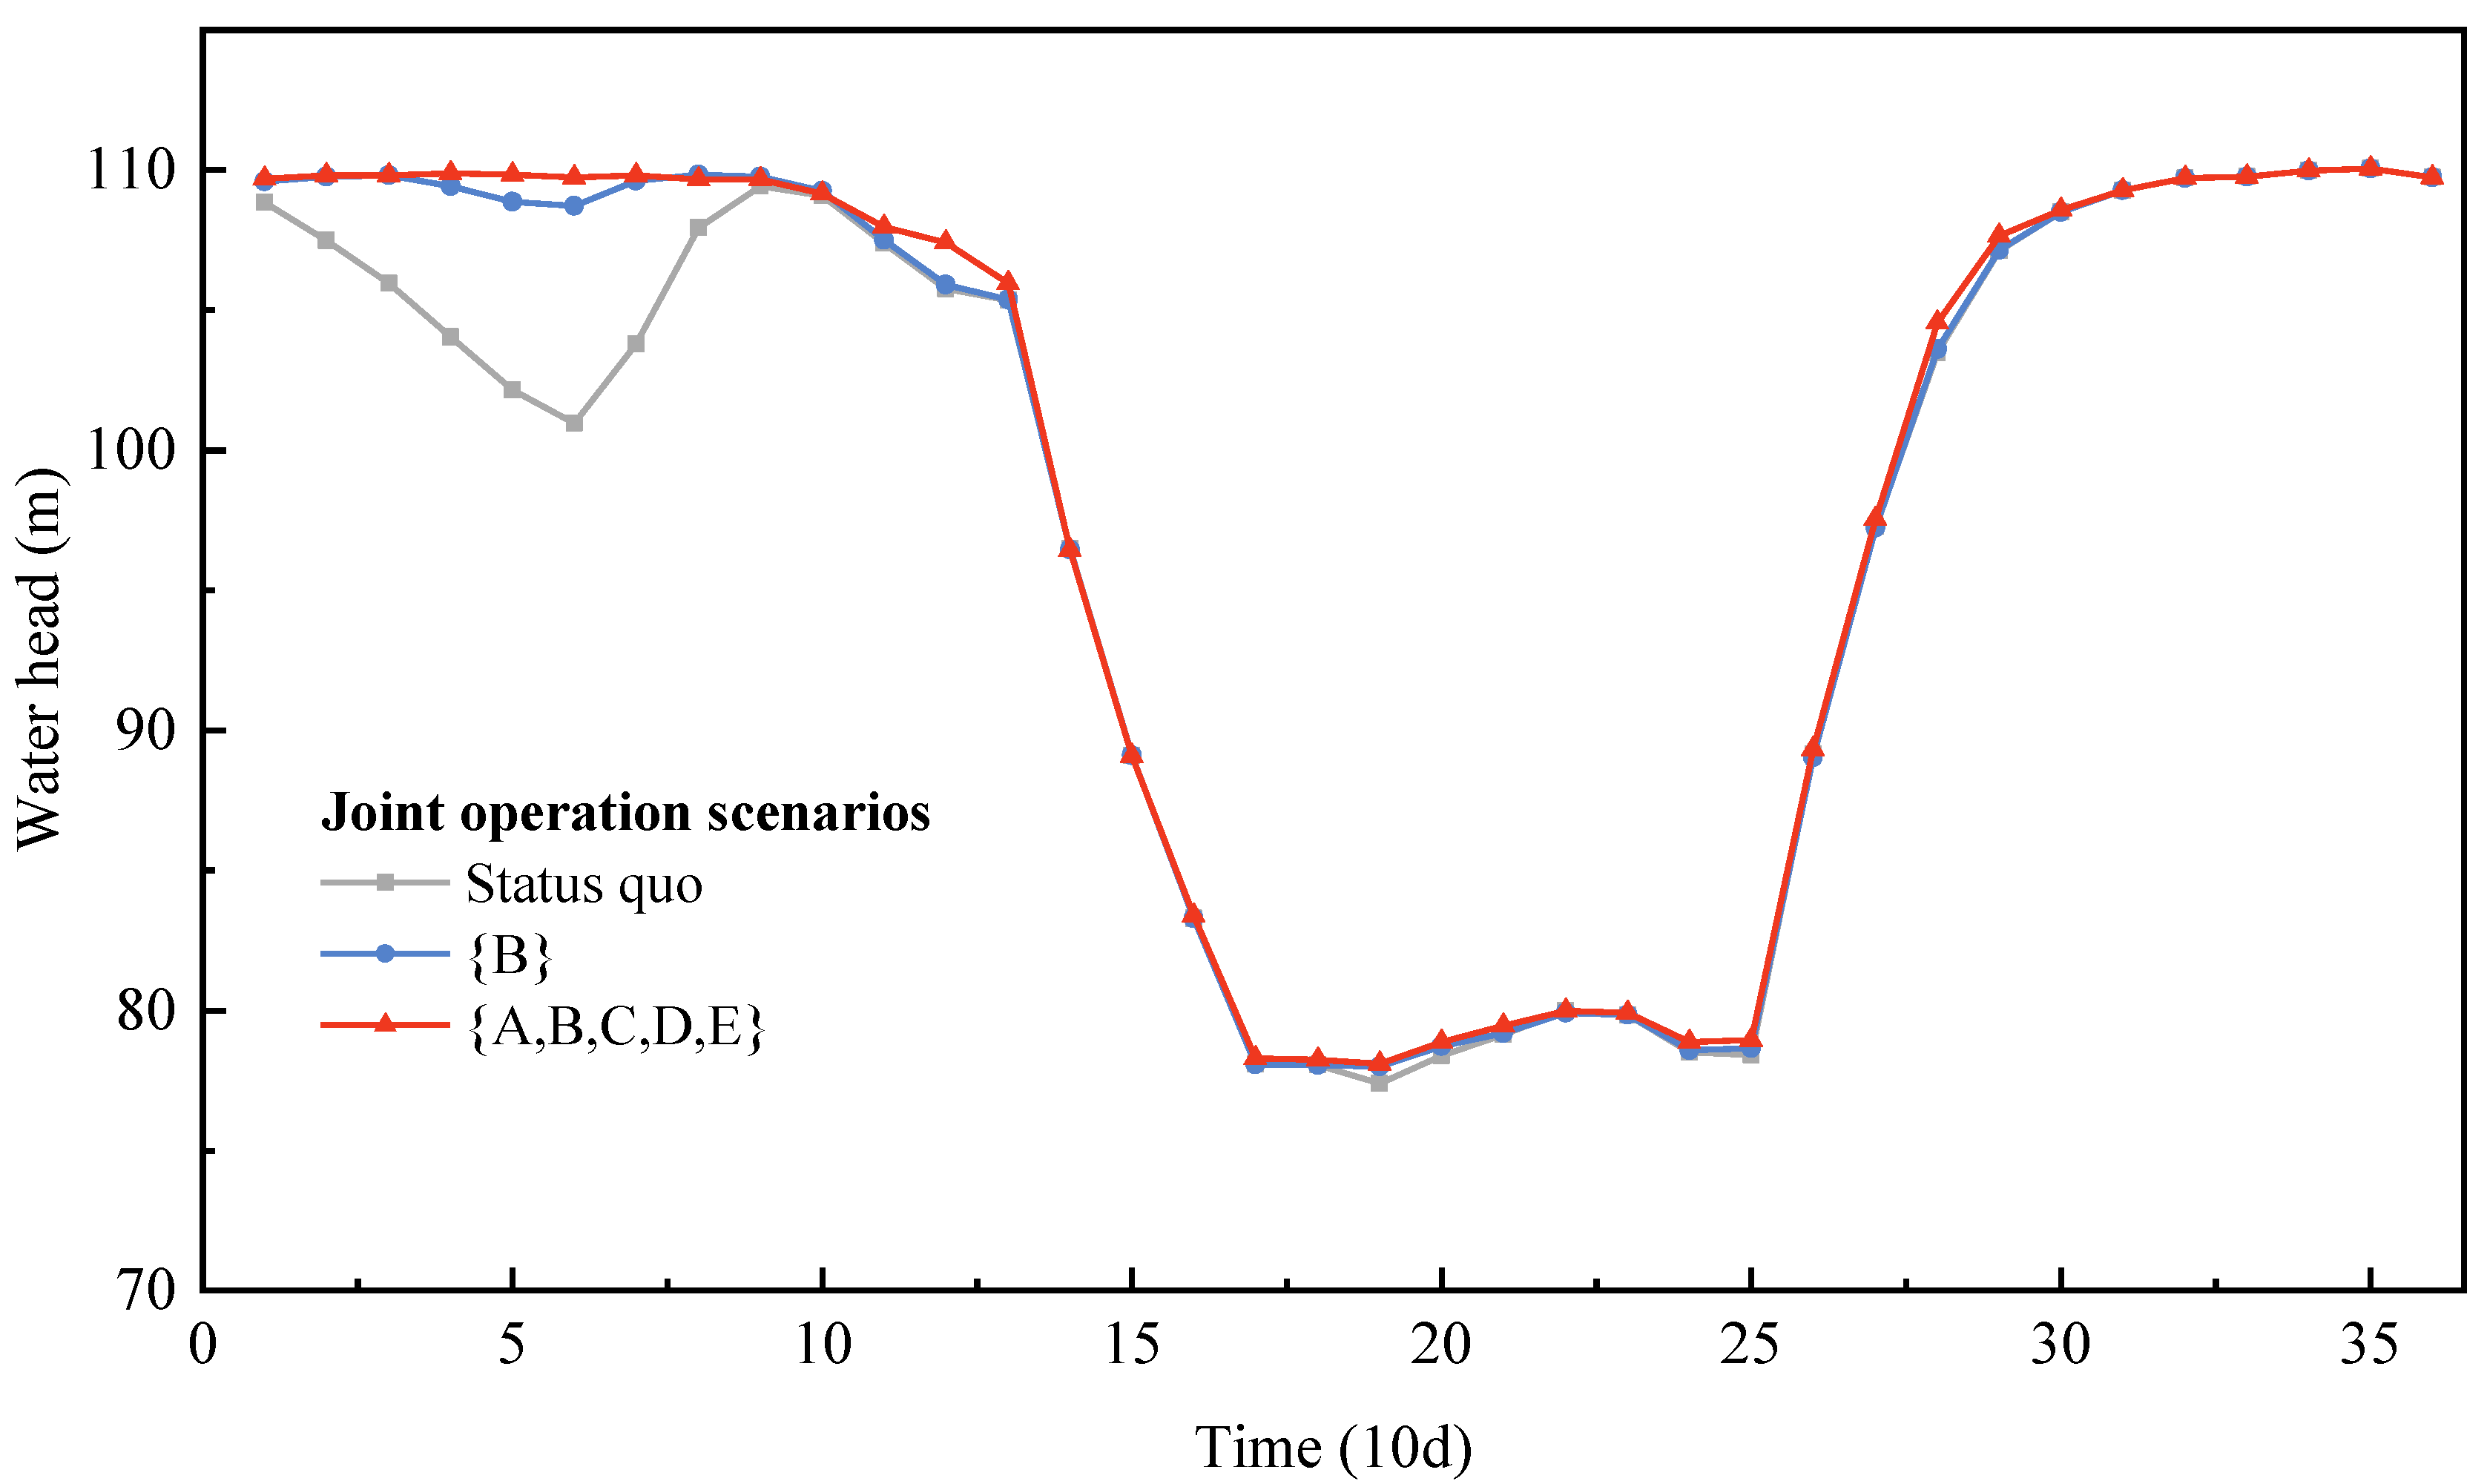
F6, which are most affected by the streamflow regulation of the aggregated reservoirs, are taken as examples. Three scenarios—status quo, scenario {B}, and combinational scenario {A,B,C,D,E}—are selected as typical scenarios. For the three scenarios, the total power output and total synergistic revenue processes in energy production of the compensated reservoirs system are plotted in
Figure 8. The inflow process and the average head process of reservoir
F5 are presented in
Figure 9 and
Figure 10, while the power release processes of reservoir
F6 are shown in
Figure 11.
The synergistic revenue in energy production generated from the joint operation is mainly produced in the preflood season, as seen in
Figure 8. This is because joint operation through the complementarity provided by the aggregated reservoirs redistributes the temporal distribution of streamflow processes, which homogenizes the inflow process of the compensated reservoirs. The homogenization (shown in
Figure 9) enhances the water head and the power release water in the dry season and reduces spillage in the flood season, which improves the overall efficiency in the use of water resources. The results show that current inflow during the dry season (periods 1–14) is increased by 9.24% and 24.89% under joint operation scenario {B} and scenario {A,B,C,D,E}, respectively; correspondingly, the water head of
F5 is increased by 2.51 and 2.86 m (
Figure 10), and the power release of
F6 is increased by 7.91% and 19.98%, respectively (
Figure 11).
Figure 9 also shows that current inflow in the flood season (periods 15–31) is reduced by 2.67% and 7.20% under joint operation scenario {B} and scenario {A,B,C,D,E}, respectively, resulting in a corresponding reduction in spillage by 4.40 × 10
9 and 1.17 × 10
10 m
3, accounting for 6.70% and 17.76% of the total spillage, respectively. Consequently, the synergistic revenue in energy production of the compensated reservoirs system is improved by 80.41 × 10
8 kWh (2.48%) and 105.04 × 10
8 kWh (3.24%).
From the perspective of operation cost, the total outflow process of the aggregated reservoirs and the operation strategy of the compensating reservoir under the three scenarios are shown in
Figure 12 and
Figure 13.
The results show that in providing a more homogeneous outflow process to complement the downstream reservoirs, the storage of the upstream compensating reservoirs is drawn down faster before the flood season to increase the compensating outflow in the dry season, and refilling is postponed to later in the flood season to enhance the refilling process of the downstream reservoirs. Consequently, the outflow process of the aggregated reservoirs during the dry season under the combinational scenarios is substantially higher than that of the status quo, which changes their individual optimal operation strategies to complement the downstream reservoirs. Therefore, the operation cost of the aggregated reservoirs increases.
Figure 13 also shows that the aggregated reservoirs tend to release more water during the dry season when complementing the downstream reservoirs; thus, the total storage is further reduced with the increase in the number of aggregated reservoirs. The minimum storage of the aggregated reservoirs under scenario {B} and scenario {A,B,C,D,E} decreases by 3.49 × 10
9 and 1.59 × 10
10 m
3. Moreover, the postponed refilling of the aggregated reservoirs during the late flood season homogenizes the outflow process temporally, thereby increasing the dry season inflow and the water head of the compensated reservoirs and also providing additional water for their refilling operations.
3.4. Identification of Key River Systems and Aggregated Reservoirs for Achieving the Highest Synergistic Revenues
The analysis in
Section 3.2 shows that when the upstream compensating reservoirs participate in joint operation to increase the overall revenue of middle and downstream compensated reservoirs, the incremental synergistic revenues in energy production decrease as the number of compensating reservoirs increases. Therefore, when considering operating the entire reservoir system under a joint operation, the compensating reservoirs that achieve the highest synergistic revenue in energy production under a certain given cost should be selected preferentially by the downstream compensated reservoirs for realizing cooperation.
To identify the key river systems and aggregated reservoirs with the highest synergistic revenues, and to consider the possibility of generating the most revenue with the participation of the fewest compensating reservoirs, this study used the stepwise elimination method to examine the key combinational aggregated reservoirs (river systems). The stepwise elimination method eliminates one aggregated reservoir from the residual combination set scenario at one time, such that the difference in synergistic revenue before and after the elimination is minimized. By analyzing the subsets via stepwise elimination from the grand combination, the key subset can be successively determined.
To facilitate analysis of the effect of operation cost on the optimal combinational scenario under a given cost, this study divided the maximum change degree in outflow into three levels: low change degree, medium change degree, and high change degree, and selected the typical values of each level (i.e., 50%, 75%, and 95% around) as the degree of change to be investigated. The analysis reveals that the contributed synergistic revenue in energy production of a two-reservoir combinational scenario is more than 85% of the total synergistic revenue in energy production that can be contributed from the grand coalition; thus, the key two-reservoir combinational scenarios are identified. To further analyze the most important influencing factors of the key reservoirs, three basic factors (natural stream flow, reservoir storage, and geographical location) were considered. The key combinational scenarios set under different costs and numbers of aggregated reservoirs are shown in
Table 6, and the natural streamflow percentage to the total inflow and the regulation storage coefficient of the aggregated reservoirs are shown in
Figure 14.
a. Under different change degrees, the key reservoir for a single aggregated reservoir is reservoir B, and the key reservoirs for two aggregated reservoirs are reservoirs A and B. The synergistic revenue in the energy production of aggregated reservoir B under low, medium, and high change degrees accounts for 89.07%, 87.33%, and 80.19% of the total synergistic revenue, respectively, and aggregated reservoirs A and B account for 98.64%, 97.01%, and 88.54% of the total synergistic revenue, respectively. Therefore, under the situation of limited cost and complex cooperative coalitions, the downstream cascade reservoir decision maker might give priority to establishing joint operations with the stakeholders of reservoirs A and B.
b. The aggregated reservoirs with highly controlled streamflow, large storage capacity, and geographical location in the uppermost reaches of the entire reservoir system could contribute substantially to the synergistic revenue in energy production. In particular, reservoirs A and B control the most (25.82%) and second most (24.76%) streamflow to the total inflow of the downstream reservoirs, while the storage capacity of the two reservoirs accounts for 38.56% of the total storage capacity of all the aggregated reservoirs, thereby contributing most to the synergistic revenue in energy production. Moreover, aggregated reservoirs A and B are in the most upstream position within the entire reservoir system. This means that the two aggregated reservoirs can fully regulate the inflow process from the most upstream compensated reservoirs to the downstream, thereby greatly affecting the inflow and synergistic revenue in energy production of the downstream reservoirs.
4. Conclusions
The joint optimal operation of a reservoir system can fully exploit synergistic revenues and improve the efficiency of water resource development and utilization. In a complex multistakeholder reservoir system, the quantitative assessment of the revenue of the downstream compensated reservoirs at the cost of operational change of the upstream reservoirs is a prerequisite for exploring the potential revenue and for formulating the joint optimal operation via stakeholder cooperation. Modeling for revenue–cost quantitative assessment faces the challenges of multiobjective, multistakeholder, high-dimensional, and combinational joint reservoir operation. To address these problems, this study introduced the method of aggregating the compensating reservoirs of different stakeholders based on the topology of the river system. Considering the effect of streamflow regulation via the upstream reservoirs, the operation of aggregated reservoirs was built into the model constraints to improve calculation efficiency without a notable reduction in model precision. Using the epsilon constraint method, the reliability of water supply, ecological protection, and shipping were taken as constraints, while the maximum outflow change degree and the synergistic revenue in energy production were selected as cost and revenue indexes with which to construct a dual-objective joint optimal operation model. By solving the equivalent aggregated dual-objective optimization model, the evaluation of synergistic revenue in energy production and maximum outflow change degree in the outflow of the upstream reservoirs under scenarios of individual and combinational joint operation was conducted. The model significantly improves computational efficiency and reduces the modeling complexity. The main conclusions derived are as follows.
(1) The equivalent aggregated multiobjective joint operation and synergistic revenue–cost assessment model for a multistakeholder reservoir system was constructed, which simplifies the structure of the traditional grand optimization model for a complex reservoir system. The proposed model reduces the need for upstream stakeholder information and significantly improves computational efficiency. In the case study, a large-sized reservoir system (27 reservoirs) was simplified and converted into a small-sized reservoir system (11 reservoirs). The conversion not only reduced the total number of variables by 67.18% and decreased the number of constraints by 39.75%, but it also shortened the computation time by 96.67% without significant loss of precision.
(2) The synergistic increase in the energy production of the reservoirs increases with operation cost, but the increment of the synergistic revenue decreases with an increase in the number of compensating reservoirs.
(3) The compensating reservoirs located upstream of the compensated reservoirs, with high storage capacity and considerable control of the streamflow, contribute high synergistic revenues (e.g., reservoirs A and B in the example) to the downstream reservoirs.
(4) The synergistic revenue from increases in energy production is generated because the storage capabilities of the aggregated reservoirs allow the regulation of their outflow process, which homogenizes the spatial and temporal distribution process of the inflow to the compensated reservoirs. Consequently, spillage during the flood season is reduced, and water resources are used efficiently by the downstream reservoirs, such that the water head, power release, and energy production of the downstream reservoirs increase. This is achieved by increasing the cost of the compensating reservoirs, owing to fast drawdown and postponed refilling for complementing the operation of the downstream reservoirs.


 ,
, 


