Article

Water Physico-Chemical Indicators and Metal Assessment of Teceu Lake and the Adjacent Groundwater Located in a Natura 2000 Protected Area, NW of Romania

1
Department of Chemistry and Biology, Faculty of Sciences, Technical University of Cluj-Napoca, 76 Victoriei Street, 430122 Baia Mare, Romania
2
Research Center in Physical Chemistry, Faculty of Chemistry and Chemical Engineering, Babes-Bolyai University, 11 Arany Janos Street, 400028 Cluj-Napoca, Romania
*
Author to whom correspondence should be addressed.
Water 2023, 15(22), 3996; https://doi.org/10.3390/w15223996
Submission received: 10 October 2023 / Revised: 9 November 2023 / Accepted: 13 November 2023 / Published: 17 November 2023

Abstract

:
This study closely analyzes the water quality dynamics of Teceu Lake, situated in a Natura 2000 protected area in Romania. The research investigates seasonal variations and interconnections with groundwater, assessing various ecological impacts. The main physico-chemical indicators of water, such as electrical conductivity (EC), dissolved oxygen (DO), oxygen saturation (OS), temperature, pH, turbidity, ammonium concentration (NH4+), nitrates (NO3), nitrites (NO2), orthophosphates (PO43−), water hardness, alkalinity (A), and chlorides (Cl), were measured over the January–December 2022 period. Metal concentrations for both major metals (Na, K, Ca, Mg, Al) and trace metals (Li, Ga, Fe, Mn, Pb, Cu, Zn, Ni, Ti, Mo, Sr, Ba) were assessed. The evolution of the physico-chemical indicators revealed an increase in nutrient compounds (ammonium and phosphates) during the spring and autumn months. The EC values ranged from 180–444 μS/cm for the lake and 1575–2480 μS/cm for groundwater. The pH values (7.12–7.96) indicated a slightly alkaline environment. DO levels (6.79–11.21 mg/L) indicated good water quality. Chlorides exceeded levels in drinking water in some instances. Water hardness varied due to pH, temperature, and atmospheric pressure. Metal composition revealed diverse levels of aluminum, barium, nickel, copper, zinc, and manganese, which carries implications for environmental and human health. The water quality index (WQI) score, which is based on major ions, indicated that 93% of the groundwater samples were classified as excellent and good for drinking. WQI, based on the main physico-chemical indicators, revealed that 79.17% of the Teceu Lake-water samples and 41.66% of the groundwater samples gathered were classified as good quality; the difference indicated poor quality, especially in autumn. Q- and R-mode cluster analyses revealed distinct clusters for seasonal months and sampling points, suggesting shared sources and geological influences. Notable connections between physico-chemical indicators and metal content were identified, emphasizing the need for a tailored conservation strategy. Correlation analyses highlighted both positive and negative relationships between metal pairs. Understanding these parameters is vital for water resource management and preserving biodiversity in the region. The results of this study are important for monitoring pollution in Lake Teceu and might prompt local communities and authorities to take measures to reduce and prevent pollution.

1. Introduction

Water, access to which is a fundamental human right, is integral to every facet of sustainable development. It also plays a central role in adjusting to the obstacles presented by climate change, acting as the essential bridge between the climate system, human society, and the environment [1]. In the absence of effective water management, the potential for heightened competition over water resources among different sectors grows, exacerbating a variety of water-related crises [2,3]. The increasing demand for water is a direct consequence of rapid population expansion, urbanization, and the escalating requirements of agriculture, industry, and energy sectors. Natural pollution (biological processes, precipitation, ion exchange, and dissolution) and anthropogenic pollution can influence and alter the chemical composition of water [4,5,6]. Additionally, at a global level, approximately 80% of wastewater is discharged back into the ecosystem without being reused or undergoing proper treatment [7]. Heavy metals are arguably one of the most common water pollution sources, with their release from wastewater leading to environmental depletion, which affects aquatic and human life [8]. Given their non-biodegradable nature, heavy metals have the capacity to accumulate across various components of both the environment and living organisms. Within wetland ecosystems, the presence of heavy metals extends to rivers, lakes, sediment layers, plant life, and other organisms, underscoring their widespread distribution [9]. Alongside heavy metals (Ag, Cd, Cu, Co, Cr, Zn, Hg, Mn, Mo, Ni), other sources that need to be discussed are inorganic contaminants (NO3, NH4+, PO42−), organic contaminants (benzene, chloroaniline, methylene blue, phenol, toluene), and metalloids (As, B, Si, Te), as well as microorganisms (Escherichia coli, Staphylococcus aureus) [10].
All these pollutants must be carefully monitored as they are detrimental for both human life and the environment. For example, arsenic is a carcinogenic metalloid that can be found in the environment as a result of geogenic sources and anthropogenic activities, as well as through water–soil interactions occurring in aquifers [11]. Health problems caused by drinking water with elevated concentrations of arsenic include liver, lung, and skin cancer, as well as hematological, renal, or respiratory diseases [12]. Cadmium, which is also toxic, is present in wastewater resulting from the manufacture of batteries and cadmium-based pigments [13]. Due to its severe toxicity, its monitoring is extremely important because it affects the ecosystem and health issues such as kidney disorders, bronchitis, respiratory diseases, and reproductive problems [14]. While indispensable to plant metabolism, nickel is dangerous to most plants when present in high concentrations due to the industrial refining of nickel, smelting, and electrolysis [15]. If plants in a specific ecosystem are affected, that entire ecosystem can suffer a downfall. In humans, nickel can cause allergies, kidney and heart problems, pulmonary fibrosis, and even lung and nasal cancer [16]. Aluminum is an amphoteric element so, in waters with high pH, it can appear in high concentrations due to natural or anthropogenic causes [17]. Chromium is a heavy metal present within the environment due to various anthropogenic activities, mostly mine-related [18]. The consumption of water with a high level of chromium can induce carcinogenic effects, affect the eyes, irritate the skin, and cause gastrointestinal abnormalities [19]. While essential for the effective functioning of many significant enzyme systems, in high doses, copper is especially dangerous for people suffering from Wilson’s disease, as copper accumulates in the liver, brain, and eyes [20]. Manganese is also an essential element, necessary for the metabolism of carbohydrates and proteins; however, in high concentrations, it can present a problem for health [21]. Zinc, another vital trace element, exerts toxic effects that influence health when present in excessive concentrations, leading to cardiovascular disease and cancer, preventing the absorption and stability of the co-enzyme involving trace elements, which can lead to dizziness and fatigue [22]. Among the most toxic of metals, lead can be found in wastewater from the battery, cosmetic, and paint industries, leading to damage to the nervous system, especially in children, as well as anemia, kidney failure, cerebral edema, and liver cirrhosis [23]. Found in sewage and solid waste, iron also needs to be heavily monitored as it can attack human cells [24]. Mercury is recognized as being one of the most harmful heavy metals due to its profound biological impact. After seeping into water, mercury tends to settle in sediments, causing significant ecological risks and seriously affecting human health (it is associated with disorders of the reproductive system, genotoxicity, endocrine disruption, and cancer) [25]. Hence, its monitoring is essential for evaluating the extent of water pollution, which provides valuable information about water and environmental pollution. Muhammad et al. [26] indicated that the presence of elevated concentrations of heavy metals in water may be caused by natural processes (i.e., weathering or erosion of bedrocks and ore deposits) or by human activities (i.e., mining and industrial activity, wastewater irrigation, and other agricultural activities).
With a projected 40% deficit in freshwater resources by the year 2030, combined with an increasing global population, the world is on a trajectory towards a widespread water crisis [27]. Acknowledging the mounting issue of water scarcity, the United Nations General Assembly initiated the Water Action Decade on 22 March 2018. This initiative aims to rally efforts that can lead to transformation in the ways people approach water management.
In this study, a comprehensive analysis of water quality dynamics in Teceu Lake, Romania, was conducted. It explored seasonal variations and interconnections with groundwater. Concurrently, ecological impacts were assessed, underscoring the need for pragmatic conservation measures in the vicinity of the lake.
Lake Teceu is located in Teceu village, Remeți commune, and is part of a Natura 2000 protected area. The protected area hosts a large biodiversity including water bird species, fish, amphibians, and beavers. The lake was formed in an abandoned channel of a meander of the Tisa River, which flows in its vicinity. There are trees and dense vegetation forming a natural wetland in the vicinity, providing a breeding area for threatened birds and spawning grounds for many fish species that are important for both nature and biodiversity conservation in the area. More recently, beavers populated the area. Lake Teceu plays an important role in storing excess water when the Tisa River overflows, which helps to maintain soil moisture around the lake. At the same time, Teceu Lake is a place of recreation for residents, tourists, and fishermen; however, its water is exposed to human influence due to the discharge of untreated water and the use of chemical fertilizers in agricultural crops (maize, potatoes, vegetables, and fruit trees) in the vicinity of the lake. Therefore, knowing the level of pollution present here, in detail, is important for taking the necessary measures to maintain water quality and prevent further contamination. A previous study [28] on a water body within the Natura 2000 area, in this case the Remeți stream, revealed notable water quality issues, namely increased ammonium, orthophosphates, and dissolved iron. Seasonal variations revealed worsening trends, particularly in autumn. Calculated water quality indices (WQI) indicated deterioration, urging immediate action from local authorities to address pollution and safeguard human and ecosystem health. The intricate interconnection of water bodies in a given area heightens the likelihood of pollution infiltration. When a water body is contaminated, there is significant potential for pollutants to permeate the underlying aquifer, amplifying the risk of contaminating adjacent water bodies. Another study, with a focus on private wells used for drinking water sources in the Remeți locality, identified high concentrations of ammonium and nitrate, highlighting potential pollution processes [29]. These findings emphasize the importance of monitoring and managing groundwater resources for sustainable use, especially in environmentally sensitive areas like this protected region in Romania. Deterioration in water quality coupled with a depletion in oxygen levels, the occurrence of algal bloom, and the decline in fish populations, are all among the challenges associated with eutrophication, as highlighted by Valor and Tokatli [30]. These factors, of course, lead to severe impacts on biodiversity.
The groundwater studied in this paper is in connection with Teceu Lake through the aquifer. Therefore, for the purpose of this study, samples of a groundwater source located in the proximity of Teceu Lake were also collected. The aim was to see the degree to which indicators of the water quality of the lake water were in connection with those of the groundwater table in its proximity. The physico-chemical parameters used to assess water quality were monitored over 12 months, January–December 2022. These were electric conductivity, pH, dissolved oxygen, turbidity, oxygen saturation, water temperature, nitrate concentration, ammonium ion concentration, chloride concentration, alkalinity, nitrite concentration, total hardness, and orthophosphate concentration. Data were gathered by collecting samples of lake water at two points: at the lake’s entrance and at the far edge of the lake, close to the dam built to protect the locality against flood episodes in the Tisa River. The concentration of 22 major and trace elements present in the water was analyzed in May 2022 in a single sampling campaign: Al, Li, Ba, Na, K, Mg, Ca, Ga, Rb, Sr, Cu, Mn, Fe, Ni, Zn, Ti, Mo, As, Pb, Hg, Cd, and Cr. The findings of this study hold significance for the monitoring of pollution levels in Lake Teceu, Romania. They provide key insights that can guide local communities and authorities in implementing essential measures to mitigate the pollution in its vicinity. These actions are essential not only for safeguarding human health but also for preserving biodiversity within the protected region. This study supports local authorities to expedite the remedial measures necessary for protecting the water quality of the Natura 2000 region, which is an essential factor in supporting environmental quality and biodiversity in the area. Based on the findings of this study, urgent and strict action from relevant authorities is required to prevent the uncontrolled discharge of effluents. Additionally, protecting Teceu Lake and its tributary from further deterioration is highly recommended from an economic point of view. The results of this study will be valuable in developing new conservation guidelines for both the biological and ecological diversity of lakes and the surrounding regions. Moreover, the data set could be used successfully in obtaining management instruments for the sustainable usage of water resources.

2. Materials and Methods

2.1. Study Area

Teceu Lake is positioned in the Teceu locality, Remeți commune, in the north-eastern part of Maramureș County near Tisa River (Figure 1). The lake is close to the dam built to protect the residential area from Tisa River floods. Teceu Lake is part of the Natura 2000 protection area along the Tisa River. It is surrounded by trees and rich vegetation and is also covered by aquatic plants. Two sampling points were selected: TL1, at the entrance of Teceu Lake, at a point that is fed by a stream; and TL2, at the opposite edge of the lake, at a point close to the protection dam. The potable groundwater source is located in Teceu, near the road; this is a water source for the Teceu residents.

2.2. Water Sampling and Analysis

Physico-chemical parameter analyses were completed within 48 h of sampling. Water samples, collected in clean polyethylene containers per standard guidelines to prevent contamination, were stored in a refrigerator until analyzed [31,32]. This process was performed in triplicate. Fieldwork and analysis were conducted in 2022. Portable devices were utilized to assess various indicators of water quality.
Electrical conductivity and pH were measured according to standards [33,34]. EC was assessed using a WTW INOLAB 740 conductometer (WTW, Weilheim in Oberbayern, Germany). pH was determined with an HI 253 Hanna Instruments pH meter equipped with a combined pH electrode (Hanna Instruments, Woonsocket, USA) [31]. Dissolved oxygen was determined by back titration with potassium permanganate after the addition of oxalic acid [35]. Oxygen content and saturation were determined according to standard [36]. Alkalinity was measured according to standard [37]. Chloride concentration was measured by precipitation titration with silver nitrate according to standard [38]. Total hardness (ht) was determined by the EDTA titrimetric method according to standard [39].
Aluminum was analyzed with a Specord 50 Analytik Jena UV–VIS spectrophotometer (Analytik Jena, Jena, Germany) [40]. Al3+ was measured after sample filtration with membrane filters (pore size 0.45 μm) and acidification with nitric acid (65%, Merck, Germany,) to a pH of 1.2–1.5. The detection limit for Al3+ is 2 μg/L [31]. Ammonium was measured spectrophotometrically according to standard [41]. Nitrates were analyzed by spectrophotometric methods [42]. Nitrites were measured with a Specord 50 Analytik Jena UV–VIS spectrophotometer by diazotizing with 4-amino-di-benzene-sulfonamide and coupling with N-(1-naphthyl) ethylenediamine dihydrochloride, with absorbance measured at 540 nm [43]. Phosphates were determined according to standard [44]. Dissolved iron was evaluated through standard [45]. The turbidity of the water was gauged using the WTW 355 IR portable turbidimeter [46]. Prior to each round of measurements, all portable devices were properly calibrated [31].
Water samples were preserved with a 1:1 HNO3 solution until an acid pH of 1–2 was achieved. Subsequently, samples were digested with concentrated HNO3 (70%) and 30% hydrogen peroxide. The digested samples were dissolved in concentrated HNO3, diluted with filtered ultrapure water, further diluted to 100 mL with an acid solution, and stored at 4 °C until analysis [31]. For samples analyzed using a graphite furnace, preparation involved filtration and acidification with 0.5 mL of concentrated HNO3 for every 100 mL of sample, excluding the mineralization stage [31].
Metals such as Ca, Mg, Fe, Mn, and Zn at ppm levels, were analyzed using flame absorption atomic spectrometry (FAAS) on a Perkin Elmer AAnalyst 800 spectrophotometer (Perkin Elmer, Norwalk, CT, USA) equipped with flame and graphite furnace atomizers. Metals at trace levels (lg/L), such as Cu and Ni, were analyzed by graphite furnace atomic absorption spectrometry (GFAAS) using a pyrolytic platform [31]. The spectrophotometer, equipped with hollow cathode lamps specific to each analyzed metal and a continuous background correction system, utilized an air-acetylene flame for samples at ppm levels and a graphite furnace for samples at trace levels [31]. Calibration with standards, and data quality control and assurance, were carried out following standard operating procedures, including triplicate analyses of each sample and parallel measurements of blanks.
Results were expressed as mean values based on three independent replicates. Analytical-grade reagents and certified 1000 ppm standard metal solutions were used for calibration and standard preparation [31].

2.3. Data Analysis

2.3.1. Cluster Analysis

The collected data underwent analysis using Excel (Microsoft Office 2021, Microsoft Corporation, Washington, DC, USA) and Statgraphic CS Technologies software (Centurion 19, 2023, The Plains, VA, USA). This involved conducting descriptive statistical analysis and correlation analysis (using Pearson linear correlation coefficients) among the various water quality parameters.
Additionally, cluster analysis (CA) was carried out. CA aimed to categorize the collected water samples based on their similarities in terms of the analyzed physico-chemical characteristics and their metal content. Two modes of cluster analysis were employed: Q-mode and R-mode. Q-mode cluster analysis was utilized to identify clusters of observations, specifically the most similar sampling months throughout the monitoring interval. R-mode cluster analysis was applied to ascertain correlations among variables, specifically the metal concentrations of Teceu Lake water and the adjacent potable groundwater source.

2.3.2. Water Quality Index, WQI

A useful tool in assessing the quality status of water is the WQI method. WQI (water quality index/indices) is a classification procedure that aims to cover the influence of a series of individual physico-chemical water indicators on water quality [47,48,49,50,51]. By using WQI, a large number of water quality data are converted into single numerical data, which assesses the global quality of water and is useful in showing the tendencies of water quality over time or the differences between some specific water bodies. WQI were computed based on the standard values of drinking water, considering Teceu water as a possible potable source due to its connectivity with the aquifer. The quality indices were calculated based on nine water characteristics: EC, pH, dissolved oxygen concentration, turbidity, ammonium concentration, nitrates, nitrites, chlorides, and phosphates. Dissolved oxygen was included in the physico-chemical parameters due to its importance for aquatic life.
WQI were computed by using Equations (1)–(3) according to previous studies [28,29,48,49,50]:
W Q I = i = 1 n Q i × W i i = 1 n W i
where Qi is the quality rating of the ith chemical indicator calculated according to Equation (2)
Q i = C i V i p v V i × 100
where Ci is the measured value of the ith physico-chemical parameter and Vi is the ideal value of the chemical indicator. Vi = 0 for all applied indicators except for pH, for which the ideal value is VpH = 7, and for dissolved oxygen, for which the ideal value is 14.6 mg/L according to Napo et al., 2021 [51]; n is the total number of considered indicators (n = 9 in this study).
Wi is the weightage factor of each physico-chemical indicator, calculated by Equation (3)
W i = k p v
pv is the parametric value established by the Council Directive [52] for drinking water, or the standard value shown in Table 1 [50,53,54], and k is a proportionality constant taken as one (k = 1) [28,29,50]. For the concentration of dissolved oxygen, the pv ideal for aquatic life, i.e., 5 mg/L, set by WHO [55], was considered. The relative weight was calculated by dividing Wi with the sum of all Wi.

2.3.3. Human Health Risk Assessment

Human health risk assessment was conducted by computing the average daily dose via ingestion, ADD (mg/kg day), hazard quotients (HQ), and the hazard index (HI). These risk indices were applied for NH4+, NO3, and Mn, for which the studied water samples indicated high concentrations. ADD was calculated using Equation (4), according to literature [47,51]:
A D D = C × I R × E F × E D B W × A E T
C: the average concentration of a pollutant in surface or groundwater (mg/L);
IR: ingestion rate per time (2 L/day for adults);
EF: exposure frequency (365 days/year);
ED: exposure duration (30 years);
BW: body weight, an average of 85 kg for males and 72 kg for females for Romanian people [56]
AET: average exposure time (ED × 365).
The hazard quotients for the considered pollutants of water were computed according to Formula (5)
H Q i = A D D i R f D i
where RfDi is the reference dosage via oral ingestion.
RfDi is the reference chronic oral dose and is an estimate of the population’s daily oral exposure level and the maximum tolerable daily intake of element “i”, i.e., the water pollutant component that does not result in health impairment [47,51]. The RfD expressed in mg/kg/day are 0.97 NH4+, 1.60 NO3, and 0.14 Mn, respectively [47,51].
Human health risk assessment for more toxic pollutants can be quantified using the hazard index through oral ingestion or HI, calculated as the sum of all hazard quotients HQi according to Equation (6).
H I = i = 1 n H Q i
Water that is characterized by HQ values greater than 1 (HQ > 1) endangers the health of the population through the consumption of such water for drinking purposes [47,51].

3. Results and Discussion

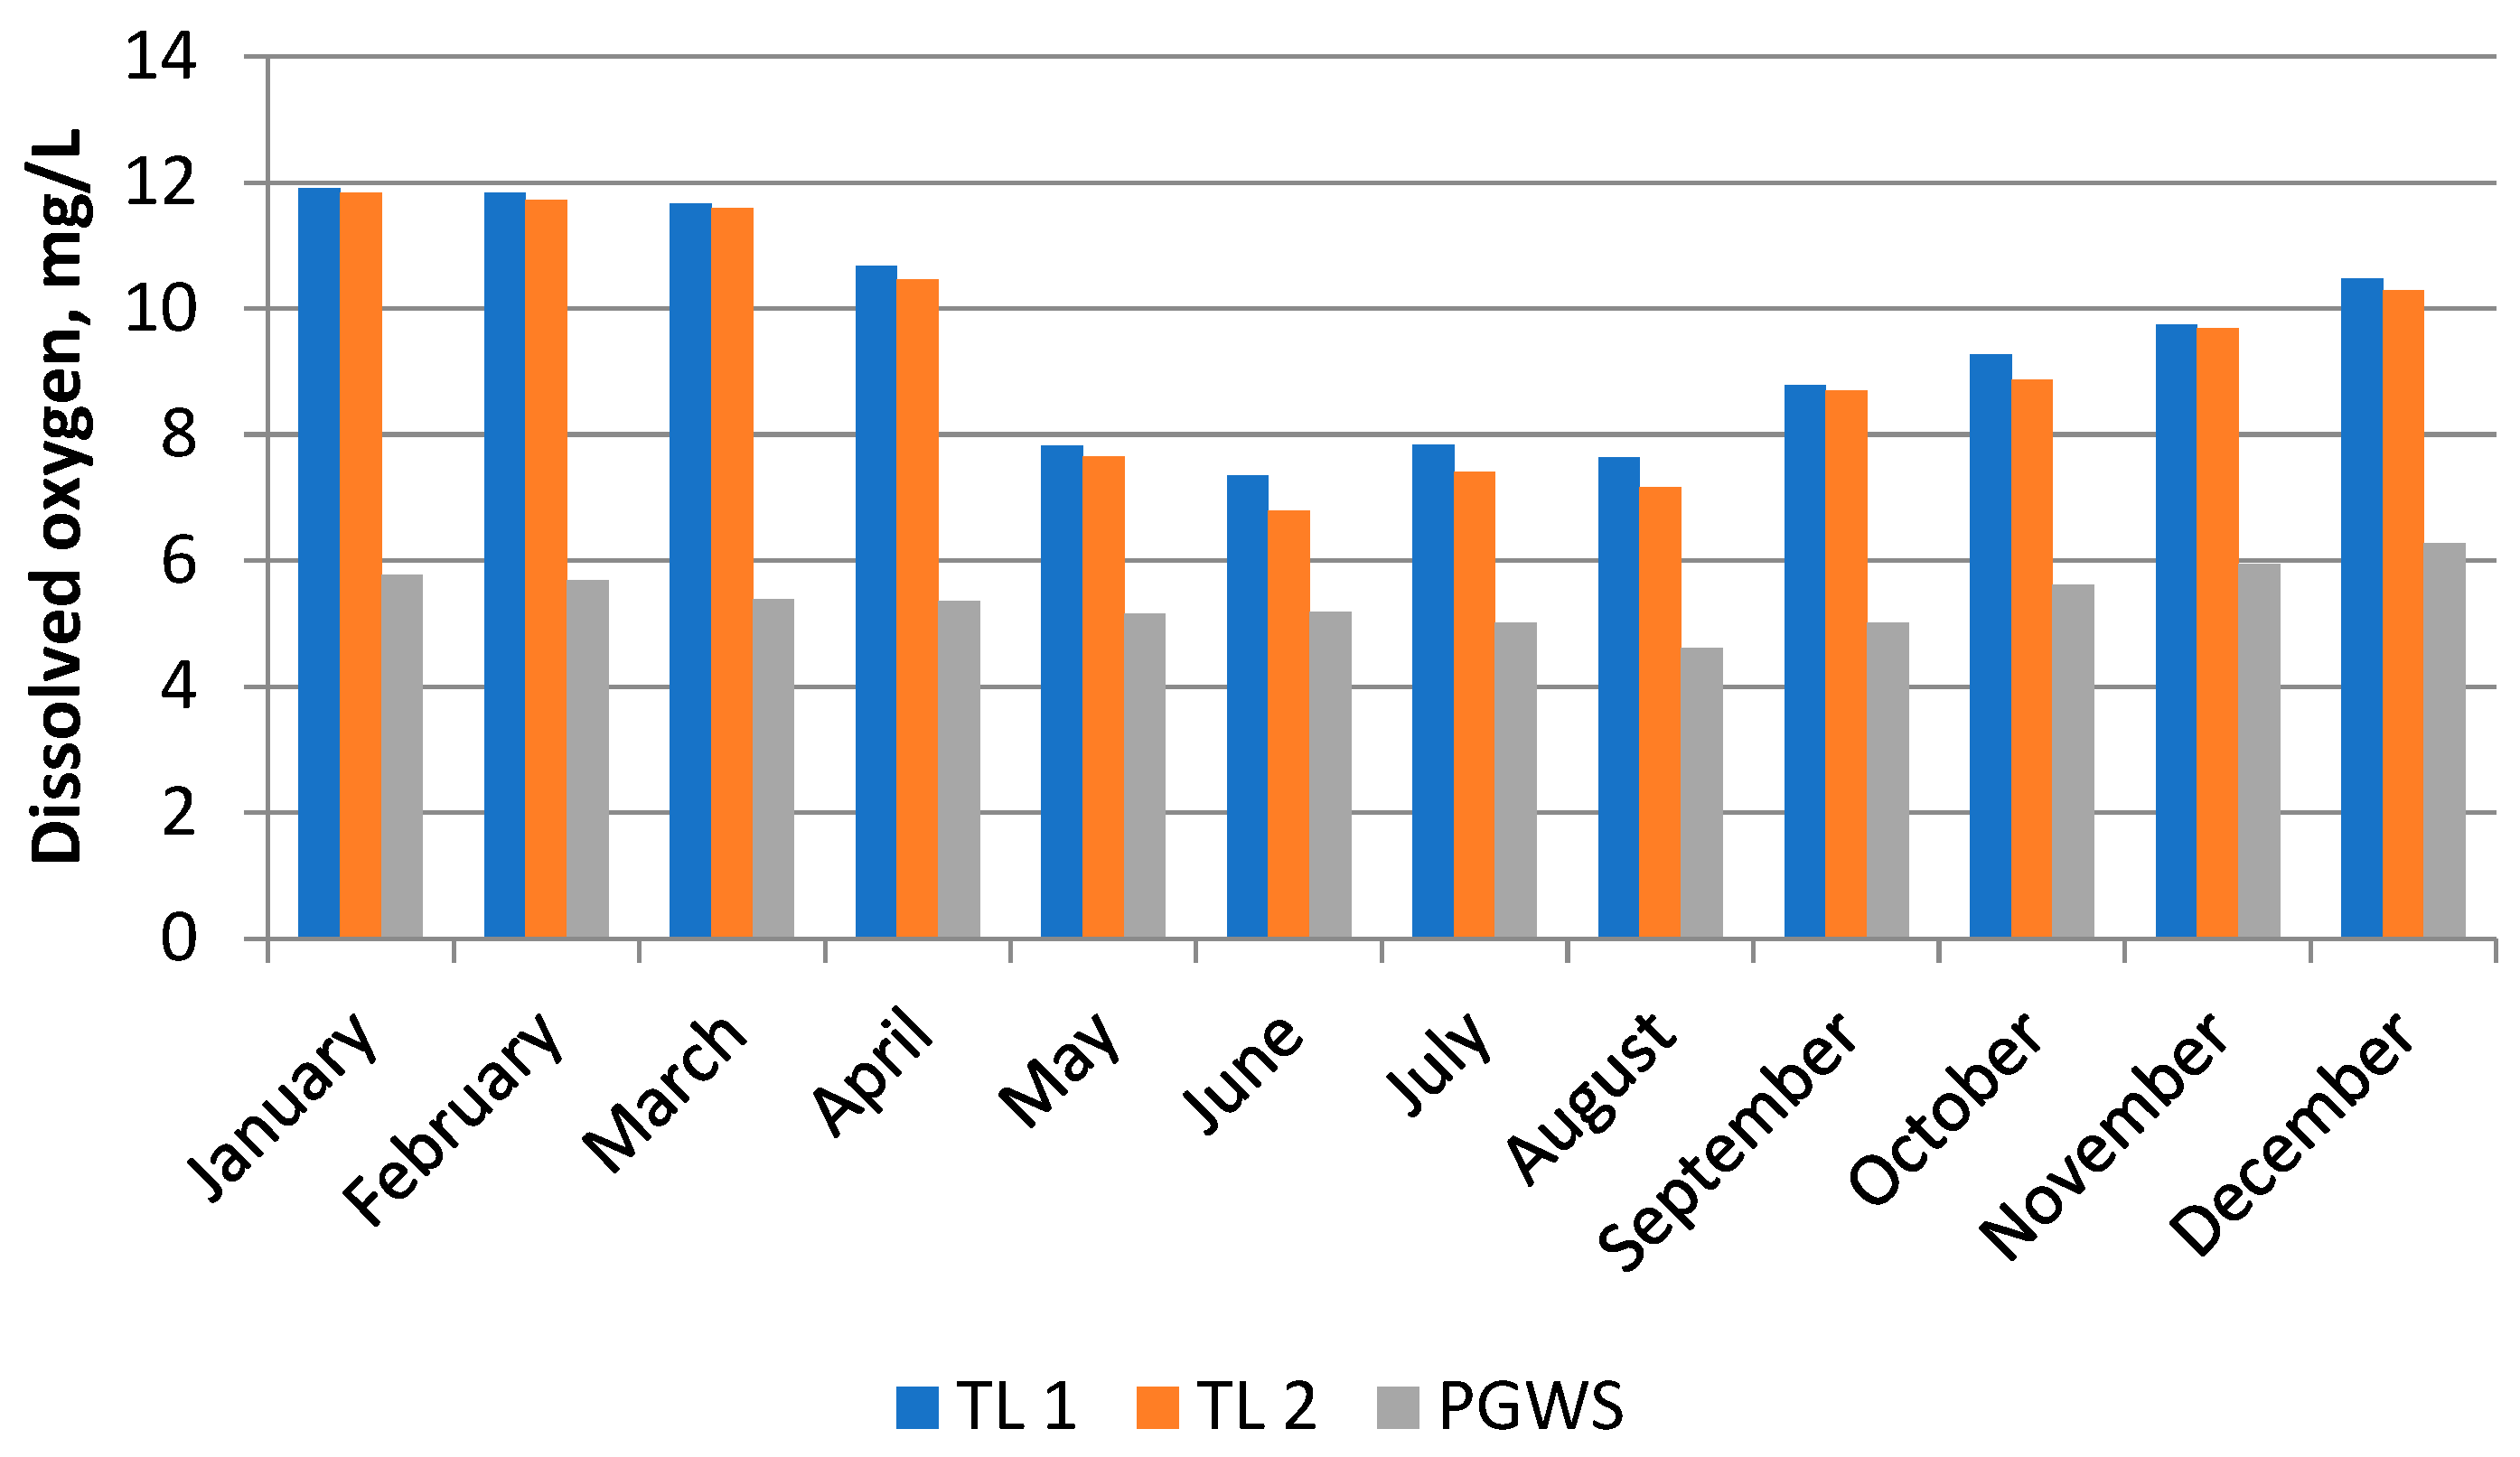
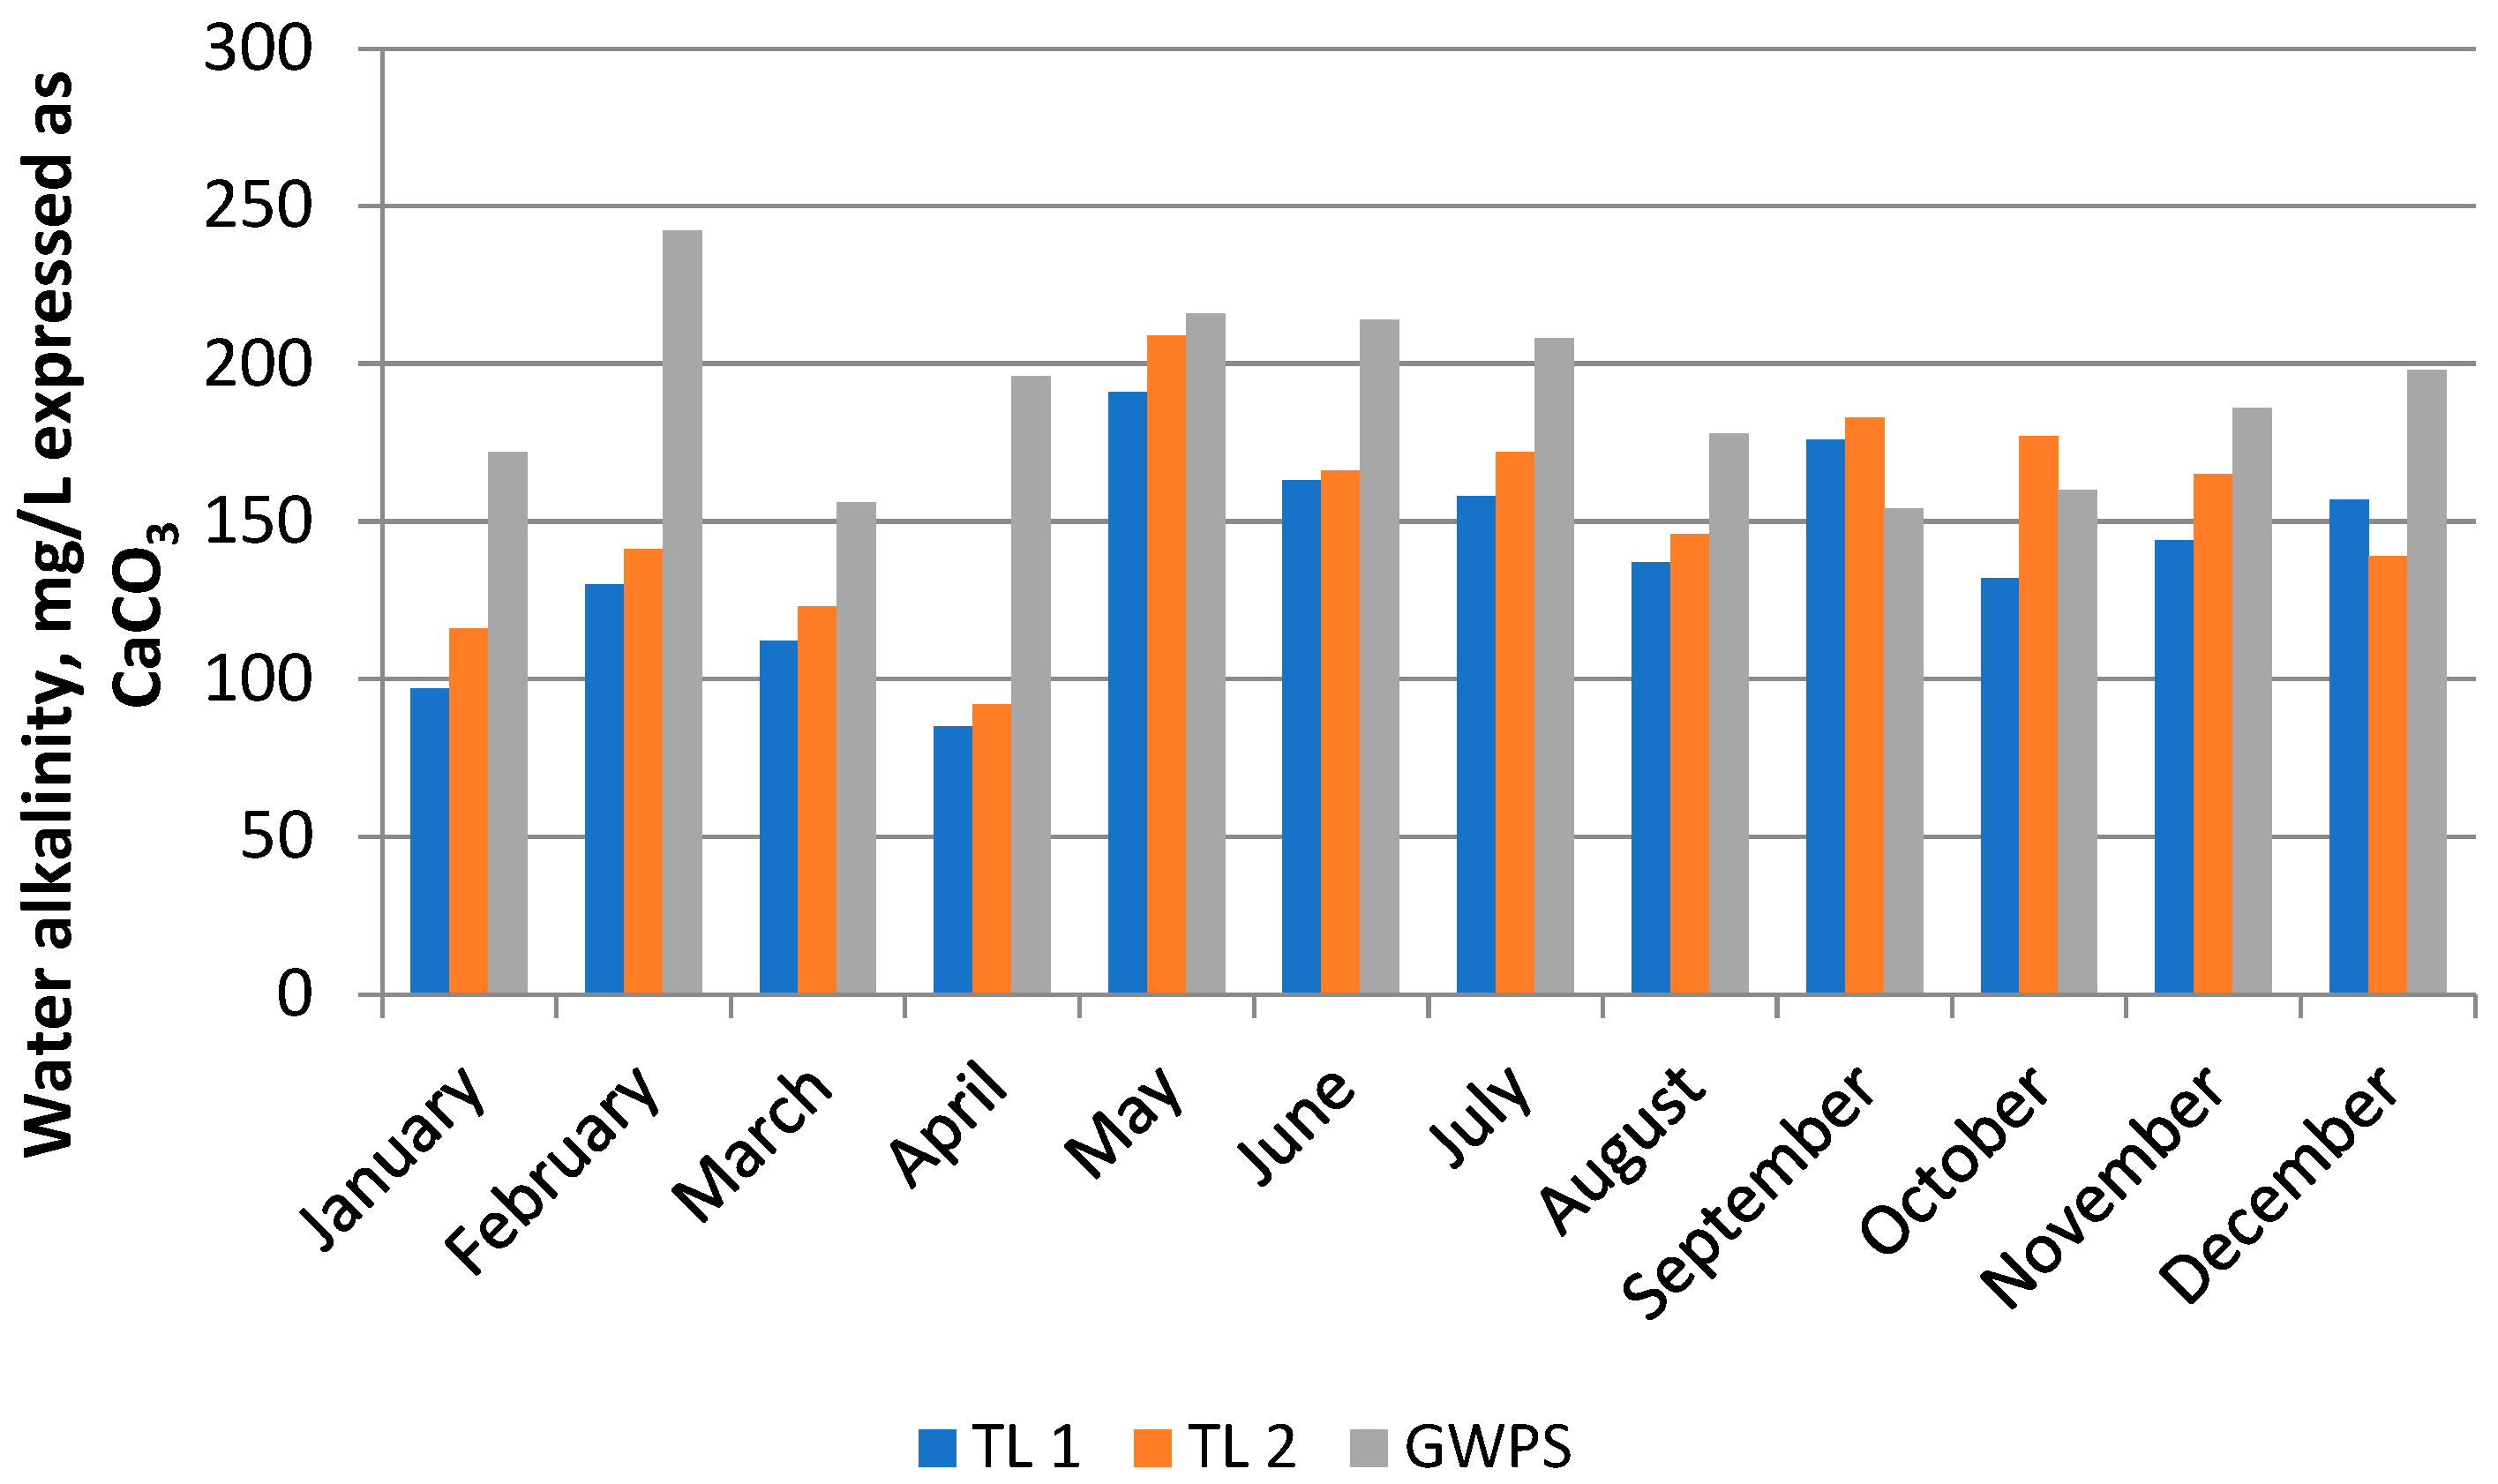
3.1. Physico-Chemical Indicators of Water Samples

Table 2 illustrates the average values of the physico-chemical parameters of studied water samples; Figure 2, Figure 3, Figure 4, Figure 5, Figure 6, Figure 7, Figure 8, Figure 9, Figure 10, Figure 11 and Figure 12 present the evolutions of these parameters during the months of 2022.
The electric conductivity (EC) of water serves as a key indicator of purity across various industries, while also functioning as an estimator for the collective amount of dissolved salts or ions in water [57]. Substantial variations in conductivity may stem from natural factors such as flooding or evaporation, as well as human-induced pollution, all of which pose significant risks to water quality. For this study, the values of the EC (Figure 2) of lake water were relatively low while the EC values for the groundwater potable source were higher, though still lower than the maximum allowable limit of 2500 μS/cm. The EC values of the lake samples varied in the range of 180–444 μS/cm for TL1-Teceu Lake and 192–463 for TL2-Teceu Lake. In the case of the potable water source, higher values, varying from 1575 to 2480 μS/cm, were registered. The average EC for the potable water was about 5.5 times higher than the EC of the lake water due to the interaction of the latter with aquifer rocks. A significant 65% of EC results exceeded the WHO limit of 1500 μS/cm; 82.5% of TDS results surpassed WHO’s 500 mg/L standard for drinking water. The highest values of EC were registered in February. Conversely, the lowest values were found in April in the case of lake water (due to the intake of rain water) and, in the case of the potable source of water, in November (also a month with a higher frequency of precipitation). Although elevated conductivity itself may not pose direct health concerns, dissolved ionizable solids can lead to water hardness or alkalinity, which is unpleasant for drinking. Further, elevated electrical conductivity can induce physiological drought in crops. Irrigation waters are commonly deemed suitable when their EC values are below 700 μS/cm [58]. The reduced conductivity values registered for the month of November (autumn) are caused by the low level of dissolved inorganic substances in ionized forms and by the dilution caused by atmospheric precipitation [59]. Meteorological factors, such as rainy and dry periods, tend to have an impact on the EC of water, suggesting that the degree of water mineralization is linked to the total quantity of dissolved salts and the estimated number of dissolved minerals [58,59].
pH plays a crucial role in influencing the majority of chemical and biological processes in water. As one of the paramount environmental factors, it significantly constrains the distribution of species in aquatic habitats [60]. The evolution of pH in the studied area is shown in Figure 3. The pH of Teceu Lake water was slightly alkaline, in the range of 7.12–7.96; the pH values for the potable water source were lower, between 6.78 and 7.31. Fluctuations in pH, or a pH consistently maintained outside the optimal range, impose physiological stress on numerous species, potentially leading to diminished reproduction, stunted growth, increased susceptibility to disease, or mortality.
The higher pH for Teceu Lake could probably be explained by the fact that this lake is surrounded by trees and rich vegetation and is also covered by aquatic plants (Figure 1). The decomposition of organic matter from surrounding vegetation and aquatic life in lakes can release substances that act as weak bases, thus influencing pH values. The photosynthetic activities of aquatic plants and algae, particularly during daylight hours, contribute to the absorption of carbon dioxide, leading to higher pH levels. Further, lakes typically possess a higher buffering capacity, containing substances like bicarbonates, which resist changes in pH, thereby maintaining a relatively stable and elevated pH level. Geological formations around lakes may also contribute carbonate minerals, such as limestone, which can increase alkalinity. Human activities such as agricultural runoff can also introduce substances that affect pH, potentially contributing to increased alkalinity in lake water [60]. The dynamic interplay of these factors results in a nuanced and varied pH profile in lakes compared to groundwater.
Dissolved oxygen (DO) is a key marker for assessing water quality in aquatic ecosystems. The evolution of DO during 2022 is shown in Figure 4. In instances of poor water quality and insufficient oxygen levels, there is a risk of loss of biodiversity [61]. For example, fish cannot endure extended periods in water where DO falls below 5 mg/L [62]. According to Romanian legislation [63], the quality of Teceu Lake falls into the first quality class (I) of surface water based on a DO level higher than 7 mg/L during almost all the months of 2022. The exception here is June for TL2 with 6.74 mg/L. DO is influenced by temperature and by aquatic plants and phytoplankton, as well as by the presence of organic or inorganic reducible substances [64].
DO in Teceu Lake in both sampling points showed a variability closely linked to season. Thus, in the colder months of winter and early spring (January, February, March and December), DO registered high values in the range of 10.29–11.21 mg/L while, in the warmer months of summer, spring, and autumn (April–November), the values of DO were lower: 6.79–10.68 mg/L. During autumn, the registered decreases in DO concentrations can be attributed to the increase in temperature as well as to the presence of organic pollutants that are oxygen consumers. DO was low in the warm months due to the decrease of oxygen solubility with the increase in temperature. DO values in the underground potable water source were lower than in the water of Teceu Lake due to the reduced surface for gas exchange with the atmosphere, which is characteristic of open wells. DO levels in lakes typically show a pattern of being higher in colder months compared to warmer months, primarily due to the influence of temperature on the oxygen-holding capacity of water. Cold water has a higher capacity to hold DO than warm water, as molecular movement slows down in lower temperatures. Additionally, thermal stratification in warmer months results in distinct layers within the lake, with the upper layer, which is exposed to the atmosphere, being able to absorb oxygen through aeration processes [61,64]. The reduced metabolic activity of aquatic organisms in colder temperatures, along with increased oxygen solubility in cold water, contributes to elevated DO concentrations. Ice covers, which can occur in extremely cold conditions, may limit gas exchange but also insulate water, aiding in maintaining DO levels [63,64].
The evolution of water turbidity during 2022 is illustrated in Figure 5. Water turbidity represents an optical determination of water clarity and can be an indirect measure of the quantity of suspended particles [65]. Water turbidity values were in the range of 2.05–5.90 NTU for Teceu Lake and in the range of 2.16–5.96 NTU for the underground potable water source. Turbidity values for the potable water source exceeded the maximum allowable value in two months: March and June. Water turbidity is influenced by the content of suspended matter in water and is higher especially after rain episodes. Water characterized by high turbidity is unsuitable for drinking purposes due to the danger of microbiological contamination. The increase in turbidity could also be attributed to the elevated levels of silt and content of organic matter [66]. Elevated turbidity values can be observed during rainy seasons due to floods, which induce soil erosion around riverbeds [53].
The concentration of ammonium (NH4+), shown in Figure 6, was higher in March and in autumn (October and November), when concentrations exceeded the drinking water maximum allowable limit of 0.5 mg/L. This likely happened due to the leakage of water with organic matter from the soils around the lake, the melting of snow (March), and the decomposition of vegetation and phytoplankton that have fallen into the lake water during the autumn months (October and November). The occurrence of ammonium in water can be caused by contamination with decomposing organic substances, which can affect bird habitats and the life of underwater fauna [67]. Depending on the level of ammonium (NH4+) cation, according to Romanian legislation [63], the quality of Teceu Lake falls into different quality classes of surface water, varying from quality I (maximum 0.2 mg/L) in July and August to quality IV (0.6–1.5 mg/L) in March, June, October, and November, and even quality V (>1.5 mg/L) in the case of TL 2 in November. NH4+ in water is in chemical equilibrium with free ammonia (NH3). The formation of ammonia in natural water is favored by high pH values and increases in temperature [68,69]. As pH and water temperature rise, the concentration of NH3 increases while the concentration of NH4+ decreases. The ionic form, NH4+, shows a lower toxicity than that the NH3 molecule [68].
Nitrate (NO3) is encountered in both soil and water and is often associated with the inadequate sanitary conditions of septic tanks located near wells or rivers, the infiltration of wastewater, or the employment of nitrogen-based fertilizers for agriculture [70]. The levels of nitrates, displayed in Figure 7, were under the maximum allowable limit of 50 mg/L for drinking water. The highest concentrations were found in February for the potable groundwater source (21 mg/L); the lowest concentrations were registered in April for Teceu Lake and in December for the potable groundwater source. Chemical fertilizers and manure are significant sources of nitrates in agricultural areas. The absorption efficiency of chemical fertilizers by plants was assessed to be 61–65% [71,72]; the remaining amount enters the environment, polluting the surface and groundwater. Lower levels for NO3 are set for the surface water. Thus, Romanian legislation [63] classifies the water with a nitrate concentration lower than 1 mg/L into quality class I, <3 mg/L into class II, <6 mg/L into class III, <15 mg/L into class IV, and more than 15 mg/L into class V.
Considering the concentration of nitrates, the water of Teceu Lake falls into classes I and II in April, July, August, and September for both TL1 and TL2, and October and November for TL1; and into classes III and IV in January, February, June, and December for both TL1 and TL2, and October–November for TL2. Low nitrate levels in warm months may be due to a high uptake of nitrogen compounds by aquatic plants and phytoplankton. Nitrate concentrations in February are higher than in the other months, both in lake water and in groundwater, probably due to the oxidation process of ammonium and organic substances with nitrate formation and due to the reduced absorption of nitrates by aquatic plants in the colder seasons. Concentrations of 20 mg/L nitrates are, however, lower than the maximum allowable level of 50 mg/L. Nitrite concentrations were low, varying in the range of 0–0.008 mg/L with the average value of 0.001 mg/L for Teceu Lake water and 0.0005 for the potable groundwater source. The decomposition of organic waste releases NH4+ into the water, leading to eutrophication [73]. Excessive nitrogen contributes to eutrophication, causing algae overgrowth, which depletes DO through the decomposition process [30].
The evolution of phosphate concentrations during 2022 is displayed in Figure 8. According to Romanian legislation [63], the water of Teceu Lake falls into classes III and IV, with phosphate values higher than 0.2 and 0.5 mg/L, respectively. Only in September was the water quality of Teceu Lake in classes I (TL1) and II (TL2). The highest values were registered in the cold months (January–March); the lowest values were measured in August and September, probably due to the assimilation of inorganic forms of P by the aquatic plants. Phosphates in water derive from P-containing fertilizers applied to agricultural areas, industrial activities, and domestic products such as phosphate-containing detergents [74]. The maximum allowable limit for drinking water was set to 0.4 mg/L but, for the water surface bodies, phosphates cause eutrophication and affect aquatic life even at concentrations above 0.02 mg/L [75]. To the authors’ knowledge, there are no available data on the eutrophication process in Lake Teceu or within the immediate area; however, one study by Proorocu [76] examines surface water quality in Romania’s north-west region, including Maramures county. That research analyzed physico-chemical, biological, and bacteriological parameters in the main lakes, revealing predominantly low and middle trophic levels, with Călineşti-Oaş Lake exhibiting a mezo-eutrophic stage. In contrast, Lake Firiza was classified as “oligo-mesotroph”, with low to moderate nutrient levels. The trend of water eutrophication is an important issue at the global level. Zhang et al. [77] showed that concentrations of total phosphorus compounds and organic compounds in the Tibetan Plateau Lake were higher during rainy seasons due to the input of non-point pollutants into the lake basin during periods of high runoff.
Figure 9 illustrates the evolution of Cl concentrations in the studied water samples during 2022. The highest average chloride concentration was found in the drinking-water source (234.05 ± 112.80); the lowest value was measured in water sample 1 from Teceu Lake (39.46 ± 16.26), as can be observed in Figure 9. Chlorides are salts (compounds of metals with hydrochloric acid), and their presence in water is linked to its salinity [78]. The lowest values were registered in April, with frequent precipitation events; the highest values were measured in February, a dry month with little precipitation. As can be observed in Figure 9, the Cl concentrations always appear higher for the potable water source (from the well) than in the two lake-water samples. This could be explained by several factors. The geological composition of the aquifer supplying the well water may contain chloride-rich minerals [78]. If the aquifer passes through rock formations or soil with a high chloride content, it can contribute to elevated chloride levels in well water [78]. Human activities such as laying road salt for de-icing, industrial discharges, and the application of certain fertilizers containing chloride compounds, can introduce elevated levels of chloride into the groundwater [79]. Wells in areas with these activities may show higher chloride concentrations. Further, wells often tap into deeper groundwater sources, and these deeper layers may have different chemical compositions than surface water from lakes. If the deeper aquifer contains naturally occurring chloride or is influenced by human activities, it can result in higher chloride levels [79]. Chloride, specifically, possesses a low taste threshold; elevated levels would diminish the suitability of the water source for both human and animal consumption [80]. A significant quantity of chlorides is derived from rainwater, soil, or water-soluble chloride salts found in minerals that support human body metabolism and various crucial physiological processes [79]; nevertheless, it is noteworthy that chloride counteracts the toxicity of nitrites and has a tendency to alleviate osmotic stress resulting from the depletion of ions in the water [80].
Formerly, salinization was believed to be an environmental issue mainly confined to arid areas; however, today it is acknowledged as a worldwide environmental issue affecting even humid regions, due to human contributions originating from road-deicing agents, sewage discharges, and water softeners [81]. Increased salinity can lead to salts eroding metals and worsening the presence of metal pollutants in drinking water. It can also escalate nutrient contents and heavy metal contamination in streams and lakes, leading to environmental strain on delicate species [82,83]. This occurs due to a rise in the amounts of key cations (such as Na, K, Ca, and Mg), which vie with heavy metals for attachment sites on solid materials, triggering the release of heavy metals from these sites and enhancing their accessibility for biological uptake [82,83].
The evolution of water hardness (ht) is displayed in Figure 10. Water hardness values varied in the range of 4.1–12 for Teceu Lake and in the range of 16.6 and 32.82 German degrees for the potable groundwater source. Water hardness is attributable to Ca and Mg salts. The variation in water hardness between Teceu Lake and the potable groundwater source could be ascribed to the pH of the water, temperature, and atmospheric pressure modification during the seasons [84]. Atmospheric CO2 is very important in the carbonate/bicarbonate system and is responsive to the dissolution or precipitation of Ca and Mg carbonates [84]. The water of Teceu Lake was moderately hard or hard, except in April, when the water was soft (water hardness < 5 German degrees). The potable groundwater source was hard–very hard due to the influence of aquifer rocks rich in Ca- and Mg-leachable compounds.
The variation of water alkalinity (A) during 2022 is presented in Figure 11. Teceu Lake-water alkalinities varied in the range of 85–209 mg/L (as CaCO3), with the highest value recorded in May; the alkalinities of the groundwater potable source were higher (154–242 mg/L as CaCO3), with the highest value in February. Low alkalinity, often caused by human activities and geological influences, indicates reduced levels of HCO3, OH, and CO32–. This buffering effect, stemming from weak acids and their conjugated bases, is essential [59]. Conversely, high alkalinity safeguards the environment, particularly against threats such as wastewater and acid rain, which can alter pH levels [59].
The evolution of water temperature during 2022 (Figure 12) showed a variation in the range of 2.4–27 °C for Teceu Lake and a smaller range for groundwater potable source, between 5.3 and 26 °C. Water temperature influences other physico-chemical parameters of water; the most evident of these is DO, the concentration of which decreases with the temperature.

3.2. Metal Composition of Water Samples

Table 3 provides metal content along with maximum allowable concentrations in accordance with the 98/83/EC Council Directive. Pb, Hg, Cd, Cr, and As fell below the detection limit of the analytical method used. The lowest aluminum concentration is 26.0 μg/L; the most elevated concentration is 117.8 μg/L. Water that is rich in Al can cause chromosomal alterations, and low content can have adverse effects on health [85]. Aluminum could be acquired naturally through water consumption in regions with acidic rocks and soils, or through treating wastewater, restoring lakes, and tainting water pipelines with aluminum salts applied in purifying drinking water [17,86]. The primary chemical species of aluminum in groundwater are hydroxo-aluminum components, including those containing silicon [87]. When aluminum is found in drinking water, its bioavailability can be higher, enabling increased absorption in the body [88]. Connections have been identified between exposure to aluminum and neurodegenerative diseases of the brain such as Alzheimer’s disease [89]. Studies have indicated that cognitive decline occurs with a daily intake of Al ≥ 0.1 mg/day from drinking water [90]. Al is also a harmful substance for species that respire through gills, including fish and invertebrates, as it reduces the disruption of ion concentrations in their plasma and haemolymph which, in turn, results in a breakdown of osmoregulation processes [91]. Elevated concentrations of aluminum were discovered in the central and eastern regions of the studied area, where Eutricambisol and Gleisols soils prevail and the pH tends to be more acidic compared to the western part of the town [86,87,88,89,90].
Regarding barium (Ba), the highest concentration was observed in the drinking-water source (88.98 μg/L); the lowest value was found at point 2 of Teceu Lake (39.80 μg/L). All values remained within the permissible maximum limit of 7000 μg/L. The ecological effects of Ba are intricate, and the processes governing its absorption and dispersion, and its harmful effects on organisms, are not fully understood. Here, the presence of sulfate or carbonate must be taken into account as each tends to diminish the bioavailability of Ba [92]. When experimental animals are subjected to short-term exposure to barium salts, various abnormalities manifest, encompassing renal poisoning, elevated blood pressure, and impaired cardiac function, with the kidneys being identified as the most susceptible organ when exposed to barium chloride [93]. The presence of Ba content may be attributed to granite (igneous rocks), and alkaline-igneous and volcanic rocks, as well as manganese-rich sedimentary rocks. Additionally, a lower pH can contribute to the presence of Ba [91,94].
Nickel (Ni) content can be influenced by pH, soil, and depth [95]. At a pH lower than 6.2, Ni levels reaching 980 μg/L have been measured in groundwater samples [96]. For the present study, the higher nickel content at the second point of Teceu Lake might be attributed to mining waters and waste. Ni can originate from industries involved in Ni alloy production and the manufacturing of pigments, from wastewater generated by tannery operations, and from mafic and ultramafic rocks [97]. The elevated copper content (8.01 μg/L) may have resulted from natural processes (such as rock degradation) and anthropogenic activities (mining, industries, and agricultural activities) [85]. The monitoring of copper content is important as consuming water that is rich in copper can lead to stomach pains and headaches, as well as eye and nasal irritations [78].
Within the present samples, the lowest zinc (Zn) concentration was 18.1 μg/L; the highest was 92.2 μg/L. The primary issue concerning freshwater lakes pertains to the potential accumulation of Zn within sediments [98]. Over an extended period, the concentration of Zn could elevate to levels that pose toxicity risks for organisms residing in the sediment, particularly macroinvertebrates. Its mobility is primarily influenced by pH, although factors such as clay content, the availability of phosphorus, organic matter concentration, and redox conditions also play a role [99].
Potential sources of copper (Cu) may include industrial and agricultural waste, as well as deposits containing copper [78]. The presence of copper-sulfide ores, such as chalcocite and bornite, along with the geological characteristics of aquifer bedrock, suggest chemical reactions that release copper into aquifers [100].
Manganese (Mn) levels were higher than the admissible limits for both lake- and well-water samples. The average registered values of 93 μg/L were almost double the maximum allowable limit of 50 μg/L, which is concerning. An increasing occurrence of elevated Mn levels in drinking water, and the resulting excessive accumulation, can lead to detrimental impacts on the central nervous system. This can manifest as impairment in both motor skills and cognitive functions [101]. Sources of Mn include industrial activities (such as alkaline battery production and cleaning products manufacturing), agricultural practices (including the use of fungicides and fertilizers/pesticides), and mining activities [102]. This is especially true as Maramures County is very rich in metalliferous ores (gold, silver, manganese, copper, and iron), and has a long history of mining. Manea et al. [103] identified Mn as the most prevalent heavy metal present in the soil of Maramures County. Additionally, iron levels exceeded the maximum allowable limit in the case of well water; this result could probably also be ascribed to mining.
A similar study [29] focusing on several groundwater sources within the general Remeti locality showed some similarities with the Teceu groundwater sample in this paper, which is to be expected given the proximity; however, some differences were also registered. Notably, chloride levels varied within the 11.0–26.0 mg/L range and carbonate registered 0.01–58.0 mg/L; these levels are lower than those observed for the Teceu well. Conversely, the nitrate levels in Remeti wells were higher, with a maximum of 55.6 mg/L for one of the wells (a value that exceeds the admissible limit).
Of course, Romanian surface water and groundwater exhibit diverse nutrient levels, physico-chemical parameters, and metal content owing to distinct geological formations, land uses, and anthropogenic influences across regions.
Stanca-Costesti Lake has been revealed to have copper (pesticides and fertilizers), cadmium (phosphate fertilizers), chromium, lead (herbicides and insecticides), and nickel as inorganic pollutants, with agriculture cited as the main anthropogenic pollution source [104]. Conversely, sediment samples from Podu Iloaiei Dam Lake in north-eastern Romania revealed low-to-moderate contamination, with manganese emerging as the most abundant trace element [105].
The European Commission [106] has stated that 25% of Romanian surface-water bodies face challenges from discharges that are not connected to sewerage networks. Agricultural activities contribute 12% of overall pressures, and urban wastewater accounts for 5%. Romania, with 58% of its land used for agriculture, ranks fourth-highest in the EU [107].
Groundwater bodies are pressured by diffuse pollution from agriculture and non-sewerage discharges, affecting 10%. Nutrient pollution impacts 27% of surface-water bodies; organic pollution affects 17%. Groundwater is mainly affected by chemical pollution, impacting 10%. These diverse pressures highlight the necessity for targeted environmental management strategies.
Worldwide, one study dealing with the heavy metal pollution of groundwater in Taluka Hyderabad (rural) (District Hyderabad, Sindh Pakistan), including lead (Pb2+), cadmium, manganese (Mn2+), nickel, and copper (Cu2+), found that groundwater in that region exceeded WHO limits in 60–82.5% of samples, posing potential health risks to the gastrointestinal and nervous systems, and kidney damage [108]. Another investigation on drinking water, both as surface water and groundwater, from the Kohistan region of northern Pakistan, revealed that chromium (Cr), nickel (Ni), lead (Pb), zinc (Zn), and cadmium (Cd) concentrations generally complied with permissible limits [26]; however, exceptions to this finding include elevated Pb (up to 43.17 μg/L) and Zn (up to 3387 μg/L) in groundwater, as well as cadmium levels exceeding allowable limits (up to 3.90 μg/L).

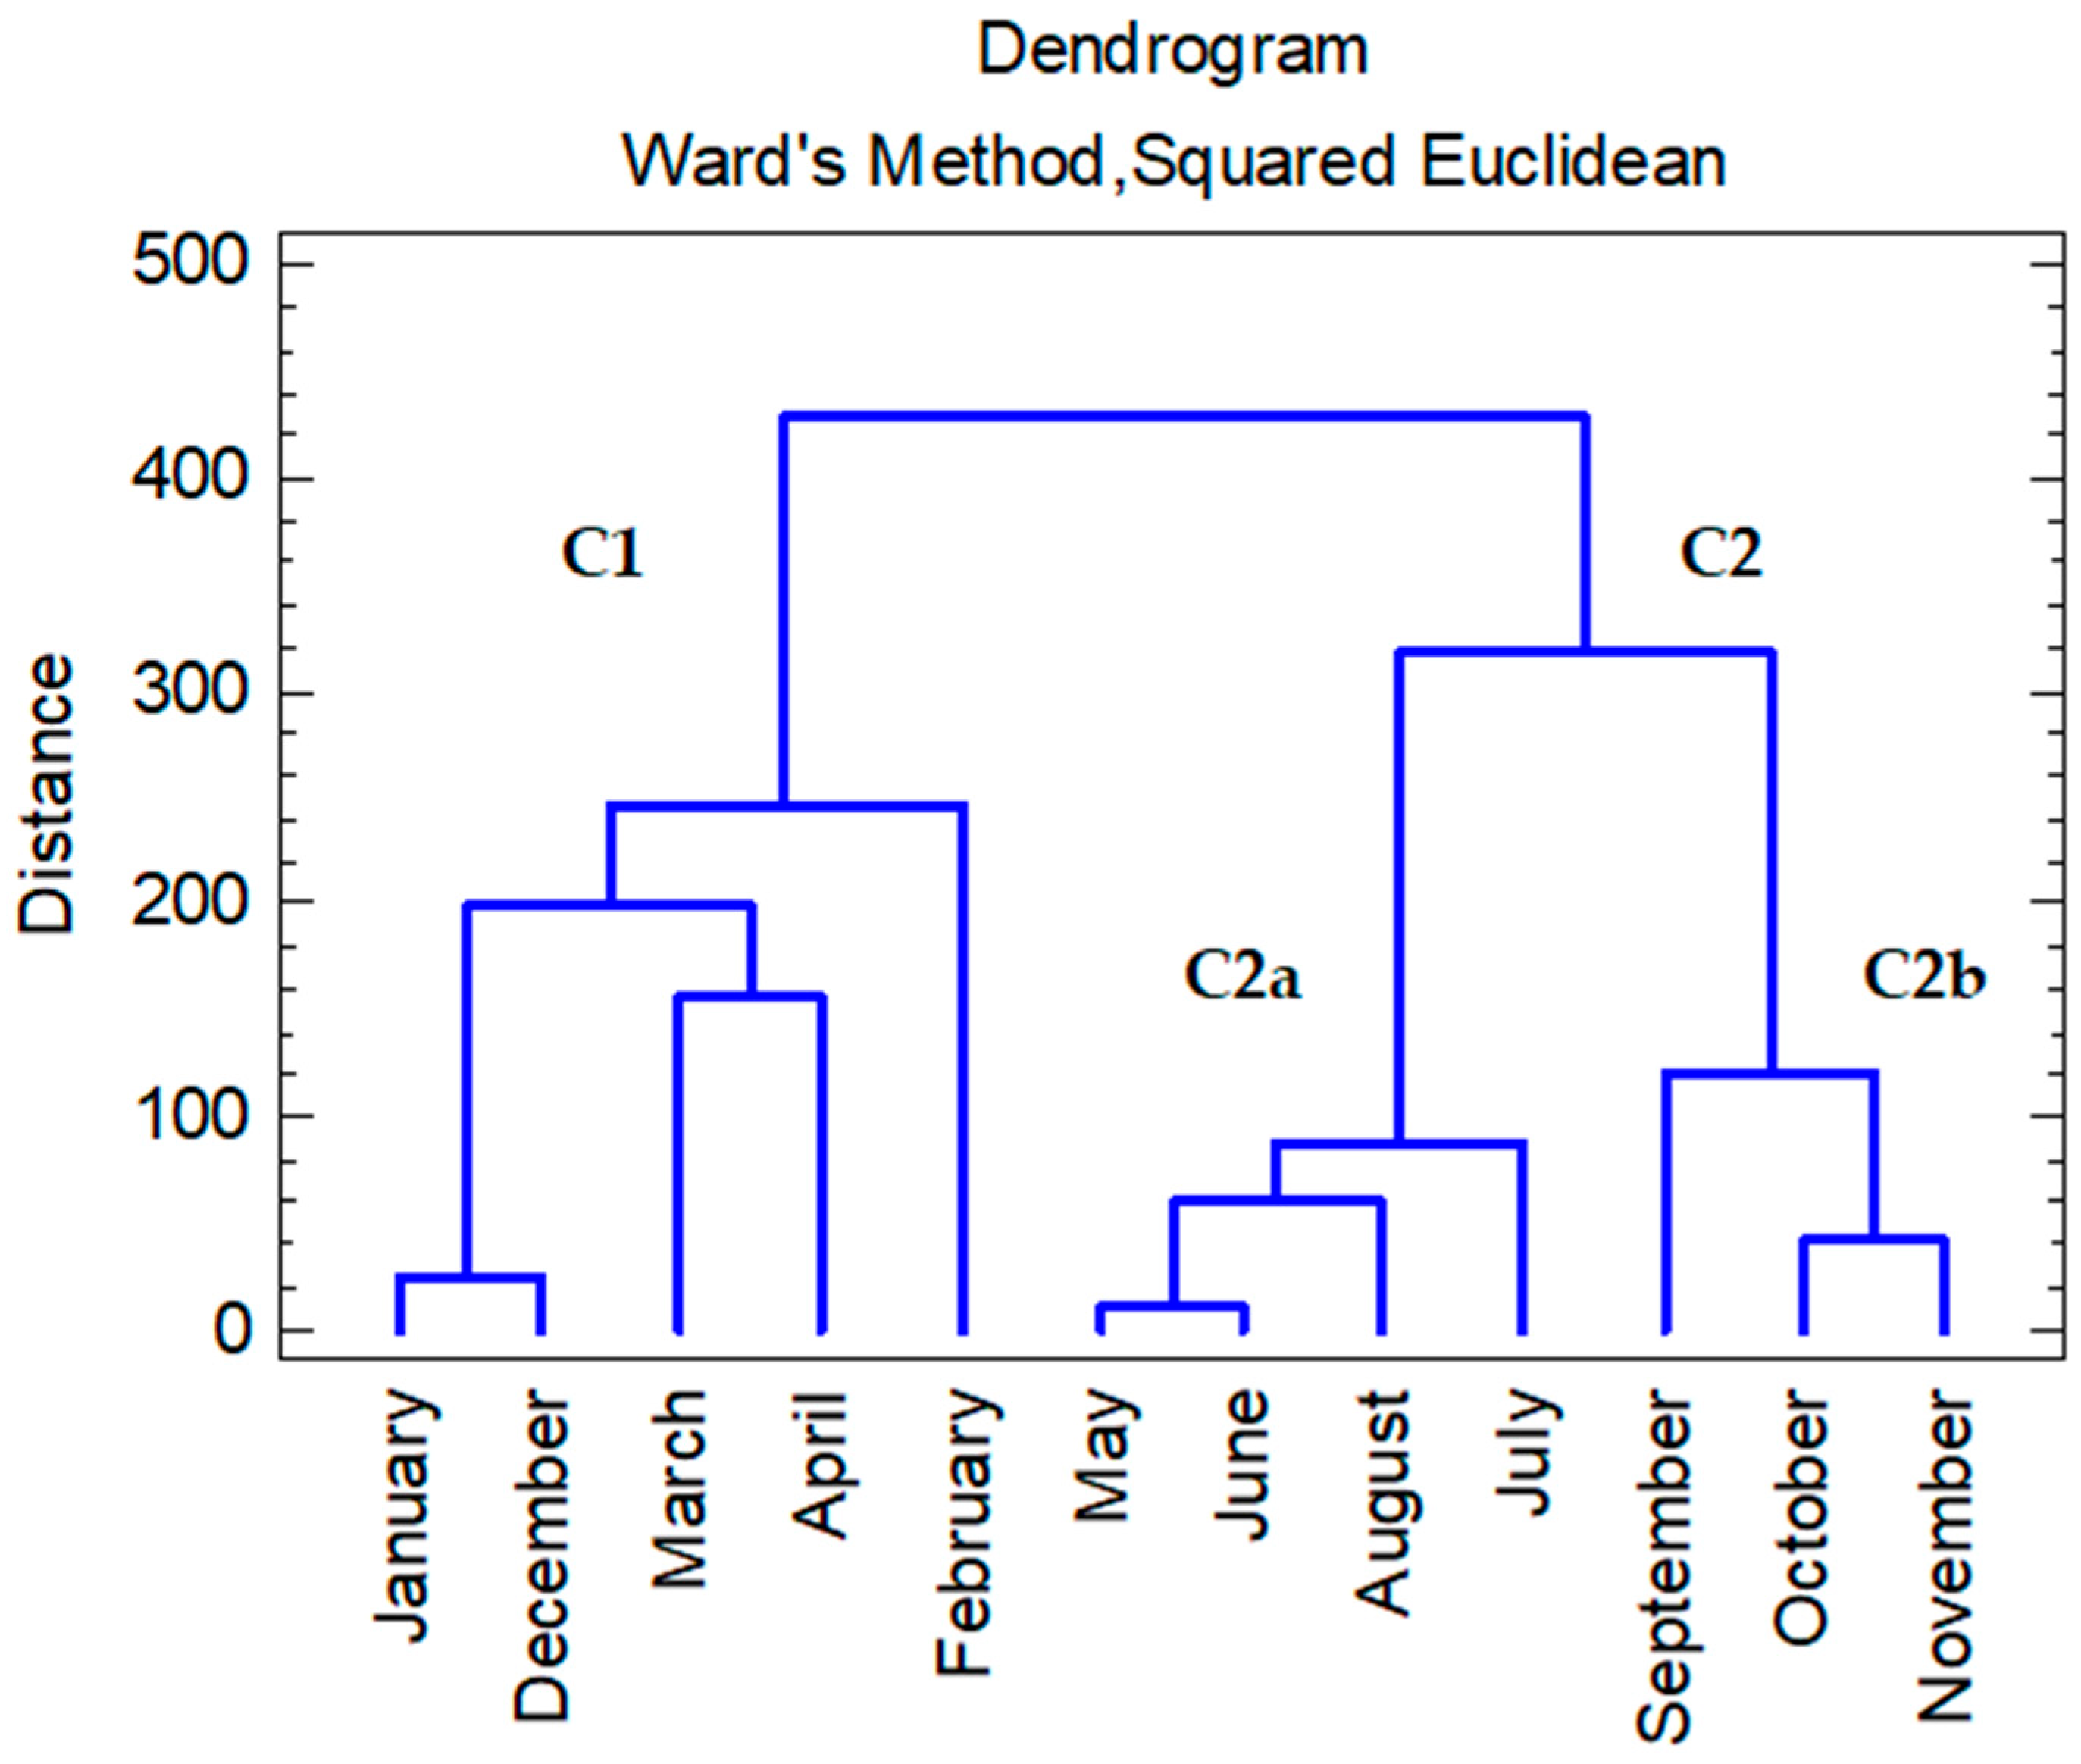
3.3. Cluster Analysis of Water Samples

Cluster analysis aims to show the similarity between observations (sampling points) or between analyzed parameters (variables). Cluster analysis for water quality and metal content is vital, helping uncover patterns that guide targeted pollution control. This approach simplifies understanding, making conservation efforts more effective for protecting water resources. For the present research, cluster analysis performed in Q mode, with the physico-chemical indicators of the three sampling points as variables and the months of 2022 as observations, is displayed in Figure 13.
Two cluster were generated: C1 and C2. C1 groups the colder month: the pair of months January-December linked to the pair of spring months March-April and to February. C2 consists of 7 elements: C2a groups the spring and summer months: May and June linked to August and July; C2b is formed by the pair of months July-September and the autumn months October-November.
Cluster analysis was performed based on metal content in Q mode, with the sampling points as observations, and in R mode, and is displayed in Figure 14a,b. Cluster analysis based on the metal content of water showed a high similarity between the two water samples of Teceu Lake: 1 and 2 are linked to a relatively low distance of about 10; the distance to the groundwater potable source is higher than 30. Through cluster analysis in R mode, two main clusters were generated: C1 and C2. C1 groups 13 elements: the pair Al-Ca links to the group of Li, Ti, K, and Sr, linked to the pair Na-Fe and, then, to the subcluster Ba-Zn-Ga-Cu and Ca. C2 contains 4 elements: the pair of Mn-Ni linked to the pair of Rb-Mo.
Cluster analysis highlighted some notable connections between the physico-chemical indicators and metal content for all sampling points. This suggests shared sources as well as similar chemical and geological characteristics among the metals analyzed [109,110]. Geological composition, anthropogenic activities, transport mechanisms, redox conditions, and seasonal variations all contribute to metal clustering. The co-occurrent presence of metals might be derived from geological formations. Industrial discharges and agricultural runoff also introduce shared sources. Transport mechanisms, i.e., suspended particles, can transport several metals simultaneously. Additionally, redox conditions that influence the solubility and mobility of metals can add to clustering. The clustering observed for specific months could be explained by the influence of metal mobility due to parameters related to seasonal variations, i.e., weather variations and season-specific human activities. The apparent clustering of Lake Teceu samples compared to the groundwater source indicates geological influences or a varying contamination. These results highlight the need for a more tailored conservation strategy.

3.4. Correlation Analysis
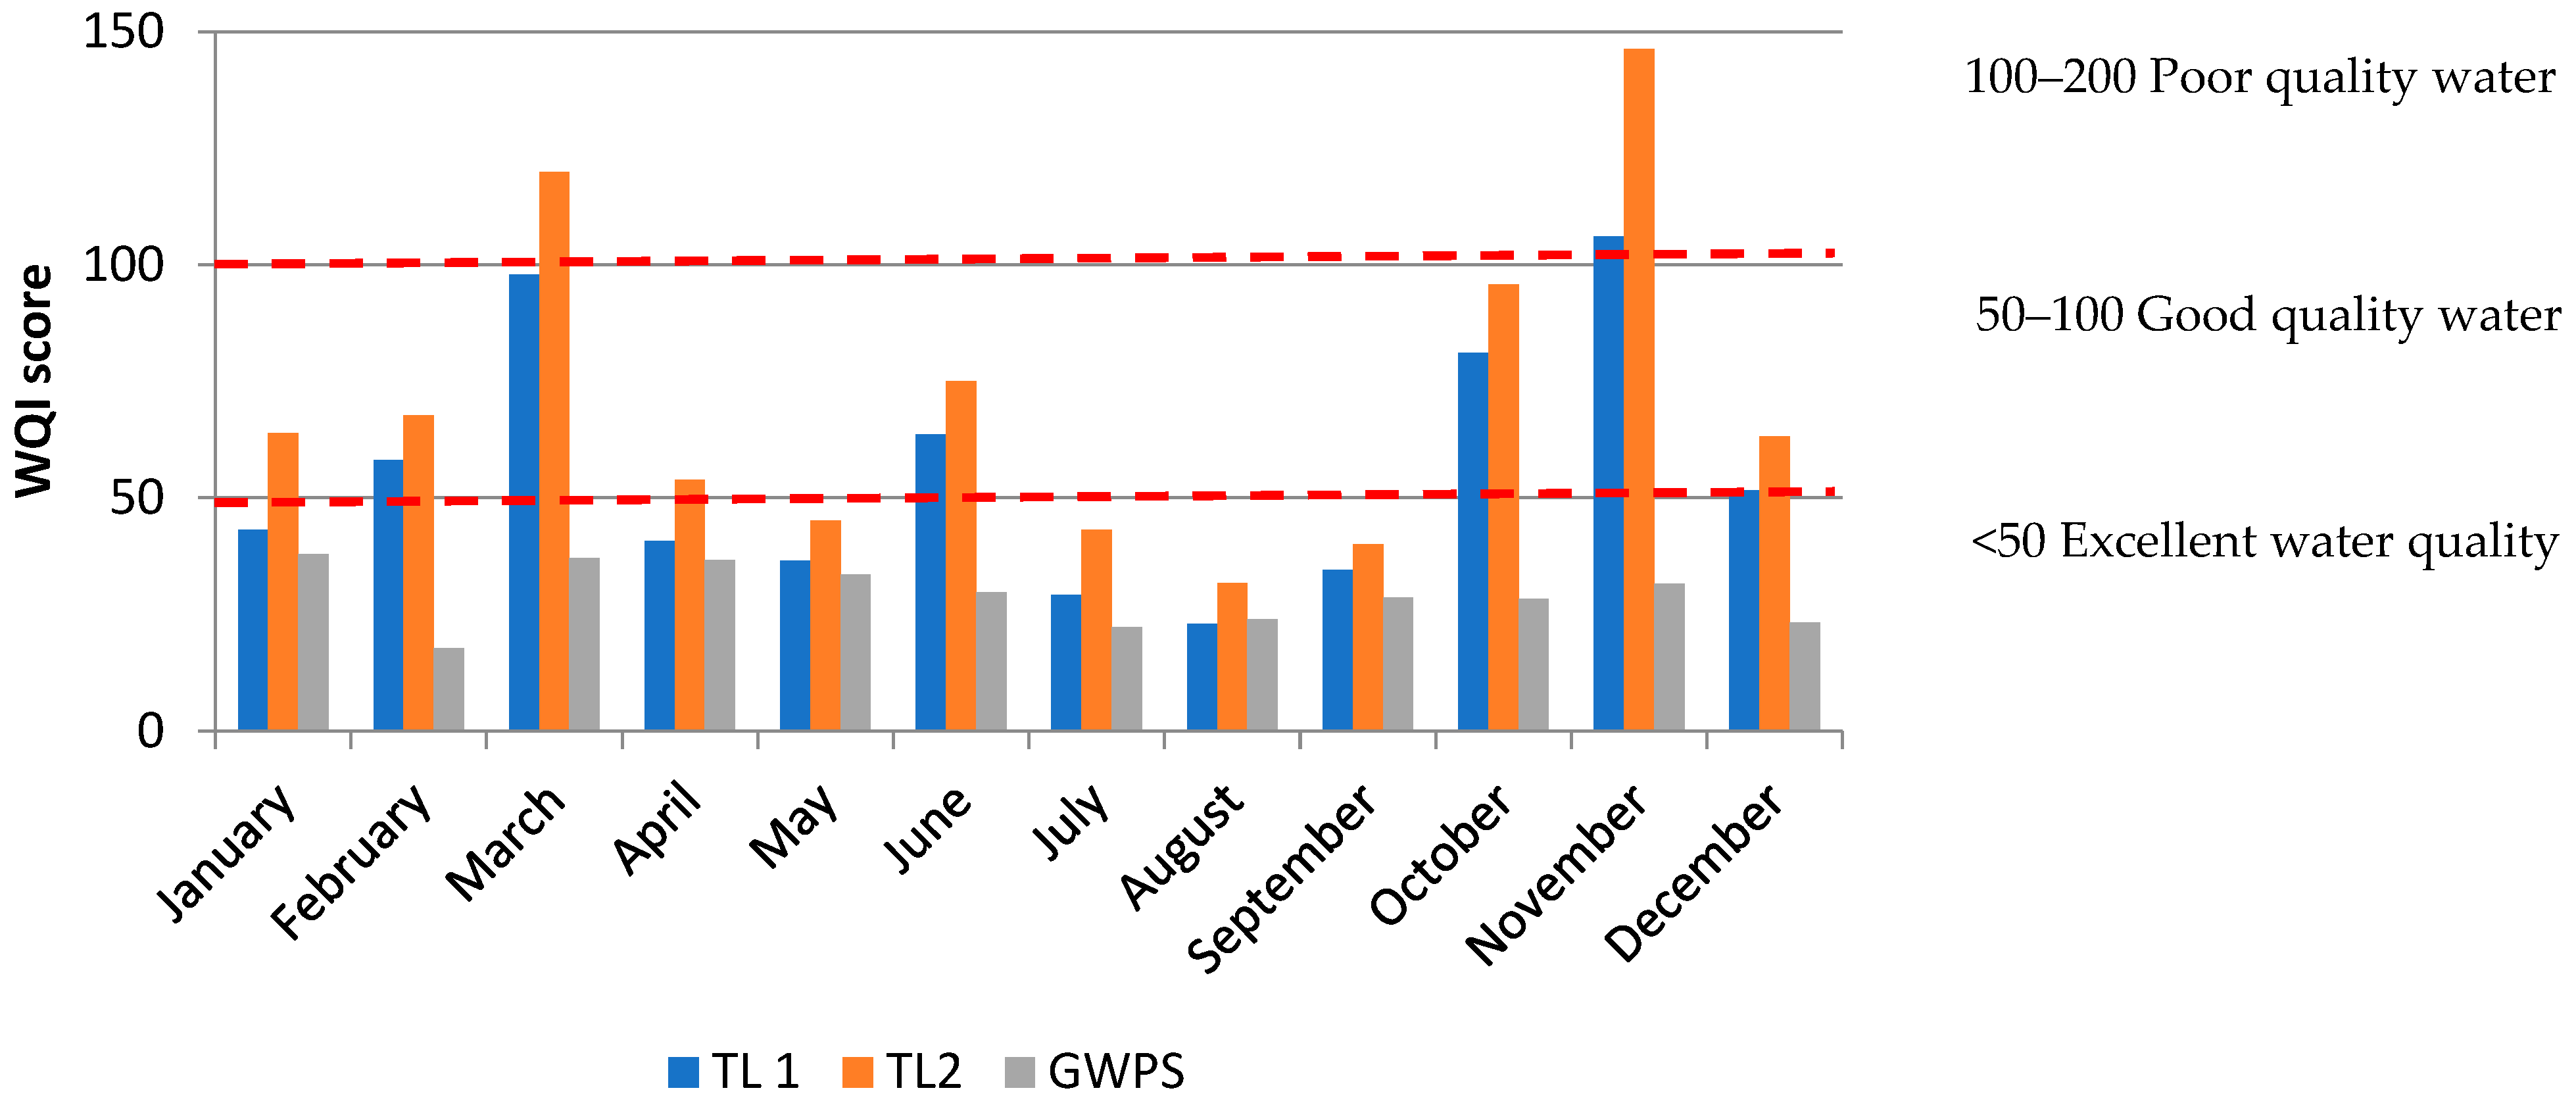
The correlation analyses of metals are presented in Table 4. The correlation analysis among the metal concentrations in the water samples revealed several highly positively correlated pairs of elements, such as Ba-Ga, Ba-Zn, Cu-Zn, Li-Ti, Li-Sr, Rb-Mo, Ti-K, Ti-Sr, K-Sr, and Fe-Mg, indicating a common origin. This highlights the importance of considering these metals as a whole in pollution monitoring practices. Other pairs of metals were negatively correlated, such as Mn with Al, Ba, Cu, Ga, Li, and Zn, which is likely evidence of conflicting environmental behaviors or separate sources. While some correlations might suggest geological origins, such as those associated with the alkaline earths, others can be inferred to be of an anthropogenic nature.
Oxbow lakes, formed as a result of river straightening, have the potential to accumulate metal-rich, suspended sediments during floods; these sediments are being transported by the river from mining-impacted source areas and other anthropogenic sources [111]. Teceu Lake is an oxbow lake formed from a meander of the Tisa River, a river spanning five countries in Central and Eastern Europe: Ukraine, Romania, Slovakia, Hungary, and Serbia and Montenegro. This geographical relationship implies that any pollution affecting the Tisa River could potentially impact Teceu Lake, as they share a hydrological connection. The Tisa River faced significant accidental pollution in 2000, originating from the dam break at Baia Mare in Romania, which released cyanides and heavy metals. Another incident occurred at Baia Borsa, also located in Romania, discharging 20,000 tons of wastewater with high zinc, iron, and lead concentrations into the River Viso, a Tisa tributary [112]. Sakan et al. [113] assessed the heavy metal pollution in sediments from the Tisa River in the Serbian part. They highlighted higher levels of Cu, Cr, Zn, and Pb in the upper-section of the Tisa River, close to the border with Hungary (specifically, between 90 and 158 km), potentially attributed to the influx of these elements from more distant segments of the Tisa River originating in countries within the Tisa watershed.
High negative correlations were found between Fe and DO and Fe-T, related to the oxidation tendency of Fe salts and the formation of unsolvable compounds of Fe, such as Fe(OH)3, which contributes to the increase in water turbidity. A high positive correlation was found between Fe and total water hardness (ht), showing the increase-tendency of Fe dissolution in hard waters. Positive correlations were found between Cl and metals such as Li and Fe, suggesting that the dissolution of these cations from rocks and soils was favored by the presence of chlorides.

3.5. WQI Indices

To assess the water quality and its evolution across the seasons, water quality indices (WQI) were employed. In Figure 15, the values of the WQI over the January–December 2022 period are depicted. The WQI of Teceu Lake water were in the range of 22.95–146.31, falling into excellent quality for 37.5% of samples, into good quality for 50% of samples, and into poor quality for 12.5% of the lake-water samples. In the case of the groundwater potable source, the WQI in the range of 17.71–37.94 showed excellent-quality water for all samples.
The water quality showed a decreasing trend during the year, with an increase-tendency in WQI values in autumn months (October–November). The best quality was calculated in the summer months of July and August, probably due to more intense oxidation processes and the assimilation of nutrients by aquatic plants. Increased values of WQI are primarily due to nutrient content, ammonium, and phosphates. The contribution of these indicators to the WQI values can be observed in Figure 16.
A recent study [29] that assessed the groundwater quality in Remeți commune, located in close vicinity to the Teceu Mic locality, showed excellent and good values for the WQI score, between 27.7 and 65.1, but the river water of Remeți stream was of very poor quality with high values for the WQI score, exceeding 300 in the autumn months [28].
Khokhar et al. [108] found a wide range of WQI results for groundwater in Pakistan, from 23.28 to 272.64. Sixteen samples (20%) fell into the excellent category (WQI less than 50); 32 samples (40%) were classified as good (WQI less than 100). In contrast, studies on river-water quality in Maramures county, Romania, indicated poor and very poor water quality (WQI between 141 and 230) for some streams near Baia Mare, a former mining and metallurgical center [114]. These rivers, affected by industrial pollution, experience anthropic pressure. In Iraq, Ewaid and Abed [115] reported WQI values between 321.1 and 387.4 for Al-Gharraf River water, indicating poor quality due to natural phenomena and anthropogenic activities.
The higher WQI values, relative to the present study, were attributed to water scarcity, high salinity, and pollutant concentrations from municipal, industrial, and agricultural activities in Iraq. Ismailia Canal water in Egypt, as assessed by Goher et al. [116], showed a WQI range between 12.61 and 65.48, classifying it as suitable for drinking and for aquatic life (good to poor), and appropriate for irrigation [117].

3.6. Human Health Risk Assessment

The human health risk posed by the ingestion of drinking water from Teceu Lake (TL1 and TL2) after treatment, and from the groundwater potable source, was evaluated and the results are presented in Table 5. The hazard index (HI) varied in the range of 0.064–0.101 for males and 0.075–0.120 for females. Although the ranges were quite narrow, the HI values were higher for females than for males. This could be attributed to general lower body mass in the female population.
Hazard quotient (HQ) values do not exceed the critical value (HQ < 1.0), suggesting no potential carcinogenic risks of NH4+, NO3, and Mn. In the computation of HQ values, the average values of NH4+ and NO3 were used. During the monitoring period in 2022, higher values of NH4+ were registered, resulting in higher values of HQ (NH4+) and HI.

4. Conclusions

This study investigated the physico-chemical characteristics of water samples from Lake Teceu in Romania, an oxbow lake of the Tisa River, as well as from a nearby well, over a span of 12 months in 2022. It is an important study in the broader context of hydrological connections, considering Tisa is an international watercourse with an historical susceptibility to pollution. Although the majority of physico-chemical parameters were found to be within the admissible limits, some values were registered outside the allowed threshold. Water turbidity for both lake and well water revealed maximum values of 5.90 and 5.96 NTU, respectively, thus surpassing the maximum of 5.00 NTU, probably due to soil erosion during rainy periods. Ammonium concentrations peaked in March, October, and November, which is attributed to melting snow, water leakage with organic matter, and the decomposition of vegetation and phytoplankton. Phosphate values were highest in cold months and lowest in August and September, possibly due to the assimilation of inorganic forms of P by aquatic plants. Well water exhibited higher chlorides, alkalinity, and hardness. Metal concentrations remained within the limits, except for manganese and iron, the latter exceeding the limit only in well water. This is attributable to mining activities. Water quality index classified most lake samples (WQI: 22.78–146.17) as excellent or good quality, with a minority categorized as poor. Groundwater samples (WQI: 17.68–37.89) were consistently labeled excellent. Cluster analysis unveiled seasonal variations and shared physico-chemical characteristics. Correlation analysis highlighted connections among certain elements, emphasizing the need to evaluate metals collectively in pollution monitoring. Negative correlations suggested distinct sources. Non-carcinogenic risk through water ingestion, expressed as Hazard Index (HI), ranged from 0.064 to 0.101 for males and 0.075 to 0.120 for females. These results on potential common sources emphasize the need to evaluate these elements as a whole in the monitoring of environmental pollution within the examined area. This study will be useful for local authorities in charge of water management, as it shows the worsening of water quality as a consequence of shepherding, grazing, and tourism activities.

Supplementary Materials

The following supporting information can be downloaded at: https://www.mdpi.com/article/10.3390/w15223996/s1. The physico-chemical indicators of water samples during 2022 is given as a supplementary materials file.

Author Contributions

Conceptualization, T.D. and C.M.; methodology, T.D. and A.A.; software, C.M.; validation, T.D. and C.M.; formal analysis, T.D., C.M. and A.A.; investigation, T.D., C.M. and A.A.; resources, T.D. and C.M.; data curation, T.D and A.A.; writing—original draft preparation, T.D., C.M. and A.A.; writing—review and editing, T.D., C.M. and A.A.; visualization, T.D., C.M. and A.A.; supervision, T.D. All authors have read and agreed to the published version of the manuscript.

Funding

This research received no external funding.

Data Availability Statement

The data presented in this study are available on request from the corresponding authors.

Conflicts of Interest

The authors declare no conflict of interest.

References

  1. Duran-Encalada, J.A.; Paucar-Caceres, A.; Bandala, E.R.; Wright, G.H. The impact of global climate change on water quantity and quality: A system dynamics approach to the US–Mexican transborder region. Eur. J. Oper. Res. 2017, 256, 567–581. [Google Scholar] [CrossRef]
  2. Mishra, B.K.; Kumar, P.; Saraswat, C.; Chakraborty, S.; Gautam, A. Water security in a changing environment: Concept, challenges and solutions. Water 2021, 13, 490. [Google Scholar] [CrossRef]
  3. Georgiu, I.; Caucci, S.; Morris, J.C.; Guenther, E.; Krebs, P. Assessing the potential of water reuse uptake through a private–public partnership: A practitioner’s perspective. Circ. Econ. Sustain. 2023, 3, 199–220. [Google Scholar] [CrossRef]
  4. OECD. OECD Environmental Outlook to 2050: The Consequences of Inaction; OECD: Paris, France, 2012. [Google Scholar] [CrossRef]
  5. Tenebe, I.T.; Julian, J.P.; Emenike, P.G.C.; Dede-Bamfo, N.; Maxwell, O.; Sanni, S.E.; Babatunde, E.O.; Alves, D.D. Multi-dimensional surface water quality analyses in the Manawatu River catchment, New Zealand. Water 2023, 15, 2939. [Google Scholar] [CrossRef]
  6. Akhtar, N.; Ishak, M.I.S.; Bhawani, S.A.; Umar, K. Various natural and anthropogenic factors responsible for water quality degradation: A review. Water 2021, 13, 2660. [Google Scholar] [CrossRef]
  7. UN-Habitat. SDG Indicator 6.3.1 Training Module: Safe Wastewater Treatment; United Nations Human Settlement Programme (UN-Habitat): Nairobi. Kenya, 2018. [Google Scholar]
  8. Baskaran, P.; Abraham, M. Evaluation of groundwater quality and heavy metal pollution index of the industrial area, Chennai. Phys. Chem. Earth 2022, 128, 103259. [Google Scholar] [CrossRef]
  9. Kluska, M.; Jabłonska, J. Variability and heavy metal pollution levels in water and bottom sediments of the Liwiec and Muchawka Rivers (Poland). Water 2023, 15, 2833. [Google Scholar] [CrossRef]
  10. Velarde, L.; Nabavi, M.S.; Escalera, E.; Antti, M.L.; Akhtar, F. Adsorption of heavy metals on natural zeolites: A review. Chemosphere 2023, 328, 138508. [Google Scholar] [CrossRef]
  11. San-Martin, M.I.; Alonso, R.M.; Ivars-Barcelo, F.; Escapa, A.; Moran, A. Complete arsenic removal from water using biocatalytic systems based on anaerobic films grown on carbon fibers. Catal. Today 2023, 423, 114269. [Google Scholar] [CrossRef]
  12. Lin, M.-H.; Li, C.-Y.; Cheng, Y.-Y.; Guo, H.-R. Arsenic in drinking water and incidences of leukemia and lymphoma: Implication for its dual effects in carcinogenicity. Front. Public Health 2022, 10, 863882. [Google Scholar] [CrossRef]
  13. Genchi, G.; Sinicropi, M.S.; Lauria, G.; Carocci, A.; Catalano, A. The effects of cadmium toxicity. Int. J. Environ. Res. Public Health 2020, 17, 3782. [Google Scholar] [CrossRef] [PubMed]
  14. Hussein, T.S.; Faisal, A.A.H. Nanoparticles of (calcium/aluminium/CTAB) layered double hydroxide immobilization onto iron slag for removing of cadmium ions from aqueous environment. Arab. J. Chem. 2023, 16, 105031. [Google Scholar] [CrossRef]
  15. Khan, Z.I.; Ahmed, K.; Ahmed, T.; Zafar, A.; Alrefaei, A.F.; Ashfaq, A.; Akhtar, S.; Mahpara, S.; Mehmood, N.; Ugulu, I. Evaluation of nickel tixicity and potential health implications of agriculturally diversely irrigated wheat crop varieties. Arab. J. Chem. 2023, 16, 104934. [Google Scholar] [CrossRef]
  16. Genchi, G.; Carocci, A.; Lauria, G.; Sinicropi, M.S.; Catalano, A. Nickel: Human health and environmental toxicology. Int. J. Environ. Res. Public Health 2020, 17, 679. [Google Scholar] [CrossRef] [PubMed]
  17. Senze, M.; Kowalska-Goralska, M.; Czyz, K. Availability of aluminum in river water supplying dam reservoirs in Lower Silesia considering the hydrochemical conditions. Environ. Nanotechnol. Monit. Manag. 2021, 16, 100535. [Google Scholar] [CrossRef]
  18. Mohanty, S.; Benya, A.; Hota, S.; Kumar, M.S.; Singh, S. Eco-toxicity of hexavalent chromium and its adverse impact on environment and human health in Sukinda Valley of India: A review on pollution and prevention strategies. Environ. Chem. Ecotox. 2023, 5, 46–54. [Google Scholar] [CrossRef]
  19. Georgaki, M.-N.; Charalambous, M.; Kazakis, N.; Talias, M.A.; Georgakis, C.; Papamitsou, T.; Mytiglaki, C. Chromium in water and carcinogenic human health risk. Environments 2023, 10, 33. [Google Scholar] [CrossRef]
  20. Siraj, K.; Kitte, S.A. Analysis of Copper, Zinc and Lead using Atomic Absorption Spectrophotometer in ground water of Jimma town of Southwestern Ethiopia. Int. J. Chem. Anal. Sci. 2013, 4, 201–204. [Google Scholar] [CrossRef]
  21. Hossain, M.; Bhattacharya, P.; Frape, S.K.; Ahmed, K.M.; Jacks, G.; Hasan, M.A.; Bromssen, M.; Shahiruzzaman, M.; Morth, C.M. A potential source of low-manganese, arsenic-safe drinking water from Intermediate Deep Aquifers (IDA), Bangladesh. Groundw. Sustain. Dev. 2023, 21, 100906. [Google Scholar] [CrossRef]
  22. Wei, Z.; Gu, H.; Le, Q.V.; Peng, W.; Lam, S.S.; Yang, Y.; Li, C.; Sonne, C. Perspectives on phytoremediation of zinc pollution in air, water and soil. Sustain. Chem. Pharm. 2021, 24, 100550. [Google Scholar] [CrossRef]
  23. Markeb, A.A.; Moral-Vico, J.; Sanchez, A.; Font, X. Optimization of lead (II) removal from water and wastewater using a novel magnetic nanocomposite of aminopropyl triethoxysilane coated with carboxymethyl cellulose cross-linked with shitosan nanoparticles. Arab. J. Chem. 2023, 16, 105022. [Google Scholar] [CrossRef]
  24. Beinabaj, S.M.H.; Heydariyan, H.; Aleii, H.M.; Hosseinzadeh, A. Concentration of heavy metals in leachate, soil, and plants in Teheran’s landfill: Investigation of the effect of landfill age on the intesity of polluation. Heliyon 2023, 9, e13017. [Google Scholar] [CrossRef] [PubMed]
  25. Huang, W.Y.; Huang, C.W.; Li, Y.L.; Huang, T.P.; Lin, C.; Ngo, H.H.; Bui, X.T. Reduced pollution level and ecological risk of mercury-polluted sediment in a alkali-chlorine factory’s brine water storage pond after corrective actions: A case study in Southern Taiwan. Environ. Technol. Innov. 2023, 29, 103003. [Google Scholar] [CrossRef]
  26. Muhammad, S.; Shah, M.T.; Khan, S. Health risk assessment of heavy metals and their source apportionment in drinking water of Kohistan region, northern Pakistan. Microchem. J. 2011, 98, 334–343. [Google Scholar] [CrossRef]
  27. Biswas, A.K.; Tortajada, C. Water crisis and water wars: Myths and realities. Int. J. Water Resour. Dev. 2019, 35, 727–731. [Google Scholar] [CrossRef]
  28. Mihali, C.; Dippong, T. Water quality assessment of Remeti watercourse, Maramures, Romania, located in a Natura 2000 protected area subjected to anthropic pressure. J. Contam. Hydrol. 2023, 257, 104216. [Google Scholar] [CrossRef]
  29. Dippong, T.; Mihali, C.; Mare Rosca, O.; Marian, M.; Payer, M.M.; Țîbîrnac, M.; Bud, S.; Coman, G.; Kovacs, E.; Hoaghia, M.-A. Physico-chemical characterization of water wells from Remeti, Maramures. Stud. Univ. Babes-Bolyai Chem. 2021, 66, 197–211. [Google Scholar] [CrossRef]
  30. Varol, M.; Tokatli, C. Evaluation of the water quality of a highly polluted stream with water quality indices and health risk assessment methods. Chemosphere 2023, 311, 137096. [Google Scholar] [CrossRef]
  31. Dippong, T.; Mihali, C.; Cical, E. Metode de Determinare a Proprietăților Fizico-Chimice ale Alimentelor; Risoprint: Cluj-Napoca, Romania, 2016; ISBN 978-973-53-1773-7. (In Romanian) [Google Scholar]
  32. SR EN ISO 5667-3:2018; Calitatea Apei. Prelevare. Partea 3: Conservarea şi Manevrarea Probelor de Apă. ISO: Geneva, Switzerland, 2018. (In Romanian)
  33. ISO 7888:1985; Water Quality—Determination of Electrical Conductivity. ISO: Geneva, Switzerland, 1985.
  34. SR EN ISO 10523:2012; Calitatea Apei. Determinarea pH-ului. ISO: Geneva, Switzerland, 2012. (In Romanian)
  35. SR EN ISO 8467:2001; Calitatea Apei. Determinarea Indicelui de Permanganat. ISO: Geneva, Switzerland, 2001. (In Romanian)
  36. SR EN ISO 5814:2013; Calitatea Apei. Determinarea Conţinutului de Oxigen Dizolvat. Metoda Electrochimică cu Sonda. ISO: Geneva, Switzerland, 2013. (In Romanian)
  37. SR EN ISO 9963-1:2002; Calitatea Apei. Determinarea Alcalinităţii. Partea 1: Determinarea Alcalinităţii Totale şi Permanent. ISO: Geneva, Switzerland, 2002. (In Romanian)
  38. SR ISO 9297:2001; Calitatea Apei. Determinarea Conţinutului de Cloruri. Titrare cu Azotat de Argint Utilizând Cromatul ca Indicator (Metoda Mohr). ISO: Geneva, Switzerland, 2001. (In Romanian)
  39. SR ISO 6058:2008; Calitatea Apei. Determinarea Calciului. Metoda Iitrimetrică cu EDTA. ISO: Geneva, Switzerland, 2008. (In Romanian)
  40. SR ISO 10566:2001; Calitatea Apei. Determinarea Conţinutului de Aluminiu. Metoda Spectrometrică cu Violet de Pirocatechol. ISO: Geneva, Switzerland, 2001. (In Romanian)
  41. SR ISO 7150-1:2001; Calitatea Apei. Determinarea Conţinutului de Amoniu. Partea 1: Metoda Spectrometrică Manual. ISO: Geneva, Switzerland, 2001. (In Romanian)
  42. SR ISO 7890-3:2000; Calitatea Apei. Determinarea Conţinutului de Azotaţi. Partea 3: Metoda Spectrometrică cu Acid Sulfosalicylic. ISO: Geneva, Switzerland, 2000. (In Romanian)
  43. SR EN 26777:2002; Calitatea Apei. Determinarea Conţinutului de Nitriţi. Metoda Prin Spectrometrie de Absorbţie Moleculară. ISO: Geneva, Switzerland, 2002. (In Romanian)
  44. SR EN ISO 6878:2005; Calitatea Apei. Determinarea Fosforului. Metoda Spectrofotometrică cu Molibdat de Amoniu. ISO: Geneva, Switzerland, 2005. (In Romanian)
  45. SR ISO 6332:1996; Calitatea Apei. Determinarea Conţinutului de Fier. Metoda Spectrometrică cu 1,10—fenantrolină. ISO: Geneva, Switzerland, 1996. (In Romanian)
  46. SR EN ISO 7027:2001Calitatea Apei. Determinarea Turbidităţii. ISO: Geneva, Switzerland,, 2001. (In Romanian)
  47. Dippong, T.; Mihali, C.; Hoaghia, A.M.; Cical, E.; Cosma, A. Chemical modeling of groundwater quality in the aquifer of Seini town-Somes Plain, Northwestern Romania. Ecotoxicol. Environ. Saf. 2019, 168, 88–101. [Google Scholar] [CrossRef]
  48. Mare Roșca, O.; Dippong, T.; Marian, M.; Mihali, C.; Mihalescu, L.; Hoaghia, M.A.; Jelea, M. Impact of anthropogenic activities on water quality parameters of glacial lakes from Rodnei mountains, Romania. Environ. Res. 2020, 182, 109136. [Google Scholar] [CrossRef]
  49. Uddin, M.G.; Nash, S.; Agnieszka, I.; Olbert, A.I. A review of water quality index models and their use for assessing surface water quality. Ecol. Indic. 2021, 122, 107218. [Google Scholar] [CrossRef]
  50. Varol, S.; Davraz, A. Evaluation of the groundwater quality with WQI (Water Quality Index) and multivariate analysis: A case study of the Tefenni plain (Burdur/Turkey). Environ. Earth Sci. 2014, 73, 1725–1744. [Google Scholar] [CrossRef]
  51. Napo, G.; Akpataku, K.V.; Seyf-Laye, A.S.M.; Gnazou, M.D.T.; Bawa, L.M.; Djaneye-Boundjou, G. Assessment of Shallow Groundwater Quality Using Water Quality Index and Human Risk Assessment in the Vogan-Attitogon Plateau, Southeastern (Togo). J. Environ. Poll. Hum. Health 2021, 9, 50–63. [Google Scholar] [CrossRef]
  52. Council Directive. 98/83/EC—On the Quality of Water Intended for Human Consumption. Available online: https://eur-lex.europa.eu/legal-content/EN/TXT/?uri=celex%3A31998L0083 (accessed on 9 October 2023).
  53. Chatanga, P.; Ntuli, V.; Mugomeri, E.; Keketsi, T.; Chikowore, T.V.N. Situational analysis of physico-chemical, biochemical, and microbiological quality of water along Mohokare River, Lesotho. Egypt. J. Aquat. Res. 2019, 45, 45–51. [Google Scholar] [CrossRef]
  54. Rupias, O.J.B.; Pereira, S.Y.; Silva de Abreu, A.E. Hydrogeochemistry and groundwater quality assessment using the water quality index and heavy-metal pollution index in the alluvial plain of Atibaia river-Campinas/SP, Brazil. Groundw. Sustain. Dev. 2021, 15, 100661. [Google Scholar] [CrossRef]
  55. WHO. Guidelines for Drinking-Water Quality, 4th ed.; Incorporating the 1st Addendum; WHO: Geneva, Switzerland, 2017. [Google Scholar]
  56. Average Height and Weight by Country. Available online: https://www.worlddata.info/average-bodyheight.php (accessed on 2 November 2023).
  57. Pal, M.; Samal, N.R.; Roy, P.K.; Roy, M.B. Electrical conductivity of lake waters as environmental monitoring—A case study of Rudrasagar Lake. J. Environ. Sci. Toxicol. Food Technol. 2015, 9, 2319–2399. [Google Scholar] [CrossRef]
  58. Asadi, E.; Isazadeh, M.; Samadianfard, S.; Ramli, M.F.; Mosavi, A.; Nabipour, N.; Shamshriband, S.; Hajnal, E.; Chau, K.-W. Groundwater quality assessment for sustainable drinking and irrigation. Sustainability 2020, 12, 177. [Google Scholar] [CrossRef]
  59. Adesakin, T.A.; Oyewale, A.T.; Bayero, U.; Mohammed, A.N.; Aduwo, I.A.; Ahmed, P.Z.; Abubakar, N.D.; Barje, I.B. Asses ment of bacteriological quality and physicochemical parameters of domestic water sources in Samaru community, Zaria, Northwest Nigeria. Heliyon 2020, 6, e04773. [Google Scholar] [CrossRef]
  60. Spyra, A. Acidic, neutral and alkaline forest ponds and lanscape element affecting the biodiversity of freshwater snails. Sci. Nat. 2017, 104, 73. [Google Scholar] [CrossRef]
  61. Du, J.; Shen, J. Decoupling the influence of biological and physical processes on the dissolved oxygen in the Chesapeake Bay. J. Geophys. Res. Oceans 2015, 120, 78–93. [Google Scholar] [CrossRef]
  62. Borzog-Haddad, O.; Delpasand, M.; Loaiciga, H.A. Chapter 10: Water quality, hygiene and health. In Economical, Political, and Social Issues in Water Resources; Borzog-Haddad, O., Ed.; Elsevier: Amsterdam, The Netherlands, 2021; pp. 217–257. [Google Scholar] [CrossRef]
  63. Order No. 1146/2002 for the Approval of the Normative on the Reference Objectives for the Classification of Surface Water Quality Issued by the Ministry of Water and Environmental Protection—MAPM. Available online: https://lege5.ro/gratuit/hezteobt/clasificarea-calitatii-apei-de-suprafata-si-a-sedimentelor-normativ?dp=giztcmjzgiyta (accessed on 15 September 2023). (in Romanian).
  64. Zdorovennova, G.; Palshin, N.; Golosov, S.; Efremova, T.; Belashev, B.; Bogdanov, S.; Fedorova, I.; Zverev, I.; Zdorovennov, R.; Terzhevik, A. Dissolved Oxygen in a Shallow Ice-Covered Lake in Winter: Effect of Changes in Light, Thermal and Ice Regimes. Water 2021, 13, 2435. [Google Scholar] [CrossRef]
  65. Constantin, S.; Doxaran, D.; Constantinescu, Ș. Estimation of water turbidity and analysis of its spatio-temporal variability in the Danube River plume (Black Sea) using MODIS satellite data. Cont. Shelf Res. 2016, 112, 14–30. [Google Scholar] [CrossRef]
  66. Mann, A.G.; Tam, C.C.; Higgins, C.D.; Rodrigues, L.C. The association between drinking water turbidity and gastrointestinal illness: A systematic review. BMC Public Health 2007, 7, 256. [Google Scholar] [CrossRef] [PubMed]
  67. Horvat, M.; Horvat, Z. Long term sediment transport simulation of the Danube, Sava and Tisa rivers. Int. J. Sediment Res. 2020, 35, 550–561. [Google Scholar] [CrossRef]
  68. Fan, B.; Li, J.; Wang, X.; Chen, J.; Gao, X.; Li, W.; Ai, S.; Cui, L.; Gao, S.; Liu, Z. Ammonia spatiotemporal distribution and risk assessment for freshwater species in aquatic ecosystem in China. Ecotoxicol. Environ. Saf. 2021, 207, 111541. [Google Scholar] [CrossRef] [PubMed]
  69. Qi, X.-Z.; Xue, M.-Y.; Yang, S.-B.; Zha, J.-W.; Wang, G.-X.; Ling, F. Ammonia exposure alters the expression of immune-related and antioxidant enzymes-related genes and the gut microbial community of crucian carp (Carassius auratus). Fish Shellfish. Immunol. 2017, 70, 485–492. [Google Scholar] [CrossRef] [PubMed]
  70. Okonkwo, O.J.; Mothiba, M. Physico-chemical characteristics and pollution levels of heavy metals in the rivers in Thohoyandou, South Africa. J. Hydrol. 2005, 308, 122–127. [Google Scholar] [CrossRef]
  71. Ren, C.; Zhang, Q.; Wang, H.; Wang, Y. Identification of Sources and Transformations of Nitrate in the Intense Human Activity Region of North China Using a Multi-Isotope and Bayesian Mode. Int. J. Environ. Res. Public Health 2021, 18, 8642. [Google Scholar] [CrossRef]
  72. Sebilo, M.; Mayer, B.; Nicolardot, B.; Pinay, G. Long-term fate of nitrate fertilizer in agricultural soils. Proc. Natl. Acad. Sci. USA 2013, 110, 18185–18189. [Google Scholar] [CrossRef]
  73. Singh, A.K.; Mondal, G.C.; Kumar, S.; Singh, T.B.; Tewary, B.K.; Sinha, A. Major ion chemistry, weathering processes and water quality assessment in upper catchment of Damodar River basin, India. Environ. Geol. 2008, 54, 745–758. [Google Scholar] [CrossRef]
  74. Schoumans, O.F.; Bouraoui, F.; Kabbe, C.; Oenema, O.; van Dijk, K.C. Phosphorus management in Europe in a changing world. AMBIO 2015, 44, S180–S192. [Google Scholar] [CrossRef] [PubMed]
  75. Zhou, W.; Lan, T.; Shang, G.; Li, J.; Geng, J. Adsorption performance of phosphate in water by mixed precursor base geopolymers. J. Contam. Hydrol. 2023, 255, 104166. [Google Scholar] [CrossRef] [PubMed]
  76. Proorocu, M.; Coste, C.; Mihaescu, T.; Varban, D.; Aschilean, I. The quality of the surface water in 6 North—West Region. ProEnvironment 2008, 1, 29–31. [Google Scholar]
  77. Zhang, H.; Chen, J.; Douglas, G.; Haffner, D.G. Plateau Lake Water Quality and Eutrophication: Status and Challenges. Water 2023, 15, 337. [Google Scholar] [CrossRef]
  78. Adeyemi, A.A.; Ojekunle, Z.O. Concentration and health risk assessment of industrial heavy metals pollution in Ogun state, Nigeria. Sci. Afr. 2021, 11, e00666. [Google Scholar] [CrossRef]
  79. Ibrahim, K.O.; Gomo, M.; Oke, S.A. Groundwater quality assessment of shallow aquifer hand dug wells in rural localities of Ilorin northcentral Nigeria: Implications for domestic and irrigation uses. Groundw. Sustain. Develop. 2019, 9, 100226. [Google Scholar] [CrossRef]
  80. Kaushal, S.S. Increased salinization decreases safe drinking water. Environ. Sci. Technol. 2016, 50, 2765–2766. [Google Scholar] [CrossRef]
  81. Chapra, S.C.; Camacho, L.A.; McBride, G.B. Impact of Global Warming on Dissolved Oxygen and BOD Assimilative Capacity of the World’s Rivers: Modeling Analysis. Water 2021, 13, 2408. [Google Scholar] [CrossRef]
  82. Hu, X.; Shi, X.; Su, R.; Jin, Y.; Ren, S.; Li, X. Spatiotemporal patterns and influencing factors of dissolved heavy metals off the Yangtze River Estuary, East China Sea. Mar. Pollut. Bull. 2022, 182, 112975. [Google Scholar] [CrossRef]
  83. Du Laing, G.; De Vos, R.; Vandecasteele, B.; Lesage, E.; Tack, F.M.G.; Verloo, M.G. Effect of salinity on heavy metal mobility and availability in intertidal sediments of the Scheldt estuary. Estuar. Coast. Shelf Sci. 2008, 77, 589–602. [Google Scholar] [CrossRef]
  84. Moya, S.M.; Botella, N.B. Review of Techniques to Reduce and Prevent Carbonate Scale. Prospecting in water treatment by magnetism and electromagnetism. Water 2021, 13, 2365. [Google Scholar] [CrossRef]
  85. Tenan, M.R.; Nicolle, A.; Moralli, D.; Verbouwe, E.; Jankowska, J.D.; Durin, M.-A.; Green, C.M.; Mandriota, S.J.; Sappino, A.P. Aluminum Enters Mammalian Cells and Destabilizes Chromosome Structure and Number. Int. J. Molec. Sci. 2021, 22, 9515. [Google Scholar] [CrossRef] [PubMed]
  86. Krupinska, I. Aluminium drinking water treatment residuals and their toxic impact on human health. Molecules 2020, 25, 641. [Google Scholar] [CrossRef] [PubMed]
  87. Gonzalez, S.O.; Almeida, C.A.; Calderon, M.; Mallea, M.A.; Gonzalez, P. Assessment of the water self-purification capacity on a river affected by organic pollution: Application of chemometrics in spatial and temporal variations. Environ. Sci. Pollut. Res. 2014, 21, 10583–10593. [Google Scholar] [CrossRef]
  88. Weisner, M.L.; Harris, M.S.; Mitsova, D.; Liu, W. Drinking water disparities and aluminum concentrations: Assessing socio-spatial dimensions across an urban landscape. Soc. Sci. Humanit. Open 2023, 8, 100536. [Google Scholar] [CrossRef]
  89. Mohammadpour, A.; Hosseini, M.R.; Dehbandi, R.; Khodadadi, N.; Keshtkar, M.; Shahvasani, E.; Elshall, A.S.; Azhdarpoor, A. Probabilistic human health risk assessment and Sobol sensitivity reveal the major health risk parameters of aluminum in drinking water in Shiraz, Iran. Environ. Geochem. Health 2023, 45, 7665–7677. [Google Scholar] [CrossRef]
  90. Rondeau, V.; Commenges, D.; Jacqmin-Gadda, H.; Dartigues, J.-F. Relation between aluminum concentrations in drinking water and Alzheimer’s disease: An 8-year follow-up study. Am. J. Epidemiol. 2000, 152, 59–66. [Google Scholar] [CrossRef] [PubMed]
  91. Rosseland, B.O.; Eldhuset, T.D.; Staurnes, M. Environmental effects of aluminium. Environ. Geochem. Health 1990, 12, 17–27. [Google Scholar] [CrossRef]
  92. Verbruggen, E.M.J.; Smit, C.E.; van Vlaardingen, P.L.A. Environmental Quality Standards for Barium in Surface Water: Proposal for an Update According to the Methodology of the Water Framework Directive; National Institute for Public Health and the Environment (RIVM): Bilthoven, The Netherlands, 2020; pp. 1–111. [CrossRef]
  93. Kaur, A.; Parkash, C. Barium: Presence in environment and health effects. Eco. Environ. Cons. 2022, 28, 2210–2213. [Google Scholar] [CrossRef]
  94. World Health Organization. Guidelines for Drinking-Water Quality, 4th ed.; WHO: Geneva, Switzerland, 2011; pp. 1–564. [Google Scholar]
  95. Begum, W.; Rai, S.; Banerjee, S.; Bhattacharjee, S.; Mondal, M.H.; Bhattarai, A.; Saha, B. A comprehensive review on the sources, essentiality and toxicological profile of nickel. RCS Adv. 2022, 12, 9139. [Google Scholar] [CrossRef]
  96. World Health Organization. Nickel in Drinking-Water: Background Document for Development of WHO Guidelines for Drinking-Water Quality; WHO: Geneva, Switzerland, 2021; pp. 1–36. [Google Scholar]
  97. El-Naggar, A.; Ahmed, N.; Mosa, A.; Niazi, N.K.; Yousaf, B.; Sharma, A.; Sarkar, B.; Cai, Y.; Chang, S.X. Nickel in soil and water: Sources, biogeochemistry, and remediation using biochar. J. Hazard. Mater. 2021, 419, 126421. [Google Scholar] [CrossRef]
  98. Algül, F.; Beyhan, M. Concentrations and sources of heavy metals in shallow sediments in Lake Bafa, Turkey. Sci. Rep. 2020, 10, 11782. [Google Scholar] [CrossRef] [PubMed]
  99. Krok, B.; Mohammadian, S.; Noll, H.M.; Surau, C.; Markwort, S.; Fritzsche, A.; Nachev, M.; Sures, B.; Meckenstock, R.U. Remediation of zinc-contaminated groundwater by iron oxide in situ adsorption barriers—From lab to the field. Sci. Total Environ. 2022, 897, 151066. [Google Scholar] [CrossRef] [PubMed]
  100. Eslami, H.; Esmaeili, A.; Razaeian, M.; Salari, M.; Hosseini, A.N.; Mobini, M.; Barani, A. Potentially toxic metal concentration, spatial distribution, and health risk assessment in drinking groundwater resources of southeast Iran. Geosci. Front. 2022, 13, 101276. [Google Scholar] [CrossRef]
  101. O’Neal, S.L.; Zheng, W. Manganese toxicity upon overexposure: A decade in review. Curr. Environ. Health Rep. 2015, 2, 315–328. [Google Scholar] [CrossRef]
  102. van Wendel de Joode, B.; Barbeau, B.; Bouchard, M.F.; Mora, A.M.; Skytt, A.; Cordoba, L.; Quesada, R.; Lundh, T.; Lindh, C.H.; Mergler, D. Manganese concentrations in drinking water from villages near banana plantations with aerial mancozeb spraying in Costa Rica: Results from the Infants’ Environmental Health Study. Environ. Pollut. 2016, 215, 247–257. [Google Scholar] [CrossRef] [PubMed]
  103. Manea, A.; Dumitru, M.; Vrinceanu, N.; Eftene, A.; Anghel, A.; Vrinceanu, A.; Ignat, P.; Dumitru, S.; Mocanu, V. Soil heavy metal status from Maramures county, Romania. In Proceedings of the GLOREP 2108 Conference, Timisoara, Romania, 15–17 November 2018. [Google Scholar]
  104. Strungaru, S.-A.; Nicoara, M.; Teodosiu, C.; Baltag, E.; Ciobanu, C.; Plavan, G. Patterns of toxic metals bioaccumulation in a cross-border freshwater reservoir. Chemosphere 2018, 207, 192–202. [Google Scholar] [CrossRef] [PubMed]
  105. Soroaga, L.V.; Amarandei, C.; Negru, A.G.; Olariu, R.I.; Arsene, C. Assessment of the Anthropogenic Impact and Distribution of Potentially Toxic and Rare Earth Elements in Lake Sediments from North-Eastern Romania. Toxics 2022, 10, 242. [Google Scholar] [CrossRef] [PubMed]
  106. European Union. European Commission, Directorate-General for Environment, The Environmental Implementation Review—Romania; Publications Office of the European Union: Luxembourg, 2019; pp. 1–35. Available online: https://environment.ec.europa.eu (accessed on 13 November 2023).
  107. European Commission. EU Environmental Implementation Review Country Report—Romania. 2017. Available online: http://ec.europa.eu/environment/eir/pdf/report_ro_en.pdf (accessed on 13 November 2023).
  108. Khokhar, L.A.K.; Khuhawar, M.Y.; Khuhawar, T.M.J.; Lanjwani, M.F.; Arain, G.M.; Khokhar, F.M.; Khaskheli, M.I. Spatial variability and hydrochemical quality of groundwater of Hyderabad Rural, Sindh, Pakistan. Sustain. Water Res. Manag. 2023, 9, 164. [Google Scholar] [CrossRef]
  109. Mishra, S.; Kumar, A.; Yadav, S.; Singhal, M.K. Assessment of heavy metal contamination in water of Kali River using principle component and cluster analysis, India. Sustain. Water Resour. Manag. 2018, 4, 573–581. [Google Scholar] [CrossRef]
  110. Mishra, S.; Kumar, A.; Shukla, P. Study of water quality in Hindon River using pollution index and environmetrics, India. Desalination Water Treat. 2016, 57, 19121–19130. [Google Scholar] [CrossRef]
  111. Babcsanyi, I.; Tamas, M.; Szatmari, J.; Hambek-Olah, B.; Farsang, A. Assessing the impacts of the main river and anthropogenic use on the degree of metal contamination of oxbow lake sediments (Tisza River Valley, Hungary). J. Soils Sediments 2020, 20, 1662–1675. [Google Scholar] [CrossRef]
  112. Sakan, S.; Grzetic, I.; Dordevic, I. Distribution and Fractionation of Heavy Metals in the Tisa (Tisza) River Sediments. Environ. Sci. Pollut. Res. 2007, 14, 229–236. [Google Scholar] [CrossRef] [PubMed]
  113. Sakan, S.M.; Dordevic, D.S.; Dragan, D.M.; Predrag, P.S. Assessment of heavy metal pollutants accumulation in the Tisza river sediments. J. Environ. Manag. 2009, 90, 3382–3390. [Google Scholar] [CrossRef] [PubMed]
  114. Sur, I.M.; Moldovan, A.; Micle, V.; Polyak, E.T. Assessment of surface water quality in the Baia Mare area, Romania. Water 2022, 14, 3118. [Google Scholar] [CrossRef]
  115. Ewaid, S.H.; Abed, S.A. Water quality index for Al-Gharraf River, southern Iraq. Egypt. J. Aquat. Res. 2017, 43, 117–122. [Google Scholar] [CrossRef]
  116. Goher, M.E.; Hassan, A.M.; Abdel-Moniem, I.A.; Fahmy, A.H.; Seliem, M.; El-Sayed, S.M. Evaluation of surface water quality and heavy metal indices of Ismailia Canal, Nile River, Egypt. Egypt. J. Aquat. Res. 2014, 40, 225–233. [Google Scholar] [CrossRef]
  117. Mohamed, A.; Saiful, I.; Towfiqul, I.; Bhuyan, S.; Shafiuddin, A.; Zillur, R.; Mostafizur, R. Toxic metal pollution and ecological risk assessment in water and sediment at ship breaking sites in the bay of Bengal coast, Bangladesh. Mar. Pollut. Bull. 2021, 175, 113274. [Google Scholar] [CrossRef]
Figure 1. Sampling points in the studied area; the perimeter of Lake Teceu is marked in blue. The lake is surrounded by trees and covered with aquatic vegetation.
Water 15 03996 g001
Figure 2. Evolution of the electric conductivity (EC) of water samples during the months of 2022 (see Supplementary Materials) for the 3 sampling points: Teceu Lake 1 (TL 1), Teceu Lake 2 (TL 2), and the adjacent potable groundwater source (PGWS).
Water 15 03996 g002
Figure 3. Evolution of pH in the water samples during the months of 2022.
Water 15 03996 g003
Figure 4. Evolution of dissolved oxygen (DO) in the water samples during the months of 2022.
Water 15 03996 g004
Figure 5. Evolution of water turbidity in the water samples during the months of 2022.
Water 15 03996 g005
Figure 6. Evolution of ammonium (NH4+) in the water samples during the months of 2022.
Water 15 03996 g006
Figure 7. Evolution of nitrates (NO3) in the water samples during the months of 2022.
Water 15 03996 g007
Figure 8. Evolution of phosphates in the water samples during the months of 2022.
Water 15 03996 g008
Figure 9. Evolution of chlorides (Cl) in the water samples during the month of 2022.
Water 15 03996 g009
Figure 10. Evolution of water hardness in the water samples during the months of 2022.
Water 15 03996 g010
Figure 11. Evolution of water alkalinity in the water samples during the months of 2022.
Water 15 03996 g011
Figure 12. Evolution of water temperature in the water samples during the months of 2022.
Water 15 03996 g012
Figure 13. Cluster analysis in Q mode for Teceu Lake TL1, TL2, and groundwater potable water source for the sampling months January–December, as observations based on the physico-chemical parameters.
Water 15 03996 g013
Figure 14. Cluster analysis of Teceu Lake TL1, TL2, and groundwater potable water source based on metal concentrations in Q mode (a) and R mode (b).
Water 15 03996 g014
Figure 15. The evolution of the water quality indices (WQI) over 2022.
Water 15 03996 g015
Figure 16. The contribution of water parameters to the water quality indices (WQI) over 2022 for the three sampling points (TL1, TL2, and GWPS).
Water 15 03996 g016
Table 1. The physico-chemical parameters used in the calculation of WQI; the parametric values and weights used.
Physico-Chemical ParameterParametric Value, pv *Weight, WiRelative Weight, wiVariation of Q **
EC (μS/cm)25004 × 10−45.69 × 10−59.84–99.52
pH9.50.110.01562–40
DO (mg/L)50.20.02840.1–11.91
T (NTU) **50.20.028443.2–186
NH4+ (mg/L)0.520.284317.4–382
NO3 (mg/L)500.020.00281.34–42
NO2 (mg/L)0.520.28430–0.016
Cl (mg/L)2504 × 10−35.69 × 10−47–74.72
PO43− (mg/L)0.42.50.355412.5–130
* according to [52,55] for dissolved oxygen. ** the rating scale for each physico-chemical indicator in the present study.
Table 2. Physico-chemical composition for water samples as average values for 12 samples (January–December 2022).
ParameterTeceu Lake 1
(TL1)
Teceu Lake 2
(TL2)
Potable Groundwater Source (PGWS)MeanSDCV, %Stnd.
Skewness
Stnd.
Kurtosis
MAC *
EC (μS/cm)330 ± 81346 ± 851917.5 ± 290.9864.777589.62.13−1.232500
pH7.74 ± 0.187.49 ± 0.237.10 ± 0.177.440.334.5−0.25−1.236.5–9.5
DO (mg/L)9.59 ± 1.719.35 ± 1.855.42 ± 0.468.122.4129.720.50−1.63
OS (%)93.82 ± 6.9791.67 ± 8.3454.75 ± 8.2780.0519.724.63−1.62−1.27
T (NTU) **4.45 ± 2.074.32 ± 2.014.14 ± 1.204.091.2731.040.02−1.655
NH4+ (mg/L)0.54 ± 0.390.68 ± 0.520.28 ± 0.190.500.4283.444.113.470.5
NO3 (mg/L)2.38 ± 2.993.7 ± 4.215.38 ± 5.413.824.37114.55.938.2050
NO2 (mg/L)0.0008 ± 0.00060.0011 ± 0.00220.0005 ± 0.00068.6 × 10−40.0013166.010.1726.040.5
ht (og)7.53 ± 1.708.50 ± 2.3221.72 ± 4.4512.827.0855.232.500.38Min 5
A (mg/L CaCO3)140.16 ± 31.45152.42 ± 32.55190.02 ± 27.33160.8636.6222.77−0.22−0.26
Cl (mg/L)39.46 ± 16.2642.25 ± 16.55234.05 ± 112.8086.6568.6679.241.89−1.32250
PO43− (mg/L)0.23 ± 0.130.31 ± 0.140.18 ± 0.100.220.1466.160.69−0.890.4
Temp (°C)13.2 ± 8.813.4 ± 8.913.10 ± 7.713.088.1462.220.94−1.75
* MAC = maximum allowable concentration or limit according to Romanian legislation for drinking water. ** NTU = Nephelometric Turbidity Units. SD: standard deviation; CV: coefficient of variance; Stnd = standardized.
Table 3. The metal content in Teceu Lake (TL1, TL2) and in the potable groundwater source; average value of metals content (for the three samples) and guidelines (MAC) according to 98/83/EC Council Directive.
ParameterTeceu Lake TL1Teceu Lake TL2Groundwater Potable SourceMeanSDCV, %Stnd.
Skewness
MACMAC WHO
Al (μg/L)50.30 ± 2.1 *26.03 ± 1.6117.8 ± 3.564.7147.5573.480.87200100–200
Ba (μg/L)64.74 ± 2.939.80 ± 1.888.98 ± 3.464.5124.5938.12−0.03700700–2000
Cu (μg/L)6.44 ± 0.464.17 ± 0.298.01 ± 0.586.211.9331.11−0.3820002000
Ga (μg/L)24.39 ± 1.3714.67 ± 0.8435.99 ± 1.6325.021.9342.670.19--
Li (μg/L)3.84 ± 0.382.83 ± 0.2310.22 ± 0.865.634.0171.171.14300–130
Mn (μg/L)93.21 ± 3.6694.13 ± 3.7192.65 ± 3.5593.330.750.800.495050
Ni (μg/L)2.74 ± 0.144.70 ± 0.233.22 ± 0.173.551.0228.750.93207.9–16.6
Rb (μg/L)0.75 ± 0.040.55 ± 0.020.28 ± 0.010.530.2444.79−0.31--
Zn (μg/L)57.1 ± 2.8618.07 ± 0.9392.23 ± 4.6155.837.166.48−0.1150005000
Ti (μg/L)22.7 ± 1.1418.83 ± 0.9442.13 ± 2.1127.8812.4944.471.09--
Mo (μg/L)2.60 ± 0.121.85 ± 0.090.86 ± 0.031.770.8749.31−0.29--
K (mg/L)1.98 ± 0.090.95 ± 0.047.40 ± 0.263.443.47100.631.11010
Na (mg/L)9.41 ± 0.469.16 ± 0.4231.26 ± 1.4616.6112.6876.381.22200200
Fe (mg/L)0.095 ± 0.0050.128 ± 0.0060.39 ± 0.0210.200.1679.101.170.20.200
Mg (mg/L)18.36 ± 0.1227.41 ± 0.8438.76 ± 1.2728.1610.2536.411.085050
Ca (mg/L)48.43 ± 0.3340.02 ± 0.6773.97 ± 1.4954.1417.6732.65−0.86100100
Sr (μg/L)0.220 ± 0.0090.100 ± 0.0050.890 ± 0.0430.400.43105.551.12700050
* values and standard deviation of three replicates. MAC maximum allowable concentration in drinking water, according to Law 311/2004 458/2002 Law M.O. No. 552/29 July 2002—Law on the quality of drinking water. MAC WHO—maximum allowable concentration in drinking water; according to the World Health Organization Guidelines for drinking-water quality. SD: standard deviation; CV: coefficient of variance; Stnd: standardized.
Table 4. Pearson’s correlation coefficients between major and trace metals in the water samples.
AlBaCuGaLiMnNiRbZnTiMoKNaFeMgCaSr
Al1
Ba0.961
Cu0.930.991
Ga0.970.99 *0.981
Li0.990.910.870.941
Mn−0.91−0.99−0.99 *−0.98−0.851
Ni−0.51−0.73−0.79−0.68−0.400.811
Rb−0.76−0.56−0.48−0.61−0.840.45−0.151
Zn0.950.99 *0.99 *0.990.91−0.99−0.74−0.541
Ti0.990.930.890.950.99 *−0.87−0.43−0.830.921
Mo−0.76−0.56−0.47−0.60−0.840.45−0.161 **−0.54−0.831
K0.990.920.880.950.99−0.87−0.42−0.830.911 **−0.831
Na−0.970.870.810.890.99−0.79−0.29−0.900.850.98−0.890.991
Fe0.930.800.740.830.97−0.72−0.18−0.940.790.96−0.940.970.991
Mg0.910.760.700.800.96−0.67−0.12−0.960.750.94−0.960.950.890.99 *1
Ca0.510.250.160.310.61−0.120.48−0.940.230.59−0.940.590.970.770.811
Sr0.990.920.880.950.99 **−0.87−0.41−0.830.910.99 **−0.831 **0.990.970.950.601
EC0.960.820.800.890.99−0.79−0.28−0.910.840.98−0.900.980.99 **0.990.890.970.98
pH−0.83−0.65−0.57−0.69−0.890.54−0.050.99−0.63−0.880.99−0.88−0.94−0.97−0.99−0.84−0.88
DO−0.94−0.83−0.77−0.86−0.980.750.220.93−0.81−0.980.93−0.97−0.99 *−0.99 *−0.92−0.95−0.98
T−0.95−0.83−0.78−0.87−0.990.760.240.92−0.82−0.970.92−0.98−0.99 *−0.99 *−0.91−0.95−0.98
NH4+−0.99 *−0.95−0.92−0.97−0.990.900.480.79−0.94−0.99 *0.79−0.99 *−0.97−0.95−0.78−0.99 *−0.99 *
NO30.940.820.700.850.98−0.74−0.20−0.940.81−0.97−0.930.970.990.99 *0.930.950.98
ht0.940.800.740.840.97−0.72−0.14−0.950.790.96−0.940.970.991 *0.940.940.97
A0.520.260.170.320.62−0.140.47−0.950.840.59−0.950.600.710.780.950.530.61
Cl0.970.860.800.890.99−0.78−0.27−0.910.850.98−0.900.980.99 *0.990.900.970.98
PO43−0.820.630.550.670.88−0.530.07−0.990.610.87−0.990.670.930.970.990.830.88
* p-values below 0.05 indicate statistically significant non-zero correlations at the 95.0% confidence level. ** p-values below 0.01 indicate statistically significant non-zero correlations at the 99.0% confidence level.
Table 5. Values of non-carcinogenic risks through water consumption.
Water SampleHQ(NH4+)HQ(NO3)HQMnHI
MaleFemaleMaleFemaleMaleFemaleMaleFemale
TL10.0130.0150.0350.0410.0160.0180.0640.075
TL20.0160.0190.0540.0640.0160.0190.0870.102
GWPS0.0070.0080.0790.0930.0160.0180.1010.120
Disclaimer/Publisher’s Note: The statements, opinions and data contained in all publications are solely those of the individual author(s) and contributor(s) and not of MDPI and/or the editor(s). MDPI and/or the editor(s) disclaim responsibility for any injury to people or property resulting from any ideas, methods, instructions or products referred to in the content.

