Article

Comparison of Solubilization Treatment Technologies for Phosphorus Release from Anaerobic Digestate of Livestock Manure

1
Department of Civil and Environmental Engineering, Konkuk University, 120 Neungdong-ro, Gwangjin-gu, Seoul 05029, Republic of Korea
2
Department of Tech Center for Research Facilities, Konkuk University, 120 Neungdong-ro, Gwangjin-gu, Seoul 05029, Republic of Korea
*
Author to whom correspondence should be addressed.
These authors contributed equally to this work.
Water 2023, 15(23), 4033; https://doi.org/10.3390/w15234033
Submission received: 25 October 2023 / Revised: 15 November 2023 / Accepted: 16 November 2023 / Published: 21 November 2023
(This article belongs to the Special Issue Nanoparticle Removal and Remediation Processes in Water and Soil)

Abstract

:
This study addresses the imminent threat of phosphorus (P) depletion, investigating anaerobically digested livestock manure as a high-concentration P alternative. To achieve this objective, Visual MINTEQ software, a general-purpose software used for chemical equilibrium modeling, was employed to simulate the alteration in P species fractions at different pH levels. The investigation further examined the variation in P release rates and electrical energy consumption across various pretreatment processes as influenced by pH levels. The results indicate a significant pH influence on P release, with enhanced efficacy under both acidic and alkaline conditions. At pH 2, total P concentration peaked at 684 mg·L−1, with 83.0% reactive P, in contrast with pH 10 conditions, which exhibited 504 mg·L−1 and 48.4%, respectively. P release increased with reaction time across all pretreatment processes. Sonication notably increased P release by 126.9%, with the highest reactive P release efficiency at 2.09 mg·L−1·Wh−1, emerging as an optimal process. Simulation results using Visual MINTEQ software indicate that the inclination for P release in alkaline conditions can be ascribed to the heightened presence of hydroxyapatite, brushite, and Ca-Fe (III)-phosphate bonds with rising pH levels. These simulation results, which are consistent with the experimental results, affirm the crucial influence of cations in determining P release on pH values.

1. Introduction

Phosphorus (P) is a vital nutrient that is essential for human survival, with significant applications in food production, as well as in the manufacturing of pesticides and pharmaceuticals [1]. The primary source of P, phosphate ore, is a finite and irreplaceable resource, currently diminishing in supply. Global production hovers around 170 million tons annually, with over 80% directed toward the production of agricultural phosphoric acid fertilizer and animal feed [2]. The concentration of phosphate production within a limited number of countries and the fact that reserves stand at only about 18 billion tons raise concerns about potential depletion within the next century [3]. One potential solution to this impending scarcity is the recovery of P from waste sources [4]. Wastewater sludge emerges as a promising secondary source of P, as roughly 55% of the aqueous P present in P waste, resulting from human activities, is converted into sludge, and subsequently collected and treated in wastewater treatment plants [5,6].
Concurrently, livestock manure presents challenges due to its high concentrations of organic matter and nutrients, which can negatively impact the environment and therefore requires proper management [7]. Various techniques have historically been employed for treating livestock manure, including incineration, composting, liquid fertilizer, and anaerobic digestion. Recently, anaerobic digestion technology has gained attention for its ability to handle concentrated organic matter and simultaneously generate methane as an energy source [7,8]. However, the anaerobic digestion process results in the release of substantial amounts of nitrogen and P contained in livestock manure as digestate, which must be removed to prevent the eutrophication of water bodies. This presents a complex challenge [9]. Composting, an age-old approach for handling residual by-products post anaerobic digestion, has traditionally served as an environmentally conscious technique, transforming organic materials into enriching soil conditioners. Nonetheless, apprehensions have arisen regarding nutrient loss in the decomposition process, ammonia release, and the incomplete sterilization of specific pathogens. Recently, considering increasingly stringent environmental regulations concerning production processes and end products, alongside the diminishing availability of P, researchers are actively exploring new treatment processes.
One proposed solution involves the recovery of P from digestate, providing an alternative to address the difficulties in digestate treatment and the issues surrounding insufficient phosphate rock [4,10]. However, since a significant portion of the P in digestate exists in solid form, effective P recovery requires its prior release from these solids [11].
Various sludge solubilization treatment technologies have been explored to facilitate P release, including thermal, chemical, and mechanical processes. Representative processes include sonication [10,12,13], microwave [10,14,15], ozonation [16], hydrogen peroxide [17], heat [18], acid and alkaline treatments [10,19,20], and mechanical disintegration [21,22]. Most of these solubilization processes aim to oxidize organic and inorganic compounds, disrupt microorganisms, and break down particulate matter to release intracellular compounds and inorganic substances into aqueous solutions via cell lysis. This not only effectively reduces sludge volume and enhances organic matter hydrolysis but also alters the P species fraction and increases its concentration [4,23,24].
However, most studies focusing on sludge solubilization for P release have primarily concentrated on enhancing methane production and reducing sludge volume in the anaerobic digestion process [25]. Furthermore, in digested sludge, P exists in various forms, including organic P bound to cells and inorganic P bound to metal ions like Fe3+/Fe2+, Al3+, Ca2+, Mn2+, and Mg2+. These inorganic P forms, such as FePO4, Fe3(PO4)2, vivianite [26], AlPO4 [27], Ca3(PO4)2, Ca2P2O7, Mg3(PO4)2, and hydroxyapatite [28,29], need to be dissolved significantly for effective inorganic P release, necessitating low pH conditions. However, achieving both economic feasibility and carbon reduction poses challenges because of differing solubility constants at varying pH levels [30].
Nonetheless, there remains a gap in information concerning the optimal pH levels for determining the most effective process for P recovery and the economic feasibility of various solubilization treatment technologies. To address these challenges, this study presents a comprehensive analysis. Specifically, it covers (1) an investigation of the variations in P release rates among different pretreatment processes (including ozonation, ultraviolet (UV)/H2O2, cold plasma, sonication, and mechanical disintegration) within the range pH 2–12; (2) a simulation of changes in the fraction of P species at pH 1–14 using Visual MINTEQ software (version 3.1), a general-purpose software used for chemical equilibrium modeling; and (3) an investigation into the energy consumption associated with each pretreatment process to determine the P release process. This study aims to pinpoint cost-effective and optimal pretreatment technologies for P release. It further investigates optimization conditions, offering precise insights for refining the overall optimization process.

2. Materials and Methods

2.1. Anaerobic Digestate Source and Characterization

The experiment utilized anaerobic digestion effluent obtained from a biogasification plant handling livestock manure and food wastewater, situated in Icheon, Gyeonggi-do, Korea. This plant in Icheon City operates at a capacity of 100 m3·d−1 and processes a mixture of livestock manure and food wastewater at a 7:3 ratio. The samples were collected and stored in a 20 L container at a temperature of 4 °C, with thorough shaking to ensure homogenous mixing before their utilization in the experiment. The characteristics of the sample can be found in Table 1.

2.2. Experiment Setup and Conditions

To enhance the efficient release of P from anaerobic digestate, a batch experiment was conducted involving a combination of pH treatment, sonication, ozonation, cold plasma, microwave, UV/H2O2, and milling treatment. Each experiment was carried out after pH adjustment, and the reaction time for each specific process combination was established through individual experimental trials.

2.2.1. pH Treatment

To assess the P release rate, this study employed both acidic and alkaline pretreatments by modifying the pH of the sample. The sludge’s pH was adjusted in increments of 2, ranging from pH 2 to pH 12, utilizing 1N H2SO4 (>95%, Samchun Chemicals Co., Ltd., Seoul, Republic of Korea) and 1N NaOH (>96%, Samchun Chemicals Co., Ltd., Seoul, Republic of Korea), respectively. Throughout the pH pretreatment process, thorough mixing of the samples was maintained at 100 rpm, achieved with a magnetic stirrer (MaXtir 500, Daihan Scientific Co., Ltd., Daejeon, Republic of Korea) to ensure uniformity.

2.2.2. Sonication

This study utilized the STH-750S ultrasonic device from Sonictopia Inc., Cheongju-si, Republic of Korea, with a 20 kHz ultrasonic frequency and an output of 750 W. This ultrasonic generator, measuring 360 mm × 360 mm × 130 mm, featured a 5 mm diameter titanium horn. The unprocessed sample or the pH-pretreated sample was loaded into a cylindrical plexiglass container with an effective volume of 1 L and subjected to a 6 h treatment at 20 kHz. Throughout the sonication process, the samples were consistently agitated at 100 rpm using a magnetic stirrer. To prevent a potential rise in water temperature during ultrasonic treatment, a chiller (DRC08, CPT Co., Ltd., Gunpo-si, Republic of Korea) was employed to maintain it at room temperature.

2.2.3. Ozonation

The ozonation was carried out using a Clean II ozone generator from Philip Korea Inc., Seoul, Republic of Korea. In this process, either the unprocessed sample or the pH-pretreated sample was positioned within a cylindrical plexiglass vessel with an effective volume of 1 L. Ozone was generated at a rate of 16 g·m−3 and injected at a rate of 1.0 L·min−1, and the treatment continued for a duration of 6 h. To enhance the efficiency of ozone contact, a ceramic diffuser capable of generating fine bubbles was employed, and the sample was consistently agitated at 100 rpm using a magnetic stirrer during the ozonation.

2.2.4. Cold Plasma Treatment

For the cold plasma treatment, a plasma generator (Groon Co., Ltd., Jeonju-si, Republic of Korea), featuring ten glow discharges, was employed. In this process, either the untreated sample or the pH-pretreated sample was placed within a cylindrical plexiglass vessel with an effective volume of 1 L. Ozone was generated at a rate of 10.2 g·m−3 and injected at a rate of 1.0 L·min−1, and the treatment was sustained for a duration of 6 h. To enhance contact with the cold plasma, the samples were uniformly mixed using the same ceramic diffuser and magnetic stirrer utilized in the ozonation process.

2.2.5. Microwave Treatment

The microwave processing was conducted utilizing a 2.45 GHz system manufactured by Korea Microwave Instrument Co., Suwon-si, Republic of Korea, which offered a maximum output power of 1000 W. In this procedure, the sample, whether untreated or pH-pretreated, was loaded into dedicated microwave vessels with an effective volume of 20 mL. The heating process was set at 700 W for a duration of 10 min, and subsequently, the sample was allowed to cool to room temperature within the microwave over a 20 min period.

2.2.6. UV/H2O2 Treatment

For this treatment, a laboratory-scale UV collimated beam apparatus (ECOSET Co., Ltd., Seoul, Republic of Korea) was employed. This system featured a low-pressure amalgam lamp (GHO36T5L/4P, EC21 Inc., Seoul, Republic of Korea), measuring 843 mm in length and delivering an output of 87 W. The collimating tube, with dimensions of 875 mm in length and 100 mm in diameter, was designed to emit nearly parallel light rays within the tube, and the treatment was sustained for a duration of 6 h. A 35% weight(w)/weight(w) H2O2 solution (Samchun Chemicals Co., Ltd., Seoul, Republic of Korea) was diluted with distilled water to achieve a concentration of 3% w/w for use in the experiment.

2.2.7. Milling Treatment

The milling processing was conducted using a Koselig Blender (YB-S03G, KOSELIG Co. Ltd., Seoul, Republic of Korea) with an output power of 1800 W. The raw sample or the pH-pretreated sample was loaded into a 1 L glass container and processed for 15 min.

2.3. Analytical Methods

This study assessed the concentrations of TP, reactive P, COD, and NH3-N in the sample, taking into consideration the specific pretreatment processes and employing the HACH DR3900 instrument. Except for TP and COD, all samples underwent analysis after filtration through a 0.45 μm syringe filter.
To determine chlorine ion (Cl) levels, a 0.2 μm membrane filter for the removal of solid particles was utilized before conducting ion chromatography, which was carried out using Dionex equipment from Thermo Fisher Scientific Inc., Waltham, MA, USA.
The quantification of cation concentrations, encompassing Ca2+, Mg2+, Fe2+, K+, Ni2+, and Cu2+, was executed by employing inductively coupled plasma optical emission spectroscopy (5800 ICP-OES, Agilent Technologies Inc., Santa Clara, CA, USA).
In the analysis of hydroxyl radicals, the potassium iodide (KI)/UV-Vis spectrometer method was employed, involving the oxidation of KI and the subsequent analysis of the chemically stable triiodide ion (I3−) using a UV-Vis spectrometer, as described in reference [31]. The process was initiated by preparing a KI 10 g·L−1 standard solution, followed by pretreating the pH to 6. Subsequently, each treatment procedure was conducted, with samples collected at regular intervals. The absorbance of I3− ions, generated at a wavelength of 350 nm, was measured using a UV-Vis spectrometer (OPTIZEN POP, Mecasys Co., Ltd., Daejeon, Republic of Korea). This allowed for the estimation of hydroxyl radical production by observing changes in the concentration of I3− ions over time.

2.4. Calculation Methods

The energy consumption for the pretreatment process can be expressed using the following Equation (1), based on a volume of 1 L of the sample [10]:
Wh = P·t
In this equation, Wh represents energy consumption measured in watt-hours, P is power measured in watts (W), and t represents time measured in hours.

2.5. Visual MINTEQ Software 3.1 Setup

In this study, Visual MINTEQ software (version 3.1) served as the tool for investigating the composition and distribution of different cations (specifically, Ca2+, Mg2+, Fe2+, K+, Ni2+ and Cu2+) and the species and fractions of P within the original sample in response to varying pH levels. The model was employed to simulate these scenarios. To achieve this, the simulation of P chemical species fractions was carried out using the measured concentrations of cations at different pH intervals, and the shifts in P species due to pH variations in the original sample were simulated and compared.
The principal ion concentrations of the original sample, as displayed in Table 1, were input into the model. The reaction temperature was maintained at a constant 25 °C, and the ion strength was determined for each respective condition. By employing the sweep function, the model simulated pH changes ranging from 1 to 14, identifying the pH threshold at which dissolution was favored over precipitation for calcium phosphate, magnesium phosphate, iron phosphate, brucite (CaHPO4·2H2O), and iron (II) hydroxide. Four distinct solid phases were monitored: (Fe(OH)2), hydroxyapatite (Ca5(PO4)3OH), and vivianite (Fe2+3(PO4)2·8H2O). The observation of solid phase changes provided additional insights into alterations in P concentration.
The saturation index (SI) in Visual MINTEQ software is a measure of the thermodynamic tendency of a solution to either dissolve or precipitate a mineral. The SI is calculated using the following Equation (2):
SI = log10 (IAP/Ksp)
In this equation, IAP is the ion activity product, and Ksp is the solubility product constant. The IAP is calculated by multiplying the activities of the ions in solution, each raised to the power of its stoichiometric coefficient in the dissolution reaction. The activity of an ion is related to its concentration through an activity coefficient, which accounts for deviations from ideal behavior in solution. The Ksp is a constant for a given mineral that describes the equilibrium between the dissolved ions and the solid mineral. It is specific to each mineral and temperature.

3. Results and Discussion

3.1. Effects of Pretreatment on P Release

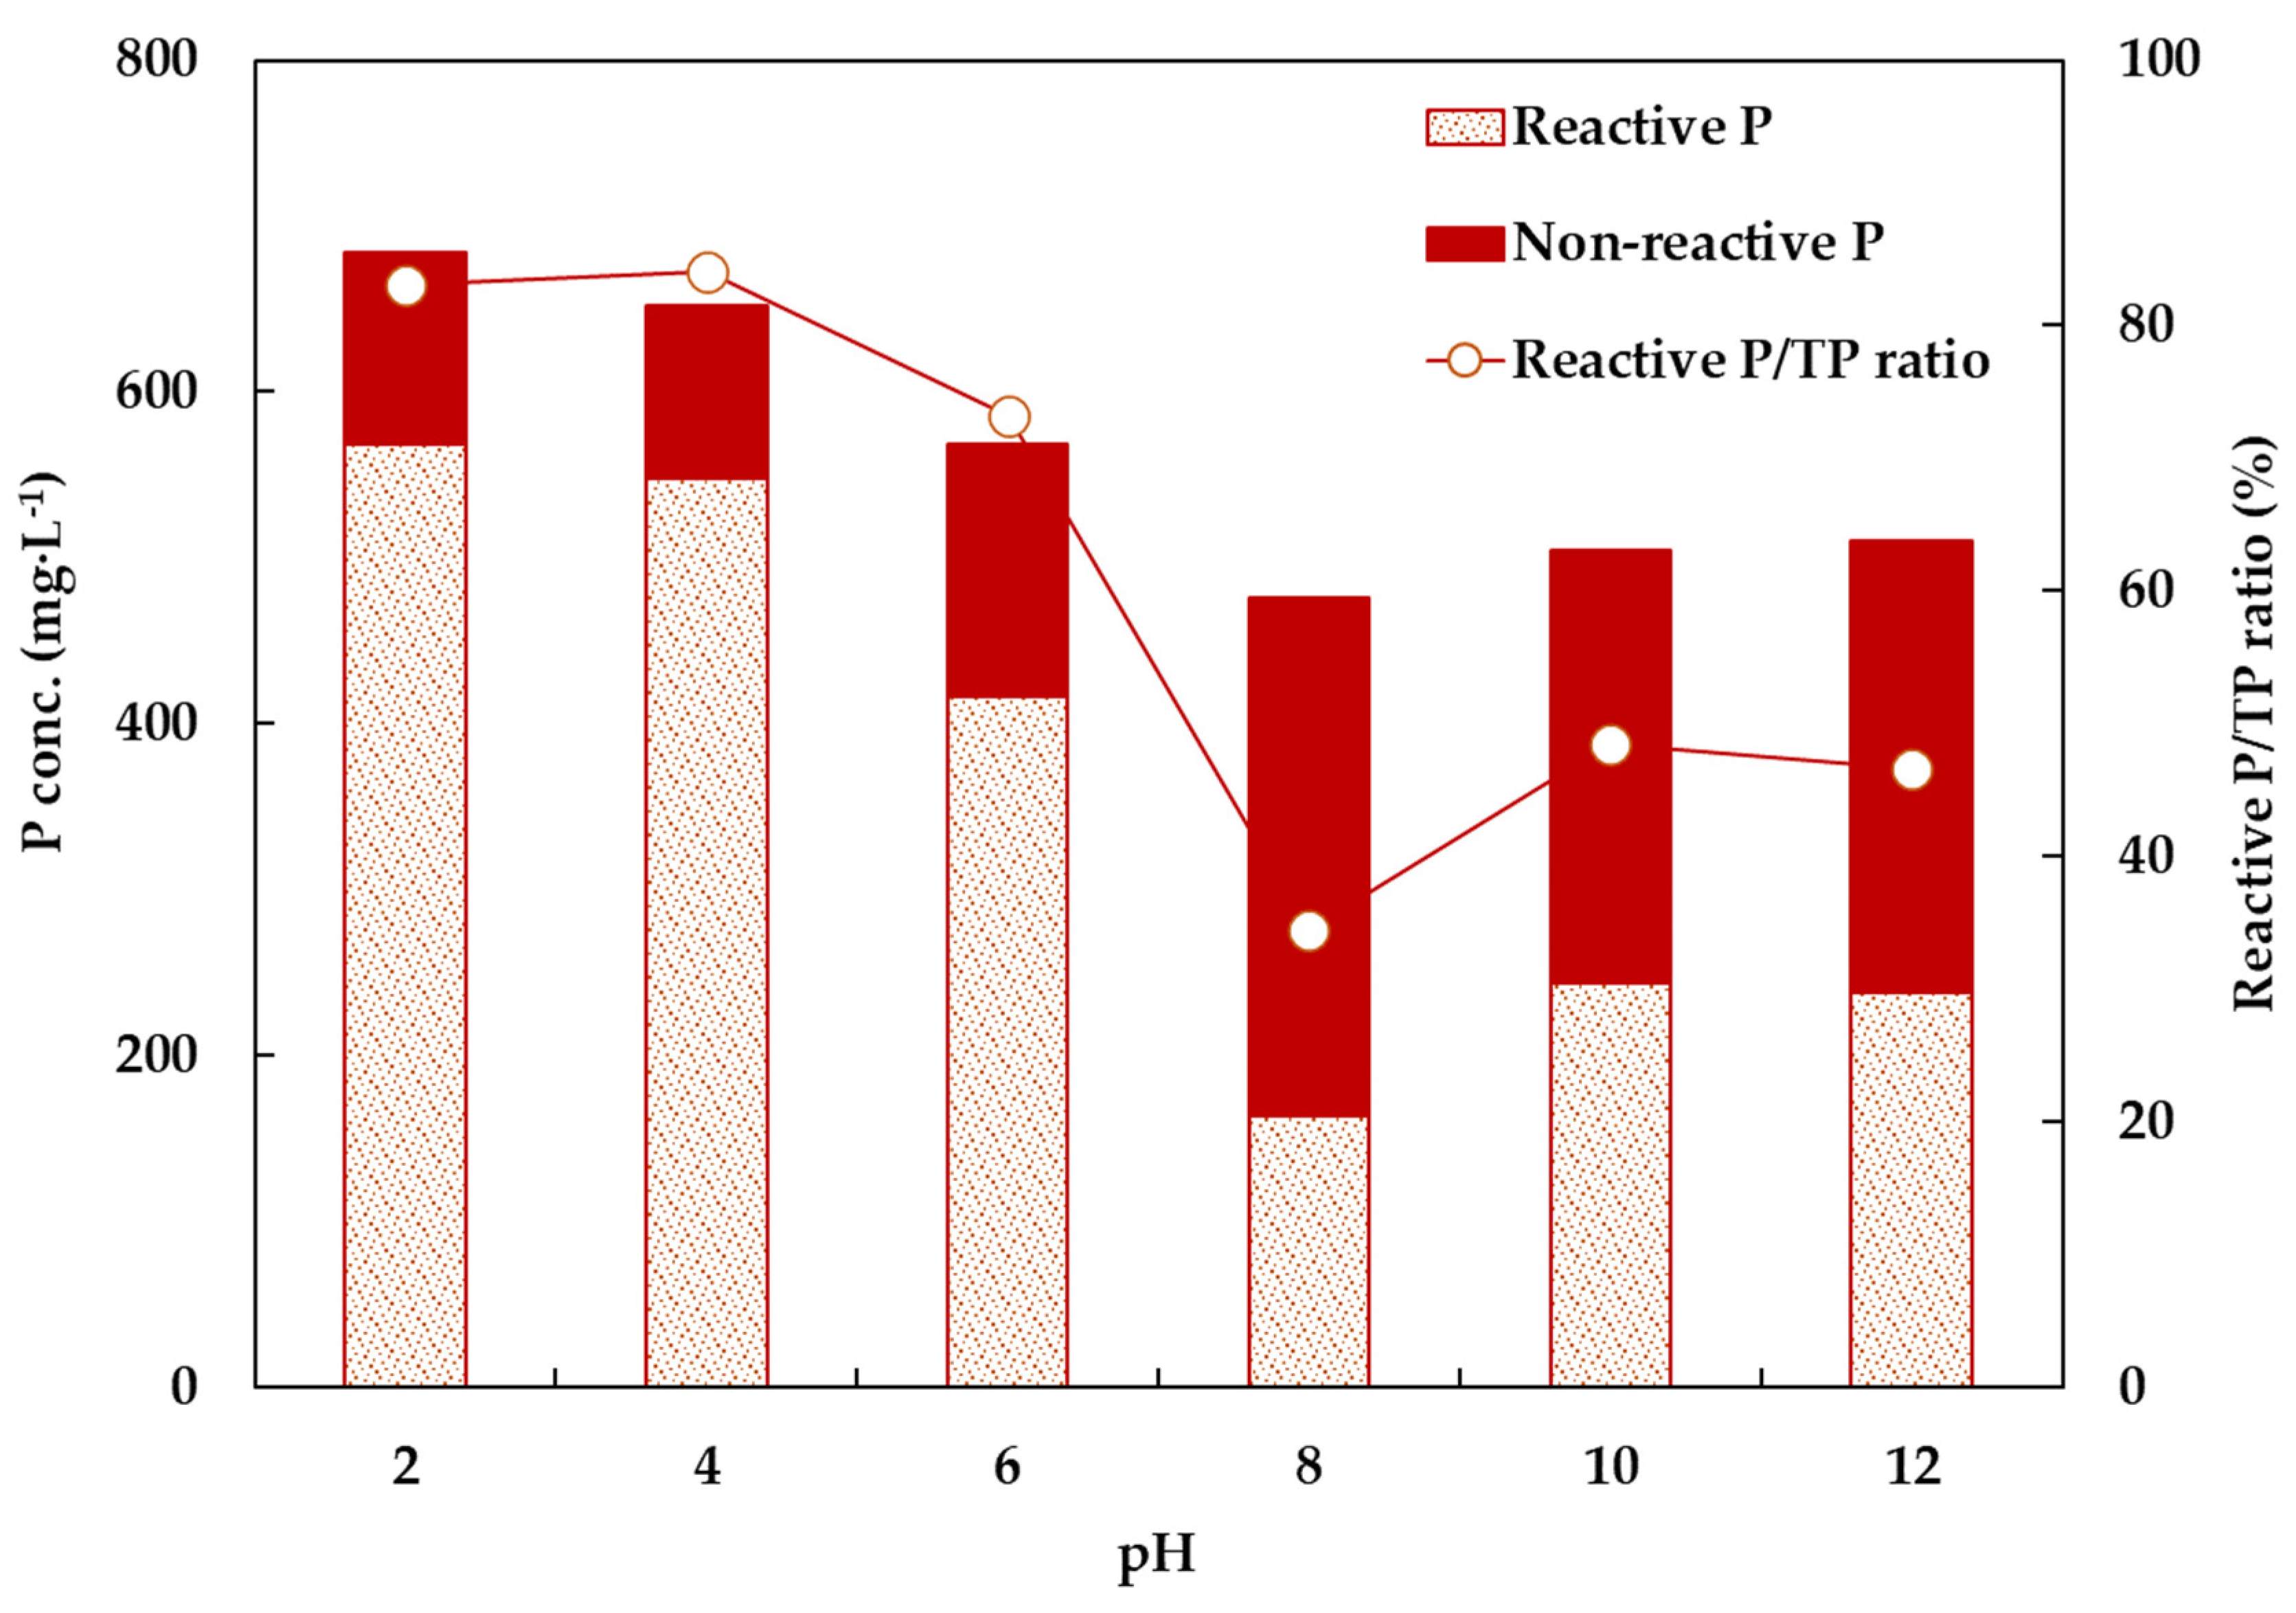
3.1.1. pH Pretreatment

The release of P is profoundly influenced by the P fraction within the sludge, where factors like sorption, adsorption, precipitation, and solubilization play crucial roles. Among these factors, pH stands out as the primary driving force significantly impacting the P fraction [4].
Water matrices contain soluble P (SP) and particulate P (PP), with PP being removable through physical separation techniques. The reusability of PP depends on its reactivity. Reactive P, also termed inorganic P or orthophosphate, represents the TP fraction readily available for chemical reactions. Non-reactive P (NRP) includes condensed or acid-hydrolysable P (AHP) and organic P (OP), containing inorganic polyphosphates. In the environmental biogeochemical P cycle, NRP, like apatite minerals, is initially unavailable but can become soluble through processes such as physical and chemical pretreatment [32].
Figure 1 illustrates the reactive P fraction and TP concentration in the original sample at pH 8 under various pH conditions. It is evident from Figure 1 that the TP concentration increased across all pH adjustment conditions, whether acidic or alkaline, showing a proportional relationship in response to deviations from the original sample’s pH. These findings support a finding that P release from the sludge occurs under both acidic and alkaline conditions, which is consistent with prior research highlighting the role of pH adjustment in promoting P release [20].
Notably, under acidic conditions, the TP concentration reached its highest point at pH 2, registering at 684 mg·L−1, with a fraction of reactive P at 83.0%. At pH 4, the TP concentration slightly decreased to 652 mg·L−1 but exhibited the highest fraction of reactive P, at 84.0%. In contrast, under alkaline conditions at pH 10, the TP concentration was 504 mg·L−1, with the highest fraction of reactive P at 48.4%. However, under alkaline conditions, TP concentration was lower, at only 77.3%, and the fraction of reactive P dropped to 58.3% compared to acidic conditions. This discrepancy may be attributed to the dissolution of inorganic P and the release of poly-P in the sludge, primarily contributing to the increase in TP concentration under acidic conditions, while in alkaline conditions, the release of organic P from the sludge takes precedence [20].
Furthermore, the impact of pH on P release could predominantly manifest itself through the various inorganic P species bound to metal cations present in the solution. It is important to consider that the conditions for solid-state material formation encompass factors like molar ion ratios, supersaturation levels, the presence of nuclei or seeds, and turbulence, which may create an optimal environment for solid-state material formation. Nonetheless, when dealing with secondary sludge derived from a sewage treatment plant, a study focused on anaerobic digestion revealed that the concentration of reactive P reached its peak at pH 12. It is acknowledged that these results might vary depending on the relative ratios of different P species in the sludge, indicating the need for further research [33].

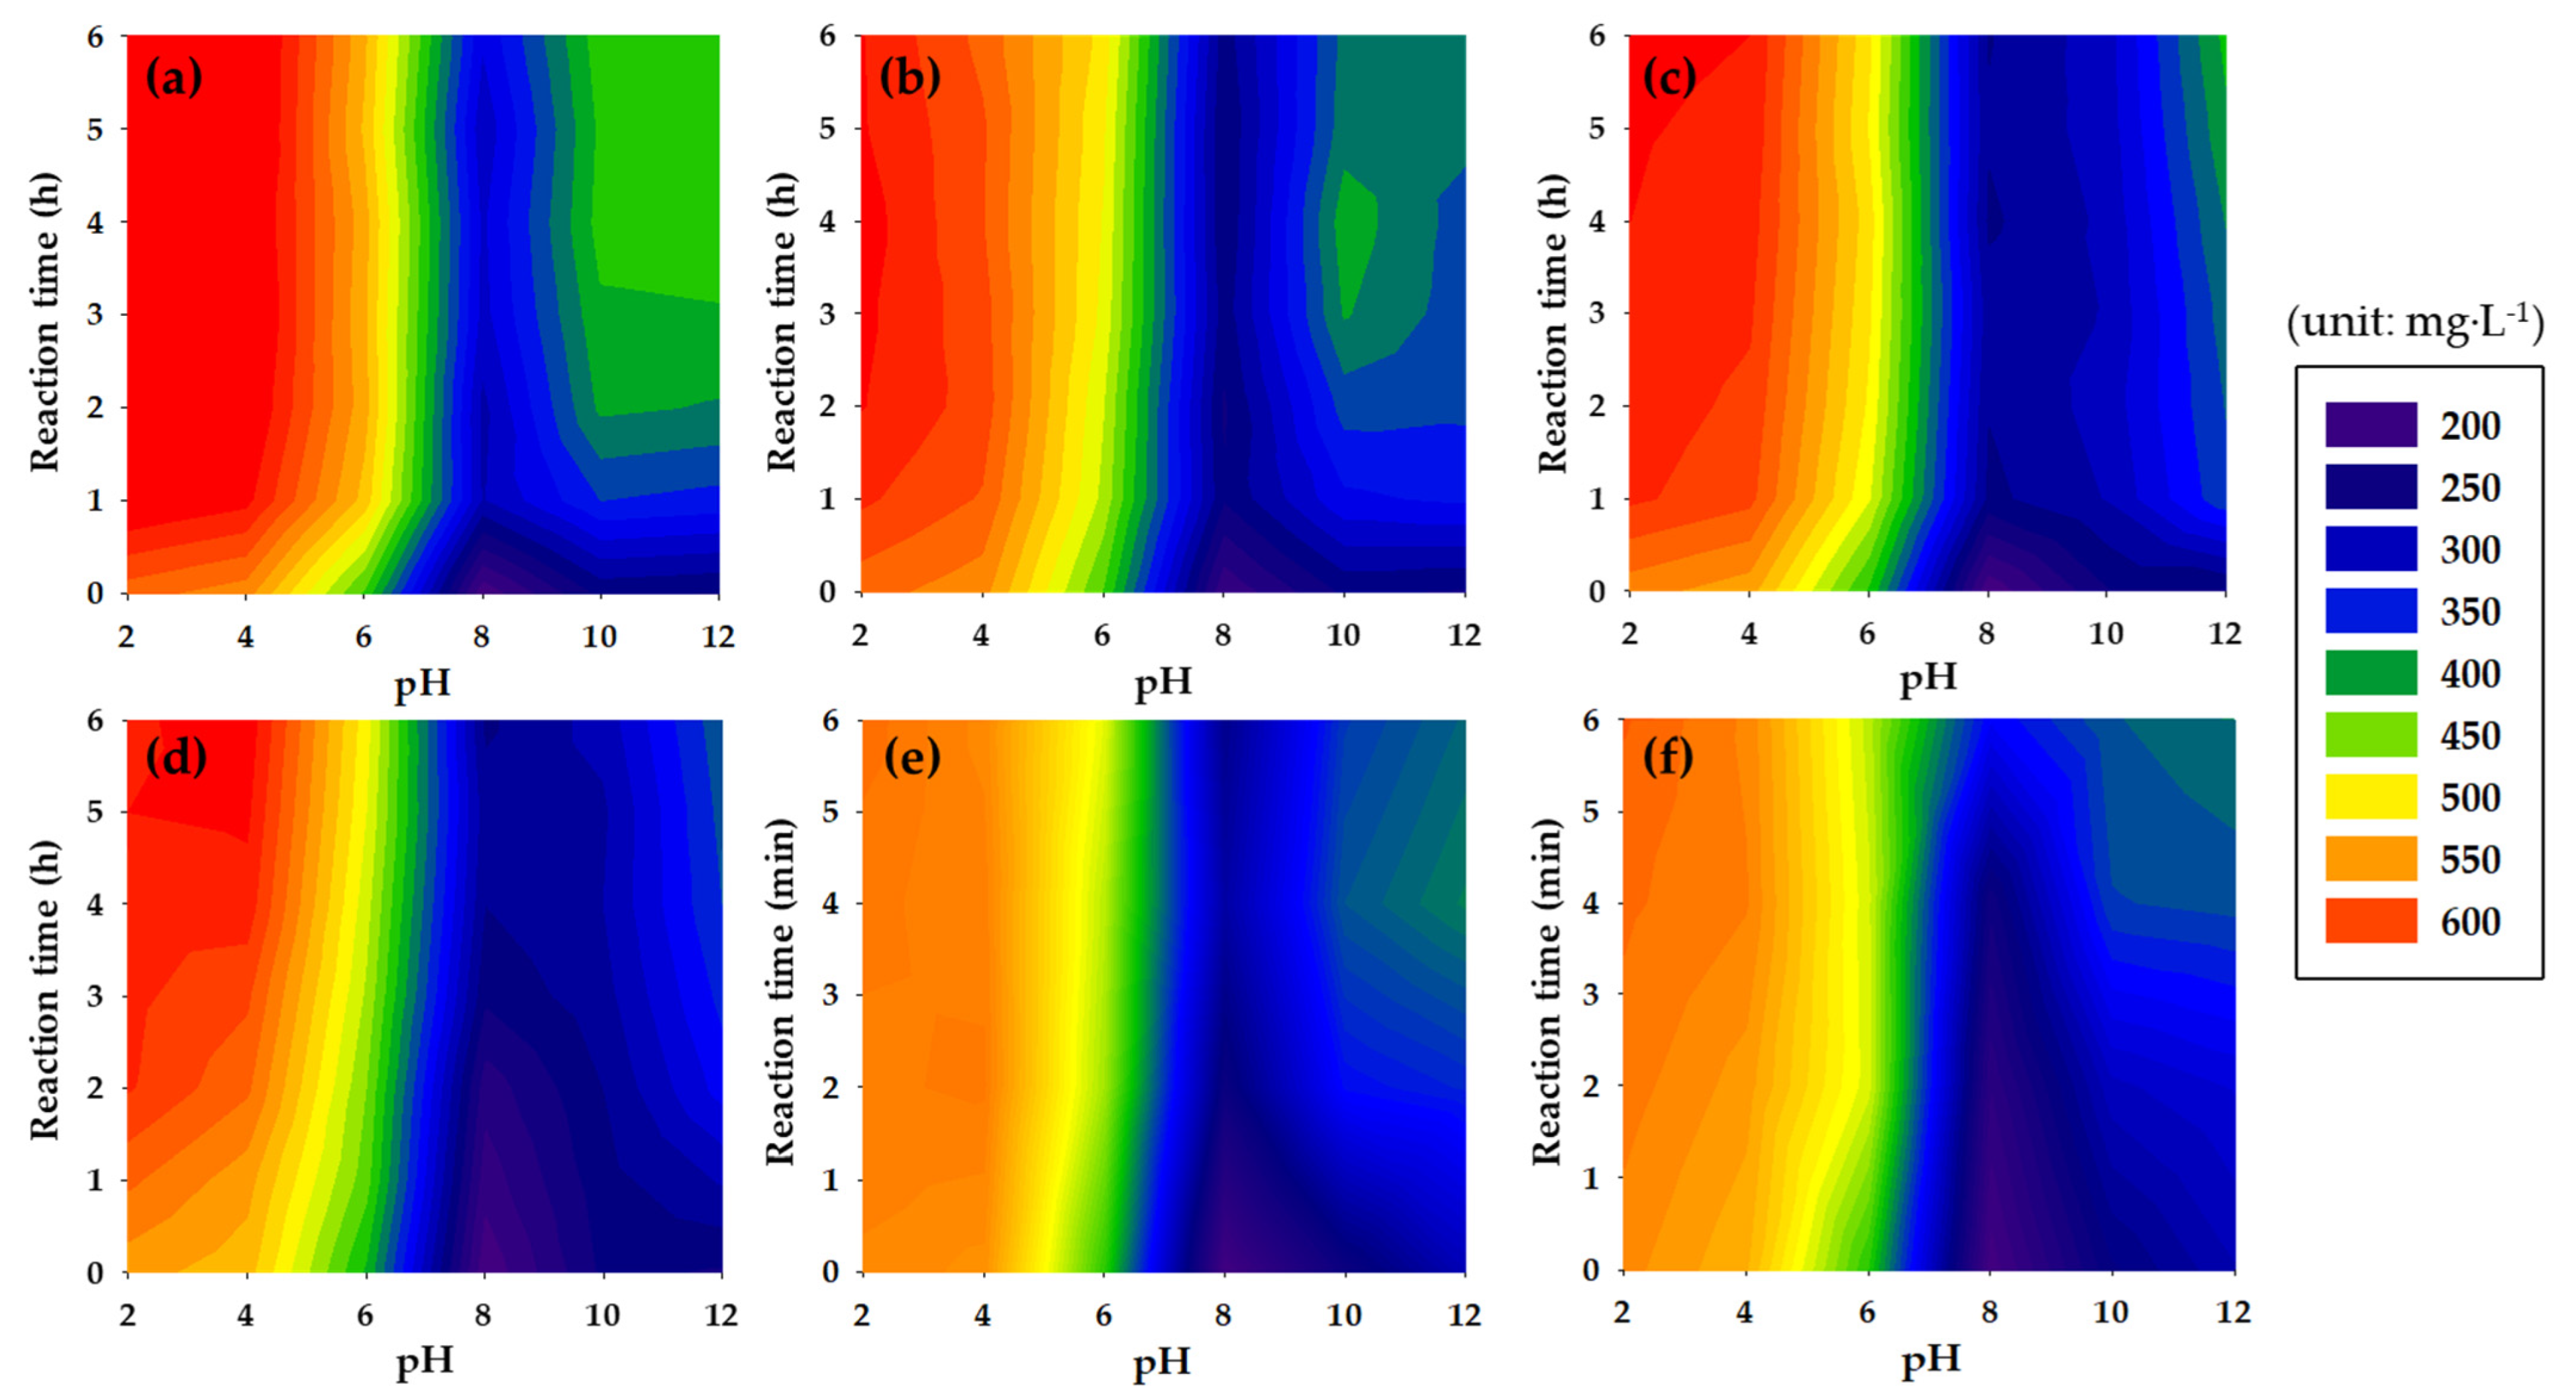
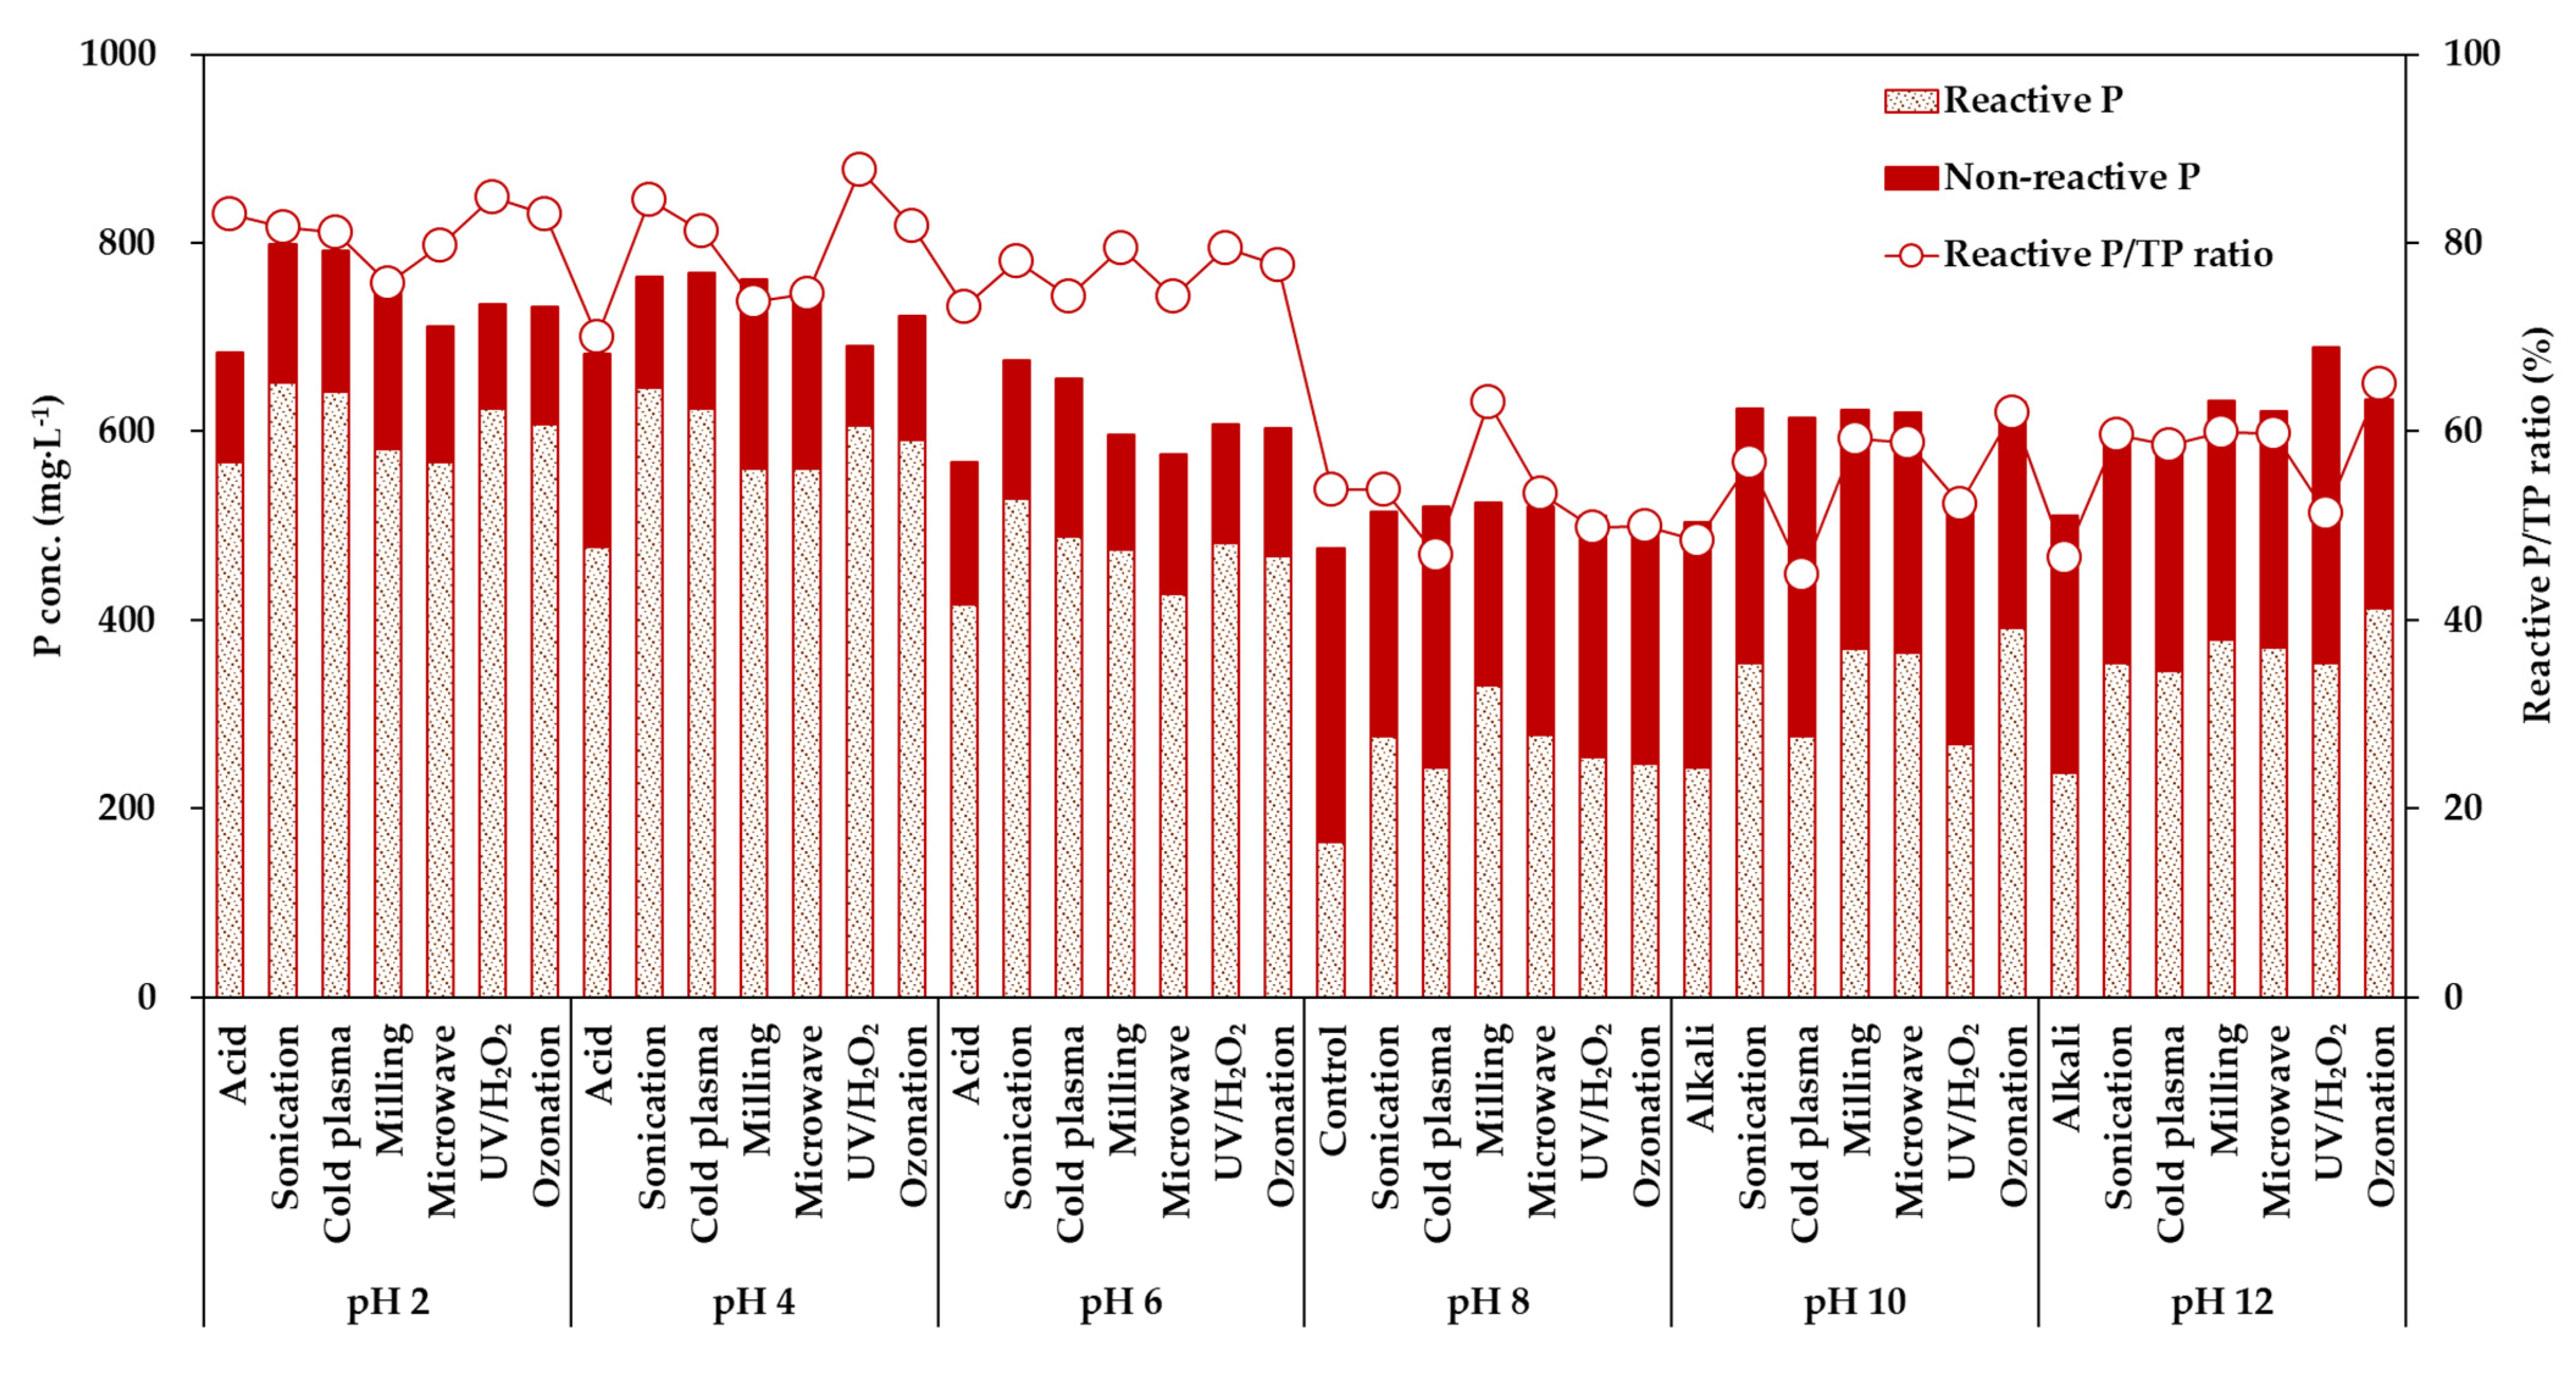
3.1.2. Pretreatment Processes and pH Combinations Process

Figure 2 presents the P release attributed to pH alterations within six distinct sludge pretreatment processes. As depicted in Figure 2, the release of P increased in all pretreatment processes with the passage of time, yet the concentration varied depending on the pH conditions. Among these pretreatment processes, sonication exhibited the most substantial P release, despite having a relatively short reaction time, and this effect was evident across a wide pH range (Figure 2a).
Sonication induces cavitation when ultrasound propagates through a medium, creating localized high-temperature and high-pressure conditions. This promotes the release of intracellular substances through water-mechanical shear, thermal effects, oxidation by free radicals, and the stirring effect of sound flow. Within the sonication, the parameters of power density and reaction time play a vital role. Exceeding a certain power density threshold accelerates the release of intracellular substances, and the thermal effects at high power density contribute to the conversion of P forms [34]. During sonication, there is a notable increase in the release of P, primarily in the form of orthophosphate, within a short timeframe. This phenomenon is attributed to the early release of loosely bound P, such as adsorbed phosphate, from the sludge floc through mechanical shearing at the outset of sonication [35]. Additionally, sonication is reported to convert organic P into inorganic P, which is beneficial for P recovery, due to elevated temperature and the generation of free radicals [36]. The low KI measured during sonication at pH 6 suggests that the elution and conversion of P occur primarily due to the high temperature and pressure induced by cavitation rather than to free radicals (Figure 3). However, it is crucial to note that an excessive sonication time can lead to P reprecipitation, necessitating the optimization of reaction time to maximize P release [37].
Ozonation is highly dependent on pH conditions (Figure 2b). Ozone has the capability to decompose into other oxidizing agents within aqueous solutions, existing as molecular ozone (2.07 V) at low pH, which encourages the production of hydroxyl radicals (•OH) with a higher oxidation potential (2.8 V) under high pH conditions. Consequently, P release is expected to be more significant under alkaline conditions (Figure 4). However, it is important to note that ozonation may affect mineralization and COD loss [38], and results can vary depending on reaction time or the quantity of ozone input. The relatively high P release under low pH conditions might also be attributed to the dissolution of minerals, such as dicalcium phosphate, octocalcium phosphate, newberyite, and struvite. Notably, the fact that acid treatment yielded similar results to ozonation suggests that minerals play a substantial role in the process [39].
Across all advanced oxidation processes (AOPs), the pH value plays a pivotal role in dictating the process mechanism. It significantly impacts the decomposition rate of UV/H2O2. At higher pH values, H2O2 becomes less stable, protons are removed, and HO2·H2O2−1 reach equilibrium. At this point, undissociated H2O2 molecules react with HO2 species, leading to decomposition into O2 and H2O instead of generating OH radicals [40]. Moreover, under highly alkaline conditions, the self-decomposition rate of H2O2 increases significantly, and OH radicals are also removed [41]. Therefore, the lower P release rate in the UV/H2O2 compared to ozonation at high pH values can be attributed to the increased autolysis rate of H2O2 and reduced production of OH radicals.
Cold plasma technology is a non-thermal technique generating multiple reactive species by interacting with water molecules, emitting light, and producing shockwaves [42]. The effectiveness of cold plasma in wastewater treatment is influenced by factors such as input power, electrode and reactor system design, contaminant concentration, solution pH and temperature, water conductivity, and the type and composition of the feed gas used. Rates of mineralization and contaminant degradation are proportionally related to the energy supplied [43]. Cold plasma displayed relatively high P release under acidic conditions but the lowest P release under alkaline conditions (Figure 2d). This highlights the effectiveness of acid treatment mentioned earlier. The low KI in cold plasma, compared to ozone and UV/H2O2, resulted in its having the lowest content of reactive P among the three treatment processes (Figure 3). However, despite the lower KI, when compared to ozonation, it was possible to achieve P emissions equivalent to ozonation by extending the operation time.
In the case of microwave treatment, a low pH environment initially led to a slower rate of P release. However, as the pH increased, the P release rate exceeded that of cold plasma (Figure 2e). The microwave process operates by inducing rapid heating through mechanisms like ionic polarization, dipole rotation, and aligning the polar sections of macromolecules with the electric field’s poles. This process breaks associated hydrogen bonds [44]. Microwave treatment disrupts the floc structure of sludge, causing the release of intracellular and extracellular biopolymers into the solution [4]. The presence of hydronium ions accelerates the degradation of extracellular polymer substances (EPS) and related cells by breaking intermolecular and intramolecular bonds. This degradation process is further enhanced under acidic conditions [45]. The results of this study show that microwaves are ineffective in promoting cell lysis under extremely acidic conditions.
Comparatively, simple milling resulted in a lower rate of P release than both sonication and microwave treatment, underscoring the significance of temperature in P release (Figure 2f). The solubility of P compounds, which include orthophosphate (soluble), polyphosphates (less soluble), and organically bound P (insoluble), generally increases with higher temperatures. As the temperature rises, the adsorption of P on solids weakens, facilitating desorption and subsequently increasing the P concentration in the aqueous. While milling can be a cost-effective process, the relatively low P emissions make it practical to combine it with thermal treatment.
The findings from this study indicate that all pretreatment processes are more effective in enhancing P release when combined with lower pH conditions than when employed individually. This suggests significant potential for practical applications of P recovery (Figure 4). As the pH decreases, the rate of P release increases, with pH 6 standing out as the most suitable option due to its eco-friendly and cost-effective characteristics. However, it is important to recognize that the optimal pH value and reaction time may vary for each process combination, necessitating further research.

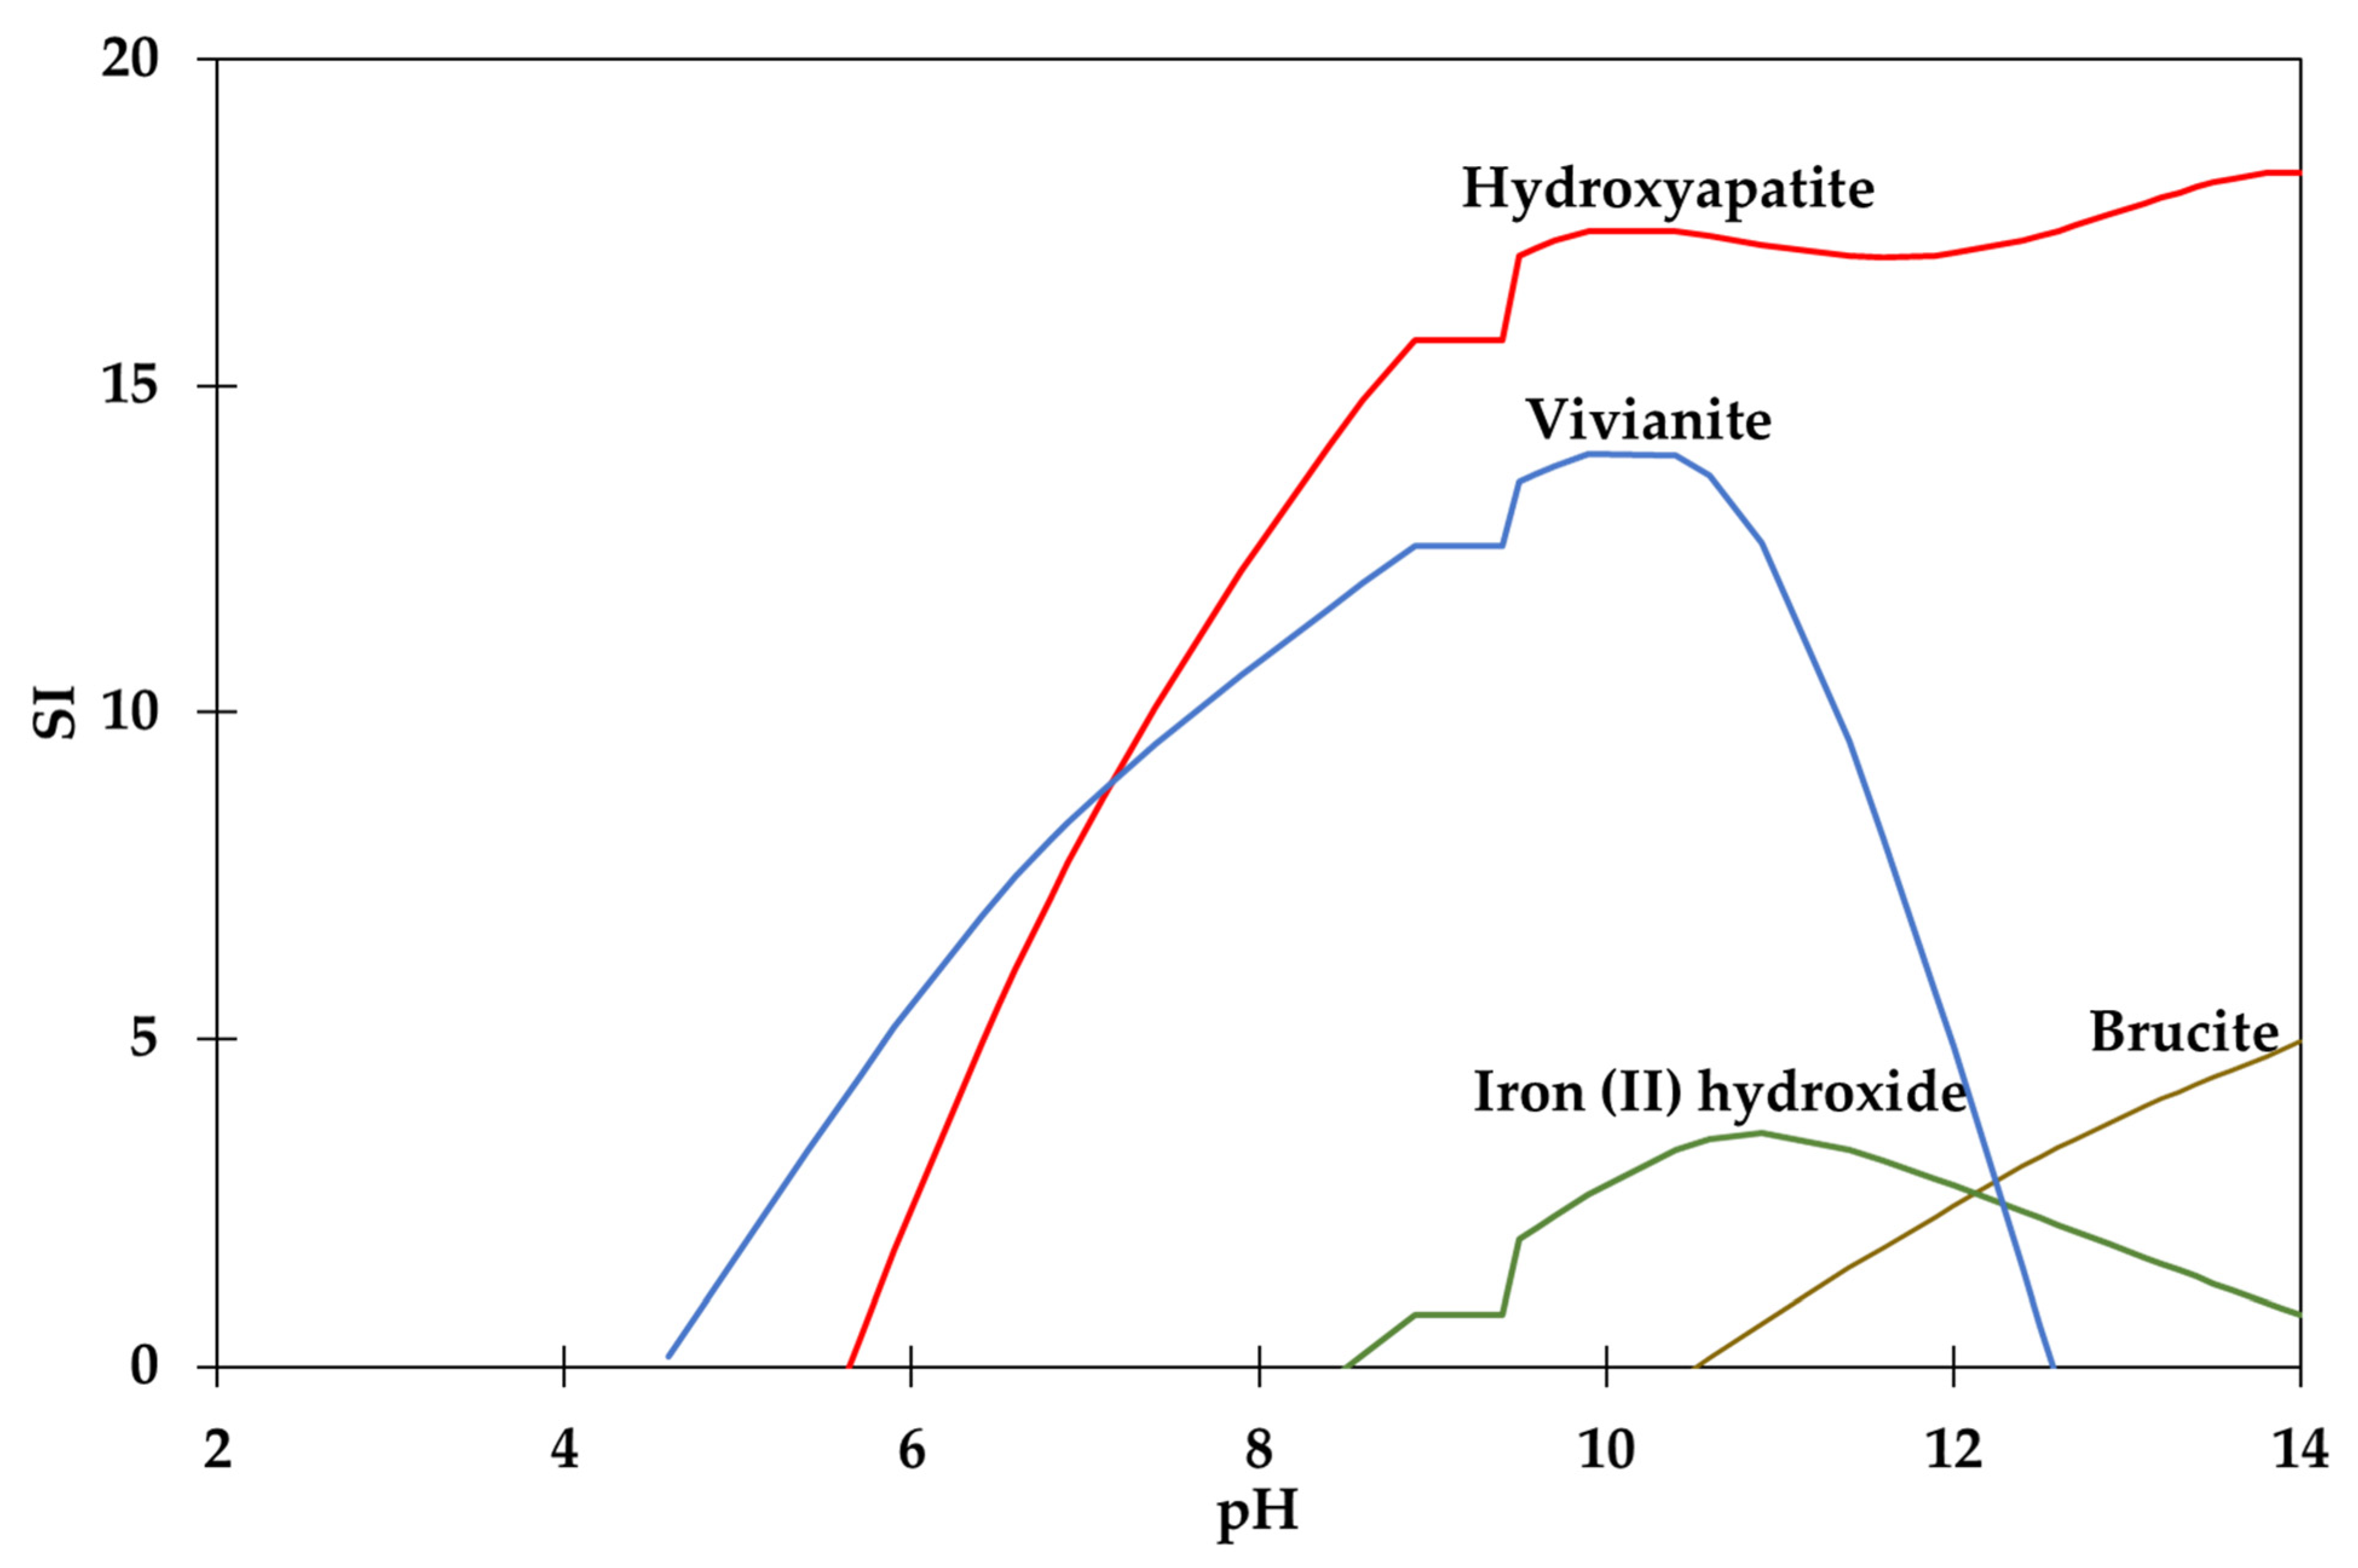
3.2. Visual MINTEQ Software Simulations

Figure 5 displays Visual MINTEQ software prediction simulations that depict the forms and fractions of P in the aqueous as pH changes are made to the original sample with a pH of 8. These simulations predicted that phosphate shifts into the typical H3PO4, H2PO4, HPO42−, and PO43− forms as the pH level increases or decreases, with calcium phosphate, iron phosphate, and potassium phosphate present as the major phosphorus compounds. At pH levels of 2 or lower, over 50% of phosphate exists as H3PO4, while at pH 12 or higher, equilibrium is reached for CaPO4. The actual simulation results, represented in the graph, aligned relatively well with the predictions, based on the analysis values measured after altering the original sample’s pH (Figure 5). Although the experimental results slightly overestimated the FeH2PO4+ fraction at pH 4 or lower and the CaPO4 fraction at pH 10 or higher compared to the predicted simulations, these outcomes are valuable and support the validity of Visual MINTEQ software’s predictive simulations.
The decrease in phosphate fraction may be attributed to amorphous precipitates [46]. Additionally, the overestimation of FeH2PO4+ and CaPO4 fractions appears to be linked to the high concentration of Fe2+. When Fe (II) dissolves in water, it oxidizes to form amorphous to low-crystalline Fe (III) precipitates, and phosphate has a strong affinity for Fe (III). In a nearly neutral pH environment, the presence of phosphate during Fe (II) oxidation leads to the precipitation of amorphous Fe (III)-phosphate [47]. Furthermore, amorphous Fe (III)-phosphates often contain Ca, and phosphate and Ca can form electrostatically enhanced co-adsorption complexes within Fe (III)-(hydr)oxides or separate Ca- and Fe (III)- or mixed Ca-Fe (III)-phosphates [48,49]. Thus, the reduction in phosphate fraction may be associated with precipitation due to the formation of these complexes.
The saturation index, denoted as SI, is employed in chemistry and geochemistry to determine a solution’s state in relation to mineral solubility. It helps assess whether a solution is unsaturated, saturated, or supersaturated with respect to a particular mineral or compound. An SI below zero indicates an unsaturated solution with ion concentrations lower than the equilibrium level, favoring dissolution. Conversely, an SI above zero indicates supersaturation with ion concentrations exceeding thermodynamic equilibrium, promoting precipitation. The results monitoring solid substances as pH changes are made to the original sample are presented in Figure 6. As shown in Figure 6, the SI for vivianite, generated from hydrated iron phosphate, crosses zero at pH 4.6, while hydroxyapatite, a type of calcium phosphate, surpasses zero at pH 5.7. Vivianite’s SI increases as pH rises, reaching its peak at pH 10 and declining from pH 10.6 until it goes below zero at pH 12.6. In contrast, hydroxyapatite shows that its SI does not drop to zero even in environments where pH levels exceed 10. These disparities could be attributed to the prevalence of carbonate ions (CO32−) in solution at high pH, which react with Ca2+ to form calcium carbonate [50].
Iron (II) hydroxide, with properties and reactivity influenced by physical form and conditions, is produced at pH 8.6 and then diminishes from pH 10.5. However, in an experiment in which the pH of the original sample was adjusted to 12, both Ca2+ and Fe2+ concentrations decreased. In high pH conditions, the iron (II) compound formed may undergo oxidation to generate iron (III) compounds such as iron (III) hydroxide, potentially forming Ca-Fe (III)-phosphate [51]. On the other hand, brucite, composed of magnesium hydroxide, exhibits a typical pattern, with the SI exceeding zero at pH 10.6 and then increasing proportionally.
The Visual MINTEQ software simulations demonstrate similar trends to the experimentally obtained results, emphasizing the significant role played by cations in determining phosphate release according to pH levels. With increasing pH, the presence of Ca-Fe (III)-phosphate bonds becomes evident.

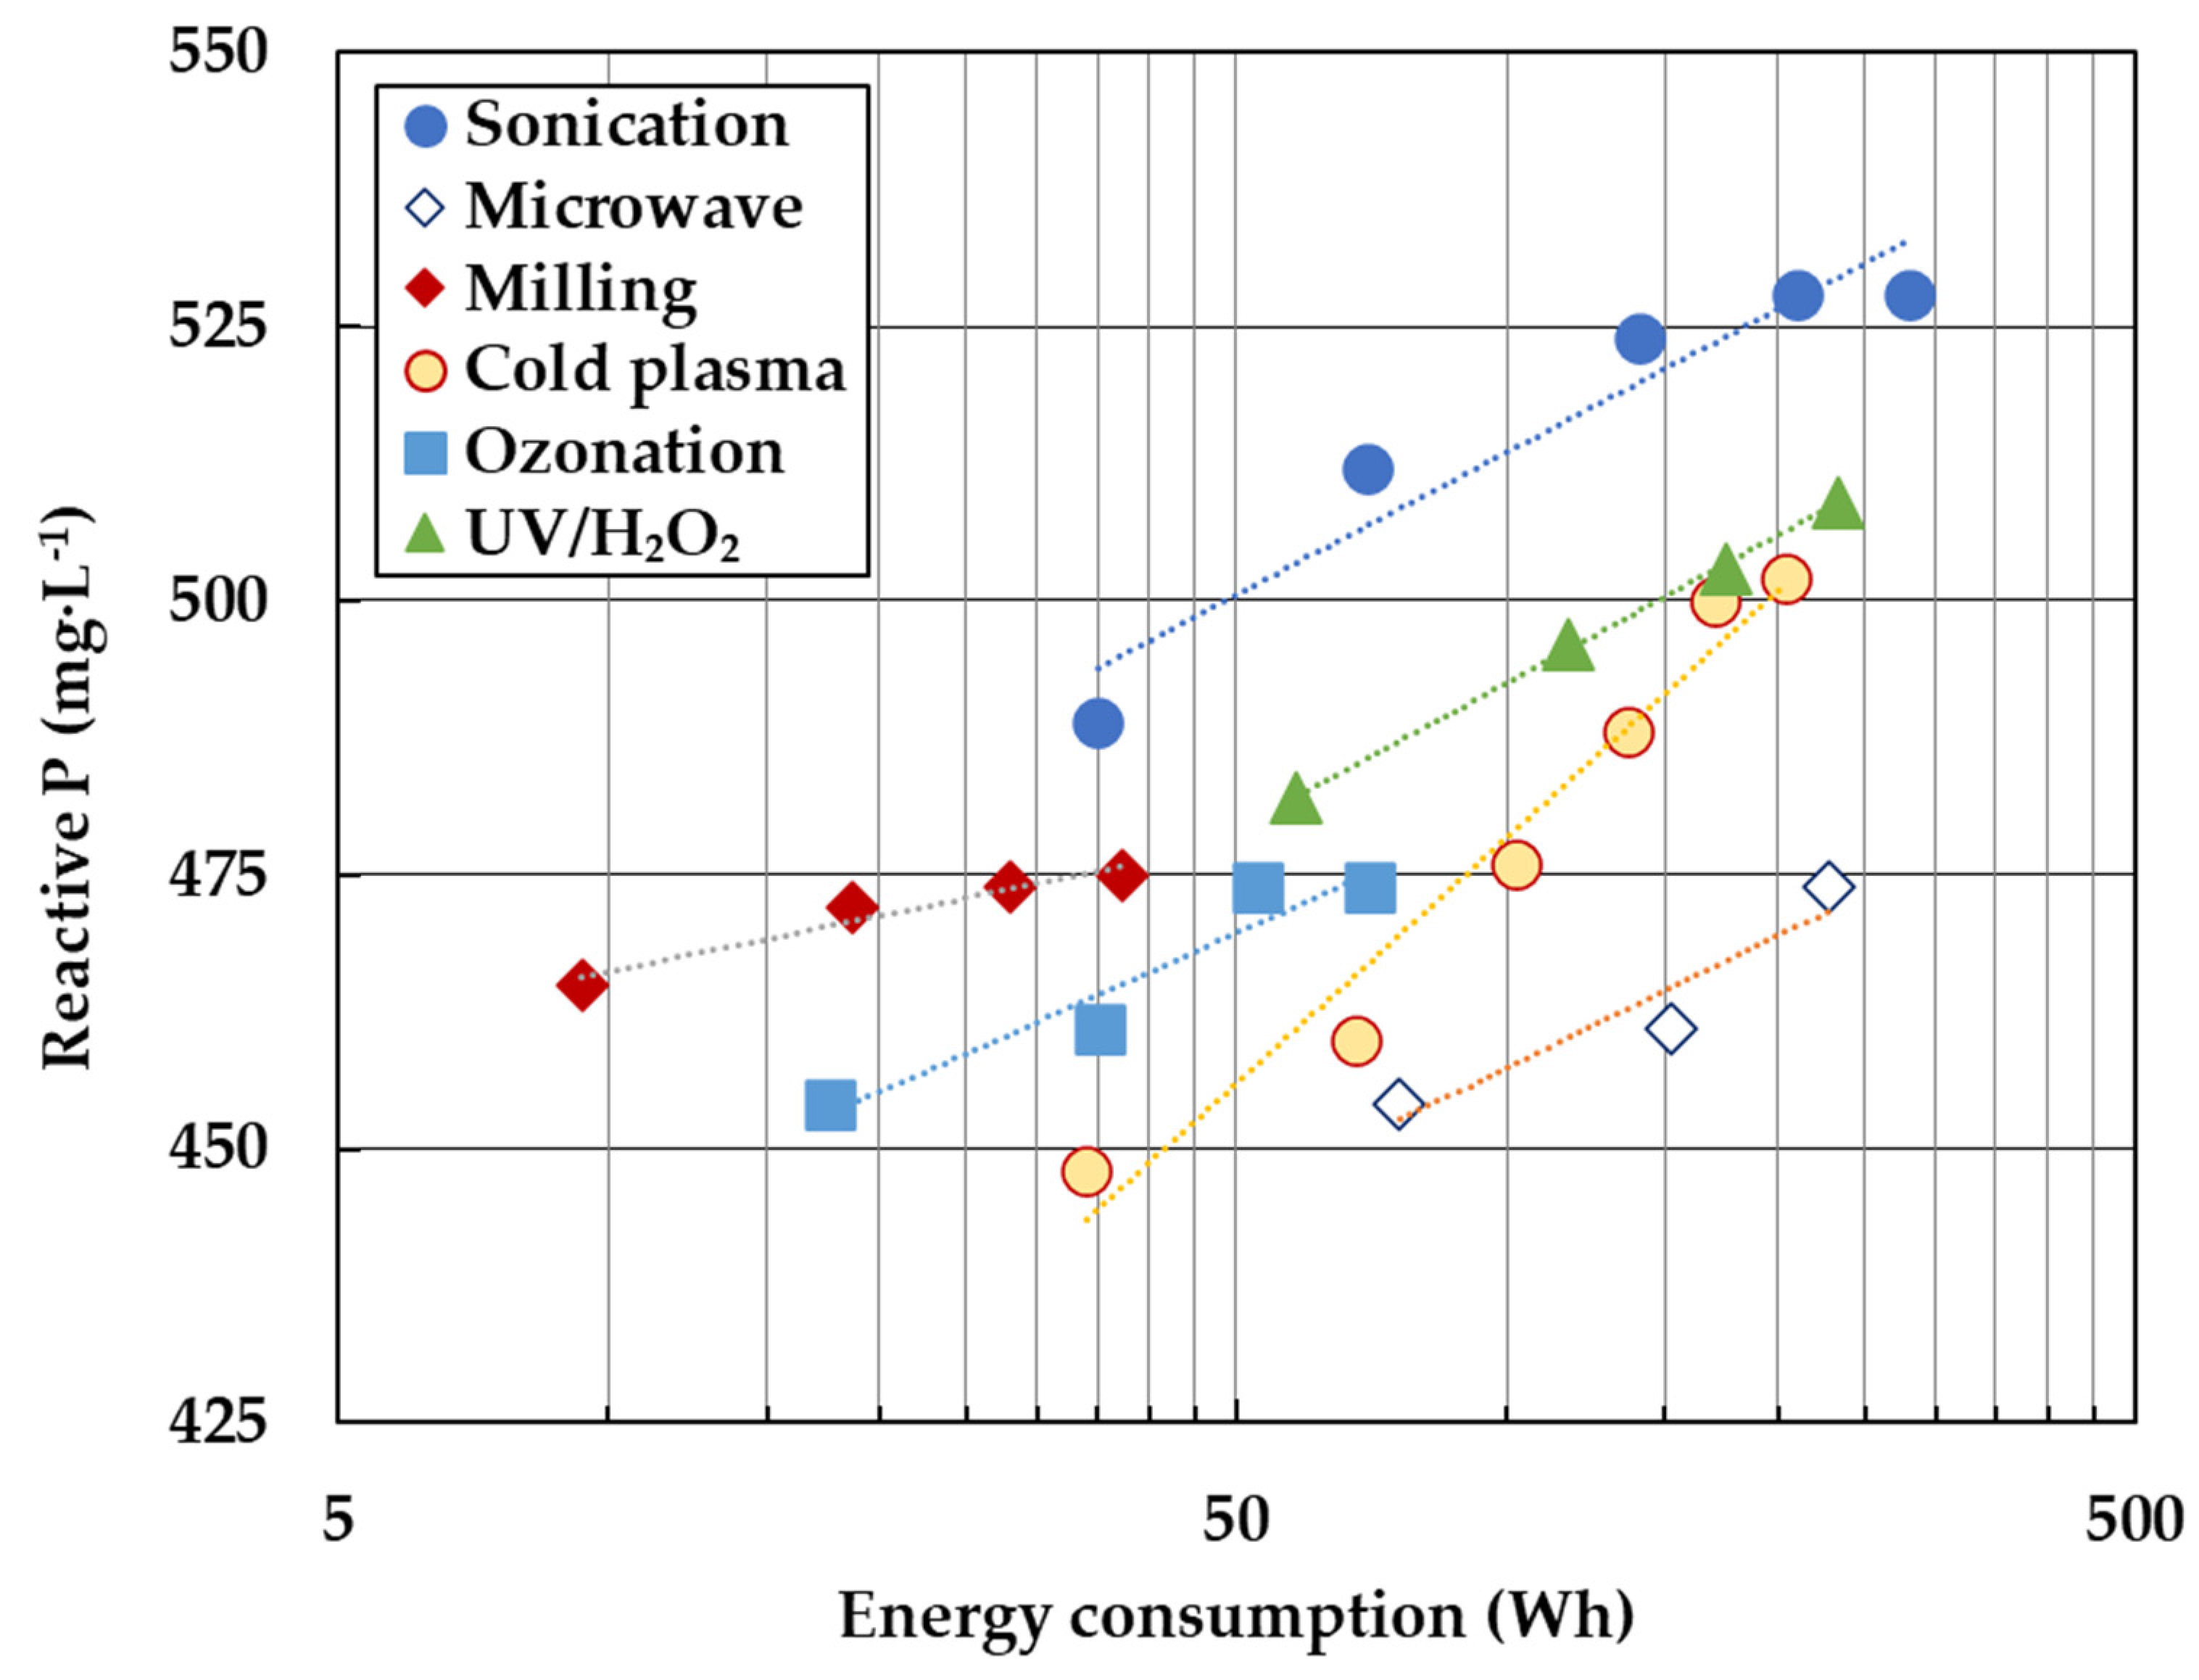
3.3. Electrical Energy Consumption

When optimizing any technology, it is imperative to factor in operating costs, a crucial determinant of the process’s feasibility at the industrial level [52]. In the case of pretreatment processes, assessing the P release rate and considering the reaction time are of paramount importance. Nevertheless, it is worth noting that the optimal pH and reaction time can vary for each pretreatment process. While pH influences chemical costs and thus forms a significant portion of operating expenses, electrical energy consumption is arguably the most substantial operating cost in the pretreatment process [53]. To mitigate operating costs and reduce environmental impacts, scrutinizing electrical energy consumption becomes essential to meet the requisite conditions.
Electrical energy consumption was assessed based on pH 6 conditions. The amount of electrical energy consumption fluctuates depending on reaction time, and with increasing reaction time, both electricity consumption and the concentration of reactive P exhibit a linear relationship (Figure 7). Across all conditions, there was variation in reaction time for each pretreatment process, with sonication consistently demonstrating the lowest electrical energy consumption for reactive P, while the electrical energy consumption was highest for the microwave process. Notably, sonication achieved a maximum reactive P release of 2.09 mg·L−1·Wh−1, while microwave treatment only reached 0.46 mg·L−1·Wh−1, representing just 22% of sonication’s efficiency. Although ozonation’s electrical energy consumption was relatively modest, it secured the second-highest maximum emission of reactive P at 1.99 mg·L−1·Wh−1. However, with longer operating times, the quantity of reactive P emissions diminished rapidly. UV/H2O2 featured lower electrical energy consumption than ozonation, but the continuous usage of H2O2 might result in higher operating costs compared to other technologies alongside ozonation.
The commercial potential of sonication processing has been debated among researchers. Laboratory-scale studies have indicated substantial energy consumption, making sonication appear less energy-efficient and, therefore, impractical [54]. However, in full-scale commercial applications, sonication has been shown to consume less than 10 kWh of energy for treating 1 m3 of 10% total solids (TS). Some researchers contend that sonication is energetically viable because the energy consumption for typical sludge concentrations in an actual treatment plant is only 6 kWh [55]. Therefore, sonication is a viable technique with the lowest electrical energy consumption for reactive P release.

4. Conclusions

This study investigates the influence of pH control on the release of P, providing insights into the increase in TP and the proportion of reactive P across different pH levels. Validation of these experiments is achieved through simulations using Visual MINTEQ software, affirming that P release is more prominent under acidic conditions, a result that is attributed to the augmentation of specific chemical bonds with increasing pH levels. Consequently, the recommended strategy involves combining low pH levels with pretreatment processes, offering advantages in the promotion of P release from both environmental and economic standpoints. Notably, sonication stands out for its substantial increase in reactive P release, showcasing superior efficiency and economic viability among the examined processes. This study offers a thorough analysis of the impact of pH control on P release, presenting practical insights for optimizing processes in terms of efficiency and economics.

Author Contributions

Validation, K.J.M.; Formal analysis, K.J.M.; Investigation, J.H.L. and H.J.A.; Data curation, J.H.L. and H.J.A.; Writing—original draft, J.H.L.; Writing—review & editing, K.J.M. and K.Y.P.; Supervision, K.Y.P. All authors have read and agreed to the published version of the manuscript.

Funding

This research was funded by the Korea Environmental Industry and Technology Institute (KEITI) through the Research and Development Project for Energy and Resource Recovery Type High-concentration Wastewater and Sewage Treatment Process, funded by the Korean Ministry of Environment (MOE) grant number [2022003600001] and the Human Resources Development Program of the Korea Institute of Energy Technology Evaluation and Planning (KETEP) grant, funded by the Ministry of Trade, Industry and Energy, Republic of Korea grant number [No. RS-2023-00237035] And The APC was funded by [2022003600001 and No. RS-2023-00237035].

Data Availability Statement

Data available on request due to restrictions e.g., privacy or ethical. The data presented in this study are available on request from the corresponding author. The data are not publicly available due to [restrictions apply to the availability of these data].

Acknowledgments

The authors thank the support from the Korea Environmental Industry and Technology Institute (KEITI) through the Research and Development Project for Energy and Resource Recovery Type High-concentration Wastewater and Sewage Treatment Process, funded by the Korean Ministry of Environment (MOE), and the Human Resources Development Program of the Korea Institute of Energy Technology Evaluation and Planning (KETEP) grant, funded by the Ministry of Trade, Industry and Energy, Republic of Korea.

Conflicts of Interest

The authors declare no conflict of interest.

References

  1. Chrispim, M.C.; Scholz, M.; Nolasco, M.A. Phosphorus recovery from municipal wastewater treatment: Critical review of challenges and opportunities for developing countries. J. Environ. Manag. 2019, 248, 109268. [Google Scholar] [CrossRef]
  2. Hellal, F.; El-Sayed, S.; Zewainy, R.; Amer, A. Importance of phosphate pock application for sustaining agricultural production in Egypt. Bull. Natl. Res. Cent. 2019, 43, 11. [Google Scholar] [CrossRef]
  3. Fang, L.; Wang, Q.; Li, J.S.; Poon, C.S.; Cheeseman, C.R.; Donatello, S.; Tsang, D.C. Feasibility of wet-extraction of phosphorus from incinerated sewage sludge ash (ISSA) for phosphate fertilizer production: A critical review. Crit. Rev. Environ. Sci. Technol. 2021, 51, 939–971. [Google Scholar] [CrossRef]
  4. Cosgun, S.; Semerci, N. Combined and individual applications of ozonation and microwave treatment for waste activated sludge solubilization and nutrient release. J. Environ. Manag. 2019, 241, 76–83. [Google Scholar] [CrossRef]
  5. Van Dijk, K.C.; Lesschen, J.P.; Oenema, O. Phosphorus flows and balances of the European Union Member States. Sci. Total Environ. 2016, 542, 1078–1093. [Google Scholar] [CrossRef] [PubMed]
  6. Wang, Z.; Liu, F.; He, Z. Electrochemical phosphorus release and recovery from wastewater sludge: A review. Crit. Rev. Environ. Sci. Technol. 2023, 53, 1359–1377. [Google Scholar]
  7. Jack, J.; Huggins, T.M.; Huang, Y.; Fang, Y.; Ren, Z.J. Production of magnetic biochar from waste-derived fungal biomass for phosphorus removal and recovery. J. Clean. Prod. 2019, 224, 100–106. [Google Scholar] [CrossRef]
  8. Guo, H.G.; Chen, Q.L.; Hu, H.W.; He, J.Z. High-solid anaerobic co-digestion of pig manure with lignite promotes methane production. J. Clean. Prod. 2020, 258, 120695. [Google Scholar] [CrossRef]
  9. Ma, H.; Guo, Y.; Qin, Y.; Li, Y.Y. Nutrient recovery technologies integrated with energy recovery by waste biomass anaerobic digestion. Bioresour. Technol. 2018, 269, 520–531. [Google Scholar] [CrossRef]
  10. Kim, D.; Min, K.J.; Lee, K.; Yu, M.S.; Park, K.Y. Effects of pH, molar ratios and pre-treatment on phosphorus recovery through struvite crystallization from effluent of anaerobically digested swine wastewater. Environ. Eng. Res. 2017, 22, 12–18. [Google Scholar] [CrossRef]
  11. Min, K.J.; Kim, D.; Lee, J.; Lee, K.; Park, K.Y. Characteristics of vegetable crop cultivation and nutrient releasing with struvite as a slow-release fertilizer. Environ. Sci. Pollut. Res. 2019, 26, 34332–34344. [Google Scholar] [CrossRef] [PubMed]
  12. Kamusoko, R.; Jingura, R.M.; Parawira, W.; Sanyika, W.T. Comparison of pretreatment methods that enhance biomethane production from crop residues—A systematic review. Biofuel Res. J. 2019, 6, 1080–1089. [Google Scholar] [CrossRef]
  13. Li, W.; Yu, N.; Liu, Q.; Li, Y.; Ren, N.; Xing, D. Enhancement of the sludge disintegration and nutrients release by a treatment with potassium ferrate combined with an ultrasonic process. Sci. Total Environ. 2018, 635, 699–704. [Google Scholar] [CrossRef]
  14. Agrawal, A.V.; Chaudhari, P.K.; Ghosh, P. Effect of microwave treatment on maximizing biogas yield for anaerobic co-digestion of fruit and vegetable waste and anaerobic sludge. Biomass Convers. Biorefin. 2023, 1–13. [Google Scholar] [CrossRef]
  15. Mawioo, P.M.; Rweyemamu, A.; Garcia, H.A.; Hooijmans, C.M.; Brdjanovic, D. Evaluation of a microwave based reactor for the treatment of blackwater sludge. Sci. Total Environ. 2016, 548, 72–81. [Google Scholar] [CrossRef]
  16. Dos Santos, L.C.; Adarme, O.F.H.; Baêta, B.E.L.; Gurgel, L.V.A.; de Aquino, S.F. Production of biogas (methane and hydrogen) from anaerobic digestion of hemicellulosic hydrolysate generated in the oxidative pretreatment of coffee husks. Bioresour. Technol. 2018, 263, 601–612. [Google Scholar] [CrossRef]
  17. Zhao, Y.; Wang, L.; Helong, Y.; Baojun, J.; Jinming, J. Comparison of sludge treatment by O3 and O3/H2O2. Water Sci. Technol. 2014, 70, 114. [Google Scholar] [CrossRef]
  18. Gahlot, P.; Balasundaram, G.; Tyagi, V.K.; Atabani, A.E.; Suthar, S.; Kazmi, A.A.; Štěpanec, L.; Juchelková, D.; Kumar, A. Principles and potential of thermal hydrolysis of sewage sludge to enhance anaerobic digestion. Environ. Res. 2022, 214, 113856. [Google Scholar] [CrossRef]
  19. Bolado-Rodríguez, S.; Toquero, C.; Martín-Juárez, J.; Travaini, R.; García-Encina, P.A. Effect of thermal, acid, alkaline and alkaline-peroxide pretreatments on the biochemical methane potential and kinetics of the anaerobic digestion of wheat straw and sugarcane bagasse. Bioresour. Technol. 2016, 201, 182–190. [Google Scholar] [CrossRef]
  20. Xu, Y.; Hu, H.; Liu, J.; Luo, J.; Qian, G.; Wang, A. pH dependent phosphorus release from waste activated sludge: Contributions of phosphorus speciation. Chem. Eng. J. 2015, 267, 260–265. [Google Scholar] [CrossRef]
  21. Wang, X.; Xie, Y.; Qi, X.; Chen, T.; Zhang, Y.; Gao, C.; Zhang, A. A new mechanical cutting pretreatment approach towards the improvement of primary sludge fermentation and anaerobic digestion. J. Environ. Chem. Eng. 2022, 10, 107163. [Google Scholar] [CrossRef]
  22. Zielewicz, E.; Tytła, M. Effects of ultrasonic disintegration of excess sludge obtained in disintegrators of different construction. Environ. Technol. 2016, 36, 2210–2216. [Google Scholar] [CrossRef] [PubMed]
  23. Fall, C.; Silva-Hernández, B.C.; Hooijmans, C.M.; Lopez-Vazquez, C.M.; Esparza-Soto, M.; Lucero-Chávez, M.; van Loosdrecht, M.C.M. Sludge reduction by ozone: Insights and modeling of the dose response effects. J. Environ. Manag. 2018, 206, 103–112. [Google Scholar] [CrossRef]
  24. Gil, A.; Siles, J.A.; Martín, M.A.; Chica, A.F.; Estévez-Pastor, F.S.; Toro-Baptista, E. Effect of microwave pretreatment on semi-continuous anaerobic digestion of sewage sludge. Renew. Energy 2018, 115, 917–925. [Google Scholar] [CrossRef]
  25. Semblante, G.U.; Hai, F.I.; Dionysiou, D.D.; Fukushi, K.; Price, W.E.; Nghiem, L.D. Holistic sludge management through ozonation: A critical review. J. Environ. Manag. 2017, 185, 79–95. [Google Scholar] [CrossRef] [PubMed]
  26. Wilfert, P.; Kumar, P.S.; Korving, L.; Witkamp, G.J.; Van Loosdrecht, M.C. The relevance of phosphorus and iron chemistry to the recovery of phosphorus from wastewater: A review. Environ. Sci. Technol. 2015, 49, 9400–9414. [Google Scholar] [CrossRef]
  27. Toor, U.A.; Kim, D.J. Effect of pH on phosphorus (P) dissolution and recovery from polyaluminum chlorides (PAC) sludge. J. Environ. Manag. 2019, 239, 142–149. [Google Scholar] [CrossRef]
  28. Chen, J.; Tang, S.; Yan, F.; Zhang, Z. Efficient recovery of phosphorus in sewage sludge through hydroxylapatite enhancement formation aided by calcium-based additives. Water Res. 2020, 171, 115450. [Google Scholar] [CrossRef]
  29. Han, X.; Wang, F.; Zhou, B.; Chen, H.; Yuan, R.; Liu, S.; Zhou, X.; Gao, L.; Le, Y.; Zhang, R. Phosphorus complexation of sewage sludge during thermal hydrolysis with different reaction temperature and reaction time by P K-edge XANES and (31)P NMR. Sci. Total Environ. 2019, 688, 1–9. [Google Scholar] [CrossRef]
  30. Yu, B.; Luo, J.; Xie, H.; Yang, H.; Chen, S.; Liu, J.; Zhang, R.; Li, Y.Y. Species, fractions, and characterization of phosphorus in sewage sludge: A critical review from the perspective of recovery. Sci. Total Environ. 2021, 786, 147437. [Google Scholar] [CrossRef]
  31. Kim, S.H.; Lee, S.W.; Kim, J.J.; Kim, S.O. Analytical Methods of Hydroxyl Radical Produced by TiO2 Photo-catalytic Oxidation. J. Mineral. Soc. Korea 2015, 28, 245–253. [Google Scholar] [CrossRef]
  32. Venkiteshwaran, K.; McNamara, P.J.; Mayer, B.K. Meta-analysis of non-reactive phosphorus in water, wastewater, and sludge, and strategies to convert it for enhanced phosphorus removal and recovery. Sci. Total Environ. 2018, 644, 661–674. [Google Scholar] [CrossRef] [PubMed]
  33. He, Z.W.; Liu, W.Z.; Wang, L.; Tang, C.C.; Guo, Z.C.; Yang, C.X.; Wang, A.J. Clarification of phosphorus fractions and phosphorus release enhancement mechanism related to pH during waste activated sludge treatment. Bioresour. Technol. 2016, 222, 217–225. [Google Scholar] [CrossRef] [PubMed]
  34. Yu, H.; Yang, Y.; Wu, X.; Yuan, W.; Wang, H.; Deng, H.; Sun, L.; Li, R. Phosphorus Migration and Transformation in Activated Sludge by Ultrasonic Treatment. Sustainability 2022, 14, 11224. [Google Scholar] [CrossRef]
  35. Khanal, S.K.; Grewell, D.; Sung, S.; Van Leeuwen, J. Ultrasound applications in wastewater sludge pretreatment: A review. Crit. Rev. Environ. Sci. Technol. 2007, 37, 277–313. [Google Scholar] [CrossRef]
  36. Mayer, B.K.; Baker, L.A.; Boyer, T.H.; Drechsel, P.; Gifford, M.; Hanjra, M.A.; Parameswaran, P.; Stoltzfus, J.; Westerhoff, P.; Rittmann, B.E. Total Value of Phosphorus Recovery. Environ. Sci. Technol. 2016, 50, 6606–6620. [Google Scholar] [CrossRef]
  37. Wolski, P.; Zawieja, I. Effect of Ultrasound Field on Dewatering of Sewage Sludge. Arch. Environ. Prot. 2012, 38, 25–31. [Google Scholar] [CrossRef]
  38. Tian, W.; Li, L.; Liu, F.; Zhang, Z.; Yu, G.; Shen, Q.; Shen, B. Assessment of the maturity and biological parameters of compost produced from dairy manure and rice chaff by excitation-emission matrix fluorescence spectroscopy. Bioresour. Technol. 2012, 110, 330–337. [Google Scholar] [CrossRef]
  39. Zhang, H.; Victor, K.L.; Thompson, J.R.; Frederic, A.K.; Ping, H.L.; Sergey, L.; Donald, S.M.; James, A. Recovery of phosphorus from dairy manure: A pilot- scale study. Environ. Technol. 2014, 36, 1398–11404. [Google Scholar] [CrossRef]
  40. Fard, M.S.; Ehsani, A.; Soleimani, F. Optimization of Toluenediamine degradation in synthetic wastewater by a UV/H2O2 process using full factorial design. Water Resour. Ind. 2023, 30, 100218. [Google Scholar] [CrossRef]
  41. Buthiyappan, A.; Abdul Aziz, A.R.; Wan Daud, W.M.A. Degradation performance and cost implication of UV-integrated advanced oxidation processes for wastewater treatments. Rev. Chem. Eng. 2015, 31, 263–302. [Google Scholar] [CrossRef]
  42. Iervolino, G.; Vaiano, V.; Palma, V. Enhanced removal of water pollutants by dielectric barrier discharge non-thermal plasma reactor. Sep. Purif. Technol. 2019, 215, 155–162. [Google Scholar] [CrossRef]
  43. Wang, J.; Sun, Y.; Feng, J.; Xin, L.; Ma, J. Degradation of triclocarban in water by dielectric barrier discharge plasma combined with TiO2/activated carbon fibers: Effect of operating parameters and byproducts identification. Chem. Eng. J. 2016, 300, 36–46. [Google Scholar] [CrossRef]
  44. Kostas, E.T.; Beneroso, D.; Robinson, J.P. The application of microwave heating in bioenergy: A review on the microwave pre-treatment and upgrading technologies for biomass. Renew. Sustain. Energy Rev. 2017, 77, 12–27. [Google Scholar] [CrossRef]
  45. Lee, J.H.; Lee, J.M.; Lim, J.S.; Park, T.J.; Byun, I.G. Enhancement of microwave effect with addition of chemical agents in solubilization of waste activated sludge. J. Ind. Eng. Chem. 2015, 24, 359–364. [Google Scholar] [CrossRef]
  46. Min, K.J.; Lee, J.; Cha, H.Y.; Park, K.Y. Nutrient removal from secondary effluent using filamentous algae in raceway ponds. Membr. Water Treat. 2019, 10, 191–199. [Google Scholar] [CrossRef]
  47. Senn, A.C.; Kaegi, R.; Hug, S.J.; Hering, J.G.; Mangold, S.; Voegelin, A. Composition and structure of Fe (III)-precipitates formed by Fe (II) oxidation in water at near-neutral pH: Interdependent effects of phosphate, silicate and Ca. Geochim. Cosmochim. Acta 2015, 162, 220–246. [Google Scholar] [CrossRef]
  48. van Genuchten, C.M.; Pena, J.; Amrose, S.E.; Gadgil, A.J. Structure of Fe (III) precipitates generated by the electrolytic dissolution of Fe (0) in the presence of groundwater ions. Geochim. Cosmochim. Acta 2014, 127, 285–304. [Google Scholar] [CrossRef]
  49. Hong, S.H.; Lee, C.G.; Jeong, S.; Park, S.J. Synthesis of polysulfone beads impregnated with Ca-sepiolite for phosphate removal. Membr. Water Treat. 2020, 11, 69–77. [Google Scholar] [CrossRef]
  50. da Silva Cerozi, B.; Fitzsimmons, K. The effect of pH on phosphorus availability and speciation in an aquaponics nutrient solution. Bioresour. Technol. 2016, 219, 778–781. [Google Scholar] [CrossRef]
  51. Kim, J.; Yoon, S.; Jung, J.; Bae, S. Phosphorus removal by lime-natural mineral dissolved solutions. Membr. Water Treat. 2023, 14, 27. [Google Scholar] [CrossRef]
  52. Garcia-Segura, S.; Eiband, M.M.S.G.; de Melo, J.V.; Martínez-Huitle, C.A. Electrocoagulation and advanced electrocoagulation processes: A general review about the fundamentals, emerging applications and its association with other technologies. J. Electroanal. Chem. 2017, 801, 267–299. [Google Scholar] [CrossRef]
  53. Shaker, O.A.; Safwat, S.M.; Matta, M.E. Nickel removal from wastewater using electrocoagulation process with zinc electrodes under various operating conditions: Performance investigation, mechanism exploration, and cost analysis. Environ. Sci. Pollut. Res. 2023, 30, 26650–26662. [Google Scholar] [CrossRef] [PubMed]
  54. Cano, R.; Pérez-Elvira, S.I.; Fdz-Polanco, F. Energy feasibility study of sludge pretreatments: A review. Appl. Energy 2015, 149, 176–185. [Google Scholar] [CrossRef]
  55. Ariunbaatar, J.; Panico, A.; Esposito, G.; Pirozzi, F.; Lens, P.N. Pretreatment methods to enhance anaerobic digestion of organic solid waste. Appl. Energy 2014, 123, 143–156. [Google Scholar] [CrossRef]
Figure 1. Concentrations and fractions of TP and reactive P by pH pretreatment.
Water 15 04033 g001
Figure 2. P alterations in response to pH and reaction duration in each pretreatment process: (a) sonication, (b) ozonation, (c) UV/H2O2, (d) cold plasma, (e) microwave, and (f) milling.
Water 15 04033 g002
Figure 3. Hydroxyl radicals for each pretreatment process at pH 6 conditions.
Water 15 04033 g003
Figure 4. Concentrations and fractions of TP and reactive P by pretreatment processes at various pH levels.
Water 15 04033 g004
Figure 5. Speciation of major P in aqua as a function of pH simulated in Visual MINTEQ software with the presence of cations (Ca2+, Fe2+, and K+). The simulation results are depicted as lines, showcasing variations in response to the pH changes to the original sample. Additionally, the forecasted values for each pH, derived from the analysis of measurements taken after adjusting the pH, are illustrated as dots.
Water 15 04033 g005
Figure 6. Saturation index of solid-state materials across varying pH levels as simulated in Visual MINTEQ software.
Water 15 04033 g006
Figure 7. Concentration of reactive P in relation to electrical energy consumption at pH 6 conditions.
Water 15 04033 g007
Table 1. Characteristics of the anaerobic digestate.
UnitConcentration UnitConcentration
pH-8.22Ca2+mg·L−160.3
Suspended Solids (SS)mg·L−134,360Mg2+mg·L−114.8
Chemical Oxygen Demand (COD)mg·L−134,650Fe2+mg·L−134.9
Total Nitrogen (TN)mg·L−14200K+mg·L−11971.6
Ammoniacal Nitrogen (NH3-N)mg·L−13820Ni2+mg·L−10.6
Total Phosphorus (TP)mg·L−1476Cu2+mg·L−10.7
Phosphate phosphorus (PO43−-P)mg·L−1164Cl-mg·L−14191.6
Disclaimer/Publisher’s Note: The statements, opinions and data contained in all publications are solely those of the individual author(s) and contributor(s) and not of MDPI and/or the editor(s). MDPI and/or the editor(s) disclaim responsibility for any injury to people or property resulting from any ideas, methods, instructions or products referred to in the content.

