Abstract
The karst water resources in the Fengfeng mining area are an important water supply source in the region. In recent years, due to the influence of external environment changes, the hydrochemical environment of karst groundwater has changed. In order to scientifically understand karst groundwater and rationally develop groundwater resources, it is necessary to study the hydrochemical characteristics and evolution laws of groundwater in this area. In this study, major elements in karst groundwater of different years and hydrogen and oxygen isotopes in 2022 were analyzed. The hydrochemical types of the study area were analyzed by using the Piper trilinear diagram drawn with Aquachem10.0 software. D and 18O were used to analyze the source and elevation of groundwater recharge. Origin software was used to draw Gibbs diagrams, three-terminal diagrams, ion ratio diagrams, etc., to analyze the influencing factors of groundwater chemical components. The research results show that: (1) The groundwater in the study area is mainly HCO3-Ca(Mg) type water; (2) The main supply source of karst water in the study area is atmospheric precipitation, and the supply elevation ranges from 1166.7 to 1533.3 m; (3) Most of the karst groundwater in the study area is affected by the dissolution of carbonate and silicate rocks; (4) With the influence of human activities, mainly agricultural activities, with the passage of time, the impact of industrial activities on groundwater has been weakening.
1. Introduction
Groundwater is an important component of freshwater resources and the main water supply source in many parts of the world [1,2]. Analysis of the hydrogeochemical characteristics of groundwater is an effective method to understand the source and evolution of groundwater recharge, which is of great significance to ensure the sustainable utilization of water resources [3,4]. The commonly used methods for the analysis of hydrochemical characteristics include Piper trilinear diagram analysis of groundwater hydrochemical types [5,6,7], hydrogen and oxygen isotope analysis of groundwater recharge elevation and source [8,9,10], Gibbs diagram [11], three-terminal diagram and ion ratio diagram to analyze the source of groundwater chemical components [12,13,14,15,16].
In recent years, domestic and foreign scholars have carried out a lot of research on the evolution mechanism of regional groundwater chemical field [17,18,19,20,21,22]. Carmine Apollaro et al. [23] studied the geochemical characteristics of rocks, stream sediments, and soils in the Fumg Grande Valley. Nur Hayati Hussin et al. [24] used multivariate statistical methods to identify the hydrochemical evolution of shallow groundwater in Quaternary sediments in the Lower Kelantan River Basin, Peninsular Malaysia. Tu Chunlin et al. [25] used a graphic method, mathematical statistics, absolute factor analysis and a multiple linear regression receptor model to study the characteristics and driving factors of hydrochemical evolution in the Qianxi Tuo Yangtze River Basin. Guo Xiaojiao et al. [26] studied the hydrochemical characteristics and evolution of groundwater in Baiyangdian Wetland by comparing and analyzing the hydrochemical characteristics and spatial distribution of surface water and groundwater. Pankaj Kumar et al. [27] analyzed the hydrogeochemical evolution of the Panna region in central India by using the Piper trilinear diagram, ion proportional coefficient and δ18O–δD relationship. Kaveh Pazand et al. [28] analyzed the groundwater hydrochemical evolution process of the igneous rock sedimentary aquifer system in the Bamnan region, southeastern Iran, using multivariate statistical methods. Huang Jinou et al. [29] studied the evolution and genesis of the groundwater hydrochemical field in Hangjiahu Plain by using multivariate statistics and hydrochemical analysis methods. Ye Huijun et al. [30] used hydrochemistry, correlation analysis and ion ratio methods to analyze the hydrochemical evolution characteristics and influencing factors of karst water in the Liupanshui mining area. Balagizi Charles M et al. [31] used stable isotopes to study the groundwater recharge and sources in the north of Jivu Lake in East Africa. Based on hydrochemistry and hydrogen and oxygen isotopes, Meng Linghua [32] studied the source and evolution of karst groundwater recharge in the Tai’an urban area. Carmine Apollaro et al. [33] studied the late argillaceous alteration of the Cave di Caolino cave in Lipari, Iolia Islands, Italy, and analyzed its volcanic risk and the impact of the development of geothermal resources. Barzegar Rahim et al. [34] assessed the potential sources and human health risks of trace elements in groundwater.
Karst groundwater is the main source of agricultural, industrial and domestic water in the Fengfeng mining area. In terms of total water use, the utilization of groundwater resources accounts for more than 50%. Understanding its hydrogeochemical evolution is of great importance to the development, protection and sustainable utilization of groundwater resources. Previous studies on the Fengfeng mining area mostly focused on the spatial evolution of hydrochemistry and achieved rich research results and relatively mature research methods [35,36,37,38,39,40,41].
However, the research on the hydrogeochemistry of karst groundwater in the Fengfeng mining area still has the following shortcomings: (1) In recent years, there have been few studies on the evolution laws of long-term hydrochemistry, which is limited to one hydrological year or the period of abundance and low water; (2) There is a lack of research on the relationship of ions in karst water, the sources and influencing factors of major ions. Therefore, based on a longer time series, this paper will intuitively reveal the evolution laws of karst water-water chemical components in time and space scales. In this paper, the evolution mechanism of karst groundwater in the study area is directly studied, and the conceptual model of groundwater hydrochemical evolution in the study area is established so that the karst groundwater in the study area in recent years is deeply studied.
2. Overview of the Study Area
2.1. Geographical Location
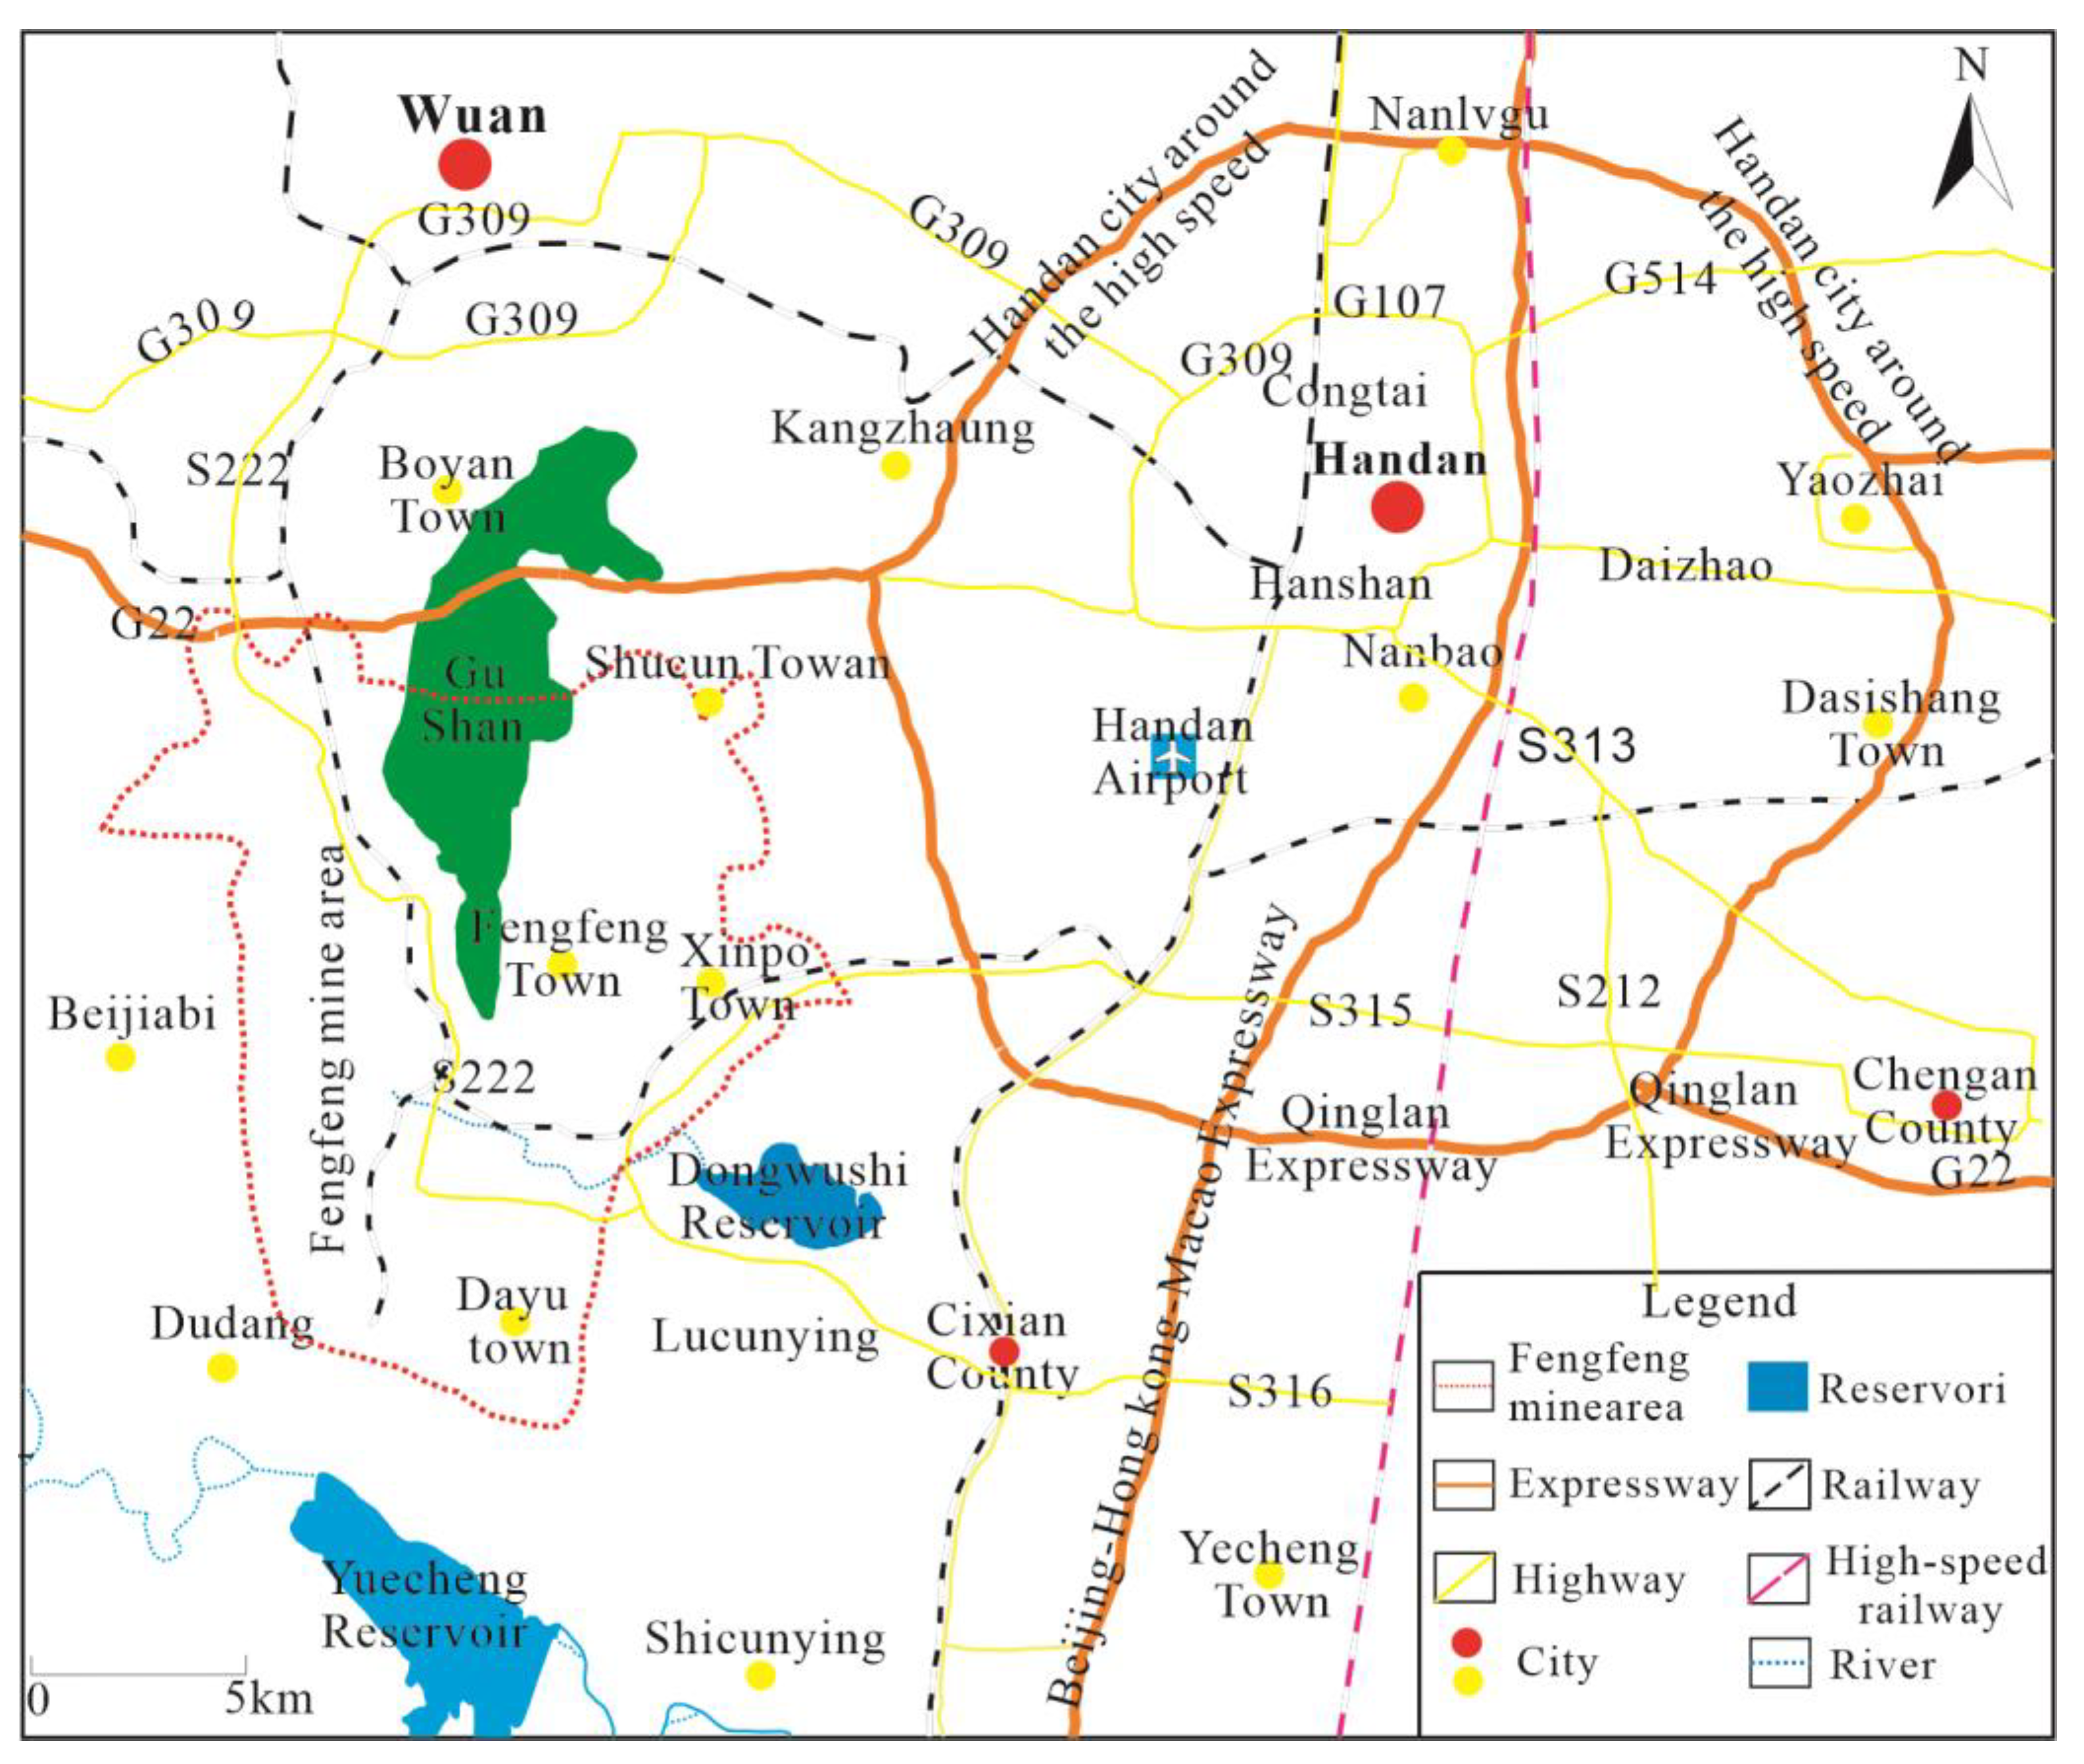
The Fengfeng mining area belongs to Handan City, Hebei Province, located in the south of Hebei Province, at the junction of Shanxi, Hebei and Henan provinces, at the eastern foot of Taihang Mountain and on the west side of North China Plain. Its geographical coordinates are 36°20′–36°34′ north latitude and 114°3′–114°16′ east longitude, as shown in Figure 1.
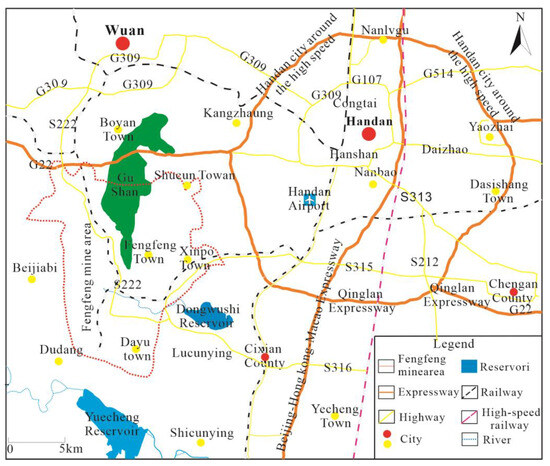
Figure 1.
Geographical Location of Fengfeng Mining Area.
The annual dryness of the Fengfeng mining area is 1.4 degrees; which is located in the middle latitudes. The climate is a warm, temperate, semi-humid continental monsoon climate. The rainfall is mostly concentrated from July to September. The Zhanghe River and Fuyang River are the main rivers in the area. Dongwushi Reservoir and Yuecheng Reservoir are the main surface water bodies. The Nanming River, Fuyang River and Zhanghe River systems are located in the northern, central and southern parts of the study area, respectively. The south wind and north wind appear alternately in the study area. Usually, there will be a weather process in 4–6 days, the maximum wind speed is 14 m/s, and the spring precipitation in the Fengfeng mining area accounts for 12.7% of the annual precipitation.
2.2. Topography and Landform
The Fengfeng mining area is located in the low mountain and hilly area of the southern section of the Taihang Mountains, with an intermountain basin to the west and a sloping plain to the east. The terrain is generally low in the east and high in the west. The highest elevation is 891 m. Gu Mountain runs north and south in the central Fengfeng Mining Area. To the west of Gu Mountain, there is a shallow erosion accumulation area, and to the east, there is a slope–diluvial foreslope gradually entering the North China Plain eastward.
2.3. Geological and Hydrogeological Conditions
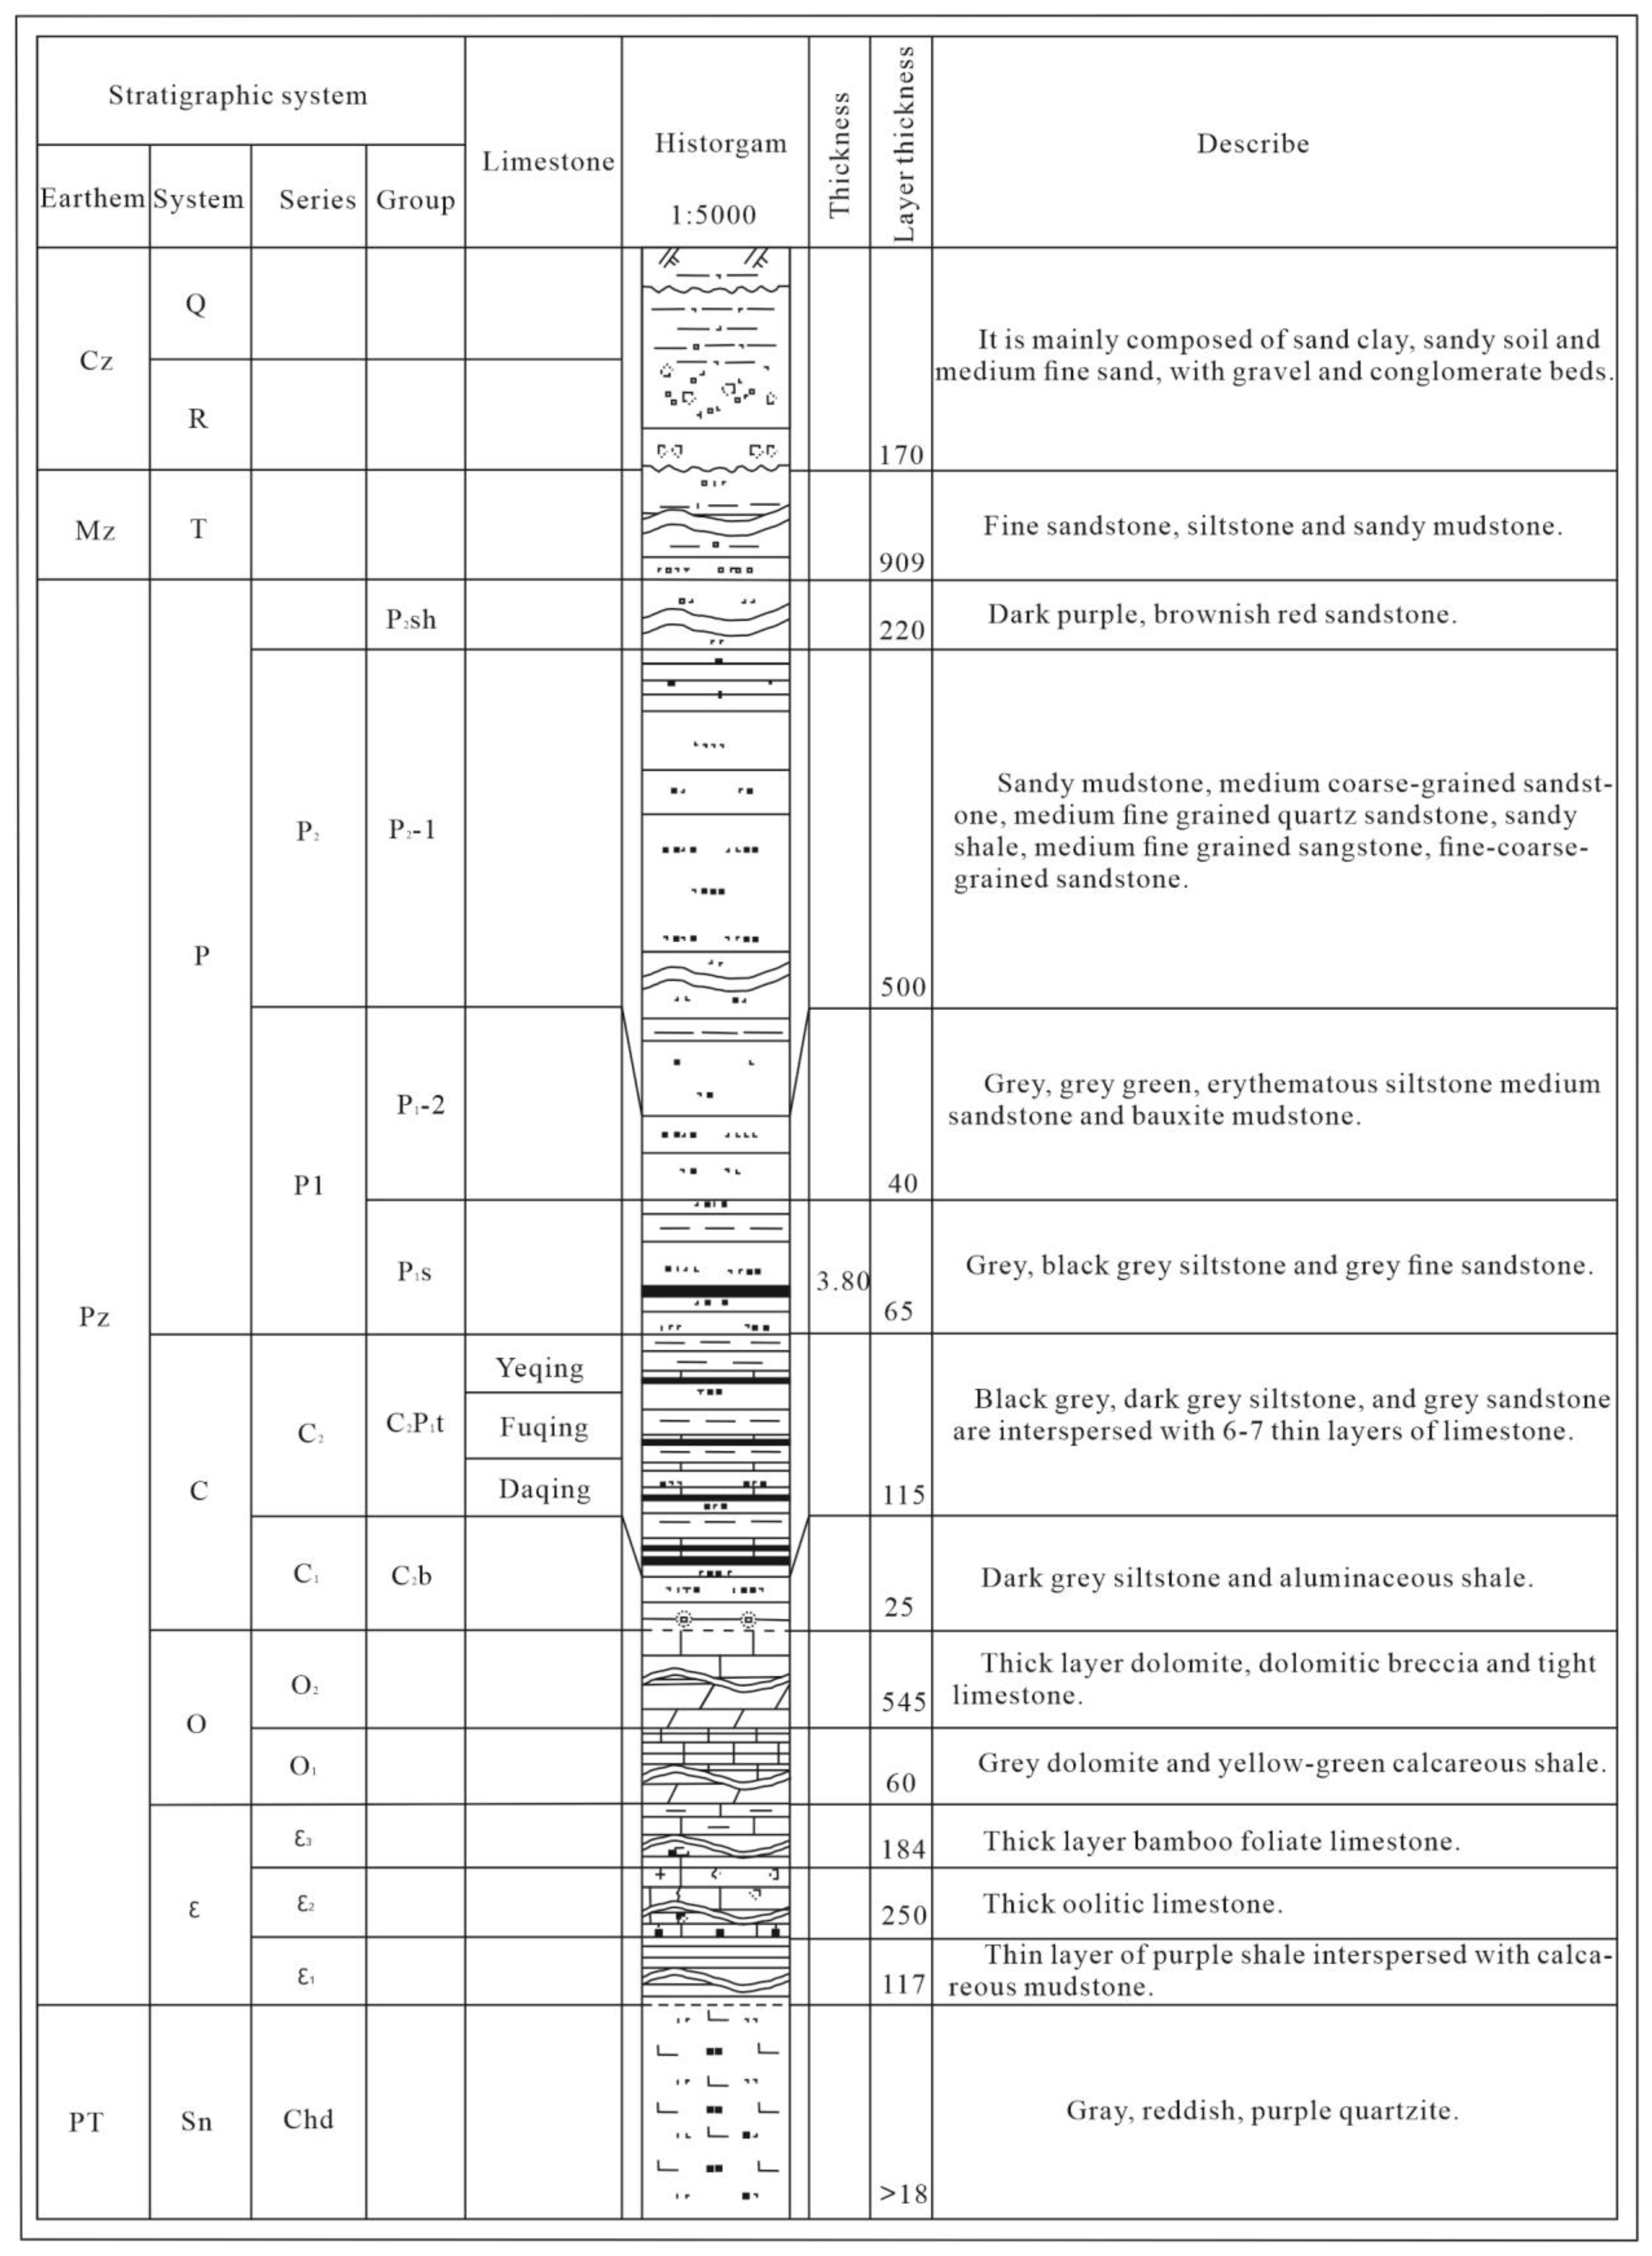
The Fengfeng mining area is located on the eastern side of the Taihang Mountains. The stratigraphic division belongs to the Shanxi stratigraphic division of the Shanxi Hebei Shandong Henan stratigraphic region in the North China stratigraphic region. The strata exposed in the area are relatively complete, and the strata from west to east are the Middle Ordovician, Carboniferous, Permian, Triassic, and Quaternary. The lithology of the Middle Ordovician is mainly thick layer dolomite, dolomitic breccia and tight limestone, while the lithology of the Lower Ordovician is mainly gray dolomite and yellow-green calcareous shale.
The comprehensive stratigraphic histogram is shown in Figure 2.

Figure 2.
Comprehensive Bar Chart.
The aquifer in the Fengfeng mining area from top to bottom is the Quaternary gravel pore aquifer; the sandstone aquifer of the Upper and Lower Shihezi Formation; Shanxi Formation sandstone fissure aquifer; Taiyuan Formation wild bluish limestone fissure karst aquifer; Taiyuan Formation mountain and underlying limestone fissure karst aquifer; Small bluish limestone fissure karst aquifer of Taiyuan Formation; Taiyuan Formation fissure karst aquifer of Great bluish limestone; and Middle Ordovician limestone karst fissure aquifer.
The main lithology of the Ordovician limestone aquifer is gray pure limestone, dolomite, and dolomitic limestone, with a thickness of 500–600 m. In the third member (O2x3) of the Lower Majiagou Formation in the Middle Ordovician, there are 5–6 layers of rock salt or gypsum pseudocrystals, with each layer thickness of 0.15–0.20 m. Due to the uneven development of karst in Ordovician limestone, karst development and water-rich characteristics are controlled horizontally by folds, faults, and tensile fracture structures. Different lithological combinations in the vertical direction have different degrees of karst, and the aquifer can be divided into three groups and eight sections.
2.4. Geological Structure
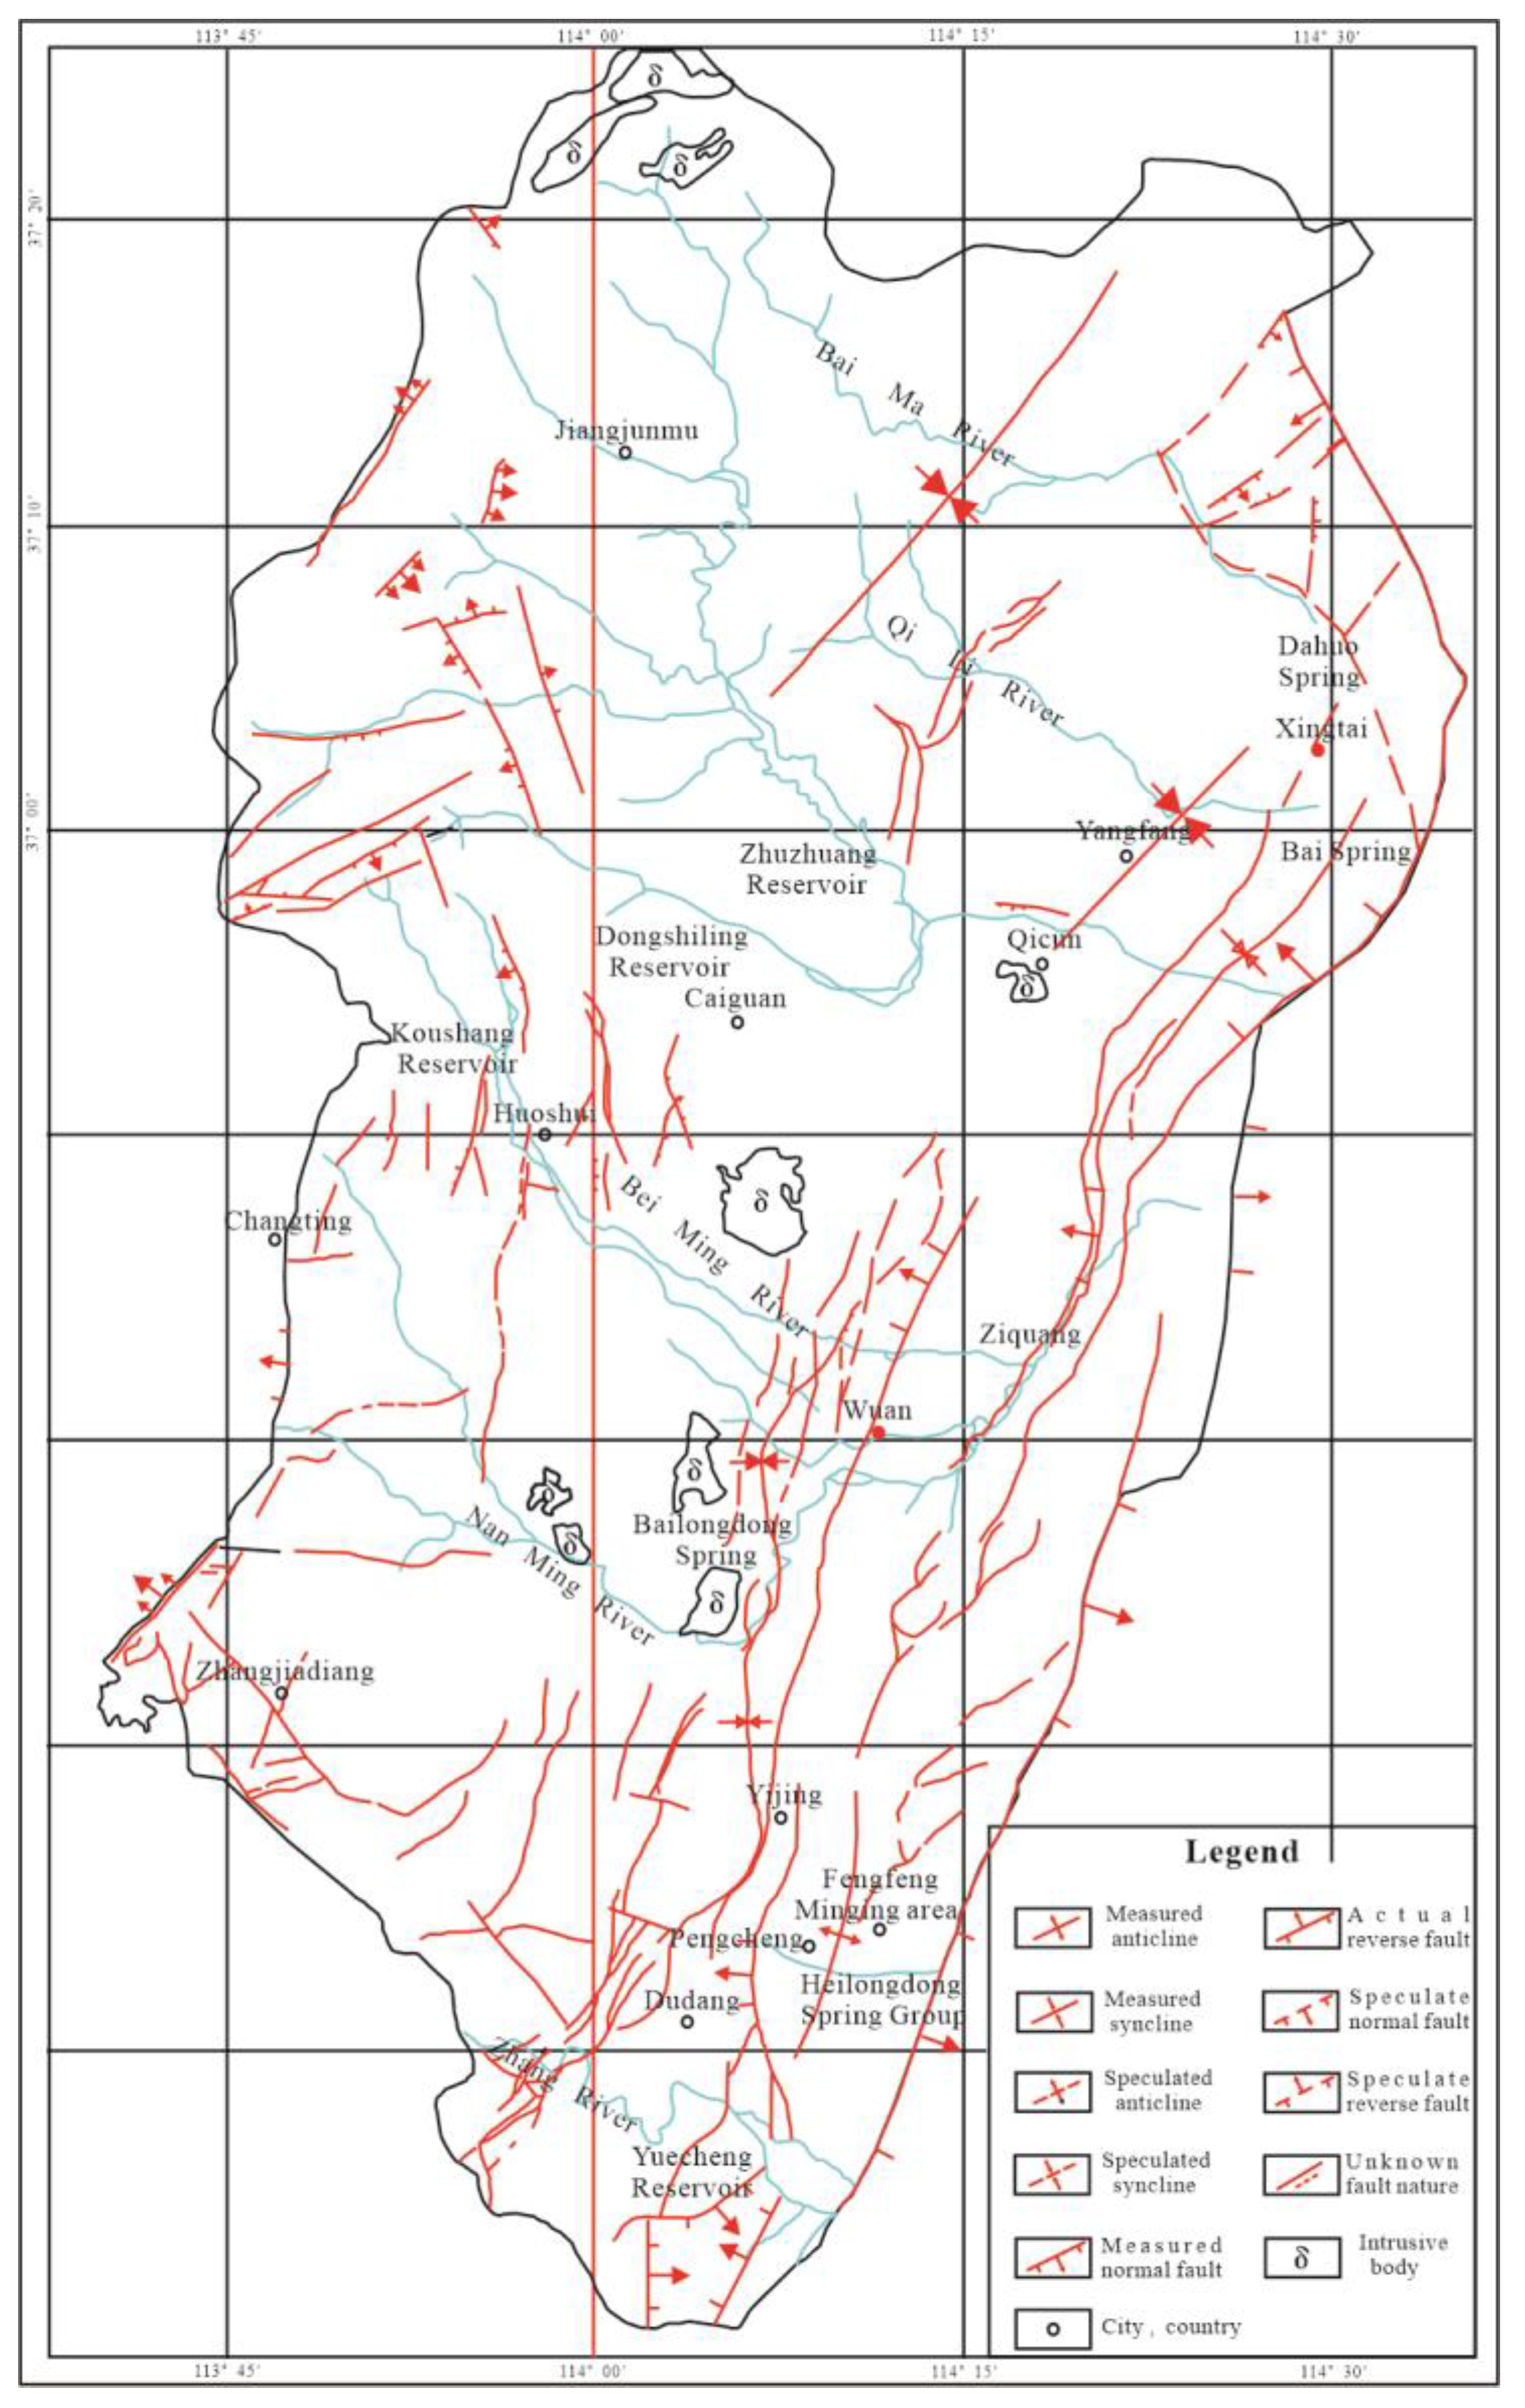
The study area is located in the western part of the North China Plain subsidence zone of the Neocathaysian system. The main structure was formed in the late Yanshan period; the folds were not developed, and the fault structures were developed and dense. A large number of NNE-NE trending normal faults and a small number of small faults in the form of NW trending faults are developed in the area. A total of hundreds of NNE-trending and NE-trending collapse columns are found, with great differences in size and different shapes. In the northern part of the study area, there are magmatic rocks intruded in a long strip in the NNE direction and intruded along the main fault structure in the NNW direction. The outline of the regional geological structure is shown in Figure 3.

Figure 3.
Geological structure outline of the Fengfeng mining area.
2.5. Regional Groundwater Recharge and Drainage Conditions
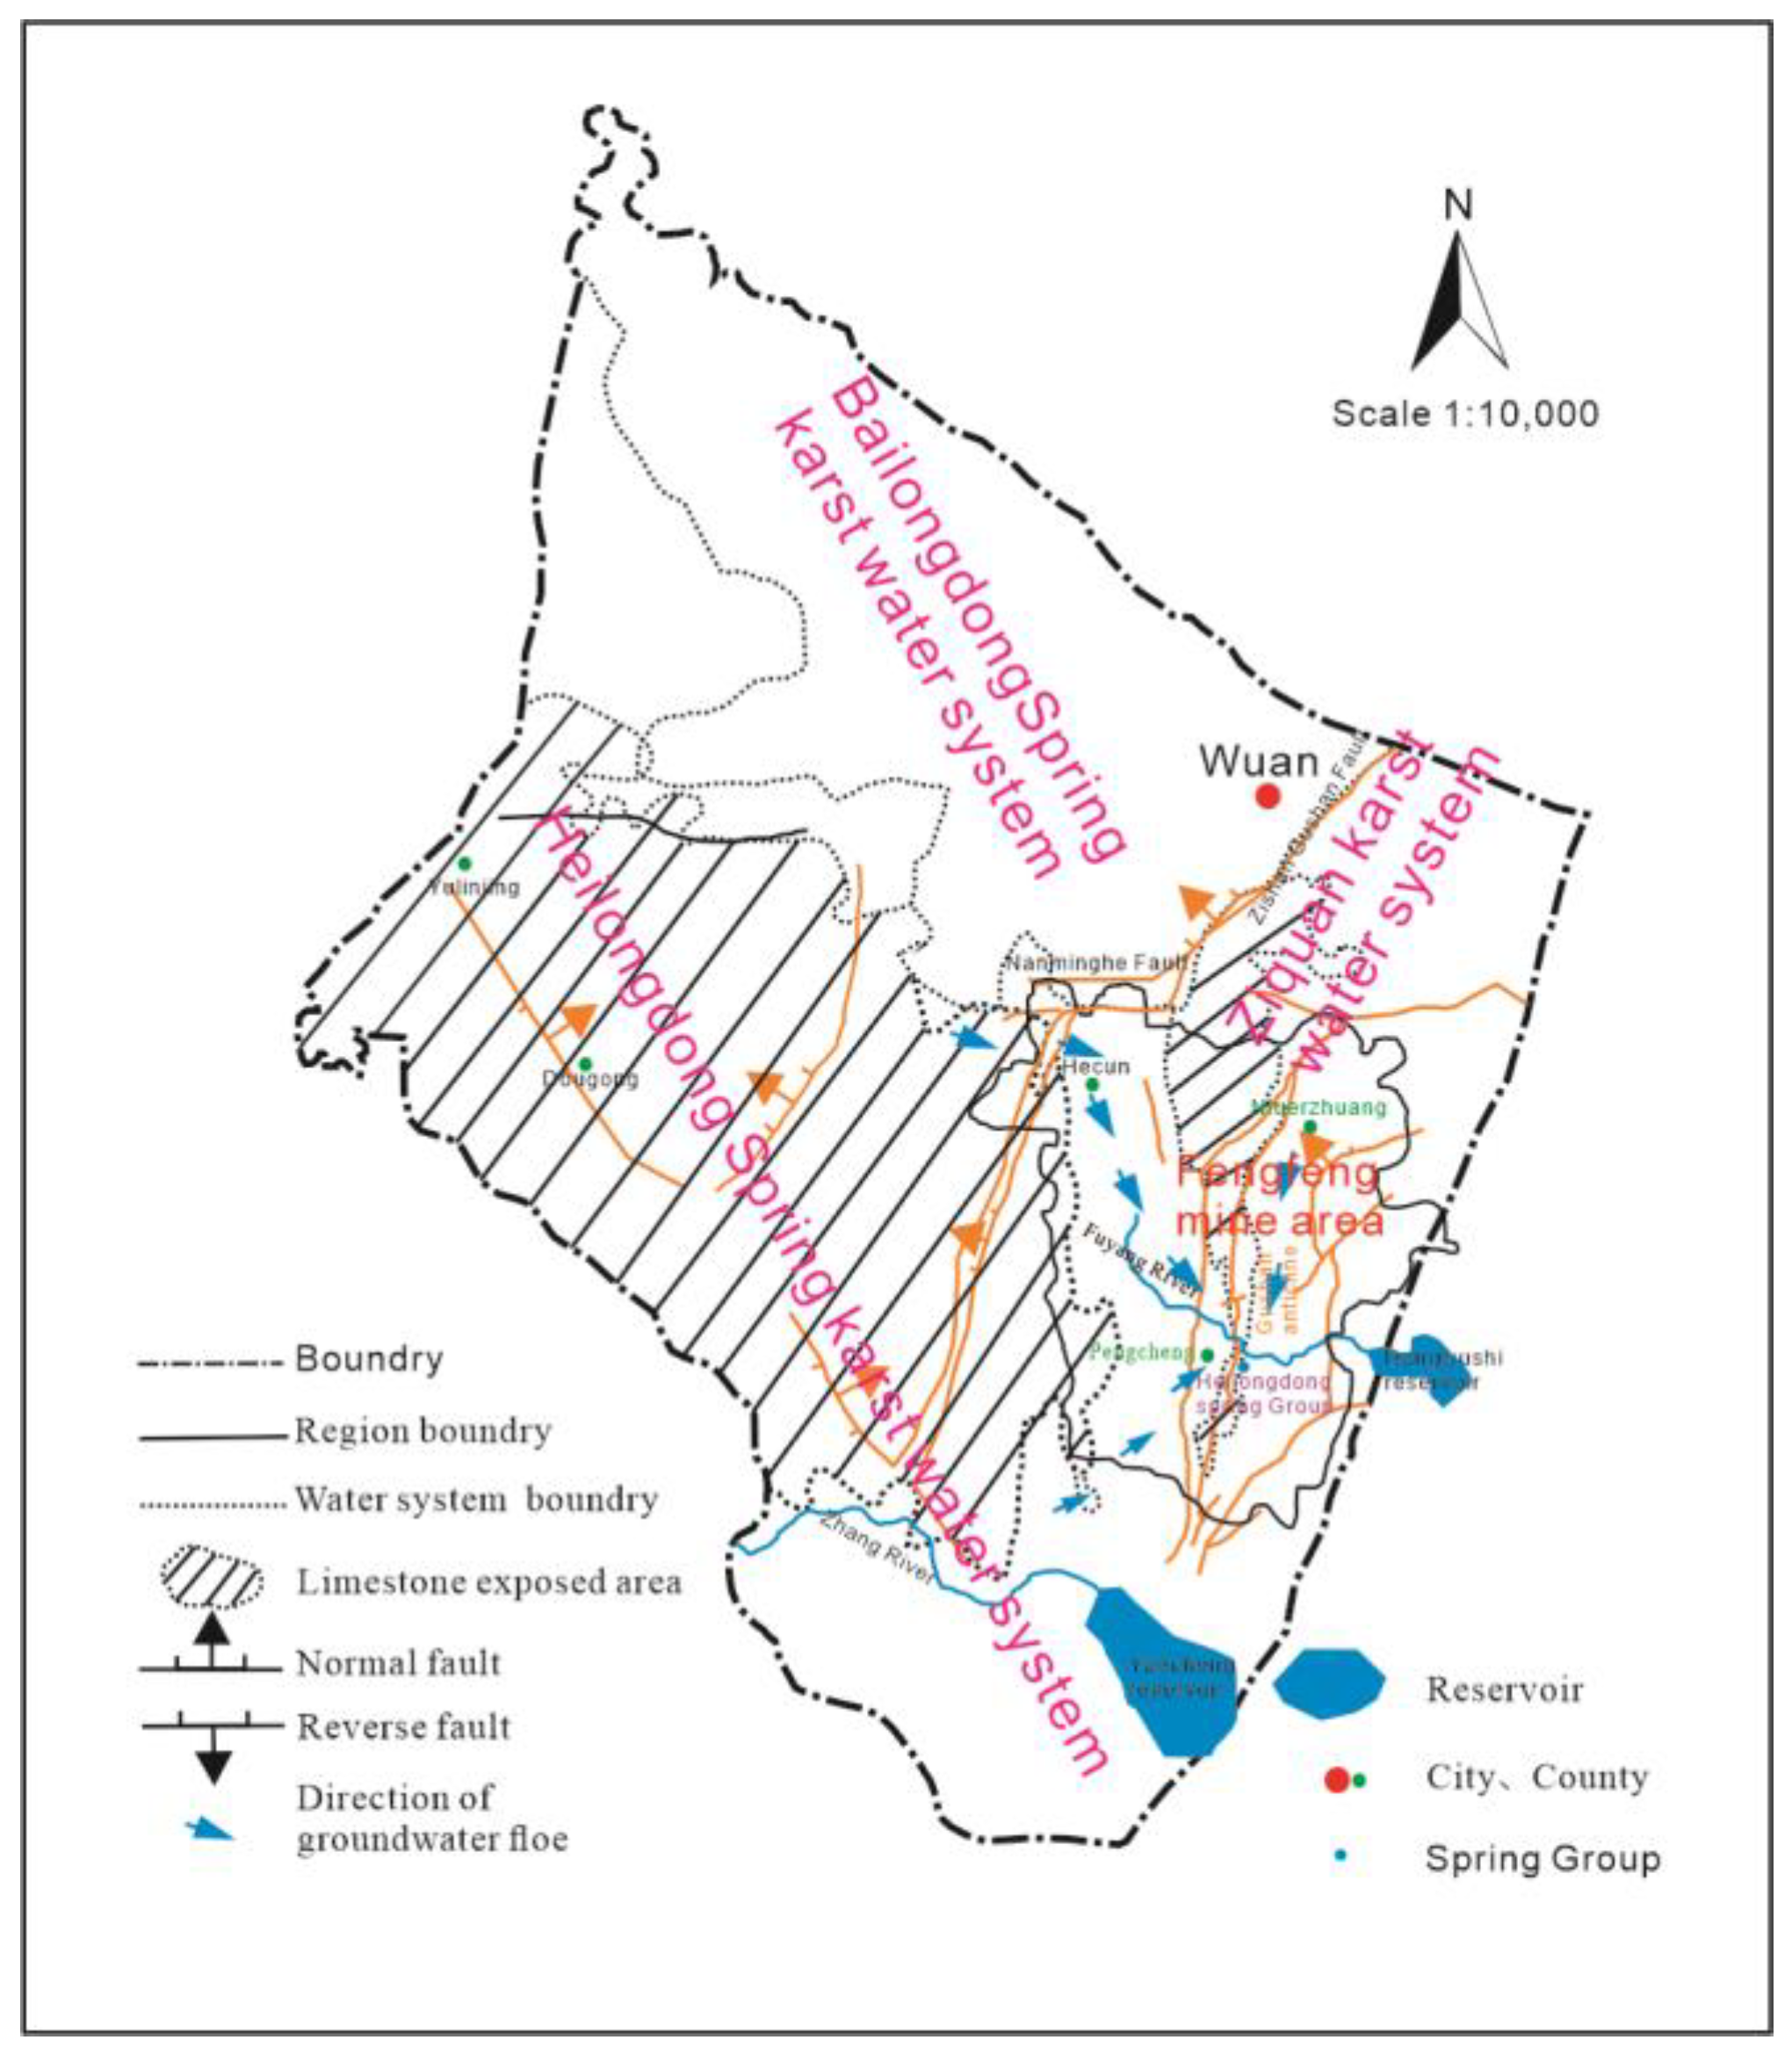
The groundwater in the area mainly comes from atmospheric precipitation supply, and the concentrated supply source comes from the drainage of gullies and rivers in local areas. Due to the influence of terrain, structure, and drainage conditions, groundwater flows into the Hecun Basin from the west, north, and south sides of the limestone exposed leakage area, forming three runoff zones in the north, south, and east of Gu Mountain. The northern strong runoff zone is located in the northern part of the Hecun Basin, with the Cuilu to Dagogang to Yangjiaopu line as the center and lateral recharge as the main supply source, with good supply conditions, strong water richness and low salinity. The southern strong runoff zone is located in the south of the Hexun Basin, centered on the line of the Gangziyao to Heilongdong spring group with strong water richness and low salinity. Atmospheric precipitation infiltration is the main supply source of the runoff belt on the east side of Gu Mountain, and the center line of the Niuerzhuang to the Heilongdongquan Group is poor in water abundance and relatively high in salinity. The hydrogeological plan of the Fengfeng mining area is shown in Figure 4.
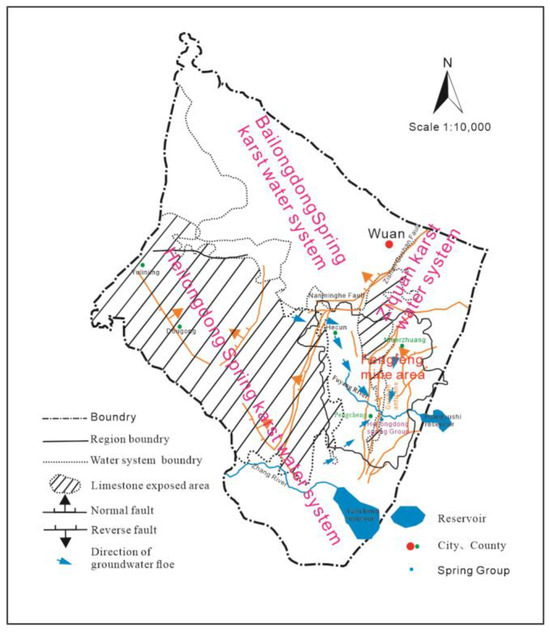
Figure 4.
Regional hydrogeological plan of Fengfeng mining area.
3. Materials and Methods
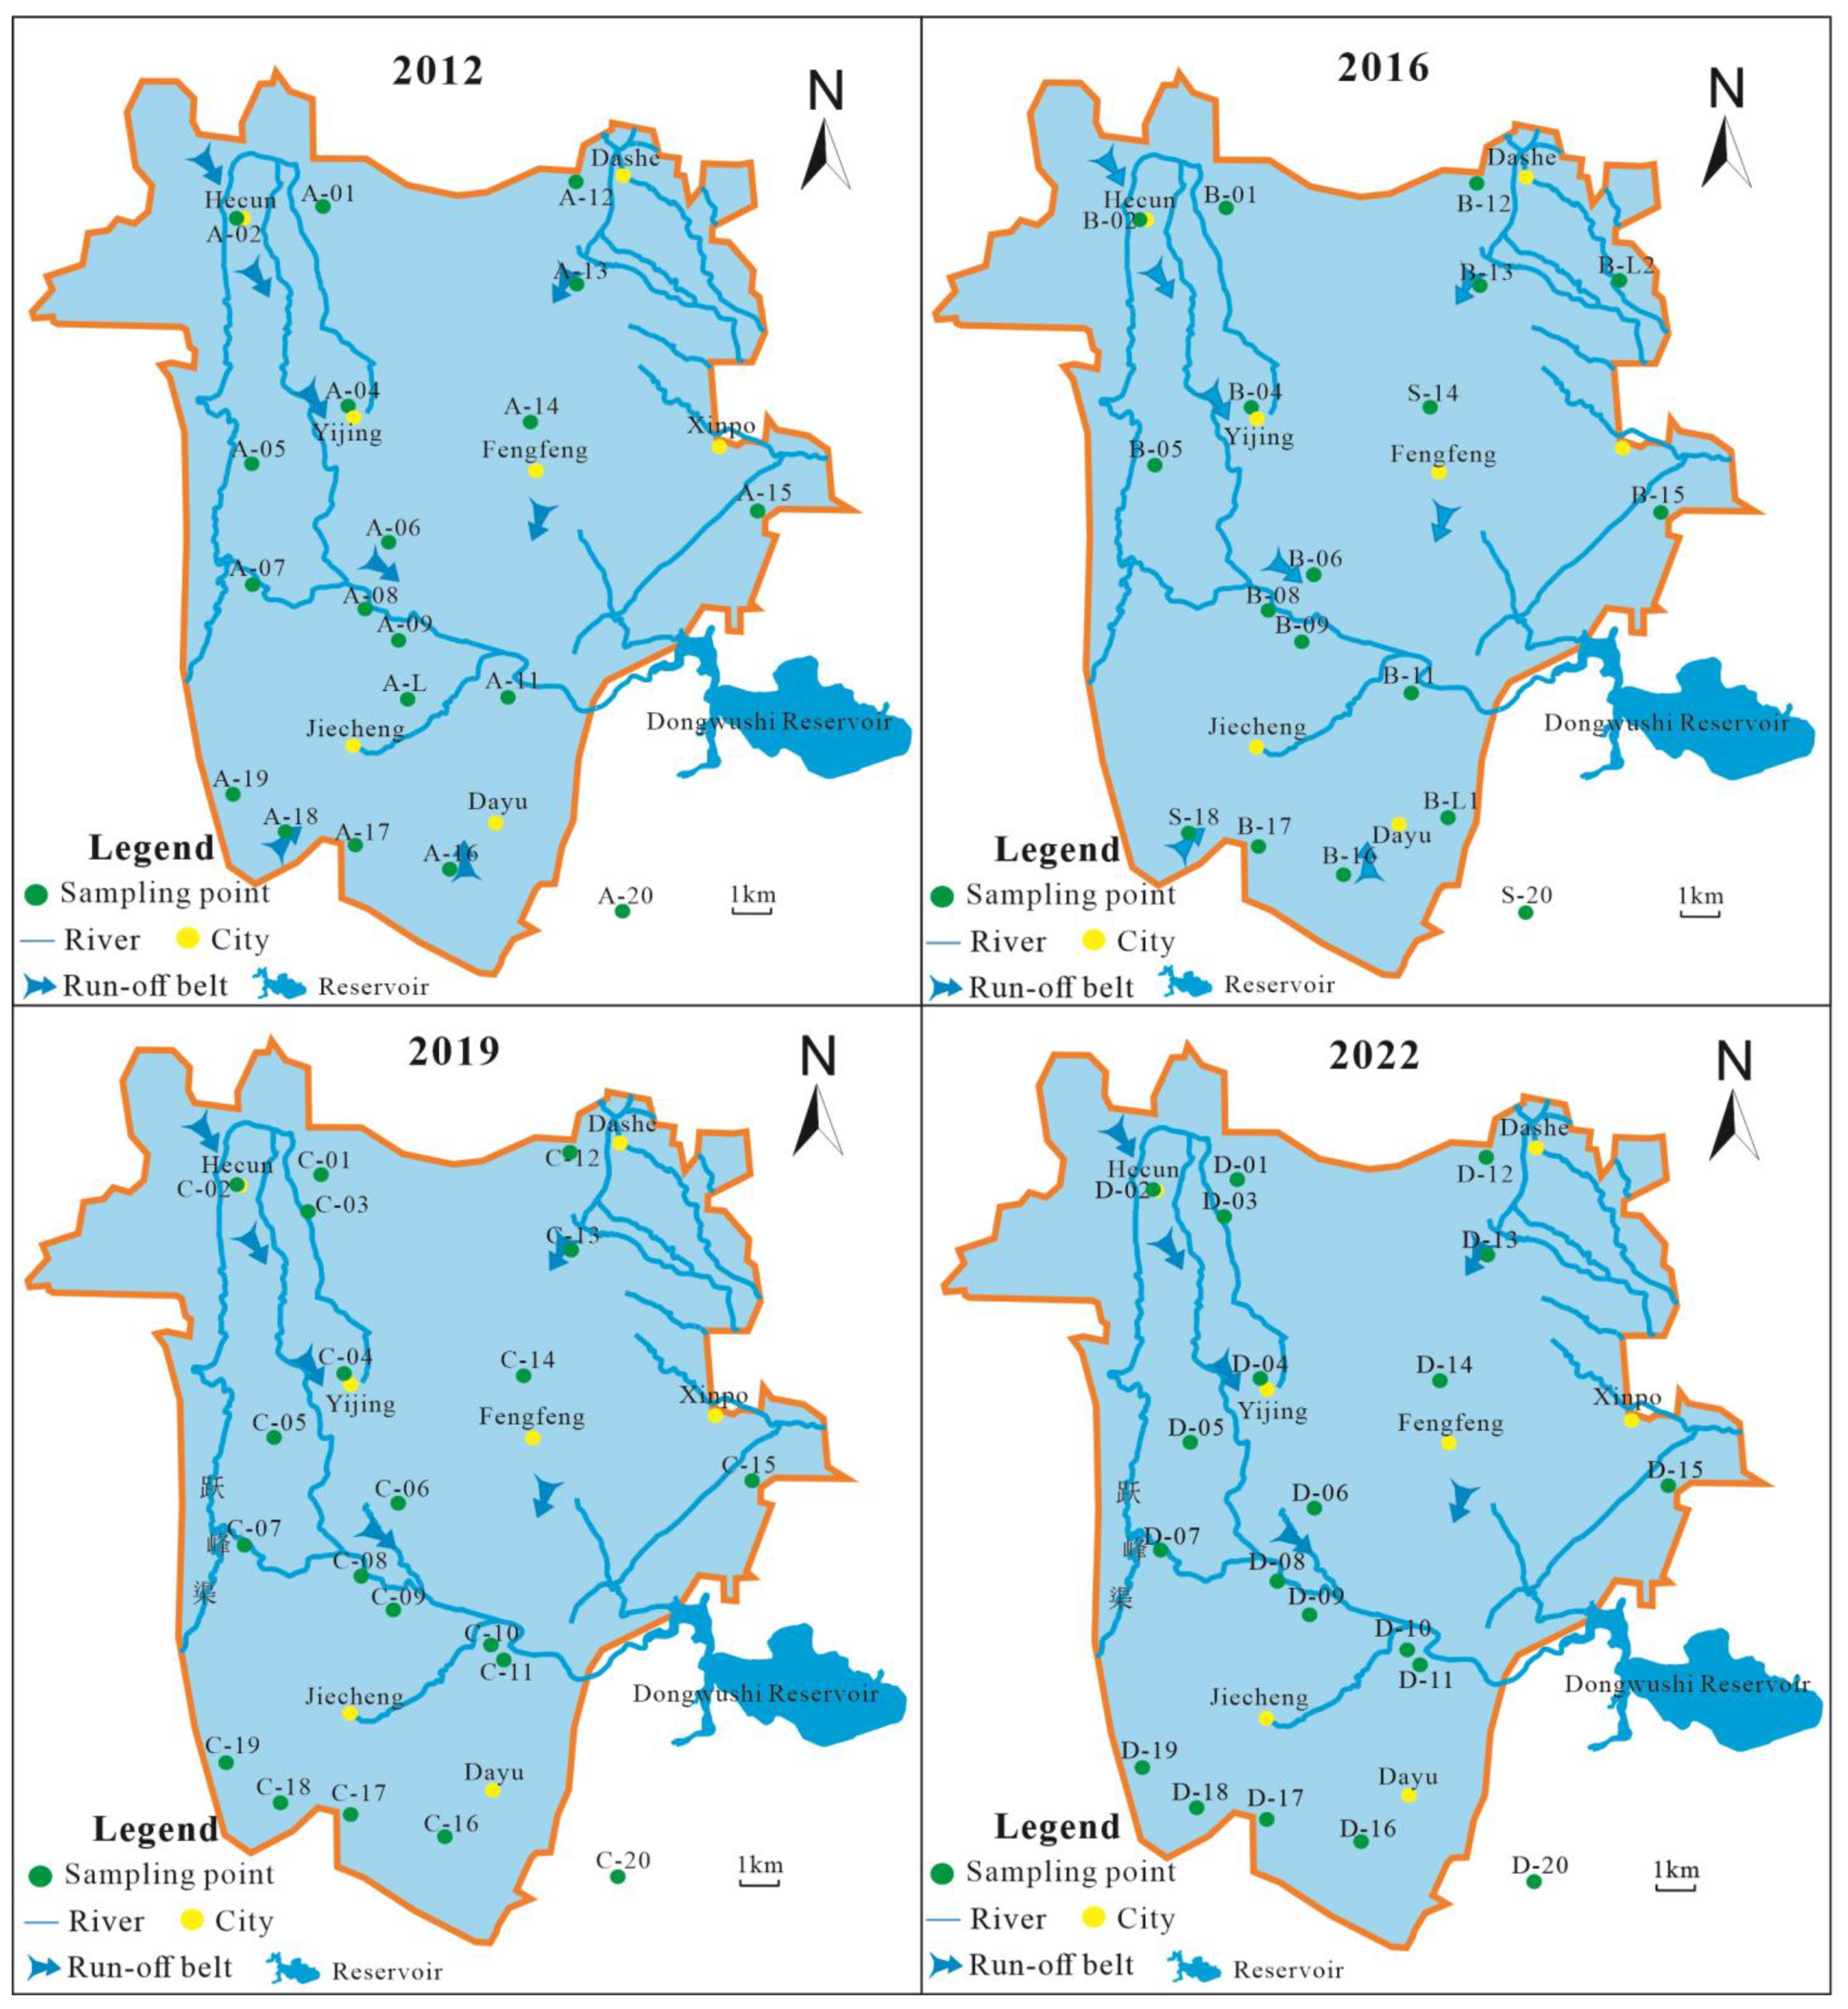
This study collected 18 karst hydrochemical data from the Fengfeng mining area in 2012 and 18 karst hydrochemical data from 2016; 20 samples of karst groundwater were collected in 2019 and 2022, and the distribution map of water sample points is shown in Figure 5.
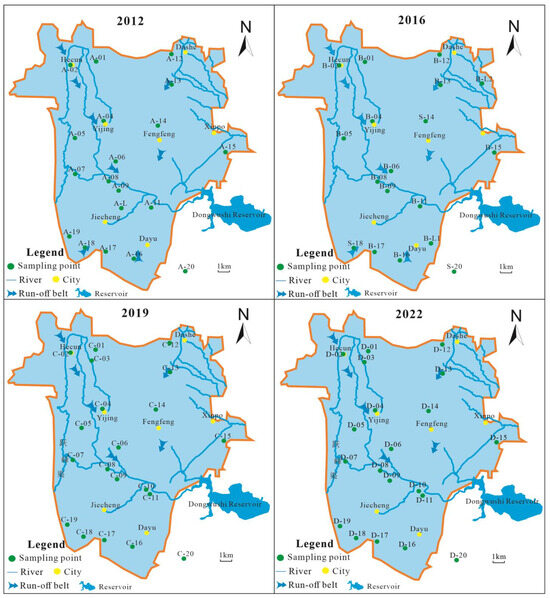
Figure 5.
The distribution map of karst groundwater sample points in the study area.
Each sample is measured for pH using a pH meter on site and filtered (0–45 μm). Afterward, it was placed in a polyethylene bottle and stored in a refrigerator with an average temperature of 4 °C. The hydrochemical testing is conducted by the qualified School of Earth Science and Engineering, Hebei University of Engineering (Hebei Provincial Key Laboratory of Resource Survey and Research). The hydrochemical analysis of the anionic part is determined using an ion chromatograph, and the bicarbonate and carbonate ions are determined using the dilute hydrochloric acid phenolphthalein methyl orange titration method. Major elements such as potassium, calcium, sodium, and magnesium are measured using an inductively coupled plasma emission spectrometer (ICP-OES). Total dissolved solids (TDS) were estimated by summing each major ion (including K+, Na+, Ca2+, Mg2+, Cl−, SO42− andHCO3−) and subtracting half of the bicarbonate concentration [42].
4. Discussion
4.1. Statistics of Hydrochemical Parameter Characteristics
The statistical table of hydrochemical parameter characteristics is shown in Table 1. PH value is an important factor reflecting the information on hydrogeochemical equilibrium. In the study area, the pH range in 2019 was 7.69–8.12, with an average value of 7.82 and a coefficient of variation of 1.4%. In 2022, the pH range was 7.75–8.09, with an average value of 7.84 and a coefficient of variation of 1.1%. The groundwater in the study area is mainly weakly alkaline, and the degree of acidity and alkalinity varies little in space.

Table 1.
Statistical Table of Hydrochemical Parameter Characteristics.
Total hardness (TH) reflects the concentrations of Ca2+ and Mg2+ in the water. In 2012, the TH values of karst water in the study area ranged from 260.3 to 851.0 mg/L, with an average of 399.4 mg/L. Among them, slightly hard water (150 mg/L ≤ TH < 300 mg/L) accounted for 31.6%, hard water (300 mg/L ≤ TH < 450 mg/L) accounted for 52.6%, and extremely hard water (TH ≥ 450 mg/L) accounted for 15.8%. In 2016, the TH value of karst water ranged from 205.1 to 940.5 mg/L, with an average of 388.6 mg/L, with soft water, slightly hard water, hard water, and extremely hard water accounting for 22.2%, 66.7%, and 11.1%, respectively. In 2019, the TH value of karst water ranged from 276.7 to 971.7 mg/L, with an average of 379.6 mg/L, with soft water, slightly hard water, hard water, and extremely hard water accounting for 10.0%, 80.0%, and 10.0%, respectively. The TH value of karst water in 2022 ranges from 286.9 to 1011.1 mg/L, with an average value of 377.5 mg/L, with soft water, slightly hard water, hard water, and extremely hard water accounting for 10.0%, 80.0%, and 10.0%, respectively.
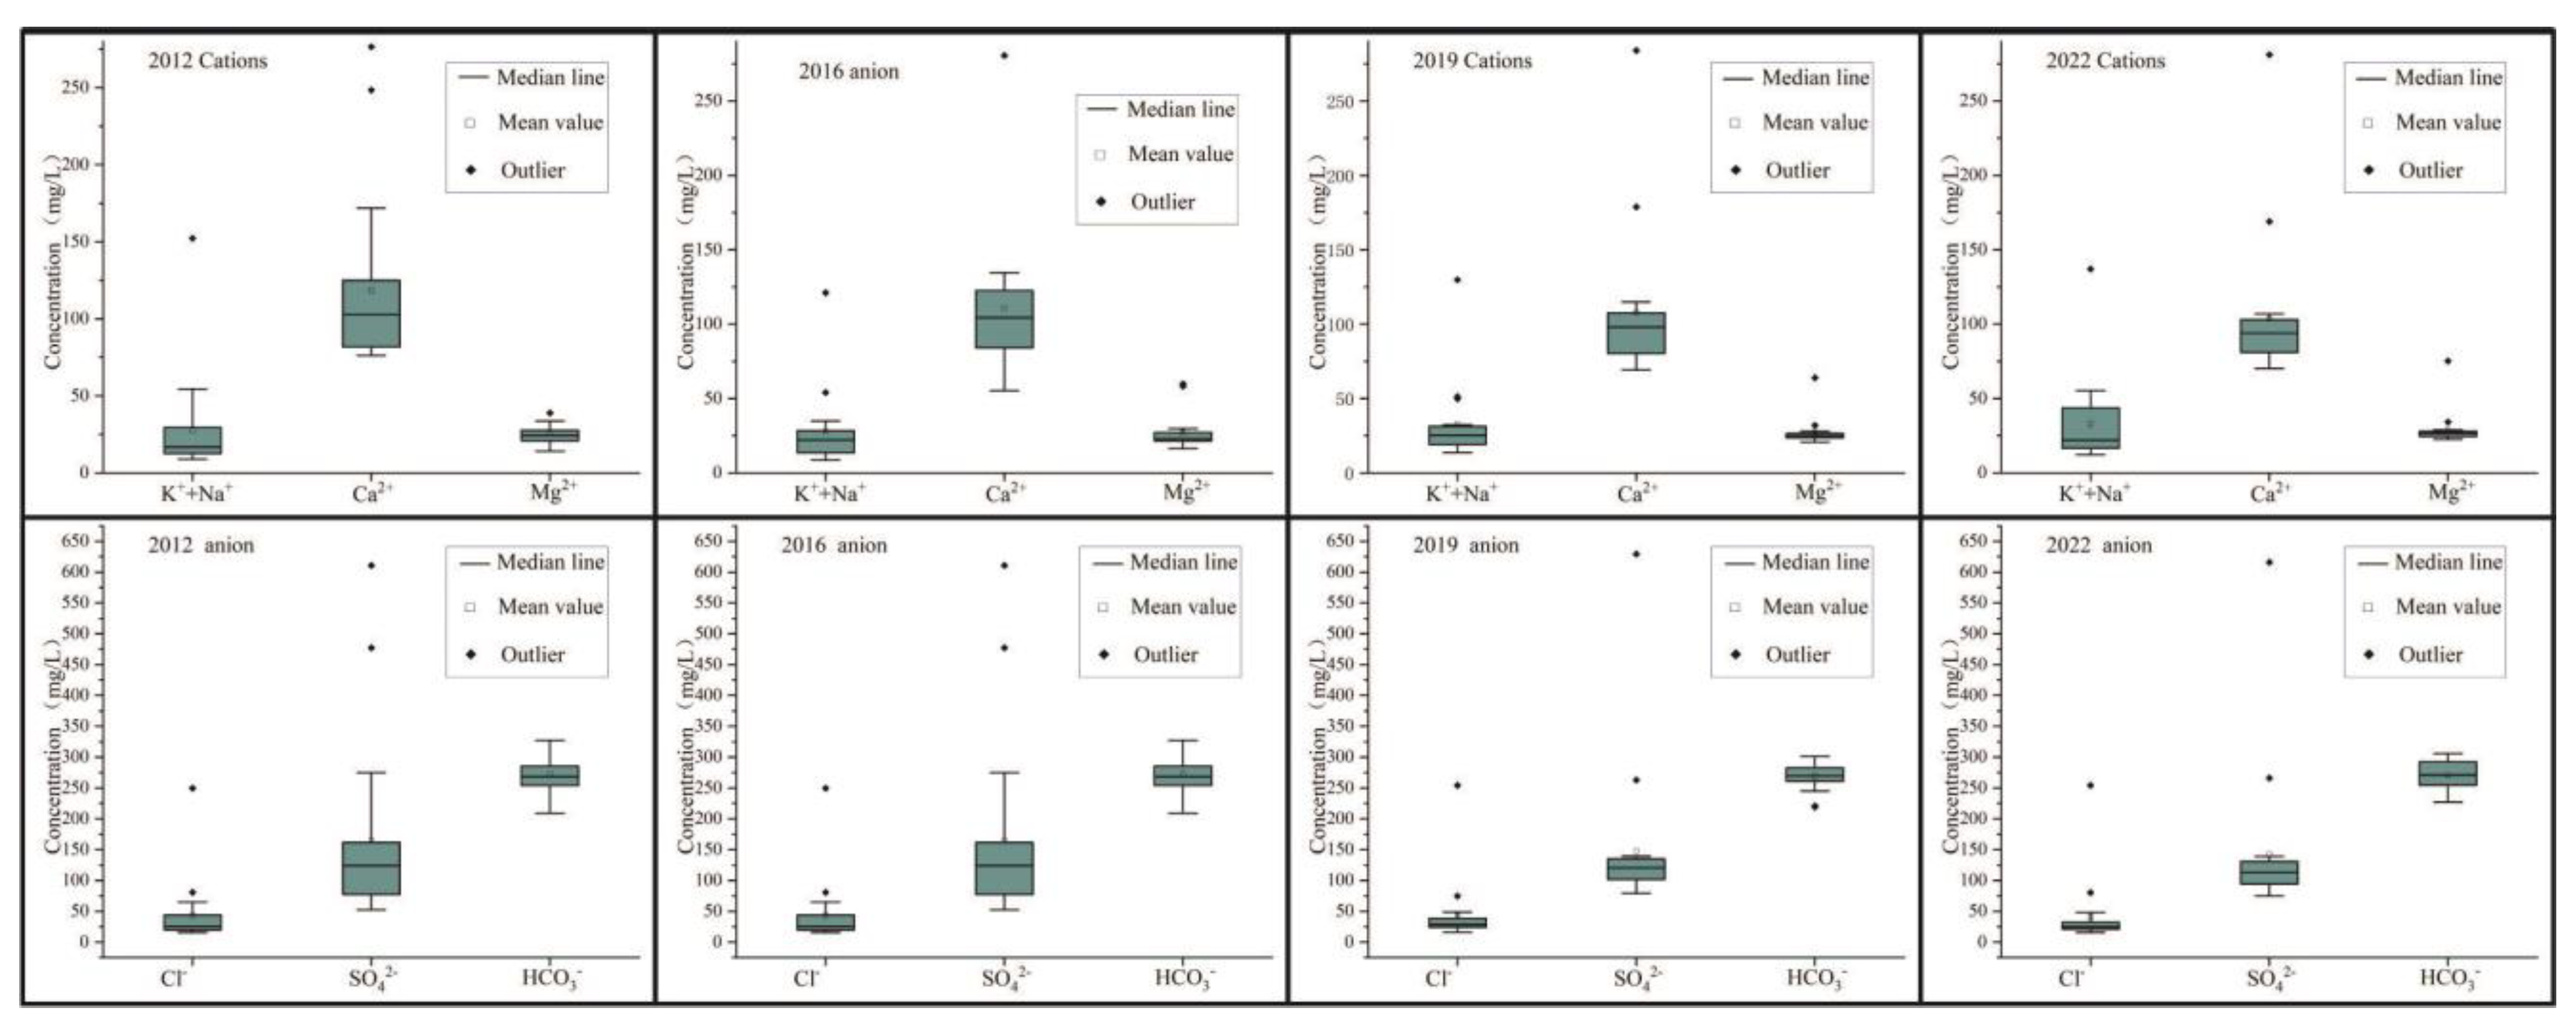
Total dissolved solids (TDS) are used to evaluate the total salt content in water. In 2012, the TDS range of karst water in the study area was 321.6–1482.3 mg/L, with freshwater (TDS < 1 g/L) accounting for 89.5% and brackish water (1 g/L ≤ TDS < 3 g/L) accounting for 10.5%. The TDS range of karst water in the study area in 2016 was 250.3~1461.6 mg/L, with freshwater accounting for 94.4% and brackish water accounting for 5.6%. The TDS range of karst water in the research area in 2022 is 325.2~1511.1 mg/L, with freshwater accounting for 95.0% and brackish water accounting for 5.0%. According to the average concentration of each ion, combined with Figure 6, it can be seen that in different years, Ca2+ > K + +Na+ > Mg2+, HCO3− > SO42− > Cl−. Therefore, the cations in the karst groundwater in the study area are mainly Ca2+, while the anions are mainly HCO3− and SO42− (Table 1).
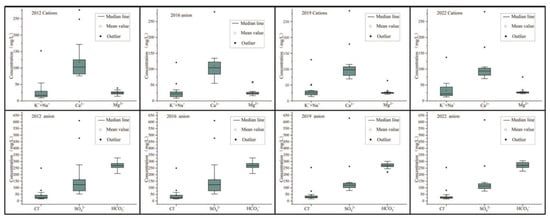
Figure 6.
Box plots of major ions in the study area by year.
4.2. Hydrogeochemical Characteristics
4.2.1. Types of Hydrochemistry
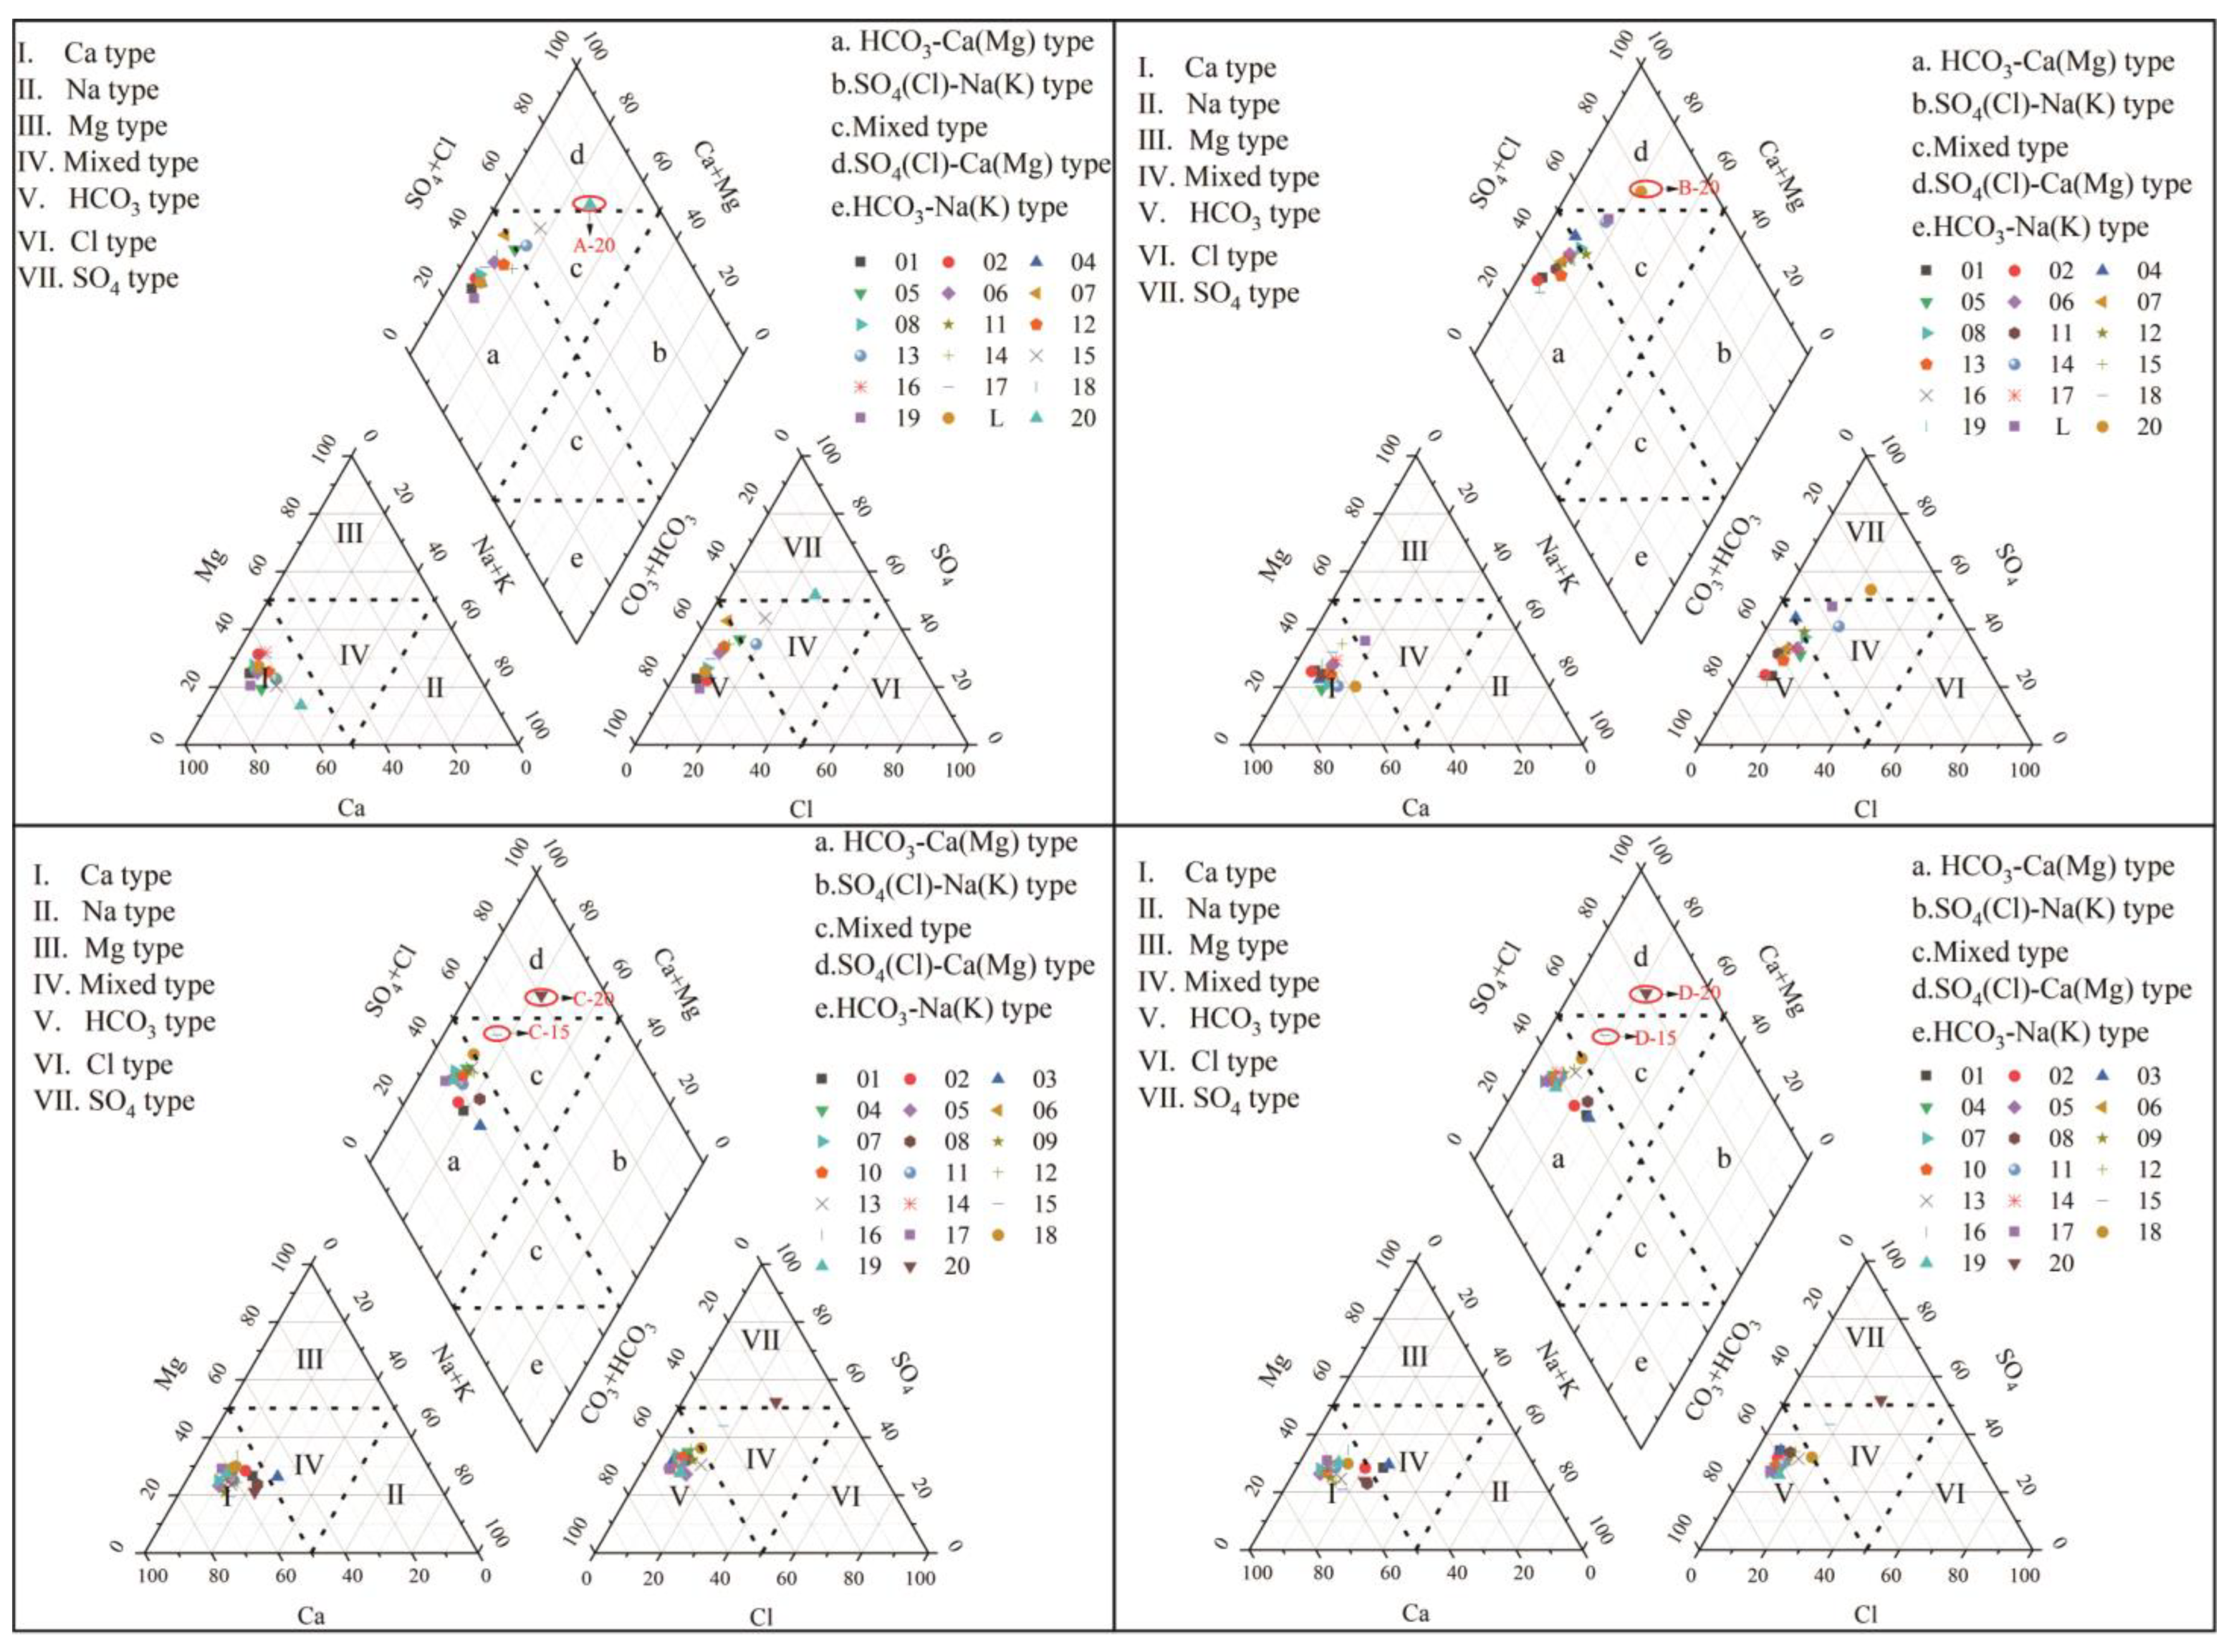
In 1944, Piper proposed the Piper trilinear diagram method, which is a graph drawn using the percentage of ions expressed in milligram-equivalent percentage per liter of water. It is used to intuitively determine the type of hydrochemistry, reflect the relative concentration and distribution characteristics of hydrochemical ions and analyze the evolution of hydrochemical components [29].
From Figure 7, it can be seen that the majority of cations in different years fall in region Ⅰ, indicating that Ca2+ is the absolute dominant species among cations. The majority of anions fall in region Ⅴ, indicating that HCO3− dominates among anions. The hydrochemical types of karst groundwater in the study area in different years are mainly HCO3-Ca(Mg) type.
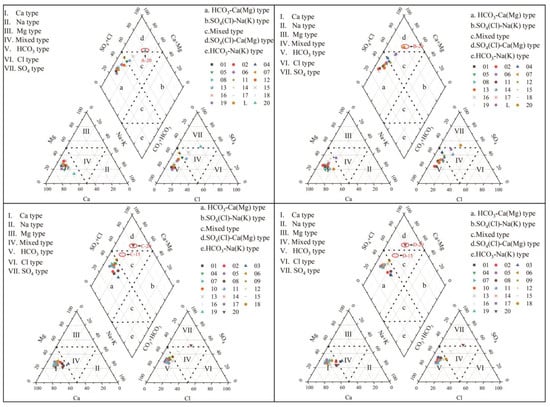
Figure 7.
Piper trilinear diagram of karst groundwater in the study area.
From a spatial analysis, the hydrochemical type of the eastern region (point 20) is different from other regions. Cations are still mainly Ca2+ and Mg2+, while anions are mainly SO42− and Cl−. The hydrochemical type has evolved into SO4(Cl)-Ca(Mg) type. From a time perspective, due to changes in hydrological processes, the hydrochemical types change every year, but this change is minimal.
4.2.2. Hydrogen and Oxygen Isotope Characteristics
- (1)
- Groundwater supply source
The distribution and enrichment degree of stable isotopes of hydrogen and oxygen are commonly expressed by δ value; when the δ value is less than 0, it indicates that stable isotopes in groundwater are enriched. When the δ value is greater than 0, it indicates that stable isotopes in groundwater are depleted. The δ values of D and 18O are calculated as follows:
In 1981, the International Atomic Energy Commission slightly revised the formula and obtained the Global Precipitation Line (GMWL) formula as follows:
In 1983, Zheng Shuhui [43] obtained the formula for precipitation line (CMWL) in the Chinese Mainland:
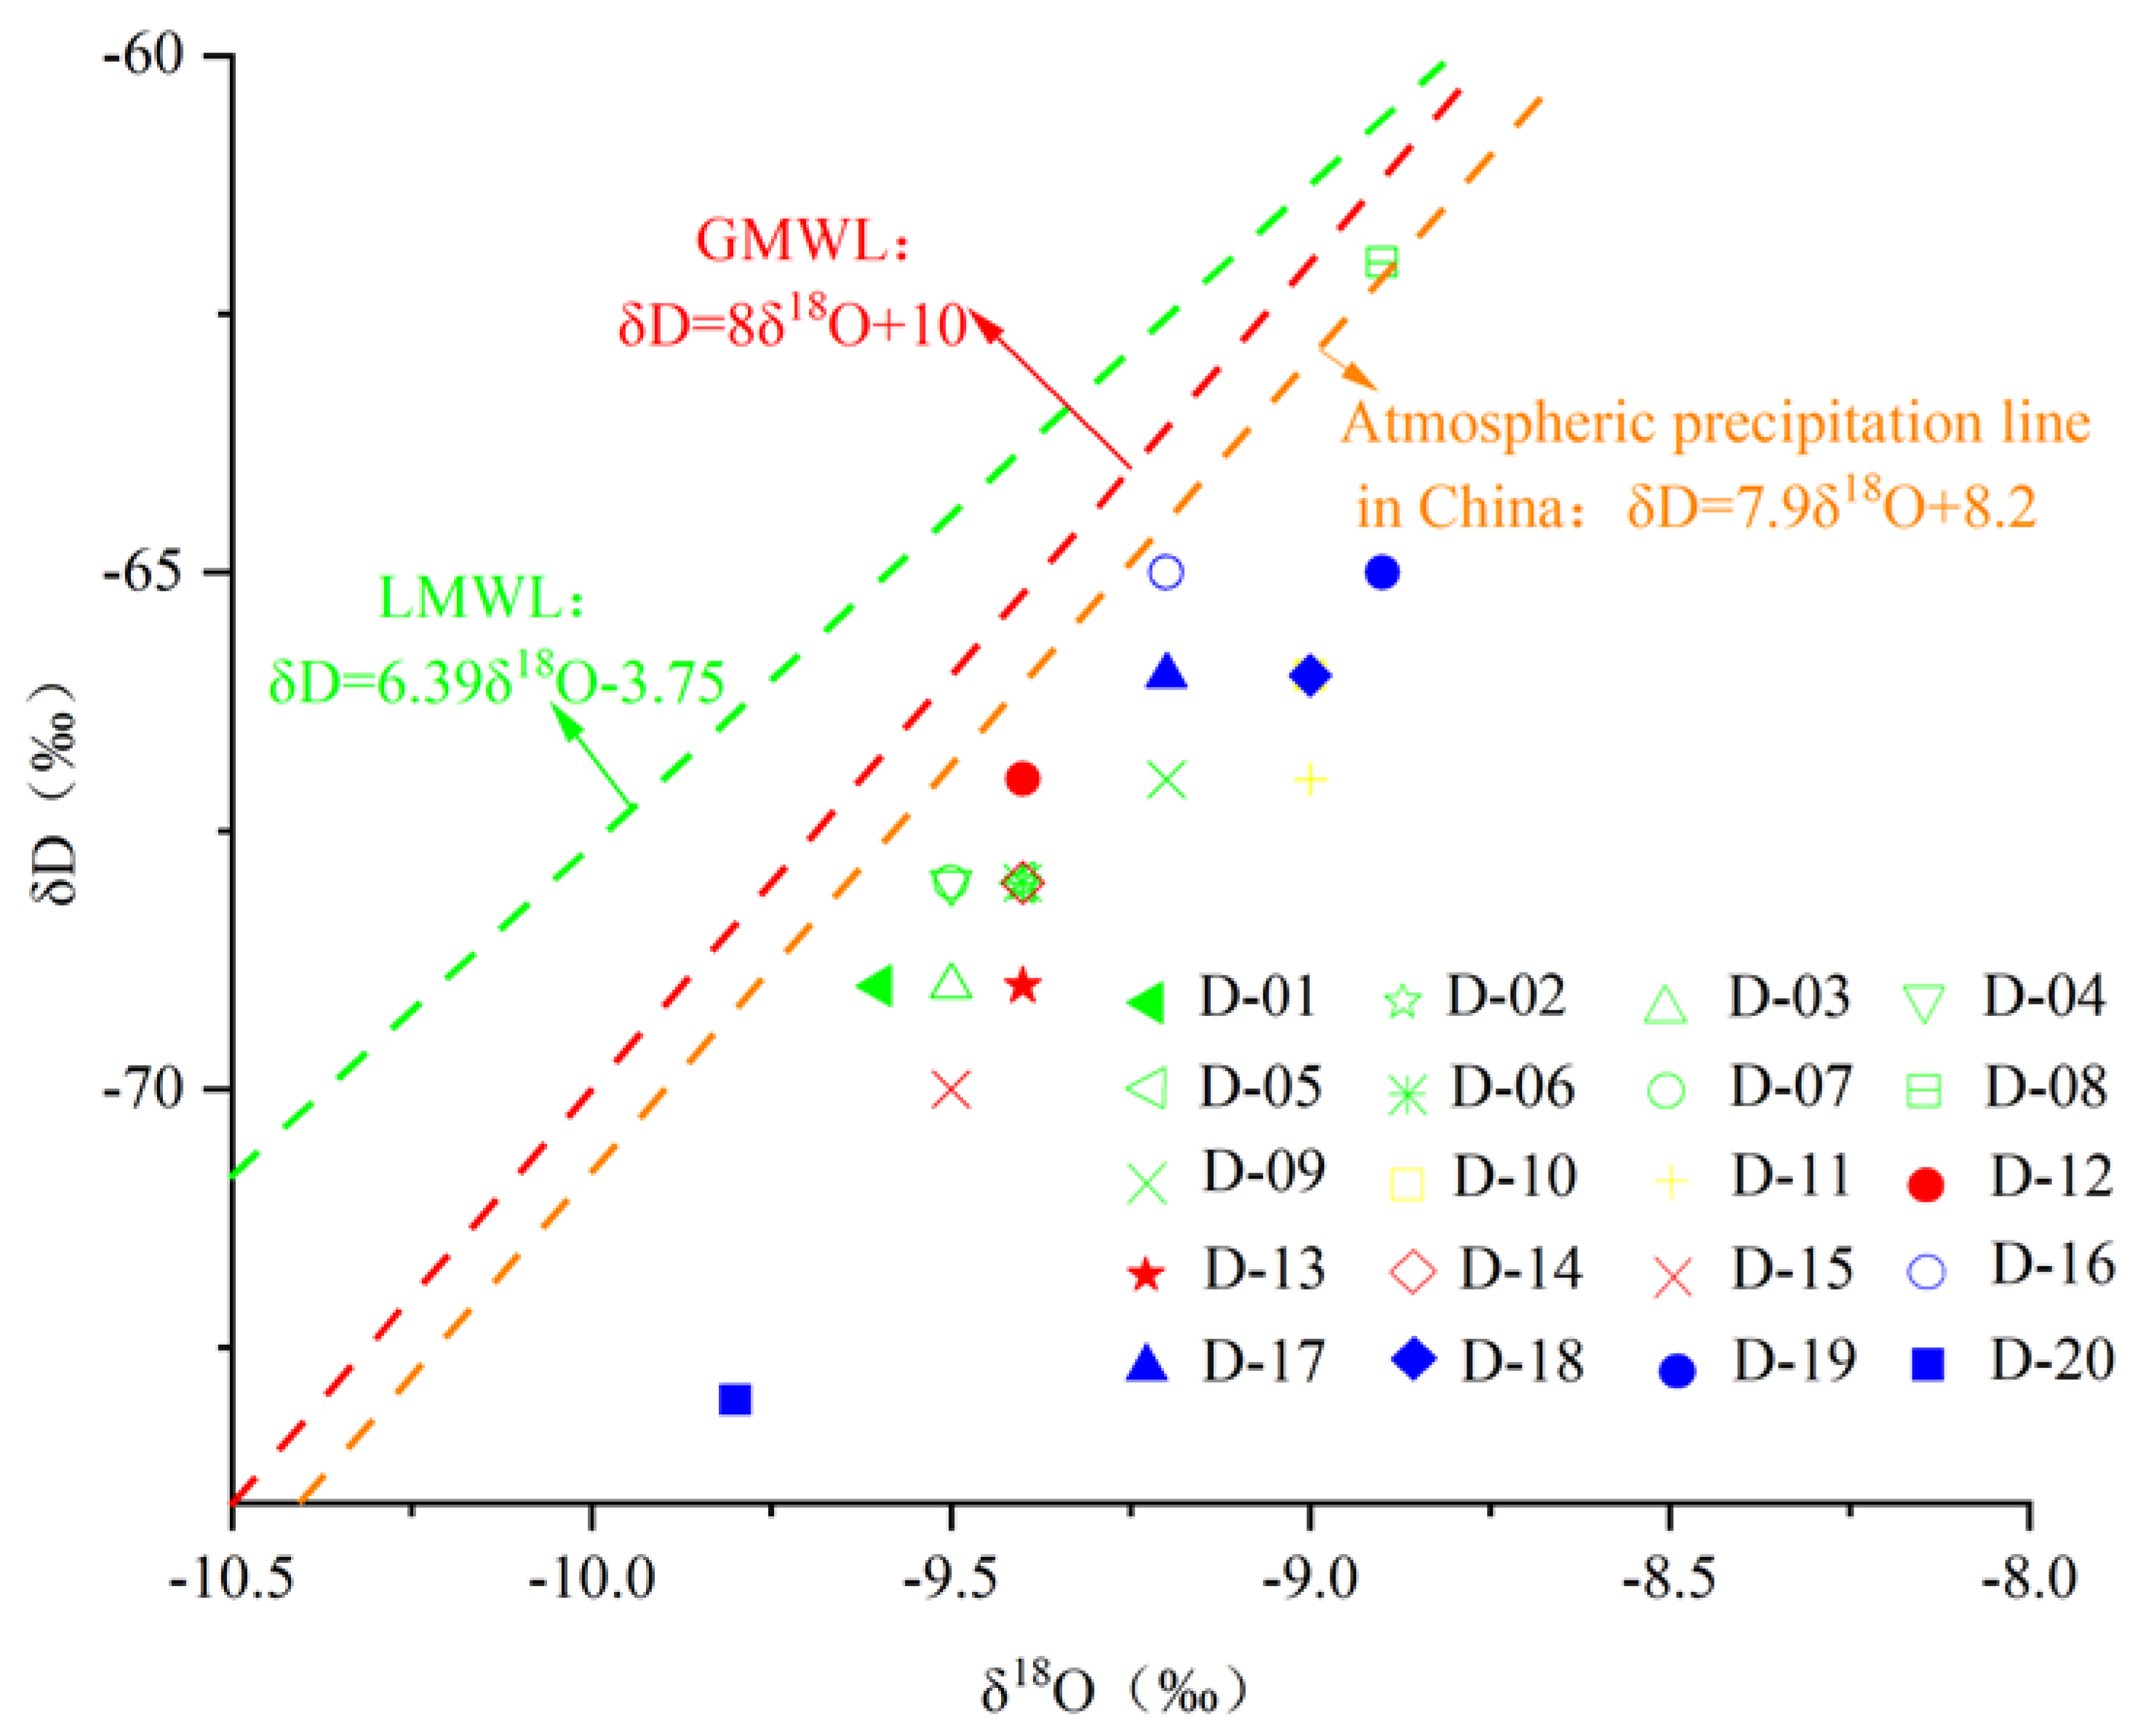
Due to the lack of isotope monitoring stations for observing atmospheric precipitation in the study area, the precipitation line equation of Shijiazhuang, which is approximately 200 km away from the Fengfeng mining area, was used as the approximate regional atmospheric precipitation line equation for the study area. The equation is:
The δD-δ18O relationship is plotted in Figure 8. The karst water sample points are all located at the lower right of the atmospheric precipitation line, indicating that although the main source is atmospheric precipitation, they are influenced by strong evaporation during precipitation and infiltration, which leads to isotopic enrichment. The strata in the study area contain dolomite and carbonate minerals, resulting in δ18O being relatively high; δD, on the other hand, is lower in all rocks and enriched in water, with very few hydrogen-bearing diagenetic minerals. Under such conditions, when isotope exchange evolves towards equilibrium, it can lead to water δ18O increases and δD changes very little. The δD-δ18O relationship diagram in the study area is consistent with this phenomenon. That is, oxygen drift occurred in karst water in the study area.
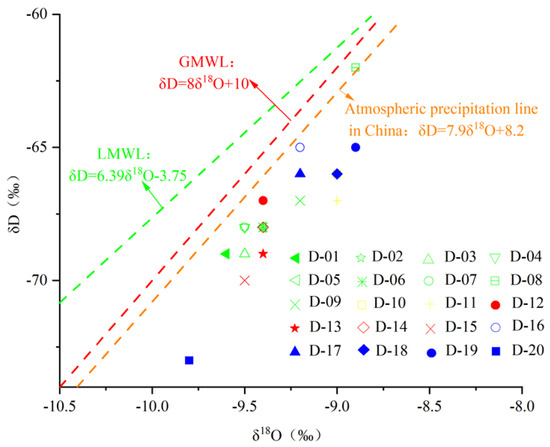
Figure 8.
The δD-δ18O diagram of karst groundwater in the study area.
- (2)
- Groundwater recharge elevation
As the elevation continues to increase, the heavy isotopes in atmospheric precipitation will gradually decrease, which is commonly known as the elevation effect. There is a difference in the groundwater supplied by atmospheric precipitation between high-altitude areas and low-altitude areas, so the elevation effect of δD and δ18O values in atmospheric precipitation can be used to estimate the elevation of the recharge area. The elevation effect of the δD value of atmospheric precipitation in China can be expressed as:
ALT: the elevation of the karst groundwater recharge area.
According to Formula 6, the elevation of the karst groundwater recharge area is calculated, as shown in Table 2. From Table 2, it can be seen that the karst groundwater recharge elevation in the study area ranges from 1166.7 to 1533.3 m, with an average recharge elevation of 1348.3 m. The range of recharge elevation changes is relatively large, indicating that the groundwater recharge conditions in the study area are relatively complex. While receiving recharge from the nearby Gu Mountain limestone exposed area, it may also have been replenished by limestone outcrops in the distant western mountains.
Table 2.
Elevation of karst groundwater recharge area in the study area.
4.3. Analysis of Influencing Factors of Hydrochemical Components
4.3.1. Mechanism of Formation of Water Chemical Components
- (1)
- Gibbs diagram
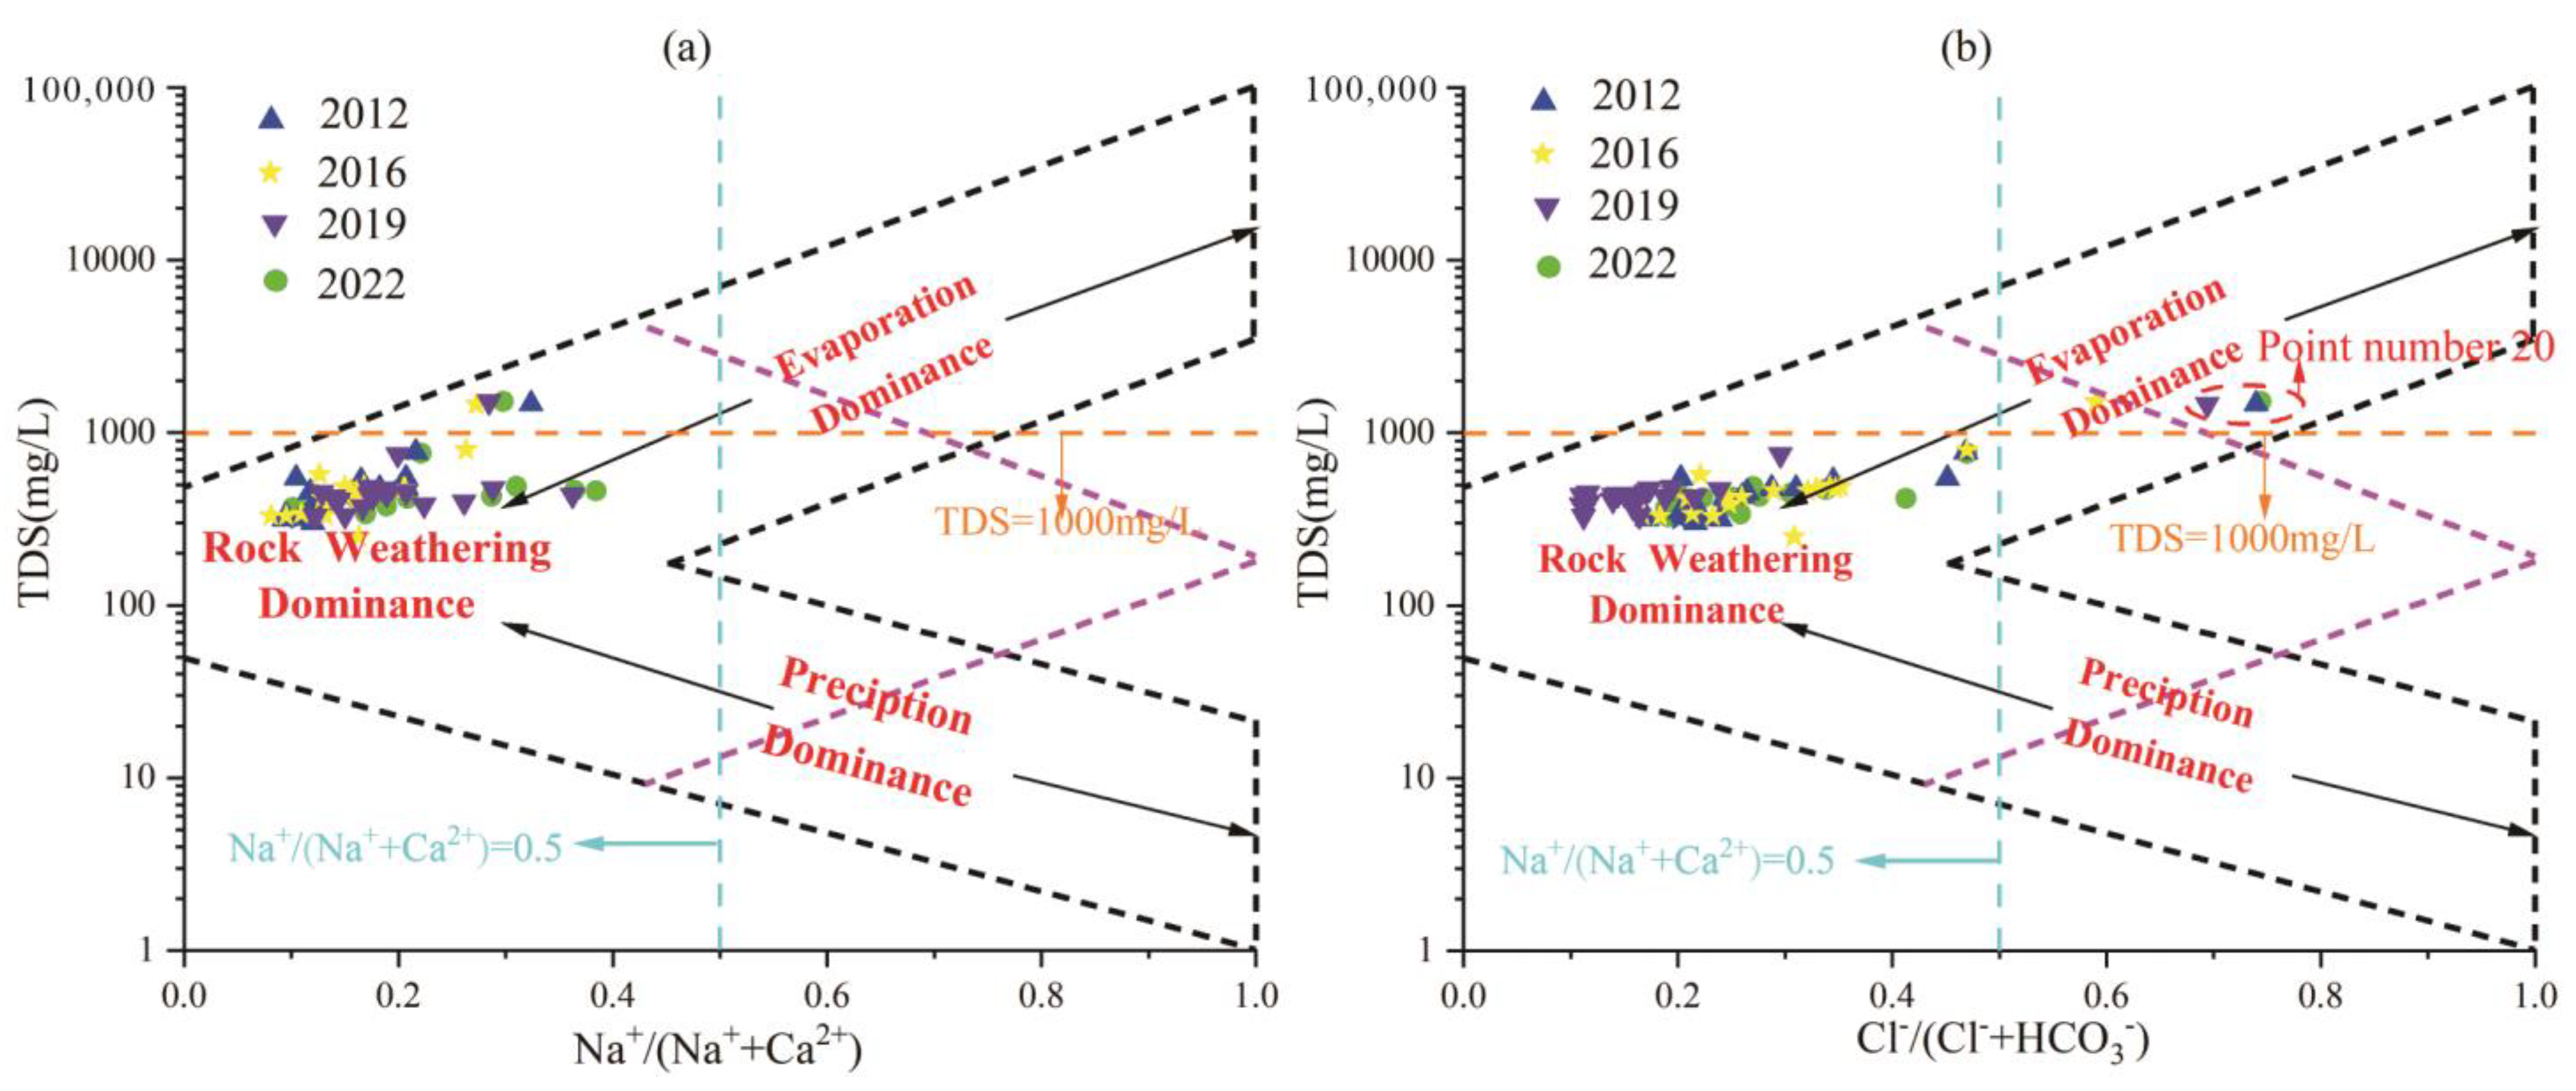
In order to explain the natural influencing factors that control the hydrochemical components in the water body, in 1970, Gibbs proposed that the scatter distribution of Na+/(Na+ + Ca2+), Cl−/(Cl− + HCO3−) ratios and TDS could be used to determine. The Gibbs diagram can intuitively compare the chemical composition, genesis and interrelationship between different water samples. The vertical coordinate of the diagram is logarithmic, representing the total dissolved solids in the water. The horizontal coordinate is the common coordinate, representing the cation ratio Na+/(Na+ + Ca2+) or the anion ratio Cl−/(Cl− + HCO3−) in water. The Gibbs diagram clearly reflects that the main composition of water tends to be “precipitation control type”, “rock weathering type”, or “evaporation-concentration type” [44].
The hydrochemical data of different water sample points in the region each year were projected into the Gibbs diagram. It can be seen from Figure 9 that none of the water sample points fell in the control area of atmospheric precipitation in three different years. By analyzing the reasons, it is concluded that although atmospheric precipitation is one of the main recharge sources of groundwater in the study area, rock weathering, evaporation and concentration, and alternating cation adsorption occurred in the process of runoff and infiltration. Therefore, the influence of atmospheric precipitation on the change of groundwater hydrochemical components has been very weak.

Figure 9.
Gibbs diagram of karst groundwater in the Fengfeng mining area each year. (a) TDS vs. Na+/(Na+ + Ca2+) relationship, (b) TDS vs. Cl−/(Cl− + HCO3−) relationship.
Figure 9a shows that the TDS values of most water sample points are between 100–1000 mg/L, and the Na+/(Na+ + Ca2+) ratio is less than 0.5, indicating that the cation components in karst groundwater in the study area are mainly affected by rock weathering. As shown in Figure 9b, in point 20, located in the eastern plain, Cl−/(Cl− + HCO3−) values in different years are all greater than 0.5, and TDS is greater than 1000 mg/L, located in the evaporation and crystallization control area, while other water sample sites are located in the rock weathering control area, indicating that anions in the study area are mainly controlled by rock weathering. In the eastern region, where the runoff condition is poor, it is affected by evaporative crystallization.
- (2)
- Three-terminal element diagram
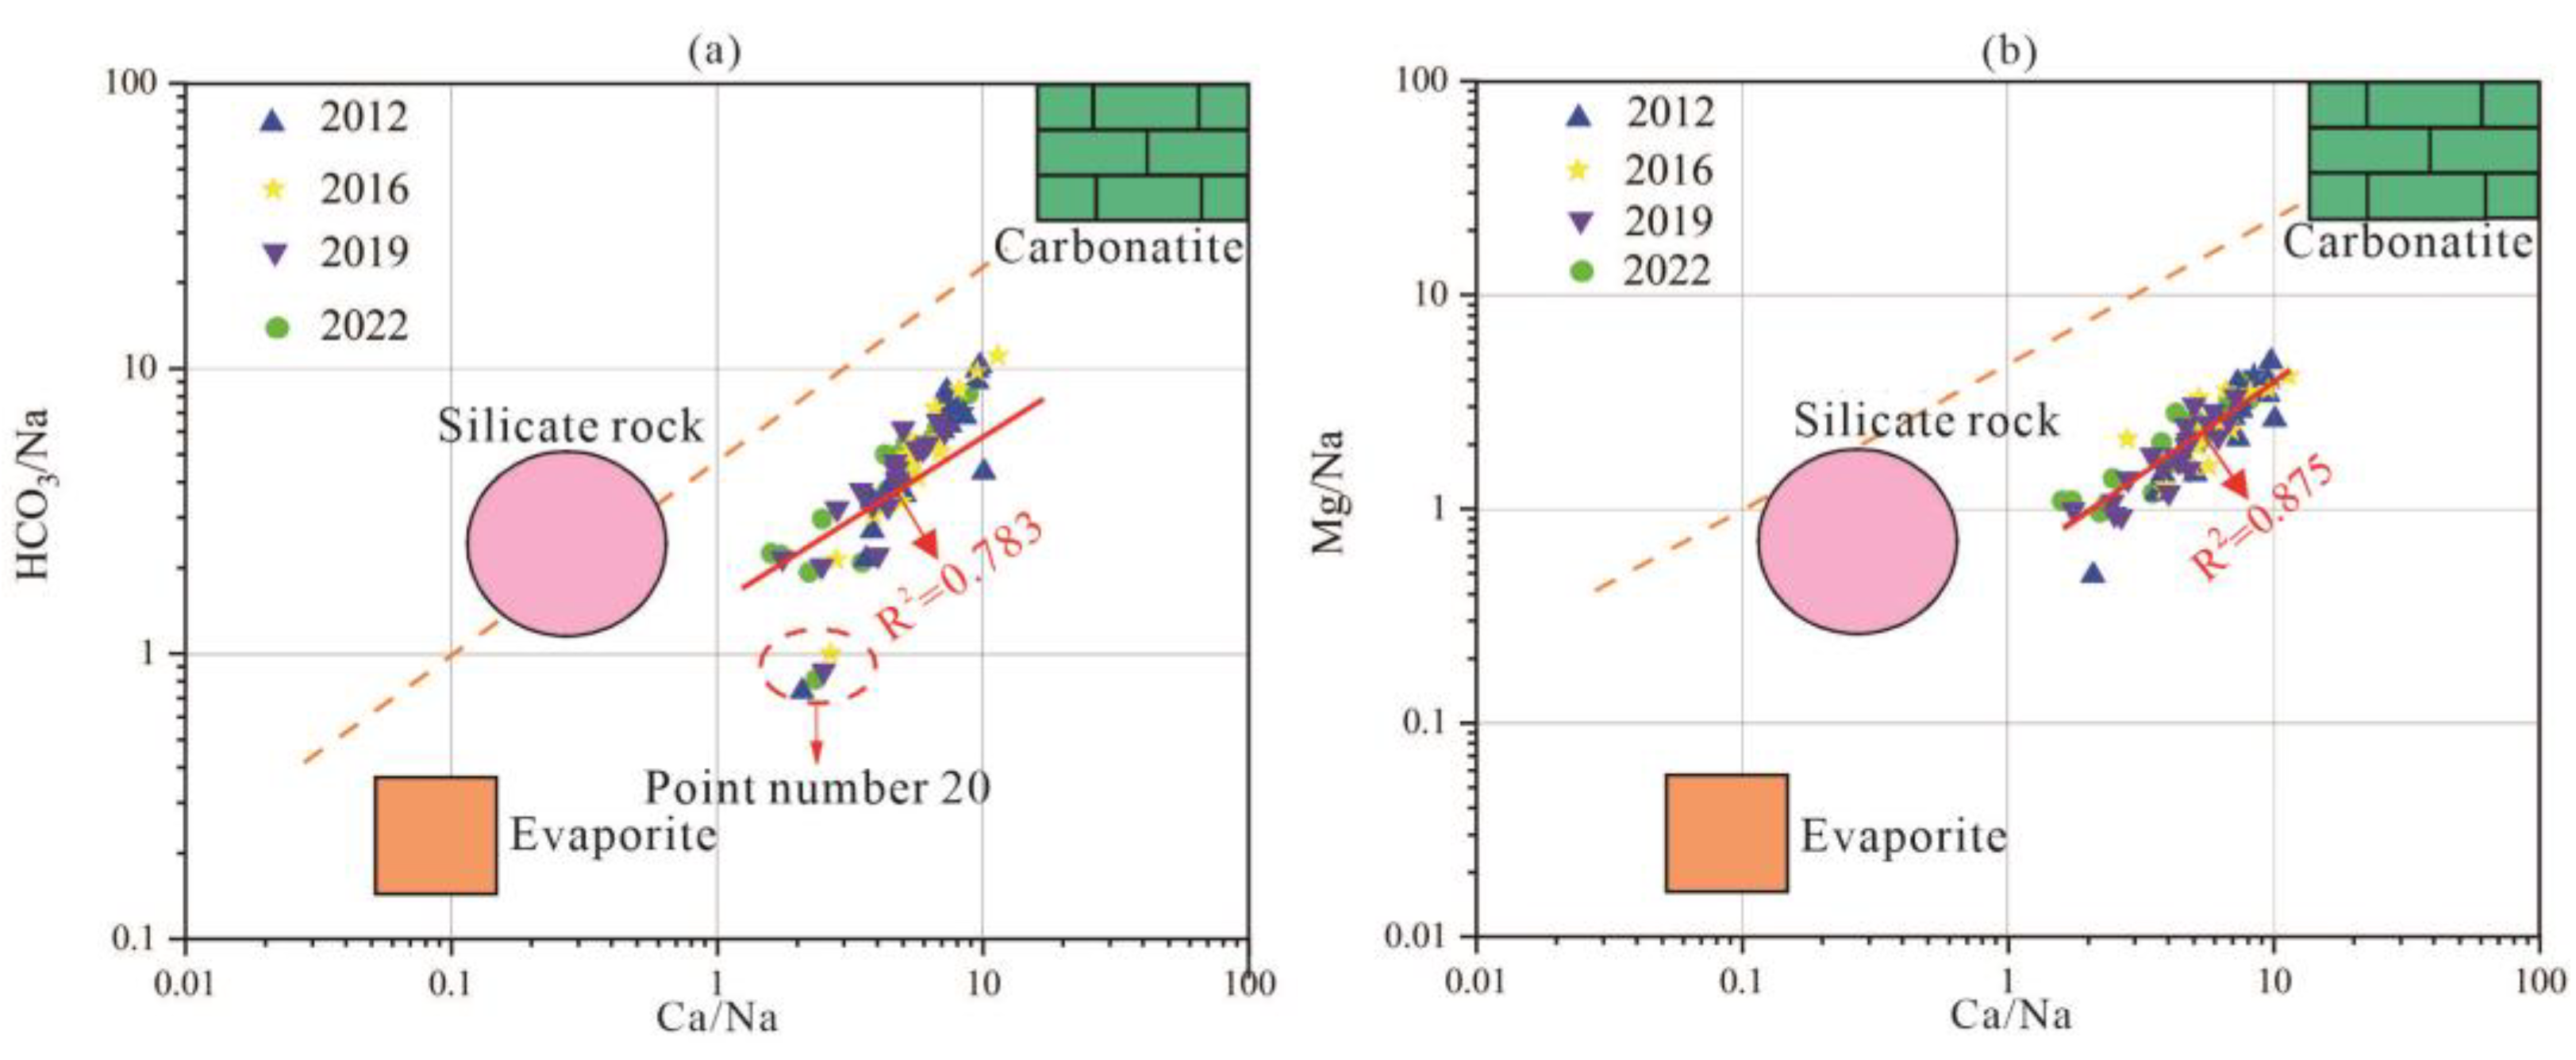
The three-terminal element diagram of groundwater sources can be used to analyze the main sources of groundwater components, including carbonate rocks, silicates, and evaporites. The three-terminal element diagram of karst groundwater in the research area is shown in Figure 10.
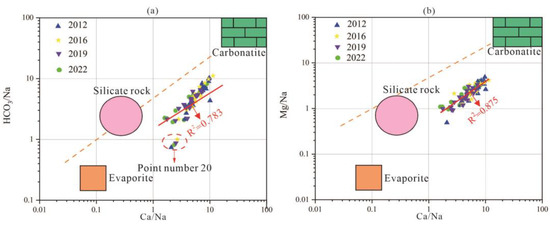
Figure 10.
End-member diagram of groundwater samples in the study area. (a) (HCO3/Na) vs. (Ca/Na) relationship, (b) (Mg/Na) vs. (Ca/Na) relationship.
Most of the karst groundwater samples in the study area are located between the end elements of carbonate and silicate rocks, between the end elements of carbonate and silicate rocks, indicating that the karst erosion of carbonate and silicate rocks plays a dominant role in the process of groundwater chemical composition changes. In the area of Point 20 in the eastern plain area, there are signs of water sample points approaching the end elements of evaporite, indicating that the hydrochemical composition of these water sample points is not only affected by silicate weathering and dissolution but also by evaporite karst erosion. The poor runoff conditions here correspond to the result of this analysis.
4.3.2. Source Analysis of Hydrochemical Components
- (1)
- Weathering and dissolution of carbonate rock
The Ca2+, Mg2+ and HCO3− in karst groundwater mainly come from the karst erosion and precipitation of carbonate rocks, such as the karst erosion and precipitation of calcite and dolomite. Different regions and different stages have different geochemical roles.
The equation of the total dissolution of calcite is:
The equation for the non-uniform dissolution of dolomite is:
If calcite and dolomite dissolve simultaneously, the Equation is (7) + (8):
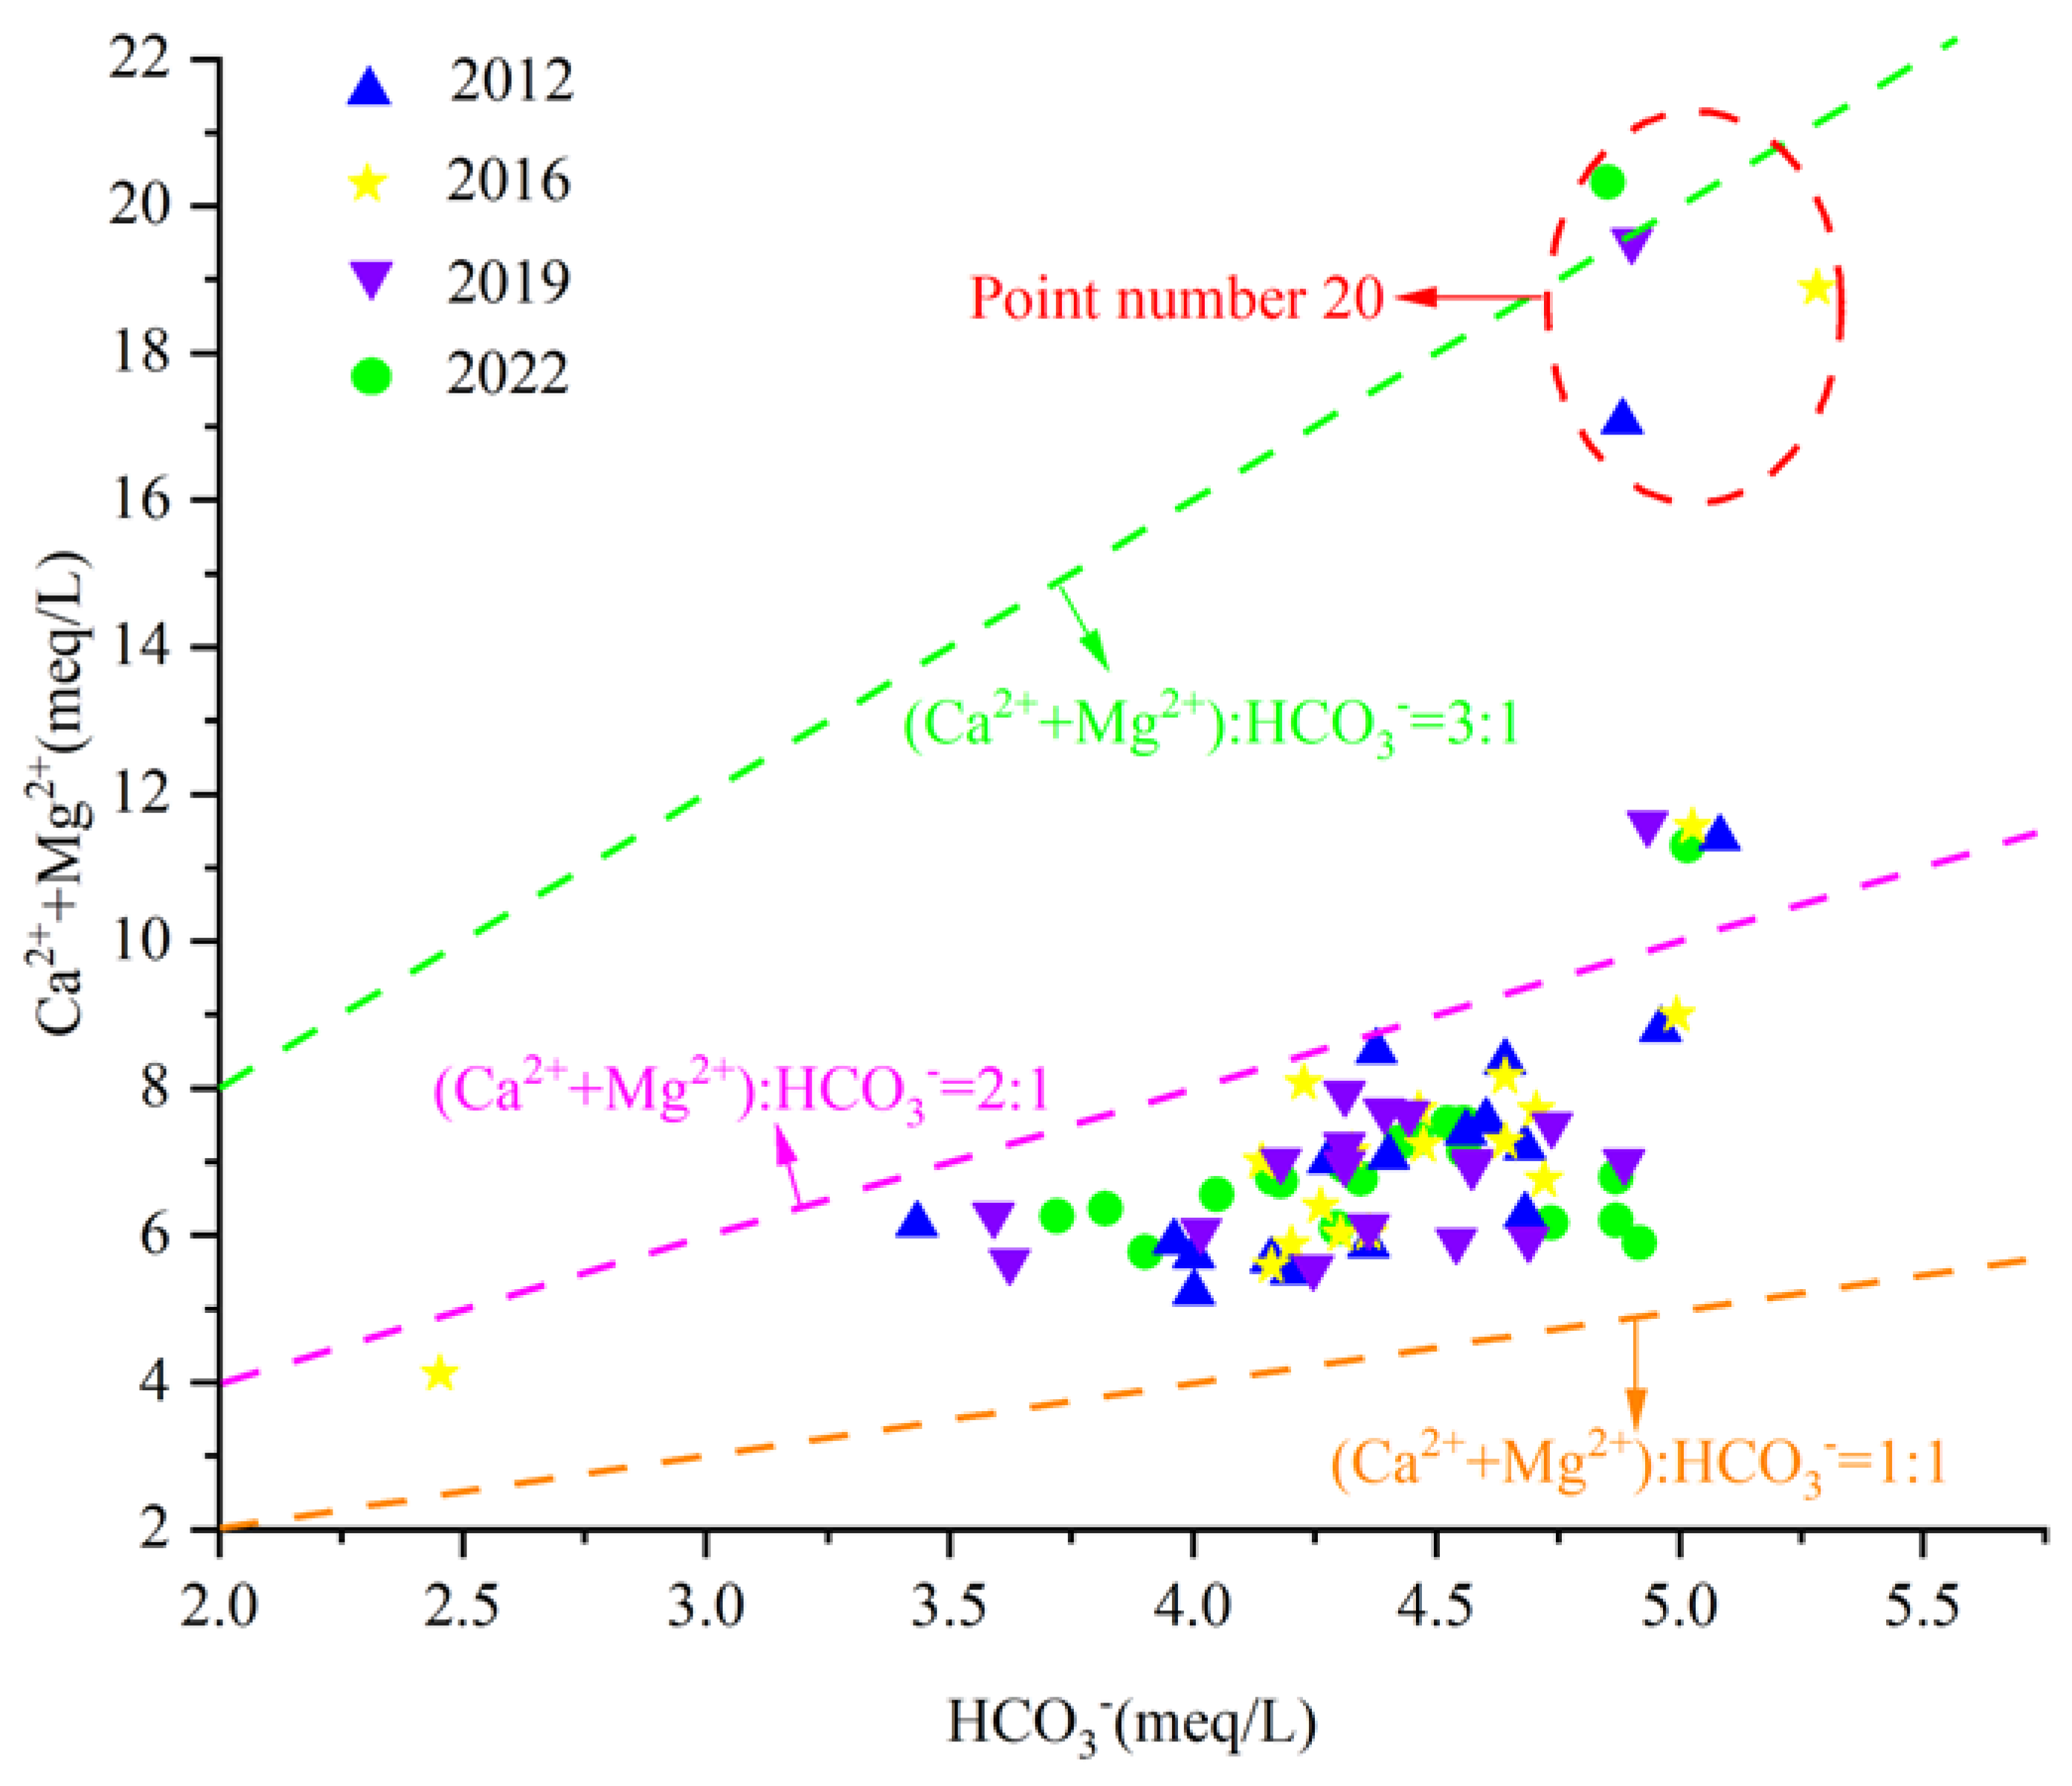
In addition to carbonate karst erosion, the dissolution of silicic rock minerals also increases the plasma concentrations of Ca2+, Mg2+, and HCO3− in water. Therefore, the(Ca2+ + Mg2+)/HCO3− milligram equivalent scatter plot can preliminarily determine the source of Ca2+ and Mg2+ in groundwater. If Ca2+ and Mg2+ in groundwater only come from carbonate dissolution or weathering of silicic rock minerals, the ratio of γ(Ca2+ + Mg2+)/HCO3− is close to 1/2. That is, the groundwater sample point falls near line 1:2, which indicates that Ca2+, Mg2+ and HCO3− in groundwater mainly come from the weathering and dissolution of carbonate rock and the mineral dissolution of silicic rock. If it falls above the line 1:2, it indicates that Ca2+ and Mg2+ in groundwater have other sources besides mineral dissolution. If it falls below line 1:2, it indicates another source of HCO3− ions in groundwater.
By analyzing the γ(Ca2+ + Mg2+)/γHCO3− scatter diagram of karst groundwater in the Fengfeng mining area (Figure 11), it can be seen that most water samples fall between the line 1:1 and 2:1, with some water sample points falling above line 2:1. All water sample points fall above the line 1:2, indicating that Ca2+ and Mg2+ in groundwater in the study area are not only subjected to weathering and dissolution of carbonate rocks or silicic rocks but also have other sources.

Figure 11.
Scatterplot of γ(Ca2+ + Mg2+)/γHCO3−.
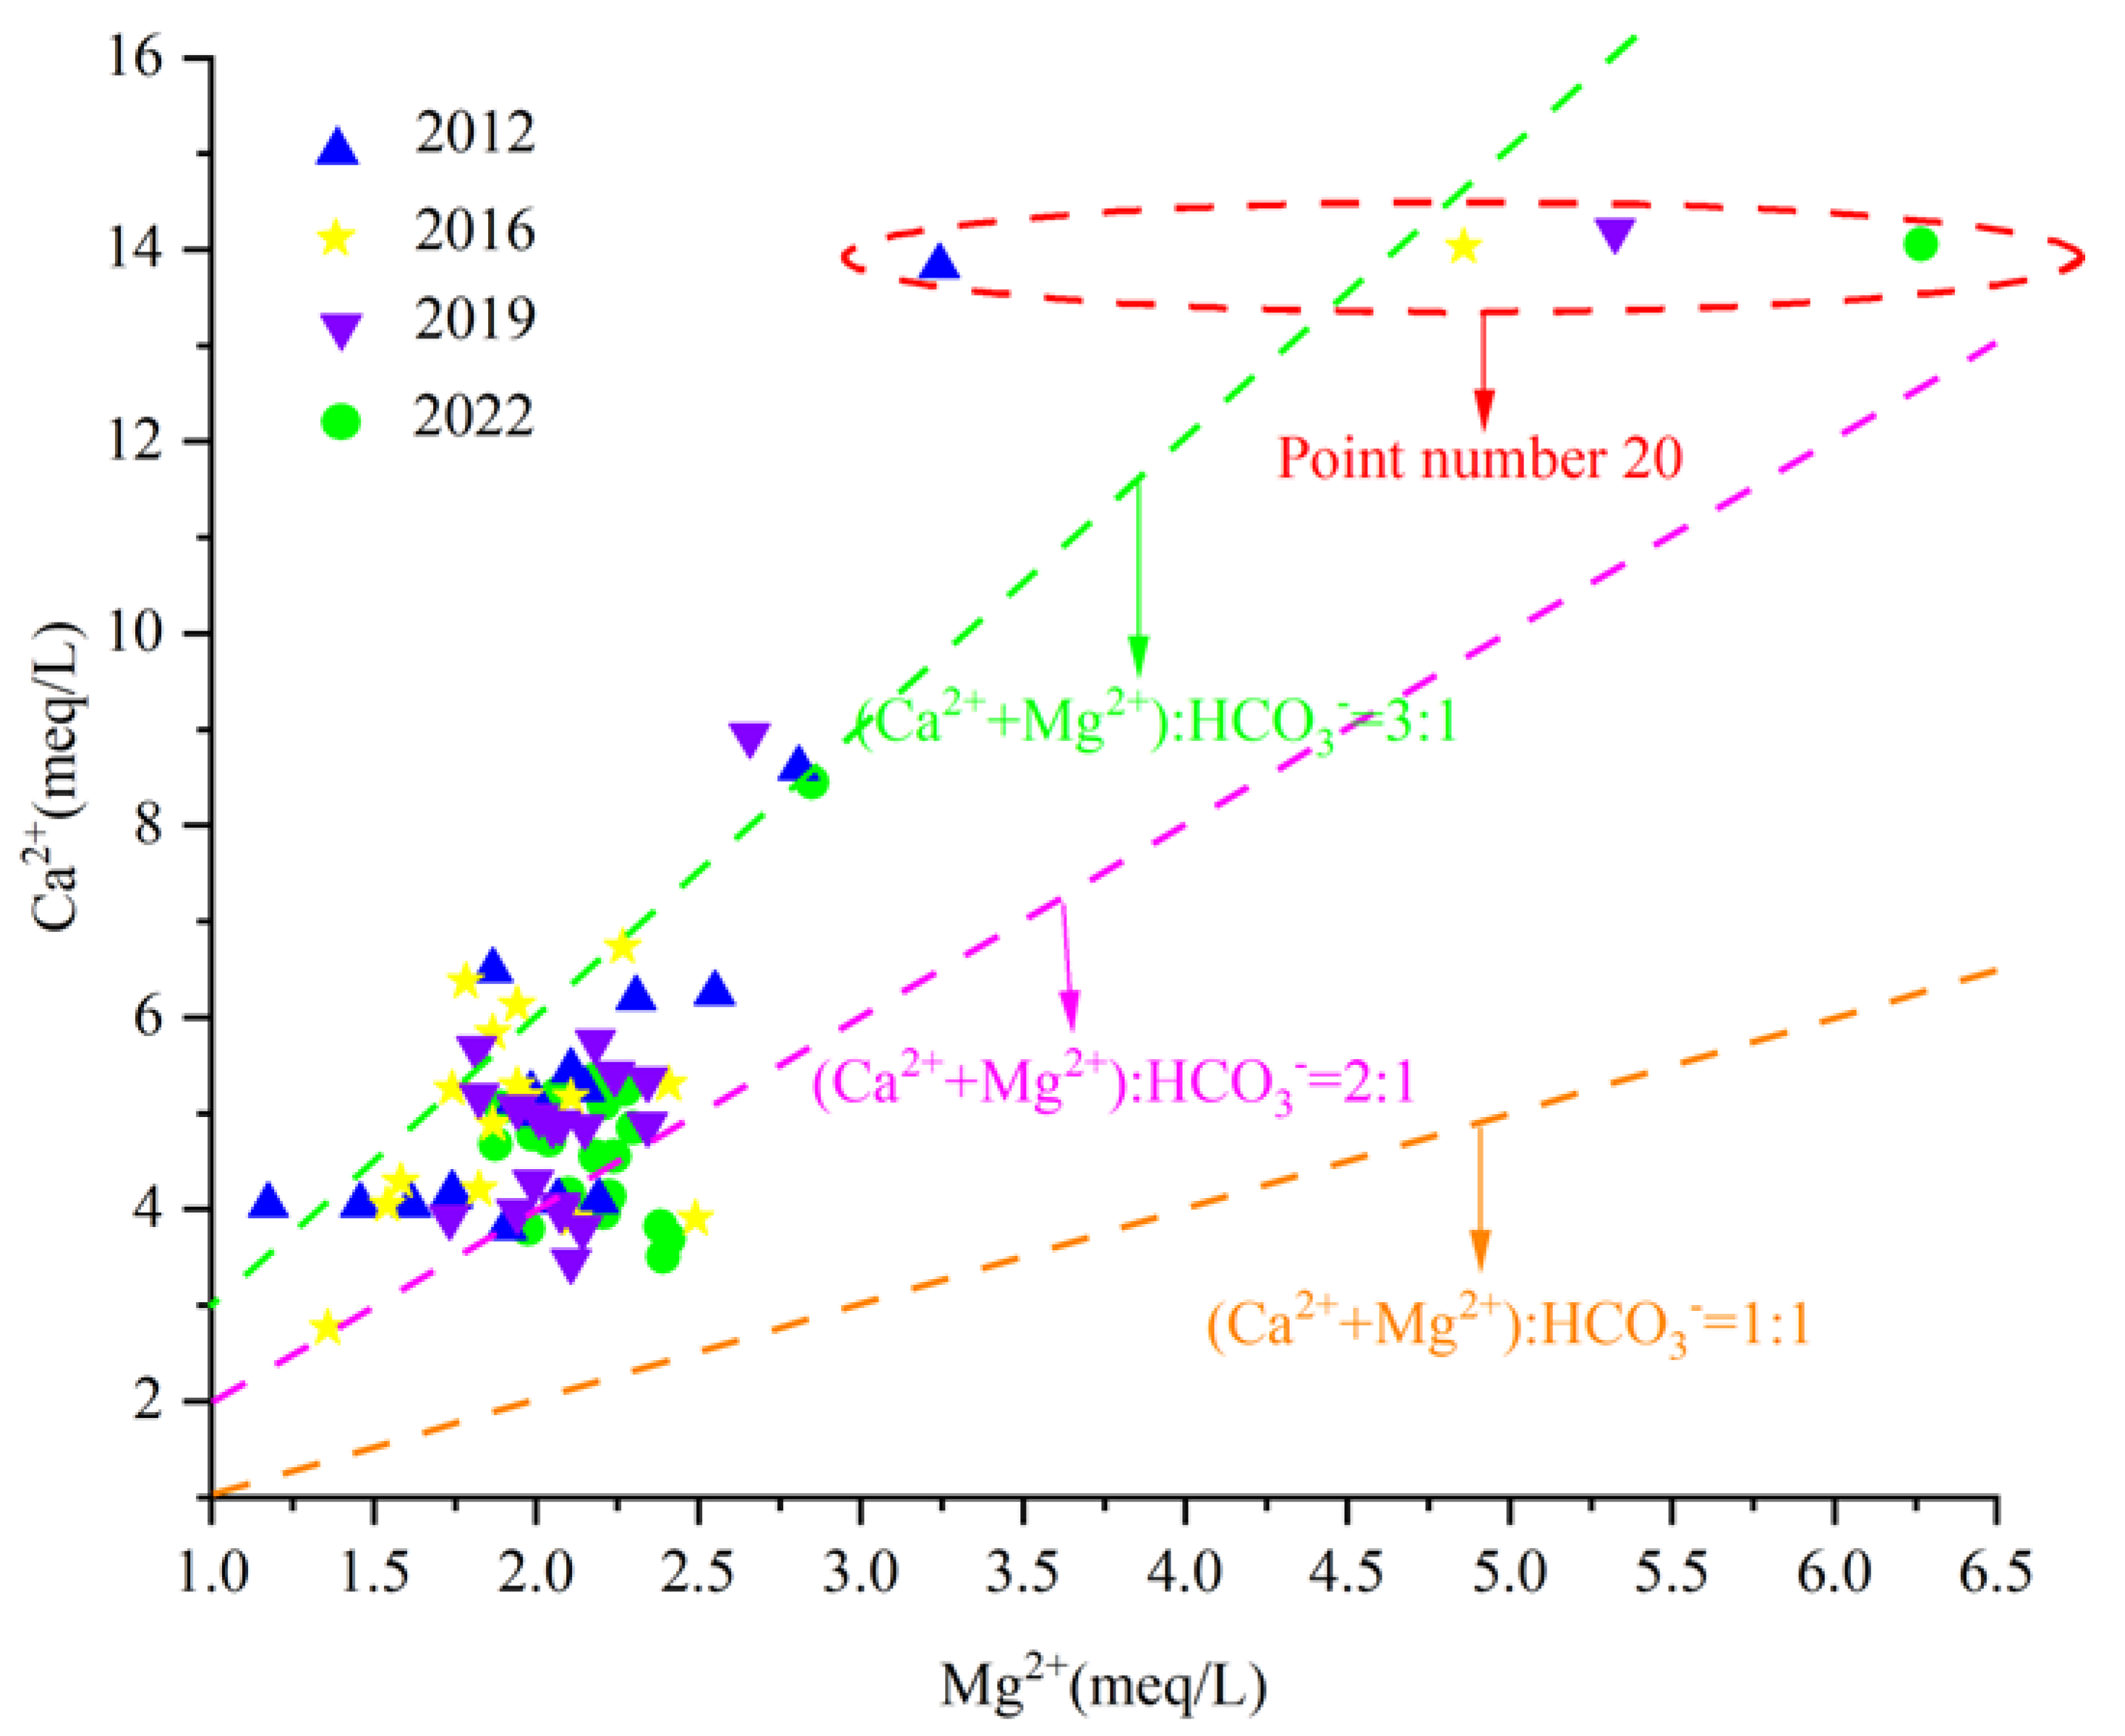
In order to further study the source of carbonate dissolution of Ca2+ and Mg2 in groundwater, the milligram equivalent ratio γCa2+/γMg2+ can be used to analyze the dissolution of carbonate minerals calcite and dolomite in groundwater. If the groundwater sample point γCa2+/γMg2+ falls near line 1:1, it indicates that dolomite dissolution occurs mainly in the groundwater. If it falls above line 2:1, it indicates that calcite dissolution occurs mainly in groundwater. If it falls near the 2:1 line, it means that the dissolution ratio of calcite and dolomite in groundwater is 1:1.
The analysis of the γCa2+/γMg2+ scatter diagram of karst groundwater in the Fengfeng mining area (Figure 12) shows that the milligram equivalent values of γCa2+ and γMg2+ in the eastern area with point number 20 are significantly higher than those in other areas, which is caused by poor runoff conditions and strong water–rock interaction. Most of the water sample points in the study area fall between the straight line 2:1 and 3:1 and keep approaching the straight line 2:1 during the ten years from 2012 to 2022, indicating that the dissolution of carbonate rock salt minerals mainly occurs in the karst groundwater in the study area, but the dissolution of dolomite continues to increase with the passage of time.
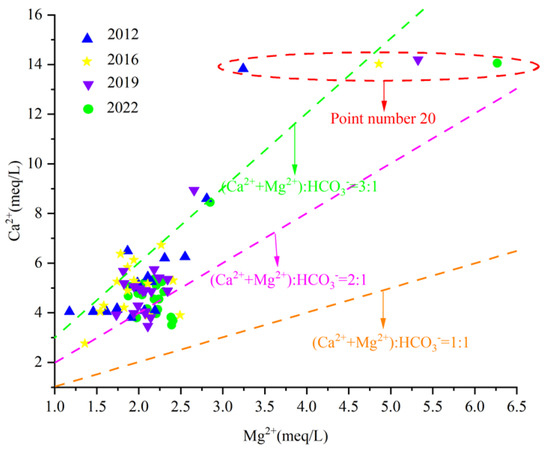
Figure 12.
Scatter diagram of γCa2+/γMg2+.
- (2)
- Weathering and dissolution of silicate minerals
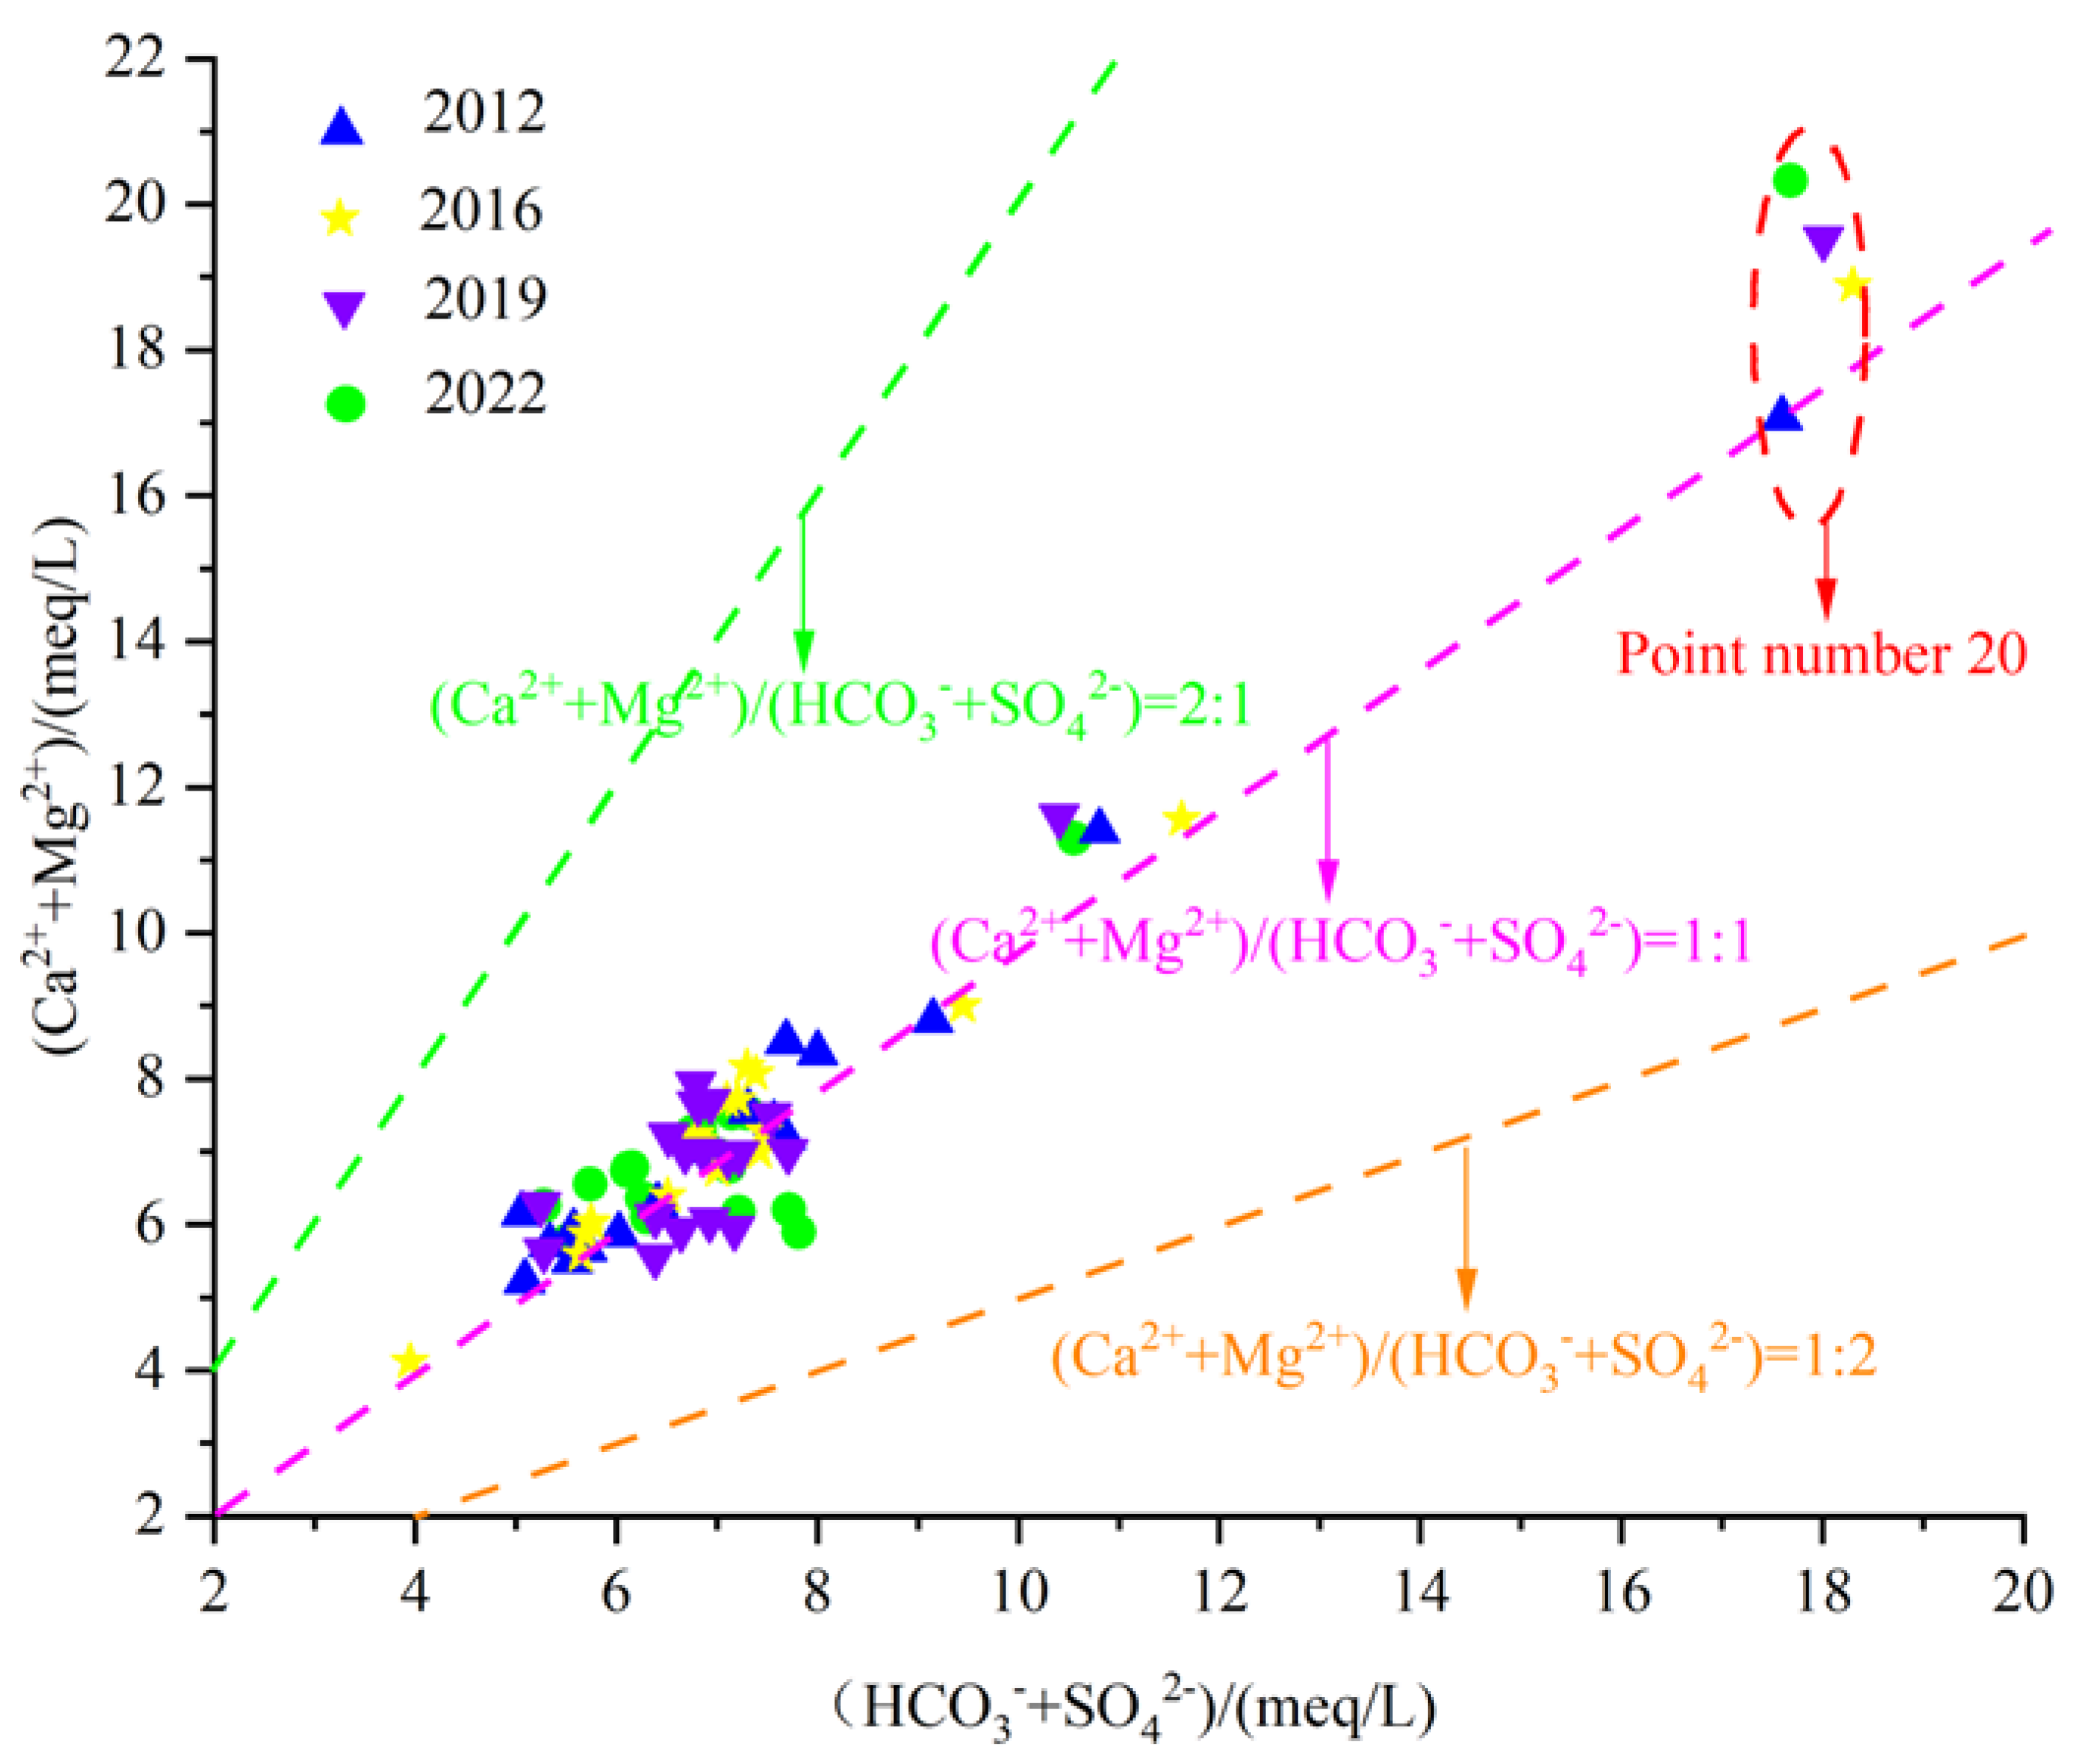
Silicate minerals generate not only HCO3 but also Na+ during weathering. Therefore, the milligram equivalent ratio of γ(Ca2+ + Mg2+)/γ(HCO3− + SO42−) can be used to analyze the effects of carbonate rock, gypsum dissolution, and silicate rock weathering and hydrolysis on Ca2+ and Mg2+ in the chemical components of groundwater. As the water sample γ(Ca2+ + Mg2+)/γ(HCO3− + SO42−) falls above a straight line of 1:1, the groundwater water–rock interaction is mainly carbonate rock and gypsum dissolution. If it falls below the line 1:1, it indicates that the main water–rock interaction is weathering of silicate rock; If it falls near the 1:1 straight line, it indicates that the dissolution of carbonate rocks, gypsum and weathering of silicate rocks jointly control the chemical composition of groundwater.
Figure 13 shows that the values of γ(Ca2+ + Mg2+)/γ(HCO3− + SO42−) of karst groundwater sample points in the study area are all located near and above the line 1:1. As the concentration of HCO3− + SO42− increases, the concentration of Ca2+ + Mg2+ also continuously increases, indicating that the karst groundwater in the Fengfeng mining area mainly undergoes hydrolysis of carbonate rocks, silicate rocks, and gypsum. Due to the main lithology of the Ordovician aquifer group in the Fengfeng mining area being calcareous shale, marlstone, brecciated limestone, and gypsum pseudocrystals, in addition to the hydrolysis of silicate minerals, it may also be affected by the alternating adsorption of cations.

Figure 13.
Scatter diagram of γ(Ca2+ + Mg2+)/γ(HCO3− + SO42−).
- (3)
- Evaporative Leaching Effect
- (1)
- Gypsum dissolution
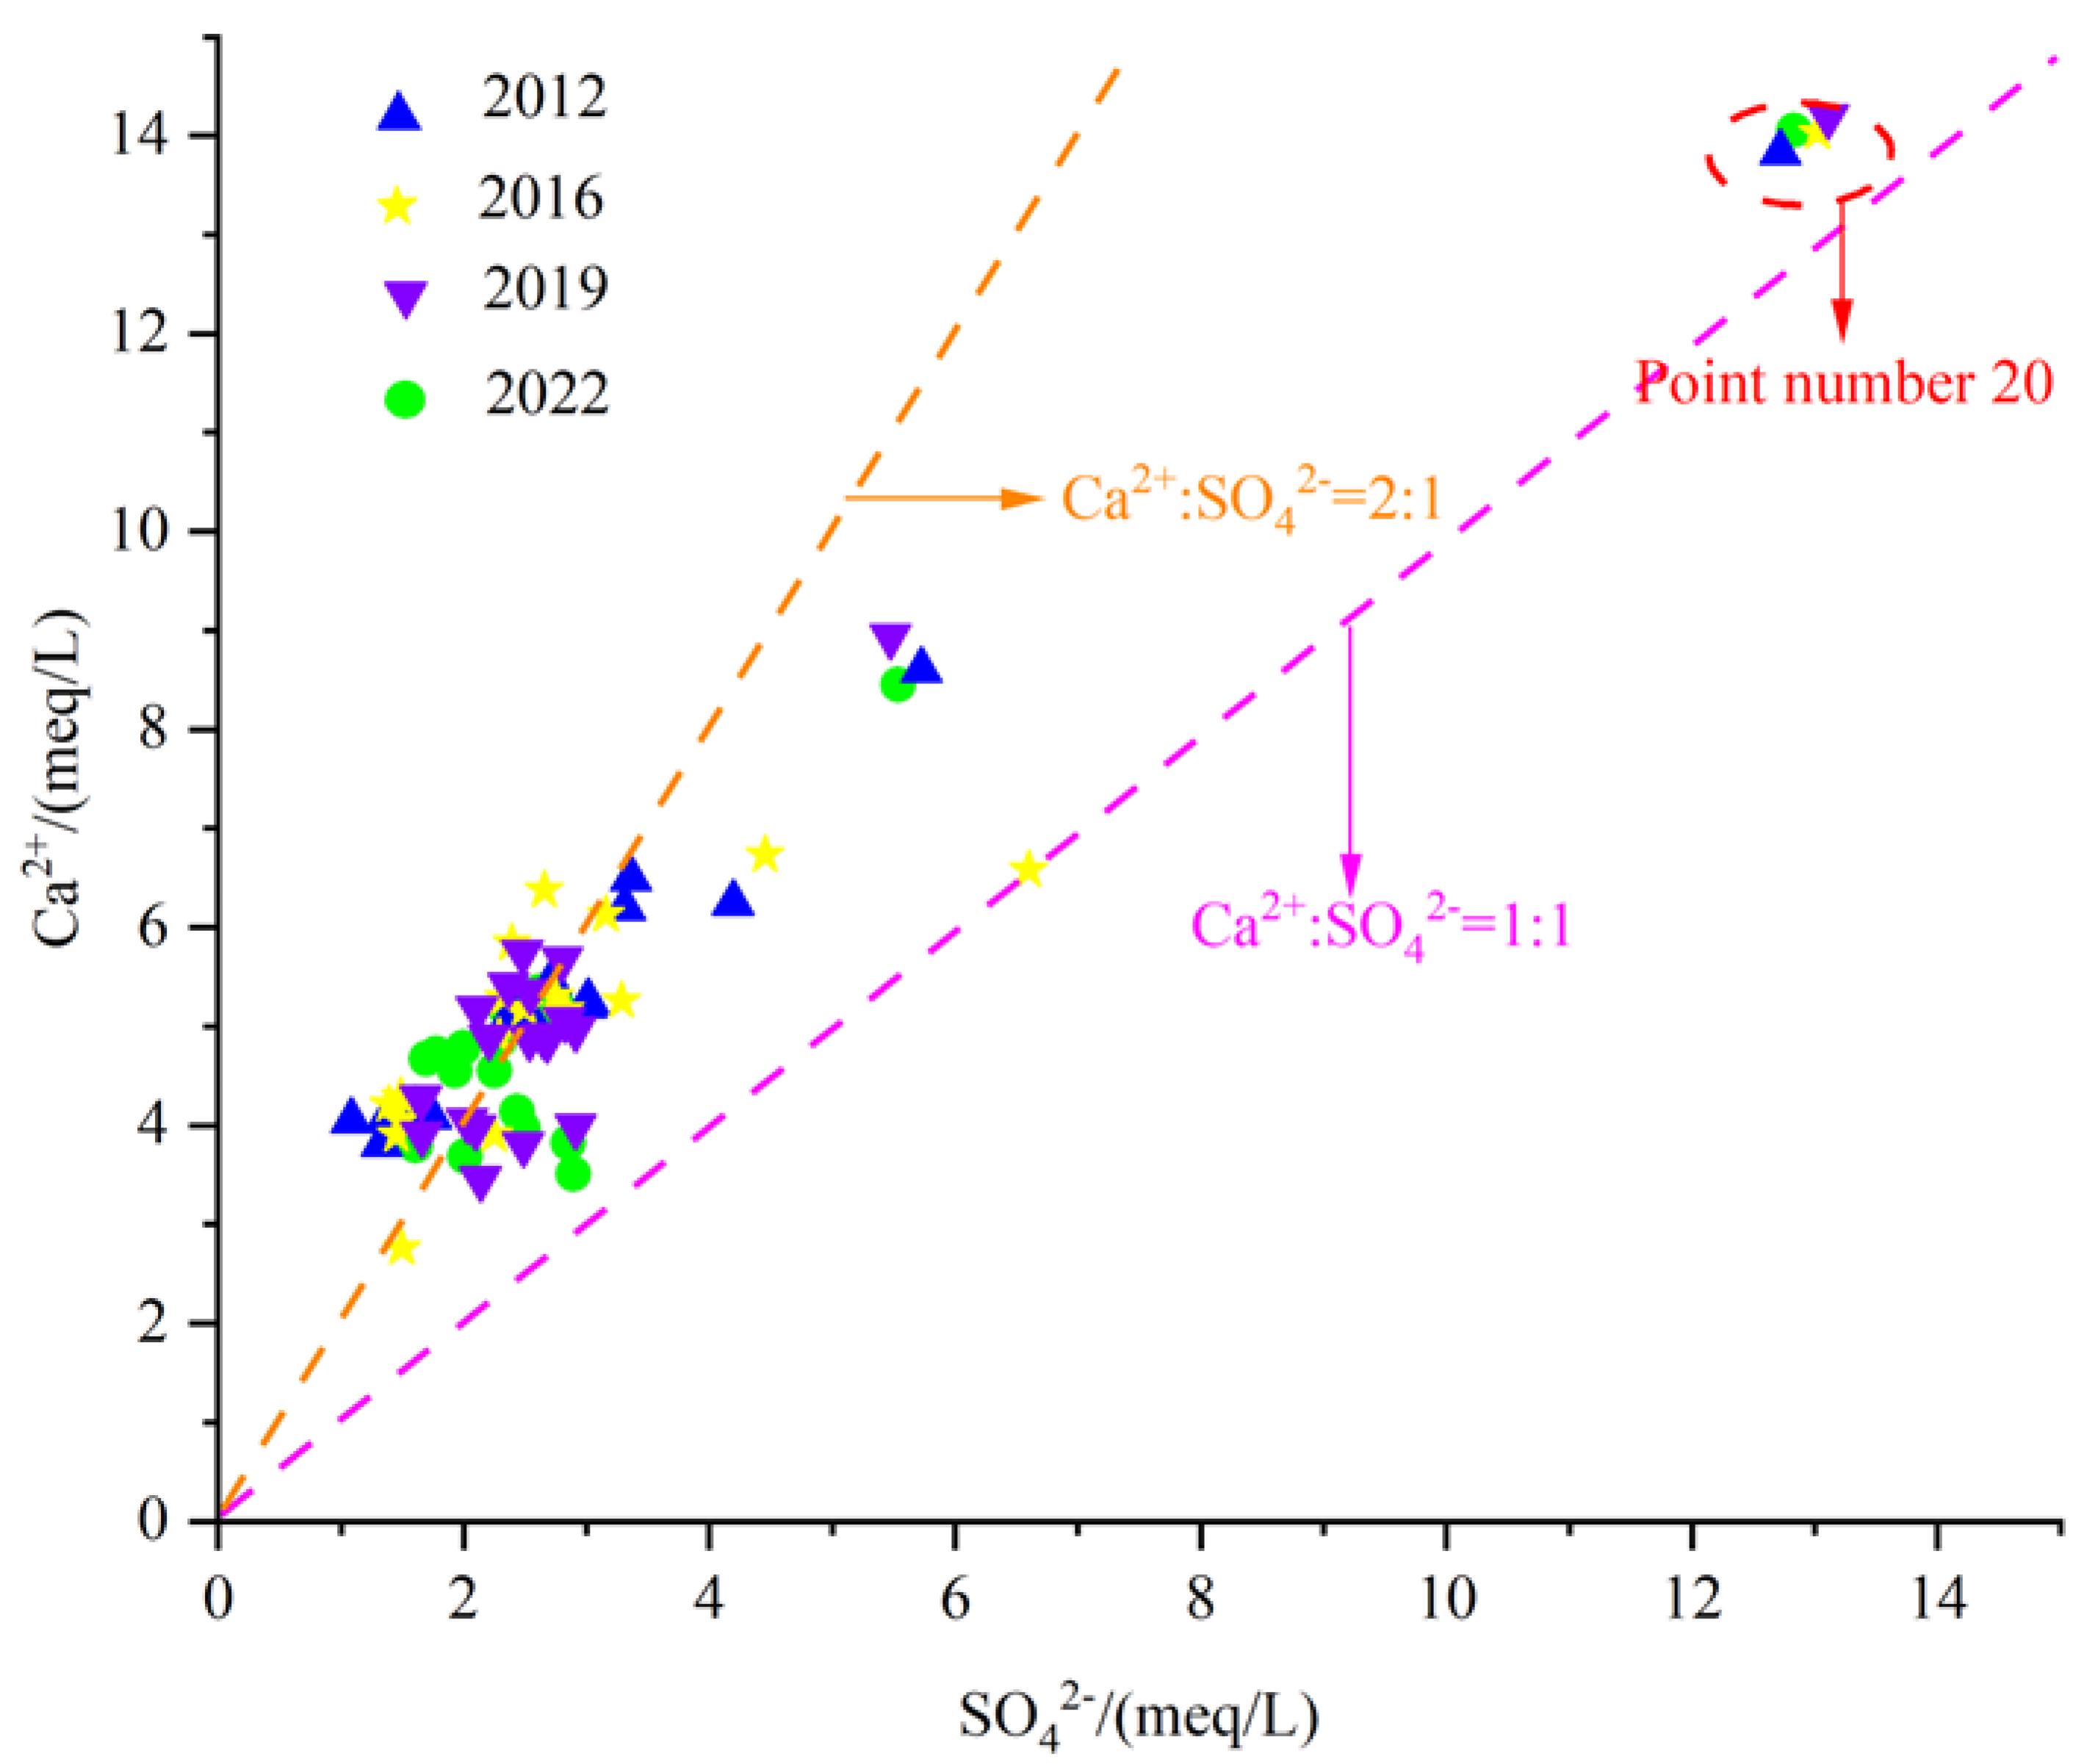
Gypsum is relatively developed in some areas of the Fengfeng mining area, such as the Upper Majiagou Formation and Fengfeng Formation of the Middle Ordovician. Therefore, the dissolution of gypsum is also one of the main sources of Ca2+ and SO42− in the groundwater of the study area. The dissolution of gypsum belongs to congruent dissolution, and its chemical equation is:
From Figure 14, it can be seen that most of the karst groundwater sample points are distributed near the straight line 2:1, while some water sample points are located near the straight line 1:1. None of the water sample points fall below the line 1:1, indicating that gypsum dissolution is indeed one of the main sources of SO42− in the groundwater of Fengfeng mining area. However, Ca2+ is affected not only by gypsum dissolution but also by other sources. Point 20 is located near the straight line 1:1, and the Ca2+ and SO42− milligram equivalent values are larger than those in other regions, indicating that the dissolution of evaporite is stronger in the eastern plain area with poor runoff conditions.

Figure 14.
Scatter diagram of γCa2+/γSO42−.
- (2)
- Rock salt dissolution
The dissolution of rock salt is one of the main sources of Na+ and Cl− in karst groundwater in northern China. The chemical equation for its dissolution is:
In addition to rock salt, cation exchange adsorption is another source of Na+ in karst groundwater, the most common being the exchange between Ca-Na and Mg-Na. Ion exchange follows the law of mass action, and the chemical equation is as follows:
The karst groundwater γ(Na+ + K+)/γCl− relationship in the Fengfeng mining area is shown in Figure 15. It can be seen from the figure that most of the water sample points in the karst groundwater in the study area are located near the straight line 1:1, indicating that rock salt dissolution is one of the main sources of Na+, K+ and Cl− in the groundwater. In the eastern plain area with point number 20, the milligram equivalent ratio is relatively far from the line 1:1, and the concentrations of Na+ + K+ and Cl− are both high, indicating that this area is affected by strong evaporation and concentration.
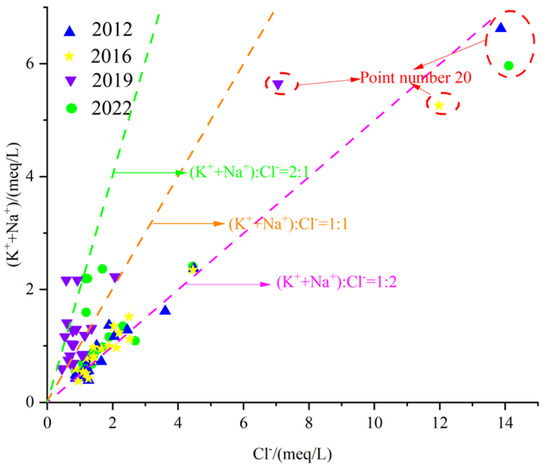
Figure 15.
Scatter diagram of γ(Na+ + K+)/γCl−.
4.4. Impact of Human Activities
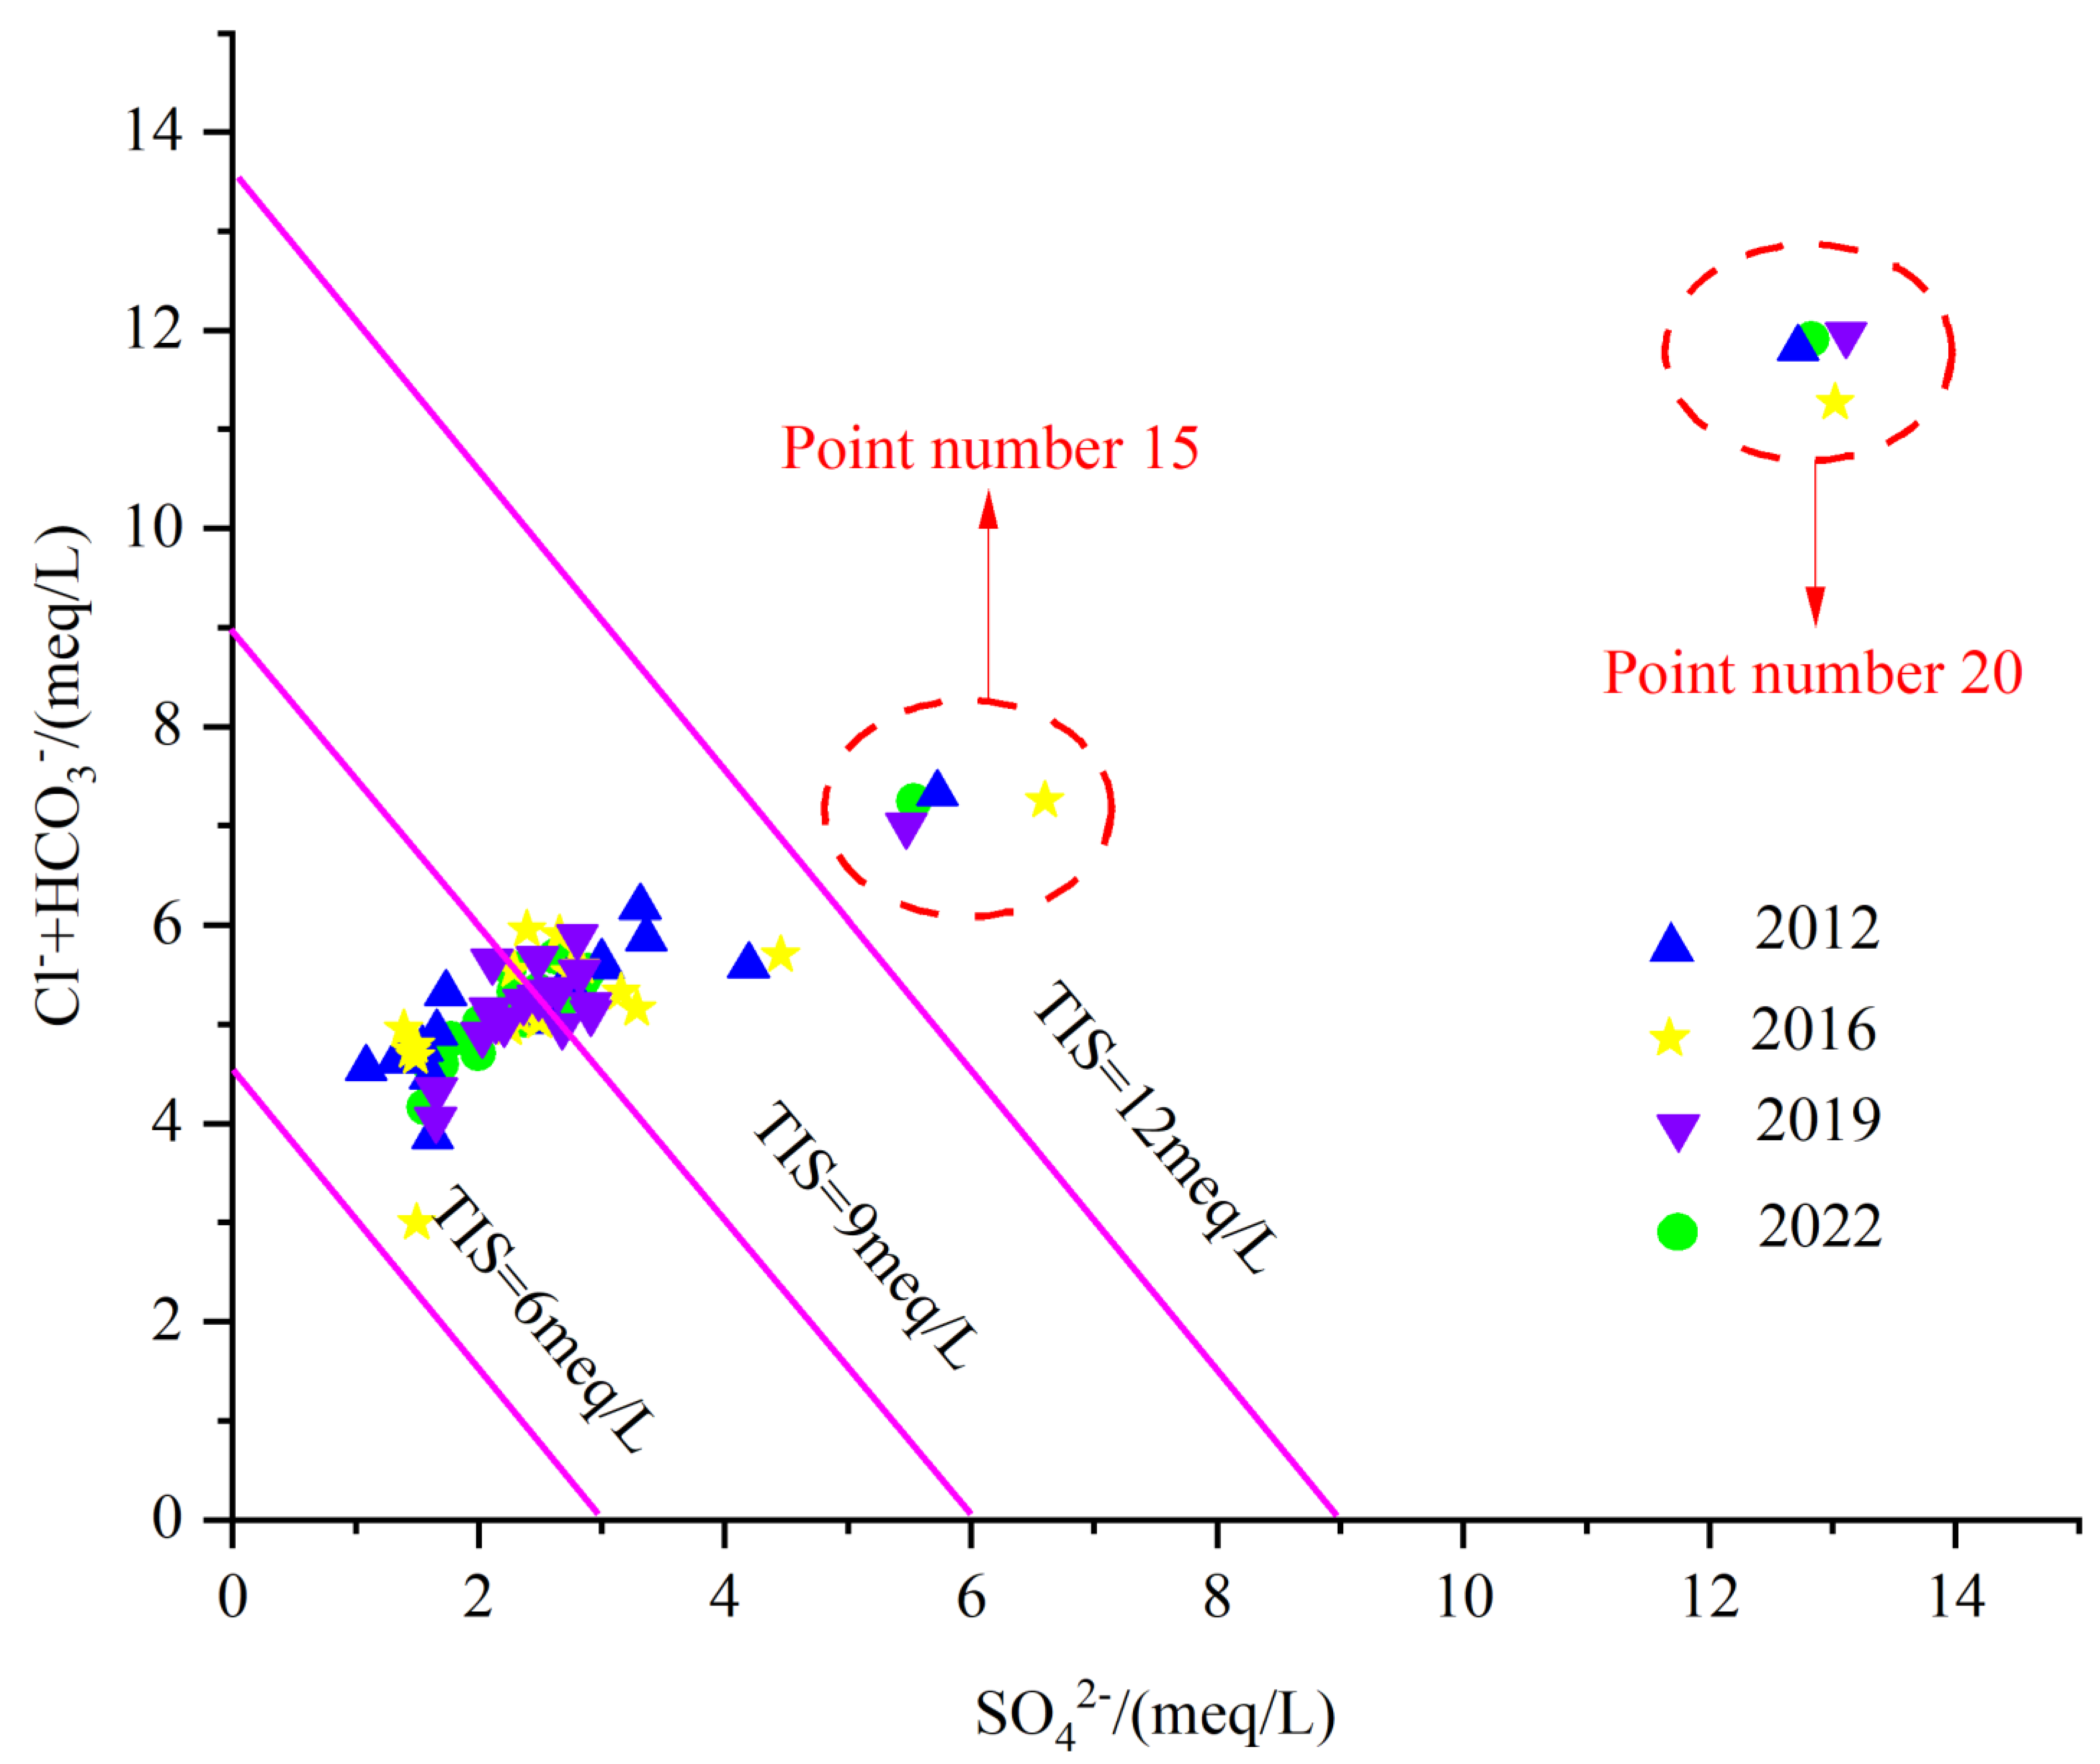
As indicated in Figure 16, generally, the main sources of SO42− are correlated to Industrial activities [45]. The industrial activities in the study area are dominated by coal and iron ore. Samples 20 and 15 are characterized by the highest SO42− amounts, affected by industrial sewage, but also by the water–rock action.
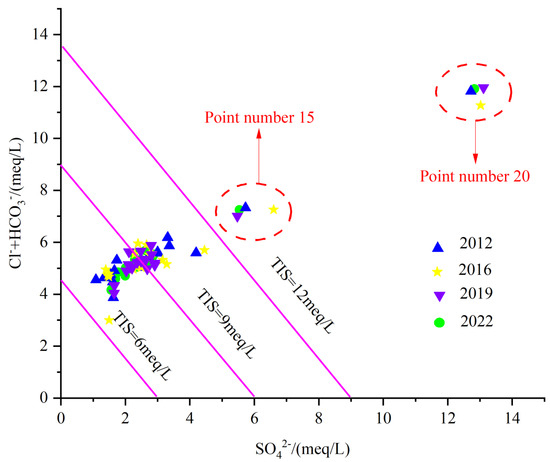
Figure 16.
Total ionic salinity plot.
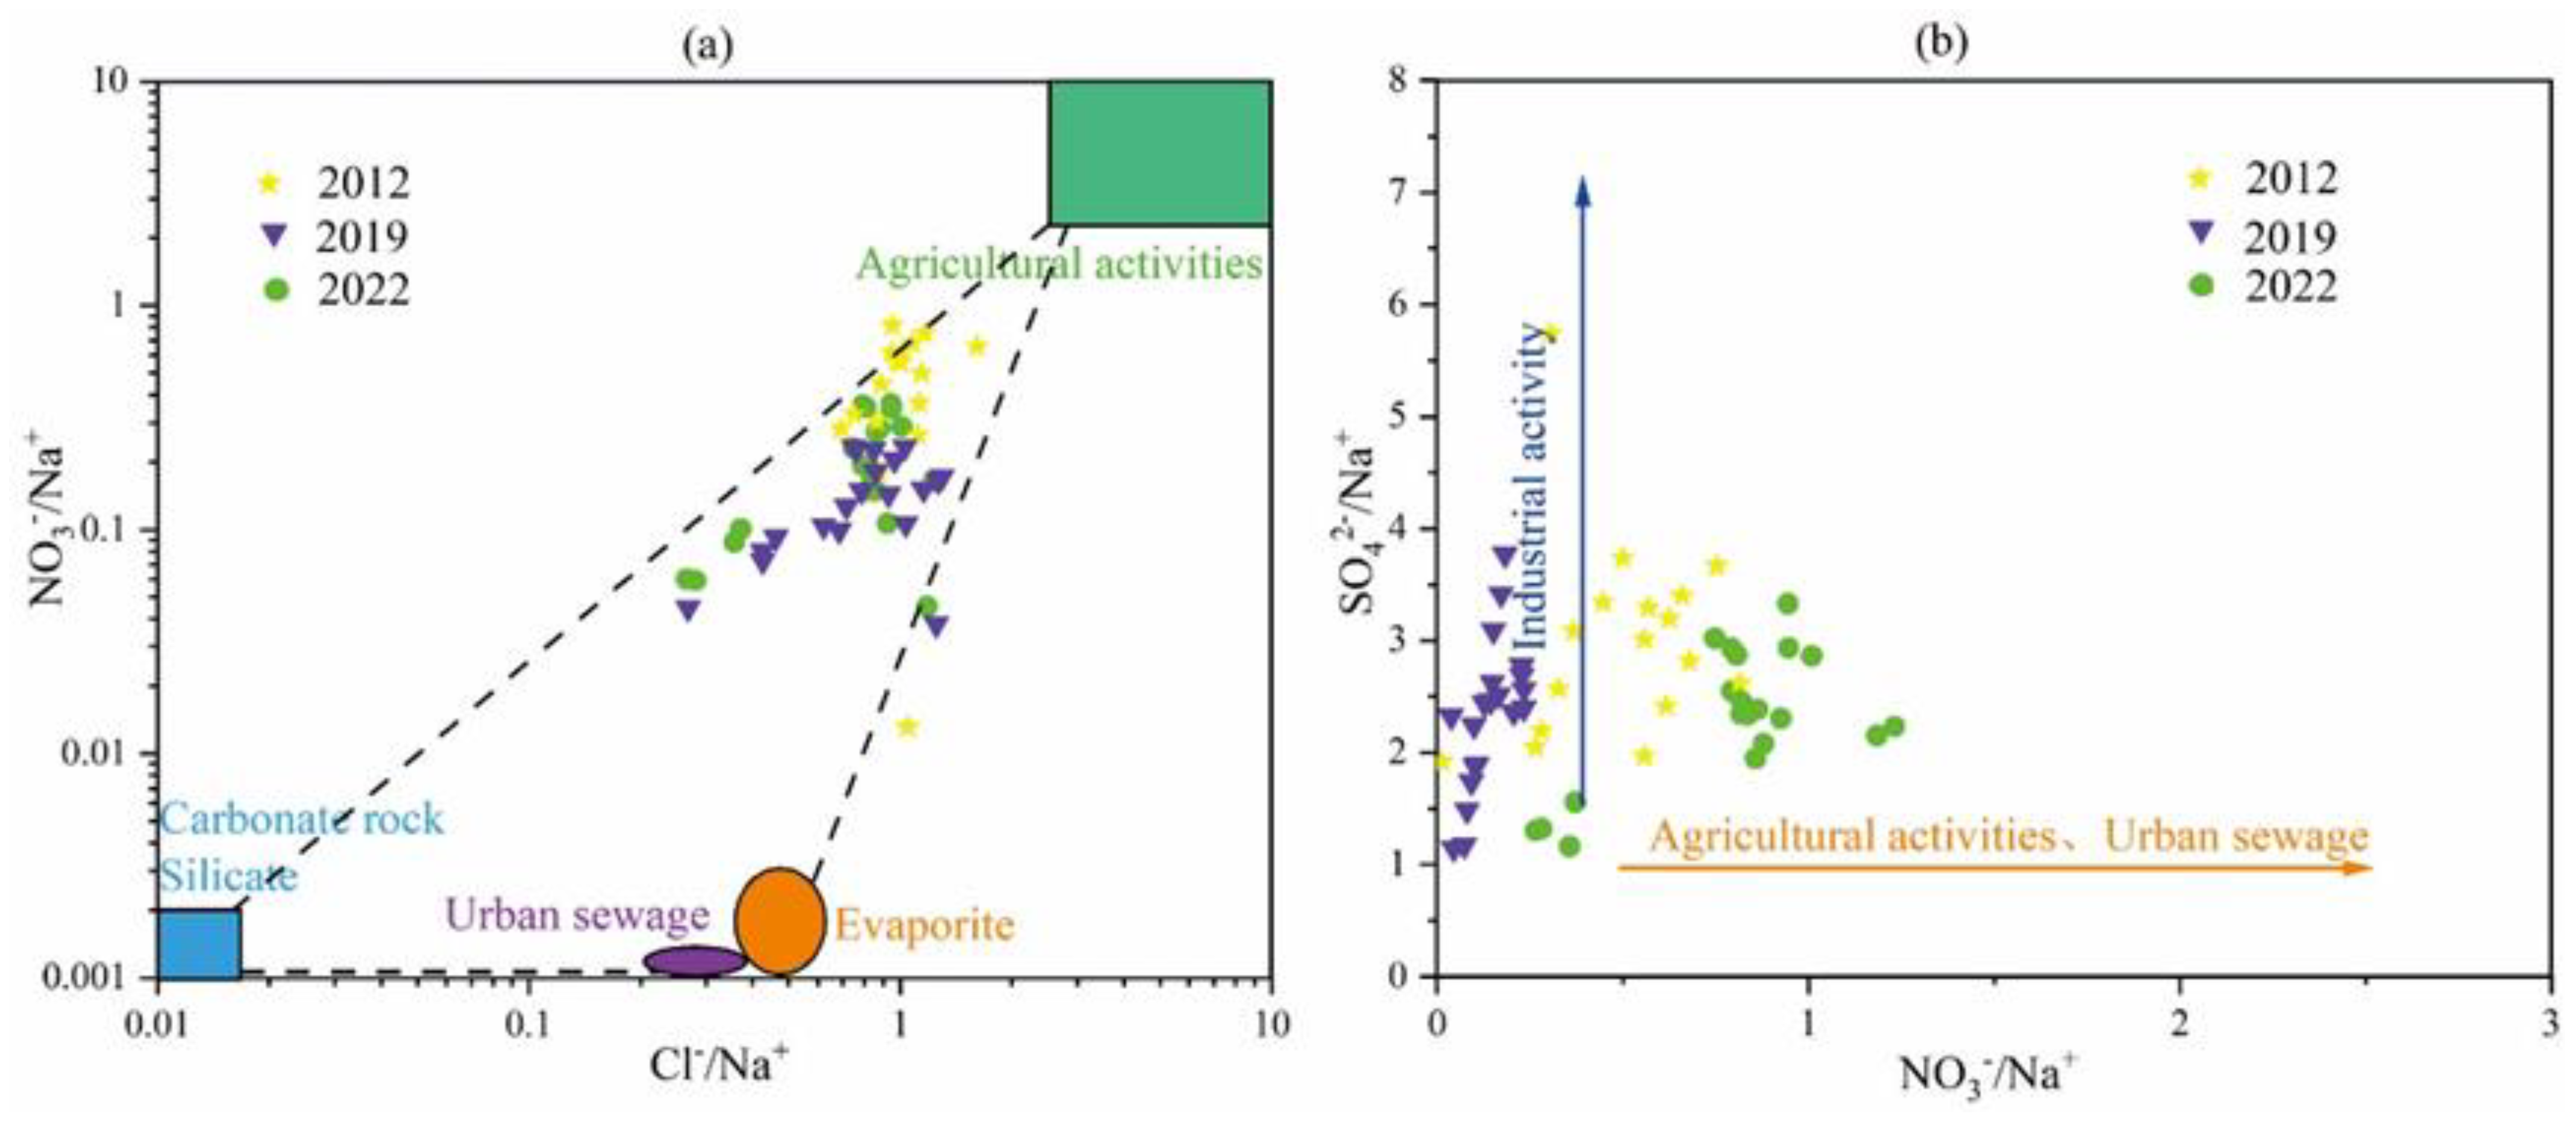
Human activities affect the evolution of groundwater hydration components, which are mainly reflected in the changes of Na+, Cl−, SO42, and NO3− plasma components and concentrations. SO42− is mainly affected by mining activities, while Na+, Cl−, and NO3− are mainly affected by factors such as agricultural activities and domestic sewage [46].
In general, the greater the ratio of γCl−/γNa+ to γNO3−/γNa+ in groundwater, the more strongly the chemical composition of groundwater is affected by human activities. The relationship between SO42−/Na+ and NO3−/Na+ ratios can further indicate whether agricultural activities and municipal wastewater are major sources of nitrate pollution in groundwater.
As can be seen from Figure 17, the karst groundwater in the study area has been affected by human activities. According to the relationship between the ratio of γCl−/γNa+ to γNO3−/γNa+ (Figure 17a), it can be seen that the influence of human factors has weakened from 2012 to 2022, indicating that the protection of groundwater resources in the study area has achieved certain results. The relationship between SO42−/Na+ and NO3−/Na+ ratios (Figure 17b) further shows that, over time, the effects of industrial activities weaken, while the effects of agricultural activities and municipal wastewater increase, but their effects are not very large. The effect of industrial activities is reduced, which proves that some areas of mine closure and regional governance have achieved some results.
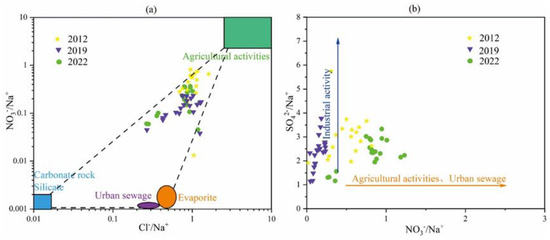
Figure 17.
Sources of nitrate ions. (a) (NO3−/Na+) vs. (Cl−/Na+) relationship, (b) (SO42−/Na+) vs. (NO3−/Na+) relationship.
4.5. Formation Process of Hydrogeochemical Characteristics
On the basis of studying the formation conditions of groundwater in the Fengfeng mining area, combined with the previous studies, the hydrogeochemical characteristics of groundwater in the study area are described as follows:
It can be seen from Figure 18 that from the Taihang Mountains in the west to the North China Plain in the east, the groundwater changes from the carbonate-exposed area to the alluvial proluvial fine soil plain area. The TDS of groundwater continuously increases from west to east, and its value gradually evolves from low salinity fresh water in the western mountainous areas to moderately mineralized brackish water in the eastern plain areas. Based on the geological and hydrogeological conditions of the study area, it can be seen that due to the steep terrain in the western mountainous areas, the groundwater runoff rate is faster and the leaching effect is stronger, so the HCO3-Ca(Mg) type water with low TDS is formed.
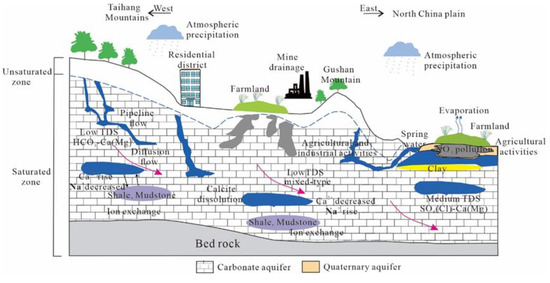
Figure 18.
The schematic diagram of the hydrogeochemical formation process of karst water in the study area.
After the groundwater flows to the alluvial fine soil plain area, the soil particles become finer, resulting in the groundwater velocity slowing down and the groundwater table rising. Therefore, the TDS in this area is slightly higher than that in the western mountainous area, but it is also the freshwater with low TDS, and the hydrochemical type has a tendency to evolve into a mixed type. In the Wutongzhuang mine area in the east, where the runoff conditions are extremely poor, the fault cuts off the hydraulic connection with the surrounding groundwater, and the water circulation is not smooth. At the same time, it is affected by agricultural activities, so it evolves into SO4(Cl)-Ca(Mg)-type water with medium TDS.
5. Conclusions
On the basis of previous studies, this study carried out a long-term series study on the hydrochemical characteristics and evolution law of karst groundwater in the Fengfeng mining area, analyzed the main influencing factors of groundwater hydrochemical components, established the conceptual model of hydrogeochemical evolution in the study area, and drew the following conclusions:
- (1)
- Dividing by TH values, most of the karst groundwater samples in the study area in different years are hard water; Divided by TDS values, most of them are freshwater. In 2022, the groundwater is generally weakly alkaline, with the dominant cation being Ca2+ and the dominant anions being HCO3− and SO42−.
- (2)
- The chemical type of groundwater in the study area in different years is mostly HCO3-Ca(Mg), while in the eastern plain area, it is SO4(Cl)-Ca(Mg) type. The results of hydrogen and oxygen isotope analysis indicate that the main source of supply for karst water in the study area is atmospheric precipitation, with supply elevations ranging from 1166.7 to 1533.3 m, and the supply conditions are relatively complex.
- (3)
- The research area is generally controlled by rock weathering (karst erosion of carbonate and silicate rocks), while in the eastern plain area with weak runoff conditions, it is doubly controlled by evaporation concentration and rock weathering. Ca2+ and Mg2+ mainly come from the dissolution of carbonate rocks, and the proportion of dolomite dissolution continues to increase over time. By 2022, the ratio of carbonate rock dissolution to calcite dissolution will basically be 1:1.
- (4)
- Human activities have had a certain impact on the hydrochemistry composition of karst groundwater in the study area. Most areas have been affected by agricultural activities, while some areas have been affected by industrial activities. Over time, the impact of industrial activities has begun to weaken.
- (5)
- HCO3-Ca(Mg) type water with low TDS is formed in the western mountainous area, HCO3-Ca(Mg) type water with slightly higher TDS is formed in the alluvial fine soil plain area, and SO4(Cl)-Ca(Mg) type water with medium TDS is formed in the Wutongzhuang mine area with extremely poor runoff conditions. Therefore, this study is expected to provide suggestions and references for the utilization and protection of groundwater resources in the study area.
Author Contributions
Methodology, H.S.; Formal analysis, Z.J.; Investigation, K.B., T.W. and Z.N.; Resources, T.W. and Z.J.; Data curation, H.S.; Writing—original draft, H.S.; Writing—review & editing, K.B. and Z.N. All authors have read and agreed to the published version of the manuscript.
Funding
The research was supported by the National Natural Science Foundation of China (41902254), the Ecological Wisdom Mine Joint Fund of the Natural Science Foundation of Hebei province (D2020402013), the Key R and D Project of Hebei Province (21373901D) and the Natural Science Foundation Project of Hebei Province (D2022402040).
Data Availability Statement
Data not disclosed due to privacy permission issues.
Conflicts of Interest
Wang Tieji and Jin Zidong are employed by Jizhong Energy Fengfeng Group, Co., Ltd. and Niu Zhiqiang is employed by Hydrogeology Team of Hebei Coalfield Geology Bureau. The remaining authors declare that the research was conducted in the absence of any commercial or financial relationships that could be construed as a potential conflict of interest.
References
- Medici, G.; Lorenzi, V.; Sbarbati, C.; Manetta, M.; Petitta, M. Structural Classification, Discharge Statistics, and Recession Analysis from the Springs of the Gran Sasso (Italy) Carbonate Aquifer; Comparison with Selected Analogues Worldwide. Sustainability 2023, 15, 10125. [Google Scholar] [CrossRef]
- Goldscheider, N.; Chen, Z.; Auler, S.A.; Bakalowicz, M.; Broda, S.; Drew, D.; Hartmann, J.; Jiang, G.H.; Moosdorf, N.; Stevanovic, Z.; et al. Global distribution of carbonate rocks and karst water resources. Hydrogeol. J. 2020, 28, 1661–1677. [Google Scholar] [CrossRef]
- Jiang, T.S.; Qu, C.X.; Wang, M.Y.; Hu, B. Hydrochemical characteristics of shallow groundwater and the origin in the Pinggu plain, Beijing. J. Arid. Land Resour. Environ. 2017, 31, 122–127. [Google Scholar] [CrossRef]
- Wang, L.H.; Dong, Y.H.; Song, F.; Zhang, J.Y.; Tong, S.Q.; Zhang, Q. Recharge sources and hydrogeochemical properties of groundwater in the Shiyou River, Gansu Province. Arid. Land Geogr. 2017, 40, 54–61. [Google Scholar] [CrossRef]
- EunHee, K.; Eunhee, L.; KangKun, L.; DukCheol, M. Integrated application of a Bayesian mixing model, numerical model, and environmental tracers to characterize groundwater recharge sources in a mountainous area. Sci. Total Environ. 2022, 853, 158619. [Google Scholar] [CrossRef]
- Yamazaki, Y.; Muneoka, T.; Wakou, S.; Kimura, M.; Tsuji, O. Characteristics of Ion Components in River Water with Multivaraite Analysis and Piper Diagram in Agricultural Area. Int. J. Environ. Rural. Dev. 2020, 6, 80–85. [Google Scholar] [CrossRef]
- Zhu, X.; Wang, G.L.; Ma, F.; Zhang, W.; Zhang, Q.L.; Zhang, H.X. Hydrogeochemistry of Geothermal Waters from Taihang Mountain-Xiong’an New Area and Its Indicating Significance. Earth Sci. 2021, 46, 2594–2608. [Google Scholar] [CrossRef]
- Tsuchihara, T.; Shirahata, K.; Ishida, S.; Yoshimoto, S. Application of a Self-Organizing Map of Isotopic and Chemical Data for the Identification of Groundwater Recharge Sources in Nasunogahara Alluvial Fan, Japan. Water 2020, 12, 278. [Google Scholar] [CrossRef]
- Zhang, Y.; Li, F.D.; Zhao, G.S.; Li, J.; Zhu, O.Y. An attempt to evaluate the recharge source and extent using hydrogeochemistry and stable isotopes in North Henan Plain, China. Environ. Monit. Assess. 2014, 186, 5185–5197. [Google Scholar] [CrossRef]
- Parlov, J.; Kovač, Z.; Nakić, Z.; Barešić, J. Using Water Stable Isotopes for Identifying Groundwater Recharge Sources of the Unconfined Alluvial Zagreb Aquifer (Croatia). Water 2019, 11, 2177. [Google Scholar] [CrossRef]
- Gibbs, R.J. Mechanisms controlling world water chemistry. Science 1970, 170, 1088–1090. [Google Scholar] [CrossRef] [PubMed]
- Sun, Y.; Zhou, J.L.; Wei, X.; Lei, M.; Zeng, Y.Y.; Ma, J.; Yin, P. Hydrochemical characteristics and cause analysis of groundwater in the plain area of Bachu County. Environ. Chem. 2019, 38, 2601–2609. [Google Scholar] [CrossRef]
- Zhang, T.; He, J.; Li, J.J.; Cao, Y.T.; Gong, L.; Liu, J.W.; Bian, C.; Cai, Y.M. Major ionic features and possible controls in the groundwater in the Hamatong River Basin. Environ. Sci. 2018, 39, 4981–4990. [Google Scholar] [CrossRef]
- Ren, X.H.; Wu, X.; Gao, Z.J.; An, Y.H.; Hao, M.H.; Wang, Z.Y.; Wang, S. Hydrochemical characteristics and formation mechanisms of groundwater in Jiuquan East basin. J. Arid. Land Resour. Environ. 2019, 33, 109–116. [Google Scholar] [CrossRef]
- Benmoussa, Y.; Remini, B.; Remaoun, M. Quality assessment and hydrogeochemical characteristics of groundwater in Kerzaz and Beni Abbes along Saoura valley, southwest of Algeria. Appl. Water Sci. 2020, 10, 721–732. [Google Scholar] [CrossRef]
- Suraj, P.R.; Krishnakumar, K.N.; Induja, K.N.; Anish, A.U. Hydrogeochemical characterization of groundwater in coastal aquifers of kollam district, Southern Kerala, India. Pollut. Res. 2019, 38, 18–22. [Google Scholar]
- Sharif, M.U.; Davis, R.K.; Steele, K.F.; Kim, B.; Kresse, T.M.; Fazio, J.A. Inverse geochemical modeling of groundwater evolution with emphasis on arsenic in the Mississippi River Valley alluvial aquifer, Arkansas (USA). J. Hydrol. 2008, 350, 41–55. [Google Scholar] [CrossRef]
- Eugenio, S.; Catalina, B.; Carlos, P.; Ignacio, M.P.; Cristina, F. Hydrogeochemical Evolution of an Aquifer Regulated by Pyrite Oxidation and Organic Sediments. Water 2021, 13, 2444. [Google Scholar] [CrossRef]
- Zhang, X.; Hu, B.X.; Wang, P.; Chen, J.; Yang, L.; Xiao, K.; Zhang, X. Hydrogeochemical Evolution and Heavy Metal Contamination in Groundwater of a Reclaimed Land on Zhoushan Island. Water 2018, 10, 316. [Google Scholar] [CrossRef]
- Jacek, M.; Kajetan, D.; Ondra, S.; Adam, P.; Michał, Ź. Pit Lakes Affected by a River Contaminated with Brines Originated from the Coal Mining Industry: Evolution of Water Chemistry in the Zakrzówek Horst Area (Krakow, Southern Poland). Energies 2022, 15, 4382. [Google Scholar] [CrossRef]
- Rosela, P.; Cesar, C.; Roger, P.; Julia, P.; Jorge, M.M. Regional Hydrogeochemical Evolution of Groundwater in the Ring of Cenotes, Yucatán (Mexico): An Inverse Modelling Approach. Water 2021, 13, 614. [Google Scholar] [CrossRef]
- Li, M.Q.; Liang, X.J.; Xiao, C.L.; Cao, Y.Q.; Hu, S.Y. Hydrochemical Evolution of Groundwater in a Typical Semi-Arid Groundwater Storage Basin Using a Zoning Model. Water 2019, 11, 1334. [Google Scholar] [CrossRef]
- Apollaro, C.; Marini, L.; De Rosa, R.; Settembrino, P.; Scarciglia, F.; Vecchio, G. Geochemical features of rocks, stream sediments, and soils of the Fiume Grande Valley (Calabria, Italy). Environ. Geol. 2007, 52, 719–729. [Google Scholar] [CrossRef]
- Hussin, N.H.; Yusoff, I.; Tahir, W.Z.W.M.; Mohamed, I.; Ibrahim, A.I.N.; Rambli, A. Multivariate statistical analysis for identifying water quality and hydrogeochemical evolution of shallow groundwater in Quaternary deposits in the Lower Kelantan River Basin, Malaysian peninsula. Environ. Earth Sci. 2016, 75, 1081. [Google Scholar] [CrossRef]
- Tu, C.L.; Yang, R.B.; Ma, Y.Q.; Linhu, C.W.; Zhao, R.G.; He, C.Z. Characteristics and Driving Factors of Hydrochemical Evolution in Tuochangjiang River Basin, Western Guizhou Province. Environ. Sci. 2023, 44, 740–751. [Google Scholar] [CrossRef]
- Guo, X.J.; Wang, H.W.; Shi, J.X.; Wang, W. Hydrochemical characteristics and evolution pattern of groundwater system in Baiyangdian wetland, North China Plain. Acta Geol. Sin. 2022, 96, 656–672. [Google Scholar]
- Kumar, P.; Kumar, A.; Singh, C.K.; Saraswat, C.; Avtar, R.; Ramanathan, A.L.; Herath, S. Hydrogeochemical Evolution and Appraisal of Groundwater Quality in Panna District, Central India. Expo. Health 2016, 8, 19–30. [Google Scholar] [CrossRef]
- Pazand, K.; Javanshir, A.R. Application of multivariate statistical techniques in hydrogeochemical evolution of groundwater in a igneous rock and sedimentary aquifer system: A case study of the southern Bam, SE Iran. Carbonates Evaporites 2016, 31, 9–16. [Google Scholar] [CrossRef]
- Huang, J.O.; Xian, Y.; Li, W.; Zhang, D.Z.; Zhuang, X.M. Hydrogeochemical Evolution of Groundwater Flow System in the Typical Coastal Plain: A Case Study of Hangjiahu Plain. Earth Sci. 2021, 46, 2565–2582. [Google Scholar]
- Ye, H.J.; Zhang, R.X.; Wu, P.; Han, Z.W.; Zha, X.F.; Li, X.X.; Tan, Y.J.; Shi, J.F. Characteristics and Driving Factor of Hydrochemical Evolution in Karst Water in the Critical Zone of Liupanshui Mining Area. Earth Sci. 2019, 44, 2887–2898. [Google Scholar]
- Balagizi, M.C.; Kasereka, M.M.; Kyambikwa, A.M.; Cuoco, E.; Liotta, M. Characterizing groundwater recharge sources using water stable isotopes in the North Basin of Lake Kivu, East Africa. Chem. Geol. 2022, prepublish. [Google Scholar] [CrossRef]
- Meng, L.H. Recharge Source and Evolution Process of Karst Groundwater in Tai’an Urban Area Based on Hydrochemistry and Hydrogen and Oxygen Isotopes. Environ. Sci. 2023, 136, 1–13. [Google Scholar] [CrossRef]
- Apollaro, C.; Fuoco, I.; Gennaro, E.; Giuliani, L.; Iezzi, G.; Marini, L.; Radica, F.; Di, L.F.; Ventura, G.; Vespasiano, G. Advanced argillic alteration at Cave di Caolino, Lipari, Aeolian Islands (Italy): Implications for the mitigation of volcanic risks and the exploitation of geothermal resources. Sci. Total Environ. 2023, 889, 164333. [Google Scholar] [CrossRef] [PubMed]
- Rahim, B.; Asghar, M.A.; Jan, A.; Hossein, N.A. Assessing the potential origins and human health risks of trace elements in groundwater: A case study in the Khoy plain, Iran. Environ. Geochem. Health 2019, 41, 981–1002. [Google Scholar] [CrossRef]
- Jia, Y.L.; Bian, K.; Li, C.; Bai, X.; Bai, F.Q. Analysis of hydrochemical characteristics of karstic water in Fengfeng mining area based on GIS and correlation. China Coal 2019, 45, 95–101. [Google Scholar]
- Guo, Y.Y. The Geochemical Evolution of Groundwater and the Influence on Regional Groundwater in Abandoned Mines in the Fengfeng Mining Area. Master’s Thesis, China University of Geosciences, Beijing, China, 2016. [Google Scholar]
- Sun, T.T. Groundwater Rebound of Quantou Mine after Abandoned in Fengfeng Mining Area and Its Impacts on Regional Groundwater. Master’s Thesis, China University of Geosciences, Beijing, China, 2014. [Google Scholar]
- Ma, L. Study on Process and Mechanism of Water Rebound Impact on the Regional Groundwater Flow Field in Abandoned Mines. Master’s Thesis, China University of Geosciences, Beijing, China, 2016. [Google Scholar]
- Guo, Y.Y.; Lv, Z.C.; Wang, G.C.; Ma, L.; Xu, Q.Y.; Huang, X.J.; Gao, S.Z. Hydrogeochemical simulation of groundwater in Eastern Fengfeng mining area. Geol. Explor. 2016, 44, 101–105. [Google Scholar] [CrossRef]
- Hao, C.M.; Zhang, W.; Sun, W.; He, P.Y. Study on hydrogeochemistry processes of deep Ordovician limestone water of Fengfeng coal mining area. China Min. Mag. 2021, 30, 230–236. [Google Scholar]
- Yan, Y.M.; Qin, P.; Wu, Z.L.; Bai, X.Q.; Shen, Z.H. Influence on the karst groundwater environment by coal mining in the Fengfeng coal mine area. China Min. Mag. 2010, 19, 120–125. [Google Scholar]
- Bian, K.; Sun, H.; Xia, S.B.; Yang, Z.J.; Wang, Y.X.; Balaji, P. Hydrochemical and Hydrogen–Oxygen Isotope-Based Identification of Water Sources in Mine Wells. J. Water Chem. Technol. 2023, 45, 290–301. [Google Scholar] [CrossRef]
- Zheng, S.H.; Hou, F.G.; Ni, B.L. Hydrogen and oxygen stable isotope studies of atmospheric precipitation in China. Sci. Bull. 1983, 28, 801–806. [Google Scholar] [CrossRef]
- Marandi, A.; Shand, P. Groundwater chemistry and the Gibbs Diagram. Appl. Geochem. 2018, 97, 209–212. [Google Scholar] [CrossRef]
- Resz, M.A.; Roman, C.; Senila, M.; Török, A.I.; Kovacs, E. A Comprehensive Approach to the Chemistry, Pollution Impact and Risk Assessment of Drinking Water Sources in a Former Industrialized Area of Romania. Water 2023, 15, 1180. [Google Scholar] [CrossRef]
- Liu, Y.Q.; Zhou, L.; Lv, L.; Li, W.; Wang, X.F.; Deng, Q.J.; Zhen, Y.D.; Li, C.S. Hydrochemical Characteristics and Control Factors of Pore-water in the Middle and Upper Reaches of Muwen River. Environ. Sci. 2023, 44, 1429–1439. [Google Scholar] [CrossRef]


Disclaimer/Publisher’s Note: The statements, opinions and data contained in all publications are solely those of the individual author(s) and contributor(s) and not of MDPI and/or the editor(s). MDPI and/or the editor(s) disclaim responsibility for any injury to people or property resulting from any ideas, methods, instructions or products referred to in the content. |
© 2023 by the authors. Licensee MDPI, Basel, Switzerland. This article is an open access article distributed under the terms and conditions of the Creative Commons Attribution (CC BY) license (https://creativecommons.org/licenses/by/4.0/).