1. Introduction
Marine pumps are a general term for a type of mechanical equipment installed on ships to transport or pressurize liquids [
1]. A marine magnetic pump is a marine pump that is driven by the magnetic field generated by the motor and external magnetic assembly as the driving force to synchronously rotate the magnetic steel inside the isolation sleeve and the pump shaft [
2]. Due to the non-contact transmission adopted by the prime mover and working machine, the friction and vibration are greatly reduced compared with the traditional coupling connection, and it is more suitable for low-vibration occasions such as ships.
Water-lubricated bearings are bearings with water as the lubricating medium, which are widely used as important supporting parts in the shafting structure, and their role in simplifying the structure of marine pump units and shafting complexity is unparalleled [
3]. Water-lubricated bearings will cause an unstable lubrication state when the speed is low, resulting in abnormal vibration of the bearing. In the case of a large operating load, high rotational speed or insufficient lubricating water, the lubricating hydrodynamic film cannot be fully formed, resulting in self-excited vibration of the water-lubricated bearing. This kind of vibration will in turn affect the normal operation of the pump shaft and even the marine magnetic pump unit, causing hidden dangers to the operation of the marine magnetic pump shaft and the pump unit, threatening their normal operation [
4]. Therefore, it is of great theoretical value to explore the influence of water-lubricated bearings on the vibration of marine magnetic pumps.
In terms of the vibration characteristics of water-lubricated bearings, some scholars at home and abroad have carried out research, through experiments to study the vibration type and vibration frequency and other laws, or use dynamic equations to deduce its deformation and friction damping and other vibration forms. Daugherty [
5] studied the self-excited vibration of multi-slat-structure water-lubricated bearings. The conclusion showed that the self-excited vibration will aggravate the vibration of the shaft system and the entire unit. Huang et al. [
6] took the shaft-bearing system as the research object, studied its interaction behavior in detail, and proposed a vibration numerical model considering stick–slip friction. Peng et al. [
7] studied the vibration of the ship’s water-lubricated stern bearing shaft and bearing seat. By loading the bearing with different specific pressures and different speeds, the vibration frequency domain law was obtained, thereby judging the bearing vibration status. Jin et al. [
8] used empirical modal decomposition and the method of identifying the vibration characteristics of water-lubricated bearings to carry out experimental studies to visually demonstrate the variation law of vibration signal with friction. Bansal et al. [
9] conducted a study on the elastic deformation of the dynamic pressure sliding bearing, and theoretically calculated the bearing stiffness and damping coefficient under different eccentricities considering the elastic deformation. Guha et al. [
10] obtained a modified Reynolds equation using the finite difference method, and theoretically studied the influence of the dynamic characteristics of the finite hydrodynamic porous bearing with coupled stress fluid lubrication. Simpson et al. [
11] took the actual bearing dynamic model as the research object, established and analyzed a nonlinear two-degree-of-freedom model, and used the numerical calculation of the equation of motion to predict different vibration characteristics. Qin et al. [
12] studied the abnormal vibration and noise of the water-lubricated stern tube bearing due to friction and wear, and proved that the stick–slip mechanism was the fundamental cause of the friction and vibration of the water-lubricated stern tube bearing through experiments. Wang [
13] applied ABAQUS to numerically study the transient corresponding results of water-lubricated bearings under different external loads and concluded that the increase in load and rotational speed would aggravate the vibration of the bearing. In summary, the current research on water-lubricated bearings mainly focuses on the vibration signal characteristics and the mechanism of the vibration model caused by friction, and do not consider the relationship between the vibration characteristics of the output structure and the coupling of the bearing.
In the field of marine pump vibration research, there are many studies on the vibration law of ordinary marine pumps by domestic and foreign scholars, and most of them are centered on the vibration induced by hydraulic fluid factors, but there are few studies on the vibration of marine magnetic pumps caused by water-lubricated bearings. Wang [
14] used the transient fluid–structure interaction theory to conduct a transient analysis of the volute of a large double-suction centrifugal pump and studied the dynamic stress and vibration of the volute. The test showed that the pressure pulsation and the blade frequency vibration were significantly reduced after the optimization. Dai et al. [
15] studied the contribution of different excitation sources to the vibration of marine centrifugal pump units, and proposed that the order of contribution of different excitation sources to the vibration of marine centrifugal pump units were: fluid excitation on the inner surface of the pump > electromagnetic excitation > fluid in the impeller excitation. Dong-Myung Bae [
16] used the finite element method to analyze the vibration of the marine pump, compared it with the measured results, and proposed an improved method. Parszewski et al. [
17] conducted a rigid finite element analysis of the vibration of a marine feed pump, established a rotor system model supported by a multi-oil film bearing, and proposed two vibration reduction measures. Ji et al. [
18] applied coherent analysis theory to study the vibration of marine lubricating oil pumps and concluded that the vibration was mainly caused by the fluctuation of oil pressure. Burgerr et al. [
19] used the experimental method to study the problem of bearing sleeve damage caused by the misalignment of the rotor in the magnetic pump. The results showed that the misalignment of the rotor would cause severe vibration of the bearing in the pump. Zhao et al. [
20] calculated the influence of the gap between the volute and the impeller on the structural vibration of marine centrifugal pumps by acoustic analogy. Wang et al. [
21] used fluid–structure interaction and finite element methods to calculate the strength of the three-stage deep-sea mining mixed pump, and verified the safety and reliability of its structure. Liu et al. [
22] studied the effect of a floating raft vibration isolation system (FRIS) on the vibration characteristics of marine pumps. Sun et al. [
23] used CFD to calculate the internal flow field of the marine centrifugal pump as the excitation load, and established a fluid–structure interaction model to obtain its flow-induced vibration characteristics. To sum up, the current research on the vibration characteristics of marine pumps mainly focuses on the influence of the flow in the pump on the vibration characteristics of the pump structure, and the rotor system model of the multi-oil film bearing support system, and the vibration reduction, but the relationship between the vibration characteristics of the flow in the pump and the excitation coupling of the flow in the bearing gap is not considered.
Therefore, the influence of the structural parameters of water-lubricated bearings on the internal flow field of the magnetic pump in the low-frequency range (0–315 Hz) and the vibration characteristics of the water-lubricated bearing liquid film coupling under different flow rates are numerically studied, and the vibration of the pump under three flow rates is analyzed.
2. Method
2.1. Modeling and Meshing
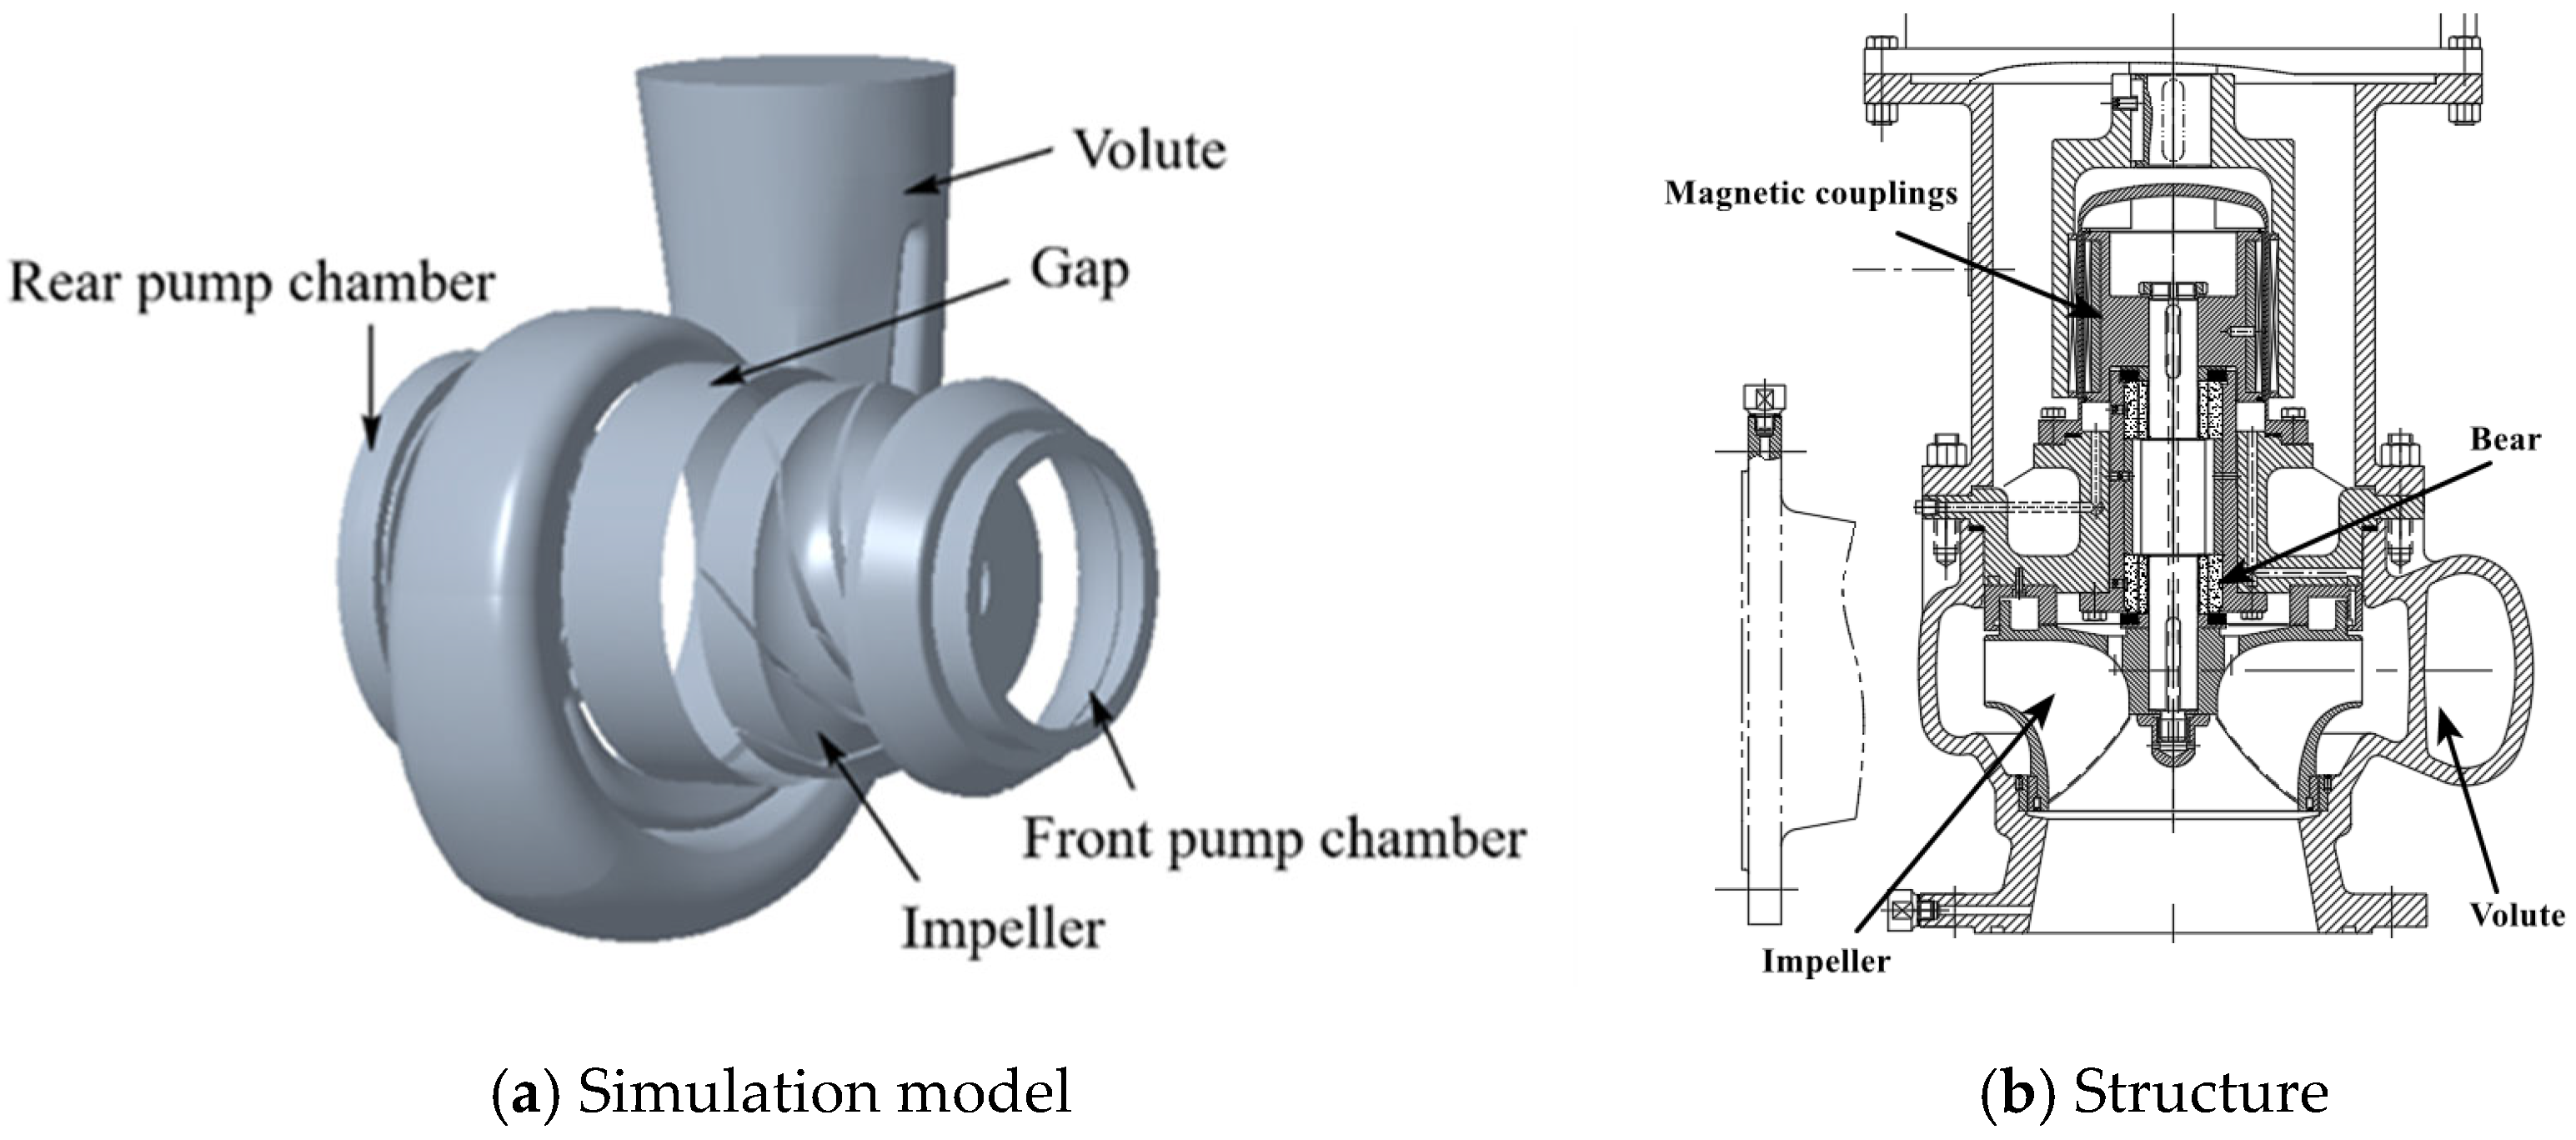
The research object of this study is a marine magnetic pump. Its design parameters are as follows: design flow rate
Qd is 550 m
3/h, head
H is 25 m, and the rotational speed
n is 1475 r/min. The blade number of impeller is 7 and the rotational frequency is 24.583 Hz. The full flow field water calculation domain of the marine magnetic pump includes the inlet extension, the impeller, the front, and rear pump chambers, the gap, the volute, and the outlet extension. The three-dimensional modeling of the water body in the full flow field calculated by the marine magnetic pump is shown in
Figure 1.
The fluid domain grids of each part of the marine magnetic pump are shown in
Figure 2. ICEM CFD (The Integrated Computer Engineering and Manufacturing code for Computational Fluid Dynamics) is a professional CAE preprocessing software. In this paper, based on ICEM CFD, the computational model of the water domain of the marine magnetic pump is meshed, and the unstructured hexahedral mesh is used. The grids of the bearing water film are shown in
Figure 3.
In order to avoid the accuracy error caused by the number of grids, the grid independence check was carried out for 5 different grid numbers. The grid independence check scheme is shown in
Table 1. Taking the head error within 3% as the standard, scheme 3 is selected for calculation in which the number of grids is 2,424,871, and the number of nodes is 2,041,943.
2.2. The Numerical Calculation Method
2.2.1. Fluid Control Equation
The description of fluid motion in fluid mechanics is achieved by establishing control equations based on the three laws of mass conservation, momentum theorem, and energy conservation. The continuity equation and N-S equation of incompressible fluid to describe three-dimensional turbulence in marine magnetic pumps were used.
N-S equations for incompressible fluids:
2.2.2. The Turbulence Model
The standard k-ε model is a classic turbulence model that has been widely applied and validated in simulation of centrifugal pump. It has a simple form, high computational efficiency, and is suitable for handling various engineering fluid dynamics problems. In order to verify its accuracy, external characteristic experiments were conducted on the marine magnetic pump, and the final numerical calculation error met the requirements. Therefore, it is believed that the standard k-ε model is suitable for calculating the three-dimensional turbulent flow field of marine magnetic pumps. This article adopts the standard k-ε turbulence model to numerically calculate the flow field of a marine magnetic pump.
The standard
k-
ε turbulence model assumes that the turbulent viscosity is isotropic, i.e., the ratio of Reynolds stress to deformation rate is the same in all directions. In the standard
k-ε turbulence model, the turbulent viscosity
μt is defined as:
where
Cμ is the empirical coefficient with a value of 0.09,
ε is the turbulent kinetic energy dissipation rate, and
k is the turbulent kinetic energy.
The constraint equation for turbulent kinetic energy dissipation rate
ε and the control equation for turbulent kinetic energy
k are as follows:
Pk is the pressure generation term caused by the velocity gradient, and its mathematical expression is as follows:
The parameters in the equation are empirical coefficients, where σk = 1, σε = 1.3, c1 = 1.44, and c2 = 1.92.
2.2.3. Boundary Conditions
The inlet boundary condition is set to the total pressure of 1 standard atmosphere; the outlet boundary condition is set to the mass flow rate, and the values under the five flow rates are 91.7 kg/s, 122.2 kg/s, 152.8 kg/s, 183.3 kg/s, and 213.9 kg/s. All walls are set to no-slip, and the Scalable function is selected for the walls.
2.2.4. Interface
In the steady calculation, the Frozen rotor interface is used, while in the unsteady calculation, the Transient rotor/stator interface is used, and the grid association adopts the GGI method. Generalized Grid Interface (GGI) is a method for coupling interface, used for joining multiple non-conformal regions where the patches nodes on each side of the interface do not match. The GGI is a common interface in the domain of CFD simulation of turbomachines. The inner surface of the front and rear pump chambers is the outer surface of the front and rear cover plates. The wall type is set as a rotating wall, and the rotational speed and direction are the same as the rotation direction of the impeller water body.
2.2.5. Solver Settings
Routine calculation settings: Select High Resolution for the advection scheme, First Order for the turbulence numerical item, 1000 maximum steps for the convergence control, automatic time step for the fluid time scale control. The convergence criterion type is RMS (residual), and the residual target is set to 10−4.
Unsteady Computing Settings: The total time is 0.24408 s, and the time step Δt is set to 0.000226 s. The iterative calculation is performed every 2° of impeller rotation, and the calculation result of the flow field is obtained once. The impeller rotates 6 times in total. When the flow field shows obvious periodicity and the periodic change is stable, the data of the last four rotation periods are extracted to analyze the unsteady calculation results.
2.2.6. Bearing Water Film Setting
In the setting of water film calculation, since the radial and axial scales are relatively large, and the RNG k-ε model can well reflect the influence of the flow in the near-wall boundary layer on the turbulent field, the RNG k-ε model is selected as the turbulent flow model. According to the calculation results of the pump flow field, the inlet pressure of the water film is set to 0.15 MPa, and the outlet pressure is 0.1 MPa. The inner surface of the water film is set as a rotating wall, the outer surface is set as a static wall, and the wall type is set as a non-slip surface. Due to the small radial thickness and large curvature of the water film, and considering the wall effect of the flow, the Enhance Wall Function is used.
2.3. Pump Structure
The three-dimensional model of the overall structure of the marine magnetic pump is established by using Creo, including the motor, the coupling frame, the pump cover, the pump body, and the common base. The mesh of the overall structure of the marine magnetic pump is divided into an adaptive mesh by the mesh module of Ansys Workbench, and the surface with complex curvature is refined. The 3D modeling and meshing are shown in
Figure 4.
Table 2 shows the materials and parameters of the main components of the pump.
2.4. Modal Analysis
To understand the various order modes and natural frequencies of the marine magnetic pump structure, the modal calculation of the marine magnetic pump is carried out first.
This marine magnetic pump is a vertical pump, the radial direction is X, Y direction, and the axial direction is the Z direction. According to the actual installation and operation of the marine magnetic pump, the flange connection of the pump inlet and outlet is not a fixed connection, and only the bolt holes of the common base are fixed. Fixed constraint B is set at all bolt holes of the common base. The gravitational acceleration of 9806.6 mm/s2 is applied to the marine magnetic pump as a whole, and the direction is along negative Z-axis. The modal calculation is carried out under this constraint condition, and the modes and natural frequencies of each order of the pump body are obtained.
2.5. Transient Dynamic Analysis
First, the transient dynamics calculation of the rotor system is performed.
Figure 5 shows the structure, grids and constraints of the rotor system. Gravitational acceleration is applied to the entire rotor system, and fixed constraints are imposed on the shaft end away from the impeller. The face-to-face contact form of the shaft and the bushing is used, the shaft is the master face, the bearing is the slave face, and the friction setting is system control. The outer surface of the bearing and the inner surface of the bearing housing are defined as two faces of the cylindrical constraint. The water film pressure field data of the water-lubricated bearing is loaded into the bearing gap through fluid–structure coupling. The unsteady calculated radial force data are applied to the impeller center of mass to simulate the actual load of the pump operation. Apply a rotational speed of 1475 r/min to the impeller, pump shaft and shaft sleeve. The solver solution type is controlled by the system. The time step is consistent with the unsteady computation, Δ
t is 0.000226 s, and the total calculation time is 0.24408 s.
Based on the vibration calculation results of the bearing rotor, the extracted vibration velocity at the bearing seat is loaded on the bearing seat of the pump body, and the calculation is carried out to obtain the time domain information of the vibration velocity of each measuring point. And the Fourier transform is carried out to obtain the vibration frequency domain information of each measuring point of the pump, to determine the trend and law of vibration, and then to explore the influence of different bearing clearances, the bearing eccentricity, and bearing length–diameter ratio on the pump vibration. The bearing eccentricity is the ratio of bearing eccentric distance to bearing diameter clearance.
In order to intuitively show the law of vibration change and characterize the vibration level, the concept of vibration velocity level is introduced. The vibration velocity values of the three measuring points of the marine magnetic pump are transformed into vibration velocity grades (dB), and the transformation formula is:
where
v is the vibration velocity at each measuring point, and
v0 is the reference vibration velocity, which is 1 × 10
−6 mm/s.
Using the vibration velocity level processing method, the vibration velocity level of each measuring point of the pump is obtained. By comparing the vibration velocity level, it is convenient to judge the vibration level of the marine magnetic pump.
Three measuring points are set on the pump. M1 is set at the inlet flange, M2 is set at the outlet flange, and M3 is located in the common base.
To accurately apply the excitation load to the marine magnetic pump, the calculation step and time setting of the pump dynamics calculation are consistent with the time step setting of the rotor component vibration calculation.
Figure 6 shows the constraints of the marine pump and the location of each measuring point.
3. Results and Analysis
3.1. External Characteristics
Figure 7 shows the external characteristic curve of the numerical calculation and experiment. It can be seen from
Figure 7 that under 1.0
Qd, the calculated head is 24.97 m, and the error is 2.3%. The efficiency by the numerical calculation is 77.2%, and the error is 2.8%. The calculation error of the head under 0.8
Qd is 2.8%, and the error under 1.2
Qd is 3.4%. The deviations of the calculated and experimental results of the head and efficiency under 0.6
Qd and 1.4
Qd are all less than 5%. From an error line of the figure, it can be seen that the head data are within the error line except for 1.4
Qd, while centrifugal pumps are prone to generating a large amount of vortex and flow distortion under high flow conditions. Due to the complex geometric shape and cross-sectional flow changes in centrifugal pumps, these vortices and flow distortions may cause slight deviations between simulation results and experimental results. However, due to the failure to consider mechanical friction loss in numerical calculations, the simulation results were consistently higher than the experimental results. The efficiency results showed a consistent trend with the flow rate, and the error remained within a small range. Therefore, it is believed that the numerical calculation method is reliable.
3.2. Internal Flow
Figure 8 shows the comparison of the results of theoretical analysis and numerical calculation of the velocity vector inside the impeller under the design flow rate.
Figure 8a shows the distribution of velocity vectors in the flow channel between any two blades at the same radius in theoretical analysis. It shows that under the same radius, the velocity near the back of the blade is larger, while the velocity near the pressure surface is smaller. The velocity in the flow channel changes uniformly, and the direction changes with the shape of the blade.
Figure 8b shows the velocity vector distribution in the middle section of the impeller in CFD, and its overall distribution is consistent with the trend in theoretical analysis, which to some extent verifies the accuracy of numerical calculations. Due to the change in the flow rate, the flow trend inside the pump changes, making it difficult to obtain its change pattern through theoretical analysis. Therefore, different flow rates were selected as the boundary conditions for numerical calculation to explore the internal flow change pattern under non-design flow rates.
Figure 9 shows the relative flow velocity distribution inside the impeller of the marine magnetic pump under 0.6
Qd, 0.8
Qd, 1.0
Qd, 1.2
Qd, and 1.4
Qd. From
Figure 9, it can be seen that the relative velocity distribution pattern is similar from 0.6
Qd to 1.4
Qd. The relative velocity of fluid flow at the inlet of the impeller is relatively small, and the relative velocity increases uniformly from the inlet of the pressure surface of the blade to the outlet of the pressure surface of the blade. The relative velocity increment of the pressure surface is greater than that of the back, and the relative velocity gradient from the back of the blade to the pressure surface gradually decreases. As the flow rate increases, the velocity at the outlet of the impeller increases more regularly. The areas with low relative velocity gradually become smaller, while the areas with high relative velocity gradually increase. Under low flow rates, the flow velocity in the flow channel between any two blades is relatively low. It is worth noting that there is a certain degree of backflow impact on the blades at the outlet edge of the blades. This is because the flow rate under operating conditions is less than the design value, and the flow rate inside the impeller is insufficient to support smooth fluid discharge, which exacerbates the vibration of the entire pump structure under low flow rates. Under larger flow rates, due to the flow rate exceeding the design value under operating conditions, when the fluid enters the blade area, the fluid flow angle is greater than the inlet edge attack angle, resulting in an impact on the back of the blade when the fluid enters the flow channel between any two blades, which to some extent intensifies the structural vibration of the entire pump under larger flow rates.
3.3. Modal Calculation
Figure 10 shows the contours of the first eight order modes. It can be seen from
Figure 10 that the maximum deformation of each order mode of the pump increases first, then decreases, and then increases. Compared with the third order, the modal deformation first decreases slightly, then monotonically increases to the seventh order, and then decreases again in the eighth order. Except for the sixth order mode, the maximum deformation in other modes occurs at the outlet flange. However, in the sixth mode, the maximum deformation is at the inlet flange of the pump. Since the base of the pump is fixed, the smallest deformation in each mode occurs at the base of the pump. In the first eight modes, the maximum deformation is 6.554 mm, which occurs on the outlet flange of the third mode, while in the sixth mode, the largest deformation at the inlet flange is 4.1136 mm. In each order mode, the deformation variables in most regions are concentrated within 2 mm, and the positions with larger deformation variables are concentrated and occupy only a very small area, indicating that the overall anti-vibration performance of the marine magnetic pump is good.
Figure 11 is the frequency distribution diagram corresponding to each order mode of the marine magnetic pump. As can be seen from the figure, the modes within the first 1000 Hz of the pump body have a total of 17 orders, and the first order modal frequency is 179.5 Hz, which is higher than the blade frequency (172.2 Hz). Therefore, it can be considered that the mode of the pump is less affected by the hydraulics, that is, the possibility of the hydraulics inducing the resonance of the entire pump is avoided.
3.4. Vibration Velocity under Different Bearing Clearances
Figure 12,
Figure 13 and
Figure 14 show the vibration velocities of each measuring point under different bearing clearances under 0.8
Qd, 1.0
Qd, and 1.2
Qd. It can be seen from the figure that when the flow rate increases from the low flow rate to the larger flow rate, the peak value of the vibration velocity at the same measuring point decreases. Compared with the larger flow rate, the radial force loaded on the bearing and the rotor when the pump is running under the low flow rate is larger, which leads to the deterioration of the rotational stability of the rotor and the bearing, which in turn increases the vibration of the bearing. Therefore, the pump is subjected to a relatively larger vibration excitation load from the bearing, increasing the peak value of vibration velocity at each measuring point of the pump.
Under different flow rates, the characteristic frequencies of each measuring point of the pump body with bearing clearances of 0.08 mm, 0.09 mm, and 0.1 mm all appear at 3APF, and the peak values of other vibration velocity are at the shaft frequency and each multiplier, and at each measuring point, the peak value of the vibration velocity in the X direction is the largest. The vibration law of the measuring point in the Y direction and the Z direction is similar to the law in the X direction. As the bearing clearance increases from 0.08 mm to 0.1 mm, the peak value of vibration velocity at each measuring point increases gradually.
This may be that when the bearing clearance increases, the vibration excitation load transmitted by the bearing to the pump becomes larger so that the excited vibration response of the pump is larger. Among the three measuring points, the peak value of the vibration velocity at M2 is the largest, while the peak value of the vibration velocity at M3 is the smallest. This is because M1 and M2 are closer to the bearing excitation source, so the vibration is relatively large, M3 is relatively far away from the excitation source, and the common base is fixed, so the vibration is relatively small.
It can also be seen from
Figure 12,
Figure 13 and
Figure 14 that under the design flow rates, with the increase in bearing clearance, M2 has the largest increase in the peak value of vibration velocity among the three measuring points, which is increased by 4 mm/s. The smallest is M3, which is increased by 0.023 mm/s. When the bearing clearances are 0.08 mm, 0.09 mm, and 0.1 mm, the peak values of vibration velocity at M1 are 6.4 mm/s, 9.5 mm/s, and 10.5 mm/s, the peak values of vibration velocity at M2 are 9.6 mm/s, 10.9 mm/s, 13.6 mm/s, and’ peak values of vibration velocity at the base are 0.129 mm/s, 0.142 mm/s, 0.152 mm/s.
As the flow rate increases from 0.8 Qd to 1.2 Qd, when the bearing clearance is 0.08 mm, the peak values of vibration velocity at M1 decreases from 7.7 mm/s to 5.4 mm/s, the peak values of vibration velocity at M2 is reduced from 10.4 mm/s to 7.9 mm/s, and the peak values of vibration velocity at M3 is reduced from 0.136 mm/s to 0.124 mm/s. When the bearing clearance is 0.09 mm, the peak value of vibration velocity at M1 is reduced from 10.2 mm/s to 7.3 mm/s, while the peak value of vibration velocity at M2 is reduced from 11.3 mm/s to 9.2 mm/s, and the peak value of vibration velocity at M3 is reduced from 0.166 mm/s to 0.143 mm/s. When the bearing clearance is 0.1 mm, the peak value of vibration velocity at M1 is reduced from 11.2 mm/s to 8.3 mm/s, the peak value of vibration velocity at M2 is reduced from 12.5 mm/s to 10.3 mm/s, and the peak value of vibration velocity at M3 is reduced from 0.178 mm/s to 0.147 mm/s.
Figure 15 shows a comparison diagram of the vibration velocity level of each measuring point under different bearing clearances under three different flow rates. It can be seen from the figure that with the gradual increase in the flow rate, the vibration velocity level at the same measuring point decreases. The influence laws of different bearing clearances on the vibration at each measuring point under three different flow rates are M3 < M1 < M2, and as the bearing clearance increases, the vibration velocity level at each measuring point increases gradually.
In terms of under the design flow rate, the bearing clearance is increased from 0.08 mm to 0.1 mm, and the vibration velocity level of measuring point M1 is increased from 135.9 dB to 142.1 dB, an increase of 6.2 dB. The vibration velocity level of M2 increased from 137.6 dB to 143.7 dB, an increase of 6.1 dB. The vibration velocity level of M3 increased from 102.3 dB to 104.2 dB, an increase of 1.9 dB.
It can also be seen from
Figure 15 that when the flow rate increases from 0.8
Qd to 1.2
Qd, when the bearing clearance is 0.08 mm, the vibration velocity level of M1 decreases from 137.5 dB to 134.4 dB, a decrease of 3.1 dB. The vibration velocity level of M2 is reduced from 140.2 dB to 137.9 dB, a reduction of 2.3 dB. The vibration velocity level of M3 is reduced from 103.3 dB to 101.2 dB, a reduction of 2.1 dB. When the bearing clearance is 0.09 mm, the vibration velocity level of M1 is reduced from 140.1 dB to 136.9 dB, a decrease of 3.2 dB. The vibration velocity level of M2 is reduced from 142.3 dB to 139.3 dB, a decrease of 3 dB. The vibration velocity level of M3 is reduced from 104.4 dB to 102.9 dB, a decrease of 1.5 dB. When the bearing clearance is 0.1 mm, the vibration velocity level of M1 is reduced from 141.6 dB to 138.4 dB, a decrease of 3.2 dB. The vibration velocity level of M2 is reduced from 143.4 dB to 141.6 dB, a decrease of 1.8 dB. The vibration velocity level of M3 is reduced from 105.6 dB to 103.4 dB, a decrease of 2.2 dB.
3.5. Vibration Velocity under Different Bearing Eccentricities
Figure 16,
Figure 17 and
Figure 18 show the vibration velocities of each measuring point under different bearing eccentricities under three flow rates. It can be seen from the figure that with the increase in the flow rate, the vibration velocity peak of the same measuring point gradually decreases. Under different flow rates, when the bearing eccentricity is 0.4, 0.5, and 0.6, the characteristic frequency of each measuring point appears at 3APF, and the peak values of other vibration velocity are at the shaft frequency and each multiplier. And the peak value of the vibration velocity in the X direction is the largest, the vibration law of the measuring point in the Y direction and the Z direction is similar to the law in the X direction. As the bearing eccentricity increases from 0.4 to 0.6, the peak value of vibration velocity at each measuring point gradually increases. The peak value of the vibration velocity at M2 is the largest, and the peak value of the vibration velocity at M3 is the smallest.
When the bearing eccentricity is 0.4, 0.5, and 0.6, the peak value of main frequency of vibration velocity at M1 are 6.4 mm/s, 7.6 mm/s, and 8.5 m/s, respectively. The peak value of main frequency of vibration velocity at M2 are 9.6 mm/s, 10.5 mm/s, 11.3 mm/s, respectively, and the peak value of vibration velocity at M3 are 0.129 mm/s, 0.134 mm/s, 0.158 mm/s.
With the increase in the bearing eccentricity, the peak value of vibration velocity at M1 shows a significant increase by 2.1 mm/s, and the increase in peak value of vibration velocity at M3 is the smallest, which is 0.029 mm/s.
It can also be seen from
Figure 16,
Figure 17 and
Figure 18 that with the increase in the flow rate, when the bearing eccentricity is 0.4, the peak value of vibration velocity at M1 decreases from 7.7 mm/s to 5.4 mm/s. The peak value of vibration velocity at M2 is reduced from 10.4 mm/s to 7.9 mm/s. The peak value of vibration velocity at M3 is reduced from 0.136 mm/s to 0.124 mm/s. When the bearing eccentricity is 0.5, the peak value of vibration velocity at M1 is reduced from 10.2 mm/s to 7.3 mm/s. The peak value of vibration velocity at M2 is reduced from 11.2 mm/s to 9.3 mm/s. The peak value of vibration velocity at M3 is reduced from 0.157 mm/s to 0.131 mm/s. When the bearing eccentricity is 0.6, the peak value of vibration velocity at M1 is reduced from 9.7 mm/s to 7.8 mm/s. The peak value of vibration velocity at M2 is reduced from 11.8 mm/s to 10.4 mm/s. The peak value of vibration velocity at M3 is reduced from 0.168 mm/s to 0.144 mm/s.
Figure 19 is a comparison diagram of the vibration velocity level of each measuring point for different bearing eccentricities under three flow rates. It can be seen from the figure that with the gradual increase in the flow rate, the vibration velocity level of the same measuring point decreases. The influence rules of different bearing eccentricities on the vibration of different parts of the pump under the three flow rates are M3 < M1 < M2, and with the increase in the bearing eccentricity, the vibration velocity level value of each measuring point increases gradually. This is because the structure at the foundation is better constrained, resulting in the lowest vibration velocity. The flow at the pump inlet is more uniform, which has less flow excitation on the pump body. However, after the pump outlet works through the impeller, the flow is more turbulent, so the vibration velocity level is significantly higher than other measurement points.
Under the design flow rate, the bearing eccentricity increases from 0.4 to 0.6, and the vibration velocity level of M1 increases from 135.9 dB to 138.8 dB, an increase of 2.9 dB. The vibration velocity level of M2 was increased from 139.6 dB to 141.9 dB, an increase of 2.3 dB. The vibration velocity level of M3 was increased from 102.3 dB to 104.6 dB, an increase of 2.3 dB. This indicates that an increase in the bearing eccentricity to some extent increases flow instability, which in turn affects the vibration velocity of the pump body.
It can also be analyzed from
Figure 19 that as the flow rate increases from 0.8
Qd to 1.2
Qd when the bearing eccentricity is 0.4, the vibration velocity level of M1 decreases from 137.5 dB to 134.4 dB, a decrease of 3.1 dB. The vibration velocity level of M2 is reduced from 140.2 dB to 137.9 dB, a decrease of 2.3 dB. The vibration velocity level of M3 is reduced from 103.3 dB to 101.2 dB, a decrease of 2.1 dB. When the bearing eccentricity is 0.5, the vibration velocity level of the measuring point M1 is reduced from 138.7 dB to 136.6 dB, a reduction of 2.1 dB. The vibration velocity level of M2 was reduced from 141.1 dB to 139.3 dB, a decrease of 1.8 dB. The vibration velocity level of M3 was reduced from 105.1 dB to 102.5 dB, a decrease of 2.6 dB. When the bearing eccentricity is 0.6, the vibration velocity level of M1 is reduced from 139.7 dB to 137.7 dB, a decrease of 2 dB. The vibration velocity level of M2 was reduced from 142.6 dB to 142.3 dB, a reduction of 0.3 dB. The vibration velocity level of M3 was reduced from 105.9 dB to 103.5 dB, a reduction of 2.4 dB.
In traditional experience, when a centrifugal pump operates at low or larger flow rates, the flow in the pump is more turbulent, so the excitation effect of the flow field in the pump on the vibration of the pump body will be stronger. However, considering the coupling between the flow in the pump and the bearing liquid film, a decrease in the vibration velocity level actually occurs under larger flow rates. This is because water-lubricated bearings have more stable liquid film pressure and lower vibration velocity levels under larger flow rates, The effect of flow inside the pump on the vibration of the pump body was offset, resulting in a decrease in the overall vibration level.
3.6. Vibration Velocity under Different Bearing Length–Diameter Ratios
Figure 20,
Figure 21 and
Figure 22 show the vibration velocities at each measuring point of the pump under different bearing length–diameter ratios. It can be seen from the figure that as the flow rate increases, the peak value of vibration velocity at the same measuring point decreases. Under the three flow rates, the characteristic frequencies of each measuring point of the pump body under different bearing length–diameter ratios appear at 3APF, and the frequencies of other vibration velocities are at the shaft frequency and each multiplier. And each measuring point has the largest peak value of vibration velocity in the X direction, and the vibration law of the measuring point in the Y and Z directions is similar to the X direction. As the length–diameter ratio of the bearing increases from 0.8 to 1.2, the peak value of vibration velocity at each measuring point is gradually decreasing. Among the three measuring points, the peak value of vibration velocity at M2 is the largest, and the peak value of vibration velocity at M3 is the smallest.
It can also be seen from
Figure 20,
Figure 21 and
Figure 22 that under the design flow rate, when the bearing length–diameter ratio is 0.8, 1.0, and 1.2, the peak value of vibration velocity at M1 are 7.9 mm/s, 6.2 mm/s, 5.2 mm/s. The peak value of vibration velocity at M2 are 10.5 mm/s, 9.4 mm/s, 8.6 mm/s, and the peak value of vibration velocity at M3 are 0.152 m/s, 0.132 mm/s, 0.11 mm/s. As the length–diameter ratio of the bearing increases, among the three measuring points, the peak value of vibration velocity at M1 decreases the most, by 2.7 mm/s. The peak value of vibration velocity at M3 decreases the least, which is reduced by 0.042 mm/s.
As the flow rate increases from 0.8 Qd to 1.2 Qd, when the bearing aspect ratio is 0.8, the peak value of vibration velocity at M1 decreases from 9.1 mm/s to 7.2 mm/s, the peak value of vibration velocity at M2 is reduced from 10.3 mm/s to 8.6 mm/s, while the peak value of vibration velocity at M3 is reduced from 0.189 mm/s to 0.143 mm/s. When the bearing length–diameter ratio is 1.0, the peak value of vibration velocity at M1 is reduced from 7.7 mm/s to 5.4 mm/s, the peak value of vibration velocity at M2 is reduced from 10.4 mm/s to 7.9 mm/s, and the peak value of vibration velocity at M3 is reduced from 0.136 mm/s to 0.124 mm/s. When the length–diameter ratio of the bearing is 1.2, the peak value of vibration velocity at M1 is reduced from 6.7 mm/s to 4.8 mm/s, the peak value of vibration velocity at M2 is reduced from 9.8 mm/s to 7.3 mm/s, and the peak value of vibration velocity at M3 is reduced from 0.111 mm/s to 0.098 mm/s.
These trends to some extent verify the trend of better bearing performance and lower vibration velocity level of the pump body, and the characteristic frequencies of each measurement point of the pump body appear at 3APF, which can also be used as the main judgment phenomenon for the operating status of water-lubricated bearings.
Figure 23 shows a comparison diagram of the vibration velocity level of the pump with different bearing length–diameter ratios under three flow rates. It can be seen from the figure that under the same flow rate, the numerical law of the vibration velocity level at each measuring point of the pump under different bearing length–diameter ratios is M3 < M1 < M2.
As the length–diameter ratio of the bearing increases, the vibration velocity grade of each measuring point gradually decreases. When the flow rate increases from 0.8 Qd to 1.2 Qd, the vibration velocity grade at each measuring point shows a decreasing trend. Under the design flow rate, the bearing length–diameter ratio is increased from 0.8 to 1.2, and the vibration velocity level of M1 is reduced from 138.1 dB to 134.1 dB, a decrease of 4 dB. The vibration velocity level of M2 is reduced from 140.9 dB to 138.3 dB, a decrease of 2.3 dB. The vibration velocity level of M3 is reduced from 103.5 dB to 100.7 dB, a decrease of 2.9 dB.
It can also be seen from
Figure 23 that as the flow rate increases from 0.8
Qd to 1.2
Qd when the bearing aspect ratio is 0.8, the vibration velocity level of M1 decreases from 139.1 dB to 137.1 dB, a decrease of 2 dB. The vibration velocity level of M2 is reduced from 141.8 dB to 138.9 dB, a decrease of 2.9 dB. The vibration velocity level of M3 is reduced from 105.6 dB to 102.9 dB, a decrease of 2.7 dB. When the bearing length–diameter ratio is 1.0, the vibration velocity level of M1 is reduced from 137.5 dB to 134.4 dB, a reduction of 3.1 dB. The vibration velocity level of M2 is reduced from 140.2 dB to 137.9 dB, a decrease of 2.3 dB. The vibration velocity level of M3 is reduced from 103.3 dB to 101.2 dB, a decrease of 2.1 dB. When the bearing length–diameter ratio is 1.2, the vibration velocity level of M1 is reduced from 136.1 dB to 133.1 dB, a decrease of 3 dB. The vibration velocity level of M2 is reduced from 139.1 dB to 136.2 dB, a decrease of 2.9 dB. The vibration velocity level of M3 is reduced from 101.6 dB to 99.6 dB, a decrease of 2 dB. It has also been verified that water-lubricated bearings have more stable liquid film pressure and lower vibration velocity levels under larger flow rates, reducing the overall vibration velocity level.


