Article

Collaborative Watershed Modeling as Stakeholder Engagement Tool for Science-Based Water Policy Assessment in São Paulo, Brazil

1
The National Socio-Environmental Synthesis Center, University of Maryland, Annapolis, MD 21401, USA
2
US Geological Survey, Water Resources Mission Area, Reston, VA 20192, USA
3
The Nature Conservancy, Global Office, Arlington, VA 22203, USA
*
Author to whom correspondence should be addressed.
Water 2023, 15(3), 401; https://doi.org/10.3390/w15030401
Submission received: 6 December 2022 / Revised: 6 January 2023 / Accepted: 11 January 2023 / Published: 18 January 2023
(This article belongs to the Section Water Resources Management, Policy and Governance)

Abstract

:
This study describes a collaborative modeling process deployed at the Cantareira Water Supply System (CWSS) in São Paulo City Metropolitan Area, Brazil. The CWSS faces challenges for meeting the increasing water demand, while land-use and climate change and their combined effect on its water cycle and balance have created a complex water resources management problem. Through a stakeholder engagement process—involving scientists and policymakers, the water utility company, and state administration—environmental simulation models were developed to elicit and represent multiple environmental, economic, and policy perspectives, developing a mutual language to communicate and establish common goals of water resources management. Study outputs include estimation of biophysical and economic benefits associated with prioritized native vegetation restoration activities in the source watersheds. These outputs are deployed in support of landscape planning and the decision process integrating multiple stakeholder perspectives in São Paulo state administration, the water utility company, and municipalities.

1. Introduction

The latest Intergovernmental Panel on Climate Change (IPCC) report demonstrates the urgency for effective decision-making and funding over the next decade to build climate resiliency given the extent and magnitude of the observed climate change impacts and projected risks [1]. As climate extremes become more frequent, with greater intensity and magnitude, stress on water resources is intensifying, with new challenges for sustainable development [2]. According to United Nations Educational, Scientific and Cultural Organization (UNESCO), sustainable water resource systems are those designed and managed to fully contribute to the objectives of society, now and in the future, while maintaining their ecological, environmental, and hydrological integrity [3]. Therefore, to build a more resilient and sustainable future, it is critical to (1) build capacity within our institutions to respond to increasing droughts, floods, and other climate extremes and (2) create an institutional framework that considers the complexity and details of cross-scale interactions in the human–environment system.
In this paper, we describe a stakeholder engagement and collaborative modeling process in the context of water resources management with climate extremes in order to develop an institutional framework toward a resilient future. The case study is conducted in São Paulo City Metropolitan Area’s water supply system, which provides water to nearly 9 million people, and where recent extreme drought events revealed the system’s vulnerability and risks of water scarcity, with considerable socioeconomic and environmental impacts in the region.
The challenges of meeting human development needs, while protecting the natural system and its functional ecosystems, require both scientific and sociopolitical perspectives. Historically, the boundary between scientific and sociopolitical components has set them apart; however, it has shown that “boundary work” can close the gap between scientific and sociopolitical dimensions [4,5]. Environmental simulation models and the model-building process operate as “boundary work,” integrating various institutional and scientific knowledge and objectives. We demonstrate that landscape simulation models in the science–policy interface can elicit and represent multiple perspectives of the participants, and, through this collaborative model building process, scientists and policymakers may develop mutual language to communicate and establish common water resources management goals.

2. Method

In this section, we present the study site, the objectives of the collaborative modelling process, and the stakeholder engagement process in detail. Conservation scenarios with nature-based solutions (NbSs) developed through this process are outlined, and, to provide context for the stakeholder-engagement process, overviews of the synthesis landscape modeling strategy and economic analysis are presented. For more details on landscape models and economic analysis, refer to Acosta et al. [6] and Ciasca et al. [7], respectively.

2.1. Study Site

São Paulo City Metropolitan Area water supply system, Cantareira Water Supply System (CWSS), is located between Sao Paulo and Minas Gerais States in Brazil, making up 2200 km2 of source watersheds with four interconnected reservoirs (Jaguari–Jacarei, Cachoeira, Antibainha, and Paiva Castro reservoirs in Figure 1). CWSS supplies water for about 47% of the Sao Paulo Metropolitan area.
CWSS is located within the neotropical Atlantic Forest of the Serra do Mar biogeographical subregion, and only 11–16% of the Atlantic Forest remains in the study region [8]. Deforestation affects microclimate, ecohydrology, and water balance, which can lead to direct and indirect implications for water resources management downstream [8,9]. As a result, most of the forest is increasingly fragmented, leading to a cascade of environmental and ecological vulnerability. Atlantic Forest biome is also home to more than 125 million Brazilians, with some of the largest urban centers in South America, and it is one of the economic engines of Brazil, contributing 70% of the gross domestic product (GDP) and 2/3 of the industrial economy [10].
The CWSS faces challenges of meeting increasing water demand, while land-use and climate change and their effects on its water cycle, mass balance, and river and groundwater regimes have contributed to complexity of water resources management. For example, the extreme drought event that Brazilian Southeast region experienced in 2013–2015 significantly impacted the CWSS, where the main reservoirs reached below 5% of their 1.3 billion m3 capacity and Sao Paulo Metropolitan area faced a severe water crisis [11,12]. Multiple culminating factors led to this extreme water shortage condition; among them are deforestation and land-use/land-cover (LULC) changes that have long curtailed hydrological services to regulate water balance and quality [9] (e.g., Appendix A shows that the landscape’s capacity to store water has declined in recent decades with corresponding LULC changes), and insufficient drought response and water governance that further contributed to the severity of the water crisis [13]. An effective watershed management strategy is needed in the study region to prevent further degradation of water resources and related ecosystem services [14], especially when climate change and economic and population growths have exacerbated the impacts on water availability [11,15].
While multiple water crisis factors are important in consideration of a comprehensive water resources management policy, this study focuses on landscape management with forest conservation and restoration strategies. The main objective in the study site is to investigate the hydrologic impact of various conservation scenarios in order to (1) prioritize deployment of new conservation resources in the CWSS, including funding provided via water tariff; (2) help to coordinate deployment of existing landscape conservation policies in the CWSS; and (3) motivate additional funding to achieve catchment-wide restoration objectives.

2.2. Collaborative Modeling Process Overview

Stakeholder engagement and collaborative modeling were conducted in an iterative process to consider relevant and emerging knowledge of watershed processes to inform policy decisions (Figure 2). Through development of landscape simulation models, scientific data were integrated into policy analysis to consider both historical trends and current water conditions to make predictions of various future scenarios. Section 2.2.1 describes the stakeholder participants and engagement process, including the timeline, activities, tools, and models used. Section 2.2.2 presents the conservation scenarios defined given the stakeholder inputs, existing conservation policy framework, and environmental data. Section 2.2.3 describes main hydrologic simulation model used to evaluate those conservation scenarios. Section 2.2.4 describes multiple environmental data, models, and stakeholder inputs synthesized into a decision support system. Finally, Section 2.2.5 summarizes economic analyses of extreme drought and values of conservation scenarios evaluated by the decision support system.

2.2.1. Stakeholder Engagement

Stakeholders were engaged throughout the project (Figure 3) to direct the overall modeling framework, select intervention options and landscape management scenarios, and interpret and provide policy/decision-making perspectives on model simulation outputs. The main stakeholder is the São Paulo State Water Utility (Companhia de Saneamento Básico do Estado de São Paulo/SABESP), and the São Paulo State Public Services Regulatory Agency (ARSESP). SABESP was engaged on hydrological modeling and ARSESP on economic assessments and development of innovative economic instruments. TNC’s field experience has been deployed in estimation of NbS implementation costs. Other less imperative stakeholders have also taken part in different elements of the planning and discussion process, as is the case of the Piracicaba–Capivarí–Jundiaí (PCJ) Watershed Committee and local organizations. Stakeholder engagement process is described in detail at key consecutive meetings and workshops below:
Stakeholder Meeting 1
This meeting in August 2019 consisted of high-level managers and decision-makers of SABESP, ARSESP, and PCJ Watershed Committee. In this initial scoping meeting, we defined the project’s overall goal of mainstreaming NbS to sustainably manage water resources and build watershed resiliency to climate change.
At this early stage, we presented the potential path toward collaborative modeling to evaluate NbS impact on watershed hydrology. Using a reduced-complexity water-balance model, we demonstrated example functionalities of landscape simulation models as a component of a desired decision support system for landscape and water resources management (Appendix B). The reduced-complexity model was designed to facilitate stakeholder understanding about landscape modeling framework and types, determining appropriate model complexity, and data and parameter requirements that would correspond to conservation and management decision analysis goals.
The first stakeholder meeting was also an opportunity for scientists to learn about specific environmental, economic, and social dimensions of water resources management challenges from stakeholders. At the end of this stage, stakeholders agreed to share their existing modeling capabilities and the databases and monitoring efforts that are relevant to the collaborative modeling process. SABESP provided existing process-based water balance model used in their routine reservoir operation and management, which served as the foundation for the hydrological simulation modeling effort as described below.
Technical Workshop 1
We worked with SABESP’s engineering team, which had already developed and operated an existing water balance model, the Hydrologic Engineering Center-Hydrologic Modeling System (HEC-HMS). As this model was originally set up to run event-hydrological responses at each of the four reservoirs of the CWSS, we worked on conversion of the existing event-based HEC-HMS into a long-term hydrological simulation model while retaining the overall model structure. This adaptation was necessary to adjust the existing model to define the conservation simulation algorithm for evaluating the long-term hydrologic impact of various conservation scenarios. To test the functionality of the HEC-HMS model, we developed a set of preliminary landscape management scenarios as described in Section 2.2.2.
The model exchange guided selection of specific landscape data and simulation model(s) to be deployed in the subsequent steps of the project. Ultimately, through an iterative process, we synthesized four environmental simulation models (RIOS, FIESTA, HEC-HMS, and SWAT) to estimate potential hydrologic outputs resulting from the landscape management scenarios as described in Section 2.2.3.
Stakeholder Meeting 2
The model development status and preliminary model outputs were shared with the larger stakeholder group, including the technical representatives and administrators in April 2020. We communicated the progress made in our collaborative modeling effort, including modification of SABESP’s existing water balance model and synthesis of additional models to simulate both water quantity and quality effects of various NbS allocation scenarios as described in Section 2.2.4. Using the preliminary model outputs, including expected water quantity benefits, we solicited from the stakeholders: (1) additional model input and data needs, including observational data, reservoir operation rules to define water quantity thresholds for extreme events, and costs associated with managing water quantity and quality; (2) further information to develop more realistic and feasible landscape management scenarios to reflect not only the geophysical conditions but also economic, social, and policy frameworks; and (3) feedback on the effectiveness of the model output visualization.
Technical Workshop 2
Through our regular meetings with SABESP’s engineering team, we continued our collaboration to implement the stakeholder inputs into our synthesis modeling effort throughout 2020–2021. As a result, we confirmed model’s parameter selection, conservation simulation algorithm, and economic cost calculation rules as described in Section 2.2.5.
Stakeholder Meeting 3
The meeting was held to demonstrate the final synthesis biophysical model and scenario simulation outputs. Stakeholders were invited to discuss the implications of landscape management and investment in NbS with the key inputs, algorithmic framework, and the outputs of the biophysical models. Later on in the stakeholder engagement process, the São Paulo State Secretariat of Infrastructure and Environment (SIMA) also contributed to the discussion, a valuable asset given that SIMA is responsible for the overall policy planning process in São Paulo State.
As the description of the stakeholder engagement process and timeline demonstrates, the participatory modeling process is iterative. Through this process, the synthesis modeling framework was updated with stakeholder inputs, and their participation was facilitated through the development of the model. The participatory activity consisted of organization of complex environmental information, synthesis of relevant environmental, social, and economic inputs, and evaluation of various scenarios’ feasibility. The participatory process was especially relevant for accurate interpretation of model outputs and understanding their applicability in policy framework.

2.2.2. Landscape Management Scenarios

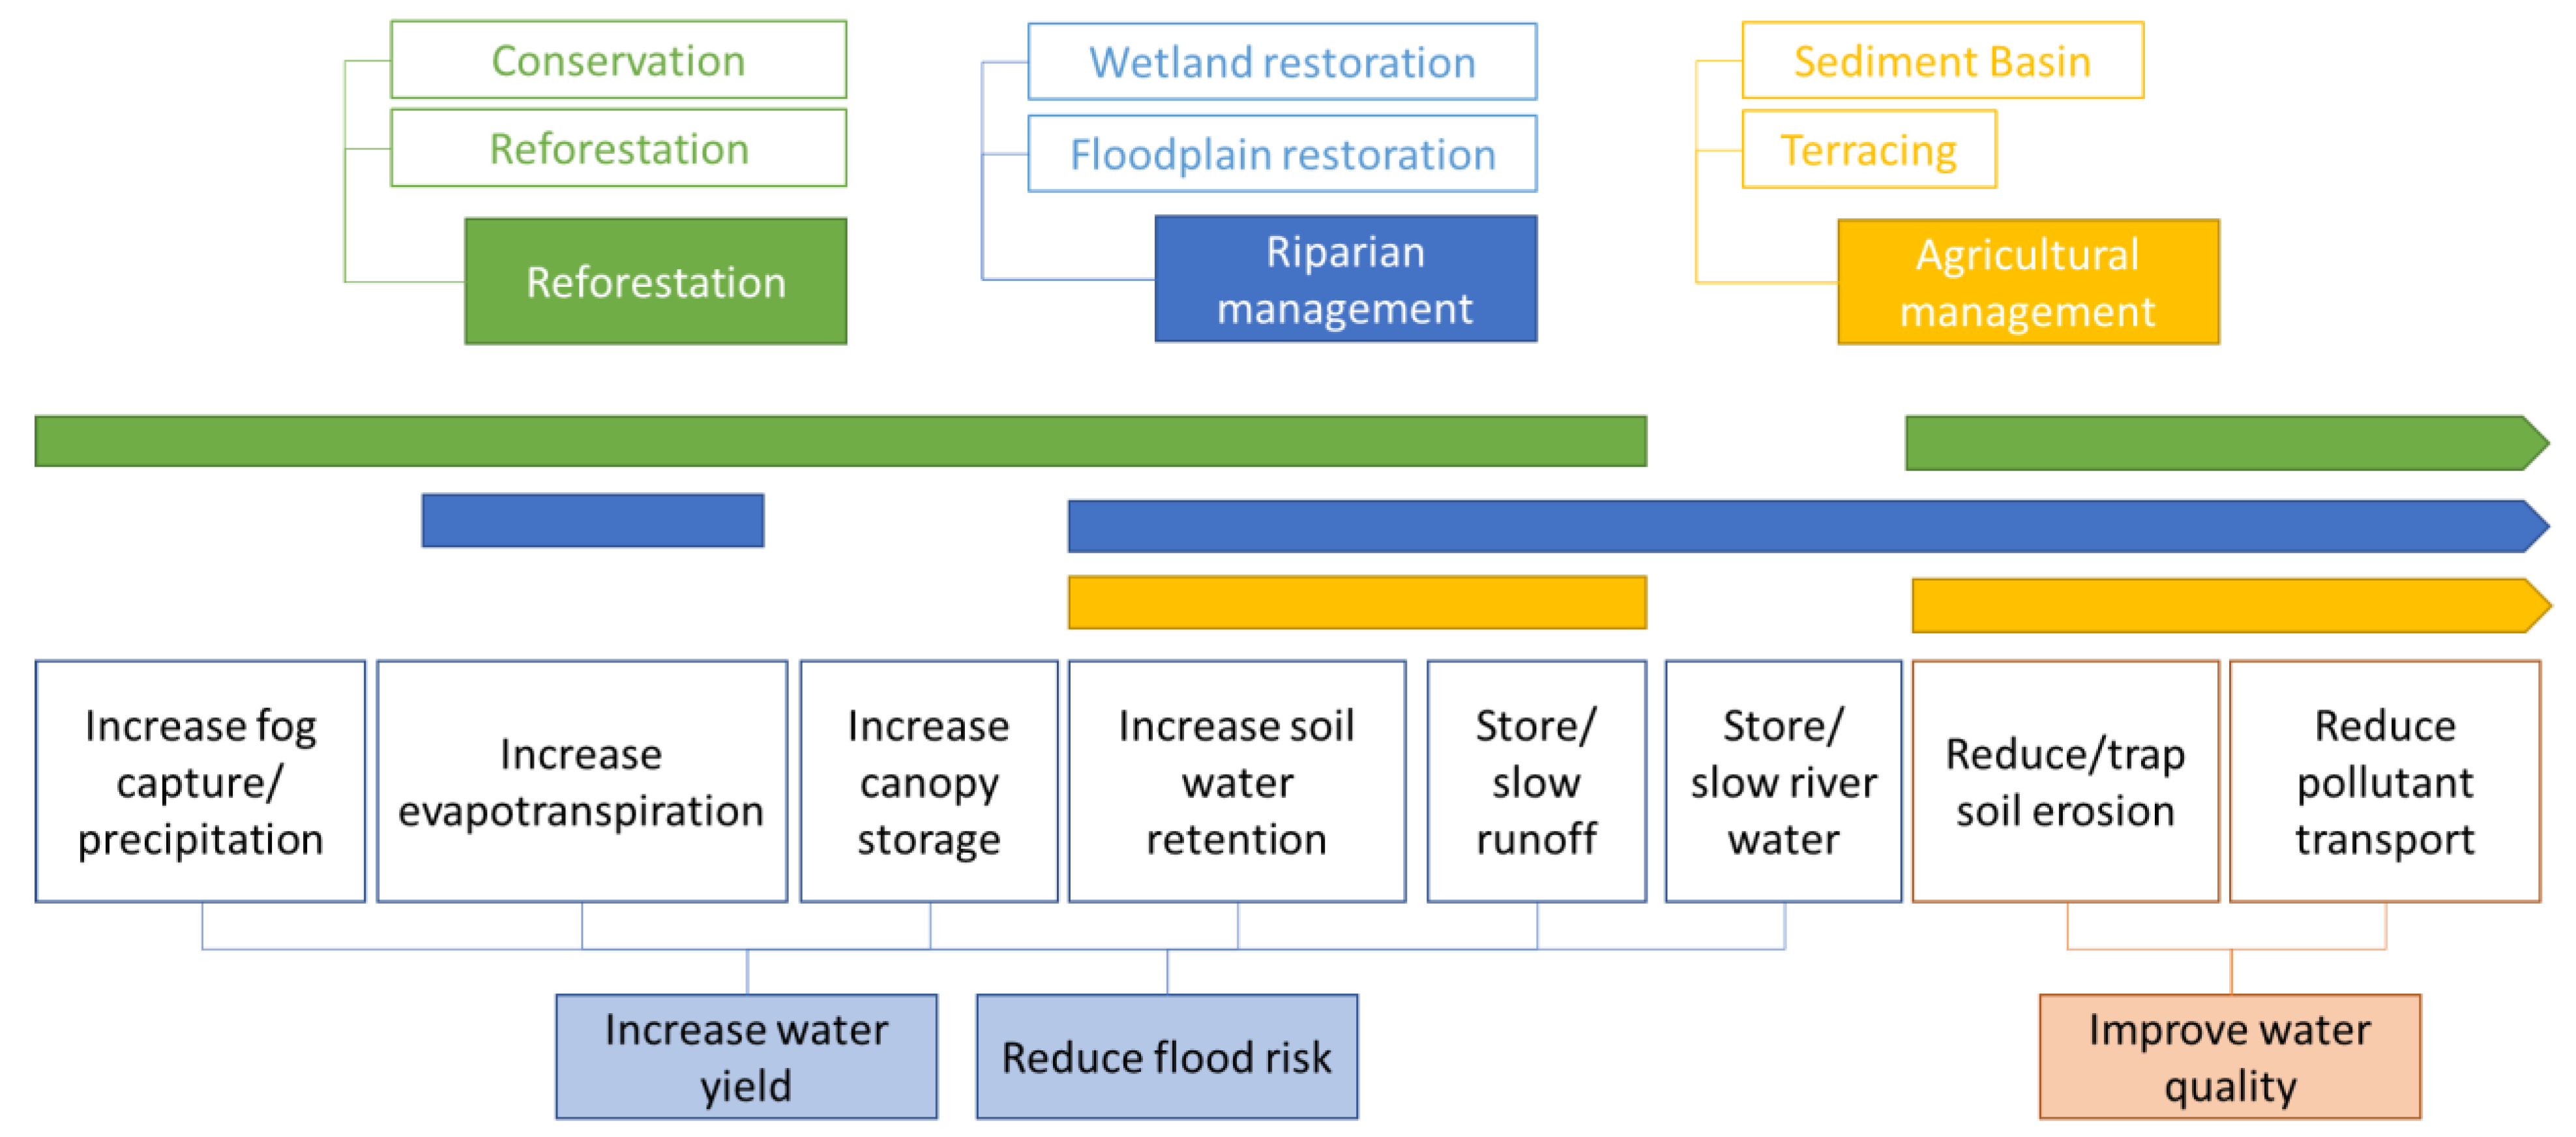
Nature-based solutions (NbSs) influence watershed’s hydrologic cycle and water balance through promotion of transient water retention and filtration in the headwaters. For example, according to a study involving workshop, literature analysis, and interviews on Payment for Ecosystem Services projects in Brazilian Atlantic Forest, hydrological services of the forest include (i) improvement in water quality, (ii) creation of positive socioeconomic effects, and (iii) regulation of land- and water uses [9]. Specifically, forest management (i.e., conservation of existing forest and reforestation through fencing (herein referred to as “passive restoration”) and replanting (“active restoration”)) can affect the water yield at reservoir intake points and reduce episodic flood risks by (1) increasing fog capture/precipitation, (2) increasing evapotranspiration, (3) increasing canopy storage, (4) increasing soil water retention and baseflow, and (5) storing/slowing surface runoff. At the same time, forest management can help improve water quality by (1) reducing/trapping soil erosion and (2) reducing/trapping nutrients (Figure 4).
Therefore, source water protection using NbS provides important ecosystem services that help to maintain water quality and supply to downstream users [16]. Landscape restoration scenarios for this project consist of different spatially distributed allocations of (1) forest, (2) riparian, (3) best management practices, and (4) reservoir buffers. There are numerous allocation possibilities, and the modeling goal was to identify landscape management scenario(s) that are both economically and politically feasible while maximizing the desired environmental outcomes.
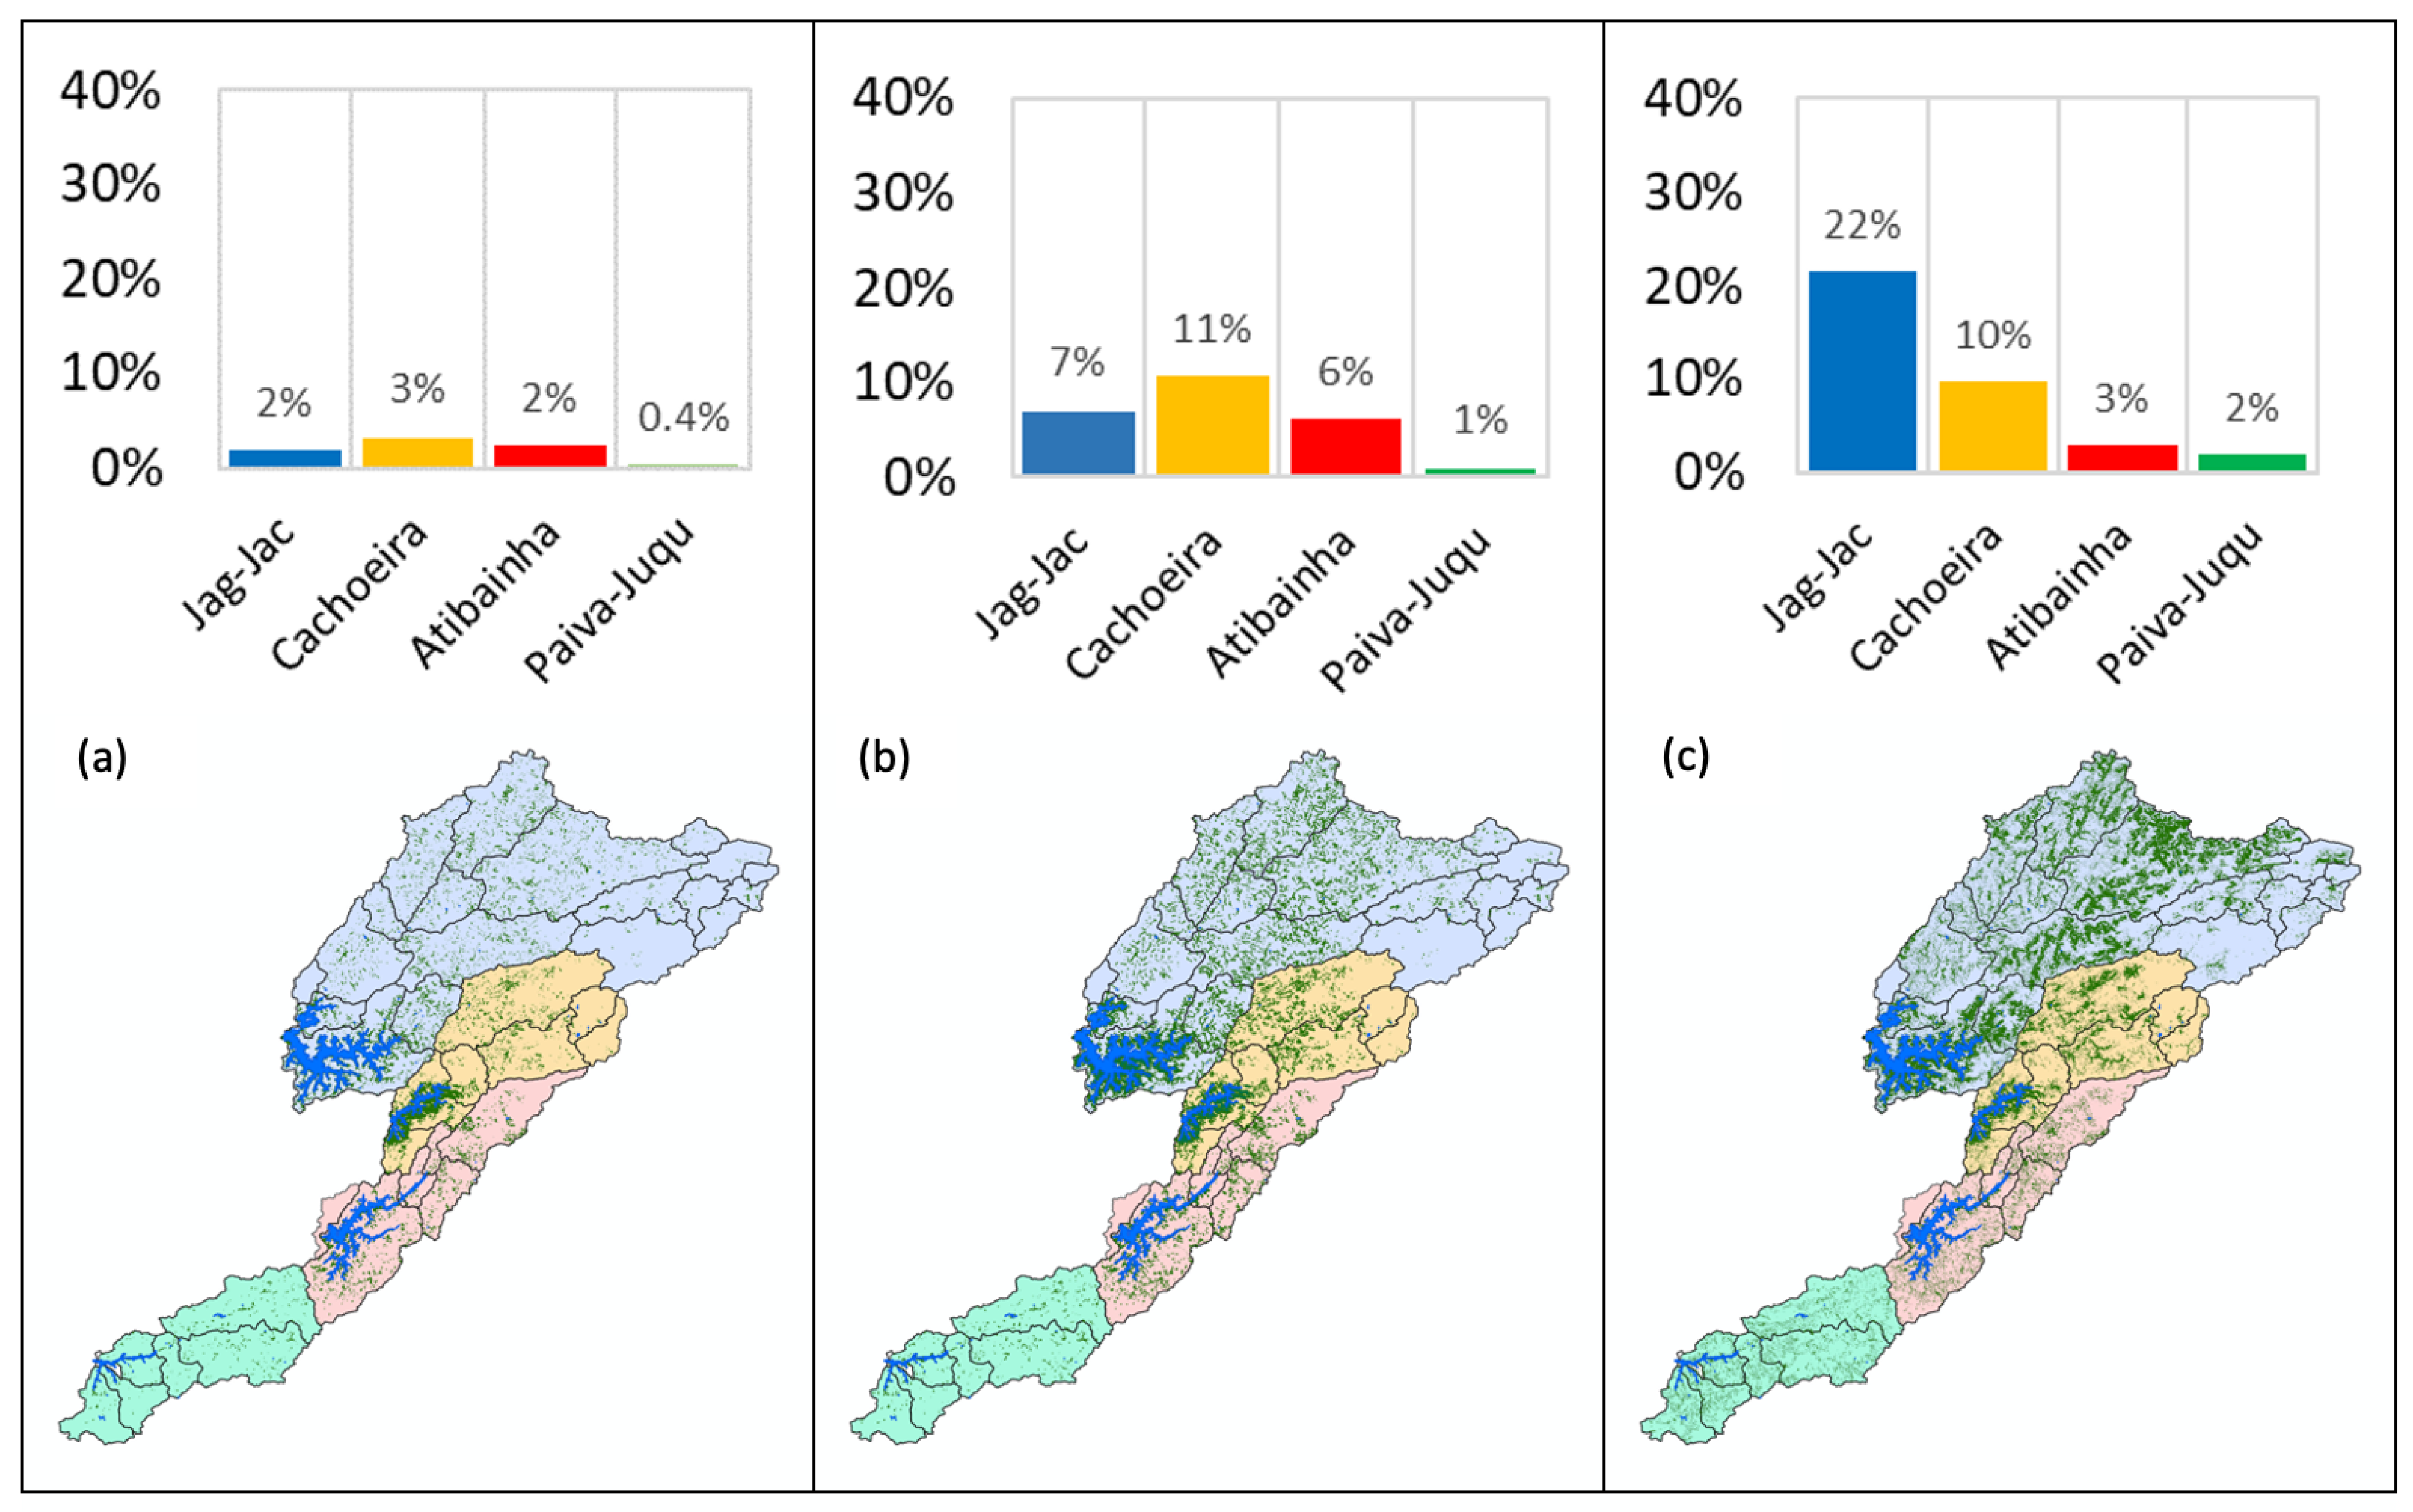
In pursuit of the most appropriate landscape intervention scenarios, we considered both the geophysical conditions and environmental history of the CWSS, as well as the existing policy framework, to define NbS allocation scenarios. The final selection of the scenarios was defined iteratively with the stakeholders after evaluating several possible alternative model outputs. Three alternative NbS scenarios resulted from this process (Figure 5 shows the spatial distribution and extent of each of the following scenarios):
(1)
Minimum Intervention (MI): Although this study is not related in any way to enforcement of the Brazilian Forest Code, the legal definition of Permanent Protected Areas (APP), defining riparian areas and springs buffers for protection, has been used to define this scenario. Restoration of riparian buffer zones in pastures ranges from 5 m for small proprieties to 15 m for larger properties, plus a buffer zone of 500 m around the reservoirs managed by SABESP. The purpose of this scenario is to explore the hydrological benefits of basic legal compliance standards in the CWSS.
(2)
Enhanced Intervention (EI): The enhanced intervention scenario follows the same logic as the minimum intervention scenario but with greater riparian buffer protections, ranging from 30 m to 50 m, plus the 500 m buffer protection around reservoirs.
(3)
Customized RIOS scenario (RIOS): To include a case that prioritizes areas for maximizing infiltration and baseflow given the geophysical characteristics (climate, topography, soil type, and underlying geology), we used the Resource Investment Optimization System (RIOS), designed by The Natural Capital Project, to map and define the extent of this scenario.

2.2.3. Environmental Simulation Models

Challenges in water resources and landscape management rest on understanding the cascading effects of the distributed intervention allocations to downstream water users. Such challenges can be aided by landscape simulation models that evaluate multiple components of hydrologic processes and water balance, including water storage and transport, and fate and transport of sediment and nutrients. Hydrologic simulation models compute transport loads and balance of water across a watershed. There are many hydrologic simulation models of varying complexity and spatial explicitness (e.g., HEC-HMS vs. SWAT).
Through stakeholder engagement and collaborative modeling process, we evaluated how different management scenarios affect timing and magnitude of river discharge and water quality at the watershed outlets where reservoirs are located. We developed multiple models as the “engines” of the participatory decision support process to quantify the hydrologic benefits of nature-based solutions. Here, we describe the general modeling structure of individual biophysical modules:
(1)
Resource Investment Optimization System (RIOS): Developed by the Natural Capital Project (NatCap), RIOS is a spatial modeling tool designed to prioritize areas in watersheds to optimize investments for multiple benefits so as to protect clean water supplies, mitigate flood risks, and contribute toward biodiversity and social goals [17]. RIOS integrates biophysical, social, and economic data to screen the landscape areas, and we used the land-use/land-cover, topography, surficial geology, canopy cover, and climate data to map the locations in the CWSS that would maximize distributed storage of water in the soil columns and vegetations across the watershed (i.e., customized RIOS scenario).
(2)
Fog Interception for the Enhancement of Stream-flow in Tropical Areas (FIESTA): FIESTA is a hydrological model that quantifies hydrological fluxes contributed by fog interception in a watershed and is used to quantify the potential water balance gains for each landscape management scenario [18]. Fog interception is an additional input to water balance when forest captures cloud water that would otherwise pass over the watershed. Additional water from fog capture can play an integral role in biological process as a part of the hydrological cycle in those regions where recurrent dry season creates drought conditions. To estimate this parcel of fog water for each management scenario, FIESTA model was used to map those areas with high potential for fog capture, compute fog capture potential using topographic, land-cover, and climatic data, and allocate the amount for those areas covered in the scenarios.
(3)
Hydrologic Engineering Center-Hydrologic Modelling System (HEC-HMS): HEC-HMS was originally used by SABESP to simulate event-based (~12–24 h) surface runoff given precipitation, hydrologic network, and reservoir water level data. During the February 2020 workshop with SABESP, we began the process of converting the existing model for long-term continuous hydrologic simulations—a model that simulates both wet and dry weather behaviors—by adapting the Soil Moisture Accounting (SMA) algorithm. We developed four independent models to evaluate individual reservoirs. Subsequently, we identified data need for the long-term hydrologic simulation and worked with SABESP to obtain them. When the long-term hydrologic simulation model setup was completed, we worked with SABESP’s engineering team to calibrate, validate, and evaluate the model framework, input data, and outputs (Figure 6). For further details on model structure and computational algorithm, refer to Acosta et al. [6].
(4)
Soil and Water Assessment Tool (SWAT): SWAT is a semi-distributed and continuous hydrologic simulation model that includes multiple hydrologic and water chemistry processes [19]. Compared to HEC-HMS, SWAT operates over more detailed and spatially explicit watershed information and hydrologic processes. SWAT uses geospatial attributes, such as soils, land-use/land-cover, topography, and crop management parameters, to predict the response of climatic inputs in the system. We used SWAT to simulate the watershed hydrology and the erosion, transport, and fate of sediment and nutrients. SWAT outputs of water balance simulation are compared to HEC-HMS outputs to assess the general modelling uncertainty and provide additional predictions about water quantity and quality associated with each landscape management scenario. For further details on model structure and computational algorithm, refer to Acosta et al. [6].

2.2.4. Model Synthesis Evaluation and Intervention Impact Simulation

The four hydrologic model simulations along with stakeholder inputs were synthesized to build an environmental modeling framework to inform policy decision analysis for sustainable water resources and drought management. Application of RIOS identified optimal locations in the landscape for restoration and provided comparative effects of addressing ecologically sensitive area versus legal framework for protection. FIESTA simulated fog capture potentials for each restoration scenario and informed HEC-HMS and SWAT hydrological simulations (Figure 7). Subsequently, these landscape simulation models collectively assessed the water quantity and quality effects of the landscape management scenarios. Water quantity effects include changes in the timing and overall water yield at the watershed outlet where reservoirs are located. HEC-HMS and SWAT models provide independent assessments of water balance and distribution across the watershed. Water quality effects of landscape intervention include soil and nutrient loading reduction through landscape filtering. SWAT simulates the sources, transport, and fate of sediment and nutrients fluxes across the watershed.

2.2.5. Economic Evaluation of the Cost of Extreme Drought and Value of Ambient Water Storage

Given the hydrological simulation outputs of the landscape management scenarios, particularly for generating drought and low-flow water resiliency within the CWSS, an economic analysis on the cost of extreme drought and values of nature-based solutions is applied in the management scenarios (Figure 8). The study considers historical data on economic costs associated with water availability during the extreme drought crisis event in 2013–2015 to evaluate the value added from ambient water storage resulting from the management scenarios, where full-lifecycle benefits for drought resistance, additional benefits from water security, and return on investment are calculated. For further details on economic analysis, refer to Ciasca et al. [7].

3. Results

3.1. Biophysical Simulation Summary

The results in the simulated water balance and dynamics of the two hydrological models (HEC-HMS versus SWAT) are complementary and corroborate each other. A decreasing water availability trend is observed in the 30-year stream flow data and is reflected in both models’ calibrated and validated baseline outputs (Figure 9). The simulation results of the landscape management scenarios—minimum intervention (MI), enhanced intervention (EI), and RIOS—indicate that nature-based solution implementation can revert some of the worst water scarcity conditions (Figure 10). The HEC-HMS outputs summarized over the entire simulation period show increases in river discharge during the dry season (May–August) at all reservoir inflow locations—Jaguari–Jacarei (Jag–Jac), Cachoeira (Cach), Antibainha (Ati), and Paiva Castro (Paiv) (Figure 10a). Particularly, the RIOS scenario with the greatest allocation of nature-based solutions shows the largest increase in water yield (solid yellow, green, blue, and red lines for Jag–Jac, Cach, Ati, and Paiv, respectively), followed by EI (dashed lines) and MI (dotted lines). The water yield increase is more pronounced during the drought period (2013–2015), particularly in Jag–Jac with RIOS simulation (Figure 10b), the results of which were expected given the significantly greater allocation of nature-based solutions in the watershed (refer to Figure 5 for allocation extents).
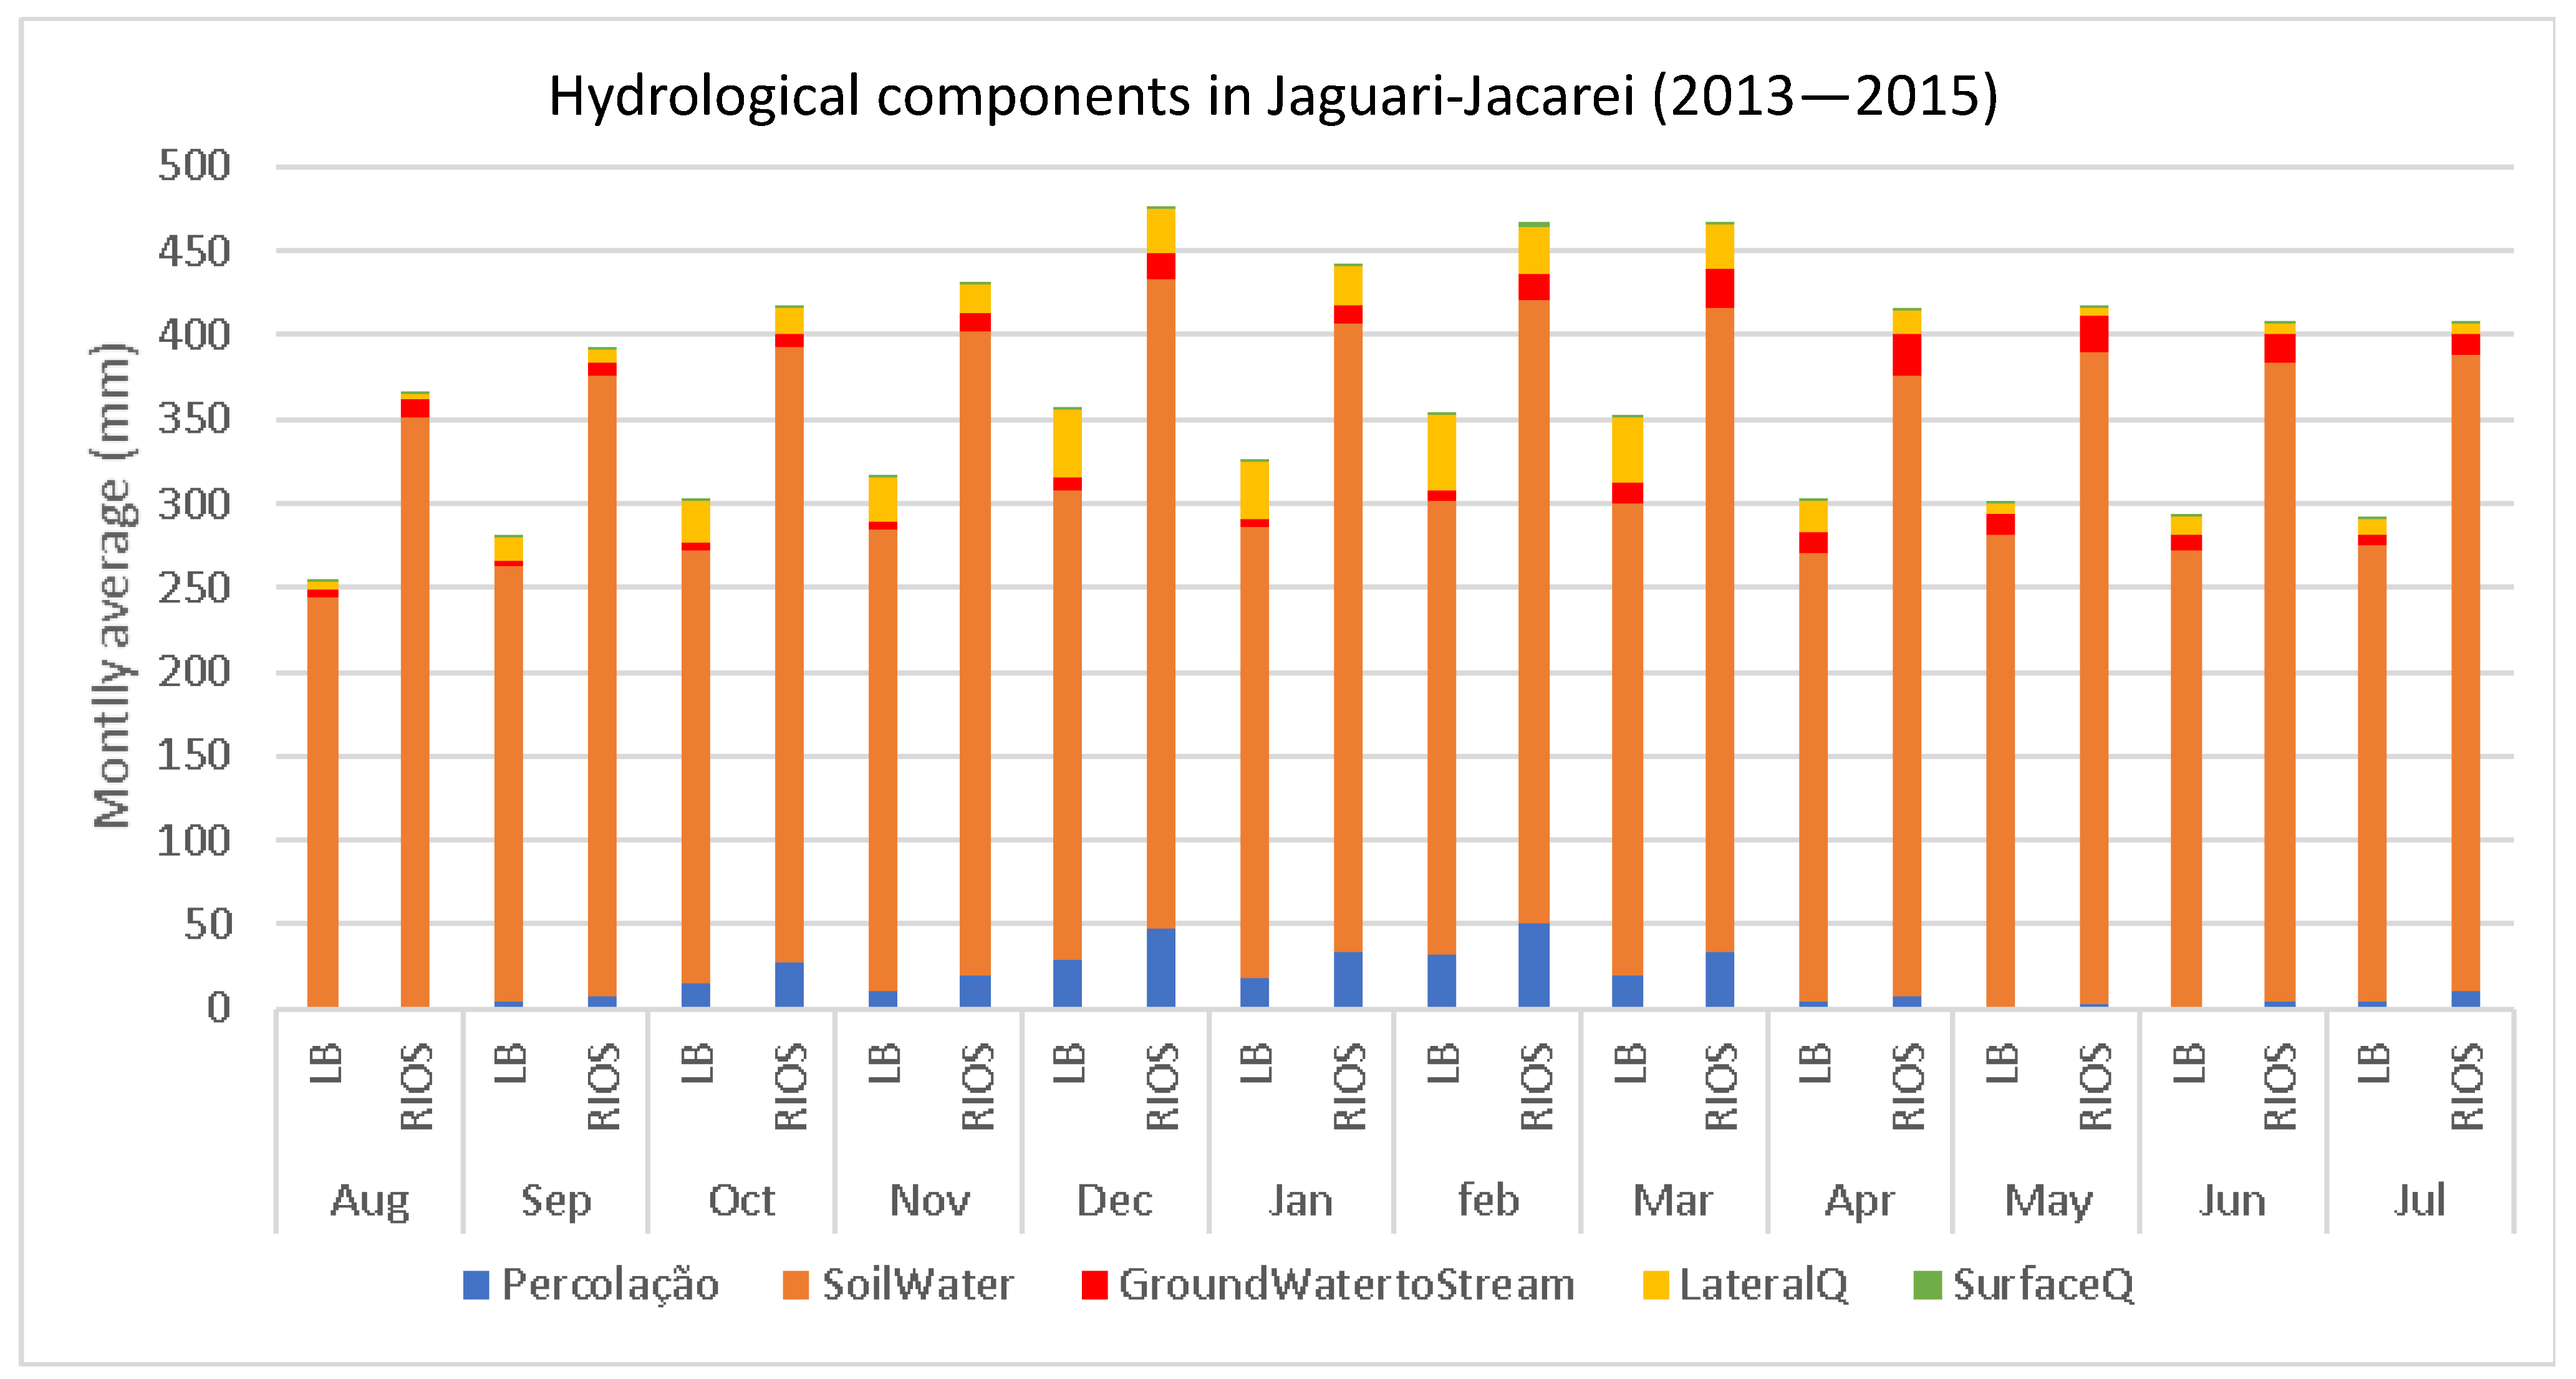
RIOS scenario outputs of HEC-HMS consistently show the greatest increase in water yield during a drought period as well as the entire simulation period. While HEC-HMS simulation outputs provide a general understanding of how management scenarios may affect the long-term water balance and water availability at the reservoirs, the SWAT model generates multiple elements of water balance, including surface, vadose zone, shallow aquifer, and deep aquifer, with more spatially explicit representations of hydrologic processes across the watershed. The SWAT model outputs of the RIOS scenario are compared to the baseline condition (Figure 11) to illustrate the potentially significant supplementation of water balance across all months, particularly in the soil water storage component. The results indicate that nature-based solutions could help to maintain water security through increased ambient water storage in soil columns across the watershed. These model results illustrate the “sponge effect” [20] performed by the soil and groundwater storage and increased baseflow to streams between the wet and dry seasons, a desirable effect to promote for a long-term water security measure. Quantitively, the sum of surface and groundwater contribution to stream flow increased up to 33% when considering all CWSS sub-watersheds, establishing a strong argument to mobilize greater political engagement to implement nature-based solutions. For further details of the hydrologic simulation model parametrization, structure, and outputs, refer to Acosta et al. [6].
There are several limitations in the hydrologic simulation models. These models do not simulate growth of trees and increased water consumption during forest maturation phase [21]. There are other structural limitations: first, limited spatial representation and uncertainties associated with precipitation data (see Appendix A for rain gages used in the study site) can lead to less accurate hydrologic simulations [22]; second, hydrologic simulation models have limited capacity to accurately simulate groundwater flow and its nonlinear dynamics [23]. It is also important to consider that future climate scenarios will likely be different from past trends, and significant uncertainty is introduced when using past climate data to make predictions about water resources in the future [21].

3.2. Economic Analysis Summary

A financial analysis based on the hydrological modeling results assesses the economic benefits associated with hydrological resilience gained from nature-based solutions, particularly during drought conditions. First, the economic evaluation indicates a total financial loss associated with the water crisis at USD 450 million over 2014–2015, consisting of the industry’s loss at approximately USD 302.7 million and the loss of water and sanitation services at USD 147.2 million (Table 1). To value the economic cost of the drought, the study considers the change in two economic parameters, which are the net value added (NVA) of the municipal water supply and sewage company (SABESP) and the gross value added of the industry sector. The database used for the analysis includes the Standardized Financial Statements for Basic Sanitation Company of the State of São Paulo (Demonstrações Financeiras Padronizadas da Companhia de Saneamento Básico do Estado de São Paulo); the National Sanitation Information System (SNIS/Sistema Nacional de Informação sobre Saneamento) by municipality; Municipal GDP for 2002 to 2018; and the industry sector price index of the National Accounts System, made available by the Brazilian Institute of Geography and Statistics [24].
If nature-based solutions had been in place and functioning according to the management scenarios, economic losses associated with drought conditions may be reduced. For instance, with the RIOS scenario, the results indicate that the industry sector may avoid 27% of drought-related gross losses (USD 220.3 million) and, regarding the water and sewage sector, 28% of net losses (USD 105.6 million) in 2014–2015. We estimate associated economic benefits of USD 82.4 million resulting from avoided industry gross losses and USD 41.6 million from avoided water supply and sewage sector net losses. Both economic valuations sum to USD 124 million, representing a 28% reduction in the total drought cost (Table 2). Accordingly, by comparing these economic cost-avoidance projections under an expected recurrence interval for a 2014–2015-type drought event against the full-lifecycle costs of the RIOS scenario, we conducted a cost–benefit analysis for Cantareira Water Supply System. Economic benefits of drought-related cost avoidance are estimated over a 35-year program evaluation period by assuming an ‘incidence factor’ for how often a drought-related economic impact similar to the 2014–2015 water crisis might occur. Assuming a 1-in-10-year incidence factor, the study estimated the net present value (NPV) of the RIOS scenario at USD 40 million considering only water storage benefits (benefits of USD 220 million versus costs of USD 180 million). This economic analysis associated with drought conditions demonstrates the importance of nature-based solutions as a complementary measure to conventional grey infrastructure in managing and supplying water resources to mitigate economic impacts of extreme climatic events and its relevance to policy analysis. For further details, refer to Ciasca et al. [7].

4. Discussion

4.1. Science–Policy Challenges for Achieving Water Security

There are several challenges in developing science-based climate-resilient watershed management policy. One is due to the inherent variability and complexity of hydrological systems. At the same time, stakeholders might perceive and evaluate landscape conservation planning and co-benefits differently [25]. The difficulty is compounded by global climate change as the past data might no longer be a reliable guide for how hydrological systems will respond to different restoration scenarios [26]. Additionally, return on investment of nature-based solutions follows distinctly different temporal patterns compared to conventional gray infrastructure solutions [27]. The time lag between investment and realization of benefits can thus become a barrier to water utility managers and policymakers seeking rapid return on investment [28].
Challenges also arise from the rigidity of existing policy and institutional arrangements and natural inertia when faced with climate and social changes (e.g., [29,30,31,32]). Traditional water and sanitation management projects focus on problems that begin at the water intake and end at the mouth of the outflow pipe, which are typically managed with grey infrastructure projects (e.g., dams, reservoirs, and inter-basin transfer). Grey infrastructural approaches are deeply ingrained in certain professional contexts (such as water engineering) and still largely shape institutional practices [33]. Institutional norms and path dependency, whereby decision-makers choose familiar options, can be a barrier to widespread watershed-scale nature-based solution application.
Our project addressed these challenges in scientific and political coordination through stakeholder engagement and a collaborative environmental model development process. There are some key lessons from the project, given the context of recent advances in stakeholder engagement and participatory modeling for environmental management decision analysis, as discussed below.

4.2. Consideration of Collaborative Modeling for Stakeholder Engagement

One way to increase the capacity within our institutions is to broaden their understanding of the multiplicity and complexity of different policy alternatives based on scientific data using landscape simulation models. Use of landscape simulation models in water resources development and management dates to the 1950s involving a relatively small number of highly trained computer programmers and hydro-engineers. It was not until the 1980s with increased public awareness of environmental issues and changes in the institutional arrangements associated with water resources planning and management that diversity of participants in the modeling process became necessary [34]. For example, Shared Vision Planning (SVP) was proposed in the early 1990s to engage the public and utilize computer simulations for policy planning and decision-making. SVP provided a process for scientists and planners to increase their shared understanding of political dimensions and environmental problems and incorporate scientific knowledge and public input into the planning process [35]. More recently, a participatory modeling project recognized the importance of collaboration among scientists and stakeholders for defining a regional water management policy, where the model development process was used to increase shared understanding among stakeholders and scientists to reach a consensus on effective landscape management strategies for mitigating water pollution [36].
While landscape simulation modeling can be an effective tool to communicate multiple dimensions of environmental issues, which can aid policy discussion with a wide range of stakeholders [37] (e.g., problem definition, social and environmental objectives, modeling assumptions and strategies, policy framework, etc.), there are important considerations that emerged from our case study for streamlining the modeling process and stakeholder engagement:
Stakeholder Engagement
Stakeholder engagement is an important tool for developing common understanding and language for water resources management decision-making. The importance of stakeholder engagement in water governance is increasingly recognized in recent literature [25,36,38,39,40,41], and there is an essential need for both policy and scientific publication outlets to present a variety of case studies to understand the various scopes of such efforts to promote sustainable water management [38]. Particularly with complex management issues, stakeholder engagement can bridge varied interests and organizations to expand the sphere of interests and define common environmental goals and strategies [42]. Stakeholder engagement’s effectiveness depends on the extent of mutual learning, iterative interaction, conflict resolution, and levels and duration of collaborations, all of which contribute toward building common ground given the diversity of interests, relationships, and physical, social, political, and cultural influences [38]. Our experience engaging stakeholders through this project revealed that their confidence in the environmental simulation models and trust in the projected water futures can be achieved through continual and iterative engagement from the onset and throughout the modeling process. The shared roles among scientists and stakeholders contributed toward founding a broad base of political, technical, and financial support throughout the project.
Environmental and Institutional Scales
Planning for conservation allocation must take into consideration ecosystem dynamics at various spatial and temporal scales, the challenges of which are compounded by institutional constraints. For instance, state and municipal administrations hold the remit for coordinating supportive policies that direct how the watershed is managed. For example, mainstreaming landscape conservation investments at scale requires creation and coordination of new and specifically designed policies, such as incentives for water-security-friendly economic activities combined with disincentives for water-intensive economic activities (e.g., silviculture, pasture, etc.). Thus, environmental actions often require both local coordination for conservation allocation, which involves scientific investigation and engagement with multiple stakeholders across jurisdictions, and institutional coordination, which involves policy and economic analyses and engagement with the water utility business and its regulators, local businesses, and national and sub-national administrations [25]. Once recognized as a component of the water utility and sanitation business and coordinated as part of the water tariff and policy framework, conservation planning can become a solid base for sustainable and long-term source water protection [43]. In our study, these varied local and institutional scales were incorporated into the project design (i.e., conservation scenarios defined according to the Brazilian Forest Code applied with environmental data and models), where the stakeholder engagement and modeling decisions helped to bridge the disconnect between the scales of environmental investment (i.e., local planning feasibility with landowners versus watershed planning feasibility with policymakers and water industry leaders). Then, with articulation of expected benefits (i.e., immediate costing versus long-term projection of return on investment) using both hydrologic simulation and economic model outputs, landscape conservation planning and nature-based solution implementation were framed as an investment for long-term water benefits.
The actual implementation of a watershed investment program where nature-based solutions are considered alongside grey infrastructure—for example, as defined by various landscape management scenarios of this study—demands an even higher level of stakeholder coordination that extends from local organizations and municipalities to various levels of state administration and civil society organizations to provide the necessary long-term support. The next steps of this project include continuation of building a broad stakeholder domain and gaining their political, technical, and financial support based on the study outputs in order to develop environmental policies that support sustainable water resources management.

5. Conclusions

Given the growing evidence that extreme climatic events will pose challenges to growing cities worldwide, building resilient water systems has become an important part of future sustainable development. Acknowledging that such an adaptation challenge represents a complex economic, social, political, and landscape management problem, this study explored how incorporating nature-based solutions in a source watershed can contribute to building a resilient water future. Prioritizing conservation investments in the Cantareira Water Supply System (CWSS) and enabling watershed resiliency require understanding the watershed’s biophysical processes and their responses to intervention strategies. A resilient watershed, influenced via green and grey infrastructure investment strategies, should maintain adequate flow and quality of water given increasing demands and during extreme climate events, such as extended droughts. Landscape simulation models are useful tools for understanding hydrologic processes and predicting the corresponding impacts of landscape management scenarios. However—from a landscape management perspective—models are only useful if they provide relevant outputs that can inform policy tradeoffs and decision-making. While the scientific information, technical evidence, and arguments employed in models must be credible and robust, they must also reflect multiple relevant social, economic, and policy perspectives. Therefore, developing a useful model as a boundary object to connect the scientific information to policy decisions and investment needs requires collaborative efforts from scientists and stakeholders. In this paper, we demonstrate a synthesis modeling framework in which stakeholders were engaged from the project onset to direct the overall model framework and selection of conservation options in addition to providing input data and scientific and management feedback on the model details, such as the computational structure and framing of model outputs. The landscape simulation model outputs inform changes in rain–discharge relations and the overall long-term water balance response to nature-based solution implementations. Correspondingly, the economic analyses highlight the implications of expanding distributed water storage through reforestation across the watershed in mitigating extreme low flows during extreme drought conditions.

Supplementary Materials

The following supporting information can be downloaded at: https://www.mdpi.com/article/10.3390/w15030401/s1, RcNEISmodel.xlsm.

Author Contributions

Conceptualization, S.J.C., J.R., C.K. and S.B.; Methodology, S.J.C., J.R. and C.K.; Software, S.J.C., E.A.A. and C.A.R.-P.; Validation, S.J.C. and E.A.A.; Formal analysis, S.J.C., C.K., E.A.A. and B.S.C.; Investigation, S.J.C., C.K., J.R., H.B. and E.A.A.; Data curation, E.A.A. and H.B.; Writing—original draft, S.J.C.; Writing—review & editing, S.J.C., C.K. and B.S.C.; Visualization, S.J.C. and E.A.A.; Supervision, C.K. and S.B.; Project administration, C.K. and J.R.; Funding acquisition, S.B. and C.K. All authors have read and agreed to the published version of the manuscript.

Funding

This research was funded by National Science Foundation (NSF) grant number DBI-1639145 and the Tinker Foundation. The APC was funded by the Tinker Foundation.

Data Availability Statement

Many of the data were acquired from public sources, including Sentinel Application Platform (SNAP), National Water and Sanitation Agency (ANA), and Brazilian Institute of Geography and Statistics. Some of the data were acquired directly from stakeholders.

Acknowledgments

We thank our stakeholders, including Mara Ramos, Suely Matsuguma, Giovana Bevilacqua Frota, and Emerson Martins Moreira (Sabesp); our collaborators, including Rafael Barbieri and Suzanne Ozment (WRI) and Edenise Garcia and Maria Tereza Leite Montalvao (TNC), for their technical support and contributions; SESYNC and Tinker Foundation for the financial support to this study; and Tafarello and the peer-reviewers selected by the journal editors.

Conflicts of Interest

The authors declare no conflict of interest.

Abbreviations

CWSSCantareira Water Supply System
IPCCIntergovernmental Panel on Climate Change
NbSNature-based Solution
GDPGross Domestic Product
SABESPSão Paulo State Water and Sanitation Company
ARSESPSão Paulo State Public Services Regulatory Agency
TNCThe Nature Conservancy
WRIWorld Resources Institute
SESYNCNational Socio-Environmental Synthesis Center/University of Maryland
PCJPiracicaba–Capivarí–Jundiaí Rivers Watershed Committee
HEC-HMSHydrologic Engineering Center-Hydrologic Modeling System
RIOSResource Investment Optimization System
FIESTAFog Interception for the Enhancement of Stream-flow in Tropical Areas
SWATSoil and Water Assessment Tool
SIMASão Paulo State Secretariat of Infrastructure and Environment
PESPayment for Ecosystem Services
LULCLand-use/Land-cover

Appendix A. Historical Land-Use and Land-Cover Change Analysis
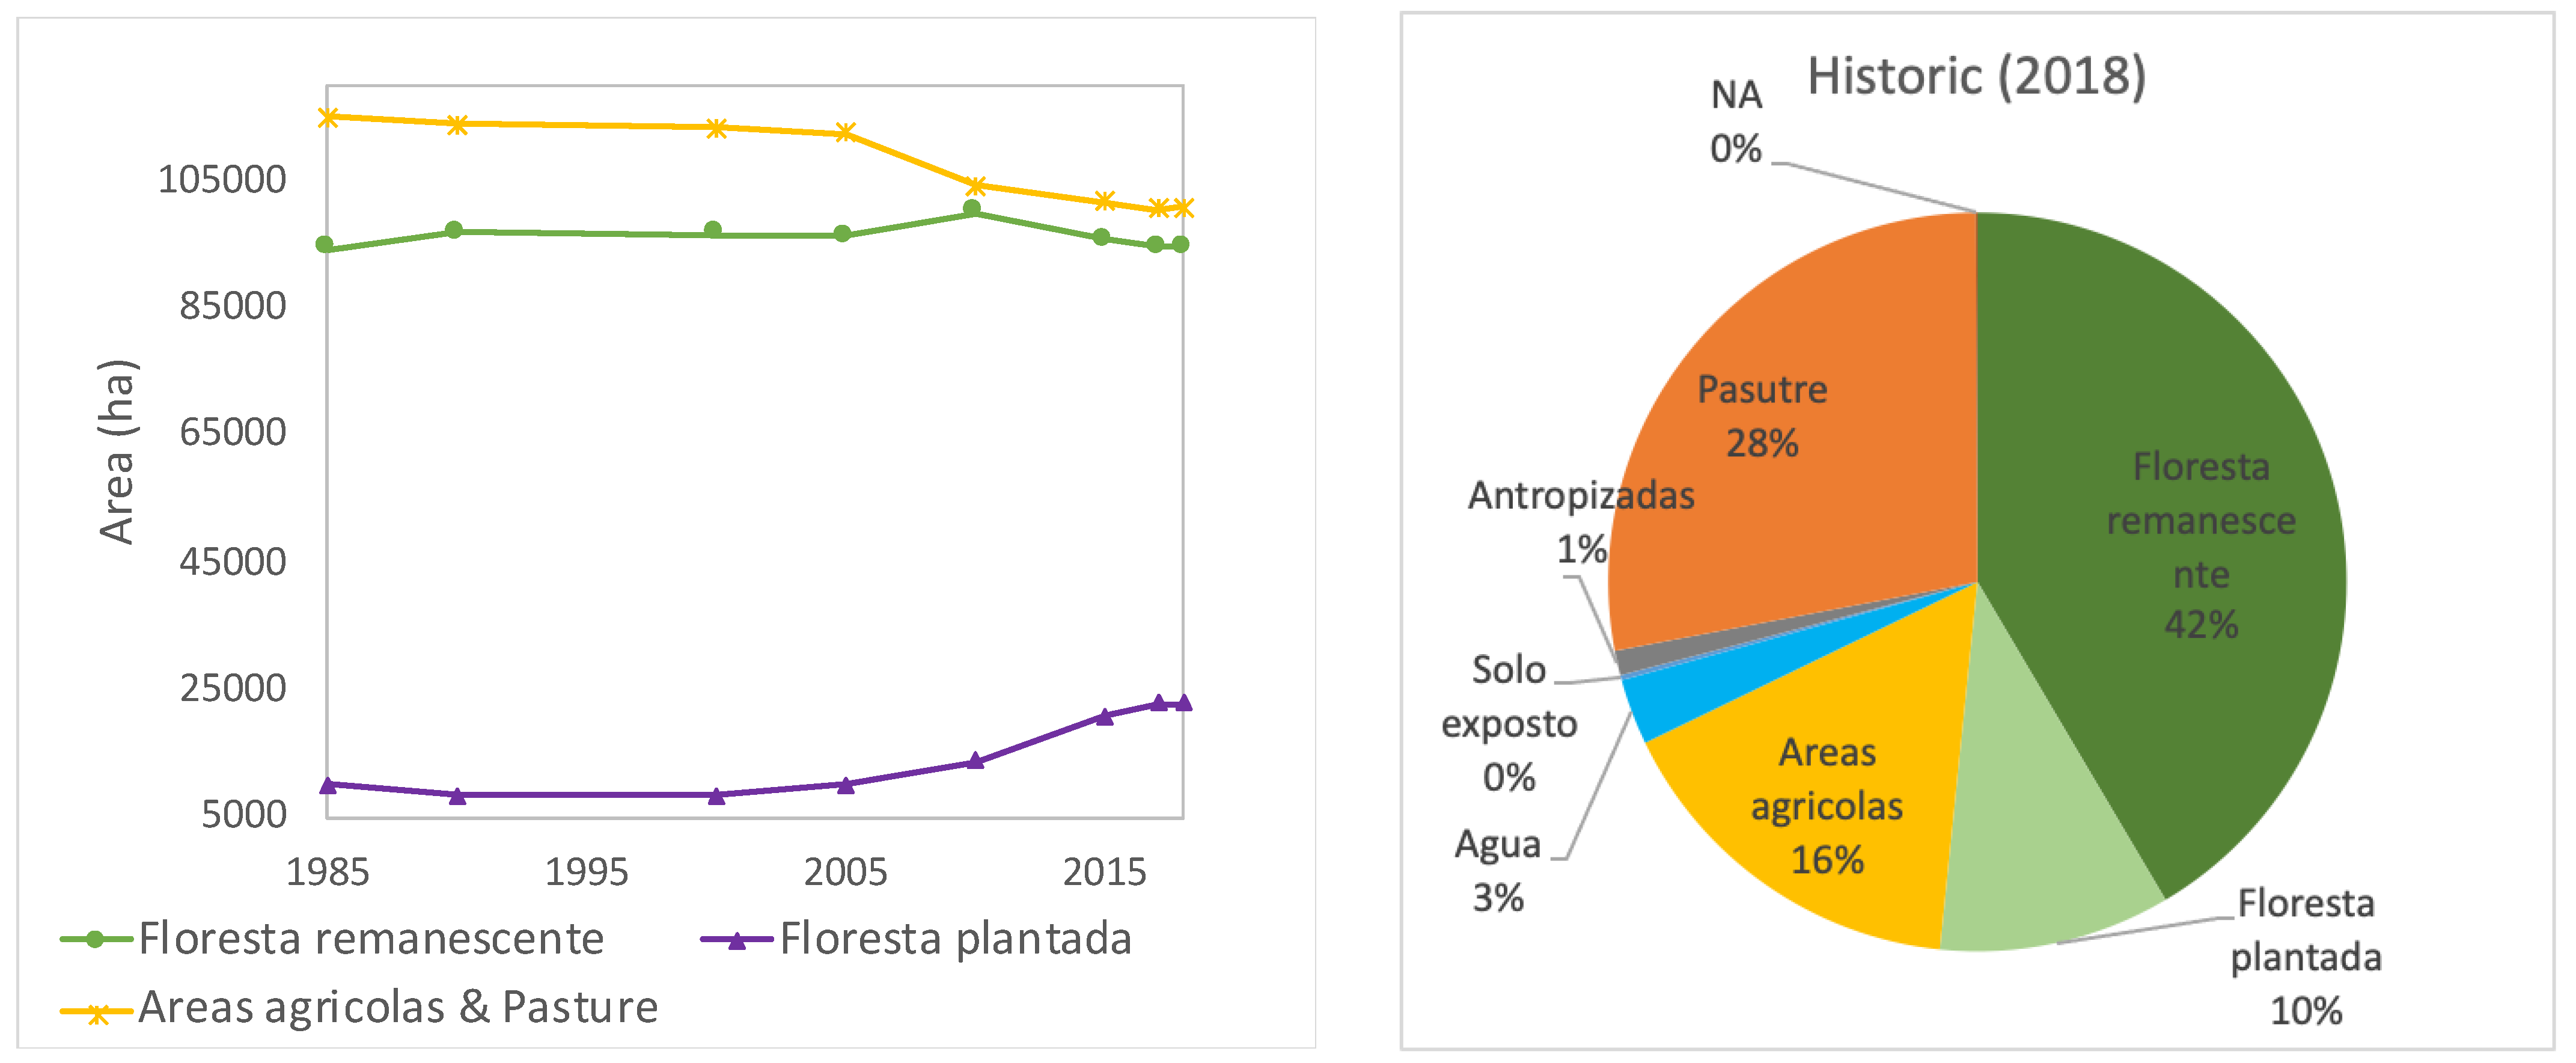
An examination of the historical LULC and water balance highlights the urgency for conservation and restoration actions in the CWSS. Historic survey of LULC from 1985 to 2018 demonstrates a steady decline in native forest, while plantation forest cover increased, especially since 2000 (Figure A1). In the year 2018, remaining native forest made up 42%, while plantation forest and agriculture/pasture, respectively, made up 10% and 44% of the CWSS.
Figure A1. Historic land-use/land-cover (LULC) changes and the most recent distribution across the Cantareira Water Supply System.3.
Water 15 00401 g0a1
The changes in the LULC, compounded by the historic drought event, have significantly affected the CWSS’s water budget. Tree species fostered in the plantation forests, Eucalyptus Grandis (eucalyptus trees) and Pinus caribaea (pine trees) [44], significantly differ in their water consumption and loss through evapotranspiration (ET) compared to the native tropical savannas and woodlands [45,46].
A soil water balance study using measured precipitation, surface runoff, and soil moisture on a 2 m deep soil profile indicates eucalyptus’s annual ET rate is about 345 mm larger than Cerrado, with the most pronounced differences observed during the wet season (September to April) [45]. Another study estimates the water loss through ET using energy budget and finds that conversion of tropical rainforest to cultivated croplands and pasture (e.g., sugarcane) resulted in a 25% decline in regional ET, a net gain in water balance [46]. Figure A3a compiles the monthly ET rates from these studies for the dominant vegetation covers in the study site.
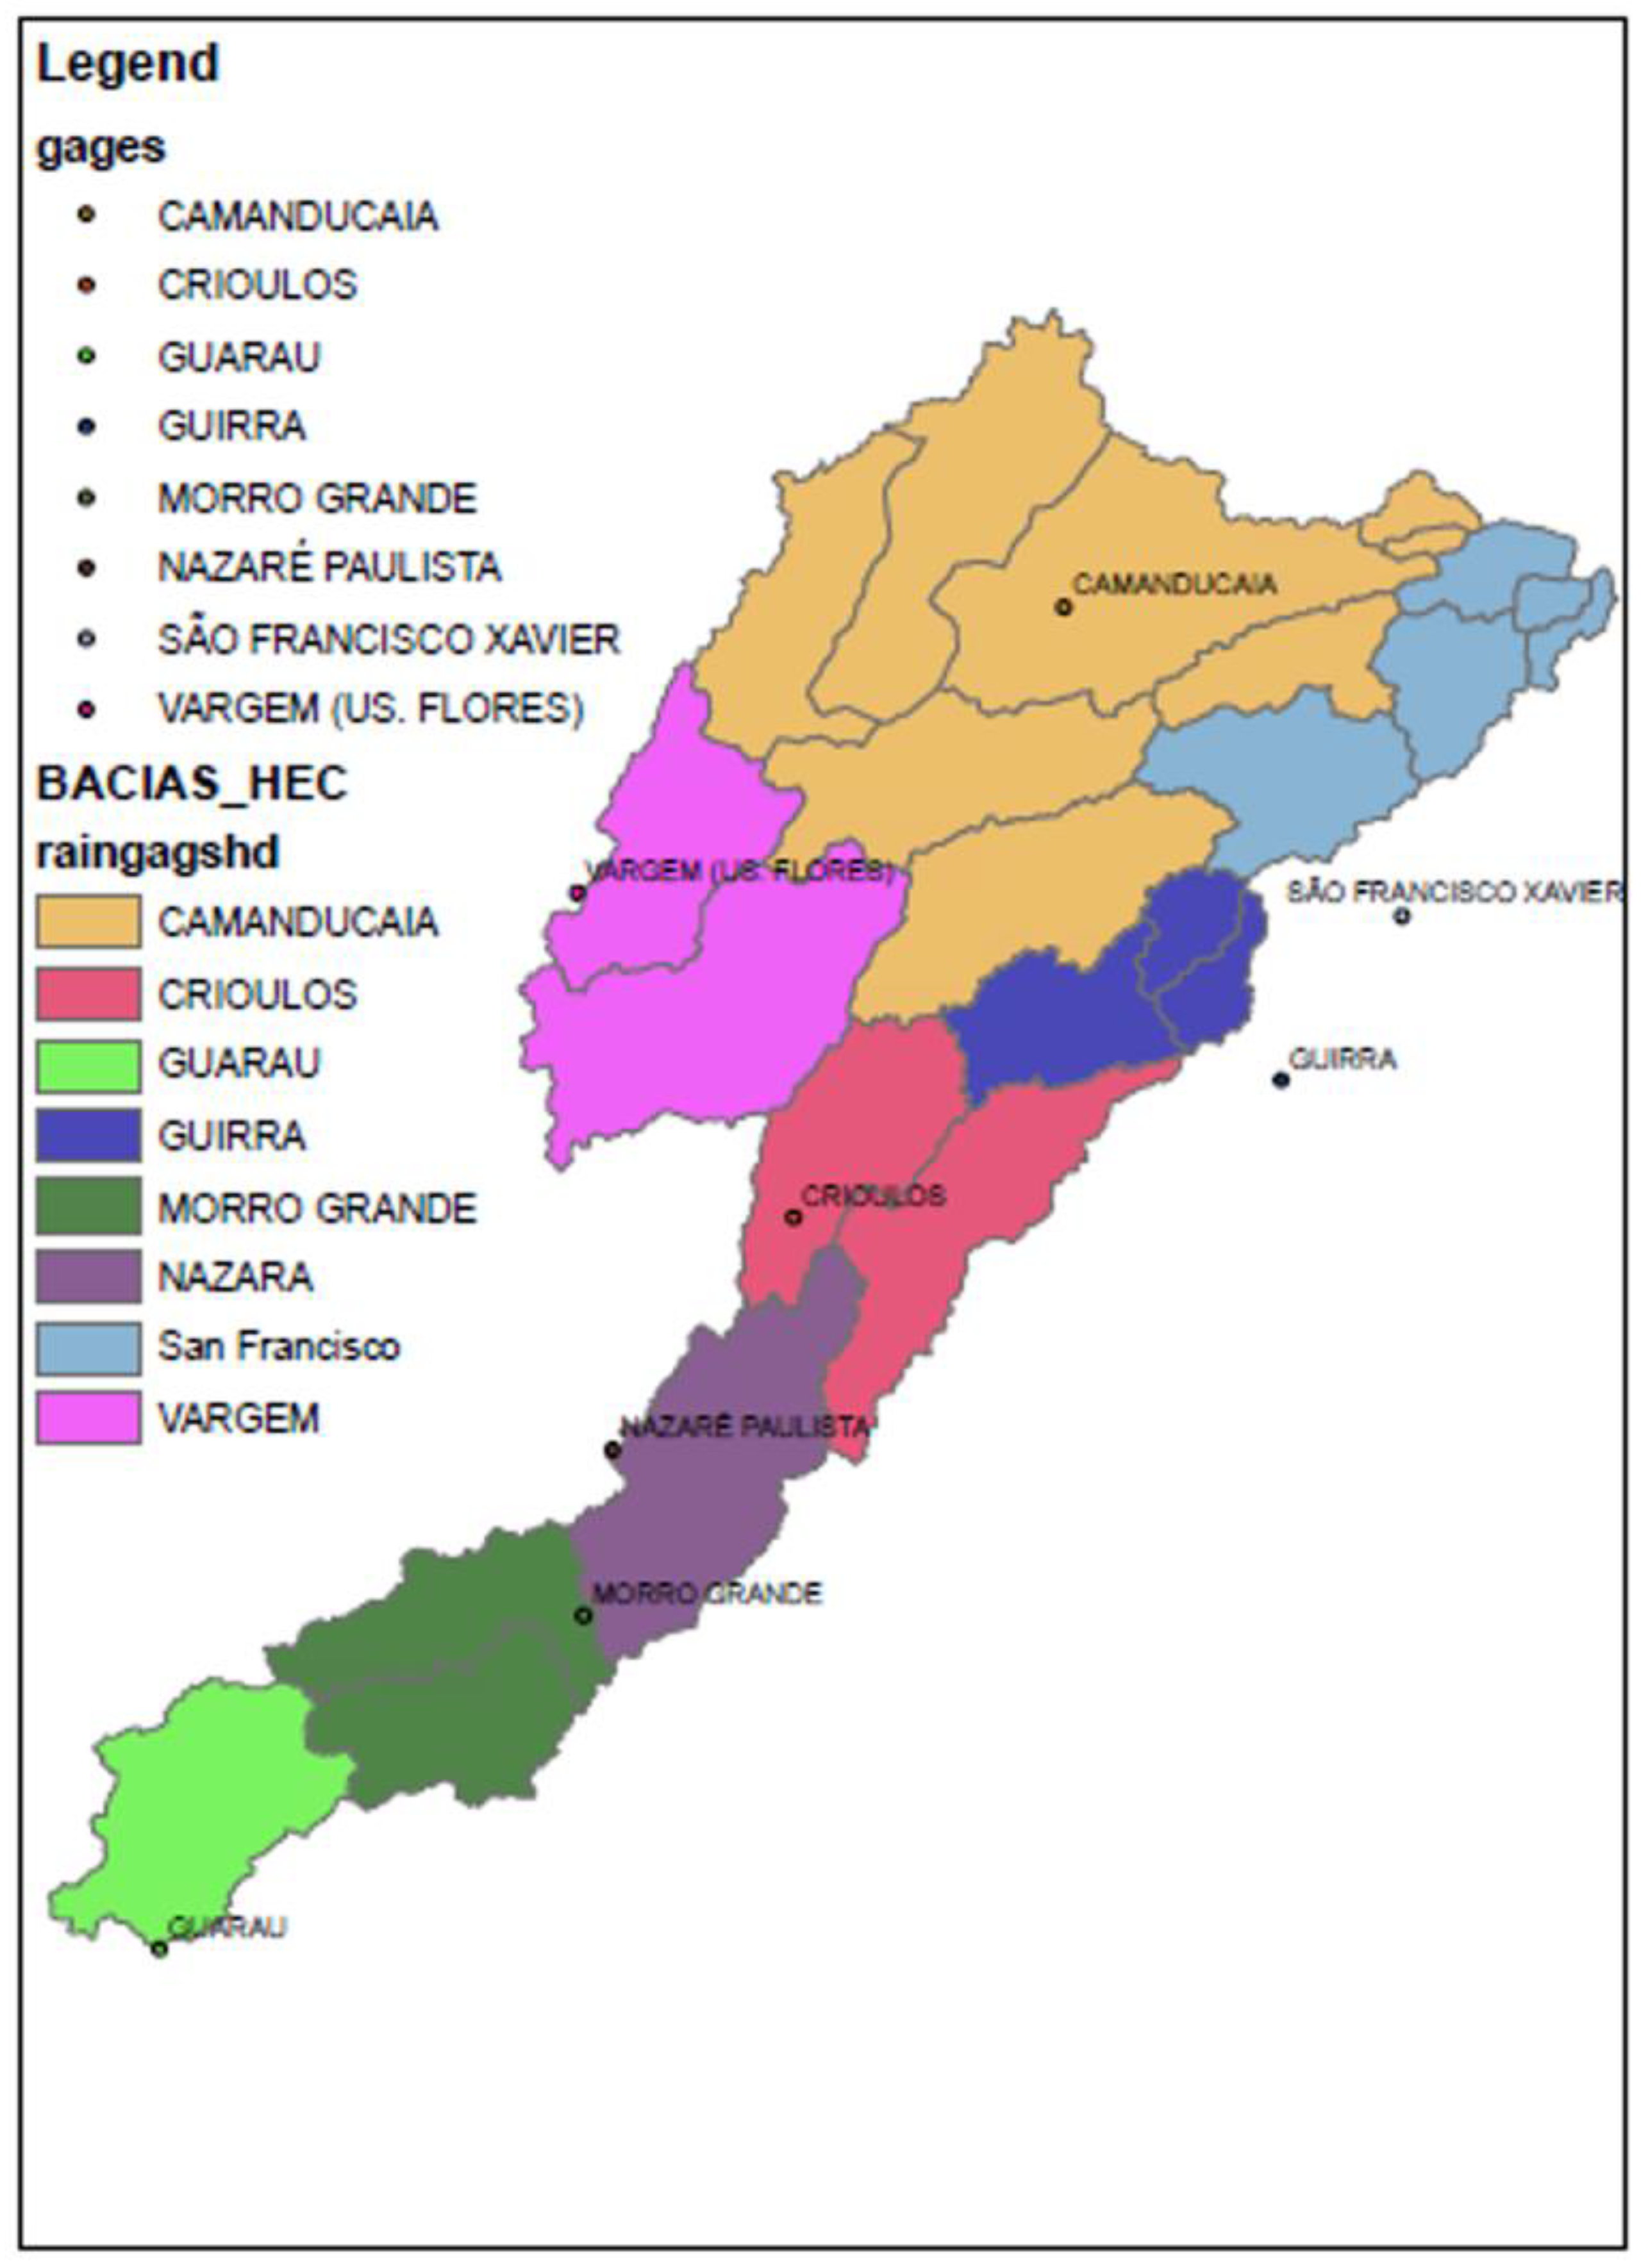
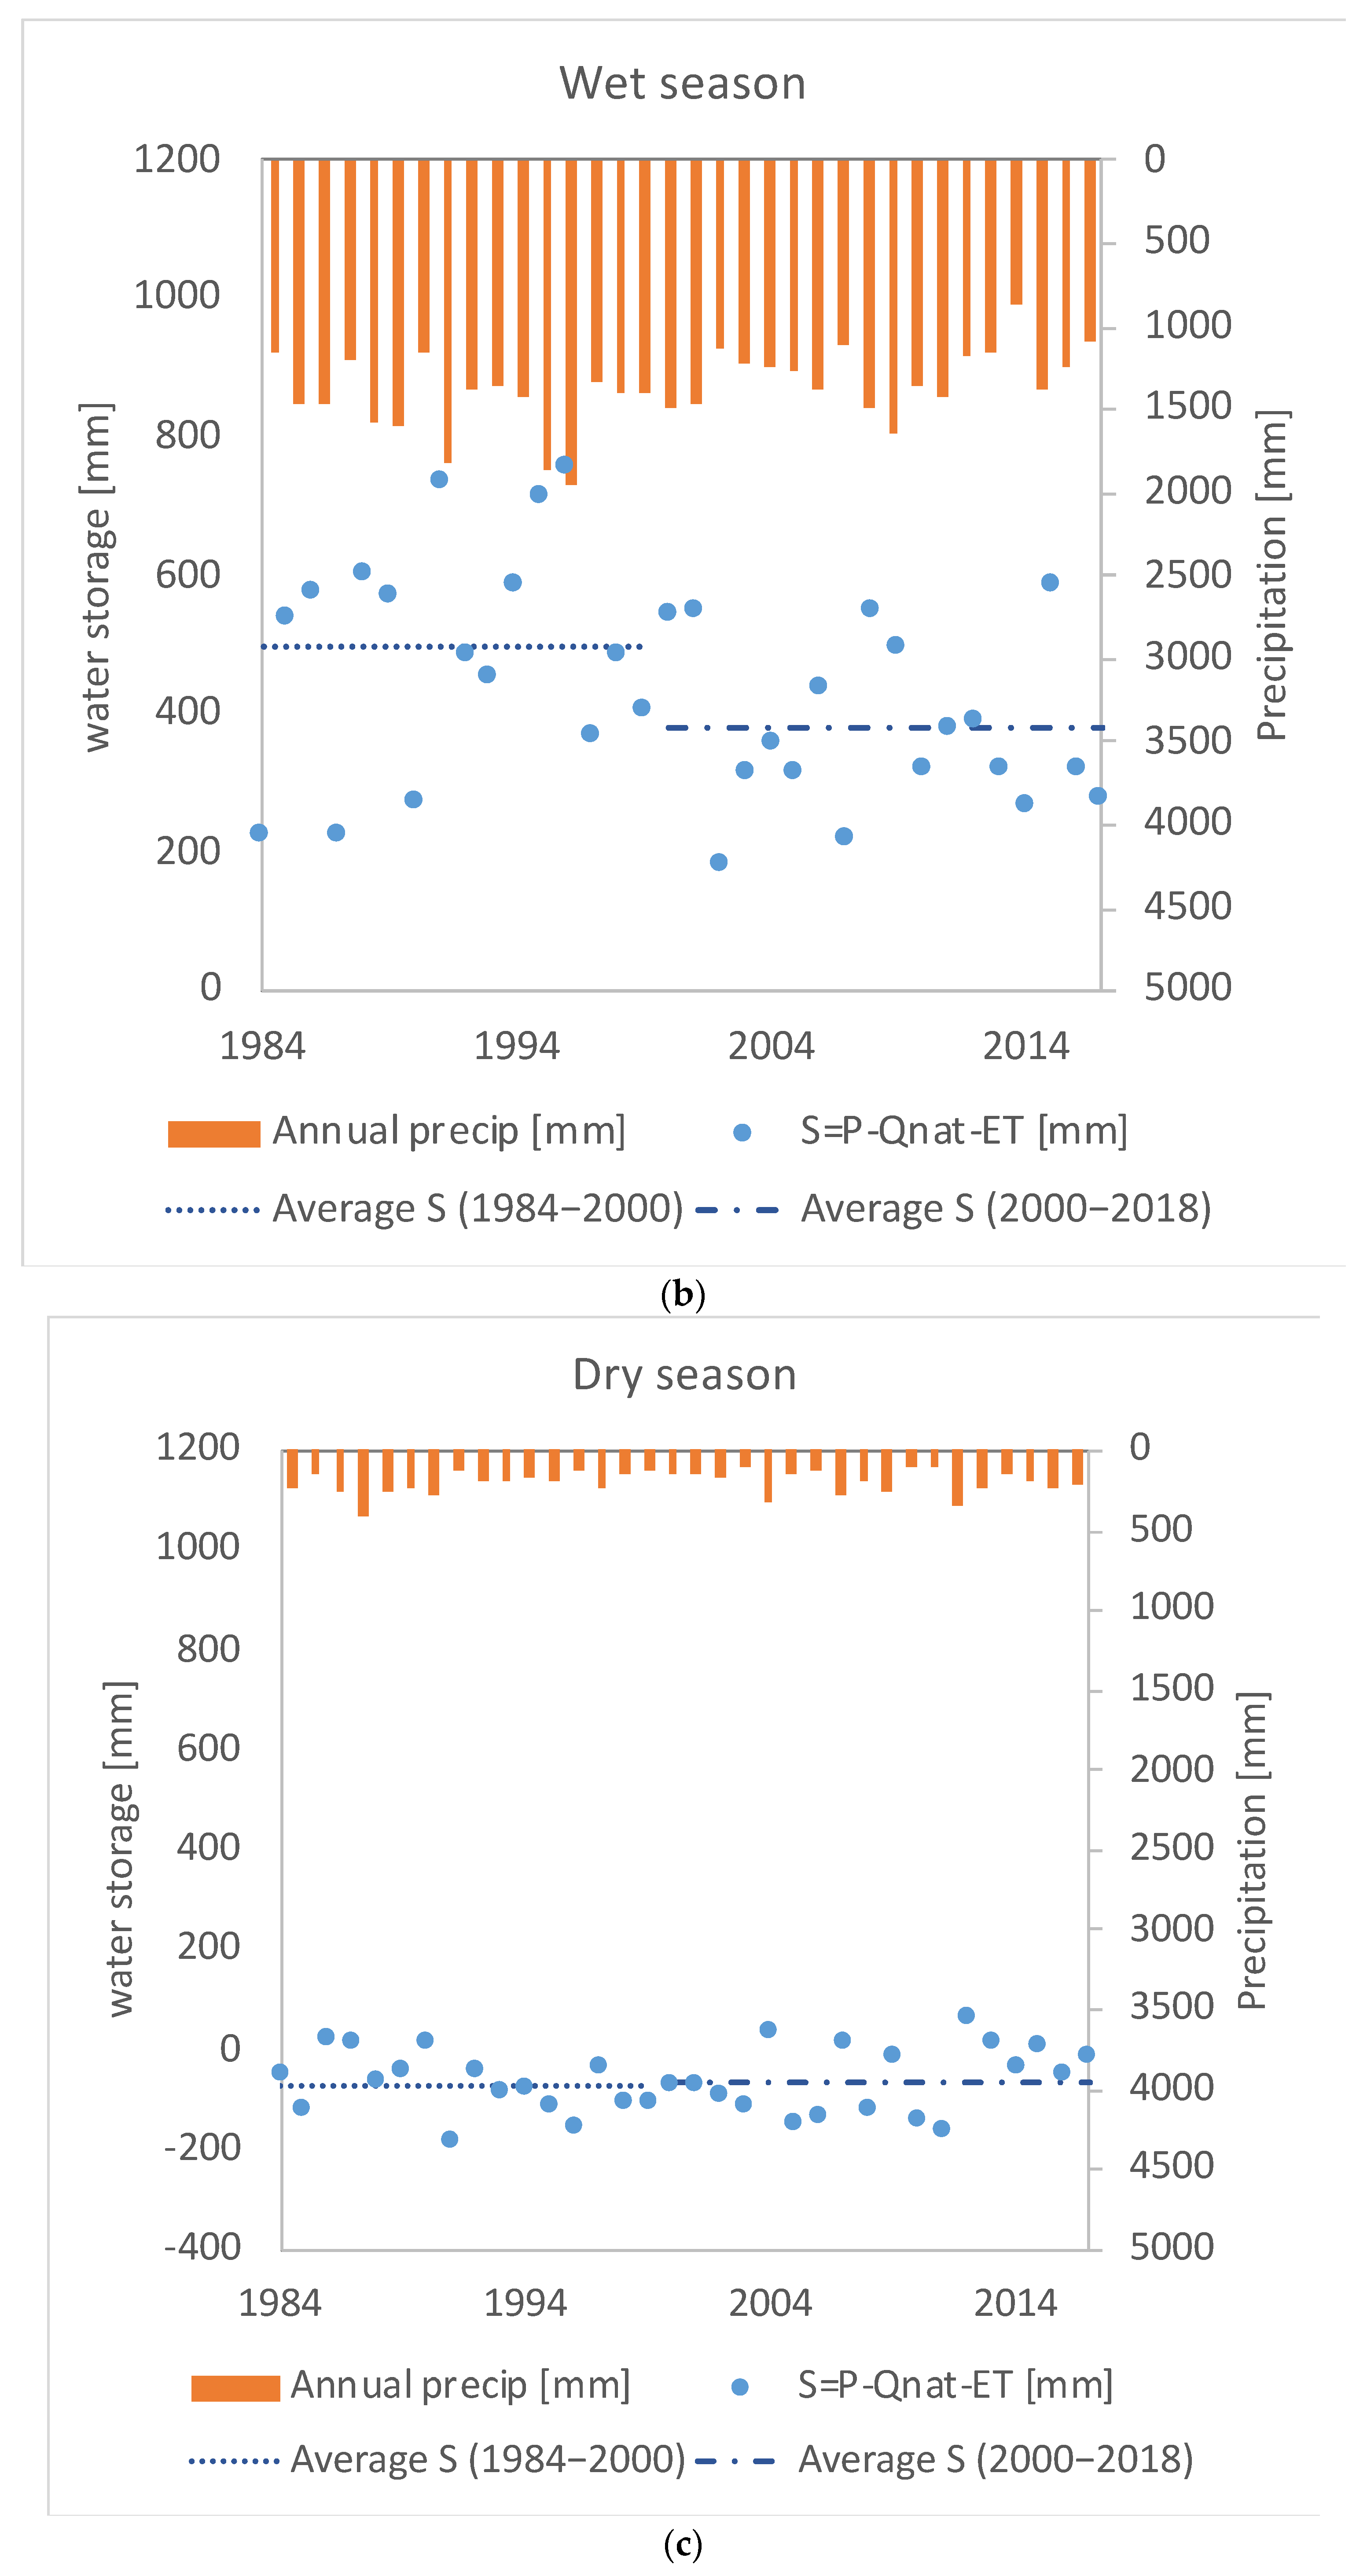
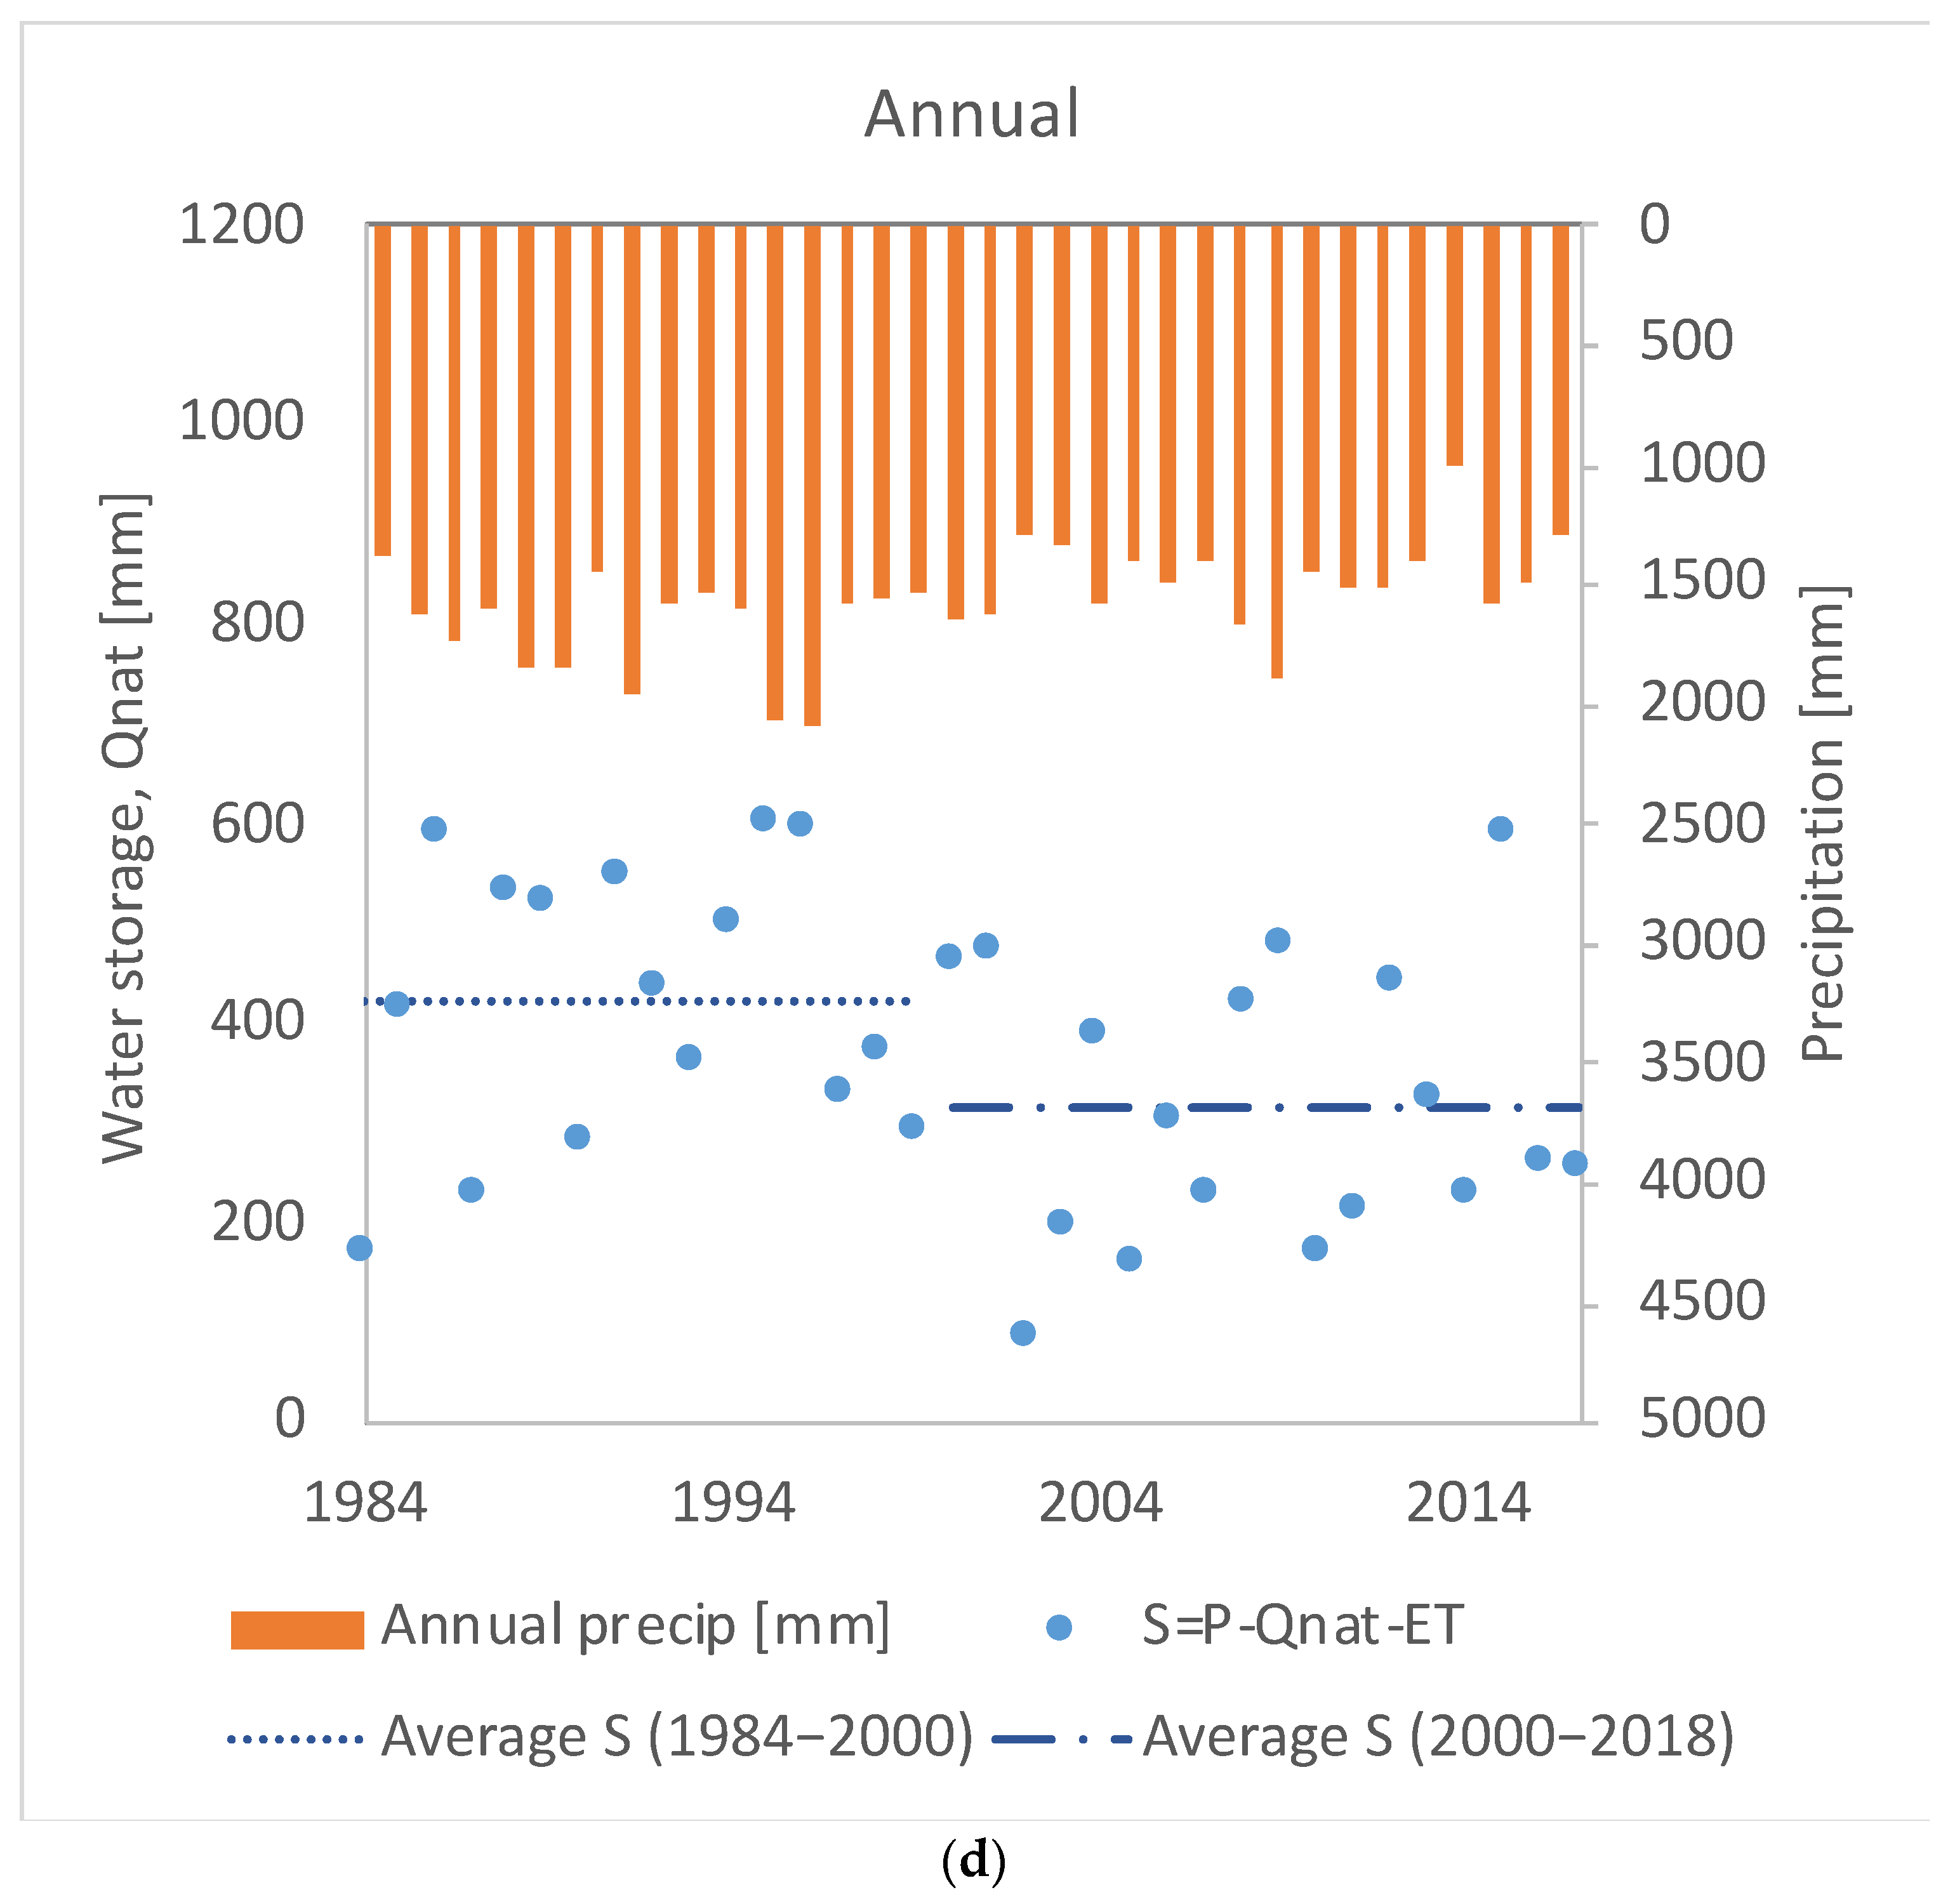
A water budget analysis, using measured monthly precipitation from eight rain gages (Figure A2), the ET rates of different land-cover, and the observed river flows at the watershed outlets, demonstrates a marked difference in the water balance, particularly in water storage, between the two periods marked by LULC change trends (i.e., before and after 2000) (Figure A3c). For example, in the Jaguari–Jacarei watershed, the largest reservoir of the CWSS, the mean annual water storage values declined by 138 mm during the wet season, water storage deficit decreased by 8 mm during the dry season, and the overall annual water storage in the CWSS decreased by 129 mm (Figure A3b–d).
Figure A2. Rain gages of Cantareira Water Supply System.
Water 15 00401 g0a2
Figure A3. (a) Monthly evapotranspiration rates of different crops and tree species synthesized from multiple field observations and modeling studies; (b) water balance during wet season; (c) dry season; (d) annual water balance of the Jaguari–Jacarei watershed.
Water 15 00401 g0a3aWater 15 00401 g0a3bWater 15 00401 g0a3c

Appendix B. Reduced-Complexity Nature and Engineered Infrastructure Simulation Model

Appendix B.1. Model Structure
Spatial resolution and extent
This simple model has spatial resolution defined in terms of flow accumulation and available data. Subbasins are delineated for streams defined as those cells with flow accumulation greater than 1000 cells (i.e., upstream catchment area >~10 km2). This demonstration model is built for the Jaguari watershed (1000 km2), which consists of 78 subbasins (Figure A5).
Temporal resolution
All model inputs and outputs represent mean annual values. Water balance data are derived from the climatic observations from global satellite data for 1950–2000 (e.g., MODIS, GRACE, LanSat, etc.) via WaterWorld model [47]. The spatially distributed water balance data at 90 m resolution are aggregated to subbasin scale. Long-term mean river discharge data are obtained from Global River Classification (GloRiC) database. The spatial scale of the discharge data is consistent with the subbasin delineation [48].
Conceptual framework
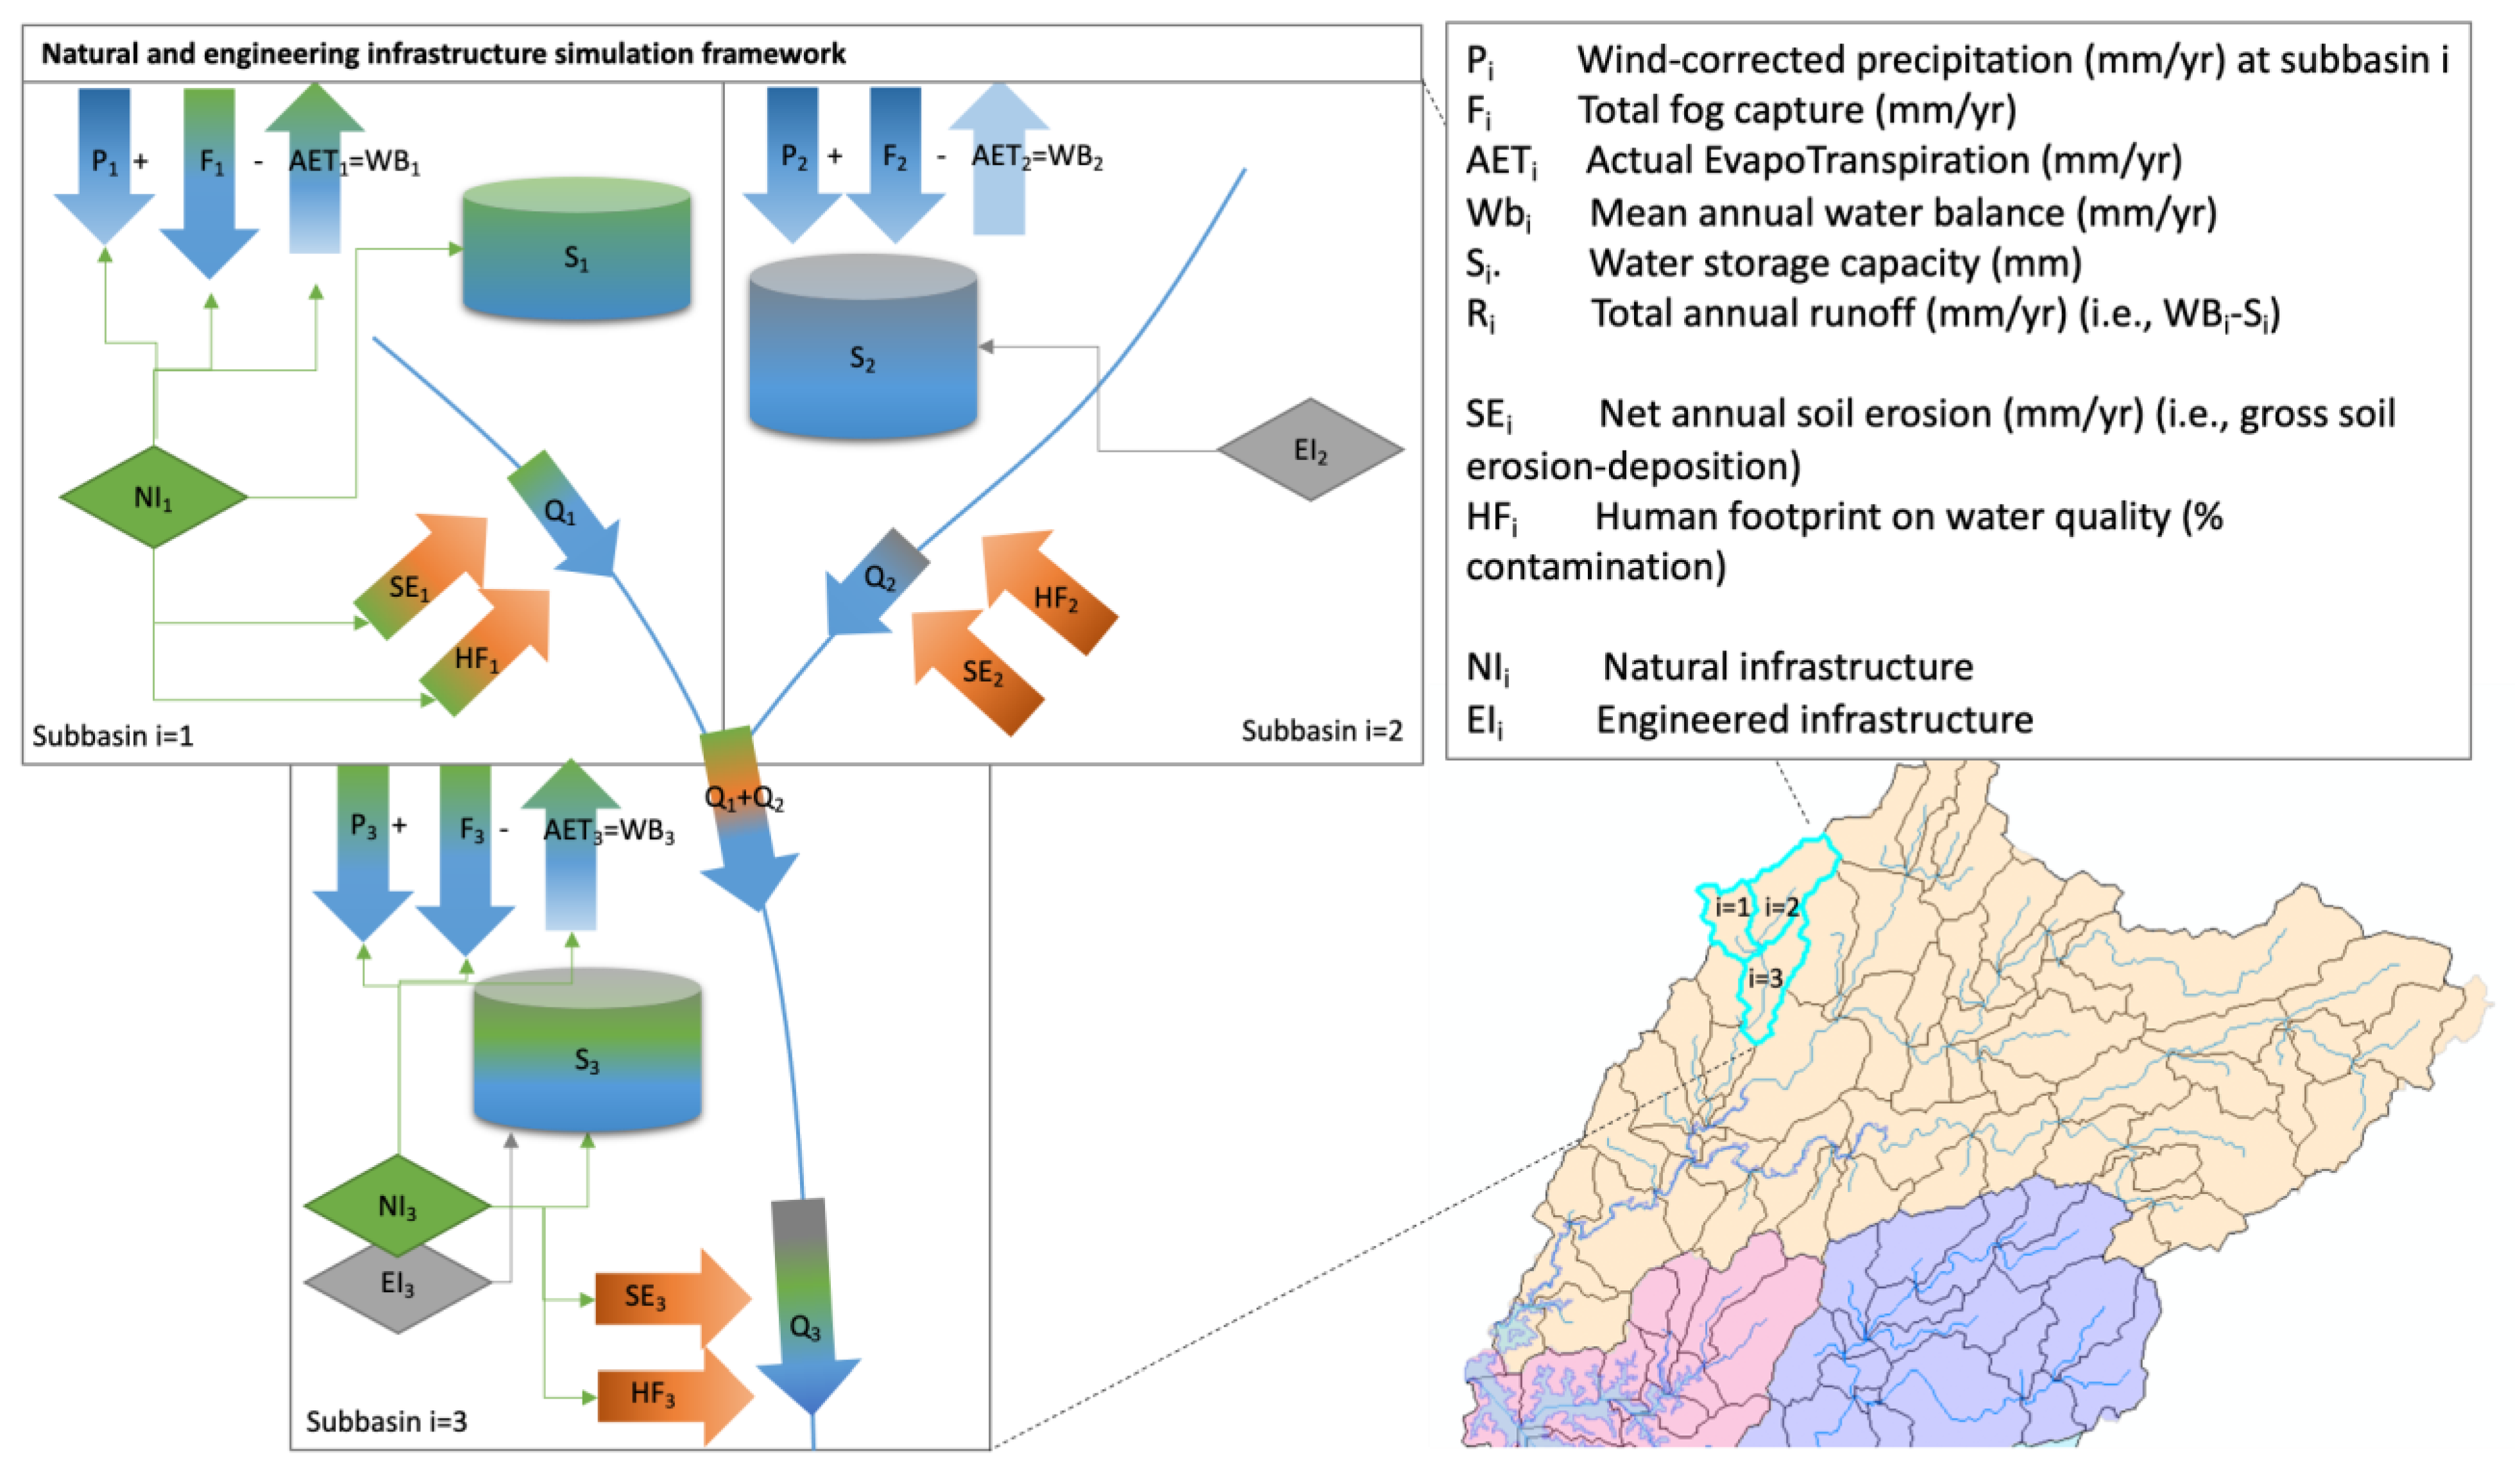
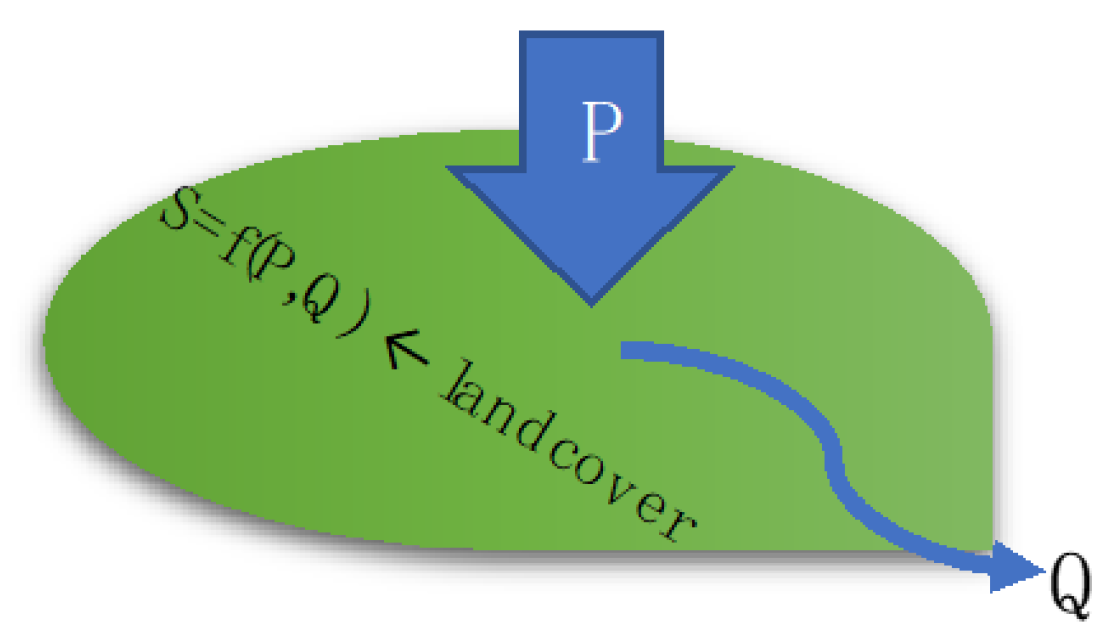
Given the water inputs from the water balance (P = precipitation + fog capture − AET) (Figure A4) and GloRic river discharge observations, water retention (S) at each subbasin is estimated (this is a simplifying assumption; with more detailed model framework, direct runoff and baseflow can be partitioned, but, since this model is intended to gather stakeholder inputs on best model functionality for our Decision Support System, we kept the model simple at this stage):
S = 2 λ P + Q ( 1 λ ) [ Q ( 1 λ ) ] ^ 2 + 4 λ Q P 2 λ ^ 2
where P is depth of precipitation, estimated from the water balance; Q is direct runoff, estimated as river discharge; and λ is the initial abstraction ratio, I a S (defulat value at 0.2).
Once the retention is calculated, curve number (CN, metric) at each subbasin is calculated (Curve number method offers a simple, empirical procedure to estimate rainfall–runoff process. There are other options for rainfall–runoff modeling that can capture more precise hydrologic processes. The complexity of the model should be determined based on the objective of the DSS.):
C N = 25400 S + 254
CN is basically an empirical parameter partitioning the direct runoff and infiltration retention. Completely impervious surface has CN = 100 and less value for more pervious surfaces (e.g., agriculture: ~62 < CN < ~91; pasture: ~39 < CN < ~89; forest: ~25 < CN < ~83 depending on hydrologic soil group and condition).
Figure A4. Water storage (S) depends of precipitation inputs (P) and discharge (Q) and influenced by landcover.
Water 15 00401 g0a4
Once the baseline CN and retention are calculated, the effects of changes in water balance (P’) and land surface (CN’) on runoff discharge may be simulated:
S = 25400 C N 254 Q = ( P λ S ) 2 P + ( 1 λ S )

Appendix B.2. Model Interface: Jaguari Watershed Is Divided into Three Zones

Zone 1 drains Rio Camanducaia, zone 2 drains upstream Rio Jaguari, and zone 3 drains Rio Jaguari after its confluence with Rio Camanducaia. Changes in water balance, runoff, and retention are illustrated select subbasins (SB) located at various confluence points in the watershed (Figure A5):
  • SB 54 in zone 1
  • SB 34 and SB 68 in zone 2, and
  • SB 80 and SB 100 in zone 3.
Figure A5. rcNEIS model framework shows the elements used in the simple water balance accounting.
Water 15 00401 g0a5
Changes in water balance, in terms of wind-corrected precipitation, fog capture, and actual evapotranspiration (AET), and changes in land surface, in terms of CN, can be entered (user input can be defined in terms of different conservation actions, and their effects on water balance and infiltration can be quantified from literature review and stakeholder/expert inputs) at the zone-level. The model will modify the water balance and infiltration capacity for all subbasins in each zone according to the user input in the table below (spatial resolution for conservation scenario inputs can be made finer than the zone-level proposed here). For example, entering 25% for “Fog capture” in zone 1 will result in a 25% increase in fog capture in all subbasins in zone 1. Likewise, entering −10% in “Land-cover” in zone 2 will result in a decrease in curve number by 10% to simulate higher infiltration capacity.
Model outputs are shown in bar charts (1) relative changes in runoff and retention (%); (2) river discharge (cms); and (3) water retention (mm/yr) at the select subbasins (SB34, SB68, SB54, SB80, and SB100):
Figure A6. rcNEIS model interface showing example outputs in selected subbasins (outlined in red) illustrates how water is distributed across the CWSS.
Water 15 00401 g0a6

References

  1. IPCC. Climate Change 2022: Impacts, Adaptation and Vulnerability. 2022. Available online: https://www.ipcc.ch/report/ar6/wg2/ (accessed on 25 March 2022).
  2. Loucks, D.P. Sustainable Water Resources Management. Water Int. 2000, 25, 3–10. [Google Scholar] [CrossRef]
  3. United Nations World Water Assessment Programme. World Water Development Report 2018: Nature-Based Solutions for Water; UNESCO: Paris, France, 2018; Available online: http://www.unwater.org/publications/world-water-development-report-2018/ (accessed on 27 September 2018).
  4. Guston, D.H. Stabilizing the Boundary between US Politics and Science: The Rôle of the Office of Technology Transfer as a Boundary Organization. Soc. Stud. Sci. 1999, 29, 87–111. [Google Scholar] [CrossRef] [PubMed]
  5. Nel, J.L.; Roux, D.J.; Driver, A.; Hill, L.; Maherry, A.C.; Snaddon, K.; Petersen, C.R.; Smith-Adao, L.B.; Van Deventer, H.; Reyers, B. Knowledge co-production and boundary work to promote implementation of conservation plans. Conserv. Biol. 2015, 30, 176–188. [Google Scholar] [CrossRef] [PubMed]
  6. Acosta, E.; Cho, S.J.; Klemz, C.; Raepple, J.; Ciasca, B.; Bracale, H. Biophysical benefits simulation modeling framework for investments in Nature-based Solutions in São Paulo-Brazil water supply system. Water, Under Review.
  7. Ciasca, B.; Klemz, C.; Acosta, E.; Cho, S.J.; Kroeger, T.; Barreto, S.; Bracale, H.; Cesario, F. Economic cost of drought and potential benefits of investing in Nature-based Solutions: A study case in São Paulo, Brazil. Water, Under Review.
  8. Ribeiro, M.C.; Metzger, J.P.; Martensen, A.C.; Ponzoni, F.J.; Hirota, M.M. The Brazilian Atlantic Forest: How much is left, and how is the remaining forest distributed? Implications for conservation. Biol. Conserv. 2009, 142, 1141–1153. [Google Scholar] [CrossRef]
  9. Taffarello, D.; Calijuri, M.D.C.; Viani, R.A.G.; Marengo, J.A.; Mendiondo, E.M. Hydrological services in the Atlantic Forest, Brazil: An ecosystem-based adaptation using ecohydrological monitoring. Clim. Serv. 2017, 8, 1–16. [Google Scholar] [CrossRef]
  10. Rezende, C.L.; Scarano, F.R.; Assad, E.D.; Joly, C.A.; Metzger, J.P.; Strassburg, B.B.N.; Tabarelli, M.; Fonseca, G.A.; Mittermeier, R.A. From hotspot to hopespot: An opportunity for the Brazilian Atlantic Forest. Perspect. Ecol. Conserv. 2018, 16, 208–214. [Google Scholar] [CrossRef]
  11. Nobre, C.A.; Young, A.F.; Saldiva, P.H.N.; Orsini, J.A.M.; Nobre, A.D.; Ogura, A.T.; Thomaz, O.; Párraga, G.O.O.; da Silva, G.C.M.; Valverde, M.; et al. Vulnerability of Brazilian Megacities to Climate Change: The São Paulo Metropolitan Region; International Policy Centre for Inclusive Growth: Brasilia, DF, Brazil, May 2012; p. 161. Available online: https://ideas.repec.org/p/ipc/opager/161.html (accessed on 27 September 2018).
  12. Nobre, C.A.; Marengo, J.A.; Seluchi, M.E.; Cuartas, L.A.; Alves, L.M. Some Characteristics and Impacts of the Drought and Water Crisis in Southeastern Brazil during 2014 and 2015. J. Water Resour. Prot. 2016, 8, 252–262. [Google Scholar] [CrossRef] [Green Version]
  13. Empinotti, V.L.; Budds, J.; Aversa, M. Governance and water security: The role of the water institutional framework in the 2013–15 water crisis in São Paulo, Brazil. Geoforum 2018, 98, 46–54. [Google Scholar] [CrossRef] [Green Version]
  14. Ministério do Meio Ambiente. Governo Federal Formaliza Conservação de Floresta Nativa como Atividade Econômica. 2021. Available online: https://www.gov.br/mma/pt-br/assuntos/noticias/governo-federal-formaliza-conservacao-de-floresta-nativa-como-atividade-economica (accessed on 6 January 2021).
  15. Marengo, J.A.; Chou, S.C.; Kay, G.; Alves, L.M.; Pesquero, J.F.; Soares, W.R.; Santos, D.C.; Lyra, A.A.; Sueiro, G.; Betts, R.; et al. Development of regional future climate change scenarios in South America using the Eta CPTEC/HadCM3 climate change projections: Climatology and regional analyses for the Amazon, São Francisco and the Paraná River basins. Clim. Dyn. 2011, 38, 1829–1848. [Google Scholar] [CrossRef]
  16. United Nations Environment Programme, Green Infrastructure: Guide for Water Management; UNEP: Nairobi, Kenya, 2014; Available online: https://www.unep.org/resources/publication/green-infrastructure-guide-water-management (accessed on 25 February 2021).
  17. Douglass, J. RIOS. Natural Capital Project. 26 April 2019. Available online: https://naturalcapitalproject.stanford.edu/software/rios (accessed on 2 March 2022).
  18. Mulligan, M.; Burke, S.M. FIESTA Fog Interception for the Enhancement of Streamflow in Tropical Areas FinalTechnical Report for AMBIOTEK; Kings College London and AmbioTECK CIC: London, UK, 2004; Available online: http://www.policysupport.org/fiesta-fogint (accessed on 4 May 2021).
  19. Arnold, J.G.; Kiniry, J.R.; Srinivasan, R.; Williams, J.R. Soil and Water Assessment Tool: Input/Output File Documentation (Version 2009). TR-365. September 2011. Available online: http://swat.tamu.edu/media/19754/swat-io-2009.pdf (accessed on 11 April 2013).
  20. Ogden, F.L.; Crouch, T.D.; Stallard, R.F.; Hall, J.S. Effect of land cover and use on dry season river runoff, runoff efficiency, and peak storm runoff in the seasonal tropics of Central Panama. Water Resour. Res. 2013, 49, 8443–8462. [Google Scholar] [CrossRef]
  21. Yu, Z.; Man, X.; Duan, L.; Cai, T. Assessments of Impacts of Climate and Forest Change on Water Resources Using SWAT Model in a Subboreal Watershed in Northern Da Hinggan Mountains. Water 2020, 12, 1565. [Google Scholar] [CrossRef]
  22. Zabaleta, A.; Meaurio, M.; Ruiz, E.; Antigüedad, I. Simulation Climate Change Impact on Runoff and Sediment Yield in a Small Watershed in the Basque Country, Northern Spain. J. Environ. Qual. 2014, 43, 235–245. [Google Scholar] [CrossRef] [PubMed]
  23. Pfannerstill, M.; Guse, B.; Fohrer, N. A multi-storage groundwater concept for the SWAT model to emphasize nonlinear groundwater dynamics in lowland catchments. Hydrol. Process. 2013, 28, 5599–5612. [Google Scholar] [CrossRef]
  24. INSTITUTO BRASILEIRO DE GEOGRAFIA E ESTATÍSTICA. Produto Interno Bruto dos Município 2018; Sidra: Rio de Janeiro, Brazil, 2020. Available online: https://sidra.ibge.gov.br/pesquisa/pib-munic/tabelas (accessed on 3 July 2022).
  25. Giordano, R.; Pluchinotta, I.; Pagano, A.; Scrieciu, A.; Nanu, F. Enhancing nature-based solutions acceptance through stakeholders’ engagement in co-benefits identification and trade-offs analysis. Sci. Total Environ. 2020, 713, 136552. [Google Scholar] [CrossRef]
  26. Cassin, J.; Matthews, J.H. Chapter 1—Setting the scene: Nature-based solutions and water security. In Nature-Based Solutions and Water Security; Cassin, J., Matthews, J.H., Gunn, E.L., Eds.; Elsevier: Amsterdam, The Netherlands, 2021; pp. 3–18. [Google Scholar] [CrossRef]
  27. Seddon, N.; Smith, A.; Smith, P.; Key, I.; Chausson, A.; Girardin, C.; House, J.; Srivastava, S.; Turner, B. Getting the message right on nature-based solutions to climate change. Glob. Chang. Biol. 2021, 27, 1518–1546. [Google Scholar] [CrossRef]
  28. Browder, G.; Ozment, S.; Bescos, I.R.; Gartner, T.; Lange, G.-M. Integrating Green and Gray: Creating Next Generation Infrastructure; World Bank: Washington, DC, USA, 2019. [Google Scholar] [CrossRef]
  29. Weiland, S. Sustainability transitions in transition countries: Forest policy reforms in South-eastern Europe. Environ. Policy Gov. 2010, 20, 397–407. [Google Scholar] [CrossRef]
  30. Xi, W.; Wang, F.; Shi, P.; Dai, E.; Anoruo, A.O.; Bi, H.; Rahmlow, A.; He, B.; Li, W. Challenges to Sustainable Development in China: A Review of Six Large-Scale Forest Restoration and Land Conservation Programs. J. Sustain. For. 2014, 33, 435–453. [Google Scholar] [CrossRef]
  31. Tajuddin, T.; Supratman, S.; Salman, D.; Yusran, Y. Bridging social forestry and forest management units: Juxtaposing policy imaginaries with implementation practices in a case from Sulawesi. For. Soc. 2019, 3, 97–113. [Google Scholar] [CrossRef]
  32. Sahide, M.A.K.; Fisher, M.; Nasri, N.; Dharmiasih, W.; Verheijen, B.; Maryudi, A. Anticipating a new conservation bureaucracy? Land and power in Indonesia’s Essential Ecosystem Area policy. Land Use Policy 2020, 97, 104789. [Google Scholar] [CrossRef]
  33. Dominique, K.; Matthews, N.; Danielson, L.; Matthews, J.H. Chapter 6—Why governments embrace nature-based solutions: The policy rationale. In Nature-Based Solutions and Water Security; Cassin, J., Matthews, J.H., Gunn, E.L., Eds.; Elsevier: Amsterdam, The Netherlands, 2021; pp. 109–124. [Google Scholar] [CrossRef]
  34. Palmer, R.N. A History of Shared Vision Modeling in the ACT-ACF Comprehensive Study: A Modeler’s Perspective. In Coordination: Water Resources and Environment; ASCE: New York, NY, USA, 1998; pp. 221–226. [Google Scholar]
  35. US Army Corps of Engineers. Welcome to Shared Vision Planning. 13 February 2009. Available online: http://www.sharedvisionplanning.us/ (accessed on 5 October 2012).
  36. Cho, S.J.; Wilcock, P.R.; Belmont, P.; Gran, K.B.; Hobbs, B.F. Simulation Model for Collaborative Decision Making on Sediment Source Reduction in an Intensively Managed Watershed. Water Resour. Res. 2019, 55, 1544–1564. [Google Scholar] [CrossRef]
  37. Falconi, S.M.; Palmer, R.N. An interdisciplinary framework for participatory modeling design and evaluation—What makes models effective participatory decision tools? Water Resour. Res. 2017, 53, 1625–1645. [Google Scholar] [CrossRef]
  38. Megdal, S.B.; Eden, S.; Shamir, E. Water Governance, Stakeholder Engagement, and Sustainable Water Resources Management. Water 2017, 9, 190. [Google Scholar] [CrossRef] [Green Version]
  39. Barbosa, M.C.; Mushtaq, S.; Alam, K. Integrated water resources management: Are river basin committees in Brazil enabling effective stakeholder interaction? Environ. Sci. Policy 2017, 76, 1–11. [Google Scholar] [CrossRef]
  40. Cowie, G.M.; Borrett, S.R. Institutional perspectives on participation and information in water management. Environ. Model. Softw. 2005, 20, 469–483. [Google Scholar] [CrossRef]
  41. Voinov, A.; Bousquet, F. Modelling with stakeholders. Environ. Model. Softw. 2010, 25, 1268–1281. [Google Scholar] [CrossRef]
  42. Lacroix, K.E.M.; Megdal, S.B. Explore, Synthesize, and Repeat: Unraveling Complex Water Management Issues through the Stakeholder Engagement Wheel. Water 2016, 8, 118. [Google Scholar] [CrossRef] [Green Version]
  43. ABAR. O Papel Das Agências Reguladoras De Saneamento E Dos Prestadores De Serviços Na Proteção De Mananciais Para Segurança Hídrica; ABAR—Associação Brasileira de Agências de Regulação: Brasília, Brazil, 2021; Available online: https://abar.org.br/mdocs-posts/o-papel-das-agencias-reguladoras-de-saneamento-e-dos-prestadores-de-servicos-na-protecao-de-mananciais-para-seguranca-hidrica/ (accessed on 3 January 2023).
  44. Mattos, T.S.; de Oliveira, P.T.S.; Lucas, M.C.; Wendland, E. Groundwater Recharge Decrease Replacing Pasture by Eucalyptus Plantation. Water 2019, 11, 1213. [Google Scholar] [CrossRef]
  45. Lima, W.; Zakia, M.; Libardi, P.; Filho, A. Comparative evapotranspiration of Eucalyptus, pine, and natural ‘Cerrado’ vegetation measures by the soil water balance method. IPEP Int. 1990, 1, 5–11. [Google Scholar]
  46. da Silva, B.B.; Wilcox, B.P.; Silva, V.D.P.R.D.; Montenegro, S.M.G.L.; de Oliveira, L.M.M. Changes to the energy budget and evapotranspiration following conversion of tropical savannas to agricultural lands in São Paulo State, Brazil. Ecohydrology 2014, 8, 1272–1283. [Google Scholar] [CrossRef]
  47. Mulligan, M. WaterWorld: A self-parameterising, physically based model for application in data-poor but problem-rich environments globally. Hydrol. Res. 2012, 44, 748–769. [Google Scholar] [CrossRef]
  48. GloRiC. Available online: https://www.hydrosheds.org/products/gloric (accessed on 3 January 2023).
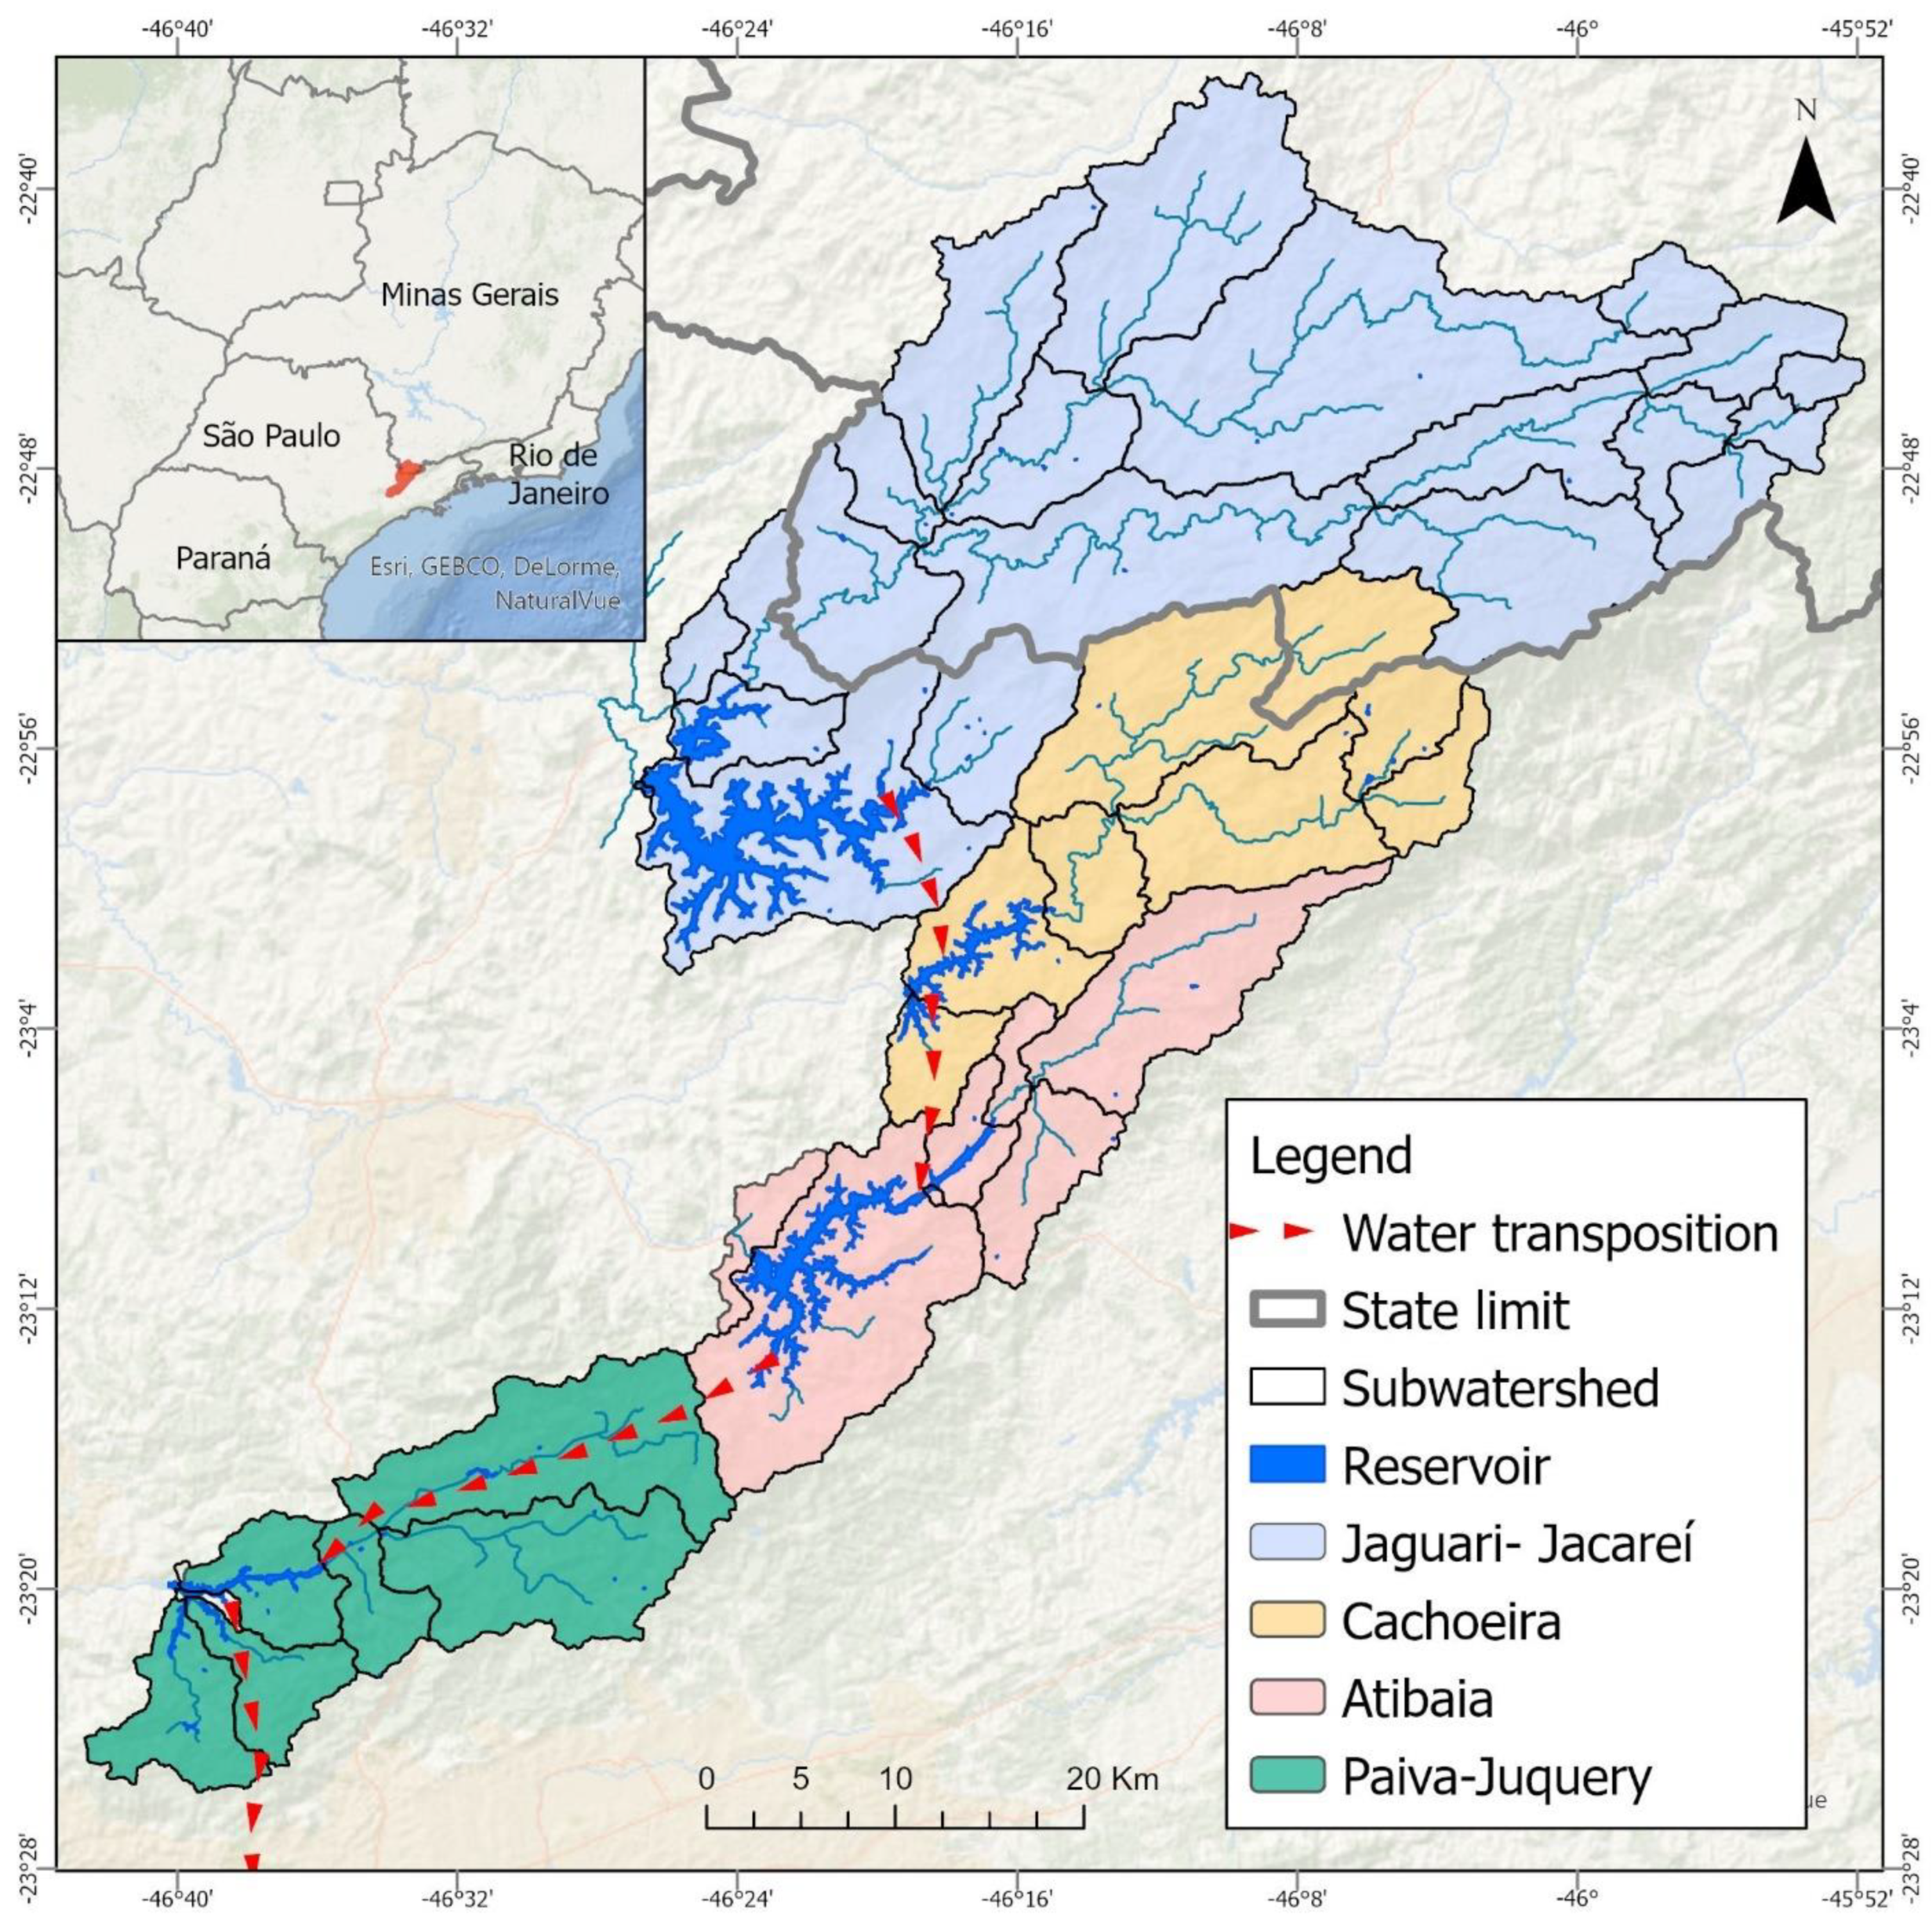
Figure 1. Geographic scope of the modeling exercise includes five subwatersheds and reservoirs of the Cantareira system. Red dotted line shows the direction of water transposition.
Water 15 00401 g001
Figure 2. Iterative stakeholder engagement and collaborative modeling process to address complex water resources management challenges.
Water 15 00401 g002
Figure 3. Project timeline and stakeholder engagement process.
Water 15 00401 g003
Figure 4. Conservation actions’ impact on water quantity and quality of a watershed.
Water 15 00401 g004
Figure 5. Areas covered (in % of the CWSS extent) by the NbS scenarios (green polygons): (a) minimum intervention, (b) enhanced intervention, and (c) customized RIOS (adopted from Acosta et al. [6] Figure 1).
Water 15 00401 g005
Figure 6. Co-development of long-term hydrologic simulation model over the course of the project by adapting the stakeholders’ existing hydrologic modeling framework.
Water 15 00401 g006
Figure 7. Multi-model synthesis framework illustrates model integration from identification of intervention sites, computation of fog capture potential for each NbS scenario, and simulation of the scenarios using two comparative hydrologic simulation models.
Water 15 00401 g007
Figure 8. Synthesis of multiple lines of historical environmental data and landscape simulation models and economic analysis.
Water 15 00401 g008
Figure 9. Average observed daily inflow rates from years 1988 to 2018 are compared with calibrated and validated HEC-HMS and SWAT model outputs.
Water 15 00401 g009
Figure 10. Average monthly river discharge and the changes with each scenario (minimum intervention (MI); enhanced intervention (EI), and RIOS) at each watershed outlet location (Jaguari–Jacarei (Jag–Jac), Cachoeira (Cach), Antibainha (Ati), and Paiva Castro (Paiv) reservoirs) from HEC-HMS simulations for (a) the entire simulation period and (b) drought years 2013–2015.
Water 15 00401 g010aWater 15 00401 g010b
Figure 11. SWAT monthly average water balance outputs for the 2013–2015 drought period (comparing customized RIOS scenario against baseline (LB)).
Water 15 00401 g011
Table 1. Estimated economic losses associated with 2014–2015 drought condition.
Industry Gross Value Added (GVA) loss in municipalities on Cantareira System (USD 1000)
Municipalities20142015Total 2014–2015
Bragança Paulista0 43.481 43.481
Caieiras0 150.314 150.314
Franco da Rocha4.104 73.653 77.757
Joanópolis 448 0 448
Mairiporã9.044 13.839 22.882
Nazaré Paulista 0 3.728 3.728
Piracaia 906 3.078 3.984
Vargem 0 43.481 43.481
Total14.502 288.092 302.594
Water supply and sewage sector Net Value Added (NVA) loss in municipalities served by Cantareira System (USD 1000)
Municipalities20142015Total 2014–2015
Caieiras 650 600 1.250
Francisco Morato708 706 1.414
Franco da Rocha1.320 1.121 2.441
Guarulhos5.359 5.230 10.589
Osasco5.655 4.860 10.515
Santo André2.654 2.572 5.226
São Caetano do Sul2.871 2.579 5.451
São Paulo58.663 51.602 110.265
Total77.880 69.270 147.151
Table 2. Summary of the mitigated financial losses in the industry gross value added (GVA) and the revenues in the supply sector under the RIOS scenario.
Avoided costs in the industry with a RIOS scenario (USD 1000)
2014–2015
Industry GVA loss in the Cantareira System municipalities (I)302.691
Industry GVA loss in the Cantareira System municipalities under the RIOS scenario (II)220.266
Avoided industry GVA financial losses with the RIOS scenario (III = I–II)82.425
Percentage of avoided industry GVA financial losses (%) (IV = III/I)27%
Avoided costs in the water supply and sanitation services with the RIOS scenario (USD 1000)
2014–2015
Loss of water and sanitation services NVA in the municipalities served by the Cantareira System (V) 147.198
Loss of water and sanitation services NVA in the municipalities served by the Cantareira System under the RIOS scenario (VI)105.590
Avoided financial loss of water and sanitation services NVA with RIOS (VII = V–VI)41.608
Percentage of avoided financial loss of water and sanitation services NVA with RIOS scenario (%) (VIII = VII/V)28%
Total avoided financial loss (IX = III + VII)124.032
Percentage of total avoided financial loss (%) [X = IX/(I + V)]28%
Disclaimer/Publisher’s Note: The statements, opinions and data contained in all publications are solely those of the individual author(s) and contributor(s) and not of MDPI and/or the editor(s). MDPI and/or the editor(s) disclaim responsibility for any injury to people or property resulting from any ideas, methods, instructions or products referred to in the content.