Article

Upgrading the MBBR Process to Reduce Excess Sludge Production in Activated Sludge System Treating Sewage

by
Duaa Natheer Khudhair
1,
Majid Hosseinzadeh
1,
Haider M. Zwain
2,
Seyed Mostafa Siadatmousavi
1,*,
Ali Majdi
3 and
Amin Mojiri
4,*
1
School of Civil Engineering, Iran University of Science and Technology, Narmak, Tehran 1684613114, Iran
2
College of Engineering, Al-Qasim Green University, Al-Qasim Province, Babylon 51001, Iraq
3
Building and Construction Techniques Engineering Department, Al-Mustaqbal University College, Hillah 51001, Iraq
4
Department of Civil and Environmental Engineering, Graduate School of Advanced Science and Engineering, Hiroshima University, Higashihiroshima 739-8725, Japan
*
Authors to whom correspondence should be addressed.
Water 2023, 15(3), 408; https://doi.org/10.3390/w15030408
Submission received: 17 December 2022 / Revised: 12 January 2023 / Accepted: 17 January 2023 / Published: 19 January 2023
(This article belongs to the Section Wastewater Treatment and Reuse)

Abstract

:
Excess sludge production is one of the limitations of the biological activated sludge process. Therefore, the study’s objective is to upgrade the MBBR process to an integrated fixed film-activated sludge (IFAS) process to reduce excess sludge production. Two scenarios were followed in this study to eliminate sludge production in the biological activated sludge process: first, modifying the moving bed biofilm reactor (MBBR) system by increasing the solid retention time (SRT) from 5 to 15 days; and second, upgrading the MBBR process to the integrated fixed-film activated sludge (IFAS) process by applying return activated sludge (RAS) of 50, 100 and 150% with operating hydraulic retention time (HRT) of 6, 12, 14 and 20 h. The results revealed that the first scenario reduced sludge production from 750 to 150 g/day, whereas the second scenario eliminated sludge generation. In the second scenario, operating the system as an IFAS process with complete SRT has eliminated sludge due to sludge decay and cell lysis. In part 3 of the second scenario, the results also showed that the system achieved low effluent pollutants concentrations of 3, 12, 8 and 45 mg/L for BOD, COD, TSS and NO3, respectively. Operating at complete SRT may eliminate sludge production but also result in higher NO3 effluent concentration due to the production of NH3 from sludge decay and cell lysis. To conclude, sludge elimination in an activated sludge system is possible by carefully controlling the process and applying RAS without additional treatment.

1. Introduction

The biological wastewater treatment process is the most effective choice for treating organic pollutants and nutrient removal from domestic and industrial wastewater. As a traditional bio-process, the activated sludge process (ASP) has been used for over a hundred years in wastewater treatment plants due to cost and treatment efficiency considerations [1]. ASP’s biological and physical properties influence the sedimentation process, treatment efficiency and net sludge formation in Wastewater Treatment Plants (WWTPs). In general, the mixed liquor suspended solids (MLSS) concentration, the food-to-microorganisms ratio (F/M), the substrate utilization rate (SUR), the solids retention time (SRT), the hydraulic retention time (HRT), the dissolved oxygen (DO), the waste activated sludge (WAS) production and the return activated sludge (RAS) rate are the operating conditions that affect the characteristics of activated sludge (AS) in biological treatment [2].
However, the ASP is associated with a large amount of WAS produced during treatment, which has brought about new disposal challenges due to toxic organic substances, pathogenic organisms and heavy metals in WAS [3]. The suspended biofilm process, particularly the moving bed biofilm reactor system (MBBR), has gained more attention as an upgrading process of the ASP due to its capacity to achieve high active biomass concentration and excellent in situ sludge reduction [4]. Biomass in the MBBR process grows attached to the floating carriers, which then move continually inside the reactor. The amount of biomass attached to the carriers in an MBBR has a crucial impact in determining the amount of microbes that are attached, the amount of biomass that is retained and the amount of pollutant that is degraded [5].
However, the production of sludge with undesirable settling characteristics and light biomass flocs are significant issues with MBBR systems since it lowers the effluent quality and increases sludge handling costs. One of the primary concerns in WWTP operation is the treatment and disposal of excess sludge produced by biological processes. In fact, associated expenditures can account for up to 60% of the total operating costs of WWTPs; in addition, the limitations imposed by current regulations on sludge quality for disposal in landfills or agricultural applications make it more challenging to identify final disposal alternatives [6]. It is also important to note that sludge production will likely increase soon. This is because both WWTPs and sewage networks are expanding and becoming bigger and cleaner water is needed to protect the environment. These difficulties will increase the expenses of sludge treatment, post-processing, handling, transportation and disposal. Minimizing sludge formation is one of the most effective ways to lower these expenses [7]. The numerous technologies and procedures developed for this aim can be categorized into two broad categories: (1) those operating to create a net decrease of the bacterial growth yield in the sludge production process, such as via the uncoupling metabolism; (2) those promoting lysis of the new bacterial cells by disintegration, which may entail mechanical, chemical, thermal, or biological factors [8]. However, most of these technologies introduce additional costs for WWTP operation, increase the management complexity, require additional new treatment units and have some adverse effects on plant treatment efficiency (e.g., more nitrogen and COD in the bioreactor to be oxidized and higher turbidity in the final effluent) [7].Moreover, there are limited studies on optimizing WASs within the wastewater treatment process, where high SRT leads to a low sludge stream. Therefore, this study aims to upgrade the MBBR process to an integrated fixed-film activated sludge (IFAS) process to reduce excess sludge production. Two scenarios achieve this: first is a different HRT of 9, 18 and 26 days (MBBR processes upgrading) to reduce excess sludge production; second is a different RAS of 50, 100 and 150% (IFAS processes upgrading) to eliminate sludge totally. The main novelty of this research in comparison to most of the past investigations consists of high sludge minimization by modifying the MBBR process and controlling the SRT without additional treatment units and cost.

2. Materials and Methods

2.1. Pilot System Set-Up

The schematic design of the MBBR system is shown in Figure 1a and design parameters are shown in Table 1. The reactor is made of iron and the dimensions were 1 × 1.1 × 2 m3, with an effective volume of 2 m3. The system scale-up factor is (1:82) assuming that the full-scale plant treated 1000 m3/d. A lamella sedimentation basin with a surface area of one-third of the MBBR volume (with a width, height and length of 1, 1 and 2 m, respectively) is also manufactured. It is supplied with two air blowers, five tube diffusers, DO meters, inlet wastewater pumps and panel control. The diffused air was found sufficient to stir the content of the reactor. The reactor was loaded with 40% plastic (HDPE) bio-carrier of the total effective volume. The bio-carrier had a diameter of 15 mm, 10 mm height, a density of 0.96 g/cm3 and a specific surface area of roughly 500 m2/m3. This shape was selected based on the availability in the market and utilization experience in other system setups. A screen was provided at the outlet to prevent the bio-carriers from escaping the system to the sedimentation tank. The lifespan of the bio-carriers is more than 7 years and after use, it can be cleaned by sulfuric acid and reused in new systems.
The pilot reactor function was modified to combine the attached and suspended bacterial growth processes; an upgraded system of MBBR for IFAS is shown in Figure 1b. The system is designed to treat 5 m3/day discharge with projected organic matter and nutrient removal efficiency of up to 95%. The system contains two parts: the first is designed to treat the total BOD by heterotrophic bacteria and NH4 by autotrophic bacteria and the second is a sedimentation basin to remove suspended solids. Air blowers and tube diffusers were used to supply more than 4 mg/L of DO to oxidize pollutants. It is equipped with a returned activated sludge (RAS) pump to operate it along with the IFAS process, as seen in Figure 1a.

2.2. Wastewater and Seed Sludge Characteristics

This study collected influent from the Karbala wastewater treatment plant (WWTP) influent inlet after the grit chamber. The collected samples of sewage were transported to the Karbala Sewer Directorate Laboratory for physicochemical characteristics and tested according to standard Methods of Water and Wastewater Examination [9]. Samples were examined and averaged for 12 months; the influent and effluent results for COD, BOD, TSS, NO3, NH4, PO4 and H2S are shown in Table 2. Different seeding sludge samples were collected from the Karbala WWTP aerobic-anoxic-oxic (A2/O) system. The seed used in the pilot’s first stage was taken from the anaerobic tank of phosphorous removal, as it contains a heterotrophic bacteria source with a DO concentration of less than 0.2 mg/L. The second part of the system was inoculated by seed from the oxic tank’s internal recirculation to the anoxic tank, as it contains autotrophic bacteria with a DO concentration of less than 2.5 mg/L. Heterotrophic and autotrophic seeds had MLSS concentrations of 3000 to 4000 mg/L.

2.3. Pilot System Start-Up and Sampling Procedures

The pilot was in operation for 18 months, with the operating period divided into two phases: the dynamic state (start-up) and the steady state. The pilot’s start-up was divided into two scenarios: batch feeding for seven days and continuous feeding for six days until reaching a steady state. In the batch feeding phase, samples were taken from inside the system, while in the continuous feeding phase, samples were taken from the sedimentation basin outlet. Throughout the start-up, three samples were tested daily to measure the concentrations of TSS, BOD, COD, NO3 and NH4 and average values only were reported. To measure biofilm formation, 10 (4% of the total carriers counts of 252) carriers were taken from the system to measure the size of biofilm over the carrier. Thereafter, the carriers were dried at 100 °C to measure the weight and burned at 550 °C to analyze the VSS concentration.
The start-up procedure was adapted from Faris et al. [10] as follows:
  • On the first day, the pilot was supplied with 0.5 m3/day, representing 10% of the total process flow. The air blower was operated after initial influent feeding until DO levels reached 4 mg/L.
  • On the second day, an additional 10% of the process flow was fed into the pilot MBBR to reach 1 m3/day discharge. The DO was maintained at 4.5 mg/L and 25% of the total volume was introduced as media.
  • On the third day, another 20% of flowrate was introduced to become the amount of discharge within 2 m3/day, adding another 25% of media.
  • On the fourth day, 20% of the mainstream were fed into the pilot to achieve 3 m3/day discharge. On this day, the heterotrophic seed was added to the first phase of the pilot, while the autotrophic seed was added to the second phase. The amount of seed per phase was 0.5 L.
  • On the fifth day, 20% of the flow rate was introduced to reach 4 m3/day discharge, along with a 25% increase in media.
  • On the sixth day, the influent was added to complete the total amount of media supplied for the design, along with 0.5 L of seed for each phase. Throughout the six days, DO concentrations were maintained between 4 and 5 mg/L.

2.4. Pilot System Operation Scenarios

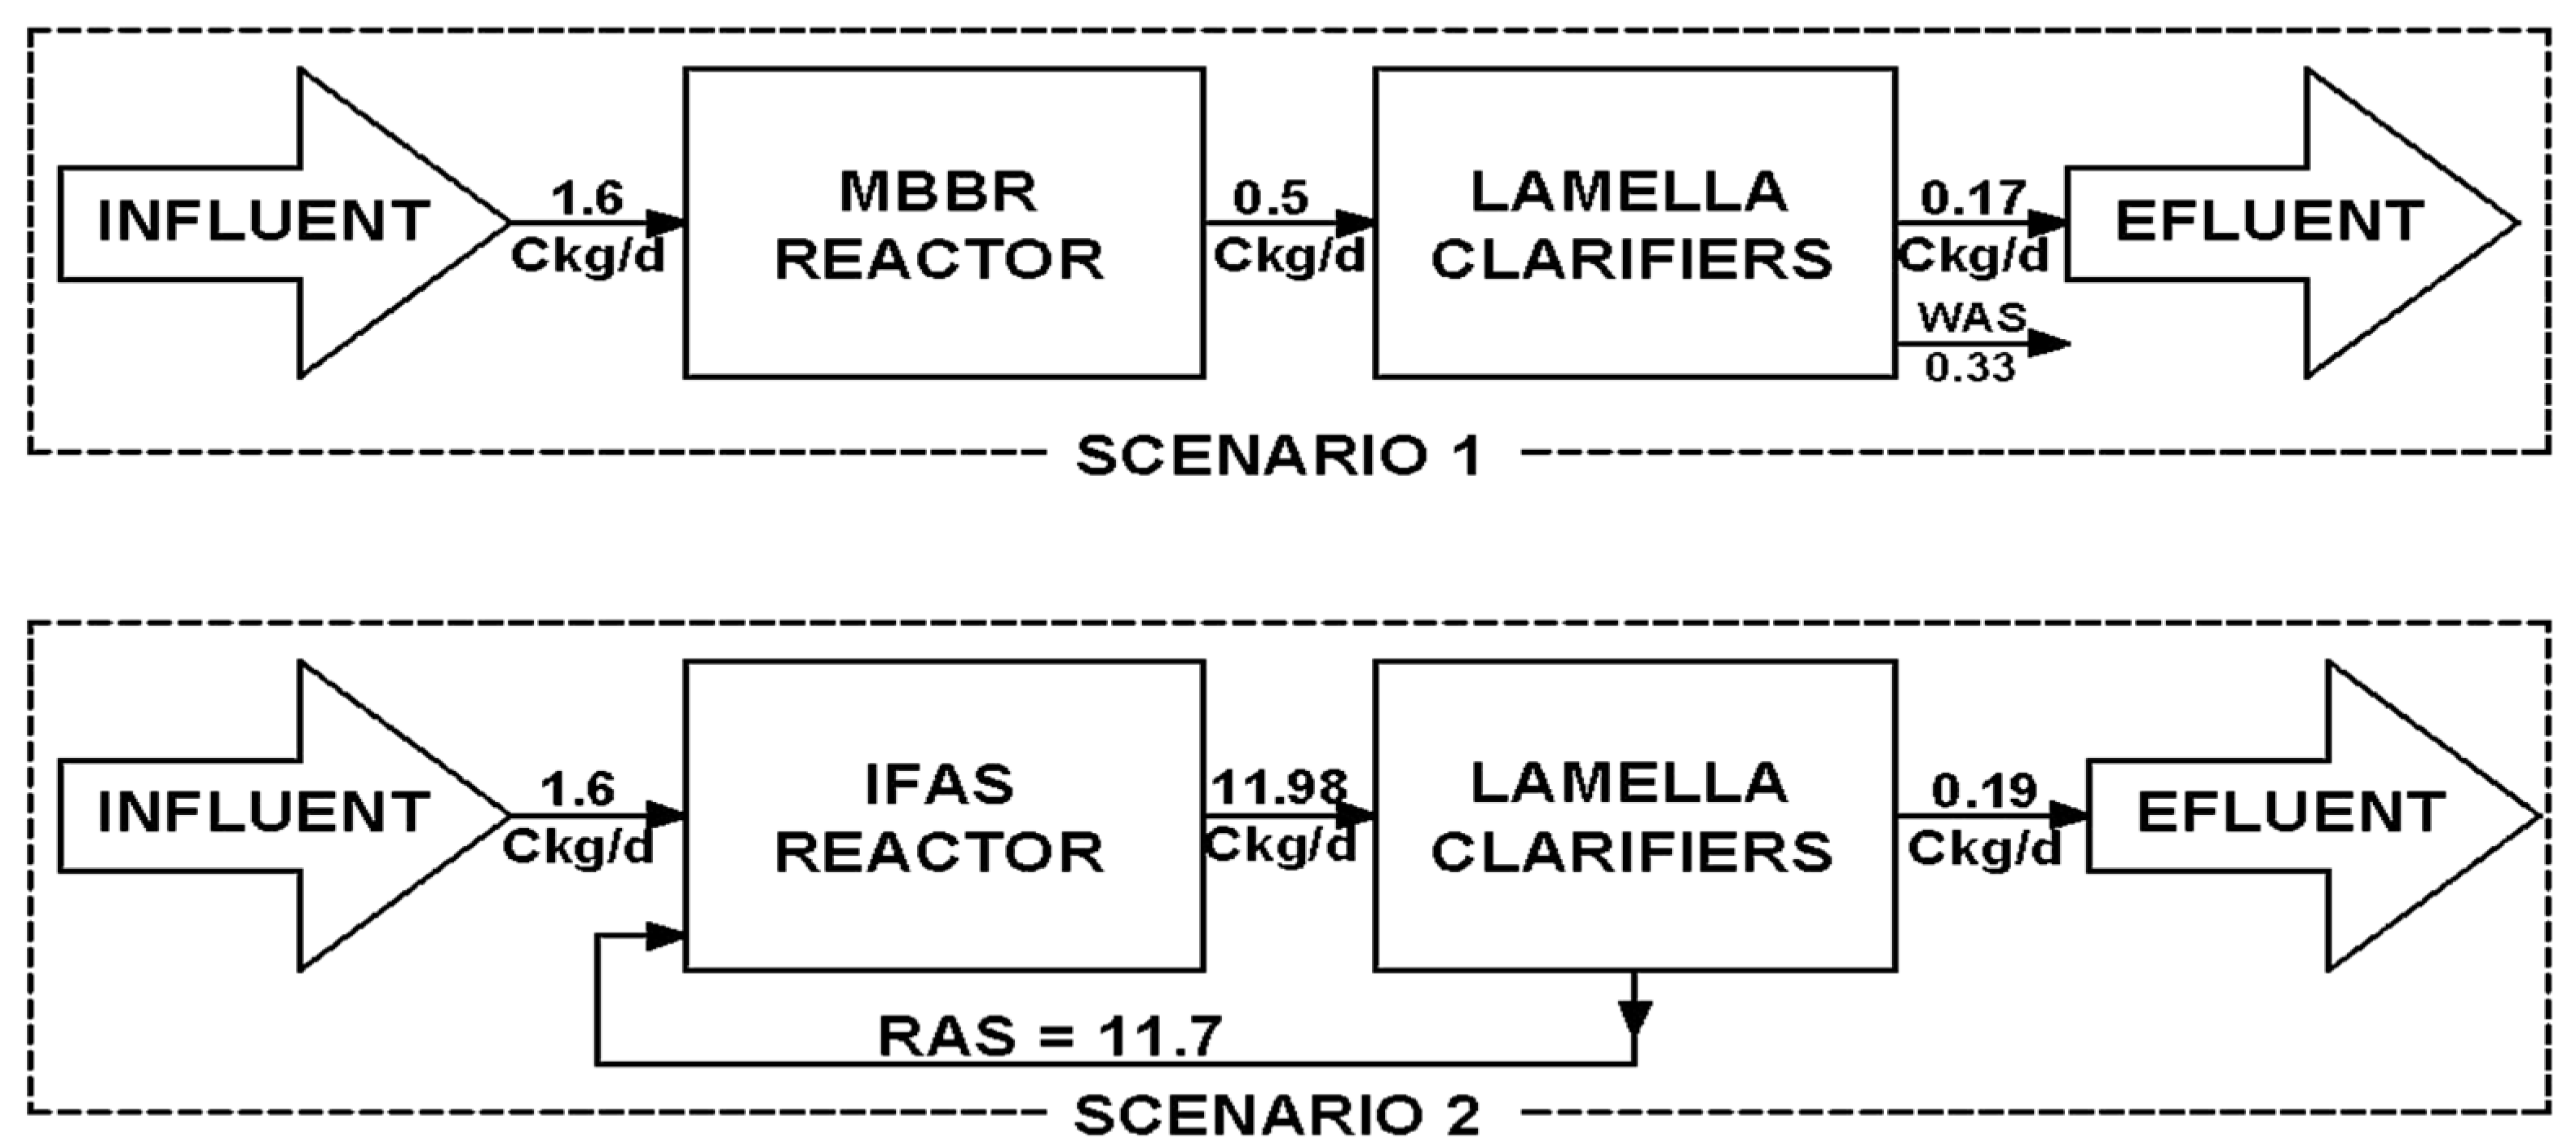
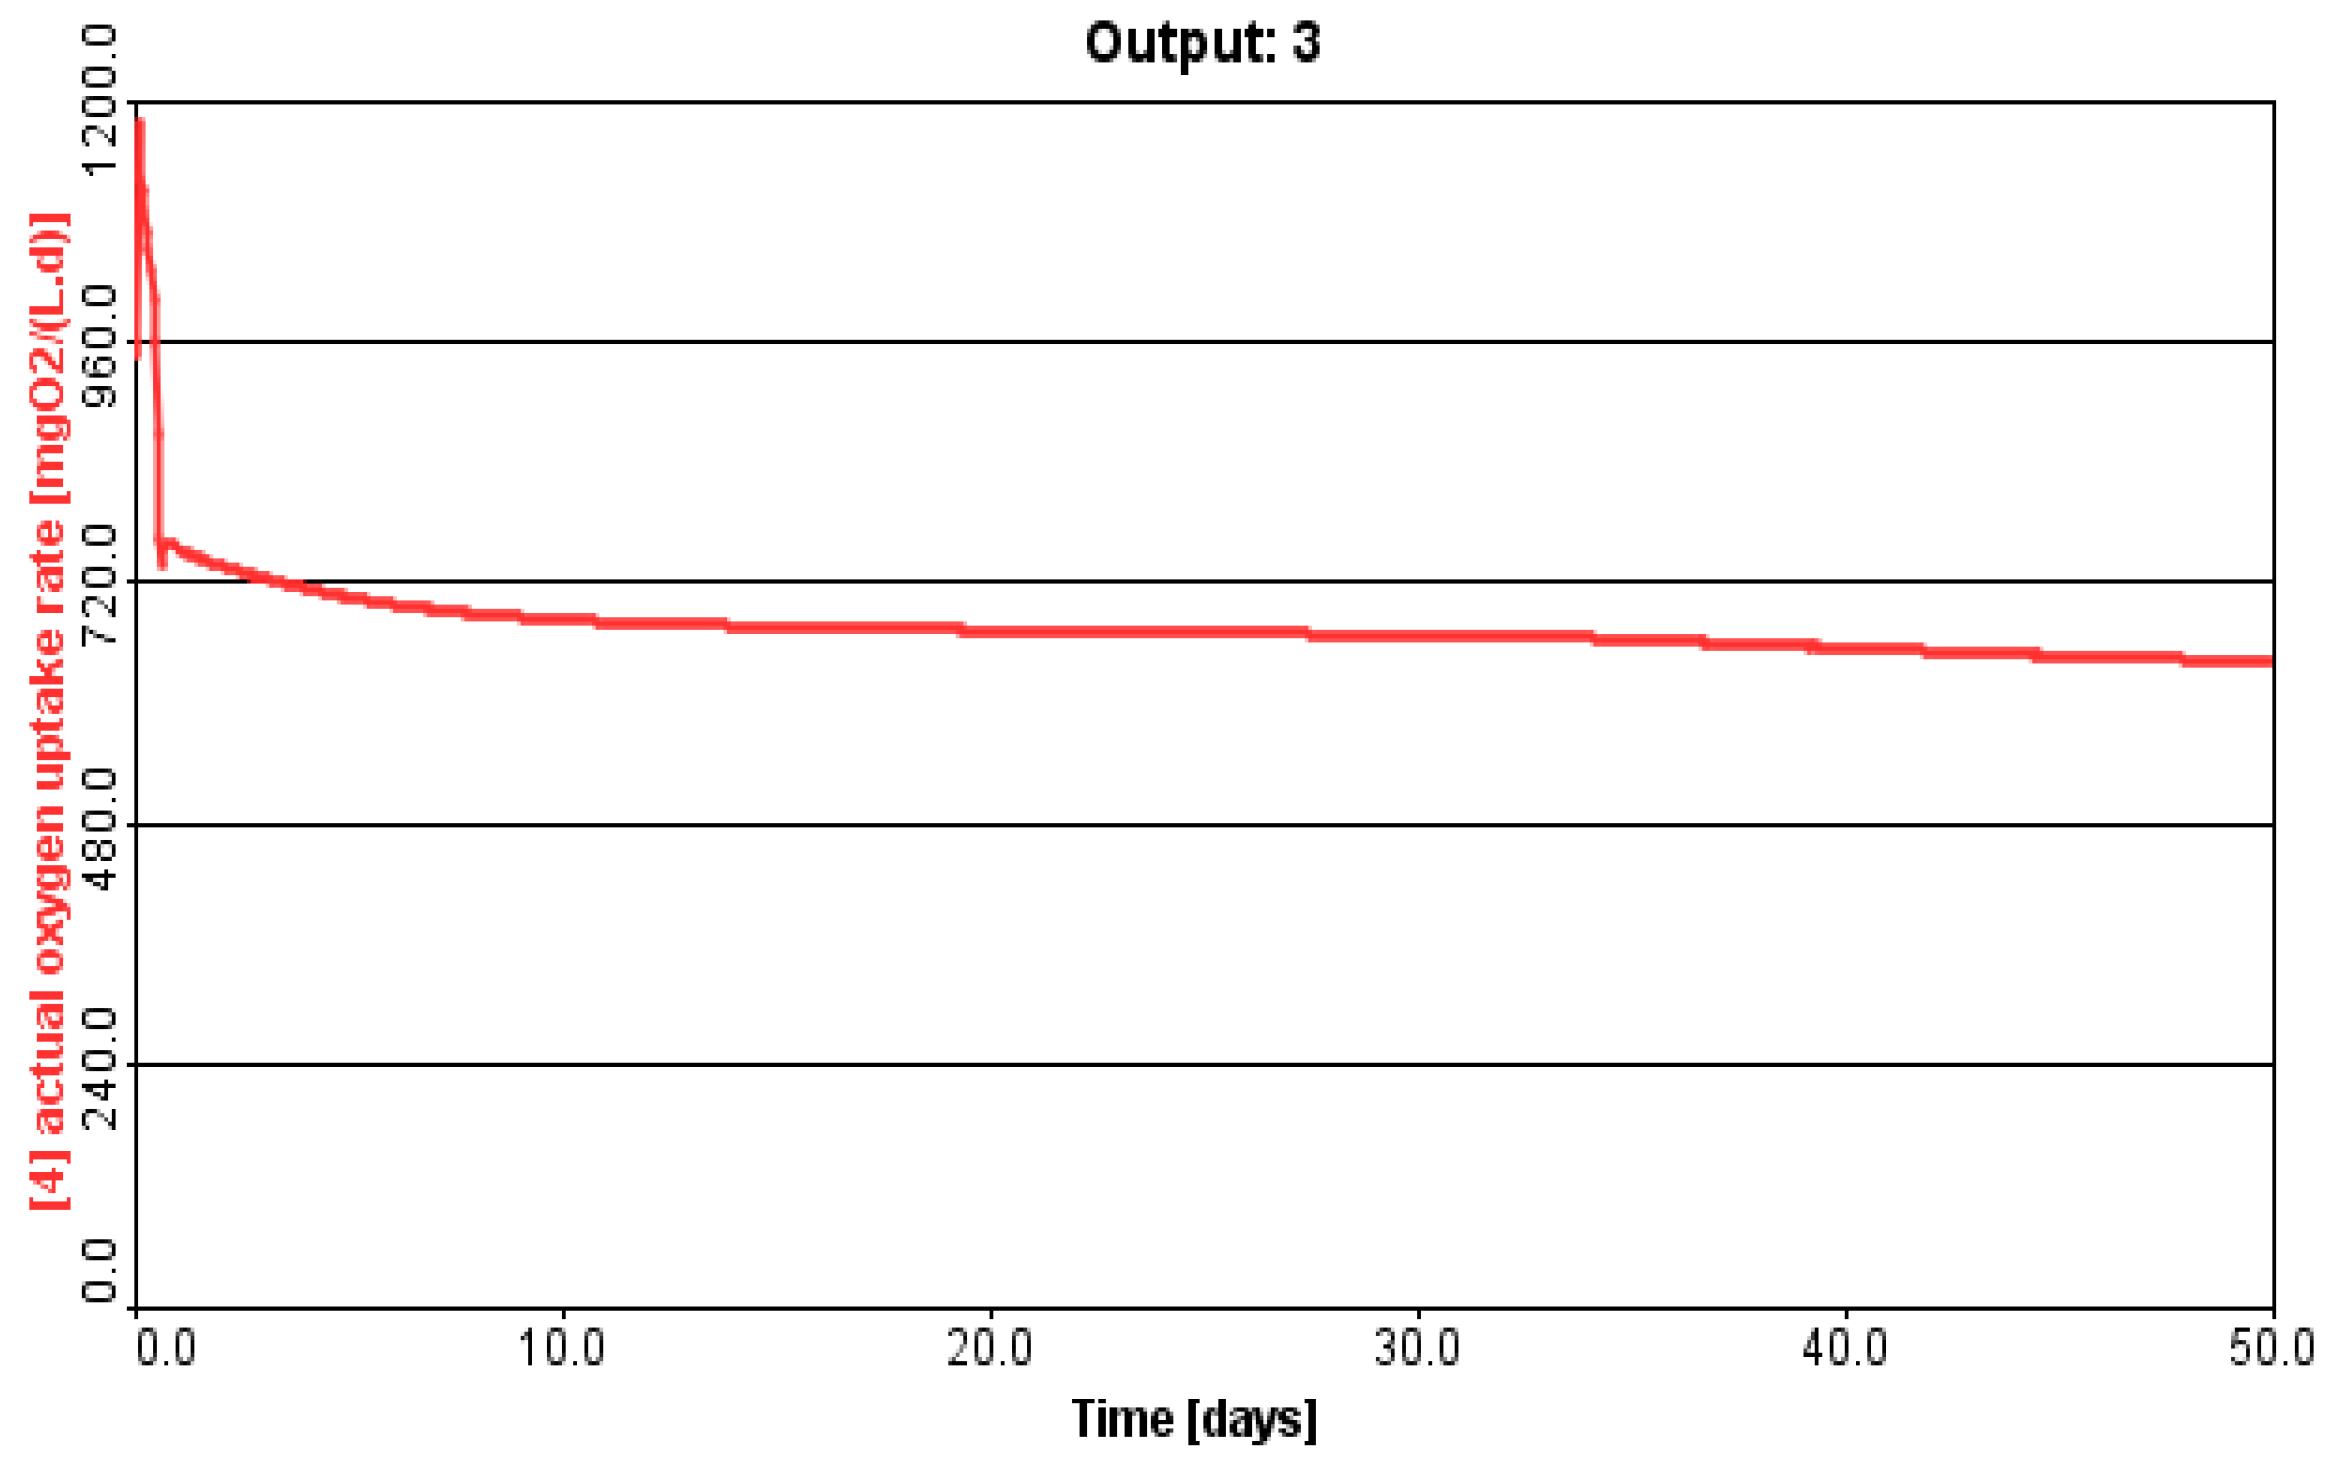
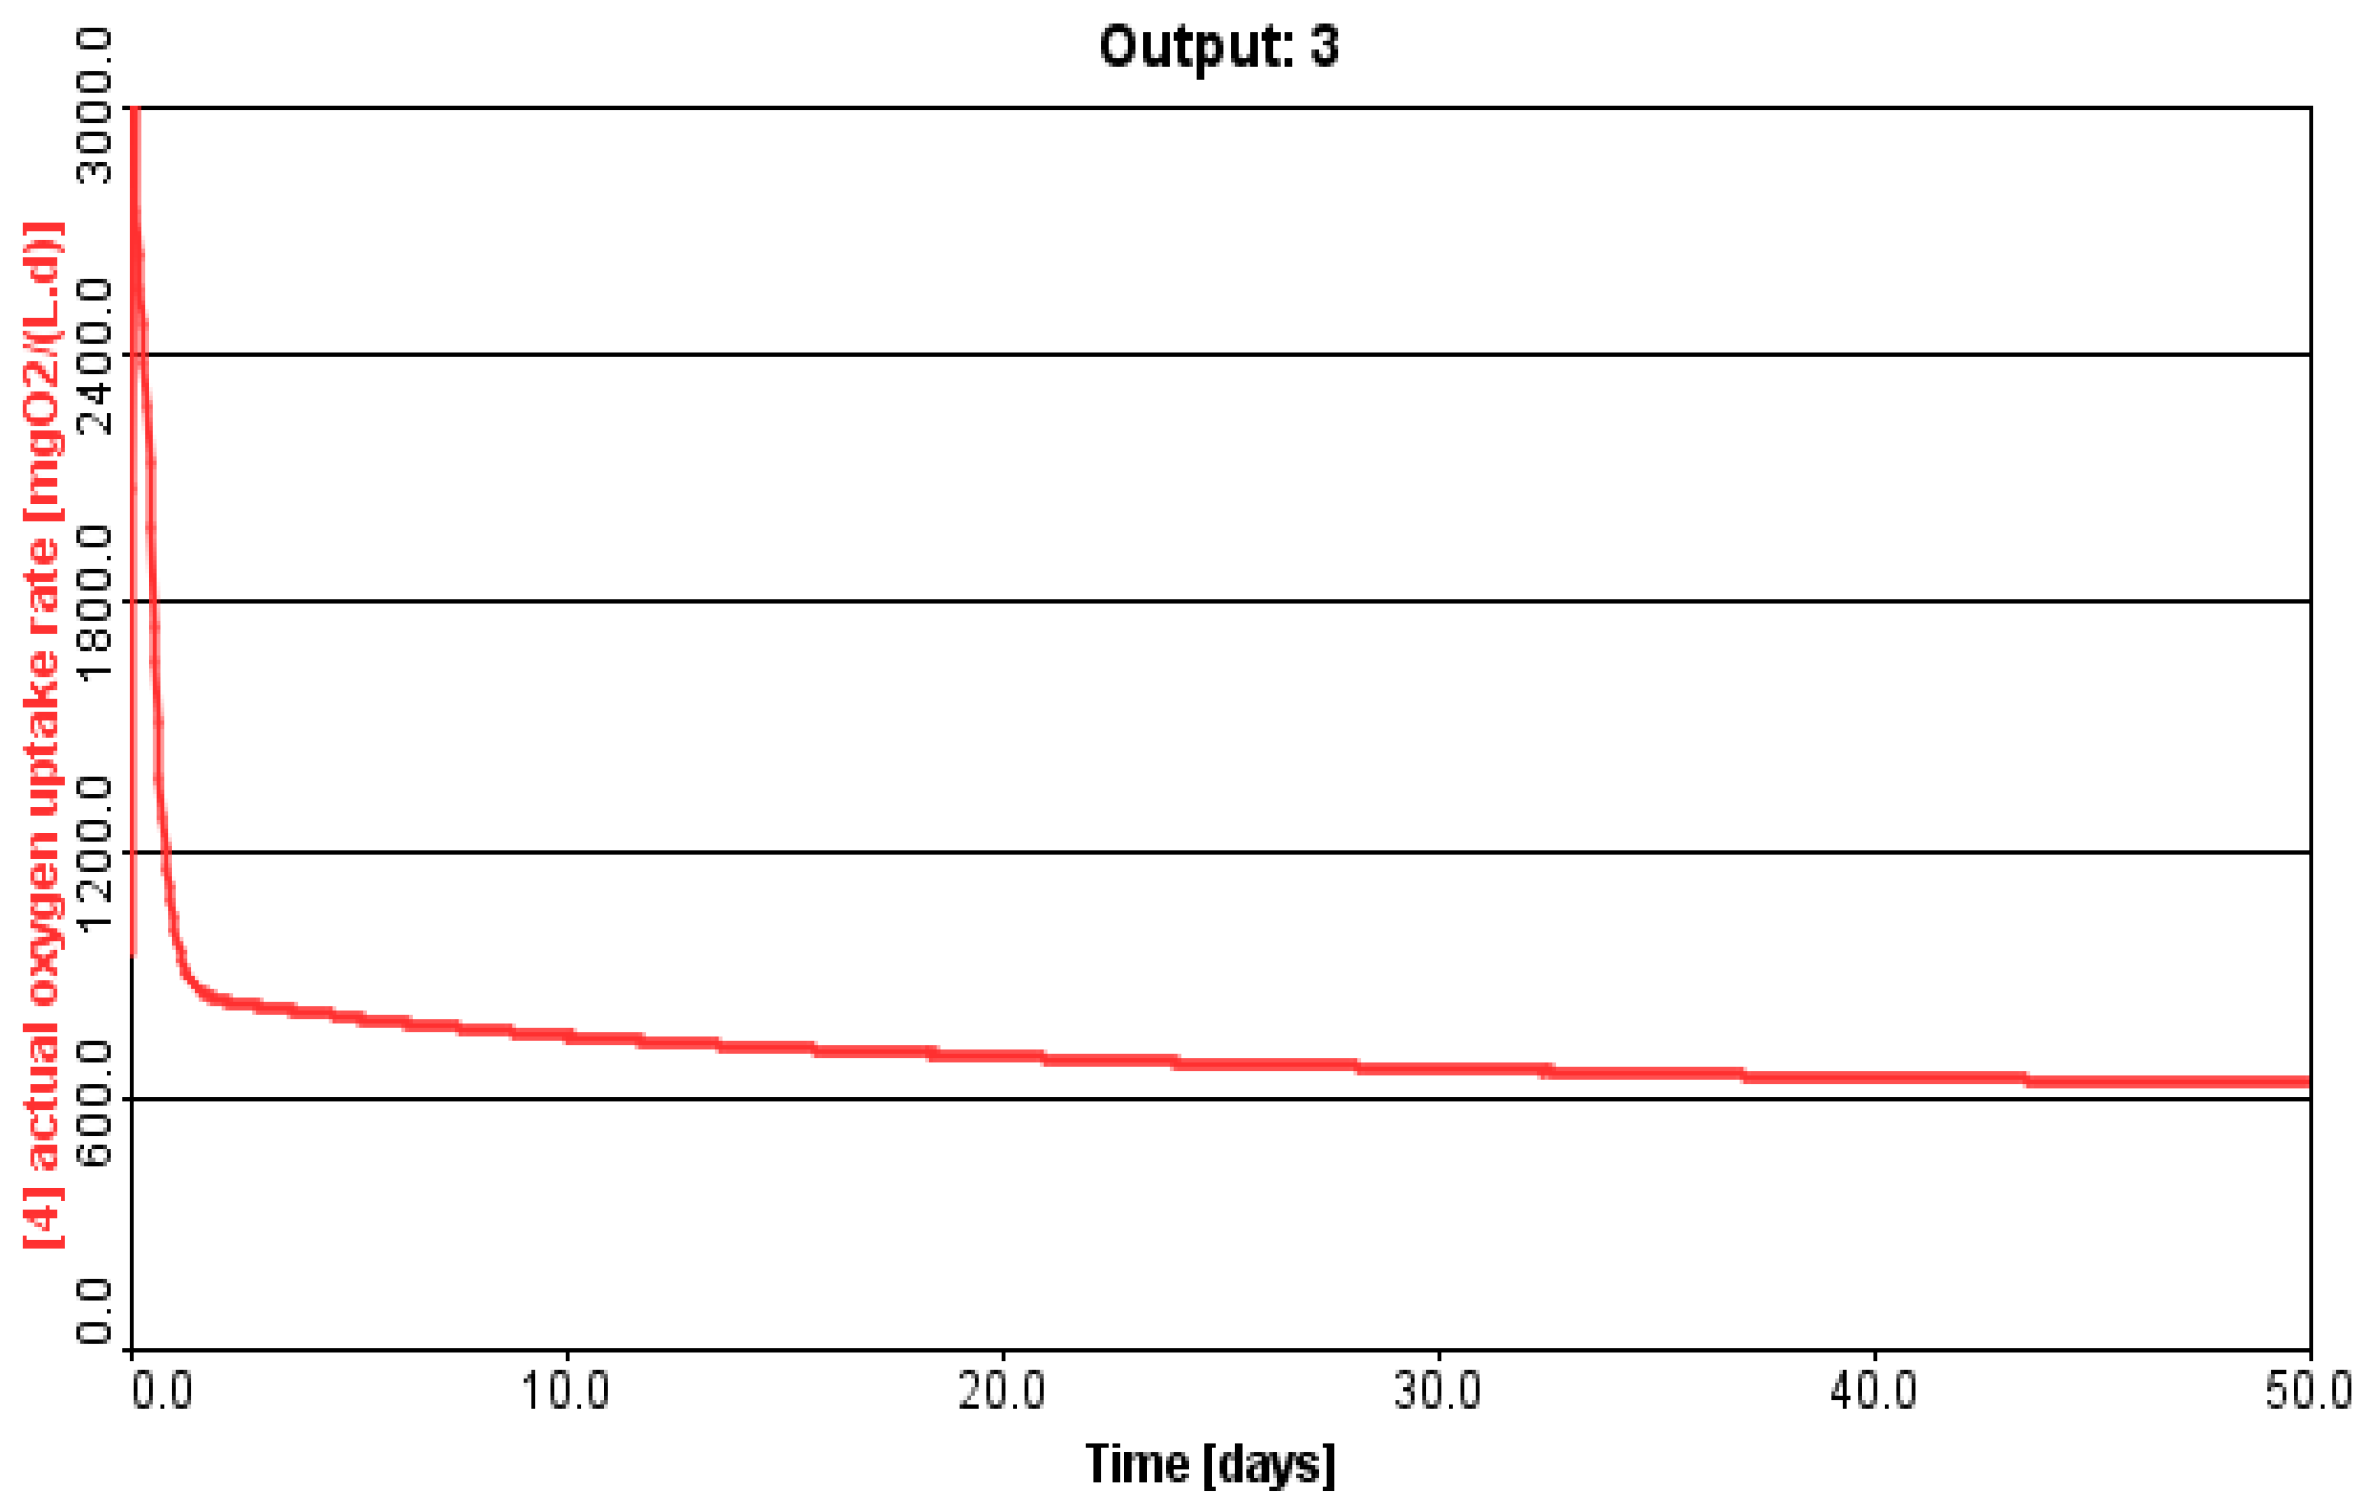
After the start-up, the system was operated according to two scenarios, as shown in the flow diagram in Figure 2, and the mass balance based on carbon around bio treatment unit for both scenarios is shown in Figure 3. In the first scenario, the biomass concentration in the attached growth is 21,460 mg/L and the suspended growth is 300 mg/L, while in the second scenario the biomass concentration in the attached growth is 38,020 mg/L and in the suspended growth is 3500 mg/L. In the lamella sedimentation basin, the TSS concentration for influent and effluent were 300 and 5 mg/L and 3500 and 6 mg/L, for the first and second scenarios, respectively.
  • First Scenario:
The pilot is operated as an MBBR system, consisting of three parts.
  • Operating the pilot with an (HRT) of 9 h and WAS of 100 L/d for 13 days.
  • Operating the pilot with an HRT of 18 h and WAS of 100 L/d for 30 days.
  • Operating the pilot with an HRT of 26 h and WAS of 100 L/d for 30 days.
  • Second Scenario:
The pilot is operated as an IFAS system, consisting of three parts, and the operational procedure is shown in Figure 2.
  • Operating the pilot at a RAS flowrate of 50% with HRT of 6 h and complete sludge retention time (SRT) for a period of 30 days.
  • Operating the pilot at a RAS flowrate of 50% with HRT of 12 h and complete sludge SRT for a period of 40 days.
  • Operating the pilot at RAS flowrate of 100% with HRT of 14 h and complete sludge SRT for a period of 35 days.
  • Operating the pilot at RAS flowrate of 150% with HRT of 14 h and complete sludge SRT for a period of 45 days.
  • Operating the pilot at RAS flowrate of 150% with HRT of 20 h and complete sludge SRT for a period of 50 days.
Figure 2. Flow diagram of operational procedure.
Water 15 00408 g002
Figure 3. Mass balance based on carbon around bio-treatment unit for both scenarios.
Water 15 00408 g003
The SRT is the ratio of sludge total mass in the system to the mass rate of sludge leaving the plant and it is estimated according to Equation (1):
S R T = V B R X B R + V R A S   X R A S   Q e f f X e f f + Q W A S   X W A S
where VBR (m3) and XBR (kg TSS/m3) are the volume and the TSS concentration of the biological reactor, respectively; VRAS (m3) and XRAS (kg TSS/m3) are the volume and the TSS concentration of the RAS, respectively. Qeff (m3/d) and QWAS (m3/d) are the flow rate of effluent and sludge wastage, respectively. Xeff (kg TSS/m3) and XWAS (kg TSS/m3) are the TSS concentration in the effluent and the sludge wastage.
The equation describes sludge production in both scenarios is presented in (2):
P x , b i o = Q Y ( S 0 S ) 1 + ( K d ) S R T + f d   k d   Q   Y   ( S 0 S )   S R T 1 + k d   S R T + Q Y n ( N O x ) 1 + ( K d n ) S R T    
where P x , b i o = biomass as VSS wasted (g/d), Q = influent flow (m3/d), Y = biomass yield, S 0 = influent substrate concentration (mg/L), S = effluent substrate concentration (mg/L), K d = endogenous decay coefficient, SRT = solids retention time (t), K d n = endogenous decay coefficient for nitrifying organisms (g VSS/g VSS·d), Y n = net biomass yield (g VSS/g bsCOD), N O x = concentration of N H 4 -N in the influent flow that is nitrified (mg/L) and f d = fraction of biomass that remains as cell debris (0.10–0.15 gVSS/gVSS).
The equation describes oxygen requirement in both scenarios is shown in Equation (3):
S O T R = A O T R   [ C s , 20 α F ( β C S - . T . H C ] ( 1.024 20 T )
where AOTR is actual oxygen transfer rate under field conditions (kg O 2 /h), SOTR is standard oxygen transfer rate in tap water at 20 °C and zero dissolved oxygen (kg O 2 /h), α is oxygen transfer correction factor for waste, F is fouling factor that is typically between 0.65 to 0.9, β is salinity surface tension correction factor that is typically 0.95 to 0.98, C is dissolved oxygen in aeration tank (mg/L), C s , 20 is dissolved oxygen saturation concentration in clean water at 20 °C and 1 atm (mg/L), C S ¯ , T , H is average dissolved oxygen saturation concentration in clean water in aeration tank at temperature T and altitude H (mg/L) and T is operating temperature (°C).

3. Results

3.1. MBBR System Start-Up Performance

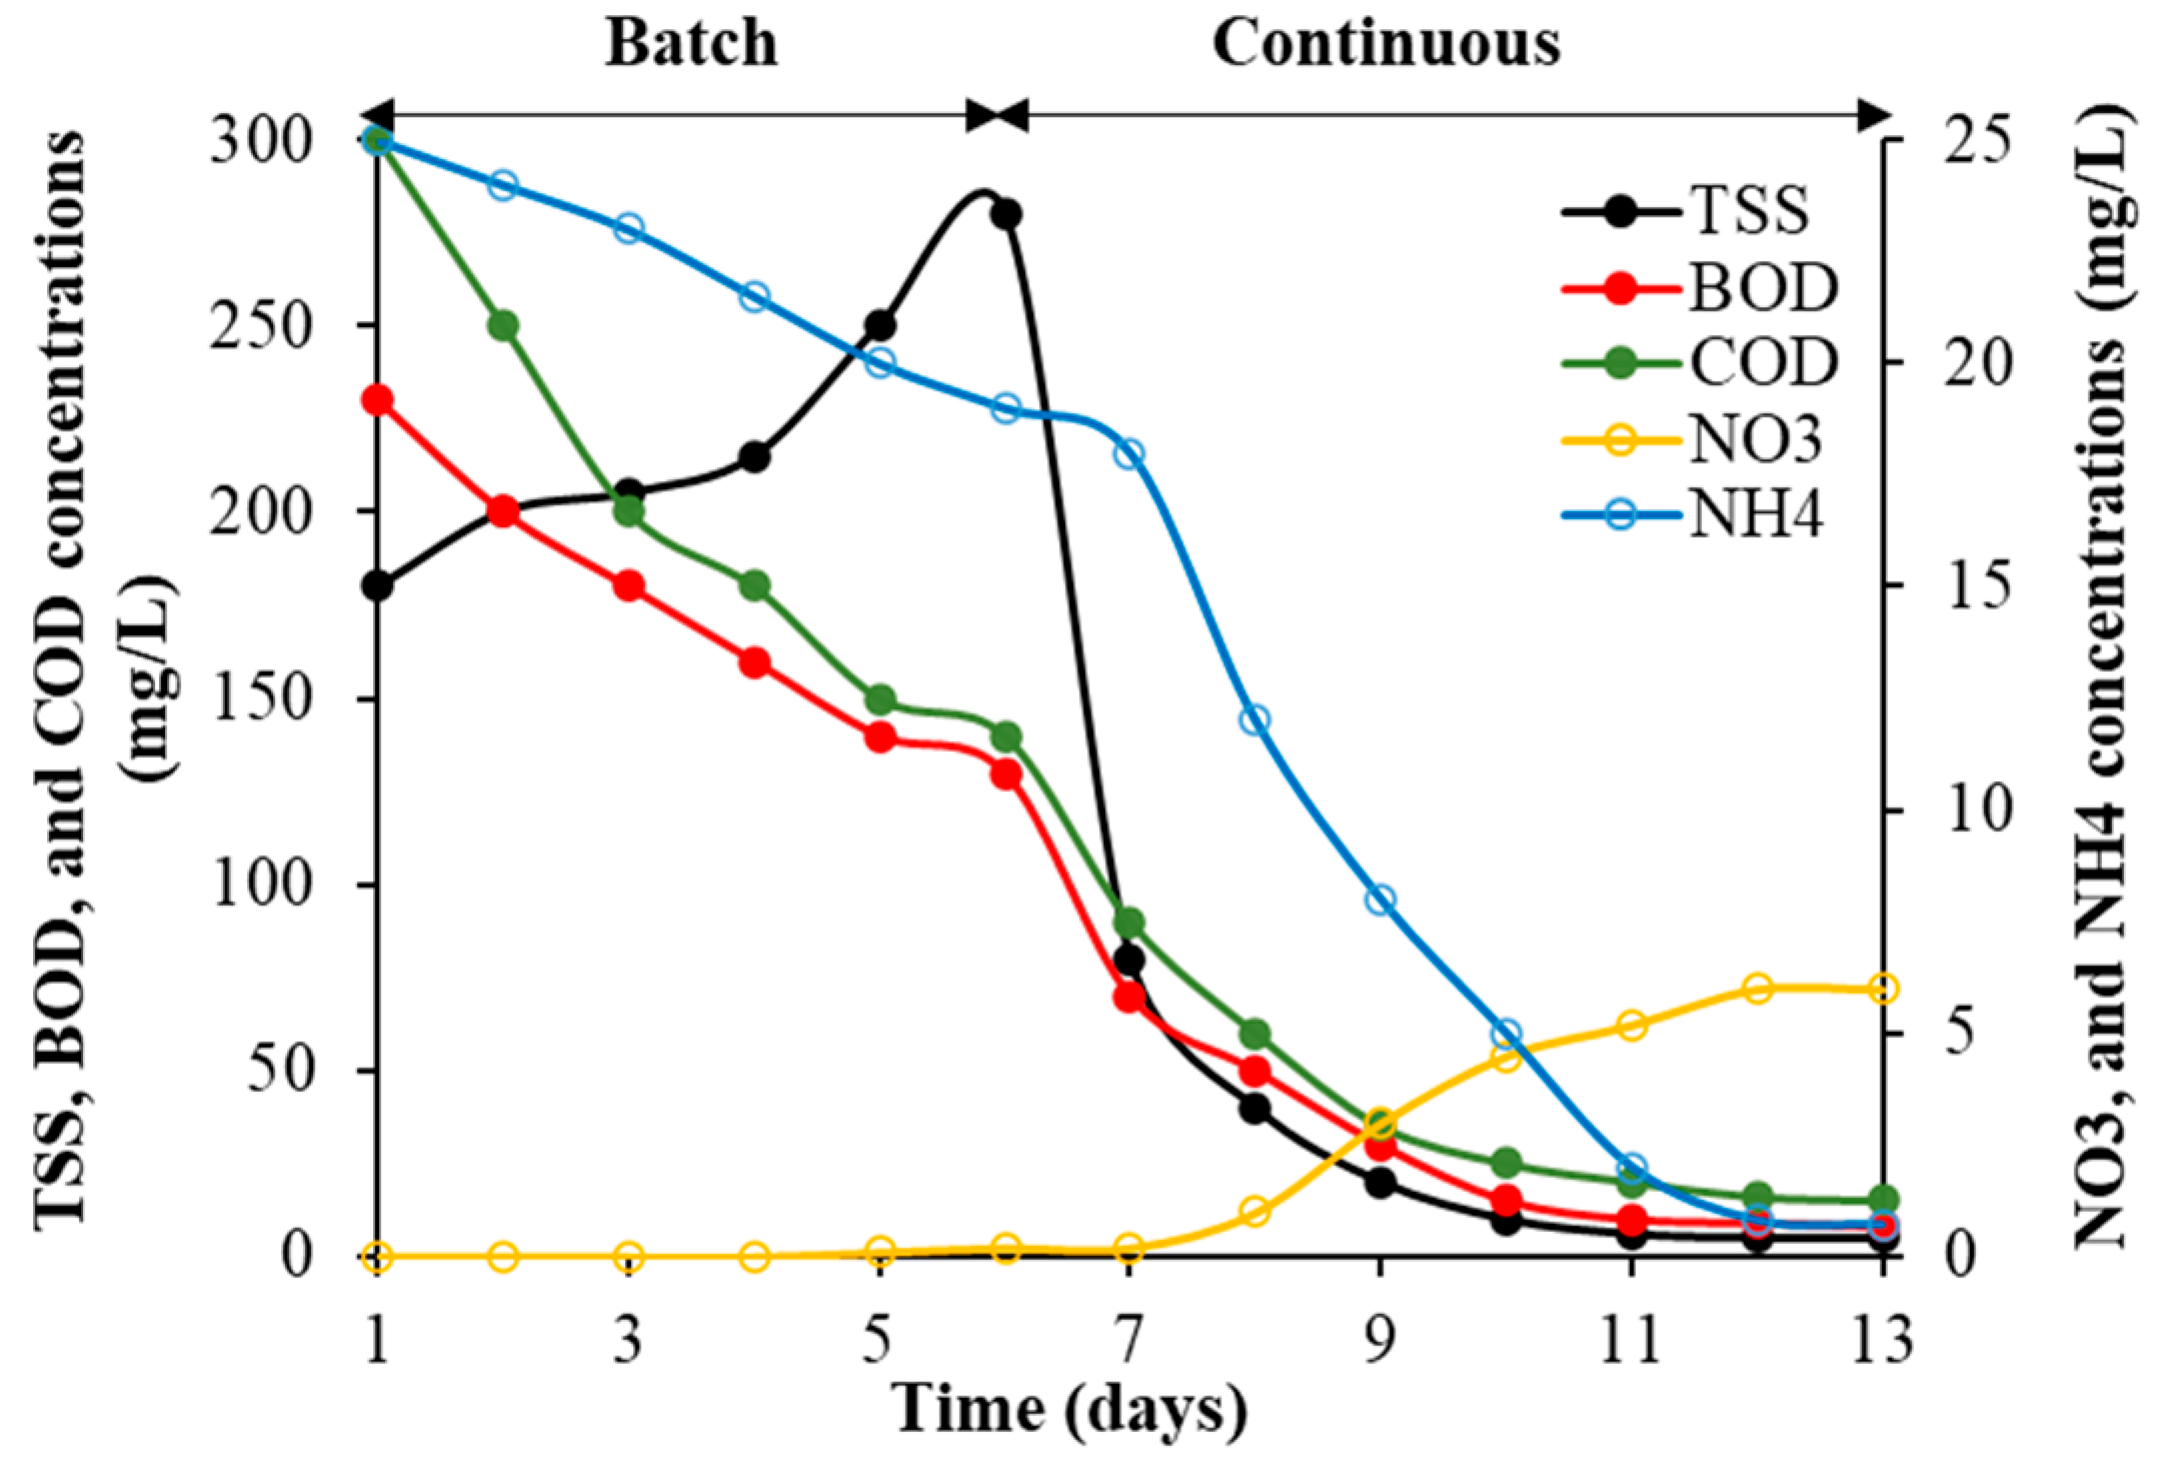
The MBBR system was fed with sewage from the Karbala wastewater treatment plant (WWTP) and the start-up process was evaluated after 13 days. Figure 4 shows the start-up performance of the MBBR system at batch and continuous feed modes. The first 7 days illustrated the concentration of the pollutant inside the MBBR system that was fed at batch mode, while from day 7 to day 13 this was operated in continuous mode. In addition, further data beyond 13 days for both scenarios are listed in Table S1 in the Supplementary Materials. A duration of 13 days was found sufficient to achieve rapid steady state condition due to the MBBR system’s advantage and biofilm formation. This can be observed by low pollutants concentration in the effluent. Figure 4 indicated that TSS concentrations (biomass) increased in the system during batch mode due to an increase in the suspended growth over the attached growth at the beginning of the process because the biofilm layer needs a period for the formation [11]. However, the TSS concentration gradually decreased during the continuous fed mode to about 5 mg/L at the steady state because of the formation of the biofilm layer on the carriers.
Figure 4 depicted that there was an initial gradual, then a rapid, reduction in BOD and COD concentrations due to three reasons: first is the formation delay of biofilm layer on the media, second is limited daily batch feed of organics to the system and third is the acclimatization of heterotrophic bacteria to continuous operation (lag period) [10]. BOD and COD are the carbon source electron donors for heterotrophic bacteria, while O2 is the electron acceptor in the metabolic processes within the cell, as shown in Equation (4) [12].
Substrate + O2 + nutrient Water 15 00408 i001 biomass + CO2 + H2O
In addition to the adaptation to carbon and oxygen sources, the cell also needs the availability of nutrients and pH adjustment. In the MBBR, the oxidation process dissolves the substrate, which depends on the enzymes secreted by the bacteria to dissolve the solids; hence, there is no need for a primary sedimentation basin. The reasons mentioned above led to a significant decrease in BOD and COD concentrations after a short start-up duration of 13 days. It was also observed that the BOD concentration was 8 mg/L and the COD concentration was less than 15 mg/L, which means the BOD/COD ratio is 53% in the treated water. This is because the sewage contains low total inert substances concentrations. The MBBR system greatly contributed to eliminating a large part of these pollutants through the attached bacterial growth process.
Ammonium is considered a major challenge in sewage treatment plants and must be removed for environmental requirements. Figure 4 observed a slight decrease in ammonium concentration at the batch flow phase due to the absence of autotrophic bacteria during batch flow mode. However, ammonium is considered a nutrient for heterotrophic bacteria during the metabolic processes. The nitrification process in two stages removes the ammonium: the first is the oxidation of ammonium to nitrite and the second stage is the oxidation of nitrites to nitrate [13]. It is noticed that, after 7 days, autotrophic bacteria began to grow by adopting ammonium as an electron donor and oxygen as an electron acceptor, in which the energy source is taken from the bicarbonate generated. The growth of autotrophic bacteria contributed to the oxidation of ammonium to nitrite, where the bacteria responsible for this reaction is nitroso-bacteria, as shown in Equation (5) [14].
2NH4 +3O2Water 15 00408 i0012NO2 + 4H+ + 2H2O
The proof of the absence of autotrophic bacteria in the batch flow phase is the absence of an increase in nitrate concentrations. Approximately when the nitrous bacteria grew on the eighth day, they contributed significantly to the oxidation of ammonium and its transformation into nitrate. After 13 days of start-up, ammonium concentration was stabilized at approximately 1 mg/L due to the growth of nitro-bacteria, which oxidized nitrite instead of ammonium. It was observed that nitrate concentrations started increasing on the eighth day of operation, after the growth of nitroso-bacteria and reached the highest concentration of 6 mg/L due to the conversion of ammonium to nitrite, as indicated in Equation (6) [15].
2NO2 + O2Water 15 00408 i0012NO3

3.2. Biofilm Formation during Start-Up Performance

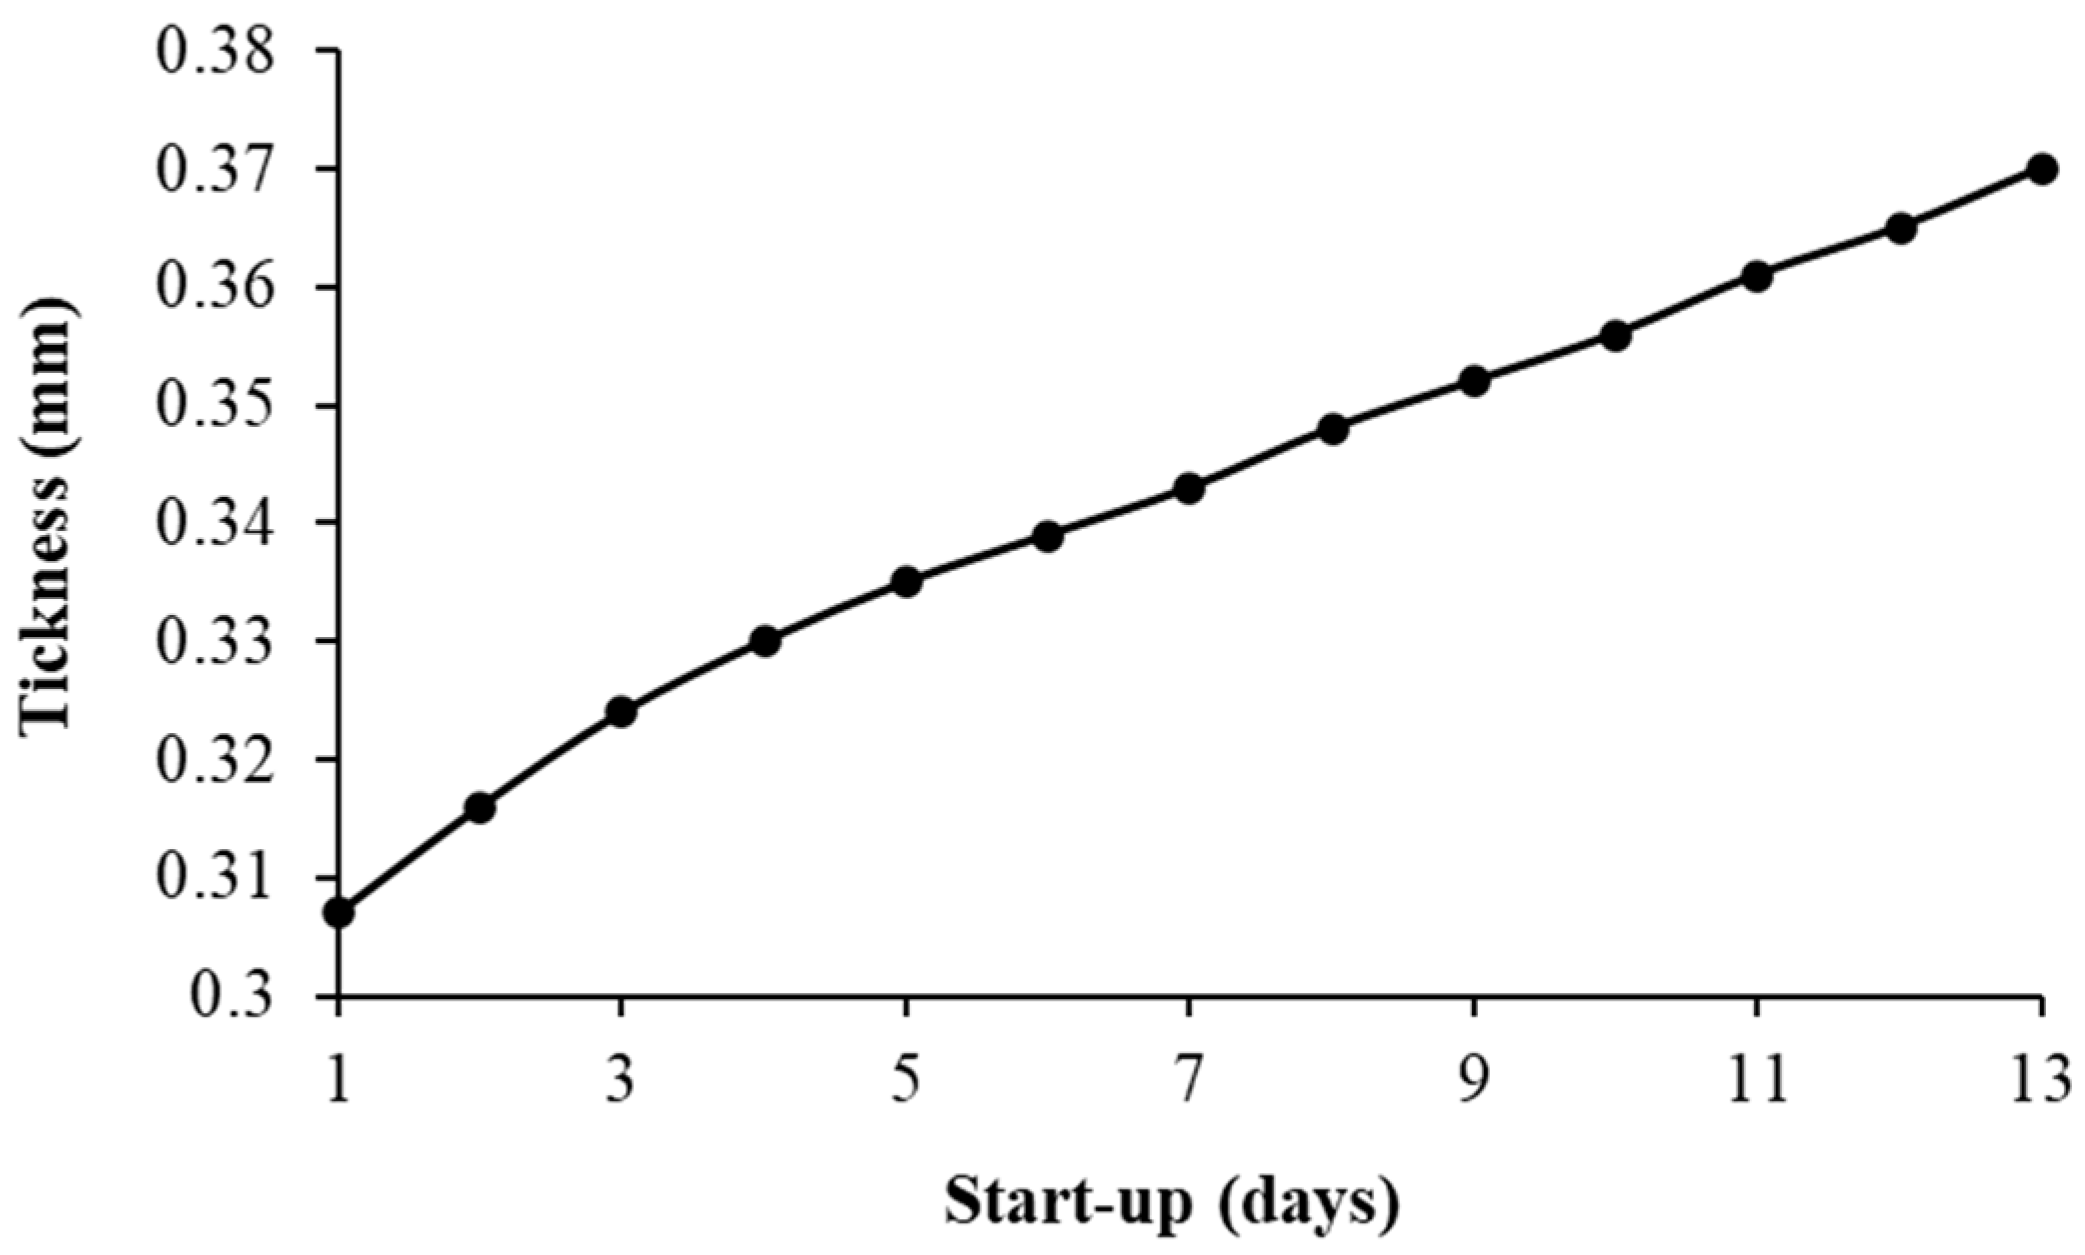
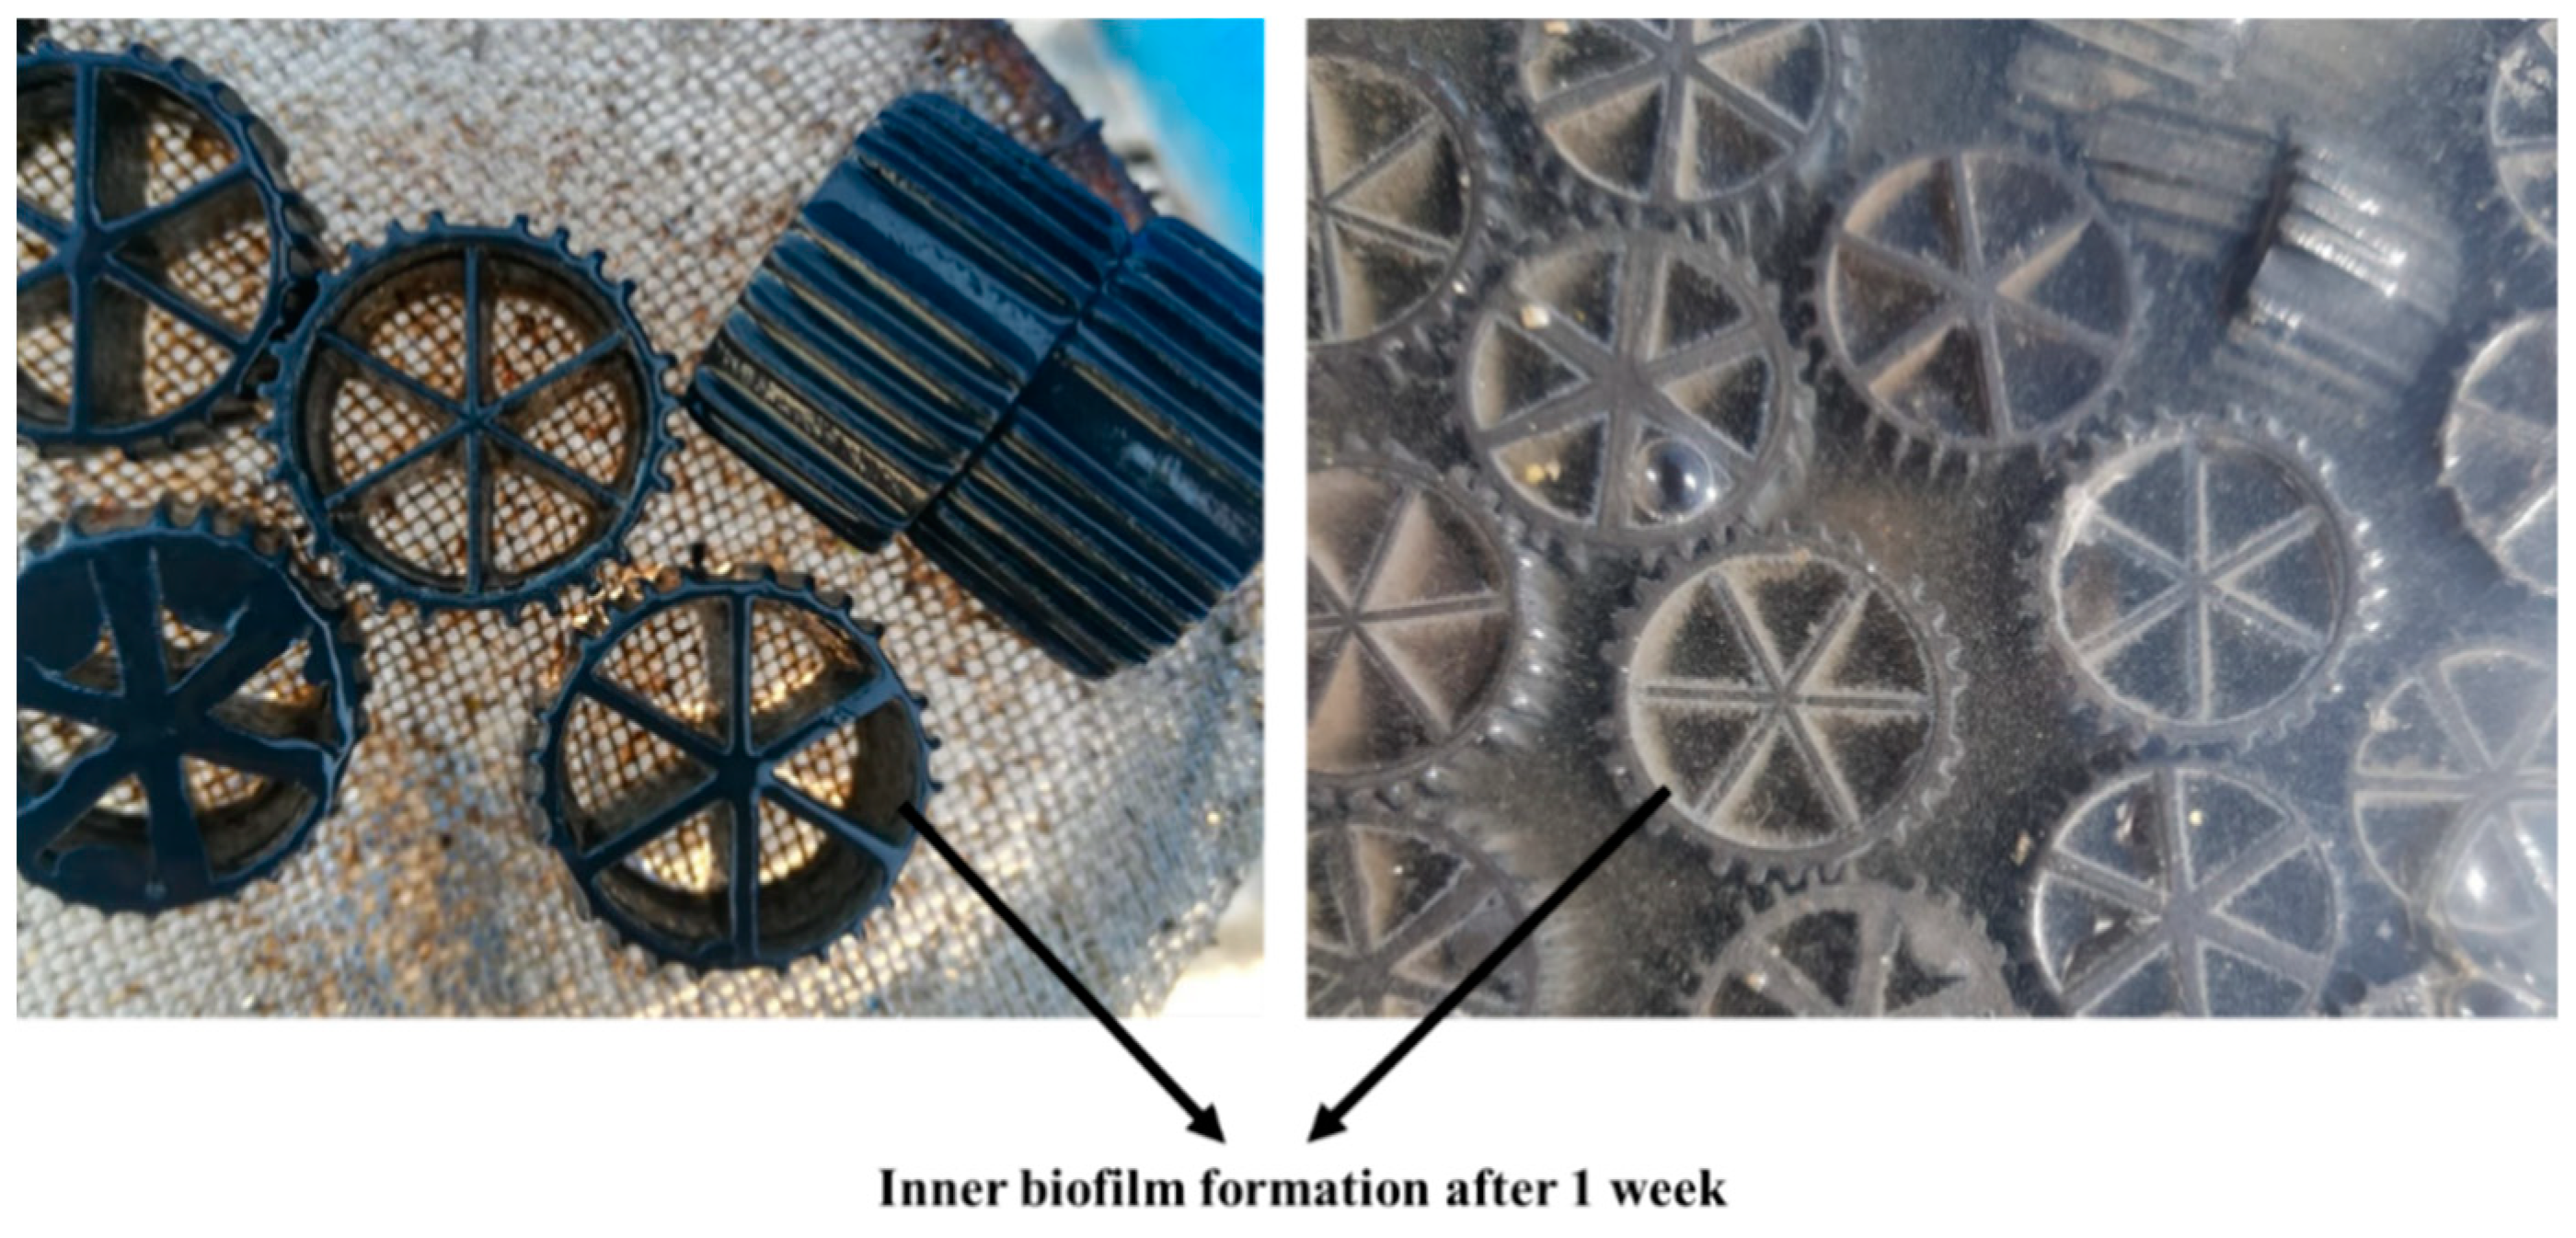
Biofilm formation is one of the most critical characteristics of attached growth in the MBBR system. Figure 5 displays the biofilm development during the start-up process, where an increase in the biofilm thickness is observed with start-up time. Within 13 days, the thickness increased from 0 to 0.37 mm on the inner surface of the carriers, as shown in Figure 6. In this study, the biofilm formation was 0.197 g VS/g biofilm after 13 days of the start-up. Likewise, Liu et al. [3] reported that the average biomass attachment reached 0.533 g VS/g biofilm after 30 days. The effectiveness of biofilm formation was also supported by the reduction of suspended growth microorganisms (TSS) in the system and high nitrate generation as a result of ammonium oxidation. The biomass carrier produced fluid separation and intercepted suspended matter for biofilm formation, contributing to the energy-uncoupling metabolism in the process. Biofilm formation also increases the SRT of sludge in the system, which promotes endogenous respiration within the biofilm layers that may eliminate sludge generation [3]. At the beginning of the formation of the biofilm layer, the oxidation of ammonia contributed to reducing the pH from 7 to 6, but increasing the thickness of the biofilm layer and the denitrification process inside the biofilm layers contributed to raising the pH ratio to the normal level. In addition, the system was filled with 40% bio-carriers, which was found sufficient for the best MBBR performance, as supported by Faris et al. [10], who reported that the best results can be achieved when the MBBR system is filled with 40–50% bio-carriers.

3.3. Sludge Reduction in MBBR System (Scenario 1)

The absence of RAS from the secondary clarifier to the aeration basin is a key feature of the MBBR system, where the biological process entirely relies on attached microorganisms formed within the aeration tank. Table 3 presents the MBBR performance and excess sludge production under different HRT, while Figure 7 shows the O2 uptake rate in the bio-treatment unit for scenario 1. Long HRT positively influences the effluent pollutant concentration, whereas HRT regulates the time in which oxygen is in contact with the liquid. When the HRT changed from 9 to 26 h, the BOD, COD, TSS and NH4 concentrations dropped from 8 to 2 mg/L, 15 to 8 mg/L, 5 to 4 mg/L and 0.7 to 0.2 mg/L, respectively. In contrast, long HRT allows more time for the growth of nitro-bacteria responsible for the conversion of nitrites to nitrates, where the NO3 increases from 6 to 32 mg/L. The ammonium oxidation is somewhat halted until the oxidation process of nitrite is exhausted, which requires more time to stabilize ammonium and nitrite. Nitrifiers grow slowly and their growth rate is determined by the SRT, with longer SRTs favoring nitrification [16].
Furthermore, increasing the HRT in the aeration tank from 9 to 26 h increased the SRT from 5 to 25 days, resulting in excess sludge reduction from 750 to 150 g/day, respectively. Operating at a long HRT reduces the sludge washout, accumulating biomass within the reactor and long SRT. Longer SRT will reduce sludge production due to the occurrence of endogenous respiration of biomass that will remove a large part of the inert organic materials [17]. Furthermore, Jiang et al. [18] reported that the longer SRT could cause energy consumption for maintenance other than cell synthesis, resulting in low sludge production. Nonetheless, the sludge reduction in the MBBR process is unsatisfactory; hence further process modification is needed. According to Chon et al. [19], sludge decomposition occurs in both anaerobic and aerobic systems with SRTs of 16 days and 21 days, respectively. Predatory bacteria (protozoa and metazoan) enrichment in sludge was also thought to increase cell lysis. Similarly, hydrolysis could break down organic matter on a molecular level, turning it into water-soluble compounds and simple monomers that bacteria can ferment and use. Therefore, the efficiency of sludge reduction can be reflected in the adoption of both predatory bacteria and fermentative bacteria [20].

3.4. Sludge Elimination at IFAS System (Scenario 2)

The MBBR process can be modified to the IFAS process by returning the activated sludge from the settling tank to the aeration basin. The IFAS system combines the processes of attached and suspended growth bacteria [10]. In Scenario 2, the process was operated with no WAS from the system and increased HRT from 6 to 20 h, SRT from 15 to 50 days and RAS from 50 to 150%. Notably, Scenario 2 successfully eliminated sludge production from the system. The operational results are shown in Table 3 and the O2 uptake rate data in the bio-treatment unit for scenario 2 is shown in Figure 8. Returning the sludge increases digestion in the aeration tank due to endogenous respiration, thus reducing sludge production [21]. Similarly, Faris et al. [10] reported that sludge is reduced by more than 60% when the system is operated with 200% of RAS, which indicates that RAS positively impacted sludge reduction in the MBBR system. Sludge return causes a change in the mass balance of sludge amount, leading to sludge digestion within the system. Likewise, Salehiziri et al. [8] have also reported that long SRT could reduce sludge production. On the contrary, most of the settled sludge in the IFAS process is believed to be chemical sludge due to the reaction of calcium hydroxide with phosphate [10].
In part 1, at a short HRT of 6 hrs and 30 days operation period, although the system eliminated the sludge production in 30 days, high effluent concentrations of 40, 85 and 80 mg/L were observed for BOD, COD and TSS. The process of returning sludge may increase the TSS concentration due to the cell debris generated from endogenous respiration [2]. The sludge reduction is ascribed to biomass disintegration with bacterial cell breakdown due to RAS, whereas there is no need for a primary sedimentation basin. This will lead to a high concentration of organic content in the effluent. The IFAS system promotes the endogenous respiration of the biomass, which contributes to the oxidation of all dissolved and insoluble organic matter and the elimination of biomass through Equation (7) [22]:
Biomass + O2Water 15 00408 i001CO2 + H2O + NH3 + energy
However, low NO3 of 16 mg/L indicated a limited oxidation process due to short HRT; hence, the process required more time to ensure further oxidation process.
In part 2, increasing the HRT to 12 h and operational time to 40 days while maintaining the RAS at 50%, resulting in an SRT of 20 days and no sludge production. Remarkably, BOD, COD and TSS concentrations decreased from 40 to 29 mg/L, 85 to 60 mg/L and 80 to 48 mg/L, respectively. These concentrations are considered high due to the decomposition that occurred by the presence and growth of heterotrophic bacteria in suspension and attached, where all the appropriate conditions were available to decompose the substrate through dissolved oxygen, temperature and nutrients. Multiple factors necessitate the use of longer SRT: the elimination of ammonia, the occurrence of endogenous respiration to reduce sludge and the removal of a significant portion of inert organic materials without the need for a primary sedimentation basin. A higher NO3 effluent concentration of 27 mg/L was also noted due to the improved oxidation process.
In this regard, Part 3 showed the optimum IFAS system performance by increasing the RAS to 100%, HRT to 14 h and operational period to 60 days. At this stage, further decreases in effluent concentrations from 29 to 3 mg/L, 60 to 12 mg/L and 48 to 8 mg/L were observed for BOD, COD and TSS, respectively. Furthermore, the NO3 effluent concentration increased from 27 to 45 mg/L but remained within the limit. Regarding Parts 4 and 5, further increase in SRT beyond 35 days and HRT exceeding 14 h improve pollutants removal but result in higher NO3 effluent concentration, which is regarded as unfavorable. Therefore, Part 3 of Scenario 2 is considered the best option for sludge elimination and pollutants control.
On the other hand, ammonia stabilizes throughout both MBBR and IFAS processes due to the presence of a complex inversion between nitrite and nitrate that slows ammonia oxidation. Nitrites are being oxidized and converted to nitrates and this is what causes the slowdown in ammonia oxidation. Ammonia levels start to drop again after nitrites are oxidized by nitro-bacteria. It was found that the oxidation and stability of nitrite are much quicker than those of ammonia. Nitrite is an intermediate product that may increase at the beginning of NH3 oxidation and decreases rapidly, whereas nitrate concentration increases. The high concentrations of nitrates in the IFAS process are due to several reasons, including the oxidation of ammonia concentrations and their conversion to nitrates and proteins and amino acids present in its suspended solids, as well as due to endogenous respiration, sludge decay and biomass cell lysis [23]. One of the advantages of this study is the long SRT (15–50 days) that offered sufficient time for nitrifiers to grow slowly, growth of predatory microorganisms and complete nitrification processes completed. In like fashion, Skouteris et al. [16] reported that ASP plants operated at short SRTs have mainly removed only organic carbon. To overcome this issue, the system was continuously seeded with aged sludge.

3.5. System Operating Cost Reduction, Limitation and Advantages

To analyze the cost reduction due to sludge elimination, the system in this study is compared with an actual MBBR system operated at 1000 m3/day, as tabulated in Table 4. In addition to the successful system performance and operation, Table 4 revealed that no cost was accounted for sludge management. This system is considered one of the most important systems that does not contain a sludge treatment line, although the sludge treatment line requires a construction and operational cost estimated at half the value of the plant. Removing the sludge treatment line contributed to eliminating the need for deodorization systems. Sludge line management and maintenance has been cancelled. Land costs earmarked for the purchase of a sludge treatment line have been cancelled. The limitation of this system is the output of nutrients with somewhat high concentrations, such as nitrates, which requires the existence of a denitrification process through the addition of an anoxic basin, but these concentrations were not outside the required global concentrations. The advantages of this system are summed up in the following points:
  • Completely eliminates sludge.
  • No odor removal system required.
  • System administration is very easy.
  • It does not need large spaces.
  • It does not require complex mechanical equipment.
Table 4. Comparison of cost reduction, limitation and advantages between the system in this study and an actual operated MBBR system.
UnitFull Scale MBBR SystemThis MBBR System
Gravity thickener and Aerobic digester10 (USD $ per m3/day)None
Excess sludge pump6 (USD $ per m3/day)None
Centrifuge and dosing polymer pump30 (USD $ per m3/day)None
Odor removal system20 (USD $ per m3/day)None
Electricity usage of sludge line (per year)60 (USD $ per m3/day)None
Maintenance of sludge line (per year)80 (USD $ per m3/day)None
Operation of sludge line (per year)70 (USD $ per m3/day)None
Environmental feasibilityOdor emission and insects gatheringNo odor
Economic feasibilityHigh costLow cost
Technical feasibilityLarge space neededNo space needed

4. Conclusions

The MBBR system was successfully started in 13 days, whereas a biofilm formation of 0.197 g VS/g biofilm (0.37 mm) was observed. At the steady state, oxidation of organic matters and nitrification processes were evident by low effluent concentrations of BOD, COD and NH4. In addition, the biofilm formation reduced the TSS concentration due to the formation of attached growth process over suspended growth process. Regarding sludge reduction in Scenario 1, modifying the MBBR process by increasing the HRT in the aeration tank from 9 to 26 h has increased the SRT from 5 to 25 days and managed to reduce excess sludge from 750 to 150 g/day, respectively. Longer SRT could cause energy consumption for maintenance other than cell synthesis, resulting in low sludge production. Furthermore, MBBR process was upgraded to IFAS process (Scenario 2) by applying RAS at 50, 100 and 150%. This scenario showed better performance and revealed that the IFAS process has better control over complete sludge elimination and pollutants degradation. This is due to the occurrence of endogenous respiration of biomass that will remove a large part of the inert organic materials. In Part 3 of scenario 2, the optimum system operational performance was obtained at 100% RAS, 14 h HRT and 35 days SRT, achieving no sludge production and low pollutants concentrations of 3, 12, 8 and 45 mg/L for BOD, COD, TSS and NO3, respectively. For future direction of sludge management, increasing the HRT and SRT may eliminate sludge protection and pollutants but generate high nitrate protection due to sludge decay and biomass cell lysis. In addition, longer SRT in the IFAS processes was found necessary for the complete nitrification process. Briefly, sludge elimination in an activated sludge system is possible by carefully controlling the process and applying RAS without additional treatment process.

Supplementary Materials

The following supporting information can be downloaded at: https://www.mdpi.com/article/10.3390/w15030408/s1, Table S1: System Performance after the start-up for both scenarios.

Author Contributions

D.N.K. conducted the research work and wrote the first draft manuscript, M.H. introduced the methodology, S.M.S. supervised the research and H.M.Z., A.M. (Ali Majdi) and A.M. (Amin Mojiri) revised and wrote consecutive drafts to improve the manuscript. All authors have read and agreed to the published version of the manuscript.

Funding

This research received no external funding.

Institutional Review Board Statement

Not applicable.

Informed Consent Statement

Not applicable.

Data Availability Statement

Not applicable.

Acknowledgments

The authors would like to thank the technical support of Kerbala Sewerage Directorate and Al-Mustaqbal University College.

Conflicts of Interest

The authors declare no conflict of interest.

References

  1. Wang, F.; Zhou, L.; Zhao, J. The performance of biocarrier containing zinc nanoparticles in biofilm reactor for treating textile wastewater. Process Biochem. 2018, 74, 125–131. [Google Scholar] [CrossRef]
  2. Amanatidou, E.; Samiotis, G.; Trikoilidou, E.; Pekridis, G.; Tsikritzis, L. Complete solids retention activated sludge process. Water Sci. Technol. 2015, 73, 1364–1370. [Google Scholar] [CrossRef] [PubMed]
  3. Liu, Y.; Wang, N.; Wei, Y.; Dang, K.; Li, M.; Li, Y.; Li, Q.; Mu, R. Pilot study on the upgrading configuration of UASB-MBBR with two carriers: Treatment effect, sludge reduction and functional microbial identification. Process Biochem. 2020, 99, 211–221. [Google Scholar] [CrossRef]
  4. Zhang, X.; Song, Z.; Guo, W.; Lu, Y.; Qi, L.; Wen, H.; Ngo, H.H. Behavior of nitrogen removal in an aerobic sponge based moving bed biofilm reactor. Bioresour. Technol. 2017, 245, 1282–1285. [Google Scholar] [CrossRef] [PubMed] [Green Version]
  5. Tang, K.; Ooi, G.T.H.; Litty, K.; Sundmark, K.; Kaarsholm, K.M.S.; Sund, C.; Kragelund, C.; Christensson, M.; Bester, K.; Andersen, H.R. Removal of pharmaceuticals in conventionally treated wastewater by a polishing moving bed biofilm reactor (MBBR) with intermittent feeding. Bioresour. Technol. 2017, 236, 77–86. [Google Scholar] [CrossRef] [Green Version]
  6. Guo, J.-S.; Fang, F.; Yan, P.; Chen, Y.-P. Sludge reduction based on microbial metabolism for sustainable wastewater treatment. Bioresour. Technol. 2020, 297, 122506. [Google Scholar] [CrossRef] [PubMed]
  7. Semblante, G.U.; Hai, F.I.; Dionysiou, D.D.; Fukushi, K.; Price, W.E.; Nghiem, L.D. Holistic sludge management through ozonation: A critical review. J. Environ. Manag. 2017, 185, 79–95. [Google Scholar] [CrossRef] [Green Version]
  8. Salehiziri, M.; Amini Rad, H.; Novak, J.T. Disruption of cell to cell communication in the aeration unit of a cannibal process: Sludge reduction efficiency and related mechanisms. Biochem. Eng. J. 2018, 137, 326–333. [Google Scholar] [CrossRef]
  9. Zwain, H.M.; Nile, B.K.; Faris, A.M.; Vakili, M.; Dahlan, I. Modelling of hydrogen sulfide fate and emissions in extended aeration sewage treatment plant using TOXCHEM simulations. Sci. Rep. 2020, 10, 22209. [Google Scholar] [CrossRef]
  10. Faris, A.M.; Zwain, H.M.; Hosseinzadeh, M.; Majdi, H.S.; Siadatmousavi, S.M. Start-up and operation of novel EN-MBBR system for sidestreams treatment and sensitivity analysis modeling using GPS-X simulation. Alex. Eng. J. 2022, 61, 10805–10818. [Google Scholar] [CrossRef]
  11. Gu, Q.; Sun, T.; Wu, G.; Li, M.; Qiu, W. Influence of carrier filling ratio on the performance of moving bed biofilm reactor in treating coking wastewater. Bioresour. Technol. 2014, 166, 72–78. [Google Scholar] [CrossRef] [PubMed]
  12. Rout, P.R.; Shahid, M.K.; Dash, R.R.; Bhunia, P.; Liu, D.; Varjani, S.; Zhang, T.C.; Surampalli, R.Y. Nutrient removal from domestic wastewater: A comprehensive review on conventional and advanced technologies. J. Environ. Manag. 2021, 296, 113246. [Google Scholar] [CrossRef] [PubMed]
  13. Paśmionka, I.B.; Bulski, K.; Boligłowa, E. The Participation of Microbiota in the Transformation of Nitrogen Compounds in the Soil—A Review. Agronomy 2021, 11, 977. [Google Scholar] [CrossRef]
  14. Ani, J.S.; Manyala, J.O.; Masese, F.O.; Fitzsimmons, K. Effect of stocking density on growth performance of monosex Nile Tilapia (Oreochromis niloticus) in the aquaponic system integrated with lettuce (Lactuca sativa). Aquac. Fish. 2022, 7, 328–335. [Google Scholar] [CrossRef]
  15. He, T.; Xie, D.; Ni, J.; Li, Z.; Li, Z. Nitrous oxide produced directly from ammonium, nitrate and nitrite during nitrification and denitrification. J. Hazard. Mater. 2020, 388, 122114. [Google Scholar] [CrossRef]
  16. Skouteris, G.; Rodriguez-Garcia, G.; Reinecke, S.F.; Hampel, U. The use of pure oxygen for aeration in aerobic wastewater treatment: A review of its potential and limitations. Bioresour. Technol. 2020, 312, 123595. [Google Scholar] [CrossRef]
  17. Faris, A.M.; Zwain, H.M.; Hosseinzadeh, M.; Siadatmousavi, S.M. Modeling of novel processes for eliminating sidestreams impacts on full-scale sewage treatment plant using GPS-X7. Sci. Rep. 2022, 12, 2986. [Google Scholar] [CrossRef]
  18. Jiang, L.-M.; Zhou, Z.; Cheng, C.; Li, J.; Huang, C.; Niu, T. Sludge reduction by a micro-aerobic hydrolysis process: A full-scale application and sludge reduction mechanisms. Bioresour. Technol. 2018, 268, 684–691. [Google Scholar] [CrossRef]
  19. Chon, D.-H.; Rome, M.; Kim, Y.M.; Park, K.Y.; Park, C. Investigation of the sludge reduction mechanism in the anaerobic side-stream reactor process using several control biological wastewater treatment processes. Water Res. 2011, 45, 6021–6029. [Google Scholar] [CrossRef]
  20. Jiang, L.-M.; Zhou, Z.; Niu, T.; Jiang, L.; Chen, G.; Pang, H.; Zhao, X.; Qiu, Z. Effects of hydraulic retention time on process performance of anaerobic side-stream reactor coupled membrane bioreactors: Kinetic model, sludge reduction mechanism and microbial community structures. Bioresour. Technol. 2018, 267, 218–226. [Google Scholar] [CrossRef]
  21. Metcalf & Eddy; Tchobanoglous, G.; Stensel, H.D.; Tsuchihashi, R.; Burton, F.; Abu-Orf, M.; Bowden, G.; Pfrang, W. Wastewater Engineering: Treatment and Resource Recovery; McGraw Hill Education: New York, NY, USA, 2014. [Google Scholar]
  22. Langone, M.; Sabia, G.; Petta, L.; Zanetti, L.; Leoni, P.; Basso, D. Evaluation of the aerobic biodegradability of process water produced by hydrothermal carbonization and inhibition effects on the heterotrophic biomass of an activated sludge system. J. Environ. Manag. 2021, 299, 113561. [Google Scholar] [CrossRef] [PubMed]
  23. Chiavola, A.; Salvati, C.; Bongirolami, S.; Di Marcantonio, C.; Boni, M.R. Techno-economic evaluation of ozone-oxidation for sludge reduction at the full-scale. Comparison between the application to the return activated sludge (RAS) and the sludge digestion unit. J. Water Process Eng. 2021, 42, 102114. [Google Scholar] [CrossRef]
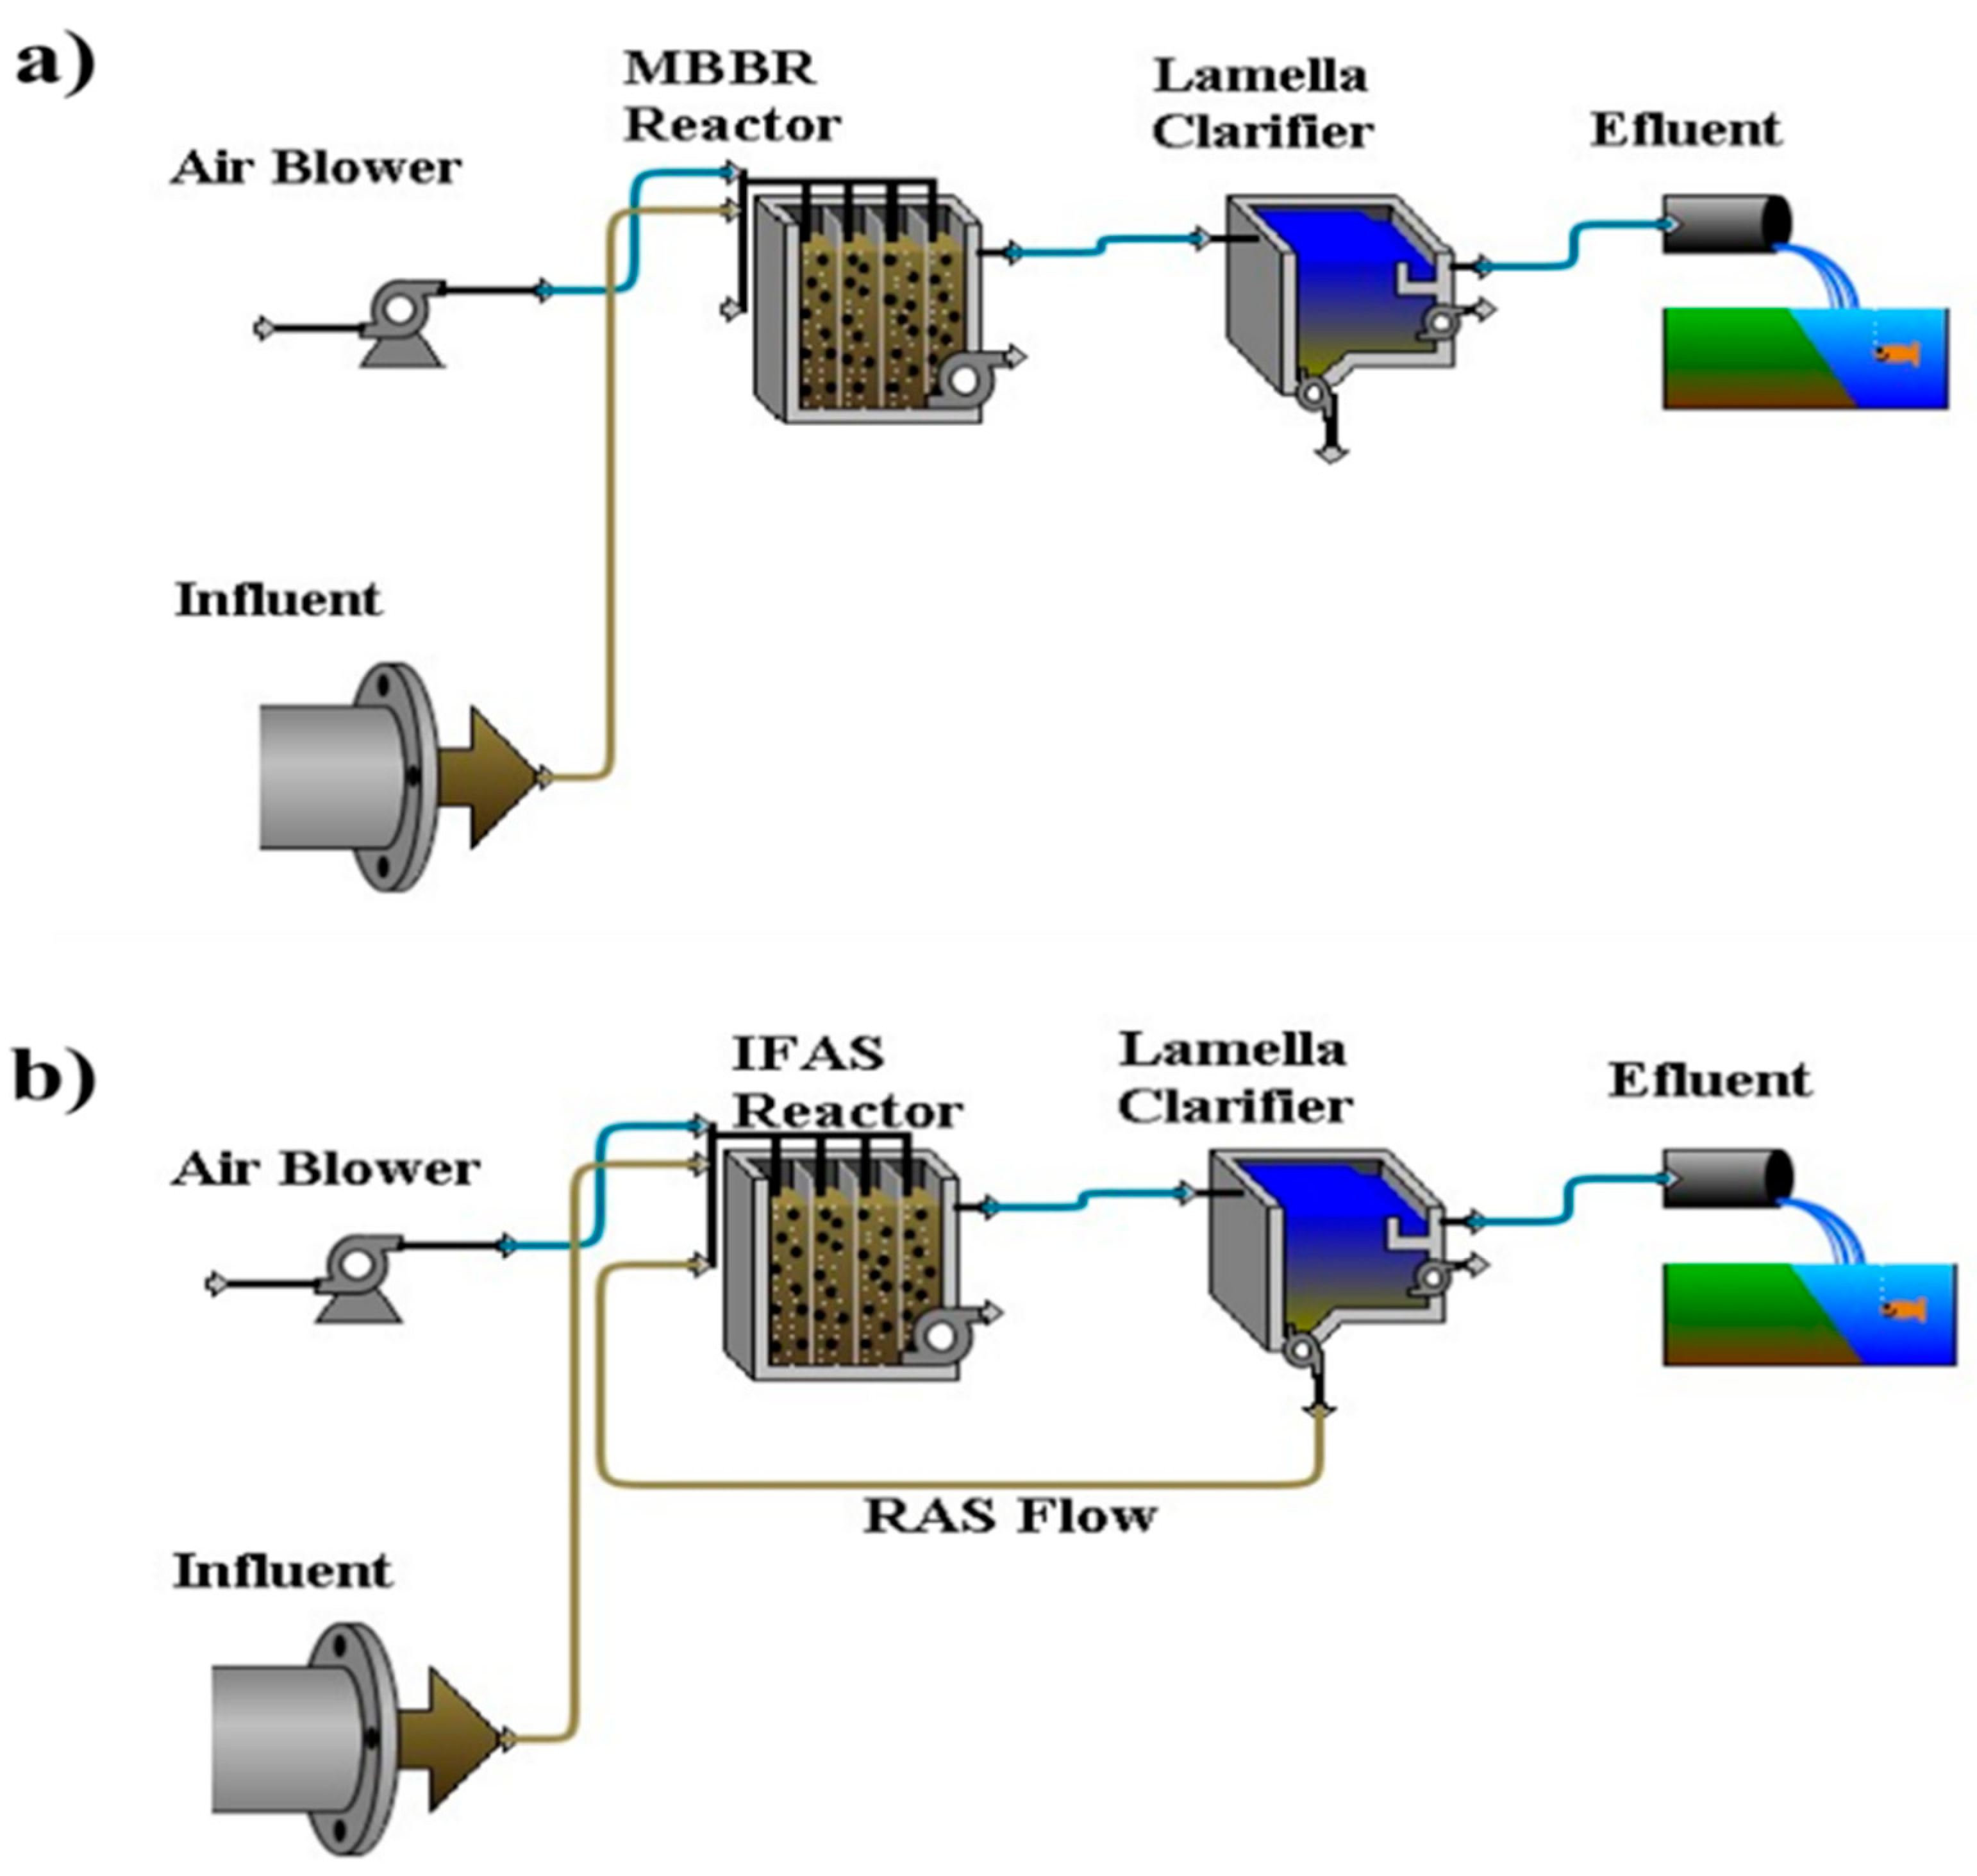
Figure 1. The schematic design of the: (a) MBBR system and (b) IFAS system.
Water 15 00408 g001
Figure 4. Start-up performance of the MBBR system. NO3 and NH4 concentration on the right vertical axes and TSS, BOD and COD on the left vertical axes.
Water 15 00408 g004
Figure 5. Biofilm development during the start-up process.
Water 15 00408 g005
Figure 6. Biofilm formation on the inner carriers surface after 1 week of the start-up.
Water 15 00408 g006
Figure 7. O2 uptake rate data in the bio treatment unit for scenario 1.
Water 15 00408 g007
Figure 8. O2 uptake rate data in the bio treatment unit for scenario 1.
Water 15 00408 g008
Table 1. System design parameters.
ParameterValue
Flow (Q)5 m3/d
Surface area loading rate (SALR) for BOD removal7.5 g/m2·d
Surface area loading rate (SALR) for NH4 removal0.87 g/m2·d
Dissolved oxygen (DO)4 mg/L
BOD removal≥95%
NH4 removal≥95%
Carrier fill ratio40%
Hydraulic Retention time (HRT) for BOD and NH4 removals9 h
Specific surface area500 m2/m3
Table 2. The performance of Karbala sewage treatment plant.
ParameterInlet ConcentrationOutlet Concentration
pH6.7–7.47–7.2
COD (mg/L)345–44020–30
BOD (mg/L)140–2454–9
TSS (mg/L)155–3254–9
NO3 (mg/L)0–47–40
NH4 (mg/L)20–280.5
PO4-P (mg/L)20–260.5–2
H2S (mg/L)15–30<0.5
Table 3. Sludge production and effluent pollutants concentrations at different operational conditions of MBBR and IFAS processes.
SRT (Day)HRT (h)WAS (m3/Day)RAS (%)Excess Sludge (g/Day)Period (Days)BOD (mg/L)COD (mg/L)TSS (mg/L)NO3 (mg/L)NH4 (mg/L)Process
Scenario 1Part 1590.1075013815560.7MBBR
Part 210180.10370304134190.4
Part 315260.1015030284320.2
Scenario 2Part 1Complete6050030408580160.3IFAS
Part 2Complete12050040296048270.2
Part 3Complete1401000603128450.2
Part 4Complete1401500604119580.2
Part 5Complete2001500602710700.2
Disclaimer/Publisher’s Note: The statements, opinions and data contained in all publications are solely those of the individual author(s) and contributor(s) and not of MDPI and/or the editor(s). MDPI and/or the editor(s) disclaim responsibility for any injury to people or property resulting from any ideas, methods, instructions or products referred to in the content.