Article

Green Zinc Oxide (ZnO) Nanoparticle Synthesis Using Mangrove Leaf Extract from Avicenna marina: Properties and Application for the Removal of Toxic Metal Ions (Cd2+ and Pb2+)

Department of Environmental Sciences, Faculty of Meteorology, Environment and Arid Land Agriculture, King Abdulaziz University, Jeddah 21589, Saudi Arabia
Water 2023, 15(3), 455; https://doi.org/10.3390/w15030455
Submission received: 22 December 2022 / Revised: 17 January 2023 / Accepted: 18 January 2023 / Published: 23 January 2023

Abstract

:
This work used a variety of experimental studies to explore the elimination of cadmium and lead ions from aqueous solutions using a novel method for the biosynthesis of nanoparticles of zinc oxide sorbents (ZnO-NPs) from mangrove leaf extract. The influences of important factors affecting the adsorption technique were determined, including the pH value, contact duration, the initial concentration of metal ions, nano-adsorbent dose, different temperatures, and interfering ions. To confirm the formation of synthesized ZnO NPs and validate the properties of green-synthesized sorbents, a variety of analytical methods were used, including UV–vis spectroscopy, X-ray diffraction (XRD), Fourier transform infrared spectroscopy (FT-IR), scanning electron microscopy (SEM), and energy-dispersive X-ray spectroscopy (EDX). The results showed that the average diameter of the ZnO-NPs was approximately 29.1 nm (spherical at the nano-size regime). The adsorption reaction rate was examined by comparing pseudo-second order against pseudo-first order templates. From the observed records, the adsorption reaction of Cd2+ and Pb2+ on the ZnO-NPs fitted well with the pseudo-second order template. Freundlich, Langmuir, Dubinin–Radushkevich, and Tempkin equilibrium isotherm models were used to evaluate the sorption of Cd2+ and Pb2+ onto the sorbent material. Based on the parameters extracted from each model, as well as the model-fitting values, the preferential isotherms for Pb2+ and Cd2+ ion adsorption on ZnO-NPs were the Dubinin–Radushkevich and Langmuir models, respectively. ZnO-NPs have the potential to be used as an effective and promising adsorbent material for eliminating metal ions from water solutions.

1. Introduction

Natural water resource contamination is a major issue on a global scale. Increasing industrialization and unchecked urban expansion allow for the release of hazardous metals such as cadmium and lead into the environment [1,2]. Metal ions enter the water via industrial activities in the metallurgical, automotive, chemical, and petrochemical sectors. In addition, these ions pose several health hazards, including the possibility of respiratory paralysis, renal and/or heart failure, pulmonary edema, and severe gastrointestinal bleeding [3,4].
Regarding wastewater treatment, several traditional approaches have been investigated, including flocculation, biological processes, electrolysis precipitation and ion exchange, membrane processes, adsorption, and coagulation. Among these strategies, adsorption is regarded as the most productive and economical approach for wastewater management because of its high efficiency at a fair cost, exceptional benefits with respect to availability, and simple operation [5,6,7].
For the elimination of heavy metals, substantial investigations have been conducted concerning the creation of adsorbents such as polymer materials, activated carbons, biofuels, industrial byproducts, and zeolites [8,9]. Nonetheless, these adsorbents have substantial limitations, such as restricted loading capacities, few metal-ion-binding sites, low economic viability, and poor selectivity. Considering these obstacles, scientists have concentrated on developing nano-adsorbents for the elimination of contaminants from wastewater [10]. During the past few years, nanotechnology, as a new term, has become the focus of the world’s attention. This technology has resulted in a vast leap in all science and engineering branches, in addition to having numerous applications in the economic, medical, informatics, petrochemical, computer, biological, agricultural, environmental, electronic, and other fields. Diverse synthesis techniques—including ball milling, thermal decomposition, hydrothermal, micro emulsion, sol–gel processing, co-precipitation, and biological and green-synthesized approaches—have been used to manufacture nano-absorbents with varying sizes, morphologies, and forms, as well as excellent compatibility and stability. For the exclusion of heavy metals from industrial effluent, several nano-adsorbents (metal oxides) including ferric, manganese, aluminum, titanium, zinc, silicon oxide, and selenium nanoparticles have been developed [11].
Metal oxides, such as ZnO, have long been predicted to be feasible nano-adsorbents owing to their distinctive properties, such as their high electron mobility, outstanding transparency, and robust room-temperature luminescence [12]. The unique physical, chemical, and biological qualities of zinc oxide nanoparticles, such as their biocompatibility, environmental friendliness, inexpensiveness, and non-toxic nature, make them one of the most significant metal oxides materials that have been extensively used in material research [12]. Many researchers are interested in topics surrounding the synthesis of zinc oxide nanoparticles from plants [13,14,15].
Angelin et al. (2015) [16] employed spherical ZnO-NPs (8 nm), manufactured by the sol–gel technique, as an adsorbent for Hg(II), Cd(II), Bi(III), and Pb(II) elimination under the reaction parameters of duration (60 min), temperature (30 °C), dosage (0.250 g), and [Mn+] (0.01 mol L−1) The reported elimination values for Cd(II), Pb(II), Bi(III), and Hg(II), were 61.2%, 97.1%, 80.9%, and 86.8%, respectively. Kamath et al. (2019) [17] produced a ZnO nanosphere to effectively remove Cr6+, and the authors reported that the qe was 0.00165 mgg−1. In contrast, the instability of zinc oxide nanoparticles in an aqueous matrix is a disadvantage.
Recently, many natural polyphenolic compounds were studied and examined for the removal of contaminants. Natural polyphenols have attracted more attention as promising compounds in diverse water treatment for either wastewater or sea water. Xu et al. (2022) [18] presented the developments from a large amount of research that has been carried out on these compounds. In the study by Wang et al. (2022) [19], a large porous membrane based on metal–organic frameworks (MOF) were explored; consequently, it was revealed that this membrane can extract uranium very efficiently through continuous seawater filtration. Saad et al. (2021) [20] prepared environmentally friendly materials from chitosan (CS) extracted from shrimp shells, and used the algae Ulva lactuca to extract biological compounds for the bio treatment of cadmium(II) ions.
Many recent studies have been conducted using the leaves and roots of terrestrial or marine plants to form nanocomposites with ZnO. Costus woodsonii leaf extract has been successfully used to synthesize narrow-band-gap ZnO-NPs [21]. An important environmental application has been developed by evaluating the antibacterial activity of Terminalia catappa leaf extract in plant-mediated ZnO-NPs and three other ZnO-NPs, and the activity was higher than that of the uncapped ZnO-NPs leaf extract and Terminalia catappa alone [22]. A modern method has been used to extract components from the leaves of Thymus vulgaris by developing a simple hydrothermal method and extracting phytochemicals for ZnO-NPs; the use of thymus leaf extract as a reducing agent containing flavonoids, phenols, and saponins played a significant role in the production of ZnO-NPs [23]. Mangrove trees are among the coastal plants spread over large areas in various regions of the Red Sea, and they have high medical and nutritional benefits. There are many studies in this field.
Our study aimed to create natural sorbents that were efficient, affordable, and ecologically beneficial. Numerous studies have been conducted on the synthesis of ZnO-NPs utilizing plant-derived reducing agents; however, the use of the mangrove leaf extract of Avicenna marina for ZnO-NPs synthesis has not yet been reported. Additionally, in this study, the chemical and physical properties of ZnO-NPs were analyzed utilizing infrared spectroscopy (FT-IR) and scanning electron microscopy (SEM). The kinetic properties and equilibrium efficiency of the adsorption of some metal ions (Cd2+ and Pb2+) from aqueous solutions under batch conditions were studied with ZnO-NPs.

2. Materials and Methods

2.1. Materials

All the chemicals used during this research were obtained internationally and were of high quality. Lead nitrate (Pb (NO3)2) and cadmium acetate (Cd(C4H6O4)·2H2O), used as sources of cadmium ions (Cd2+) and lead ions (Pb2+), respectively, and sodium hydroxide (NaOH), were of analytical quality and obtained from Aldrich, UK, and used without extra purification. Methanol was used as a solvent to obtain the mangrove leaf extract.

2.2. Collection and Extract Preparation of the Plant

Mangrove leaves (Avicenna marina) were collected from the Al-Shaibah lagoon. To remove any impurities, leaves were rinsed with tap water and then double-distilled water (DDW), and they were allowed to air dry (at 25 °C) in the shade. The plant’s parts were separated, divided into smaller pieces, and dried, before being mechanically crushed into a fine powder.
Approximately 10 g of the powder of the crushed plant was placed into 500 mL conical flasks including 100 mL of methanol and heated at 60 °C for 30 min [24]. The reaction was performed in an open conical flask with cover. Whatman filter paper was used to obtain the aqueous leaf extract separately. The filtrate was utilized for the production and synthesis of ZnO-NPs.

2.3. Biosynthesis of Nanoparticles

Modifications to a previously published co-deposition approach by Sagar and Thorat (2015) [25] have been made to synthesize zinc oxide nanoparticles. Approximately 10 mL of aqueous extract of mangrove leaves was combined with 0.02M of Zn (OAc)2·2H2O solution (5 g in 100 mL). The mixture was stirred using a magnetic stirrer in a 70 °C water bath for 2 h. Pale yellow pellets began to form, and their number grew over time. Then, drop by drop, 10 mL of 0.5M NaOH was added. The reaction was stirred for a further hour until a solid with a faint yellow tint was obtained. ZnO-NPs were centrifuged after being rinsed with deionized distilled water two to three times. The pale-yellow powder was the final product that was dried overnight in an oven at 80 °C and stored in airtight vials for future research.

2.4. Characterization of Nanostructures

ZnO-NPs were characterized in terms of their morphology, crystalline phases, elemental composition, chemical states, surface area, and functional groups by many characterization techniques. The optical characteristics of the synthesized ZnO NPs were investigated by a UV–visible spectrophotometer (Shimadzu UV-Visible Spectrophotometer), and the wavelength range was 200–700 nm. Energy dispersive X-ray spectroscopy (EDX) along with scanning electron microscopy (SEM, JEOL: JSMIT 200) were used to study the element composition and the synthesized particles. An X-ray instrument (PHILIPS, PW 1730) was also used for an X-ray diffraction test-based analysis of ZnO nanoparticles, with a theta (2θ) scanning range between 10° and 80°. To study the functional groups, the ZnO NPs sample powder was mixed with KBr, the sample was placed into a metal hole, and the hole was pressurized and then analyzed with FT-IR (Thermo Scientific Nicolet iS10, Waltham, MA, USA). An atomic absorption spectrophotometer (AAS) was used to determine the presence of metal ions (Cd2+ and Pb2+) (PerkinElmer AAnalyst 800 Atomic Absorption Spectrometer, Waltham, MA, USA).

2.5. Adsorption Studies in Batch

2.5.1. Impact of pH Value on the qe of Metal

As metal ions are less soluble in basic conditions, the pH value becomes an essential factor when evaluating metal treatment techniques. The pH effect was studied in the range of 2–7 at room temperature using a buffer solution. A 10-ppm solution of Cd2+ and Pb2+ ions was produced as a starting concentration in a 25 mL measuring flask mixed with 20 mg of bio-sorbent for 30 min at 200 rpm (the average size of ZnO-NPs sample powder was 29.1 nm). The samples were filtered using Whatman filter paper, and an atomic adsorption spectrometer was used to calculate the trace metal concentrations.

2.5.2. Impact of Contact Duration

A solution containing 20 ppm each of [Pb2+] and [Cd2+] was stirred continuously at 200 rpm for numerous contact times (5–60 min) at RT with 0.02 g of ZnO-NPs to study the optimum experimental time of removal. At the conclusion of each mixing period, the liquid portion was filtered out of the solution and the residual concentrations of Cd2+ and Pb2+ were measured by AAS [26].

2.5.3. Impact of Nano-Sorbent Dose

The removal of Cd2+ and Pb2+ from the refinery effluent was investigated at various adsorbent doses of 0.01, 0.02, 0.04, 0.08, 0.12, 0.16, and 0.2 g per 25 mL. The solution was constantly swirled at 200 rpm for 5 and 50 min for Cd2+ and Pb2+, respectively. At the conclusion of every mixing interval, the liquid portion were filtrated and the residual concentrations of Cd2+ and Pb2+ were measured by AAS [26].

2.5.4. Initial Influence of [Mn+] on Sorption Capacity

In 25 mL of DIW, the effect of Co (Cd2+ and Pb2+) on adsorption—with optimal shaking duration, pH, and doses for metal concentrations (5, 10, 15, 20, 25, 30, 40, 60, 80, and 100 ppm) applied—was examined. After filtration, the metal content of the water samples was analyzed.

2.5.5. Impact of Competing Ions on Sorption Capacity

The capacity of sorption [Mn+] was studied in the presence of competing ions at the optimum shaking time, pH, initial metal ion concentration, and doses. Then, 0.1 g of certain interfering ions, such as KCl, NaCl, MgSO4, KNO3, NaCO3, and CaCO3, was added to a 25 mL solution with initial metal ion values. The residual metal concentrations were determined using an atomic adsorption spectrometer after filtration.

2.6. Data Analysis

Using Equation (1), the quantity of metal ions that could be adsorbed per gram (mg/g) was computed (qe).
q e = ( C o C e ) / V m
The discrepancy between the starting and final concentrations was utilized to calculate the quantity of Mn+ adsorbed. Equation (2) was used to calculate the sorption efficiency (percent).
% Removal = C o C e C o 100

2.6.1. Kinetics Describing Adsorption Models

In reference to the pseudo-first-order template of kinetics, adsorption occurs only at isolated locations, with no interaction among the adsorbed ions. The frequency of absorption is related to the number of available spaces. The equation (Equation (3)) for the pseudo-first-order model of the kinetic process is as follows [27]:
ln ( q e q t ) = lnq e k 1 t
The values of K1 and qe are determined from the slope and intercept, respectively, of a plot of log (qe − qt) vs. time. The pseudo-second-order template for the kinetic process of [M2+] adsorption on a sorbent was initially described by Ho and McKay in 1999 [27]. This model assumes the rate-determining step is chemical adsorption and predicts behavior across the complete adsorption range. In this instance, the adsorption rate is dictated by the adsorption capacity [28]. Equation (4) is the pseudo-second-order equation [29]:
t q t = 1 k 2 q e 2 + t q e
The intercept and the slope of a chart of t/qt versus t were utilized to determine the amount of k2 and qe, respectively.

2.6.2. Isotherms Describing Adsorption Models

Adsorption isotherms present essential physiochemical data that can be used to establish the applicability of the adsorption process as a single operation. The Freundlich, Langmuir, Dubinin–Radushkevich (D–R), and Tempkin models were analyzed.
The Freundlich model deals with heterogeneous adsorption, while the Langmuir model concerns monolayer adsorption with a constant adsorption energy. According to the Temkin isothermal model, the heat of adsorption decreases with the height of the absorbent layer cover [30]. D–R isotherms can be used to determine adsorption on both heterogeneous and homogeneous surfaces. Table 1 shows the equations of Dubinin–Radushkevich (D–R), Tempkin, Langmuir, and Freundlich. The parameter definitions in Table 1 (Equations (5)–(8)) are as follows: qe—capacity of adsorption at equilibrium in mgg−1; qmax—the capacity of maximum adsorption of monolayer sorption in mgg−1; Ce—the ion concentration at equilibrium in mgL−1; KL—the Langmuir equilibrium constant, which represents the adsorption intensity in Lmg−1; Co—initial ion concentration (mgL−1); Kf—capacity of adsorption on the solid adsorbent; n—intensity of adsorption on the adsorbent’s surface; AT—the equilibrium-binding constant (Lmin−1); and B—the adsorption free energy/mole of sorbate substance due to its migration from the solution to the adsorbent surface [31,32,33,34,35].

2.6.3. Thermodynamic Adsorption

The thermodynamic properties of metal ion adsorption onto ZnO-NPs were studied using different temperatures, namely, 10, 20, 30, 40, 50, and 60 °C. The values of Kd, enthalpy (ΔH°), Gibbs free energy (ΔG°), and entropy (ΔS°) were computed from Equations (9)–(11).
K d = q e / C e
Δ G ο = RTLnK d
LnK d = Δ S ο R Δ H ο RT
where qe and Ce are the equilibrium adsorption capacity (mgg−1) and M2+ concentrations at equilibrium (mg/L), respectively; Kd is the adsorbate distribution coefficient; R is the universal gas constant (8.314 J/mol K); and T is the temperature (K).

2.6.4. Experimental Desorption

In order to test the reusability of ZnO-NPs, 0.20 mg of ZnO-NPs powder was used to adsorb a 20.0 mg/L metal ions solution for 60 min, after which the solution was desorbed by adding 20 mL of 0.01 M Na2EDTA solution while stirring continuously. The recyclable nature of the ZnO-NPs composites was tested by subjecting them to four adsorption–desorption cycles. The adsorbent was neutralized by washing it with deionized distilled water after each adsorption–desorption cycle, after which it was dried and readied for another adsorption cycle. Metal ion recovery efficiency, R (%), can be determined using Equation (12).
Efficiency   ofmetal   ions   desorption   %   = concentration   of   metal   ions   desorbed concentration   of   metal   ions   adsorbed × 100

2.6.5. Quality Assurance

With a blank and standards for each measurement series, the calibration curve for metal analysis was generated (Merck, Darmstadt, Germany). Using external reference materials for the presence of trace metals in water, the precision and accuracy of the metal measurements were confirmed. Microsoft Excel was used to compute the R values for the measured variables to determine the connections between the generated data.

3. Results

3.1. Characterization of Synthesis ZnO-NPs

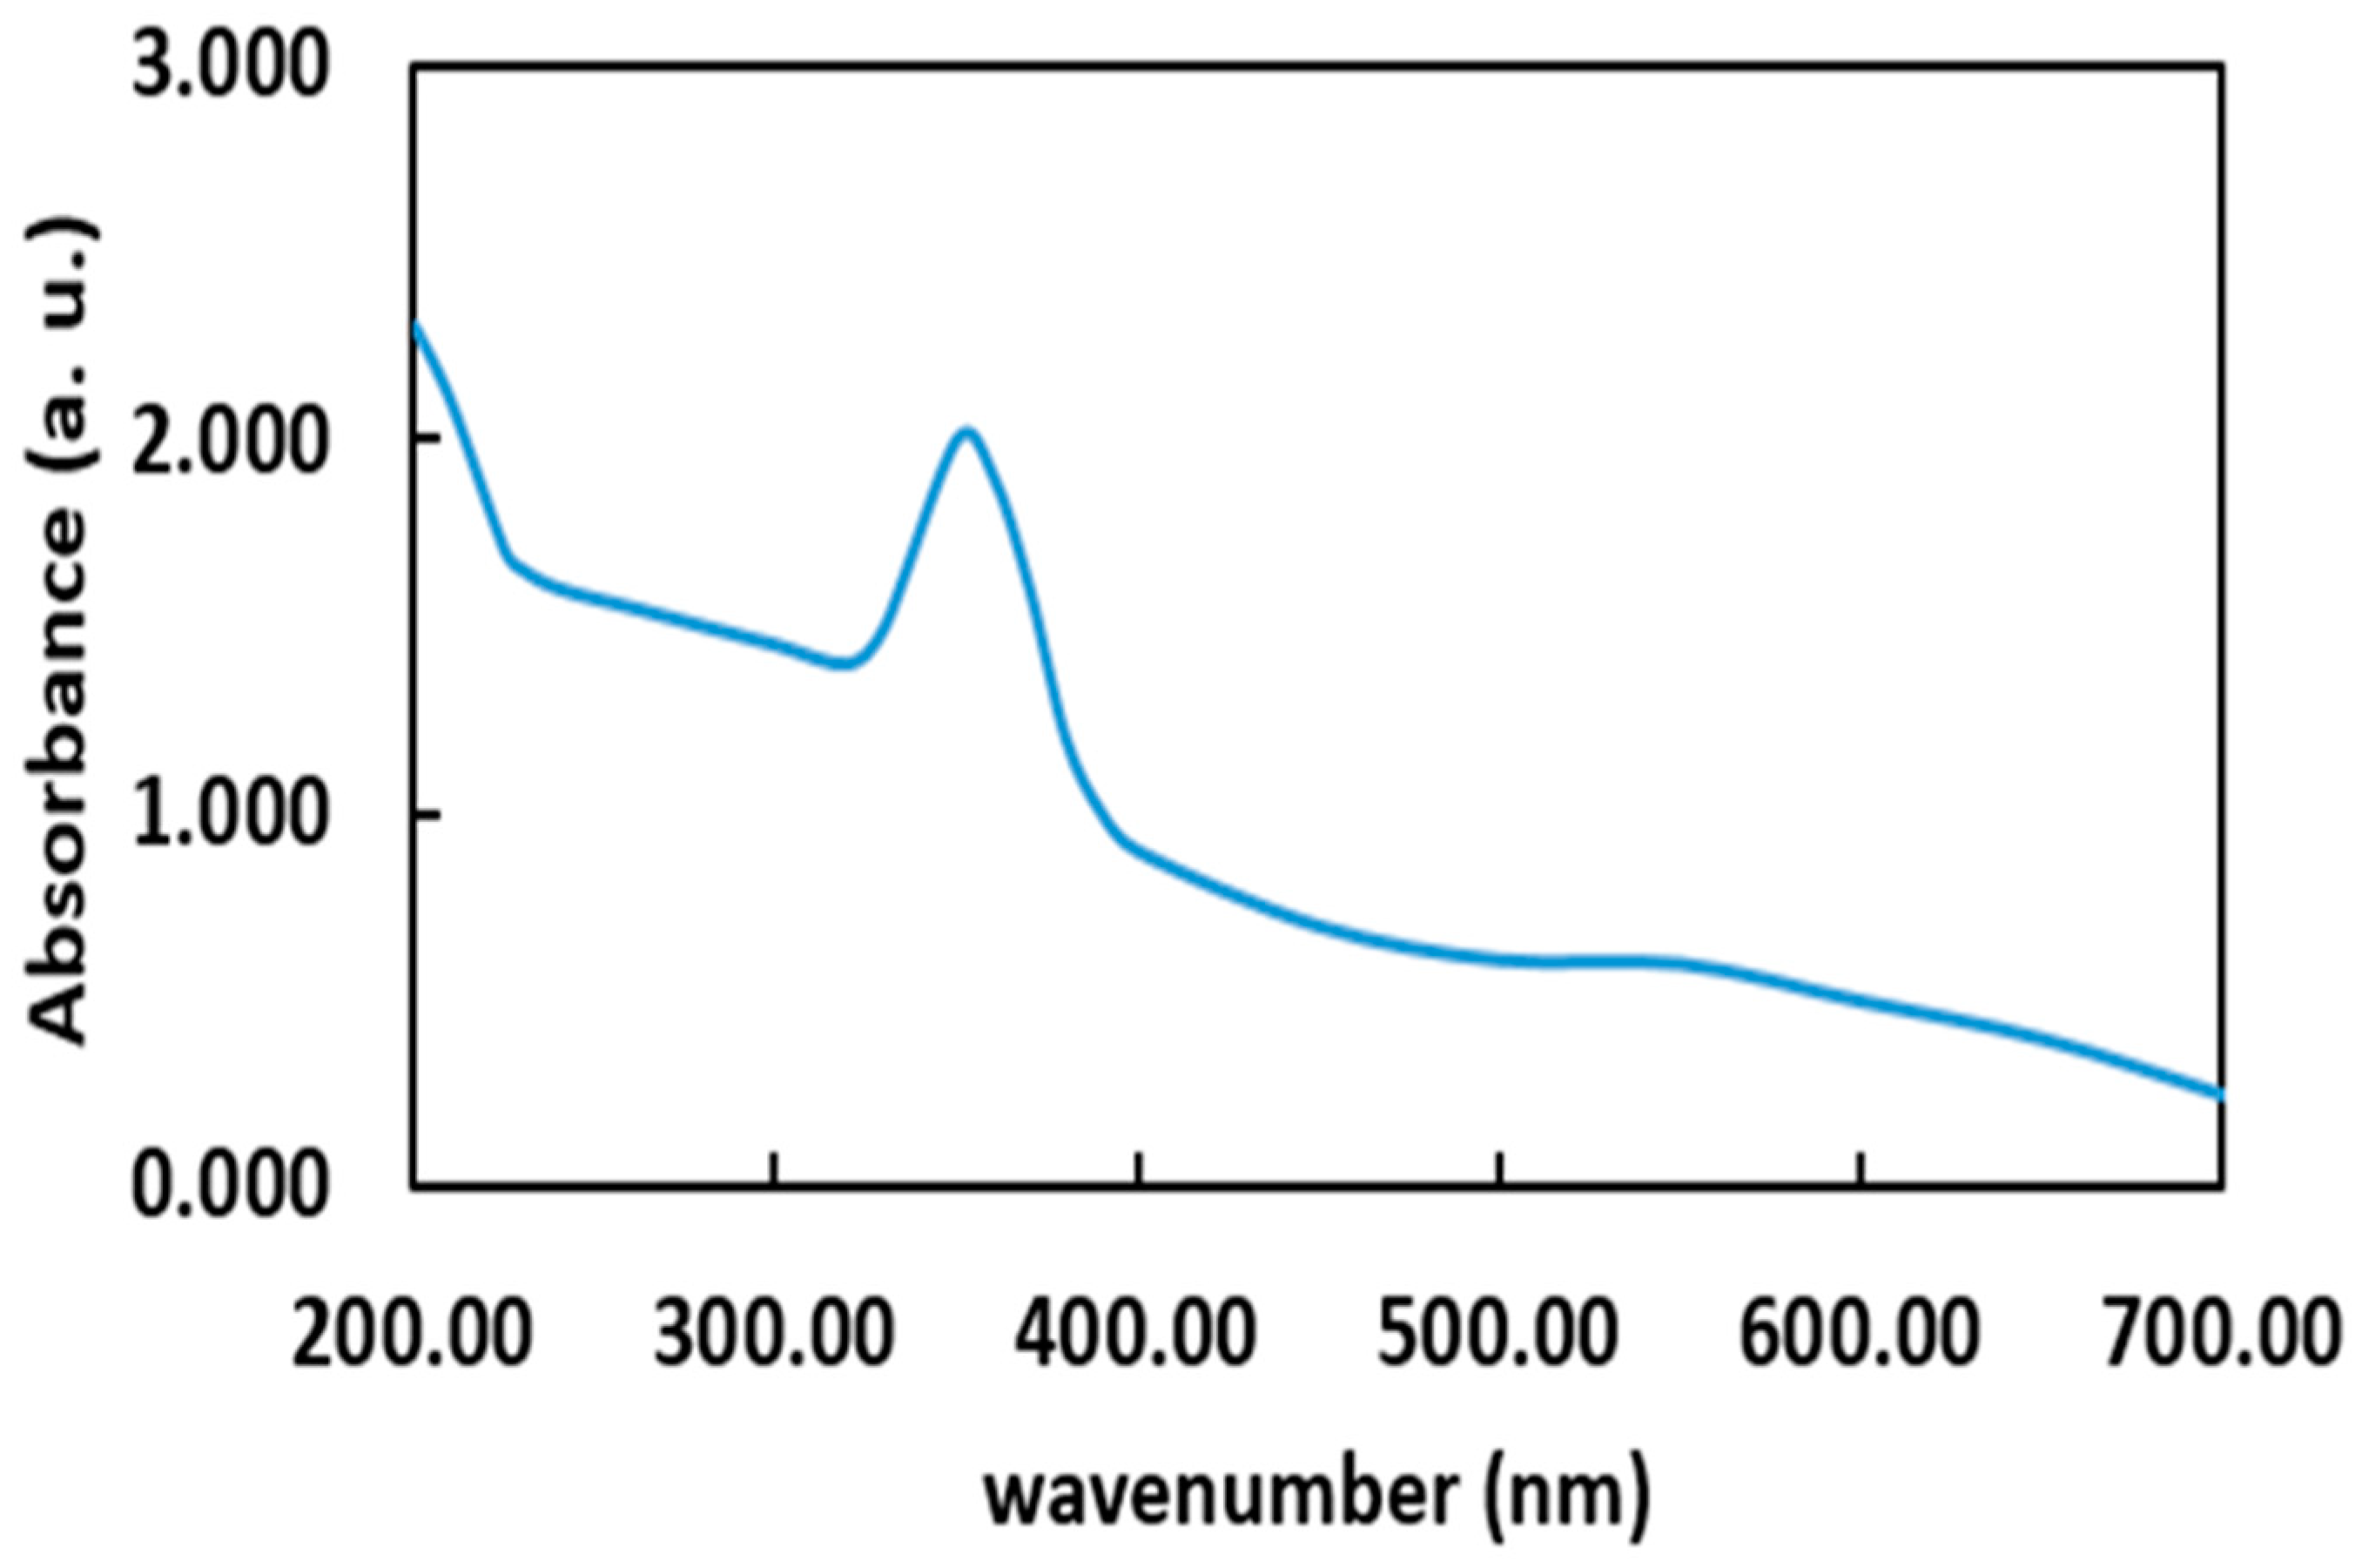
3.1.1. Ultraviolet–Visible Spectroscopy (UV–Vis)

UV–vis spectroscopy was used to confirm the formation of synthesized ZnO-NPs (Figure 1). ZnO-NPs were dissolved in ethanol (0.1% wt). The absorption spectra of ZnO-NPs were recorded at room temperature, and the wavelength ranged from 200 to 700 nm. In this study, the spectrum of the ZnO-NPs revealed good absorption at a wavelength of 370 nm in the UV region due to the band gap absorption of ZnO induced by electrons transferred from the valence band to the conduction band. Similar studies regarding the synthesis of ZnO-NPs showed a local absorption peak in the range between 355 to 380 nm [36,37,38,39,40,41,42].

3.1.2. X-ray Diffraction Spectroscopy (XRD)

X-ray powder diffraction (XRD) was used to identify the ZnO nanomaterial with a hexagonal type of crystal structure (Figure 2). In particular, the peaks at Bragg diffraction angles (2θ) of 31.77°, 34.43°, 36.26°, 47.55°, 56.60°, 62.87°, 66.39°, 67.96°, 69.09°, 72.59°, and 76.98° were assigned to the planes (100), (002), (101), (102), (110), (103), (200), (112), (201), (004), and (104), in accordance with the Joint Committee of Standards of Powder Diffraction of ZnO file (JCPDS) [43]. No diffraction peaks of other contaminants were seen, proving that the produced sample is ZnO-NP when compared to the reference with a hexagonal structure [44]. The size of the ZnO-NPs was estimated from the intensity peak utilizing the Debye–Scherer Equation (13).
D = K λ / β   cos θ
where β is the full Width at Half Maximum in Radians of the Diffraction Peak, λ is the wavelength of the X-ray from Cu-Kα (1.540560 Å), θ is Braggs’ angle, and K is the form factor, and its value is 0.9. From the X-ray diffraction data, the peaks of the produced crystals were broad in size, having sizes in nanometers, specifically, in the range from 23.7 to 39.2 nm with an average of 29.1 nm (Table 2).

3.1.3. FT-IR Analysis of ZnO Nanospheres

Figure 3 displays the FT-IR spectra of the biologically produced ZnO-NPs from the mangrove extract. In the diffuse reflectance mode, the FT-IR spectra were obtained in the form of pellets using spectroscopic-grade KBr in the ύ range of 450 to 4000 cm−1. The synthesized ZnO-NPs exhibited functional group bands at 3357, 2928, 1564, 1405, 1265, 1028, 913, 672, 609, and 519 cm−1. The strong wide band at 3357 cm−1 was a result of the ν-OH groups. The absorption band at 2928 cm−1 originated from the vibrational stretching of CH groups. The peak at around 1564 cm−1 represents the amide group (-C=O-). The frequency of the –C-H- bending vibration band was 1405 cm−1. The frequency of the C-O stretching vibration region was 1028 cm−1. The peaks at 913 and 672 cm−1 were attributable to the vibrational bending of =C-H groups. The band at 609 cm−1 was related to the O-H group’s bending vibration. The absorption band at 519 cm−1 validates the creation of materials though its relation to the stretching vibration of Zn-O bonds [45]. The spectral bands between 450 and 4000 cm−1 suggest the existence of C-O, –OH, and –C-H residues, whose presence may be due to the reaction’s precursors.
The FT-IR spectra of Cd2+ and Pb2+ adsorption on the ZnO-NPs are shown in Figure 3; certain changes in the spectra were observed. The strength of the peaks lowered, with a small variation after Cd2+ and Pb2+ adsorption. Some bands have disbanded, while others shifted or transformed. However, the existence of Pb-O and Cd-O stretching vibrations resulted in the appearance of additional absorption peaks at 422 cm−1 [46,47,48,49]. Adsorption was confirmed by such changes in the FT-IR spectra. The surface structure of the ZnO nanospheres changed following the adsorption of Cd2+ and Pb2+. The characteristic metal absorption peaks appeared at 1030.58 cm−1 and 1030.71 cm−1 for Cd2+ and Pb2+, respectively. These metal ions totally filled the active sites, resulting in the creation of a non-uniform coating across the ZnO-NPs’ surfaces [50,51].

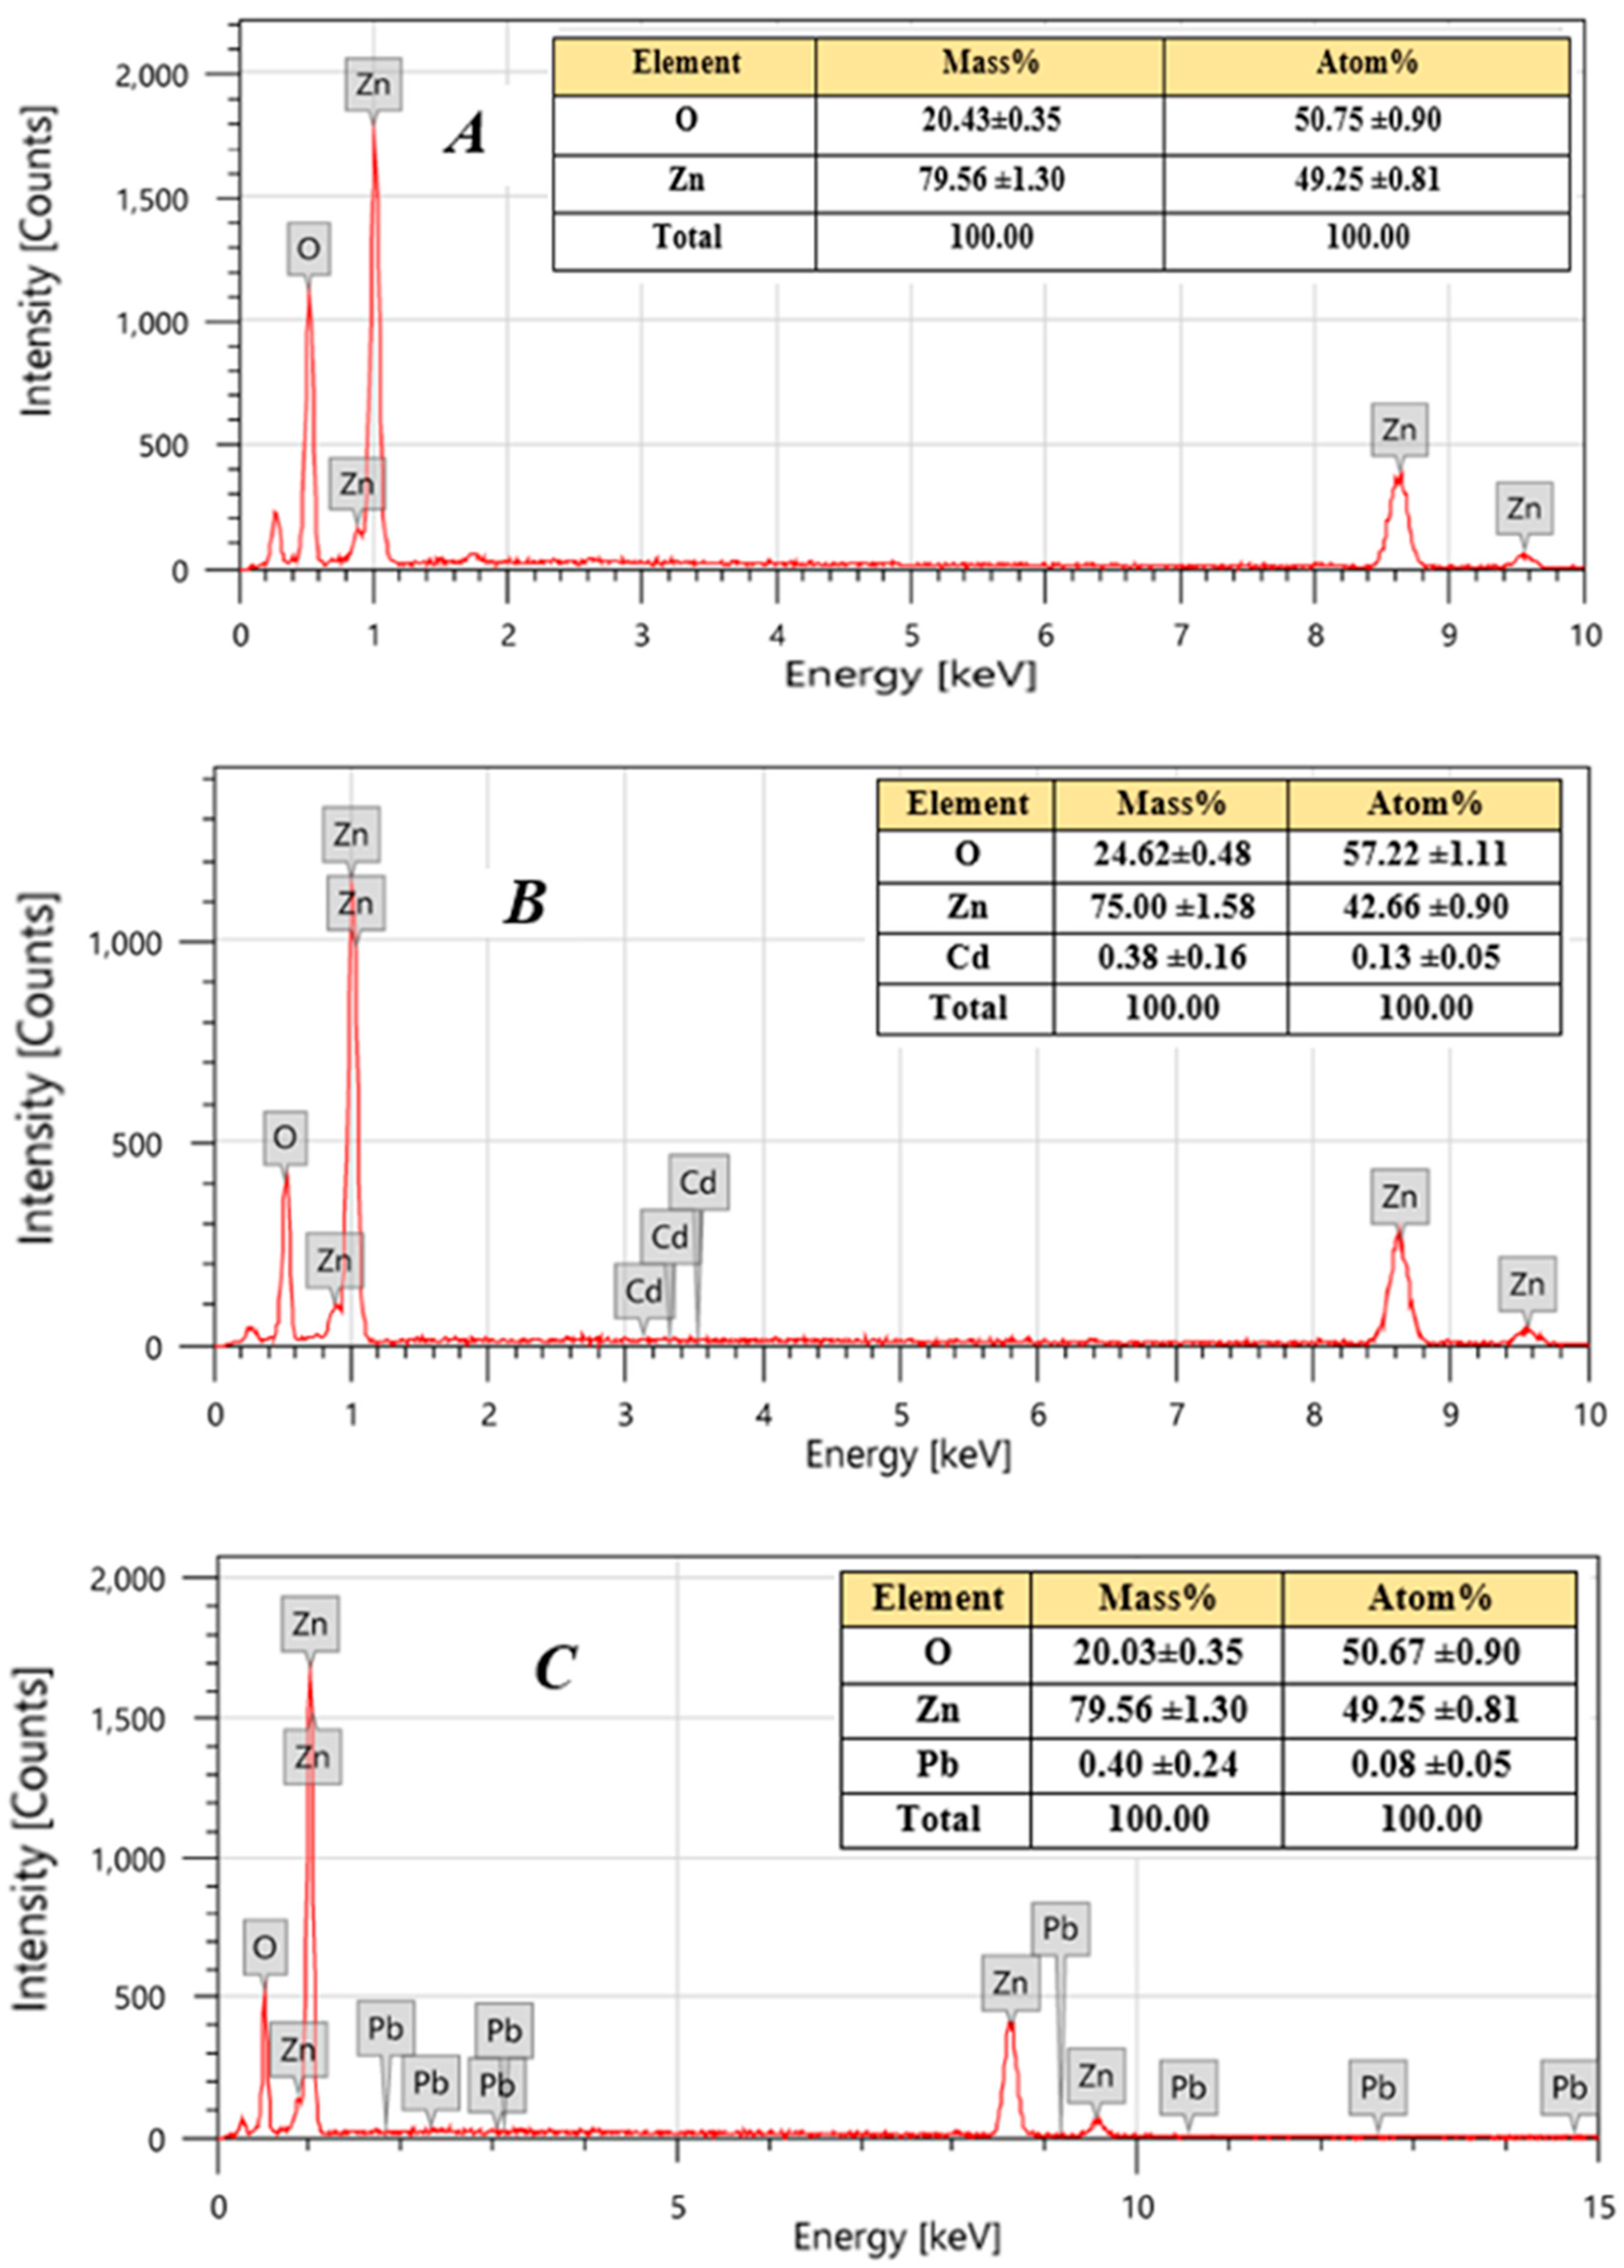
3.1.4. Elemental Analysis of ZnO-NPs (EDX)

EDX employs a semi-quantitative procedure; it provides an elemental analysis in terms of atomic percentage and weight, and it is found along with the peak area and spectra for all sample components. The elemental composition analyses of ZnO-NPs, ZnO-NPs-Pb, and ZnO-NPs-Cd are presented in Figure 4. The spectra of the naturally created ZnO-NPs demonstrated the presence of the required phase of O and Zn, confirming the excellent purity of the produced ZnO-NPs. The faint peak signals may be due to the X-ray emissions from macromolecules in the plant leaf extract’s cell wall [52]. In our data, the measured stoichiometric mass percentages of Zn and O were 50.12 and 29.15%, respectively. Figure 4 shows the results of the EDX spectra (energy-dispersive X-ray analysis) of bio-ZnO-NPs; it represents the energy in keV and the X-ray counts. This confirmed the presence of bio-ZnO-NPs and other elements such as carbon and oxygen. The spectra of Zn elements were observed at three signal energies, namely, 1, 8.5, and 9.5 keV, which is in accordance with the previous studies [53,54].

3.1.5. SEM Analysis of ZnO Nanospheres

To learn more about the sample’s morphology and crystallinity, an SEM investigation was conducted. The obtained SEM images of nano-zinc-oxide (before metal ion adsorption) revealed the surface morphology and texture of the adsorbent. In addition, the SEM pictures revealed clusters of nanoparticles, which might be attributable to the strong intermolecular interactions operating between these nanoparticles (Figure 5). Significant morphological changes were observed as a result of the treatments tested in Figure 5, showing a rougher, uneven surface with many tiny particles deposited on it. These alterations resulted from the metal ions interacting with the surface of the ZnO nanoparticles.

3.2. The Influence of Operational Parameters on Metal Ion Adsorption

3.2.1. Effect of pH

pH has a significant impact on the adsorption process in the solution, impacting not only the Mn+ species in the solution, but also the surface characteristics of the adsorbents [54]. The adsorption reaction between ZnO-NPs with Cd2+ and Pb2+ was investigated in the presence of different buffering and acidic conditions across the pH range of 2.0–7.0 using the batch equilibrium method. The results are shown in Figure 6a, and we observed that pH 6.0 is the most appropriate medium for metal removal. At low pH values, low metal adsorption was detected; this might have been due to the high concentration of hydrogen ions that compete with M2+ at the active sorption/exchange spots, resulting in a drop in the overall quantity of binding sites accessible for metal absorption [55]. In addition, the surface functional groups of the adsorbent were positively charged at a lower pH, thereby applying additional electrostatic repulsion along with the Cd2+ and Pb2+’s positive charges, and thus preventing the attachment of the adsorbent to the adsorbate [56]. The results of this study found that metal capacity was able to increase significantly when the pH values were increased in the range of 4.0–6.0. ZnO-NPs were found to act as a good adsorbent of Cd2+ and Pb2+. The maximum qe values at pH 6.0 detected for Cd2+ and Pb2+ were 15.32 and 22.29 mg/g, with removal efficiencies of 61.29 and 89.18%, respectively. This means there was a higher zinc oxide selectivity for Pb2+ compared to Cd2+. The low metal sorption capacity at different pH on the surface of the adsorbent indicates the strong ability of the adsorption mechanism.

3.2.2. Contact Time Effect

Contact time has a substantial effect on the rate of metal adsorption, as shown in Figure 6a, owing to the abundance of sites that are active on the adsorbed surfaces. Pb2+ adsorption was very fast during the first 5 min, and then slowed down. The results showed the greatest amount of Pb2+ adsorption (19.88 mg/g) with a removal efficiency of 79.52%. As the active spots are occupied gradually, the rate of absorption slows down as M2+ migrates from the surface layer to the micropores [57]. This slightly downward trend after 5 min is likely due to the repulsion reaction [45]. Due to electrostatic adsorption and the mixture of metals with abundant functional groups, the initial phase of Cd2+ adsorption involves the rapid binding of M2+ to the surface of the adsorbents [58,59]. With the gradual occupation of the surface-active sites, the adsorption method becomes less effective, and an equilibrium state is reached when the surface of the adsorbent is completely (100%) saturated. Regarding the investigated metal ion, maximum absorption (17.38 mg/g) was achieved at 50 min with a removal efficiency of 69.51%. No noticeable increase in the amount of adsorption (17.34 mg/g) was observed after the equilibrium time, and the metal ions started to adsorb from the adsorbent surface.

3.2.3. Effect of Adsorbent Dosage

The role of the adsorbent dose was studied by adding different amounts of ZnO-NPs in 25 mL of a Cd2+ and Pb2+ (20 mg/L) solution at room temperature, pH 6, rpm 200, and an optimum time for each metal. As revealed in Figure 6b, lead elimination efficiency was increased (72.43%) and maximum absorption (qe 18.11 mg/g) was confirmed with an increase in the ZnO-NPs dose from 10–40 mg. The cadmium elimination efficiency increased from 69.27% to 85.44% with an increasing dose from 10 to 160 mg, which may be due to the increase in adsorption sites at the surface of the ZnO-NPs that were available for the adsorption of metal ions. However, the qe of the ZnO-NPs increased from 17.32 mg/g to 21.36 mgg−1 and decreased to 21.14 mgg−1 at 200 mg of ZnO-NPs. This behavior is common in a great deal of adsorption research and is caused by the agglomeration of the adsorbent at high doses, thus reducing the active sites present on the surfaces of the adsorbents [60].

3.2.4. The Role of Initiation Metal Ion Concentration

The study regarding the initial [M+] ions had significant effects on the absorption of Cd2+ and Pb2+, as it acted as the driving force with which to resist the transfer of mass between metal ions and the solid phase. The effect of the initial metal ion concentrations (5–100 mg/L) on the adsorption on ZnO-NPs is illustrated in Figure 6b. It can be found that the sorbent removal efficiency decreased from 85.83% to 38.69% for Cd2+, and the qe decreased from 21.46 to 9.67 mg/g. The lead removal efficiency results increased from 90.91% to 96.64% with the increase in the initial metal ion concentration at 30 mg/L, and this was followed by a decrease in the qe (23.36 mg/g to 22.73 mg/g) with the rise in the initial [Mn+]. The highest adsorption capacities of Cd2+ and Pb2+ were 21.46 mg/g and 24.16 mg/g, respectively. However, the lower removal efficiency with an increasing concentration of primary metal ions may be attributed to a relatively limited number of adsorption active sites compared to the increase in metal ions. This shows that the increase in the initial [Mn+] acts as the driving force at the interface of both liquid and solid phases, as it works to increase the adsorption capacity to achieve the saturation of the adsorption sites [61].

3.2.5. Impact of Temperature

As shown in Figure 7, the same trend was seen with respect to the change in adsorption capacity. The adsorption capacity started at 0.62214 and 10.53 mg/g for Cd2+ and Pb2+ at 283 K, respectively. The impact of temperature on the absorption properties of the [Mn+] was studied over the temperature range of 283, 293, 303, 313, 32, and 333 K. Figure 6 shows the change in adsorption capacity (qe) for Cd2+ and Pb2+ and it is noted that these ions have the same behavior. The rise in the adsorption process was detected with an increasing temperature as the adsorbed amount reached 10.60 mgg−1 and 0.6825 mgg−1 at 333 k for Cd2+ and Pb2+, respectively. This may be because the increase in heat caused the internal bonds to collapse on the surfaces of the adsorbent material, which resulted in an increase in the number of active spots for the adsorption process; therefore, the degree of adsorption increased with temperature [62].

3.2.6. The Influence of Competing Ions

The metal adsorption capacity is greatly diminished when ions in the solution compete for the sorbent’s active sites. Under the present optimal experimental circumstances of Cd2+ and Pb2+ as significant coexisting ions in seawater, the sorbents’ capacity to adsorb K+, Na+, Ca2+, and Mg2+ was evaluated (Table 3). The adsorption ability of ZnO-NPs was drastically reduced in the presence of the indicated interfering ions. These results suggest that the solvation layers, effective nuclear charge, and ionic size all play a role in regulating the competitive mechanism of adsorption. This activity might also be affected by factors such as the type of surface loading and the existence of binding sites on the manufactured sorbents [63].

3.3. Adsorption Isotherm Models

These models were utilized to determine the heterogeneous and homogeneous properties of the experimental data. The experimental adsorption data were described using isothermal analysis, and optimal results were achieved when the correlation coefficients (R2) were near 1 (Table 4). High values of R2 suggest that the experimental results were in conformity with the isotherm model. The Langmuir adsorption isotherm quantitatively depicts the creation of a monolayer adsorbate on the outside surface of the adsorbent [31,64], after which there is no further adsorption [65]. Langmuir’s isotherm is applicable to monolayer adsorption on a surface with a limited number of comparable sites. This model implies that adsorption forces are comparable to chemical interaction forces, that adsorption energies are homogeneous over the surface, and that there is no trans-migration of adsorbate in the surface plane. There can be no additional adsorption when a molecule has taken up residence at a certain location. All the sites are equally attracted to the adsorbate; hence, the adsorption is characterized as homogeneous, and the ion exchange energies are uniform [66].
As shown in Figure 8a, there is a plot of 1/qe vs. 1/Ce, which enables the determination of the constants of Langmuir from the intercept and slope of the linear chart. The Freundlich isotherm provides an expression for the surface exponential distribution and heterogeneity of the energetically active spots. Figure 8a shows a plot of lnqe vs. lnCe; the Freundlich isotherm model is best fitted by Pb2+ and Cd2+ ions, with square regression values of 0.926 and 0.948, respectively. The intercept value (kf) suggests that Pb2+ ions have a greater propensity for adsorption than Cd2+ ions. As its value approaches zero, the slope (1/nf) is recognized as a measure of the intensity of adsorption or the heterogeneity of the surface and becomes more heterogeneous. However, a value below one indicates a chemisorption process, and 1/nf greater than one indicates cooperative adsorption [67]. As expected from Freundlich, the adsorption mechanism of our data was mostly heterogeneous and cooperative with 1/nf > 1 (Table 4).
Using a plot of qe vs. lnCe (Figure 8b), the Tempkin isotherm constants AT and BT were evaluated and are recorded in Table 4. The obtained data indicate that squares of regression (R2) of 0.913 and 0.939 are good matches for Pb2+ and Cd2+ ion adsorption, respectively. The Dubinin–Radushkevich model was utilized to better explain the physical and chemical properties of the adsorption process of Cd2+ and Pb2+ ions from the solution (Figure 8b). This method was used to distinguish between the chemical and physical adsorption of metal ions with average free energy, as well as to determine the typical adsorption porosity and the apparent adsorption energy. For Pb2+ and Cd2+, the apparent adsorption energies of activation were 21.169 and 15.011 kJ mol−1, respectively (Table 4). These relatively low Ea estimates indicate that the process of adsorption was mostly physisorption, which typically has an Ea between 5 and 40 kJ mol−1, while chemisorption has activation energies between 40 and 800 kJ. mol−1 [68]. Therefore, it is possible to attribute the affinity of ZnO-NPs for metal ions to Van der Waals forces and electrostatic attraction among the surface of the adsorbent and the metal ions. Estimates of the low activation energy (42 kJ/mol) further indicate that the process is regulated by diffusion rather than chemistry [69].
Fitting adsorption results were arranged according to R2 values as follows: D R > Langmuir > Freundlich > Tempkin for Pb2+; for Cd2+, the results were arranged accordingly: Langmuir > Freundlich > Temkin > D—R model (Table 4).

3.4. Adsorption Kinetics Models

It was necessary to assess the adsorption kinetics of the designated nanoparticles. Accordingly, the short interaction time, high qe, and fast absorption are the most important factors that determine the sorbents’ adsorption efficiency. Based on the kinetic studies, it was discovered that the optimum shaking time for the elimination of Pb2+ was 5 min and for Cd2+ it was 50 min, with a respective elimination efficiency of over 79.52 and 69.51 percent. With the use of the Lagrange equation, we modelled the M2+ adsorption kinetics as a pseudo-second-order or pseudo-first-order kinetics process, as shown in Equations (3) and (4), respectively [27,70,71], where k2 (g.mg−1.min−1) characterizes the rate constant for the pseudo-second-order model, k1 (min−1) represents the constant rate for the pseudo-first-order templet, qt represents the adsorbate concentration at time t, and qe represents the adsorbate concentration at the equilibrium. The value of qe predicted by the pseudo-first-order equation (Table 5) differed substantially from the measured value. Thus, the degree of M2+ adsorption on the ZnO-NPs resulted in a clear rejection of this theory.
However, a linear connection with a high R2 was found when the pseudo-second-order rate model was used (Figure 9). Based on the data, it was determined that the qe value predicted by the pseudo-second-order equation was quite close to the true qe value (Table 5). These results verified that the adsorption procedure followed the predictions of the pseudo-second-order kinetic template.

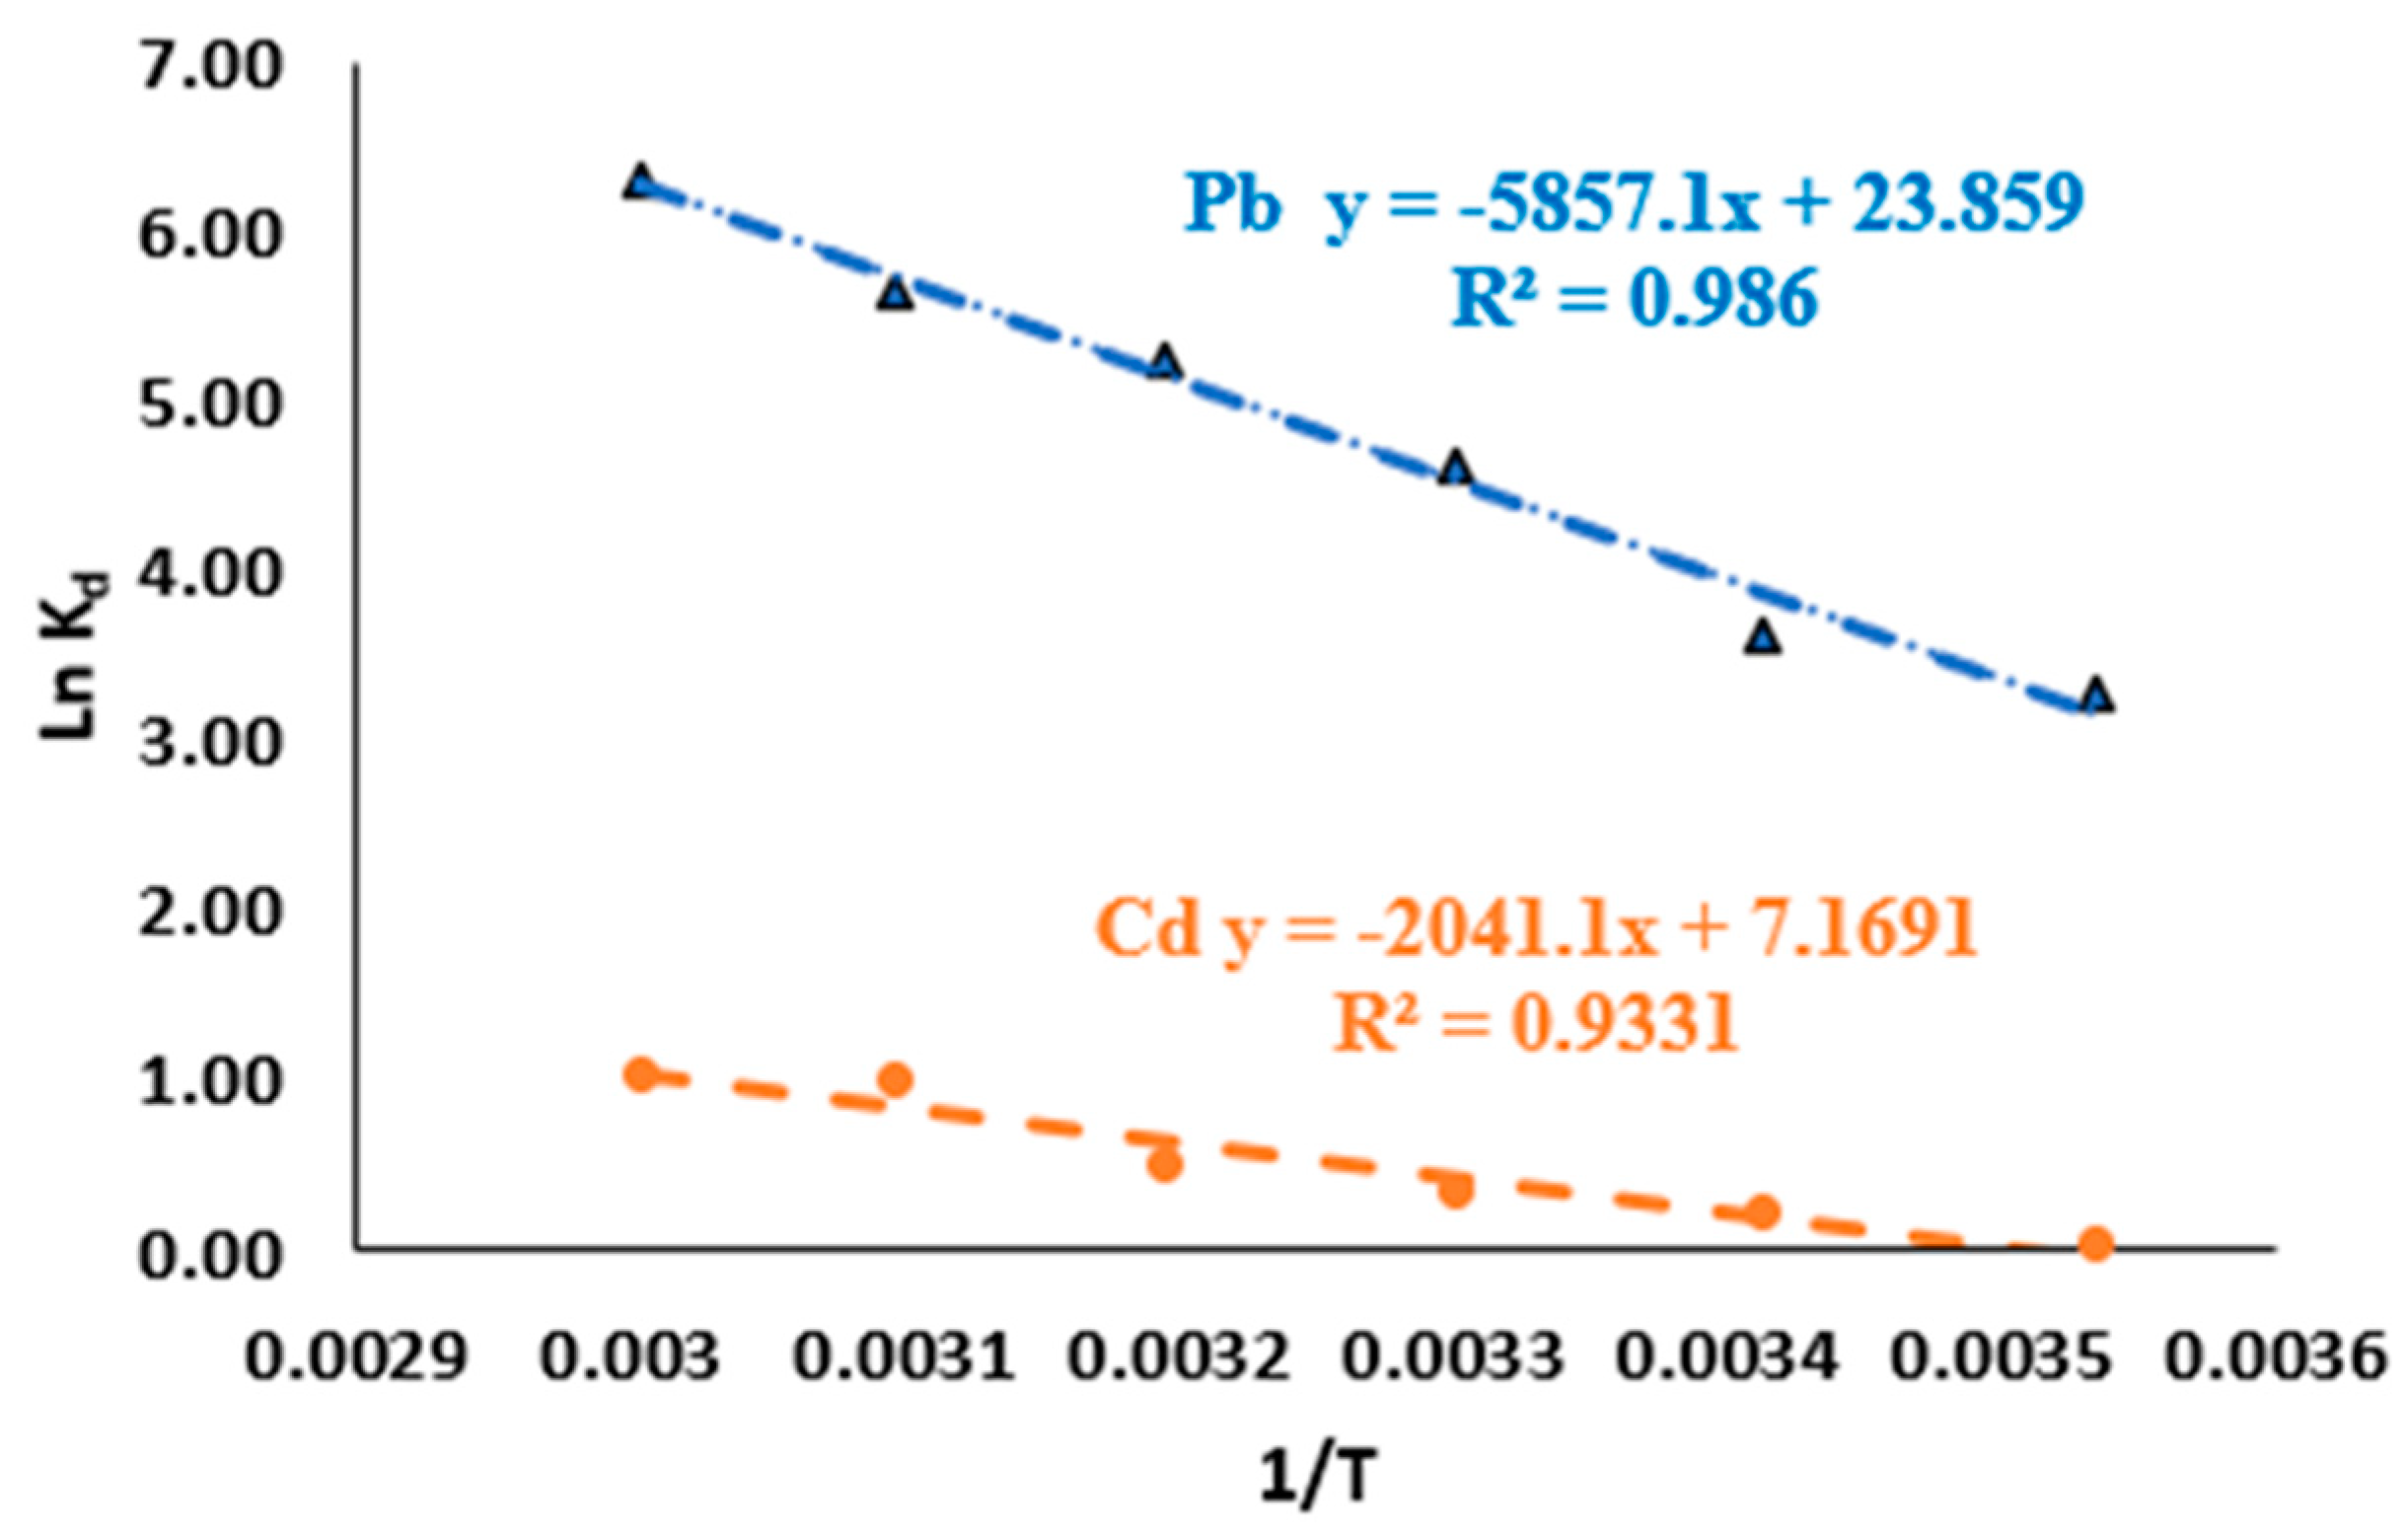
3.5. Adsorption Thermodynamic Parameter Studies

Thermodynamic parameters such as free energy (ΔG°), entropy (ΔS°), and enthalpy (ΔH°) can be estimated by studying different temperatures [72]. The control of temperature over the metal ion adsorption of the adsorbent was determined at 283, 293, 303, 313, 323, and 333 Kelvin. To achieve this, Van ’t Hoff equations (Equations (9)–(11)) were applied. From these equations, the distribution thermodynamic coefficient Kd for absorption was calculated, and the values of ΔG°, ΔH°, and ΔS° were determined from the intercept and slope of the ln Kd drawn against 1/T (Figure 10).
Table 6 shows the thermodynamic parameters with respect to Pb2+ and Cd2+’s adsorption onto the composite ZnO-NPs. The ΔH° and ΔS° parameters were evaluated from the slope and intercept of the plot of lnKd vs. 1/T using Equations (10) and (11) [ ( Δ G ο = R T L n K d ) and ( L n K d = Δ S ο R Δ H ο R T )].
Figure 10 shows a straight line (R2 = 0.986 for Pb2+ and 0.933 for Cd2+) with a slope of −5857.1 and −2041.1 kJ/mol, while the intercept was 23.859 and 7.1691 kJ/mol for Pb2+ and Cd2+, respectively. The ΔG° was calculated using the equations in Figure 8. The spontaneity of the adsorption reactions on the surface of the ZnO-NPs was confirmed by the large negative value of ΔG°, demonstrating that Pb2+ and Cd2+ sorption was spontaneous and feasible (Table 6). The values of ΔG° were negative along the temperatures, indicating the spontaneity of the adsorption process and the occurrence of physical adsorption rather than chemical adsorption [73].
The negative values of the ΔG° of the adsorption system confirmed the viability of the process and its spontaneity with respect to carrying out adsorption. The reduction in the value of ΔG0 (free energy) with the increasing temperature showed that the adsorption process is endothermic. This indicates that the spontaneity of the adsorption method decreases at low temperatures. Hence, the process is best carried out at a higher temperature. The positive enthalpy value demonstrated that the adsorption process was endothermic with respect to the adsorption of metal ions onto ZnO-NPs, as previously reported in relation to the effect of temperature. Moreover, the positive charge of ΔS° indicated increased degrees of freedom at the liquid–solid interface during adsorption, and this interface occurred at 198 kJ/mol for Pb2+ and 59.6 kJ/mol for Cd2+.

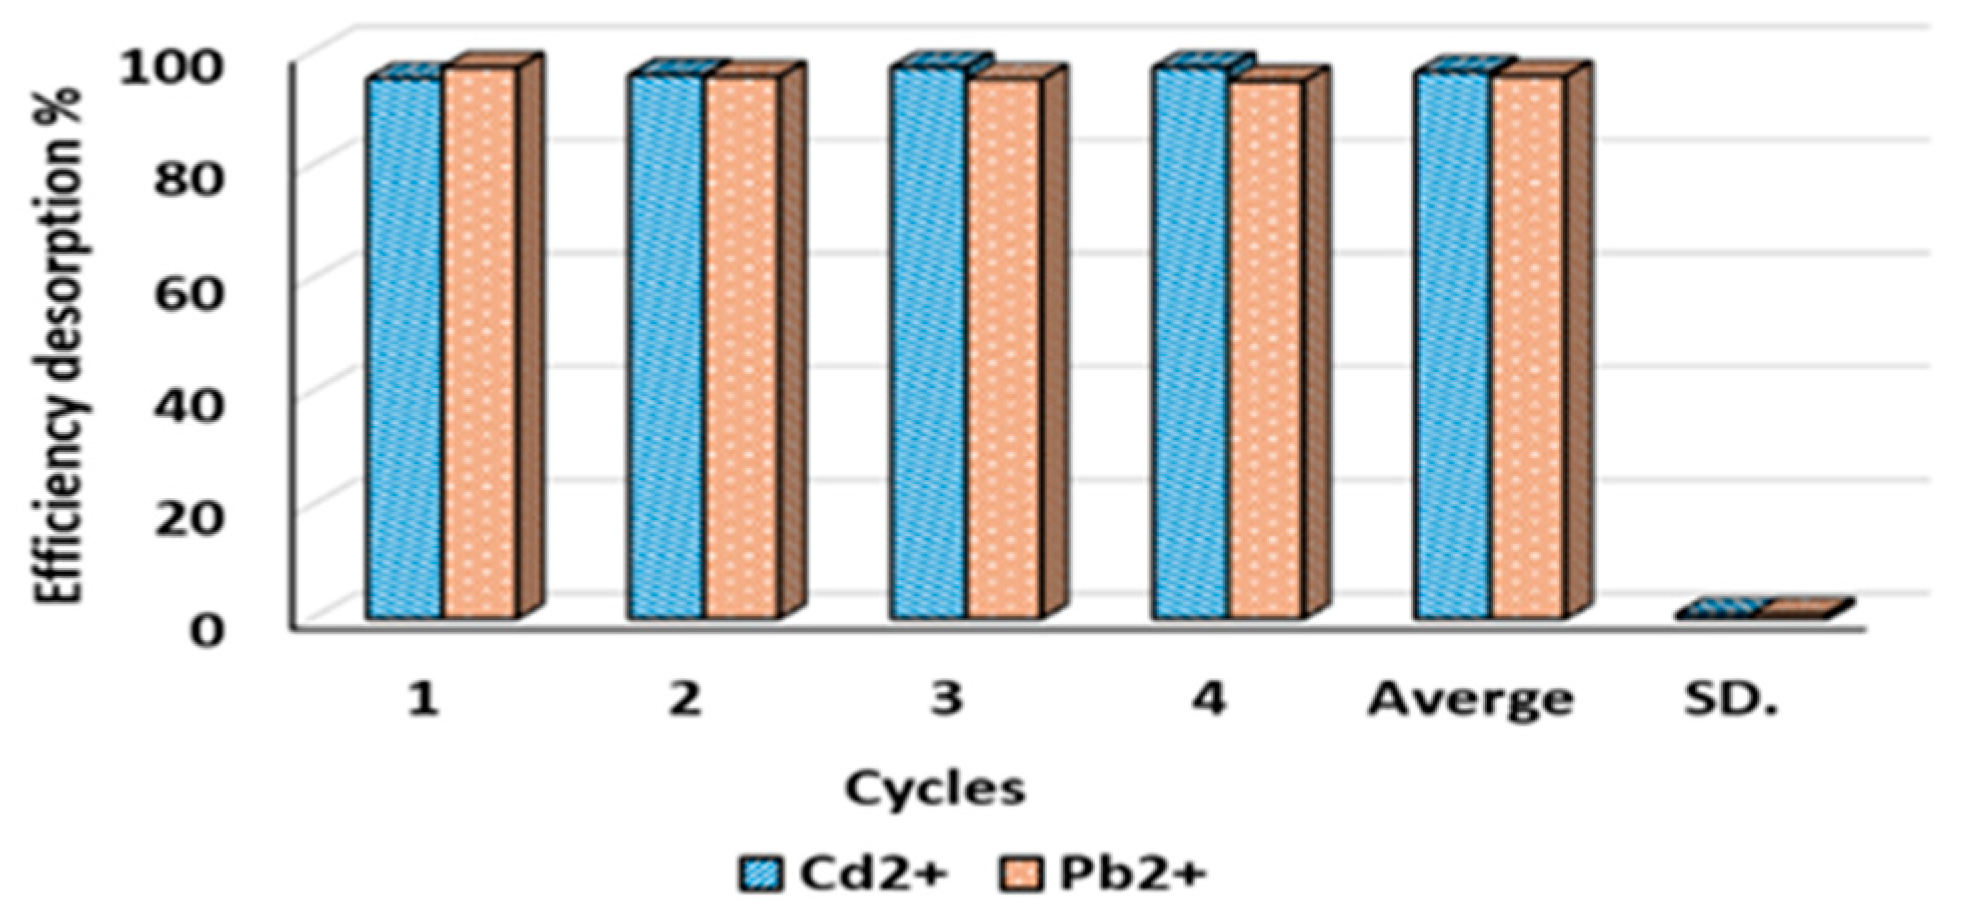
3.6. Analysis of Desorption

Research into desorption is necessary for a synthetic understanding of the adsorbent’s recycling compatibility, which is essential for the adsorbent’s economic viability. Figure 11 shows the high desorption efficiency (>95%) of the ZnO-NPs towards the investigated metals throughout the course of four desorption cycles. According to the data, the effectiveness of desorption in terms of percentages varied from 95.3% to 97.3% (average 96.3%; standard deviation 0.86%) for Cd2+, and from 94.9 to 97.3% (average 95.8%; SD 0.93) for Pb2+. By recycling the generated ZnO-NPs, it has been shown that this method has a high capacity for removing lead and cadmium ions from aqueous solutions.

3.7. Application of Green-Synthesized Adsorbents to Removal of Cd2+ and Pb2+ from Real Water Samples

Water samples were taken directly from ground water, consisting of fresh water, and Red Sea water (seawater). The samples were collected from water with different salinities to study the adsorption behavior and the matrix-related influence on the adsorption process. The physicochemical parameters (OOM, salinity, and pH), major interfering cations (Na+, K+, Mg2+, and Ca2+), and nutrient salts of the water samples were examined (Table 7). The results showed spatial variations in the studied variables. The pH value of the water samples ranged between 7.5 and 8.5. The water salinity was between 8.25 and 38.55‰. OOM is an important factor for the assessment of pollution status. The value of OOM observed in the Red Sea water was low (1.85 mg O2/L) and increased to 2.96 mg O2/L in the ground water. Major interfering ions—Na+, K+, Mg2+, and Ca2+, and SO42−—were studied in the different water salinities. The concentrations of these ions were 1208, 535, 114,245, and 0.220 mgL−1 in the ground water, while they were 10,334, 287, 650, 2452, and 2.047 mgL−1 in the Red Sea water, respectively. As shown in Table 7, low levels of nutrient concentrations were recorded in the ground water; the data (in µM) were 3.52, 0.13, 0.23, and 2.14 for NO3, NO2, PO4, and SiO4, respectively.
The applicability of the ZnO-NP sorbents in Red Sea water and ground water was studied using a multistage micro-column technique for the removal of Cd2+ and Pb2+. We measured 1 L water samples to determine the initial metal ion concentration and that spiked with 5 and 10 µg/L for Cd2+ and Pb2+, respectively. The spiked water was passed through a glass micro-column packed with 100 mg of ZnO-NPs sorbents three times under a fixed flow rate (5 mL/min). The efficiency of the studied sorbent with respect to removing metal ions is reported in Table 8. The removal efficiency of the Cd2+ ions corresponded to ground water (89.63–91.93%) > Red Sea water (84.80–86.23%) based on three replicates using the multi-stage micro-column system. The removal efficiency of Pb2+ was high and ranged from 91.87 to 93.51% in the ground water and 89.21 to 90.54% in the Red Sea water, implying that the interfering ions in these samples influenced the adsorption. The lower elimination percentage of Cd2+ and Pb2+ may be due to different impurities and a high concentration of major constituents (Table 7). These ions can block the adsorption sites on the sorbents and, consequently, decrease the metal ion uptake [74]. This indicates the competitive mechanism of adsorption on the active binding spots that is affected by the ionic size, effective nuclear charge, and solubility layers of the ions in the medium.
It was clearly observed that there was a slight variation in the Pb2+ removal efficiency of the composite ZnO-NPs in varied water salinities. It must be emphasized that the selectivity of adsorption between the areas of study is challenging for numerous reasons, such as the differences in salinity, the extent of organic matter that may form complexes with heavy metals, pH, the interfering ions [M2+], the surface area, and the presence of other pollutants [54]. Remarkably, the high-percentage elimination of Cd2+ and Pb2+ in most of the real water samples by the three synthesized sorbents in the current study shows that ZnO-NPs are suitable sorbents for the elimination of metal ions from the aquatic environment.

4. Discussion

Nanotechnology is an exciting and potentially fruitful area of study, particularly for the treatment of wastewater effluents. Nanoparticles that are produced in an environmentally friendly manner by making use of algal resources have the potential to be of significant assistance in the treatment of wastewater generated by or related to industrial effluent. This is because NPs have a high level of reactivity, a massive surface area, and robust mechanical properties [75]. The first color shifts of Avicenna marina, which were noticed during the production of the nanoparticles, were reported to be a transition from brown to light yellow. In addition to the different treatments, physicochemical factors such as salinity, pH, SO42−, and OOM; the most important interfering cations (Na+, K+, Mg2+, and Ca2+); and nutritional salts were investigated.
According to the findings of the investigators, the nitrogen component of the treated water caused a significant reduction in the capacity of the adsorbent. It is possible that the presence of a number of different contaminants as well as a high concentration of key elements are to blame for the decreased clearance rate of Cd2+ and Pb2+ (Table 7). These ions may block the adsorption sites on the sorbents, which would result in a decreased level of metal ion uptake [74]. This illustrates that factors such as the ionic size, the solubility layers, and the effective nuclear charge of the ions in the medium all have an impact on the competitive process of adsorption on the active binding sites.
It has been discovered that the salinity of water has a substantial impact on the degree to which ZnO-NPs are successful in removing Pb2+ from the water. It must be emphasized that the selectivity of adsorption between the study areas poses difficulties for a variety of reasons. Some of these reasons include differences in salinity, the amount of organic matter that can form complexes with heavy metals, pH, the interfering ions [Mn+], the surface area, and the presence of other pollutants [54]. The very high percentage of Cd2+ and Pb2+ removal from the real water samples used in this study by the three produced sorbents suggests that ZnO-NPs are appropriate sorbents for the elimination of charged metals from aquatic environments. Three chemical interactions that take place on the surface of the adsorbents provide a measure of the adsorption process’s overall efficiency. The initial concentration of the material that must be adsorbed, the pH of the medium, the temperature, the length of stirring (also known as contact time), and the amount of adsorbent used are the primary factors that influence adsorption. Concerning the adsorption of heavy metals, absorbents such as zinc oxide nanoparticles (ZnO-NPs) have been researched because of their ability to preferentially interact with cadmium and lead ions. In batch studies, ZnO-NPs displayed a very high affinity for Pb2+, with an ideal pH range of 6 and a very short contact time of 5 min. This was the case despite the fact that the optimal pH range was somewhat narrow.
Cadmium (Cd2+) is another significant heavy metal that must be removed from wastewater using the adsorption process. The initial pH controls the deprotonation of the adsorbents, which promotes greater adsorption in an appropriate pH range by lowering the repulsion of metal cations. Initial pH is a driving factor for effective adsorption because the initial pH influences the deprotonation of the adsorbents (i.e., electrostatic interactions). This process is based not only on electrostatic contact but also on metal coordination and complexation. These mechanisms interact with one another and offer synergistic effects, which lead to higher adsorption and, ultimately, increased removal efficiency. pH has a significant influence on metal coordination and, more specifically, complexation. Additionally, pH has an impact on the precipitation of metals.
The adsorption of Pb2+ was very rapid at first but eventually slowed down. This is because the rate of absorption slows down when M2+ migrates from the surface layer to the micropores [57]. As the active spots are occupied progressively, the rate of absorption also slows down. After five minutes, there is a minuscule decreasing trend that almost certainly can be attributed to the repulsion response [45]. The early phase of Cd2+ adsorption includes the quick binding of M2+ to the surface of the adsorbents [58,59]. This is because electrostatic adsorption and the combination of metals with numerous functional groups are both factors in this phase. The adsorption process gradually loses its efficiency as more surface-active sites are occupied, and equilibrium is said to be attained when the surface of the adsorbent is totally (one hundred percent) saturated with the solute being absorbed.
It is possible that the growth in the number of adsorption spots at the surface of the biosynthesized ZnO nanoparticles that were accessible for the adsorption of metal ions was responsible for the rise in the efficiency with which cadmium was removed when the dosage of ZnO nanoparticles was increased. However, the qe of Pb-ZnO-NPs rose and then declined. This may be because the adsorbent agglomerated at high dosages, thus lowering the number of active spots that were present on the surfaces of the adsorbents [60].
The reduced removal effectiveness that occurs in response to an increase in the concentration of primary metal ions may be explained by a comparatively low number of adsorption active sites in comparison to the increase in the number of metal ions. This demonstrates that an increase in the initial [Mn+] functions as the driving force at the interface between the liquid and the solid phase. This increase produces an effect by working to enhance the adsorption capacity in order to approach the saturation of the adsorption sites [61].
The change in adsorption capacity (qe) for Cd2+ and Pb2+ is shown by the influence of temperature on the bioremediation potential of the ZnO nanoparticles towards Cd2+ and Pb2+. It should be emphasized that these ions behave in the same way. This may be because the increase in heat causes the internal bonds to collapse on the surfaces of the adsorbent material, which, in turn, results in an increase in the number of active sites for the adsorption process; hence, the degree of adsorption increases with temperature [62].
It is possible that this study may influence future trials. The findings of this study show that eco-friendly materials are capable of purifying water by eliminating hazardous heavy metals. Synthesized nanoparticles are employed to improve the adsorption capabilities of other materials due to their high adsorption capacity, selectivity, and quick elimination kinetics with respect to heavy metals in polluted water.
The adsorption capacity of adsorbents and their suitability for adsorption in a batch system may be calculated using the parameters of isotherm models [76]. The Langmuir isotherm provides the best explanation for the adsorption of metal ions (Cd2+ and Pb2+) utilizing ZnO-NPs. This indicates that the adsorbent, ZnO-NPs, forms a monolayer once metal ions are uniformly dispersed on their surfaces. The maximum monolayer adsorption capabilities (qmax) of ZnO-NPs with respect to removing lead and cadmium ions from aqueous solutions investigated in previous research are shown in Table 9. Earlier studies served as the basis for this comparison. When comparing the qmax values from different studies, we can see that the values reported for Cd2+ and Pb2+ ions are rather low [77,78,79,80,81,82,83]. When the NPs were reduced and stabilized using mangrove leaf extract at a pH of 6, the adsorption capacities were 7.66 mg/g for Cd2+ and 2.02 mg/g for Pb2+, respectively.

5. Conclusions

The present study demonstrates a green approach to successfully synthesize ZnO-NPs from mangrove leaf extract. It is used to remove metal ions (Cd2 + and Pb2 +) from an aqueous solution, which is important in its use against abundant pollutants. It is economical, environmentally friendly, and suitable for metal ions treatment. In this work, ZnO-NPs demonstrated strong UV absorption at 370 nm, whereas earlier research into their production indicated a local absorption peak between 355 and 380 nm. The generated crystals’ peaks are wide in size, ranging from 23.7 to 39.2 nm with an average of 29.1 nm, according to X-ray diffraction data. The ZnO-NPs’ adsorption of Cd2+ and Pb2+ was investigated. The synthesis of such ZnO-NPs with high adsorption capacity and regeneration efficiency (> 95%) is important for achieving large-scale adsorption. At pH 6.0 and 20 °C, Cd2+ and Pb2+ had maximum adsorption capacities of 15.32 and 22.29 mg/g, respectively, with removal efficiencies of 61.29 and 89.18%. From the data, Pb2+ has a greater capacity for ZnO-NPs selectivity than Cd2+. Our kinetic investigations showed that the best contact time with respect to the removal of Pb2+ was 5 min and was 50 min for Cd2+, with removal efficiencies of over 79.52 and 69.51%, respectively. The pseudo-second order model worked best with these adsorbents in the kinetic experiments. The adsorption data of the isothermal study showed good correlations with the Langmuir isothermal model (R2 = 0.953 and 0.941) for Cd2+ and Pb2+, respectively. The best fit of the Freundlich isotherm model was Cd2+ (R2 = 0.9477), and the Tempkin isotherm model was a good fit for the adsorption of Pb2+ ions (R2 = 0.902). The Dubinin–Radushkevich isothermal model showed that the adsorption process had low activation energy (21,169 and 15,011 kJ mol−1 for Pb2+ and Cd2+, respectively) and indicated that the adsorption process predominantly occurred via physisorption. The fit adsorption results were arranged according to the R2 values as follows: D R > Langmuir > Freundlich > Tempkin for Pb2+; for Cd2+, they were arranged accordingly: Langmuir > Freundlich > Temkin > D—R model.

Funding

This research work was funded by Institutional Fund Projects under grant no. (IFPIP:219-155-1443). The authors gratefully acknowledge technical and financial support provided by the Ministry of Education and King Abdelaziz University, DSR, Jeddah, Saudi Arabia.

Institutional Review Board Statement

Not applicable.

Informed Consent Statement

Not applicable.

Data Availability Statement

Available on request.

Conflicts of Interest

The author declares no conflict of interest.

References

  1. Shafiee, M.; Foroutan, R.; Fouladi, K.; Ahmadlouydarab, M.; Ramavandi, B.; Sahebi, S. Application of oak powder/Fe3O4 magnetic composite in toxic metals removal from aqueous solutions. Adv. Powder Technol. 2019, 30, 544–554. [Google Scholar] [CrossRef]
  2. Thomson, K.K.; Rahman, A.; Cooper, T.J.; Sarkar, A. Exploring relevance, public perceptions, and business models for establishment of private well water quality monitoring service. Int. J. Health Plan. Manag. 2019, 34, 1098–1118. [Google Scholar] [CrossRef] [PubMed]
  3. Fontana, K.B.; Chaves, E.S.; Kosera, V.S.; Lenzi, G.G. Barium removal by photocatalytic process: An alternative for water treatment. J. Water Process Eng. 2018, 22, 163–171. [Google Scholar] [CrossRef]
  4. Abdulkhair, B.; Salih, M.; Modwi, A.; Adam, F.; Elamin, N.; Seydou, M.; Rahali, S. Adsorption behavior of barium ions onto ZnO surfaces: Experiments associated with DFT calculations. J. Mol. Struct. 2021, 1223, 128991. [Google Scholar] [CrossRef]
  5. Wang, Y.; Li, L.; Luo, C.; Wang, X.; Duan, H. Removal of Pb2+ from water environment using a novel magnetic chitosan/graphene oxide imprinted Pb2+. Int. J. Biol. Macromol. 2016, 86, 505–511. [Google Scholar] [CrossRef]
  6. Palani, G.; Arputhalatha, A.; Kannan, K.; Lakkaboyana, S.K.; Hanafiah, M.M.; Kumar, V.; Marella, R.K. Current trends in the application of nanomaterials for the removal of pollutants from industrial wastewater treatment—A review. Molecules 2021, 26, 2799. [Google Scholar] [CrossRef]
  7. Qasem, N.A.; Mohammed, R.H.; Lawal, D.U. Removal of heavy metal ions from wastewater: A comprehensive and critical review. npj Clean Water 2021, 4, 36. [Google Scholar] [CrossRef]
  8. Schneider, A.; Herlevi, L.M.; Guo, Y.; Fernandez Lahore, H.M. Perspectives on adsorption technology as an effective strategy for continuous downstream bioprocessing. J. Chem. Technol. Biotechnol. 2022, 97, 2305–2316. [Google Scholar] [CrossRef]
  9. El-Enein, S.A.; Okbah, M.A.; Hussain, S.G.; Soliman, N.F.; Ghounam, H.H. Adsorption of selected metals ions in solution using nano-bentonite particles: Isotherms and kinetics. Environ. Process. 2020, 7, 463–477. [Google Scholar] [CrossRef]
  10. Saleem, J.; Shahid, U.B.; Hijab, M.; Mackey, H.; McKay, G. Production and applications of activated carbons as adsorbents from olive stones. Biomass Convers. Biorefin. 2019, 9, 775–802. [Google Scholar] [CrossRef] [Green Version]
  11. Tan, W.K.; Muto, H.; Kawamura, G.; Lockman, Z.; Matsuda, A. Nanomaterial fabrication through the modification of sol–gel derived coatings. Nanomaterials 2021, 11, 181. [Google Scholar] [CrossRef] [PubMed]
  12. Shaba, E.Y.; Jacob, J.O.; Tijani, J.O.; Suleiman, M.A. A critical review of synthesis parameters affecting the properties of zinc oxide nanoparticle and its application in wastewater treatment. Appl. Water Sci. 2021, 11, 48. [Google Scholar] [CrossRef]
  13. Qu, J.; Yuan, X.; Wang, X.; Shao, P. Zinc accumulation and synthesis of ZnO nanoparticles using Physalis alkekengi L. Environ. Pollut. 2011, 159, 1783–1788. [Google Scholar] [CrossRef] [PubMed]
  14. Sundrarajan, M.; Ambika, S.; Bharathi, K. Plant-extract mediated synthesis of ZnO nanoparticles using Pongamia pinnata and their activity against pathogenic bacteria. Adv. Powder Technol. 2015, 26, 1294–1299. [Google Scholar] [CrossRef]
  15. Suresh, D.; Nethravathi, P.C.; Rajanaika, H.; Nagabhushana, H.; Sharma, S.C. Green synthesis of multifunctional zinc oxide (ZnO) nanoparticles using Cassia fistula plant extract and their photodegradative, antioxidant and antibacterial activities. Mater. Sci. Semicond. Process. 2015, 31, 446–454. [Google Scholar] [CrossRef]
  16. Angelin, K.B.; Siva, S.; Kannan, R.S. Zinc oxide nanoparticles impregnated polymer hybrids for efficient extraction of heavy metals from polluted aqueous solution. Asian J. Sci. Technol. 2015, 6, 2139–2150. [Google Scholar]
  17. Kamath, S.; Ramanjaneyalu, V.G.; Kamila, S. Application of ZnO nano rods for the batch adsorption of Cr (VI): A study of kinetics and isotherms. Am. J. Appl. Sci. 2019, 16, 101–112. [Google Scholar] [CrossRef] [Green Version]
  18. Xu, Y.; Hu, J.; Zhang, X.; Yuan, D.; Duan, G.; Li, Y. Robust and multifunctional natural polyphenolic composites for water remediation. Mater. Horiz. 2022, 9, 2496. [Google Scholar] [CrossRef]
  19. Wang, J.; Sun, Y.; Zhao, X.; Chen, L.; Peng, S.; Ma, C.; Duan, G.; Liu, Z.; Wang, H.; Yuan, Y.; et al. A poly(amidoxime)-modified MOF macroporous membrane for high-efficient uranium extraction from seawater. e-Polymers 2022, 22, 399–410. [Google Scholar] [CrossRef]
  20. Saad, E.M.; Elshaarawy, R.F.; Mahmoud, S.A.; El-Moselhy, K.M. New Ulva lactuca Algae Based Chitosan Bio-composites for Bioremediation of Cd(II) Ions. J. Bioresour. Bioprod. 2021, 6, 223–242. [Google Scholar] [CrossRef]
  21. Khana, M.M.; Saadaha, N.H.; Khanb, M.E.; Harunsania, M.H.; Tana, A.L.; Cho, M.H. Potentials of Costus woodsonii leaf extract in producing narrow band gap ZnO Nanoparticles. Mater. Sci. Semicond. Process. 2019, 91, 194–200. [Google Scholar] [CrossRef]
  22. Azimpanah, R.; Solati, Z.; Hashemi, M. Synthesis of ZnO Nanoparticles with Antibacterial Properties Using Terminalia catappa Leaf Extract. Chem. Eng. Technol. 2022, 45, 658–666. [Google Scholar] [CrossRef]
  23. Zare, M.; Namratha, K.; Thakur, M.S.; Byrappa, K. Biocompatibility assessment and photocatalytic activity of bio-hydrothermal synthesis of ZnO nanoparticles by Thymus vulgaris leaf extract. Mater. Res. Bull. 2019, 109, 49–59. [Google Scholar] [CrossRef]
  24. Thatoi, P.; Kerry, R.G.; Gouda, S.; Das, G.; Pramanik, K.; Thatoi, H.; Patra, J.K. Photo-mediated green synthesis of silver and zinc oxide nanoparticles using aqueous extracts of two mangrove plant species, Heritiera fomes and Sonneratia apetala and investigation of their biomedical applications. J. Photochem. Photobiol. B Biol. 2016, 163, 311–318. [Google Scholar] [CrossRef] [PubMed]
  25. Sagar, R.D.P.; Thorat, R. Green synthesis of zinc oxide (ZnO) nanoparticles using ocimum tenuiflorum leaves. Int. J. Sci. Res. 2015, 4, 1225–1228. [Google Scholar]
  26. Edokpayi, O.; Osemwenkhae, O.; Ayodele, B.V.; Ossai, J.; Fadilat, S.A.; Ogbeide, S.E. Batch adsorption study of methylene blue in aqueous solution using activated carbons from rice husk and coconut shell. J. Appl. Sci. Environ. Manag. 2018, 22, 631–635. [Google Scholar] [CrossRef]
  27. Ho, Y.S.; McKay, G. Pseudo-second order model for sorption processes. Process Biochem. 1999, 34, 451–465. [Google Scholar] [CrossRef]
  28. Jasper, E.E.; Ajibola, V.O.; Onwuka, J.C. Nonlinear regression analysis of the sorption of crystal violet and methylene blue from aqueous solutions onto an agro-waste derived activated carbon. Appl. Water Sci. 2020, 10, 132. [Google Scholar] [CrossRef]
  29. Marczewski, A.W.; Seczkowska, M.; Deryło-Marczewska, A.; Blachnio, M. Adsorption equilibrium and kinetics of selected phenoxyacid pesticides on activated carbon: Effect of temperature. Adsorption 2016, 22, 777–790. [Google Scholar] [CrossRef] [Green Version]
  30. Ahmad, N.H.; Mohamed, M.A.; Yusoff, S.F. Improved adsorption performance of rubber-based hydrogel: Optimisation through response surface methodology, isotherm, and kinetic studies. J. Sol Gel Sci. Technol. 2020, 94, 322–334. [Google Scholar] [CrossRef]
  31. Langmuir, I. The constitution and fundamental properties of solids and liquids. Part I. Solids. J. Am. Chem. Soc. 1916, 38, 2221–2295. [Google Scholar] [CrossRef] [Green Version]
  32. Jaerger, S.; Dos Santos, A.; Fernandes, A.N.; Almeida, C.A. Removal of p-nitrophenol from aqueous solution using Brazilian peat: Kinetic and thermodynamic studies. Water Air Soil Pollut. 2015, 226, 236. [Google Scholar] [CrossRef]
  33. Freundlich, H.M.F. Over the adsorption in solution. J. Phys. Chem. 1906, 57, 385–471. [Google Scholar]
  34. Tempkin, M.J.; Pyzhev, V. Kinetics of ammonia synthesis on promoted iron catalysts. Acta Physicochim. URSS 1940, 12, 217–256. [Google Scholar]
  35. Dubinin, M.M.; Radushkevich, L.V. The equation of the characteristic curve of the activated charcoal. Proc. Acad. Sci. Phys. Chem. Sect. 1947, 55, 331–337. [Google Scholar]
  36. Muhammad, W.; Ullah, N.; Haroona, M.; Abbasi, B.H. Optical, morphological, and biological analysis of zinc oxide nanoparticles (ZnO NPs) using Papaver somniferum L. RSC Adv. 2019, 9, 29541–29548. [Google Scholar] [CrossRef] [Green Version]
  37. Song, Z.; Kelf, T.A.; Sanchez, W.H.; Roberts, M.S.; Rička, J.; Frenz, M.; Zvyagin, A.V. Characterization of optical properties of ZnO nanoparticles for quantitative imaging of transdermal transport. Biomed. Opt. Express 2011, 2, 3321–3333. [Google Scholar] [CrossRef]
  38. Talam, S.; Karumuri, S.R.; Gunnam, N. Synthesis, Characterization, and Spectroscopic Properties of ZnO Nanoparticles International Scholarly Research Network. ISRN Nanotechnol. 2012, 2012, 372505. [Google Scholar] [CrossRef] [Green Version]
  39. Shamhari, N.M.; Wee, B.S.; Chin, S.F.; Kok, K.Y. Synthesis and Characterization of Zinc Oxide Nanoparticles with Small Particle Size Distribution. Acta Chim. Slov. 2018, 65, 578–585. [Google Scholar] [CrossRef]
  40. Zak, A.K.; Razali, R.; Abd Majid, W.H.; Darroudi, M. Synthesis and characterization of a narrow size distribution of zinc oxide nanoparticles. Int. J. Nanomed. 2011, 6, 1399–1403. [Google Scholar]
  41. AL-Asady, Z.M.; AL-Hamdani, A.H.; Hussein, M.A. Study the Optical and Morphology Properties of Zinc Oxide Nanoparticles. AIP Conf. Proc. 2020, 2213, 020061. [Google Scholar] [CrossRef]
  42. Akhil, K.; Khan, S.S. Effect of humic acid on the toxicity of bare and capped ZnO nanoparticles on bacteria, algal and crustacean systems. J. Photochem. Photobiol. B 2017, 167, 136–149. [Google Scholar] [CrossRef]
  43. Prasad, S.; Walck, S.; Zabinski, J. Microstructural evolution in lubricious ZnO films grown by pulsed laser deposition. Thin Solid Films 2000, 360, 107–117. [Google Scholar] [CrossRef]
  44. Yuvakkumar, R.; Suresh, J.; Hong, S.I. Green Synthesis of Zinc Oxide Nanoparticles. Adv. Mater. Res. 2014, 952, 137–140. [Google Scholar] [CrossRef]
  45. Jayarambabu, N.; Kumari, B.S.; Rao, K.V.; Prabhu, Y.T. Germination, and growth characteristics of mungbean seeds (Vigna radiata L.) affected by synthesized zinc oxide nanoparticles. Int. J. Curr. Eng. Technol. 2014, 4, 3411–3416. [Google Scholar]
  46. Kumar, V.; Kumar, S.; Kumar, D. Synthesis, and characterization of cadmium doped ZnO nanoparticles. In Recent Trends in Materials and Devices; Springer: Cham, Switzerland, 2017; pp. 211–215. [Google Scholar] [CrossRef]
  47. Sathya, M.; Pushpanathan, K. Synthesis and optical properties of Pb doped ZnO nanoparticles. Appl. Surf. Sci. 2018, 449, 346–357. [Google Scholar] [CrossRef]
  48. Ben Dassi, R.; Chamam, B.; Méricq, J.P.; Heran, M.; Faur, C.; El Mir, L.; Tizaoui, C.; Trabelsi, I. Pb doped ZnO nanoparticles for the sorption of Reactive Black 5 textile azo dye. Water Sci. Technol. 2020, 82, 2576–2591. [Google Scholar] [CrossRef]
  49. Feng, Z.; Gao, C.; Ma, X.; Zhan, J. Well-dispersed Pd nanoparticles on porous ZnO nanoplates via surface ion exchange for chlorobenzene-selective sensor. RSC Adv. 2019, 9, 42351–42359. [Google Scholar] [CrossRef] [Green Version]
  50. Tiwari, A.K.; Jha, S.; Singh, A.K.; Mishra, S.K.; Pathak, A.K.; Ojha, R.P.; Yadav, R.S.; Dikshit, A. Innovative Investigation of Zinc Oxide Nanoparticles Used in Dentistry. Crystals 2022, 12, 1063. [Google Scholar] [CrossRef]
  51. Lakshmikandhan, T. Green synthesis of zinc oxide nanoparticles using murraya koenigii (curry leaf) leaf extract. Malaya J. Mat. 2020, 2, 4309–4317. [Google Scholar] [CrossRef]
  52. Fakhar-e-Alam, M.; Rahim, S.; Atif, M.; Aziz, M.H.; Malick, M.I.; Zaidi, S.S.; Suleman, R.; Majid, A. ZnO nanoparticles as drug delivery agent for photodynamic therapy. Laser Phys. Lett. 2013, 11, 025601. [Google Scholar] [CrossRef]
  53. Król, A.; Railean-Plugaru, V.; Pomastowski, P.; Buszewski, B. Phytochemical investigation of Medicago sativa L. extract and its potential as a safe source for the synthesis of ZnO nanoparticles: The proposed mechanism of formation and antimicrobial activity. Phytochem. Lett. 2019, 31, 170–180. [Google Scholar] [CrossRef]
  54. Taha, A.A.; Shreadah, M.A.; Ahmed, A.M.; Heiba, H.F. Multi-component adsorption of Pb (II), Cd (II), and Ni (II) onto Egyptian Na-activated bentonite; equilibrium, kinetics, thermodynamics, and application for seawater desalination. J. Environ. Chem. Eng. 2016, 4, 1166–1180. [Google Scholar] [CrossRef]
  55. Awual, M.R.; Hasan, M.M. Novel conjugate adsorbent for visual detection and removal of toxic lead (II) ions from water. Microporous Mesoporous Mater. 2014, 196, 261–269. [Google Scholar] [CrossRef]
  56. Wen, Y.; Ma, J.; Chen, J.; Shen, C.; Li, H.; Liu, W. Carbonaceous sulfur-containing chitosan–Fe (III): A novel adsorbent for efficient removal of copper (II) from water. Chem. Eng. J. 2015, 259, 372–380. [Google Scholar] [CrossRef]
  57. Abdolali, A.; Ngo, H.H.; Guo, W.; Lu, S.; Chen, S.S.; Nguyen, N.C.; Zhang, X.; Wang, J.; Wu, Y. A breakthrough biosorbent in removing heavy metals: Equilibrium, kinetic, thermodynamic and mechanism analyses in a lab-scale study. Sci. Total Environ. 2016, 542, 603–611. [Google Scholar] [CrossRef]
  58. Huang, H.; Jia, Q.; Jing, W.; Dahms, H.U.; Wang, L. Screening strains for microbial biosorption technology of cadmium. Chemosphere 2020, 251, 126428. [Google Scholar] [CrossRef]
  59. Masoud, M.S.; Zidan, A.A.; El Zokm, G.M.; Elsamra, R.M.; Okbah, M.A. Humic acid and nano-zeolite NaX as low cost and eco-friendly adsorbents for removal of Pb (II) and Cd (II) from water: Characterization, kinetics, isotherms and thermodynamic studies. Biomass Convers. Biorefin. 2022. [Google Scholar] [CrossRef]
  60. Tang, C.Y.; Yu, P.; Tang, L.S.; Wang, Q.Y.; Bao, R.Y.; Liu, Z.Y.; Yang, M.B.; Yang, W. Tannic acid functionalized graphene hydrogel for organic dye adsorption. Ecotoxicol. Environ. Saf. 2018, 165, 299–306. [Google Scholar] [CrossRef]
  61. Adebowale, K.O.; Unuabonah, I.E.; Olu-Owolabi, B.I. The effect of some operating variables on the adsorption of lead and cadmium ions on kaolinite clay. J. Hazard. Mater. 2006, 134, 130–139. [Google Scholar] [CrossRef]
  62. El Nemr, A.; Khaled, A.; Abdelwahab, O.; El-Sikaily, A. Treatment of wastewater containing toxic chromium using new activated carbon developed from date palm seed. J. Hazard. Mater. 2008, 152, 263–275. [Google Scholar] [CrossRef]
  63. De Gisi, S.; Lofrano, G.; Grassi, M.; Notarnicola, M. Characteristics and adsorption capacities of low-cost sorbents for wastewater treatment: A review. Sustain. Mater. Technol. 2016, 9, 10–40. [Google Scholar] [CrossRef] [Green Version]
  64. Larous, S.; Meniai, A.H.; Lehocine, M.B. Experimental study of the removal of copper from aqueous solutions by adsorption using sawdust. Desalination 2005, 185, 483–490. [Google Scholar] [CrossRef]
  65. Allen, S.J.; Mckay, G.; Porter, J.F. Adsorption isotherm models for basic dye adsorption by peat in single and binary component systems. J. Colloid Interface Sci. 2004, 280, 322–333. [Google Scholar] [CrossRef]
  66. Kundu, S.; Gupta, A.K. Arsenic adsorption onto iron oxide-coated cement (IOCC): Regression analysis of equilibrium data with several isotherm models and their optimization. Chem. Eng. J. 2006, 122, 93–106. [Google Scholar] [CrossRef]
  67. Veli, S.; Alyüz, B. Adsorption of copper and zinc from aqueous solutions by using natural clay. J. Hazard. Mater. 2007, 149, 226–233. [Google Scholar] [CrossRef]
  68. Argun, M.E. Use of clinoptilolite for the removal of nickel ions from water: Kinetics and thermodynamics. J. Hazard. Mater. 2008, 150, 587–595. [Google Scholar] [CrossRef]
  69. Al-Ghouti, M.; Khraisheh, M.A.; Ahmad, M.N.; Allen, S. Thermodynamic behaviour and the effect of temperature on the removal of dyes from aqueous solution using modified diatomite: A kinetic study. J. Colloid Interface Sci. 2005, 287, 6–13. [Google Scholar] [CrossRef]
  70. Hu, H.; Huang, X.; Deng, C.; Chen, X.; Qian, Y. Hydrothermal synthesis of ZnO nanowires and nanobelts on a large scale. Mater. Chem. Phys. 2007, 106, 58–62. [Google Scholar] [CrossRef]
  71. Duman, O.; Ayranci, E. Adsorptive removal of cationic surfactants from aqueous solutions onto high-area activated carbon cloth monitored by in situ UV spectroscopy. J. Hazard. Mater. 2010, 174, 359–367. [Google Scholar] [CrossRef]
  72. Mueller, N.C.; Nowack, B. Nanoparticles for remediation: Solving big problems with little particles. Elements 2010, 6, 395–400. [Google Scholar] [CrossRef]
  73. Zhang, W.; Meng, L.; Mu, G.; Zhao, M.; Zou, P.; Zhang, Y. A facile strategy for fabrication of nano-ZnO/yeast composites and their adsorption mechanism towards lead (II) ions. Appl. Surf. Sci. 2016, 378, 196–206. [Google Scholar] [CrossRef]
  74. El-Gendy, M.M.; Ten, N.M.; Ibrahim, H.A.; Abd El-Baky, D.H. Heavy metals biosorption from aqueous solution by endophytic Drechslera hawaiiensis of Morus alba L. derived from heavy metals habitats. Mycobiology 2017, 45, 73–83. [Google Scholar] [CrossRef] [Green Version]
  75. Khilji, S.A.; Munir, N.; Aziz, I.; Anwar, B.; Hasnain, M.; Jakhar, A.M.; Sajid, Z.A.; Abideen, Z.; Hussain, M.I.; El-Habeeb, A.A.; et al. Application of Algal Nanotechnology for Leather Wastewater Treatment and Heavy Metal Removal Efficiency. Sustainability 2022, 14, 13940. [Google Scholar] [CrossRef]
  76. Joshi, N.; Singh, A. Adsorptive Performances and Characterizations of Biologically Synthesized Zinc Oxide Based Nano sorbent (ZOBN). Groundw. Sustain. Dev. 2020, 10, 100325. [Google Scholar] [CrossRef]
  77. Saad, A.A.; Azzam, A.M.; El-Wakeel, S.T.; Mostafa, B.B.; Abd El-latif, M.B. Removal of toxic metal ions from wastewater using ZnO@ Chitosan core shell nanocomposite. Environ. Nanotechnol. Monit. Manag. 2018, 9, 67–75. [Google Scholar] [CrossRef]
  78. Xu, M.; Zhang, Y.; Zhang, Z.; Shen, Y.; Zhao, M.; Pan, G. Study on the adsorption of Ca2+, Cd2+ and Pb2+ by magnetic Fe3O4 yeast treated with EDTA dianhydride. Chem. Eng. J. 2011, 168, 737–745. [Google Scholar] [CrossRef]
  79. Joshi, N.C.; Rawat, B.S.; Kumar, P.; Kumar, N.; Upadhyay, S.; Chetana, S.; Gururani, P.; Kimothi, S. Sustainable synthetic approach and applications of ZnO/r-GO in the adsorption of toxic Pb2+ and Cr6+ ions. Inorg. Chem. Commun. 2022, 145, 110040. [Google Scholar]
  80. Joshi, N.C. Synthesis of r-GO/PANI/ZnO based material and its application in the treatment of wastewater containing Cd2+ and Cr6+ ions. Sep. Sci. Technol. 2022. [CrossRef]
  81. Garg, R.; Garg, R.; Khan, M.; Bansal, M.; Garg, V.K. Utilization of biosynthesized silica-supported iron oxide nanocomposites for the adsorptive removal of heavy metal ions from aqueous solutions. Environ. Sci. Pollut. Res. 2022. [Google Scholar] [CrossRef]
  82. Mahmoud, A.E.D.; Al-Qahtani, K.M.; Alflaij, S.O.; Al-Qahtani, S.F.; Alsamhan, F.A. Green copper oxide nanoparticles for lead, nickel, and cadmium removal from contaminated water. Sci. Rep. 2021, 11, 12547. [Google Scholar] [CrossRef]
  83. Tatarchuk, T.; Shyichuk, A.; Sojka, Z.; Gryboś, J.; Naushad, M.; Kotsyubynsky, V.; Kowalska, M.; Kwiatkowska-Marks, S.; Danyliuk, N. Green synthesis, structure, cations distribution and bonding characteristics of superparamagnetic cobalt-zinc ferrites nanoparticles for Pb (II) adsorption and magnetic hyperthermia applications. J. Mol. Liq. 2021, 328, 115375. [Google Scholar] [CrossRef]
Figure 1. UV–visible spectra of synthesized ZnO NPs.
Water 15 00455 g001
Figure 2. ZnO nanoparticle diffraction pattern using X-ray powder spectroscopy.
Water 15 00455 g002
Figure 3. FT-IR spectrum of biosynthesized ZnO-NPs, ZnO-NPs-Pb, and ZnO-NPs-Cd using mangrove leaf extract.
Water 15 00455 g003
Figure 4. EDX profile of (A) the synthesized ZnO-NPs, (B) ZnO-NPs-Cd, and (C) ZnO-NPs-Pb.
Water 15 00455 g004
Figure 5. SEM morphology of ZnO-NPs before adsorption and after the Cd2+ and Pb2+ ions’ adsorption.
Water 15 00455 g005
Figure 6. (a) The influence of contact duration and pH on the elimination of cadmium and lead ions. (b) Effect of adsorbent dosage and initial metal ion concentration on the elimination of Cd2+ and Pb2+ ions.
Water 15 00455 g006
Figure 7. Impact of temperature on the qe.
Water 15 00455 g007
Figure 8. (a) Freundlich and Langmuir isotherm plot (b) Tempkin model and D–R plot for Cd2+ and Pb2+ adsorption on the Nano-ZnO at room temperature.
Water 15 00455 g008
Figure 9. Pseudo-Second-Order kinetics graph for adsorption of metal ions.
Water 15 00455 g009
Figure 10. The impact of temperature on of Pb2+ and Cd2+ adsorption onto ZnO-NPs.
Water 15 00455 g010
Figure 11. Recovery % of ZnO-NPs composites for Cd2+ and Pb2+ during 4 cyclic experiments (C° of 20 mg/L at pH 6.0, respectively).
Water 15 00455 g011
Table 1. Isotherm model equations.
Isotherm ModelAdsorption EquationEquationsReference
Langmuir 1 q e = 1 q m a x + ( 1 q m a x K L ) ( 1 C e ) (5)[31]
Freundlich ln q e = l n K f + 1 n f L n C e (6)[32,33]
Tempkin q e = B T l n A T + B T L n C e (7)[34]
(D–R)
Dubinin–Radushkevich
Lnq e = lnq m + 2 BRTLn ( 1 + 1 C e )   E D   = 1 2   B D (8)[35]
Table 2. Evaluation of crystal size D from XRD results.
Peak Position 2θ (°)FWHM (Radians)Miller IndicesD (nm)
31.770.26408(100)31.3
34.430.25677(002)32.4
31.260.25676(101)32.2
47.550.24595(102)35.3
56.60.34471(110)26.2
62.870.37829(103)24.6
66.390.24235(200)39.2
67.960.4037(112)23.7
69.090.38421(201)25.1
72.590.4044(004)24.4
76.980.3984(104)25.5
29.1
Table 3. Effect of competing ions on the adsorption capacity.
Interfering IonsZnO-NPs-CdZnO-NPs-Pb
% Removalqe (mgg−1)% Removalqe (mgg−1)
Blank71.600.5188.2416.55
CaCO357.700.4584.2215.79
Na2CO358.000.4581.9215.36
KCl62.100.4975.8414.22
NaCl63.920.5082.1915.41
KNO359.200.4673.5613.79
MgSO460.700.4772.6113.61
Table 4. Linear adsorption isotherm parameters for the Cd2+ and Pb2+.ion adsorption process.
Equilibrium ModelsParametersZnO-NP
Pb2+Cd2+
Langmuirqmax (mg/g)2.0167.663
KL (L/mg)9.5020.052
R20.9400.953
FreundlichKf (mg/g)5.4970.176
nf0.4130.529
1/nf2.4201.888
R20.9260.948
TempkinAt (L/g)0.8950.379
Bt31.0197.429
R20.9130.939
Dubinin–RadushkevichqD (mg/g)487.60269.152
Ea (kJ/mol)21.16915.011
BD (mg/L)0.0010.002
R20.9510.923
Table 5. Kinetic parameters calculated for Cd2+ and Pb2+ adsorption onto ZnO-NPs via different models.
MetalC° (ppm) (mg/L)qe (exp) (mg/g)Pseudo-First-Order KineticsPseudo-Second-Order Kinetics
K1qe (cal)R2K2qe (cal)R2
Cd2+50.770.0370.2150.90490.6100.6320.998
101.520.0350.0460.89862.4811.4811.000
152.320.0380.3950.81740.3172.0810.9991
203.090.0160.0420.1624.7583.0770.9997
253.860.0340.3540.87310.3063.6460.9997
304.670.0220.1720.38560.4264.5620.9993
Pb2+53.120.3100.9640.96230.1752.6690.9991
106.082.2510.9760.28550.5405.9170.9999
159.210.5880.9640.82410.0668.2780.9983
2012.060.1040.9660.91030.12411.5340.9999
2515.280.3320.9630.94450.16314.7711.0000
3018.390.2310.9650.86310.13717.9530.9999
Table 6. Thermodynamic parameters of Cd2+ and Pb2+ adsorption onto ZnO-NPs.
MetalsT (°C)T (K)KdΔG°
(kJ/mol)
ΔH°
(kJ/mol)
ΔS°
(J/mol K)
R2
Cd2+102831.02707−62.8516,969.759.60390.9331
202931.23844−520.9
303031.40162−850.5
403131.65461−1310
503232.73019−2697
603332.8399−2890
Pb2+1028326.6259−772248,695.9198.40.9860
2029337.7893−8848
30303100.508−11,614
40313188.482−13,633
50323279.017−15,122
60333547.621−17,457
Table 7. Physico-chemical parameters, significant components, and nutrient salts.
Physico-Chemical ParametersMajor Constituents (mgL−1)Nutrient Salts (µM)
Real SamplesS‰pHOOM (mgL−1)Na+ K+Ca2+ Mg2+ SO42− (g/L)NO3NO2PO4SiO4
Ground water 2.297.322.9612085351142450.2203.520.130.232.14
Red Sea water38.558.081.8510,33428765024522.0475.250.270.254.52
Table 8. Cd2+ and Pb2+ removal % from environmental samples using green-synthesized sorbents.
SpikedCd2+ (% Removal)Pb2+ (% Removal)
Initial Metal (C0)C0 = 5 µg/LC0 = 20 µg/L
Water sampleRun 1Run 2Run 3Run 1Run 2Run 3
Ground water91.9390.4189.6393.5191.8792.33
Red Sea water85.0484.8086.2389.2190.5490.07
Table 9. Summary of some of the other reported adsorbents used to remove Cd2+ or Pb2+.
SorbentsZnO-NPs-CdZnO-NPs-PbReferences
qe (mgg−1)qe (mgg−1)
ZnO-NPS Synthesis Using Mangrove Leaf Extract7.662.02Present study
ZnO@ Chitosan core shell135.1476.1[77]
Nano-ZnO-38.47[73]
Magnetic Fe3O4 yeast treated with EDTA anhydride41.5588.16[78]
ZnO/r-GO-16.26[79]
r-GO/PANI/ZnO12.033-[80]
Silica-supported iron oxide
nanocomposites
19.5720.54[81]
CuO NPs15.6088.80[82]
ZnFe2O4-289[83]
Disclaimer/Publisher’s Note: The statements, opinions and data contained in all publications are solely those of the individual author(s) and contributor(s) and not of MDPI and/or the editor(s). MDPI and/or the editor(s) disclaim responsibility for any injury to people or property resulting from any ideas, methods, instructions or products referred to in the content.

