Abstract
We devised a simple infiltrometer to easily assess soil infiltration capacity and key soil hydraulic properties considering the impact of soil structure on soil infiltration. We conducted two series of five in situ infiltration experiments each on undisturbed forest and grassland soil of contrasting bulk densities and saturated hydraulic conductivity (Ks), and one on six soil columns with mineral soil and various textures without structure. Finally, we measured Ks, saturated water content and the van Genuchten parameters of these soils. Based on the obtained results, we found the best correlations to be exponential correlations between clay content and infiltrated water volume on the one hand and between clay content and the hydraulic properties on the other hand in all cases. Considering the infiltrated volume obtained by the infiltrometer and the measured soil parameters in mineral soil columns as references, we hypothesized that any change in hydraulic parameters of the natural soil is proportional to the change in infiltration volume. Thus, a second term accounting for water volume changes was therefore included in the correlation equations. The first validations of Ks values in forest soil showed good agreement with the laboratory measurements. Further investigations are needed to extend our validation to other soils with various textures.
1. Introduction
Agricultural soils are the nexus of a wide variety of pressures including increasing global demand for food associated with population growth, changing diets, land degradation and associated productivity reductions potentially exacerbated by climate change [1,2]. To manage the use of agricultural soils well, decision-makers need science-based, easy to apply and cost-effective tools to assess soil quality and function [3]. However, since a practical assessment of soil quality requires the integrated consideration of key soil properties and their variations with space and time, it remains a challenging task [4].
Soil quality is related to “the capacity of a soil to function within ecosystem boundaries, to sustain biological productivity, maintain environmental quality and promote plant, animal and human health” [4,5]. The physical quality of an agricultural soil refers primarily to the soil’s strength and fluid transmission and storage characteristics in the crop root zone [6].
Recent studies have proposed several conceptual frameworks for monitoring soil quality [7]. The soil attributes are selected from a minimum dataset for their suitability for assessing a particular soil function [8], a specific soil ecosystem service [9] or a key threat to soils [10]. However, because many soil analyses are involved, monitoring all soil quality indices at different scales and land uses remains expensive, as well as time and labor consuming, when using the standard procedures [11]. In this regard, identification of appropriate soil physical indicators appears to be useful for soil quality status, since they express the soil’s ability to store and provide crop-essential water, air and nutrients [6,12].
Soil structure, including macropores and organic matter, is the property most frequently evaluated when determining soil quality under different land uses and agricultural practices [13]. Soil structure is usually evaluated in an indirect way from properties such as soil organic carbon content, bulk density and porosity. In some cases, the soil water retention curve, soil resistance to root growth, the saturated hydraulic conduction (Ks) and the infiltration rate are taken into account as well [14]. These properties, which can be used as indicators of soil physical quality [15], are usually evaluated by classical tests based on laboratory and field measurements frequently used to characterize and monitor the physical condition of soils. In this regard, infiltration capacity is a good indicator of physical soil quality since it reflects the hydrodynamic aspect of the soil structure [16]. Infiltration capacity is defined as the maximum rate at which water soaks into or is absorbed by the soil through the soil surface [17].
There are several devices and approaches to assess infiltration capacity in soils. Infiltration-based methods are recognized as valuable tools to investigate hydraulic and transport soil properties. The well permeameter and single-ring infiltrometer constant-head techniques are the most used in this issue [18]. They rely on the attainment of a steady-state flow rate of water into the soil. The BEST (Beerkan estimation of soil transfer parameters) procedure of soil hydraulic characterization [19,20] suggested determining the field saturated hydraulic conductivity (Kfs) by only a transient infiltration process through a soil surface confined by a ring. Calculating Kfs requires the slope of the linearized cumulative infiltration vs. time relationship and an estimate of the so called α* parameter. Although the BEST method is a relatively rapid and inexpensive method that substantially facilitates the hydraulic characterization of unsaturated soils [21,22,23,24,25], it’s application is limited [26]. For example, Xu et al. [27] reported the occurrence of null or even negative estimates of Ks and sorptivity in sandy soils or soils in wet conditions. [28] also found that the BEST method was not appropriate for some soils because of the lack of concavity at the beginning of the cumulative infiltration curve. [29] revealed that in some cases, the BEST method and its modified version [23] still show poor performance in fitting a cumulative infiltration curve and also occasionally resulted in a null or extremely low value, especially for sandy soil or soils in wet conditions.
Among the widely used methods for this purpose, the Guelph permeameter measures Kfs by determining the steady-state liquid recharge rate required to maintain a constant depth of water in an uncased, cylindrical auger hole in the unsaturated zone [30,31]. The term “field-saturated” refers to the fact that air may be entrapped or encapsulated by the infiltrating water, causing the measured hydraulic conductivity to be lower than the real Ks [32]. Several factors may affect the magnitude of Kfs measurements in the unsaturated soil using the Guelph permeameter, such as gradual siltation for the well and well collapse during the course of the measurements, air entrapment by the infiltrating water and solar heating of the head space in the water sections [31,33]. Double-ring infiltrometers are also routinely used by soil scientists and other professionals to measure the infiltration rate of field sites [34,35]. The size of the cylinder in these devices is one source of error. A 15 cm diameter ring produces measurement errors of approximately 30%, while a 50 cm diameter ring produces measurement errors of approximately 20% compared to the infiltration rate that would be measured with a ring of an infinite diameter [36]. It has been suggested that a diameter of at least 100 cm should be used for accurate results [34]. However, cylinders of this size become very difficult to use in practice on light soils, because large volumes of water are required to conduct tests on sandy soils with high infiltration rates.
Application of the results from measurements with the above infiltrometers for soil quality purposes is limited for several reasons. They investigate only the upper few centimeters of the topsoil, do not take into account the effect of soil layering (e.g., double-ring infiltrometer) and are difficult to implement, principally due to the friable nature of soil (e.g., Guelph permeameter). [18] showed in their review on tension discs and pressure ring infiltrometers that these methods have limitations, most of them being associated with the simplifying assumptions of the analysis used to infer soil hydraulic properties from water and solute flow measurements. Therefore, developing alternative methods to obtain key soil parameter data at different depths and with minimal experimental efforts and theoretical constraints is desirable, especially for areas of the world where resources for experimental soil research are scarce.
The aim of this study was to devise a new infiltrometer that makes it possible to rapidly and reliably evaluate the soil infiltration capacity and key soil hydraulic properties based on a short infiltration in the field and prior knowledge of clay content. Based on laboratory and field measurements, we establish correlation equations to determine the key hydraulic properties such as Ks, θs and the van Genuchten parameters [37].
2. Materials and Methods
The infiltrometer proposed here consists of a Plexiglas tube of about 4 cm in outer diameter and 57 cm in length mounted on a semisoft, porous tube of 10 cm length and with the same diameter. It ends in a conic steel point that facilitates insertion into the soil at different depths (Supplementary Material S1-A). The Plexiglas tube opens at its upper end and promotes water infiltration into the soil under the falling head. The infiltrometer was calibrated and validated using a water volume of 370 mL, ensuring the same conditions for all infiltration experiments. In the open air (outside the soil), the porous tube, containing pores of 10 μm diameter, allows water infiltration (of 370 mL volume) at a rate of 2 mL s−1, which is 16 times higher than that of soil of the highest sand content used for the calibration in this study, namely sample 6 with 90.8% sand and 0.1% clay, and 40 times higher than that of soil of the highest clay content, namely sample 1 with 17.6% sand and 13.6% clay (Figure 1), which have infiltration rates of 0.126 mL s−1 and 0.05 mL s−1, respectively. We assume that the calibration of our approach with such characteristics allows reliable estimates of soil properties within this range of soil texture.
Before the installation of the infiltrometer in the ground, a cylindrical hole was excavated by vertically driving a beveled steel cylinder of 38 cm in diameter into the ground at the desired depth. Using a rubber hammer, the excavation was made with great care to avoid creating a space between the hole’s walls and the cylinder. This metal tube was then taken out by turning it slightly to avoid any soil disturbance.
The texture of soils sampled in the field (one sample per depth) was determined after treating them with H2O2 to remove organic material [38]. The sand fraction (>50 µm) was obtained by wet sieving. The silt and clay fractions (particles of 2 to 50 µm and <2 µm, respectively) were measured on pretreated samples by sedimentation with a SediGraph 5100 (Micromeritics, Norcross, GA, USA) using particle sedimentation rates in combination with X-ray absorption.
Ks was determined on samples of undisturbed soil with a diameter of 55 mm and a length of 42 mm, taken at 50 mm depth increments throughout the soil profile. For the Ks measurements, 5 samples were taken at a depth between 10 and 20 cm. Ks was determined with a constant head permeameter [39]. Total porosity and bulk density were then determined directly for each undisturbed sample after drying at 105 °C for 24 h, assuming a particle density of 2.65 g cm−3. Organic carbon content was determined by the mass loss on ignition. The selected data consisted of WRCs of at least 6 data points over a large suction scale, most of which were measured with a pressure plate in the laboratory. Determination of van Genuchten parameter values from the paired soil water content–matric potential data was conducted using the curve fitting software RETC [40] using the m = 1−1/n assumption.
2.1. Calibration
We first conducted two series of 5 in situ infiltration experiments each on undisturbed forest (Länggasse, city of Bern, Switzerland) and grassland soil (Schwarzenburg, canton of Bern, Switzerland) of contrasting bulk densities and Ks (Supplementary Material S1-B, Table 1). In all cases, the porous tube of the infiltrometer was inserted between 10 and 20 cm depth, enabling us to estimate the infiltration rate at this depth. After the infiltration experiments, we sampled soil around the hole where the infiltrometer was inserted. The samples served for the measurements of the key soil hydraulic properties and van Genuchten parameters as described above.

Table 1.
Measured texture, saturated hydraulic conductivity (Ks), bulk density (BD) and organic carbon (OC) of investigated soils used for the calibration.
With respect to bulk density, we artificially constructed 6 soil columns of various textures, consisting of mineral soil placed in a cylinder of Plexiglas with a diameter of 19 cm and 20 cm length. They were reconstructed by weighing soil and defining the corresponding volume in the Plexiglas cylinder to obtain comparable values of BD for all soil columns (1.35–1.40 g cm−3). These soil columns consisted of mineral soil with neither structure (i.e., macropores) nor organic matter. Clay minerals used here were rich in kaolinite and smectite and were washed before use. On each of these, we conducted 3 similar infiltration experiments (Supplementary Material S1-C). A water volume of 370 mL was used for all infiltration experiments. After carrying out all infiltrations, the dried material was used to prepare soil samples of smaller sizes using cylinders of a diameter of 55 mm and a length of 42 mm (with the goal of reproducing a similar BD), which served for the measurements of the key soil properties including the van Genuchten parameters. For each soil texture, 5 (mineral) soil samples were used for the measurement of soil properties.
2.2. Field Validation
The validation was carried out on a forest soil in the Gantrisch region in the Swiss Prealps, approximately 30 km south of Bern at altitudes between 880 and 1000 m a.s.l. The site is located in the Flysch zone and features mainly marled clays interlaced with stony or sandy layers. The prevailing soil type was Gley, according to FAO-UNESCO [41], and hydromorphic attributes were found beneath depths of 0.05–0.14 m. Soil texture was 45% sand, 33% silt and 22% clay. Bulk density varied between 0.65 and 1.00 mg m−3 in topsoils and between 0.79 and 1.60 mg m−3 in subsoils. The slopes of the areas investigated were less than 7° [42].
We conducted 5 infiltration experiments on the site within a perimeter of about 1 m in diameter. Within that same perimeter, we took 5 undisturbed soil samples for the laboratory Ks measurements. The investigated soil layer was between 5 and 15 cm for both infiltration experiments and laboratory analyses. The diameter of the cylinders and the procedure of Ks measurements were the same as described for the calibration. In this study, the validation was carried out only for Ks.
3. Results
Linear relationships between infiltrated water volume and the corresponding time intervals of infiltration were determined for each sample (Figure 1). Thanks to this correlation, the infiltration capacity could be easily deduced after a time of 20 min of infiltration. Based on our calibration, we set a threshold infiltrated water volume value of 50 mL within 20 min to indicate whether the soil was loose or compacted. This threshold value was calculated based on a bulk density of 1.40 g cm−3.
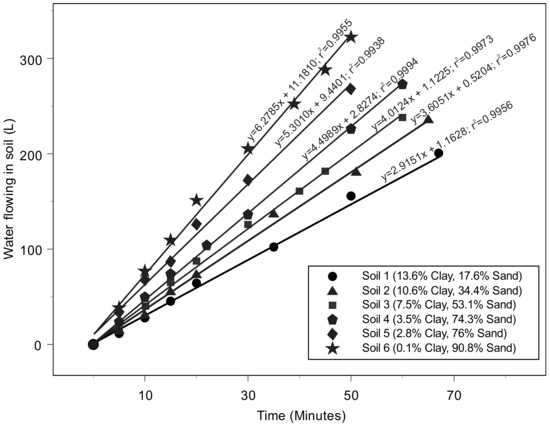
Figure 1.
Linearized cumulative infiltration vs. time relationship for six reconstructed mineral soils of different textures. No water outflow was observed during the 50 min time interval considered for all soils. The volume of water flowing in soil (y-axis) corresponds to decrease in the water level in the tube of the infiltrometer.
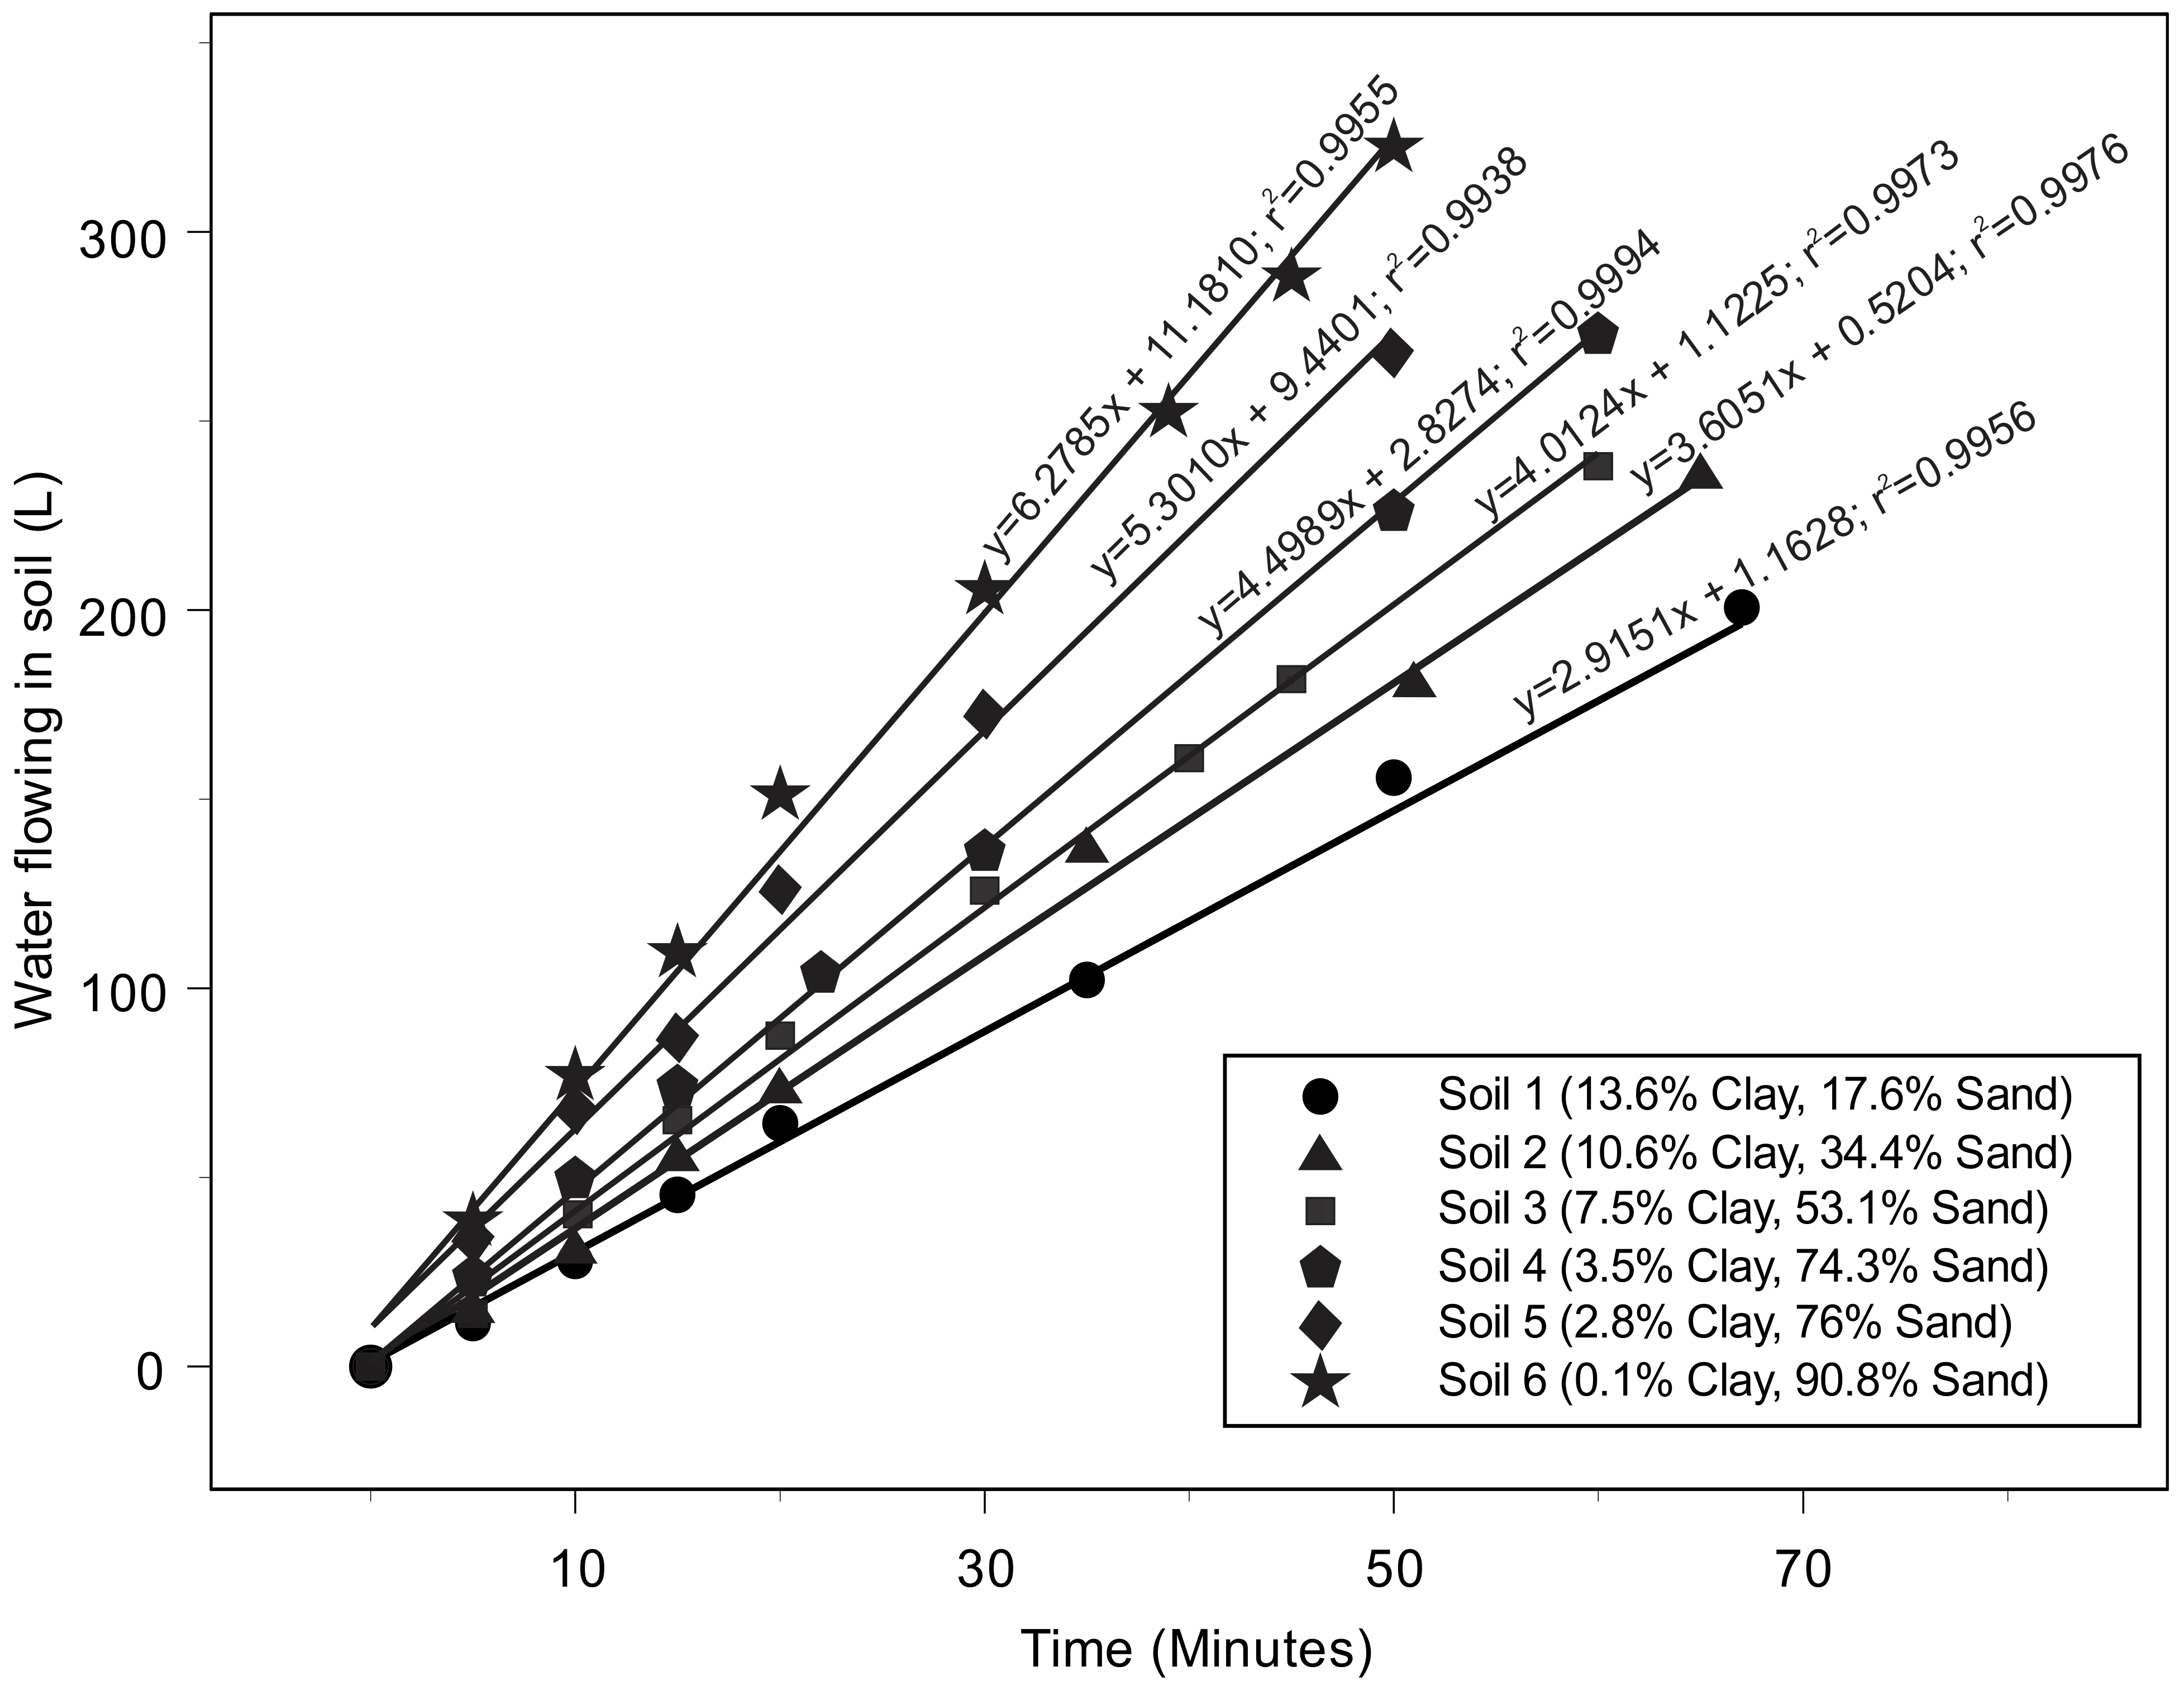
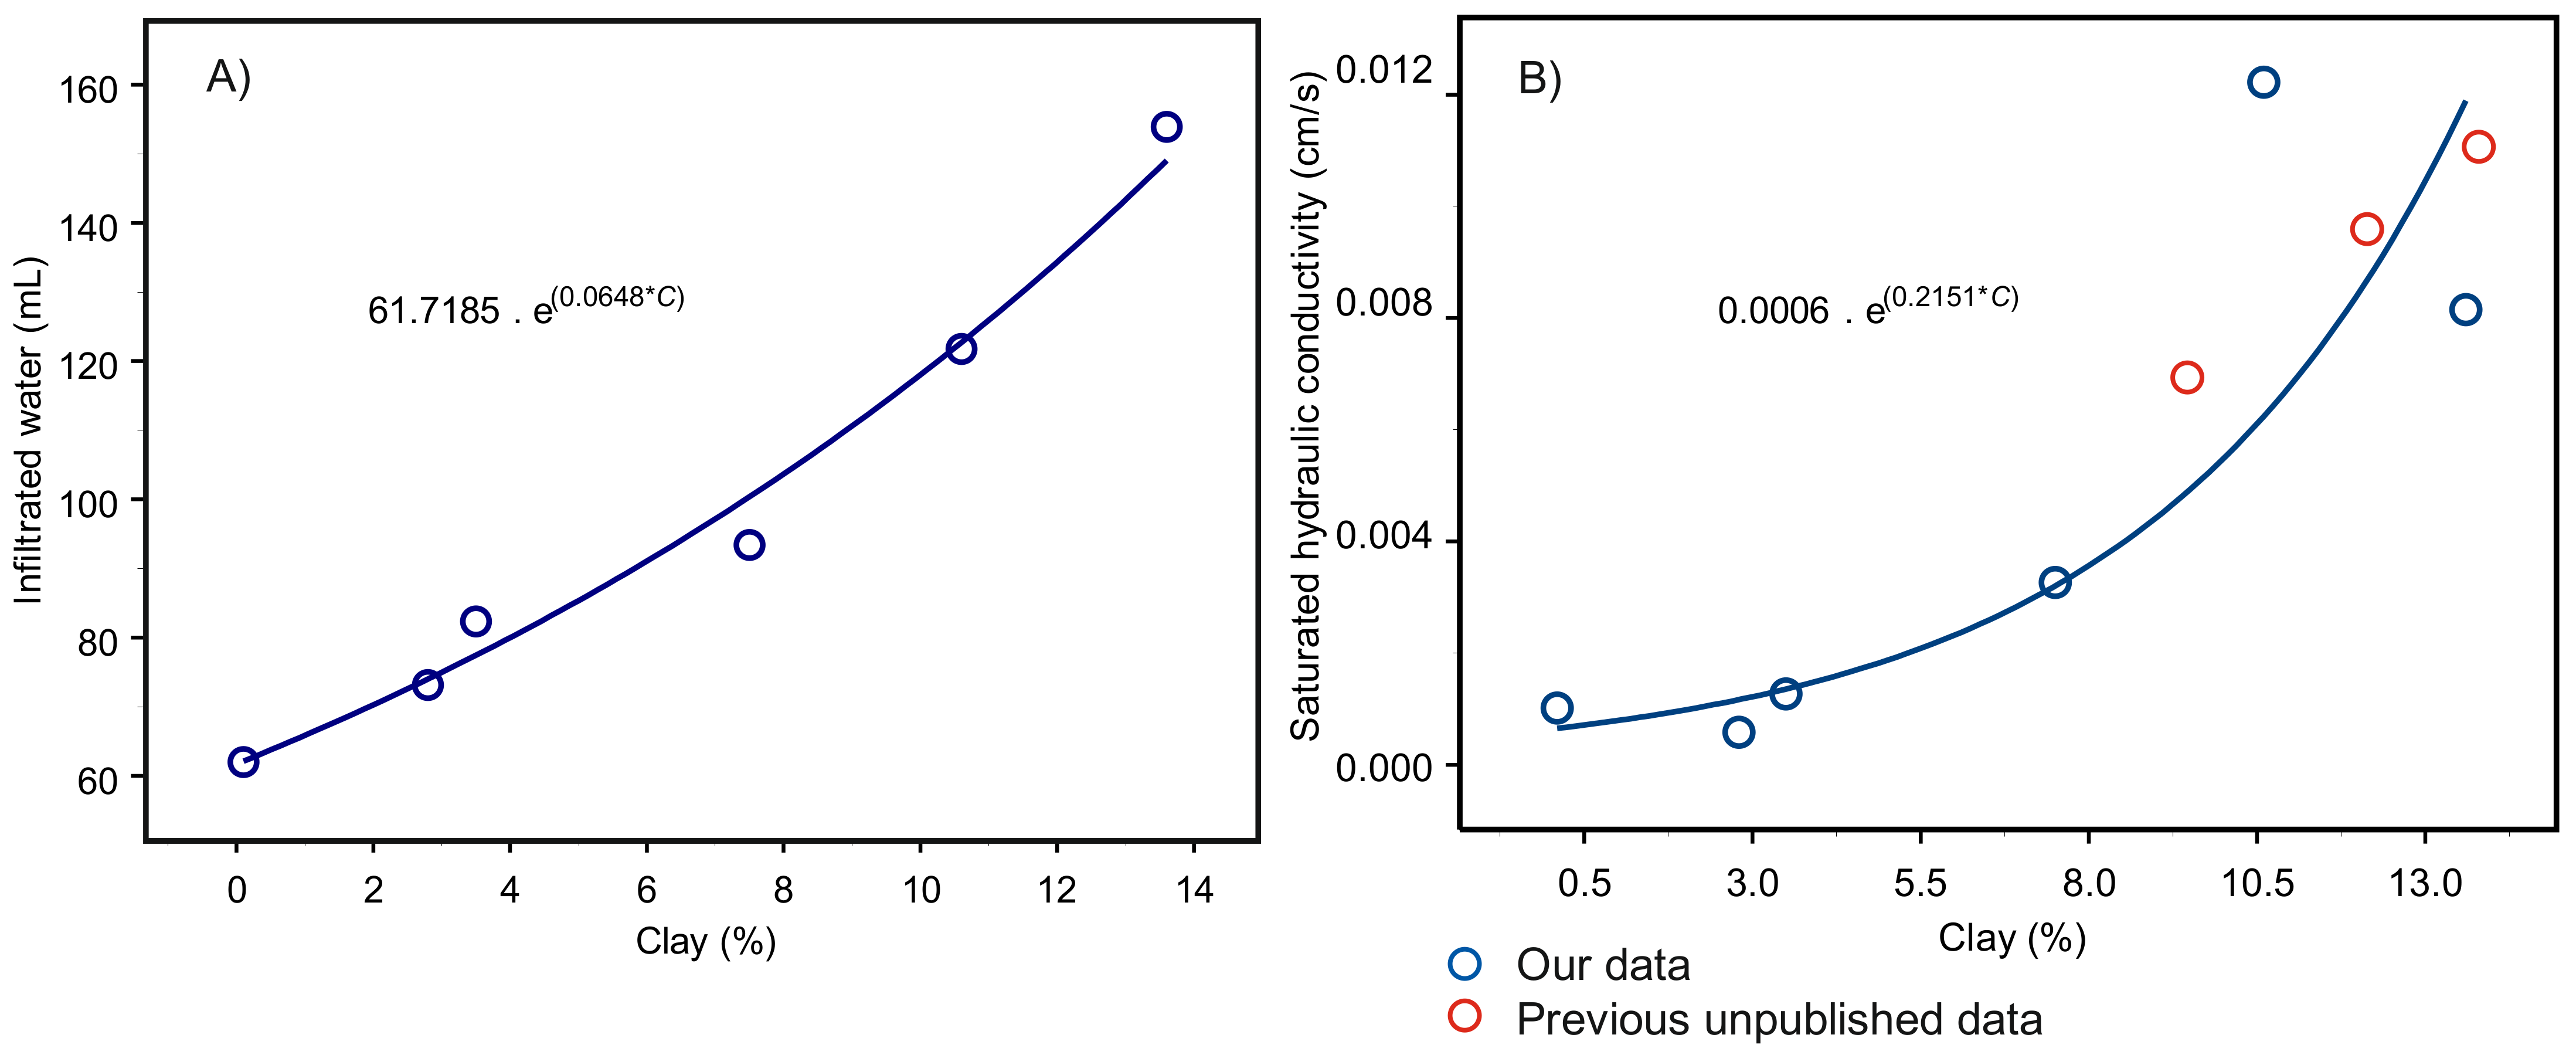
We investigated all correlations of measured properties. Overall, we found the best correlations to be exponential correlations between clay content and infiltrated water volume (Figure 2A) and also between clay content and the hydraulic parameters in all cases, expressed by “A . e(B*C)” in Equation (1 and 2) and shown in Figure 2B.
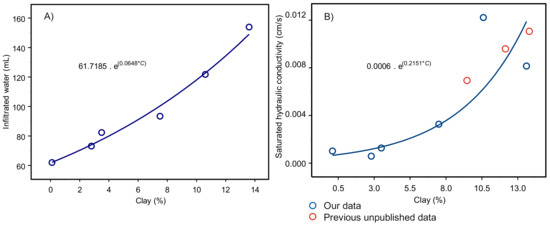
Figure 2.
Laboratory investigations on six reconstructed mineral soils: (A) exponential relationship between clay content C and infiltrated water; (B) exponential relationship between clay content C and saturated hydraulic conductivity Ks.
Taking into account a reference BD value of 1.4 g cm−3 of mineral soil, we introduced a second term (e.g., “(V2 − Vi) * F”) to state if soil was loose or compact.
Thus, hydraulic properties (HP(i)) could be obtained using the following general equations:
HP(i) = A . e(B*C) − (V2 − Vi) * F) for loose soil (forest)
or
where A and B are empirical factors specific to each hydraulic property, C is the clay content, the indices “1” and “2” refer to reconstructed soil columns and field soils, respectively, and F is a factor expressing the impact of the structure/degree of compaction on the HP (see Table 2).
HP(i) = A . e(B*C) − (V1 − Vi) * F) for compacted soil (grassland)

Table 2.
Equations for the prediction of soil parameters Ks, θs and van Genuchten parameters α and n with m = 1–1/n (calibration at 20 min).
Considering the infiltrated volume obtained by the infiltrometer and measured soil parameters in mineral soil columns as the references, we hypothesized that the increase in HP due to soil structure is proportional to the increase in infiltrated water volume from V1 to V2 (in the case of the forest soil as compared to mineral soil columns). Similarly, the decrease in HP due to soil compaction was assumed to be proportional to the decrease in infiltrated water volume from V1 to V′2 (in the case of the grassland soil as compared to mineral soil columns) (see Equations 1 and 2 and Supplementary Material S2). This relationship is valid for θs and Ks. For the van Genuchten parameters, slight differences were noted in the equations; the operators between the terms depend on the magnitude of the relation between the parameters n and λ obtained for loose soil and compacted soil (Table 2).
The soil parameters can be calculated according to the functions presented here with regard to measured Vi values. We estimate that for a compacted soil forest presenting a value for Vi in the range of those of grassland soil, the equations of the latter soil can be used for the calculations. This is because infiltration capacity is the most integrative property that represents the dynamic response of soil rather than its morphology.
These calculations were based on a 20 minute time interval of infiltration. We assume that the predictions within this time interval are less prone to errors than those for shorter time intervals.
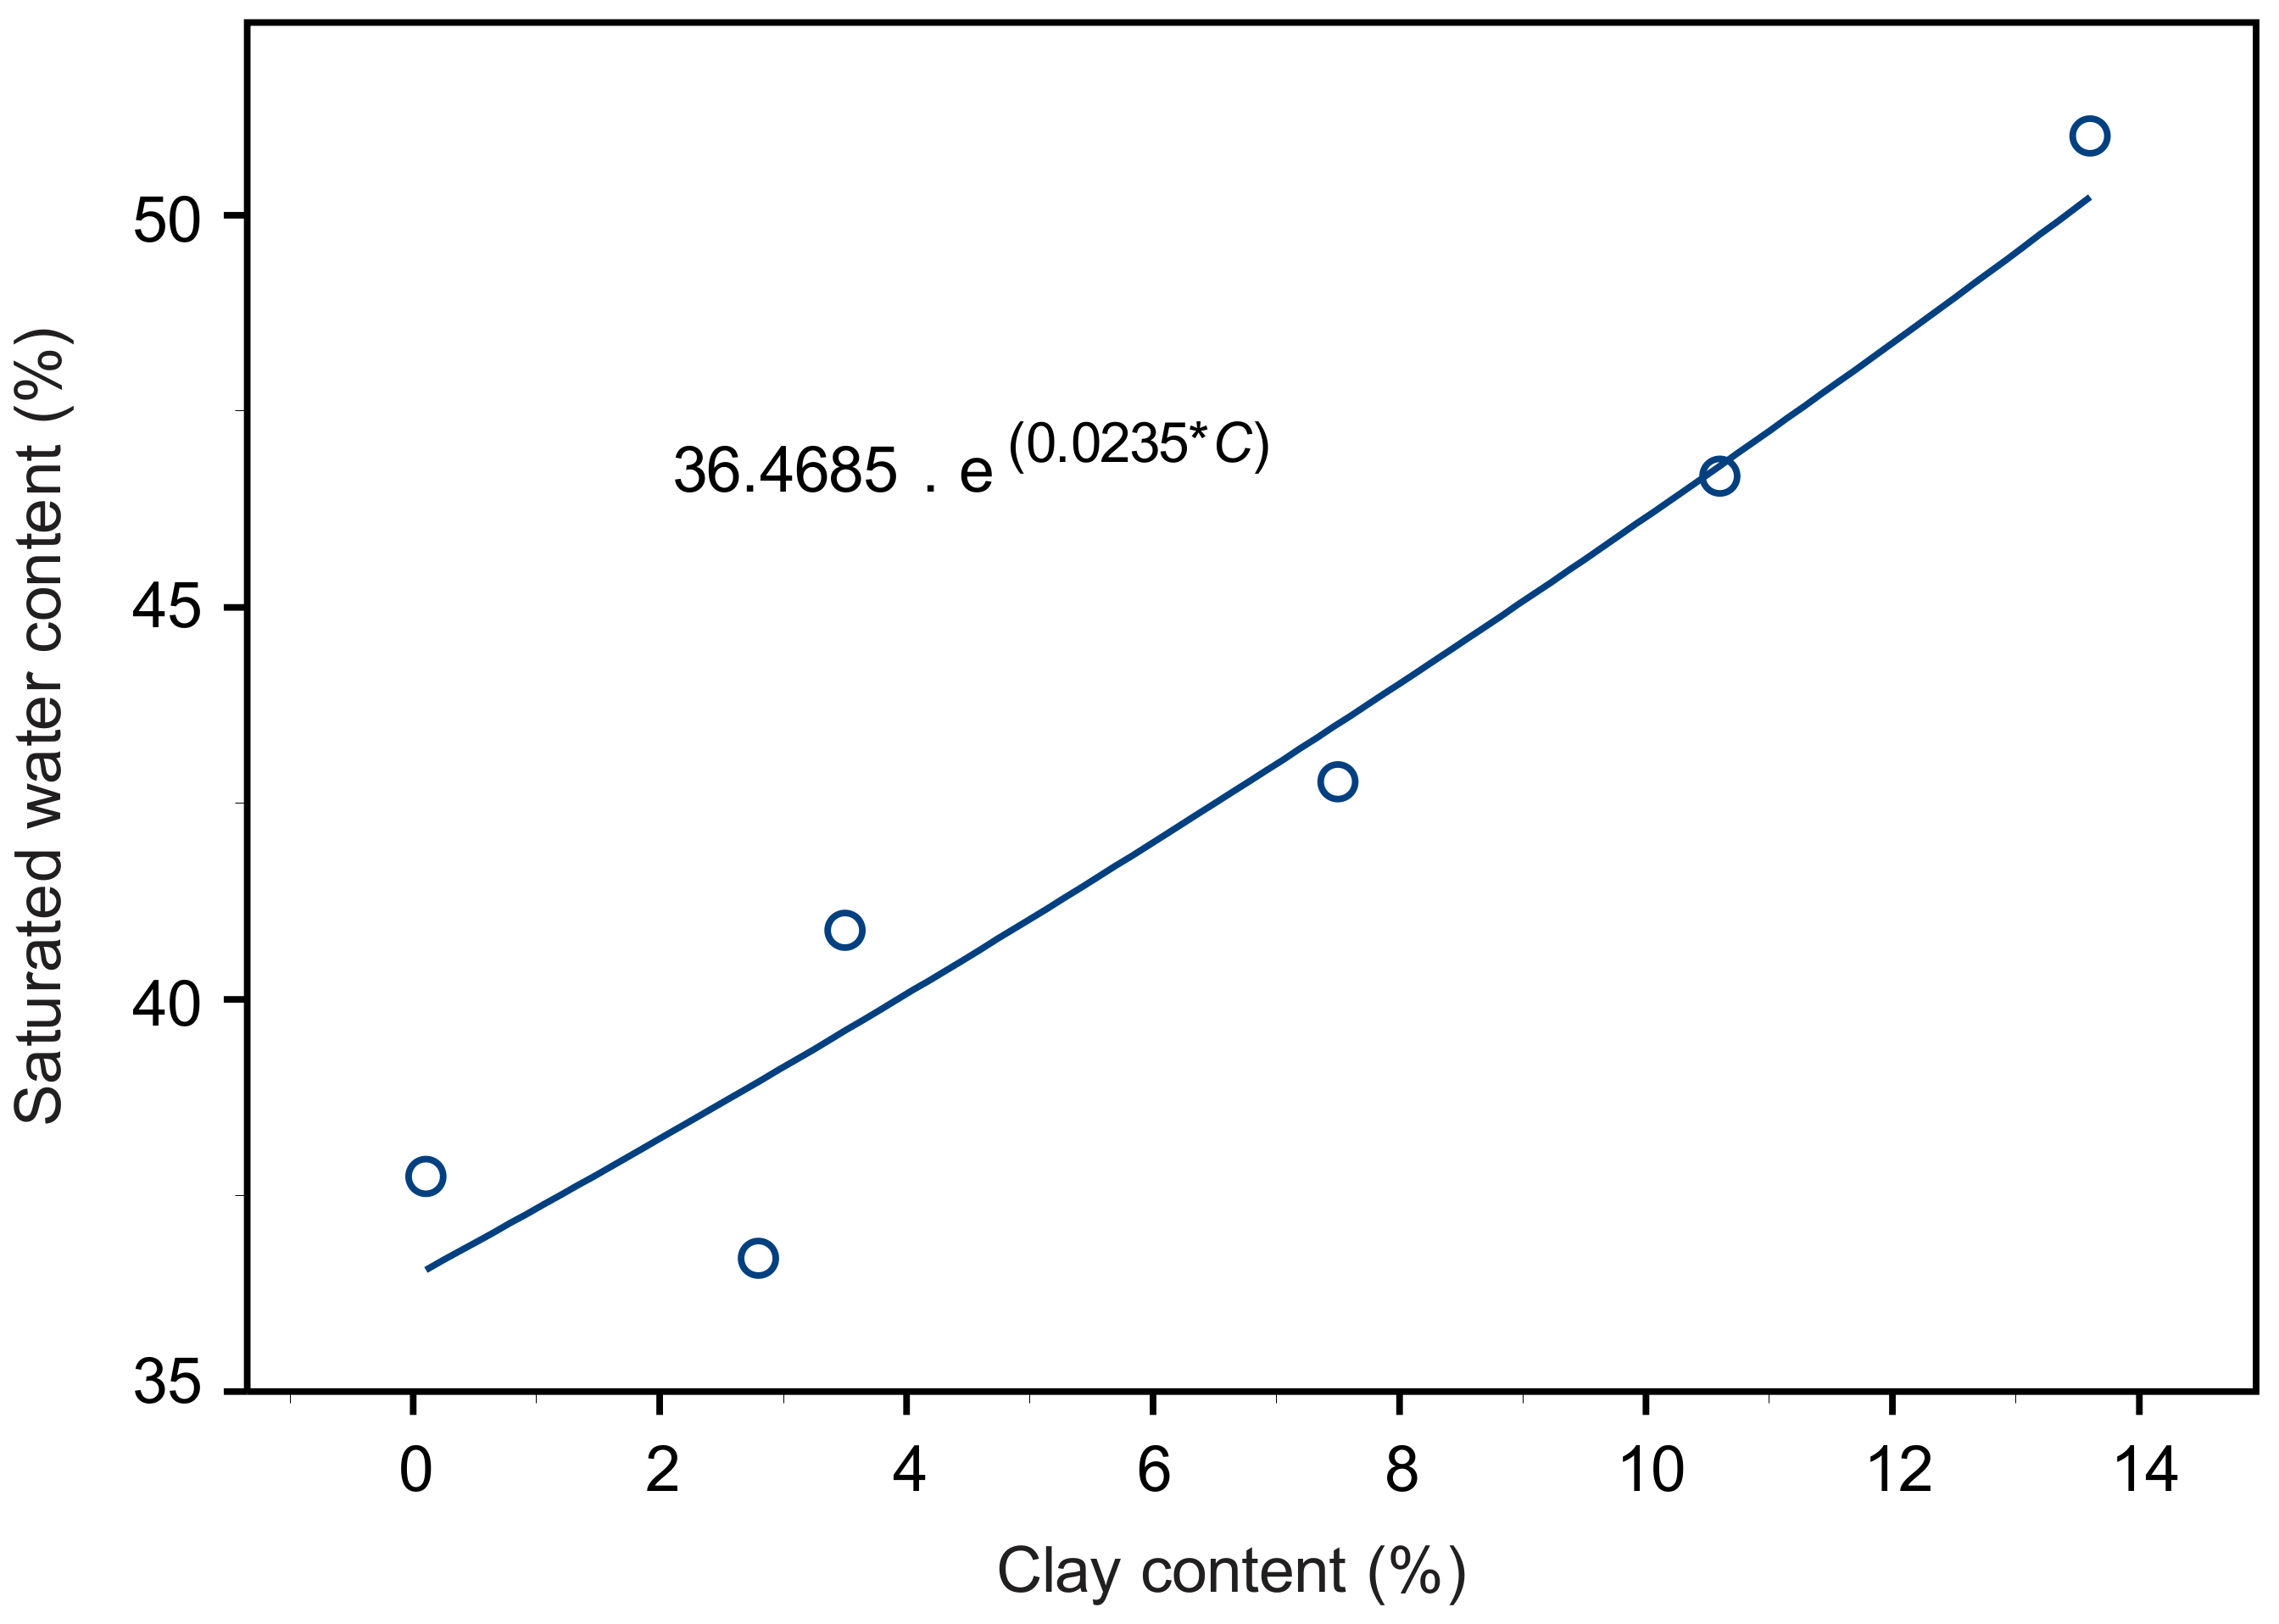
According to Equation (2b), the exponential correlation between clay content and θs results in the equations for the θs prediction for different values of Vi (Figure 3 and Table 2).
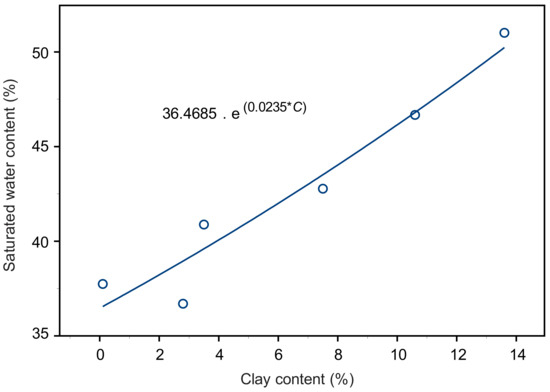
Figure 3.
Exponential relationships between saturated water content and clay content C; data from six reconstructed soil columns.
The statistical significance parameters provided in Supplementary Material S3 attests to the consistency of the equations for the calculation shown in Table 2.
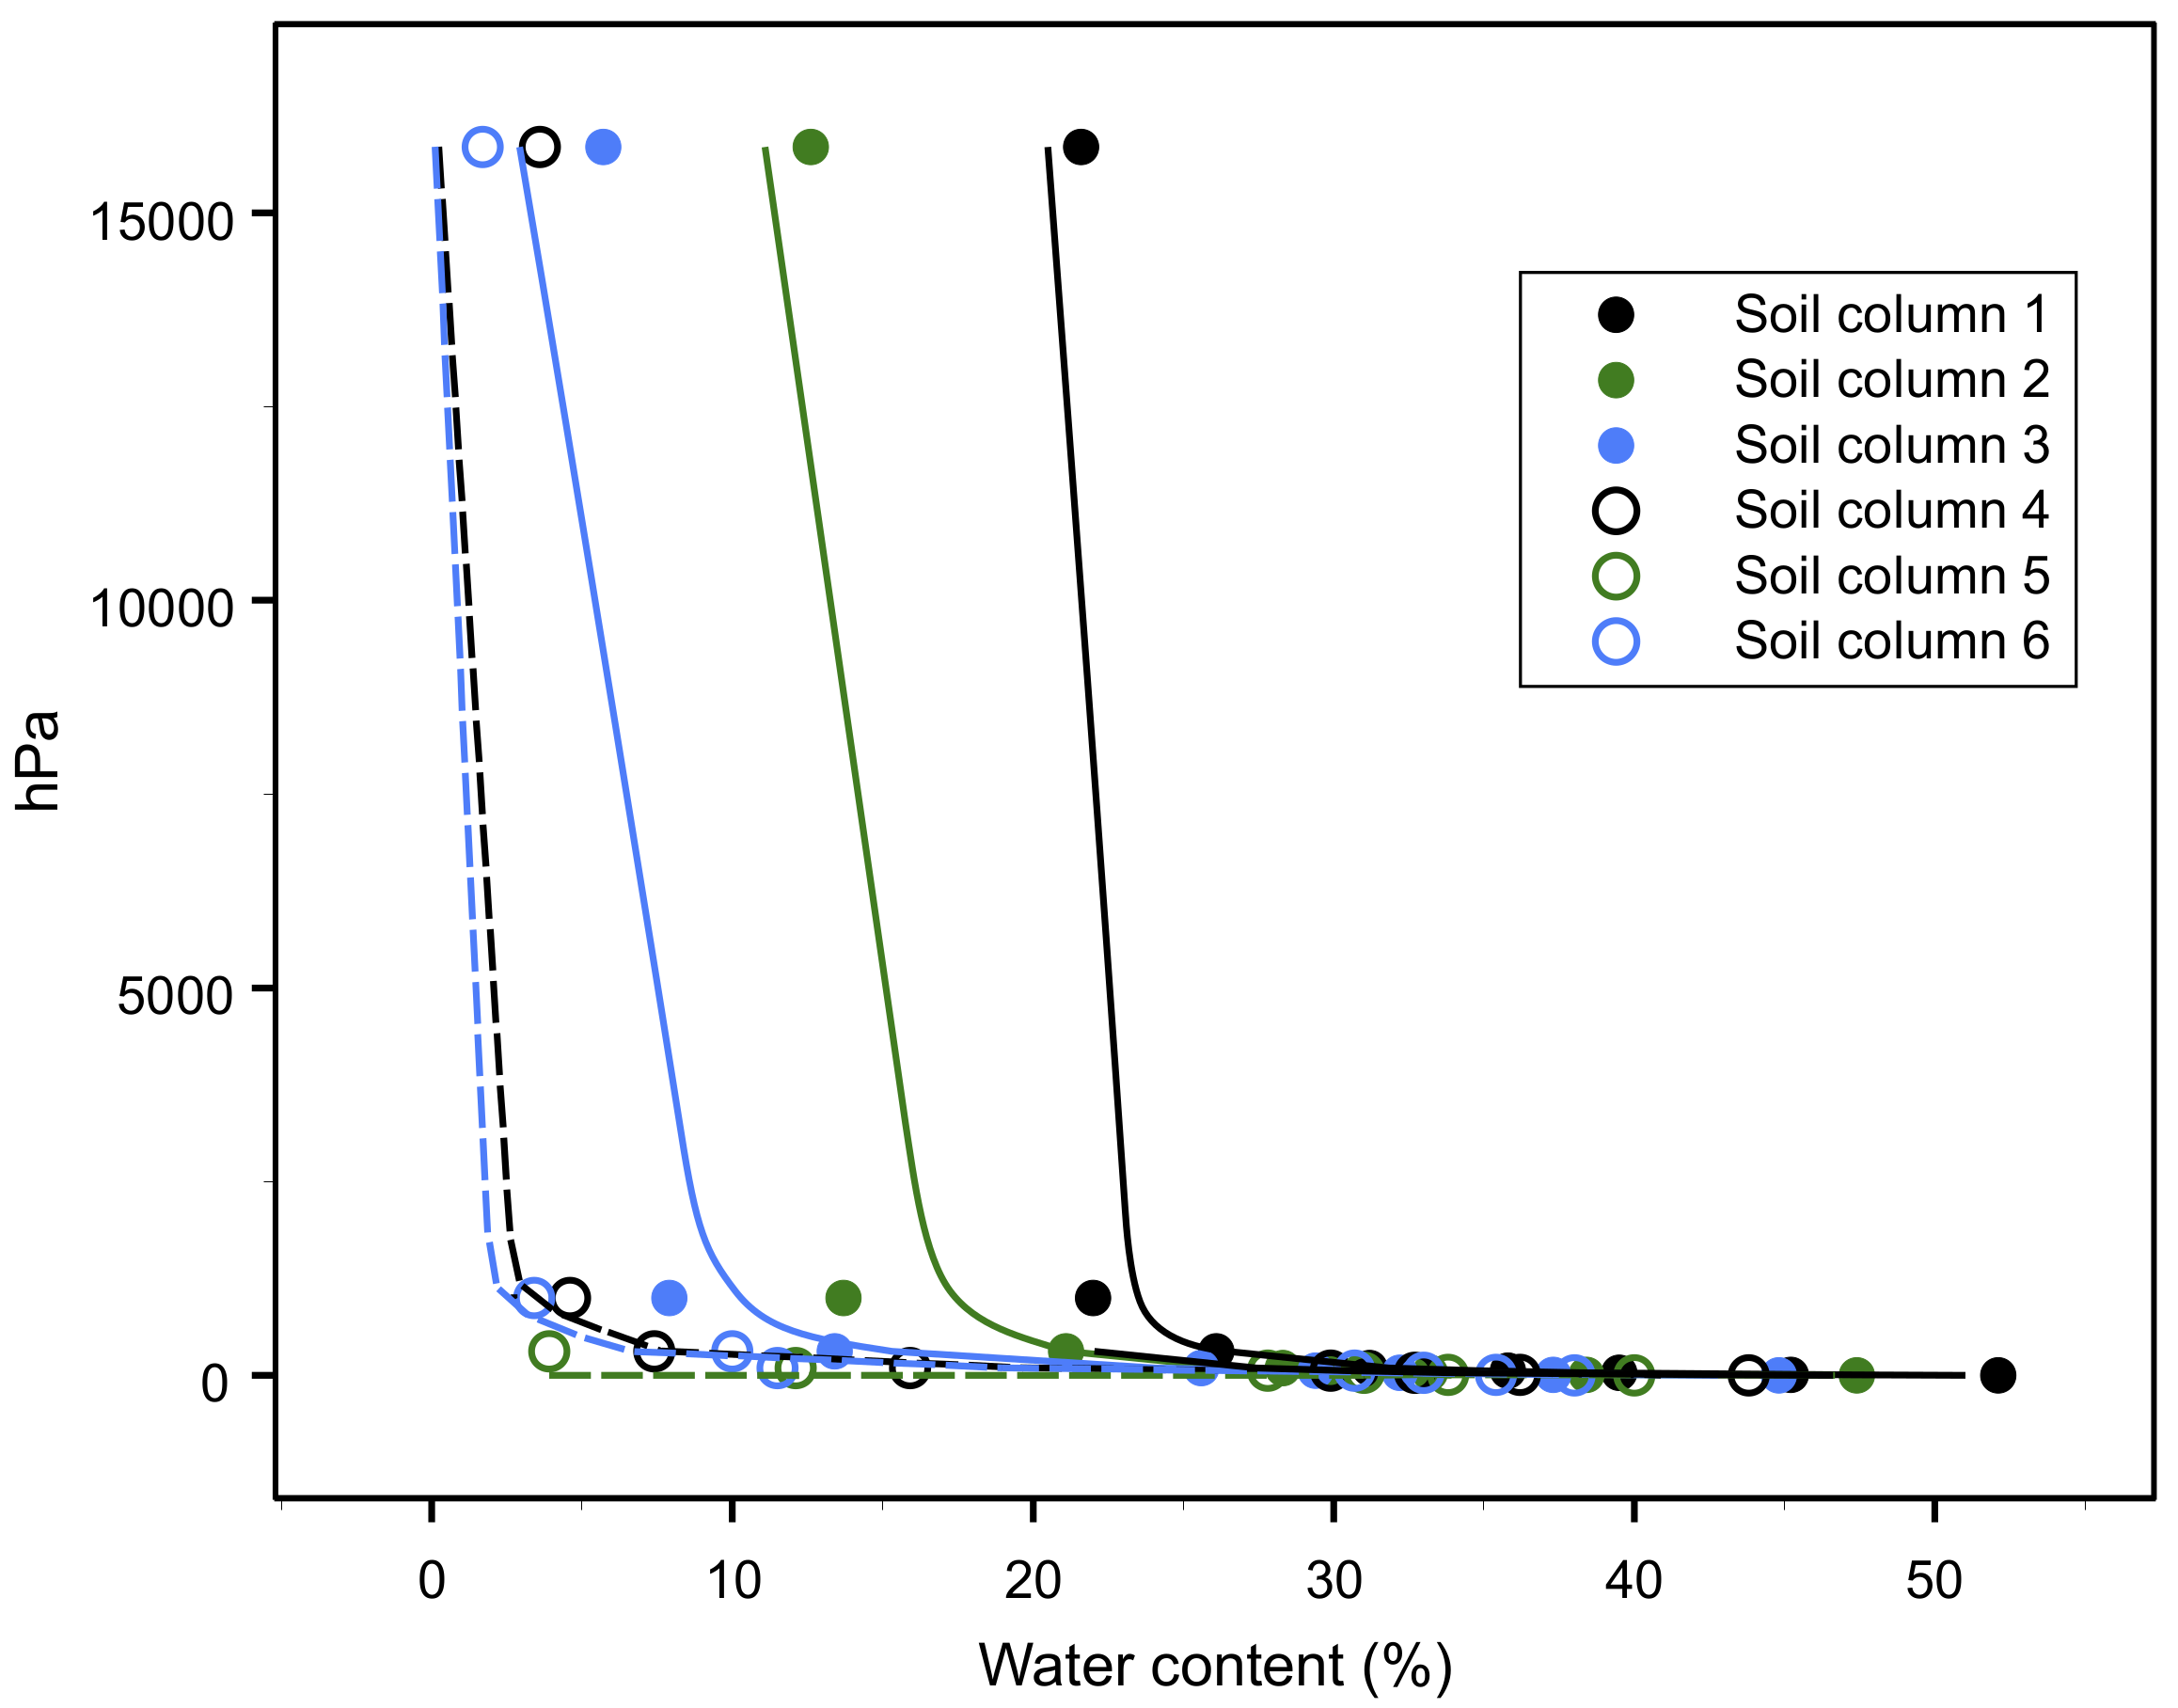
With regard to WRC, Figure 4 shows the results of the laboratory analyses of the six constructed soil columns. It appears that the water content of the small matric potential values decreases from soil column 1 to soil column 6. This fact attests to the dominant role of clay content and thus of textural porosity in controlling the WRC.
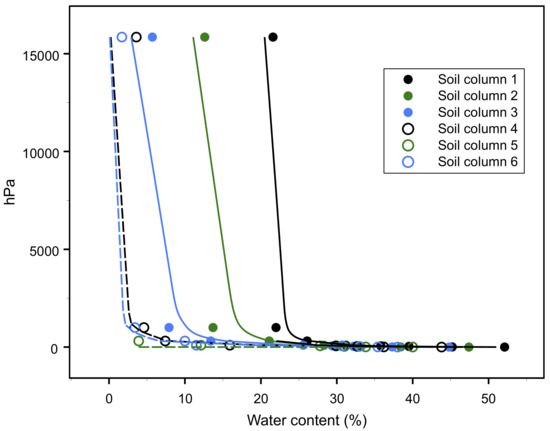
Figure 4.
Water retention curves of the six reconstructed soil columns, measured at the laboratory.
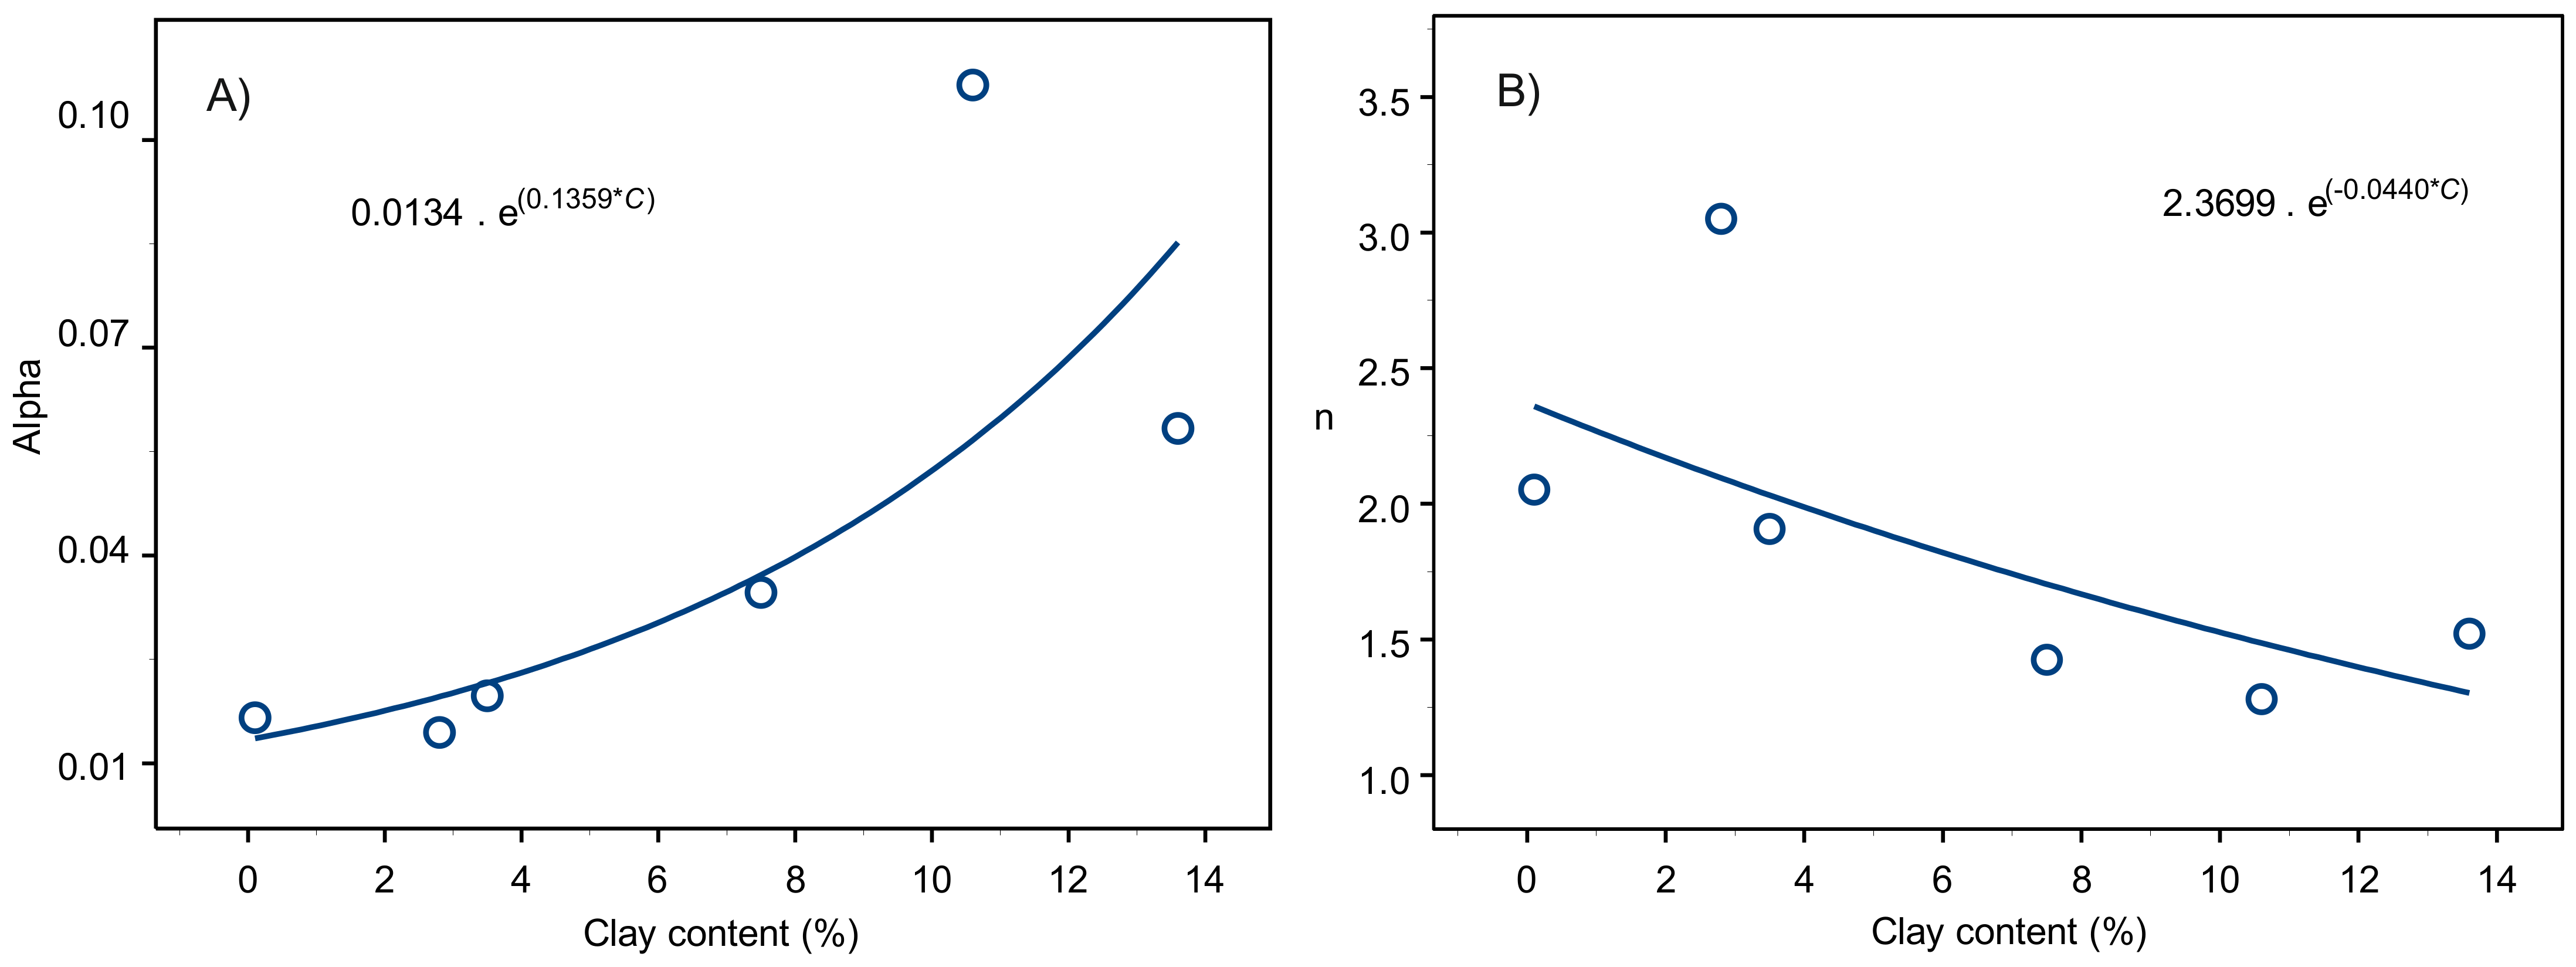
Obtained van Genuchten parameters (λ and n) of the six reconstructed soil columns and the two ones of undisturbed soils were correlated to clay content and served to obtain the correlation equations of these parameters (Figure 5 and Table 2). The soil of column 5 has high λ and n values (Figure 5) which can be attributed to the missing value of the moisture content at pressure head 15,850 hPa (Figure 4). Furthermore, we propose to extend our investigations to soils with various combinations of organic matter, macropores, pore continuity, texture and bulk density, in order to improve the accuracy of the predictions of the van Genuchten parameters.
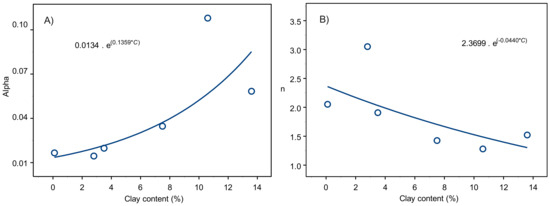
Figure 5.
Exponential correlations (A) between clay content and α (van Genuchten) and (B) between clay content C and n (van Genuchten); data from six reconstructed soil columns.
According to the concept adopted here, there are two different types of equations, one for forest soil and one for grassland soil (Table 2). Thus, the selection of the equation to use for the predictions depends on the value of V2 obtained in the field (undisturbed soil under consideration). If V2 is greater than V1 (infiltrated water volume of mineral soil), the equations related to forest soil should be used to estimate the soil properties; if V2 is smaller than V1, the equations for grassland soil should be used. As the calibration in our study was carried out on six soils of different textures (Figure 1), there are six equations for the case of V2 > V1 and six equations for the case of V2 < V1, depending on the clay content.
Validation
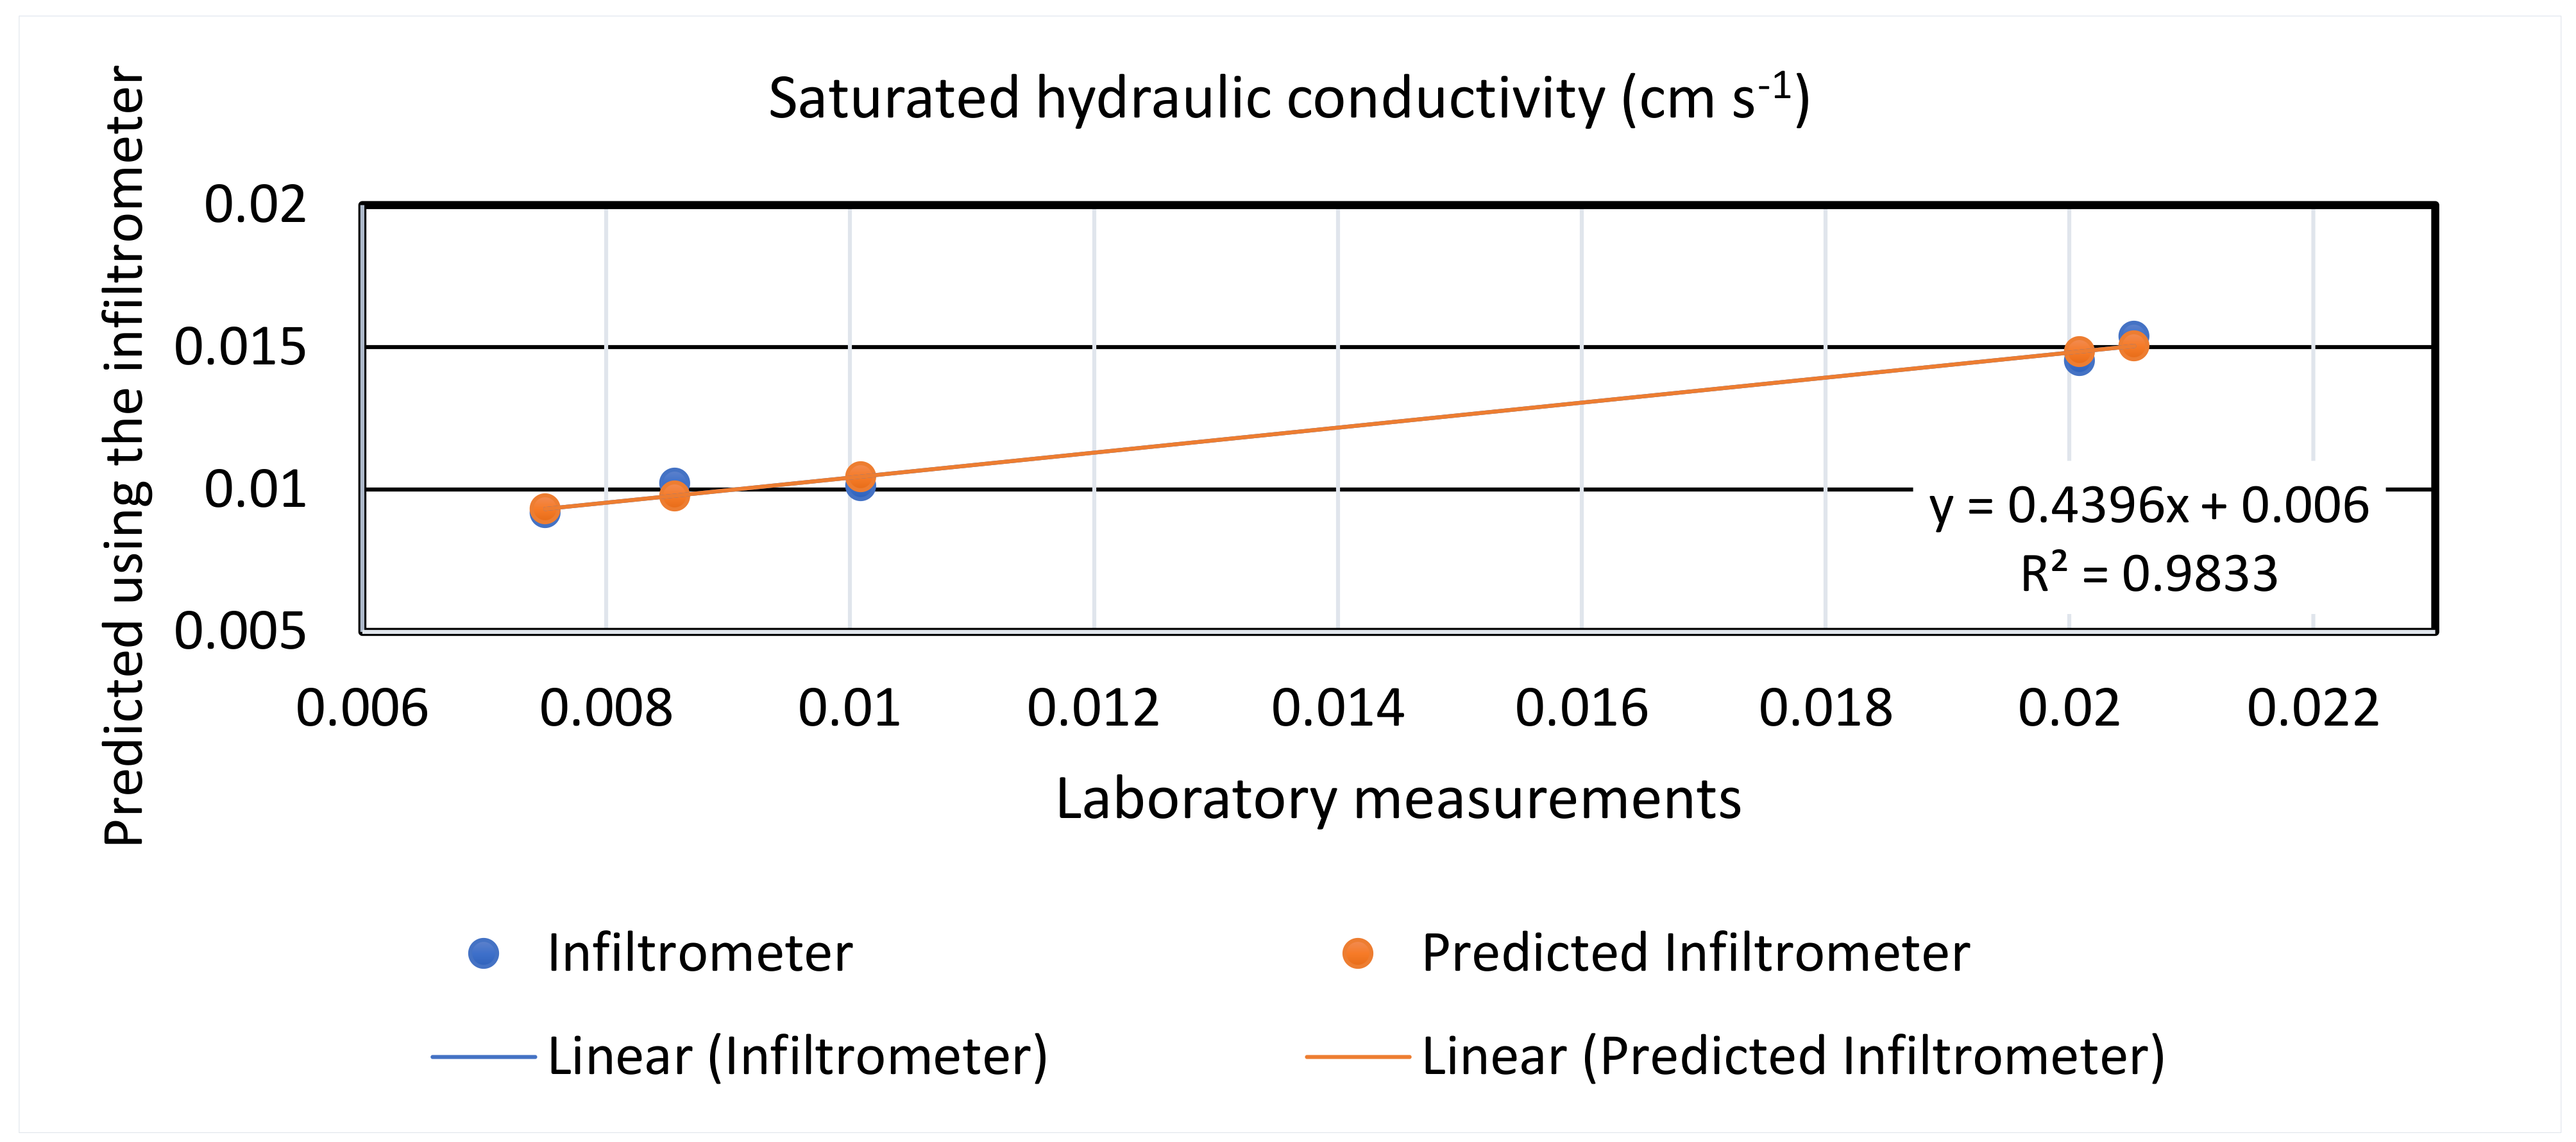
Predictions of Ks based on the five infiltration experiments and laboratory analysis of Ks gave mean values of 0.012 cm s−1 and 0.015 cm s−1, respectively, and the high correlation coefficient attests to the good agreement between the measurements and the predictions (Figure 6). These values are comparable and attest to a good validation of the approach proposed in this study. Similarly, the predicted value of total porosity was 50%, which is in the range of the values measured by [43] and reported in [42] for the same site (defined as site B in their work) (42–57%).
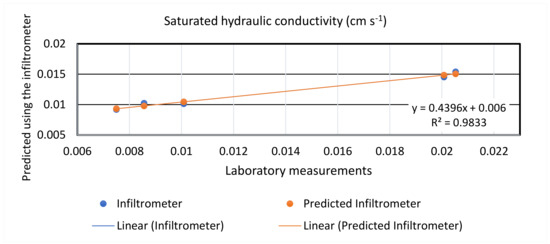
Figure 6.
Validation of the method for saturated hydraulic conductivity, Ks, comparison between laboratory measurements and predictions based on infiltration experiments. black circles represent the mean values.
Obtained Ks values for this site were relatively high. This fact can be explained by the high organic matter of the topsoil (5–15 cm depth) and the dominant contribution of pores mainly generated by roots carrying mobile water downward [42].
4. Discussion
A heterogeneous structure in undisturbed (structured) soil generally creates suitable conditions for ecosystem services and the changes in the WRC and hydraulic conductivity function affect the water transport processes. The concept of soil structure involves the distribution, size range and connectivity of the pore spaces between particles, aggregates and peds in soil [44], which have a large impact on the storage and supply of water, nutrients and oxygen [45,46]. The most commonly used physical soil properties, such as bulk density/total porosity, macroporosity, Ks and penetration resistance, only deal with the morphology of structure and do not directly account for changes in the volume distribution of these voids, their connectivity or the changes in this connectivity [47]. For this reason, it is necessary to directly consider the hydrodynamic functionality of the pores in conducting water, air and nutrients rather than dwelling on the morphology of soil structure [48].
Furthermore, there is a research gap in easy to apply tools to assess soil structure impact on the infiltration capacity at the plot, field, farm and regional level which can be used by practitioners in the agricultural sector, as well as researchers and others.
The proposed device to determine key soil parameters has the advantage of being simple, easy to use and cost-effective. It is assumed that very small changes in soil structure between different soil samples could be reflected by the variations in the volumes of infiltrated water between soils under consideration. Corresponding changes in soil parameters were assumed to be proportional between V1 of the reconstructed soil sample and V2 of the structured undisturbed soil. This could minimize the errors of the estimations.
The laboratory soil columns were reconstructed with regard to bulk density by adjusting the height of soil contained in the cylinder with its weight. In this study, the bulk density varied between 1.35 and 1.40 g cm−3 for the six reconstructed soil columns that served as references to quantify the effect of additional soil structure and OM on the infiltration rate and soil properties. The choice of this range of bulk density values is due to the need for common reference values for all soil samples used in the lab. We argue that choosing this range of bulk densities does not affect our results since the water volume flowing at the bottom of the reconstructed soil columns is proportional to the bulk density of mineral soil with neither structure (e.g., macropores) nor OM. When looking at the undisturbed soils, the variation in the OM may reflect a non-linearity between reconstructed and undisturbed soils in terms of the structure effects. In fact, the factor, F, expressing the impact of structure on each parameter may be variable depending on OM content and the magnitude of the preferential flow, but we estimate that the resulting impact on our predictions is negligible. Further studies are needed to check our hypothesis by comparing, for example, soils with different degrees of compaction.
It is worth noting that the WRCs obtained in the laboratory cover a large soil moisture range, from saturation to water retention of nearly 1500 kPa. However, the water potential measured by our infiltrometer ranges from 0 to about 6 kPa. This implies that the two different methods are not covering the same range of soil moisture. However, the correlation between the two parameters, the matric potential obtained from our laboratory analysis and the infiltration capacity could be considered as an indirect relationship. A wide range in soil textures and structures must be considered in order to verify the robustness of the approach, especially to validate the predictions of the van Genuchten parameters. As reported in the literature, underestimates of Ks may be expected when the antecedent moisture content is higher than the field capacity [49]. Thus, infiltration experiments should be carried out under dry soil conditions as was the case in this study.
A preliminary knowledge of the clay content of the soil under consideration could help in accurately positioning the first linear curve A (Figure 1) that is assumed to correspond to textural porosity (i.e., matrix flow domain). Although matrix flow domain is controlled by the rearrangement of mineral particles that includes also silt and sand, our results show that clay is the most important fraction controlling the dynamics of flow.
5. Conclusions
In this study, we have presented the preliminary results of a simple infiltrometer developed to estimate key soil hydraulic parameters such as infiltration capacity, saturated hydraulic conductivity, saturated water content and the van Genuchten parameters. It allows predictions at different depths of the soil profile in a rapid, simple and cost-effective way. The main advantage of this device is that it allows the assessment of soil structure contribution on the infiltration capacity.
The validation based on derived data from laboratory and field analyses of forest soil showed that a simple 20 min in situ infiltration measurement and prior knowledge of clay content are sufficient to estimate the key hydraulic parameters. Although the statistical significance parameters of the correlation between the hydraulic parameters and the clay content were good, further investigations are necessary to validate the predictions, especially the predictions of the van Genuchten parameters under various land uses and land covers.
Supplementary Materials
The following supporting information can be downloaded at: https://www.mdpi.com/article/10.3390/w15030467/s1, S1: Experimental design; S2: Method used for the calibration (e.g., Ks) using the relationships between cumulative infiltration and corresponding time obtained by means of our infiltrometer. (See text for explanation.) S3: Statistical performance parameters of the obtained equations provided in Table 2.
Funding
This study was supported by the Swiss Federal Office of the Environment (FOEN) through the environmental technology promotion program, project number: UTF 478.08.14.
Institutional Review Board Statement
Not applicable.
Informed Consent Statement
Not applicable.
Data Availability Statement
Data are available upon request. An Excel software was developed on the basis of the equations provided in Table 2 in this text, allowing the automatic calculations, is also available upon request.
Acknowledgments
I would like to thank Peter Weisskopf and Marliese Sommer from Agroscope (Reckenholz, Switzerland) for their support in the determination of the soil water retention curves.
Conflicts of Interest
The author declares no conflict of interest.
References
- Alaoui, A.; Rogger, M.; Peth, S.; Blöschl, G. Does soil compaction increase floods? A review. J. Hydrol. 2018, 557, 631–642. [Google Scholar] [CrossRef]
- Allen, D.E.; Singh, B.P.; Dalal, R.C. Soil Health Indicators Under Climate Change: A Review of Current Knowledge. In Soil Health and Climate Change, Soil Biology; Singh, B., Cowie, A., Chan, K., Eds.; Springer: Berlin/Heidelberg, Germany, 2011; Volume 29. [Google Scholar] [CrossRef]
- Schwilch, G.; Bestelmeyer, B.; Bunning, S.; Critchley, W.; Herrick, J.; Kellner, K.; Liniger, H.; Nachtergaele, F.; Ritsema, C.; Schuster, B.; et al. Experiences in Monitoring and Assessment of Sustainable Land Management. Land Degrad. Develop. 2011, 22, 214–225. [Google Scholar] [CrossRef]
- Doran, J.W.; Parkin, T.B. Defining and assessing soil quality. In Defining Soil Quality for a Sustainable Environment; Soil Science Society America Special Publication No. 35; Doran, J.W., Coleman, D.C., Bezedick, D.F., Steward, B.A., Eds.; American Society of Agronomy: Madison, WI, USA, 1994; pp. 3–21. [Google Scholar]
- Karlen, D.L.; Mausbach, M.J.; Doran, J.W.; Cline, R.G.; Harris, R.F.; Schuman, G.E. Soil quality: A concept, definition and framework for evaluation. Soil Sci. Soc. Am. J. 1997, 61, 4–10. [Google Scholar] [CrossRef]
- Topp, G.C.; Reynolds, W.D.; Cook, F.J.; Kirby, J.M.; Carter, M.R. Physical attributes of soil quality. In Soil Quality for Crop Production and Ecosystem Health; Gregorich, E.G., Carter, M.R., Eds.; Elsevier: Ottawa, ON, Canada, 1997; Volume 25, pp. 21–58. [Google Scholar]
- Alaoui, A.; Hallama, M.; Bär, R.; Panagea, I.; Bachmann, F.; Pekrun, C.; Fleskens, L.; Kandeler, E.; Hessel, R. A New Framework to Assess Sustainability of Soil Improving Cropping Systems in Europe. Land 2022, 11, 729. [Google Scholar] [CrossRef]
- Andrews, S.S.; Karlen, D.L.; Cambardella, C.A. The soil management assessment framework. Soil Sci. Soc. Am. J. 2004, 68, 1945–1962. [Google Scholar] [CrossRef]
- Velasquez, E.; Lavelle, P.; Andrade, M. GISQ, a multifunctional indicator of soil quality. Soil Biol. Biochem. 2007, 39, 3066–3080. [Google Scholar] [CrossRef]
- Morvan, X.; Saby, N.P.A.; Arrouays, D.; Le Bas, C.; Jones, R.J.A.; Verheijen, F.G.A.; Bellamy, P.H.; Stephens, M.; Kibblewhite, M.G. Soil monitoring in Europe: A review of existing systems and requirements for harmonization. Sci. Total Environ. 2008, 391, 1–12. [Google Scholar] [CrossRef]
- Cécillon, L.; Barthès, B.G.; Gomez, C.; Ertlen, D.; Genot, V.; Hedde, M.; Stevens, A.; Brun, J.J. Assessment and monitoring of soil quality using near-infrared reflectance spectroscopy (NIRS). Eur. J. Soil Sci. 2009, 60, 770–784. [Google Scholar] [CrossRef]
- Reynolds, W.D.; Drury, C.F.; Yang, X.M.; Fox, C.A.; Tan, C.S.; Zhang, T.Q. Land management effects on the near-surface physical quality of a clay loam soil. Soil Till. Res. 2007, 96, 316–330. [Google Scholar] [CrossRef]
- Alaoui, A.; Lipiec, J.; Gerke, H.H. A review of the changes in the soil pore system due to soil deformation: A hydrodynamic perspective. Soil Till. Res. 2011, 115–116, 1–15. [Google Scholar] [CrossRef]
- Lal, R.; Shukla, M.K. Principles of Soil Physics; Marcel Dekker: New York, NY, USA, 2004; p. 716. ISBN 0-8247-5324-0. [Google Scholar]
- Reynolds, W.D.; Drury, C.F.; Tan, C.S.; Fox, C.A.; Yang, X.M. Use of indicators and pore volume-function characteristics to quantify soil physical quality. Geoderma 2009, 152, 252–263. [Google Scholar] [CrossRef]
- Alaoui, A.; Helbling, A. Evaluation of soil compaction using hydrodynamic water content variation: Comparison between compacted and non-compacted soil. Geoderma 2006, 134, 97–108. [Google Scholar] [CrossRef]
- Ward, R.C.; Robinson, M. Principles of Hydrology; McGraw-Hill: London, UK, 1990; 365p. [Google Scholar]
- Angulo-Jaramillo, R.; Vandervaere, J.; Roulier, S.; Thony, J.; Gaudet, J.; Vaucklin, M. Field measurement of soil surface hydraulic properties by disc and ring infiltrometers. A review and recent developments. Soil Till. Res. 2000, 55, 1–29. [Google Scholar] [CrossRef]
- Lassabatère, L.; Angulo-Jaramillo, R.; Soria Ugalde, J.M.; Cuenca, R.; Braud, I.; Haverkamp, R. Beerkan estimation of soil transfer parameters through infiltration experiments—BEST. Soil Sci. Soc. Am. J. 2006, 70, 521–532. [Google Scholar] [CrossRef]
- Bagarello, V.; Di Stefano, C.; Iovino, M.; Sgroi, A. Using a transient infiltrometric technique for intensively sampling field-saturated hydraulic conductivity of a clay soil in two runoff plots. Hydrol. Process. 2012, 27, 3415–3423. [Google Scholar] [CrossRef]
- Gonzalez-Sosa, E.; Braud, I.; Dehotin, J.; Lassabatere, L.; Angulo-Jaramillo, R.; Lagouy, M.; Branger, F.; Jacqueminet, C.; Kermadi, S.; Michel, K. Impact of land use on the hydraulic properties of the topsoil in a small French catchment. Hydrol. Process. 2010, 24, 2382–2399. [Google Scholar] [CrossRef]
- Mubarak, I.; Angulo-Jaramillo, R.; Mailhol, J.C.; Ruelle, P.; Khaledian, M.; Vauclin, M. Spatial analysis of soil surface hydraulic properties: Is infiltration method dependent? Agric. Water Manag. 2010, 97, 1517–1526. [Google Scholar] [CrossRef]
- Yilmaz, D.; Lassabatere, L.; Angulo-Jaramillo, R.; Deneele, D.; Legret, M. Hydrodynamic characterization of basic oxygen furnace slag through an adapted best method. Vadose Zone J. 2010, 9, 107–116. [Google Scholar] [CrossRef]
- Bagarello, V.; Iovino, M. Testing the BEST procedure to estimate the soil water retention curve. Geoderma 2012, 187–188, 67–76. [Google Scholar] [CrossRef]
- Nasta, P.; Lassabatere, L.; Kandelous, M.M.; Šimunek, J.; Angulo-Jaramillo, R. Analysis of the role of tortuosity and infiltration constants in the Beerkan method. Soil Sci. Soc. Am. J. 2012, 76, 1999–2005. [Google Scholar] [CrossRef]
- Ghavidelfar, S.; Shamseldin, A.Y.; Melville, B.W. Estimation of soil hydraulic properties and their uncertainty through the Beerkan infiltration experiment. Hydrol. Process. 2015, 29, 3699–3713. [Google Scholar] [CrossRef]
- Xu, X.; Kiely, G.; Lewis, C. Estimation and analysis of soil hydraulic properties through infiltration experiments: Comparison of BEST and DL fitting methods. Soil Use Manag. 2009, 25, 354–361. [Google Scholar] [CrossRef]
- Lassabatere, L.; Angulo-Jaramillo, R.; Goutaland, D.; Letellier Gaudet, J.P.L.; Winiarski, T.; Delolme, C. Effect of the settlement of sediments on water infiltration in two urban infiltration basins. Geoderma 2010, 156, 316–325. [Google Scholar] [CrossRef]
- Xu, X.; Lewis, C.; Liu, W.; Albertson, J.D.; Kiely, G. Analysis of singlering infiltrometer data for soil hydraulic properties estimation: Comparison of BEST and Wu methods. Agric. Water Manag. 2012, 107, 34–41. [Google Scholar] [CrossRef]
- Reynolds, W.D.; Elrick, D.E. A method for simultaneous in situ measurement in the vadose zone of field-saturated hydraulic conductivity, sorptivity and the conductivity- pressure head relationship. Ground Water Monit. Rev. 1986, 6, 84–95. [Google Scholar] [CrossRef]
- Elrick, D.E.; Reynolds, W.D. Methods for analyzing constant-head well permeameter data. Soil Sci. Soc. Am. J. 1992, 56, 320–323. [Google Scholar] [CrossRef]
- Constantz, J.; Herkelrath, W.N.; Murphy, F. Air encapsulation during infiltration. Soil Sci. Soc. Am. J. 1988, 52, 10–16. [Google Scholar] [CrossRef]
- Rodger, H.A. Tracking Changes in Hydraulic Conductivity of Soil Reclamation Covers with The Use of Air Permeability Measurements. Ph.D. Thesis, Department of Civil Engineering, University of Saskatechewan, Saskatoon, SK, Canada, 2008; p. 116. [Google Scholar]
- Bouwer, H. Intake rate: Cylinder infiltrometer. In Methods of Soil Analysis; ASA Monograph 9; Klute, A., Ed.; ASA: Madison, WI, USA, 1986; pp. 825–843. [Google Scholar]
- ASTM D3385-18; Standard Test Method for Infiltration Rate of Soils in Field Using Double-Ring Infiltrometer. ASTM International: West Conshohocken, PA, USA, 2003.
- Gregory, J.H.; Dukes, M.D.; Miller, G.L.; Jones, P.H. Analysis of double-ring infiltration techniques and development of a simple automatic water delivery system. Appl. Turfgrass Sci. 2005, 2, 1–7. [Google Scholar] [CrossRef]
- Van Genuchten, M.T. A closed-form equation for predicting the hydraulic conductivity of unsaturated soils. Soil Sci. Soc. Am. J. 1980, 44, 892–898. [Google Scholar] [CrossRef]
- Konen, M.E.; Jacobs, P.M.; Lee Burras, C.; Talaga, B.J.; Mason, J.A. Equations for predicting soil organic carbon using loss-on-ignition for north central U.S. Soils. Soil Sci. Soc. Am. J. 2002, 66, 1878–1881. [Google Scholar] [CrossRef]
- Klute, A.; Dirksen, C. Hydraulic conductivity and diffusivity: Laboratory methods. In Methods of Soil Analysis: Part 1. Physical and Mineralogical Methods, 2nd ed.; Monograph, Klute, A., Eds.; American Society of Agronomy: Madisson, WI, USA, 1986; Volume 9, pp. 687–734. [Google Scholar]
- van Genuchten, M.T.; Lesch, S.M.; Yates, S.R. The RETC Code for Quantifying the Hydraulic Functions of Unsaturated Soils; Version 1.0; U.S. Salinity Laboratory, USDA: Riverside, CA, USA, 1991.
- FAO; UNESCO. Soil Map of the World, Vol 60, Revised Legend. Soil Map of the World; Food and Agriculture Organization of the United Nations (FAO): Rome, Italy, 1988. [Google Scholar]
- Lange, B.; Germann, P.F.; Lüscher, P. Greater abundance of Fagus sylvatica in coniferous flood protection forests due to climate change: Impact of modified root densities on infiltration. Eur. J. Forest Res. 2013, 132, 151. [Google Scholar] [CrossRef]
- Richard, F.; Lüscher, P. Physikalische Eigenschaften von Böden der Schweiz; Eidg. Anstalt für das Forstliche Versuchswesen: Birmensdorf, Switzerland, 1987; Volume 4. [Google Scholar]
- Oades, J.M. The role of biology in the formation, stabilization and degradation of soil structure. Geoderma 1993, 56, 377–400. [Google Scholar] [CrossRef]
- Hamblin, A.P. The influence of soil structure on water movement, crop root growth, and water uptake. Adv. Agron. 1985, 38, 95–158. [Google Scholar]
- Cass, A.; Hansen, D.; Dowley, A. Grape performance and soil conditions. In Sustainable Viticultural Production: Optimising Soil Resources; GWRDC Final Report: CRS 95/1; Cass, A., Ed.; Alfred Cass & Associates: Calistoga, CA, USA, 2002; pp. 5–15. [Google Scholar]
- Vogeler, I.; Horn, R.; Wetzel, H.; Kruemmelbein, J. Tillage effects on soil strength and solute transport. Soil Till. Res. 2006, 88, 193–204. [Google Scholar] [CrossRef]
- Alaoui, A. Modelling susceptibility of grassland soil to macropore flow. J. Hydrol. 2015, 525, 536–546. [Google Scholar] [CrossRef]
- Meiers, G.P. The Use of Field Measurements of Hydraulic Conductivity to Characterize the Performance of Reclamation Soil Covers with Time; M. Eng. Report; University of Saskatchewan: Saskatoon, SK, Canada, 2002. [Google Scholar]
Disclaimer/Publisher’s Note: The statements, opinions and data contained in all publications are solely those of the individual author(s) and contributor(s) and not of MDPI and/or the editor(s). MDPI and/or the editor(s) disclaim responsibility for any injury to people or property resulting from any ideas, methods, instructions or products referred to in the content. |
© 2023 by the author. Licensee MDPI, Basel, Switzerland. This article is an open access article distributed under the terms and conditions of the Creative Commons Attribution (CC BY) license (https://creativecommons.org/licenses/by/4.0/).

