Article

Hydrodynamic Decontamination of Groundwater and Soils Using ZVI

by
David D. J. Antia
DCA Consultants Ltd., The Bungalow, Castleton Farm, Falkirk FK2 8SD, UK
Water 2023, 15(3), 540; https://doi.org/10.3390/w15030540
Submission received: 6 December 2022 / Revised: 19 January 2023 / Accepted: 25 January 2023 / Published: 29 January 2023
(This article belongs to the Special Issue Sustainable Remediation Using Metallic Iron: Quo Vadis?)

Abstract

:
Polluted aquifers can be decontaminated using either ZVI (zero valent iron) permeable reactive barriers (PRB) or injected ZVI. The placement of ZVI within the aquifer may take several decades to remediate the contaminant plume. Remediation is further complicated by ZVI acting as an adsorbent to remove some pollutants, while for other pollutants, it acts as a remediation catalyst. This study investigates an alternative aquifer decontamination approach to PRB construction or n-Fe0 injection. The alternative approach reconstructs the potentiometric surface of the aquifer containing the contaminant. This reconstruction confines the contaminant plume to a stationary, doughnut shaped hydrodynamic mound. Contaminated water from the mound is abstracted, decontaminated, and then reinjected, until all the water confined within the mound is decontaminated. At this point, the decontaminated mound is allowed to dissipate into the surrounding aquifer. This approach is evaluated for potential use in treating the following: (i) immiscible liquid plumes; (ii) miscible contaminant and ionic solute plumes; (iii) naturally contaminated aquifers and soils; and (iv) contaminated or salinized soils. The results indicate that this approach, when compared with the PRB or injection approach, may accelerate the decontamination, while reducing the overall amount of ZVI required.

1. Introduction

Over the last three decades, permeable reactive barriers (PRBs) containing zero valent iron (Fe0, ZVI) [1,2,3,4,5,6,7] and injected n-Fe0 [8,9,10] have been used to decontaminate (confined and unconfined) aquifers and soils. This technology is addressed by >1000 patents and patent applications, together with >10,000 academic publications (e.g., references [1,2,3,4,5,6,7,8,9,10]). A PRB places a reactive permeable wall or barrier containing Fe0 into an aquifer, in order to intercept the flowing, contaminated water plume. The injected n-Fe0 approach either creates a PRB by n-Fe0 injection, or is associated with the direct injection of n-Fe0 into the contaminated plume or soil [11,12,13,14].
The initial Fe0 PRB patent (US5266213) focused on the treatment of organo-halides. Since then, the commercial process has been adapted to include decontamination of a variety of organic pollutants (e.g., KR100476115B1; KR20060027634A; US5611936; US5616253; US575389); and a variety of inorganic pollutants (e.g., As (US6132623; US6387276); Cd (CN105502671B); Pb (CN105502671B)). The initial patents (e.g., US5266213) constructed the PRB as a vertical barrier (0.3 to 1.5 m wide) that extended from the ground surface to the base of the contaminated aquifer. The PRB was filled with Fe0 particles. These barriers may be straight or funneled. In addition, they may include sections that are non-reactive.
Some more recent patents have created a PRB using boreholes to target deeper aquifers, unconsolidated aquifers, and soils. Five groups of borehole approaches have been adopted. The first approach (e.g., US5975798) constructs a Fe0 slurry, which is then combined with a pressurizing gas for delivery into the subsurface (by injection). The aquifer can be fracked before or during this process. The second approach (e.g., US8210773; US8366350; US85960351; US9061333; US9943893) places one or more horizontal wells within the aquifer. These are then filled with Fe0 to create a PRB. A third approach (e.g., US6664298; US7037946; US7008964; US7271199; US7582682; US8062442; US8163972) directly injects a n-Fe0–oil–water-emulsion-slurry into the aquifer or into the contaminant plume to create a barrier, or zone of remediation. A fourth approach (e.g., US5641020; US5733067; US7179381) hydraulically fractures the contaminated aquifer and uses the Fe0 as a reactive proppant to effect remediation. A fifth approach (e.g., US 5857810) injects a colloidal suspension of Fe0 into the aquifer or soil to create a PRB. This list of variants is not exclusive. The decontamination rates may be enhanced by using the PRB as an electrode, or by constructing it to include or use electrodes to facilitate electrolytic decontamination (e.g., US5868941; CN1899717B; US8968550B2; US10500618B2). A number of different patent specifications (e.g., US5833388; US5975800; US6207114; US9884771) address the hydrodynamic design of a PRB in order to focus the fluid flow within the aquifer towards a PRB, through the use of nonreactive barriers. The selection of an installed PRB, or n-Fe0 injection, to address a contaminant problem is a commercial decision. This decision will consider the aquifer properties, the location, and the contaminant present in the water.

1.1. Fe0 Particle Size

Three sizes of Fe0 are used for water remediation. They are as follows: n-Fe0 (particle size = 1–1000 nm); m-Fe0 (particle size = 1000 nm–1 mm); and Fe0 (particle size = 1 mm–200 mm). From a practical perspective, only n-Fe0 (particle size 1 = 100 nm) or m-Fe0 is suitable for injection into an aquifer as part of a water-ZVI slurry. Fe0 (0.5 to 5 mm) is suitable as a reactive proppant in some fracked boreholes. Fe0 and m-Fe0 (and n-Fe0 precipitated onto inert supports in the micron-millimeter particle size) are used in PRBs. The underlying chemical assumption for the PRB decontamination approach is that the remediation reaction occurs on the particle surface. If there are x remediation sites m−2 on the surface of a particle of Fe0, then it follows that, by decreasing the particle size, or by increasing the degree of irregularity on the particle surface, it is possible to increase the surface area (as, m2) per unit weight (g) of Fe0. This creates a natural assumption that particle reactivity increases with increasing particle surface area (decreasing particle size).
Oxidation of the particles’ surface by water converts the Fe0 to FexOyHz (rust). The rust crust, comprising FexOyHz species, tends to be porous (Figure 1). It has a lower density than Fe0. This density can approach 1 g cm−3 in more hydrated and porous forms. The surface area, associated the FexOyHz species, is typically within the range 30 to 800 m2 g−1. If Fe0 reactivity is solely a function of as, then it would be reasonable to expect the Fe0 to be less reactive than the FexOyHz. While it is true that n-Fe0 is more reactive than Fe0, it is not always true that FexOyHz is more reactive than n-/m-/Fe0. This is because different redox (Eh, pH) conditions are present on the Fe0 surface, within the FexOyHz and at the FexOyHz–water interface, including hydration shells (Figure 1).
In an aqueous environment, at any specific temperature and pressure, the redox conditions define the reaction quotient for each pollutant and the range of product outcomes that can occur (i.e., the environment is Faradaic or Nernstian). A further complication is that some pollutants form precipitants, which adhere to the Fe0 particle surface. When the precipitant is a result of a Fe–pollutant reaction, this will reduce the number of active sites available for pollutant removal, and will reduce the reactivity.

1.2. Fe0 Catalysis

Fe0 catalyzes the redox reduction of H2O: (H2O = OH + H+; Log(OH) = −14 − pH). This results in the water pH increasing (relative to the water body) at the Fe0–water interface (within its hydration shell). Chemical diffusion between the Fe0 hydration shell and the water body results in the pH of the water body increasing with time. However, the pH of the water body is always less than the pH of the Fe0 hydration shell. The FexOyHz corrosion crust (Figure 1) tends to remove the produced OH ions. This results in a reduction in pH. Therefore, the pH of the hydration shell that is associated with the FexOyHz corrosion crust, will be less than the pH associated with the Fe0 hydration shell at the Fe0: FexOyHz interface (Figure 1).
The Eh (V) of the Fe0 hydration shell varies with pH. In acidic water, the Fe0 corrosion reaction at the Fe0:water interface within the hydration shell is as follows: Fe0 = Fe2+ + 2e (Eh, V = −0.44 + 0.0295Log(Fe2+)). In alkaline water, the reaction within the Fe0 hydration shell is as follows: Fe0 + 2H2O = Fe(OH)2 + 2H+ + 2e (Eh, V = −0.047 – 0.0591 pH). At the Eh within the Fe0 hydration shell, a proportion of the H+ will form H2 (H2 = 2H+ + 2e; Eh = −0.0591 pH–0.0295 Log(pH2)). From this brief discussion, it is evident that the principal controls in the ionic reaction quotient for a dissolved contaminant are the Eh and pH. Obviously, some ionic species will interact directly with Fe0 to form a chemical precipitate or an adsorbed species. Contaminant removal by a direct reaction with Fe0, or by adsorption onto Fe0, will normally result in a maximum of 20–300 mg of contaminant removed g−1 Fe0. By way of contrast, redox remediation has been demonstrated to remove >1000 g of contaminant g−1 Fe0. These concepts are addressed further in the Appendix A, Appendix B, Appendix C, Appendix D, Appendix E, Appendix F, Appendix G, Appendix H and Appendix I.
This study focuses on the redox removal of contaminants. This requires a modification of the aquifer’s pH and Eh to achieve the required remediation level. pH = −Log[H3O+] = −Log[H+], where a hydronium ion molar concentration of 1 × 10⁻⁸ provides a pH of −Log [1 × 10⁻⁸] = 8. Eh is the potential (volts, V) of the water determined using a standard hydrogen electrode. The Standard EMF (electromotive force) ΔEo of an ideal ionic reaction (e.g., Fe0 = Fe2+ + 2e) is determined at a pH of 0. The Eh measurement adjusts ΔEo for pH, temperature, the molar reaction quotients, and for the competing reactions in the water. Eh can be measured directly, using a standard hydrogen electrode (SHE). Eh is most commonly measured indirectly, using an ORP (oxidation reduction potential) meter, which has been calibrated to the standard hydrogen electrode. The linear calibration between the ORP and the Eh is normally undertaken at pH 4 and 7, using quinhydrone reference solutions.

1.3. Contaminant Plumes

Contaminant plumes, within an aquifer or soil, fall into three basic groups: (i) historical anthropogenic contamination, which needs to be removed; (ii) ongoing pollution, associated with continuing anthropogenic activity. PRB’s which are associated with continuing anthropogenic activity, are designed to have a long life, of perhaps 20–50 years; and (iii) natural contamination of the aquifer with heavy metals, (including As, Se), NaCl or another contaminant.
This study provides an alternative solution (to a PRB, or aquifer n-Fe0 injection) for the following: (i) the decontamination of contaminant plumes, resulting from historical anthropogenic activity; (ii) the periodic decontamination of contaminant plumes, resulting from continuing anthropogenic activity; (iii) the decontamination of water, containing naturally acquired pollutants (e.g., As, Se, NaCl, etc.).

1.4. Permeability Reduction

The PRB remediation approach permanently reduces the aquifer porosity and permeability [4,5,15,16,17]. This reduction occurs within the treatment areas (PRB, injected zone and the adjacent sediments). They permanently leave FexOyHz polymers and their related minerals within the water [16,17]. They also permanently increase the pH (and decrease the Eh) of the water within the vicinity of the Fe0 and polymers [18]. These polymers act as adsorption sinks for many cations and anions within the water [19,20,21,22,23,24,25]. These remediation approaches are costly [17] and may take decades to completely, or partially, decontaminate the aquifer.
ZVI can reduce the permeability of a PRB (and its flow rates) by >2 orders of magnitude within 2 months of installation. Consequently, a PRB with an initial permeability of 10−8 m3 m−2 s−1 Pa−1, may, after 2 months, have a permeability of 10−10 m3 m−2 s−1 Pa−1. A PRB with a design expectation of treating x m3 d−1, would, after 60 days, have a reduced flow rate through the PRB of 0.01 × x m3 d−1. This would increase the time required to treat the contaminant plume by a factor of 100. This is not a new ZVI operational problem. In the commercial surface-based reactors, the problem is normally addressed through the use of a revolving drum or moving bed reactors (e.g., US439588; US439589; US439590; US443737; US458887; US458946; US462537; US513536; US513686; US559816; US559817; US563811), slurry/fluidized bed reactors (e.g., US2086753; US6533499), high porosity fixed bed reactors (e.g., US5803174; US6787034), or diffusion reactors (e.g., GB2520775A). In PRBs, the permeability issue is sometimes addressed by the dilution of the ZVI with inert material (e.g., US7347647; US20210213498A1), through the use of emulsifiers (e.g., US6664298; US7037946; US7008964; US7271199; US7582682; US8062442; US8163972; USRE40448E1), or through the use of ZVI support systems (e.g., US6787034; US7670082; US8262318). These permeability reduction concepts are addressed further in the Appendix A, Appendix B, Appendix C, Appendix D, Appendix E, Appendix F, Appendix G, Appendix H and Appendix I.

1.5. Modelling

It is possible to model the expected hydrological and chemical performance of a PRB prior to installation [26,27,28,29]. However, issues such as Fe0 corrosion (Figure 1), PRB by-pass by flowing water within the aquifer, reactivity loss with time, and both PRB and aquifer permeability loss over time, can lead to the conclusion that, for some applications and locations, the installation of a PRB is a commercially inefficient use of the Fe0. In most, but not all, ZVI reactors and ZVI remediation applications, the ZVI is reusable. Therefore, a single charge of ZVI may be able to process >100 volumes of water. A typical PRB may contain 500–1000 t of Fe0, and may process 50 to 1000 m3 of water over its life time, Without Fe0 recycle, in a surface-based facility, 1000 t of Fe0 may be able to process 33,000 m3. With Fe0 recycle, the 1000 t of Fe0 charge may be able to process >3,000,000 m3. Therefore, a commercial argument can be made, to the effect that a more efficient use of the ZVI would be to undertake the aquifer remediation in a surface-based reactor. This is the approach adopted in this study.

1.5.1. Contaminant Plume Availability

Globally, there are over 1 million sites that have been contaminated with toxic metals, chlorinated organics, nitro-organics, hydrocarbons, petrochemicals, agricultural chemicals, industrial chemicals, mining waste water, associated water produced with hydrocarbon extraction, flowback water associated with oil/gas extraction from shales, and foul (sewage) waste [26]. This is in addition to sites where the aquifer is naturally polluted with As, Se, heavy metals, nitrates and chlorides.

1.5.2. ZVI Operation

ZVI, when placed in water, corrodes [30]. The corrosion products are a mixture of ions and polymers (Fe0:Fe(a,b,c) [31,32,33,34] (Figure 1). Abrasion of the iron particles can release the corrosion products into the water as n-Fe(a,b,c) polymer colloids. A typical released polymer is spherical, has a 7% hydration shell, and may have a diameter of between 6 and 11 nm [35]. The polymers are degraded in acid to release water (US10913665B2), and are preferentially formed in alkaline water [36].
The acid treatment of ZVI, prior to use, has the following effects: (i) it reduces the water body Eh, which is associated with a specific batch of ZVI, relative to the control water body Eh, using the unacidified ZVI charge (US10913665B2); (ii) it increases the effectiveness of the ZVI when measured as the cumulative H2 (moles) released g−1 Fe0 (US10913665B2); and (iii) it maintains a similar water body pH to the control water body pH, using the unacidified ZVI charge. (US10913665B2). These observations, allow the relative efficiency of ZVI acidification to be assessed using a pH-specific Eh parameter (PSE,V), which is defined as (US10913665B2):
PSE, V = Eh/pH,
The PSE value determined for acidified ZVI is smaller than the PSE value determined for unacidified ZVI, and can be negative (US10913665B2). The rate of contaminant removal and the total amount of contaminant removed by a ZVI charge increases with a decreasing PSE (US10913665B2).

1.5.3. ZVI Definition

The term ZVI is used in this study to refer to Fe0 and its associated corrosion products and polymers (Figure 1). The ZVI interacts with pollutants (cations and anions) within the water by reaction, adsorption and catalysis.
The adsorption and reaction models for the ZVI decontamination of water consider that ZVI becomes ineffective once the available reaction or adsorption sites are removed. Adsorption, reaction and corrosion (where the corrosion removes active sites) progressively reduce the effectiveness of ZVI with time [37,38]. Consequently, the amount of ZVI used in a PRB or an n-Fe0 injection is frequently substantially in excess of the optimal charge required. PRB and n-Fe0 injection provide a tried, proven, and relatively low technical risk approach, which can be used to remediate an aquifer.

1.5.4. Significance of Iron Bacteria

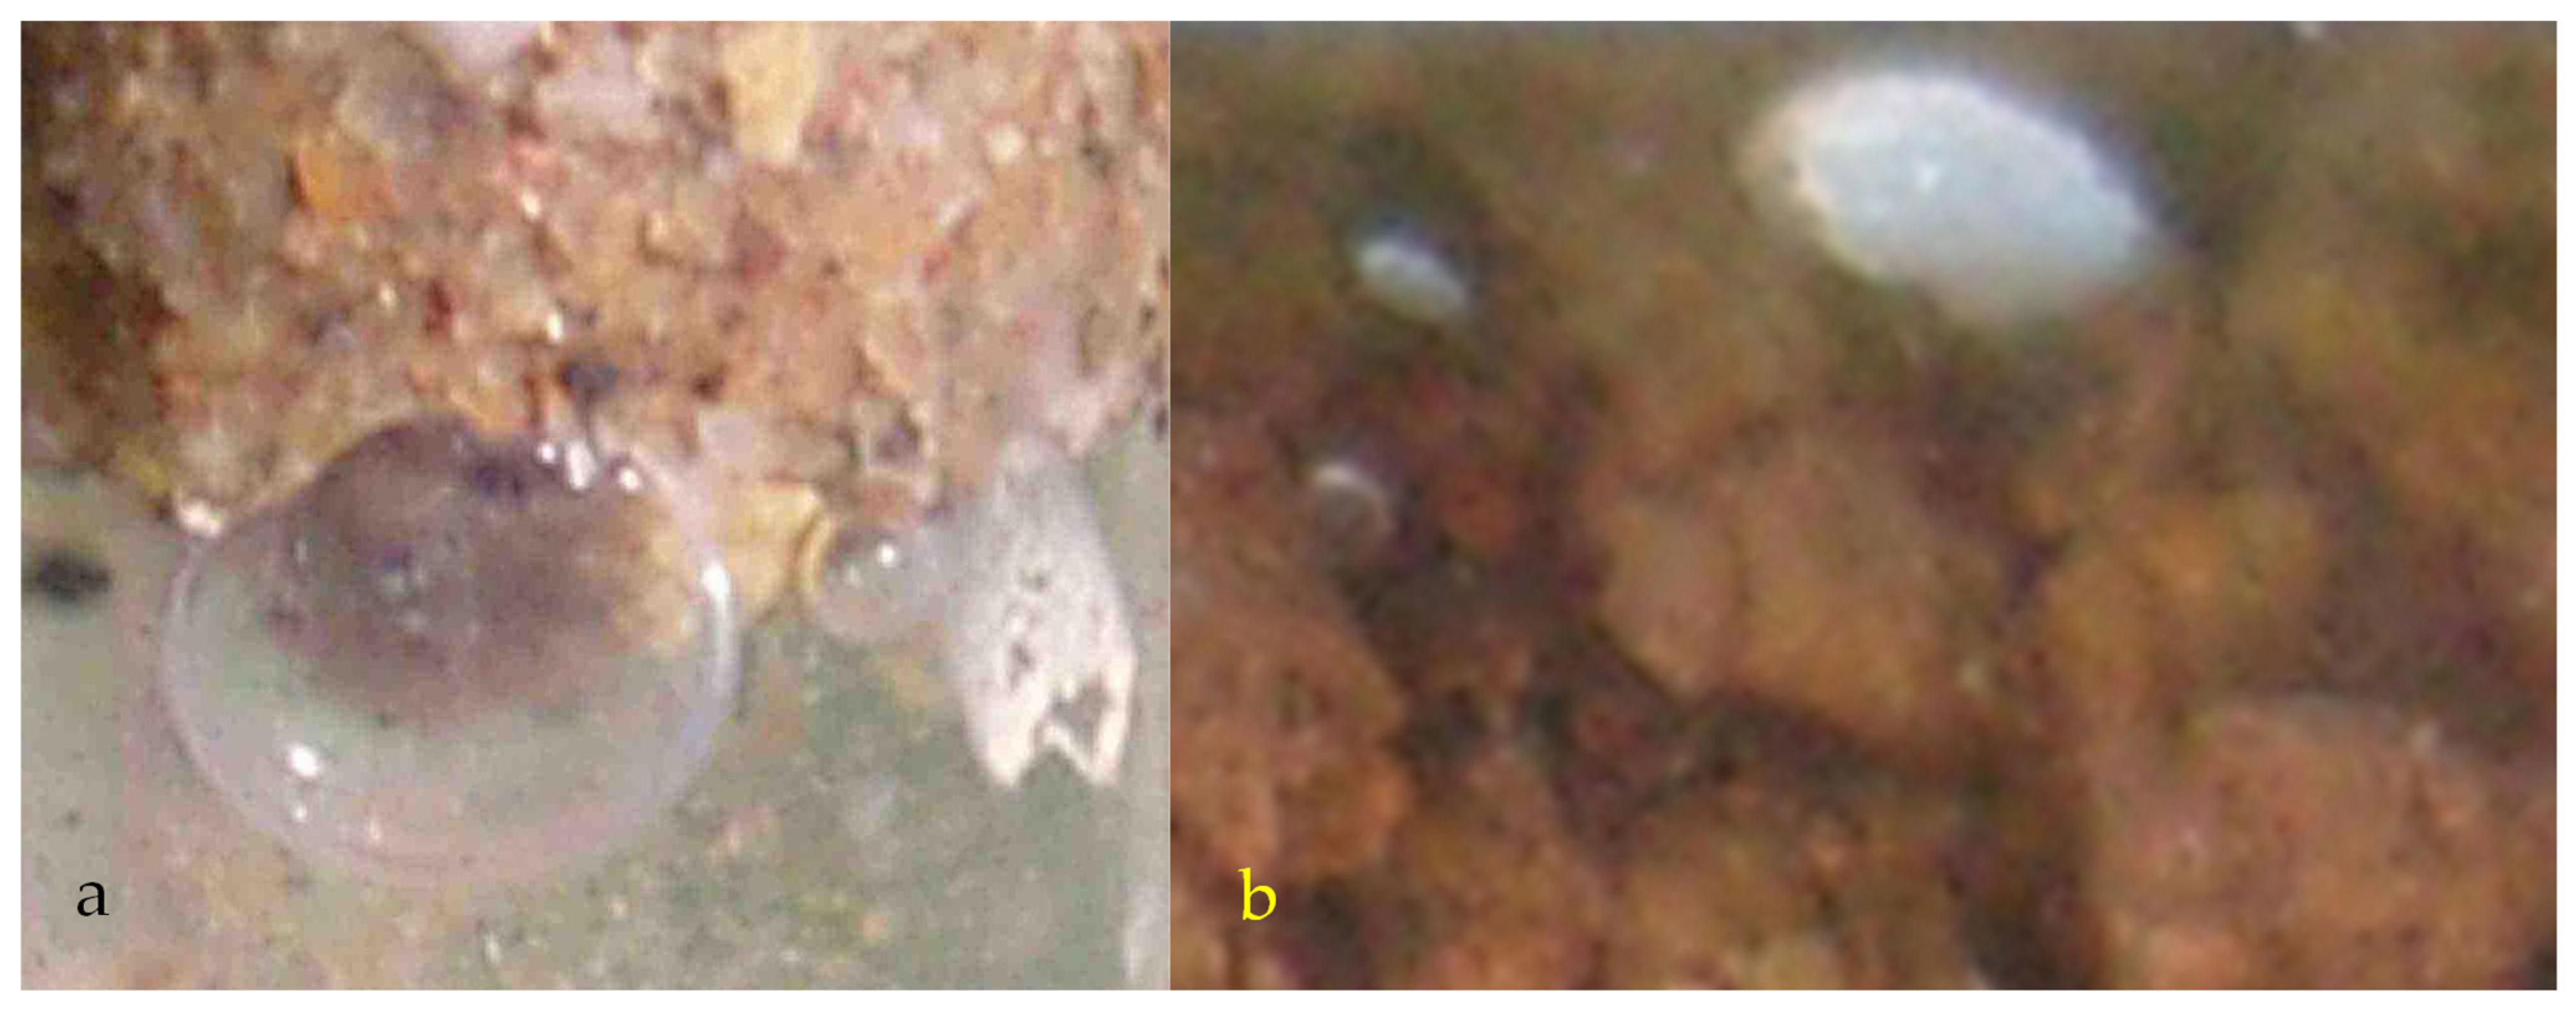
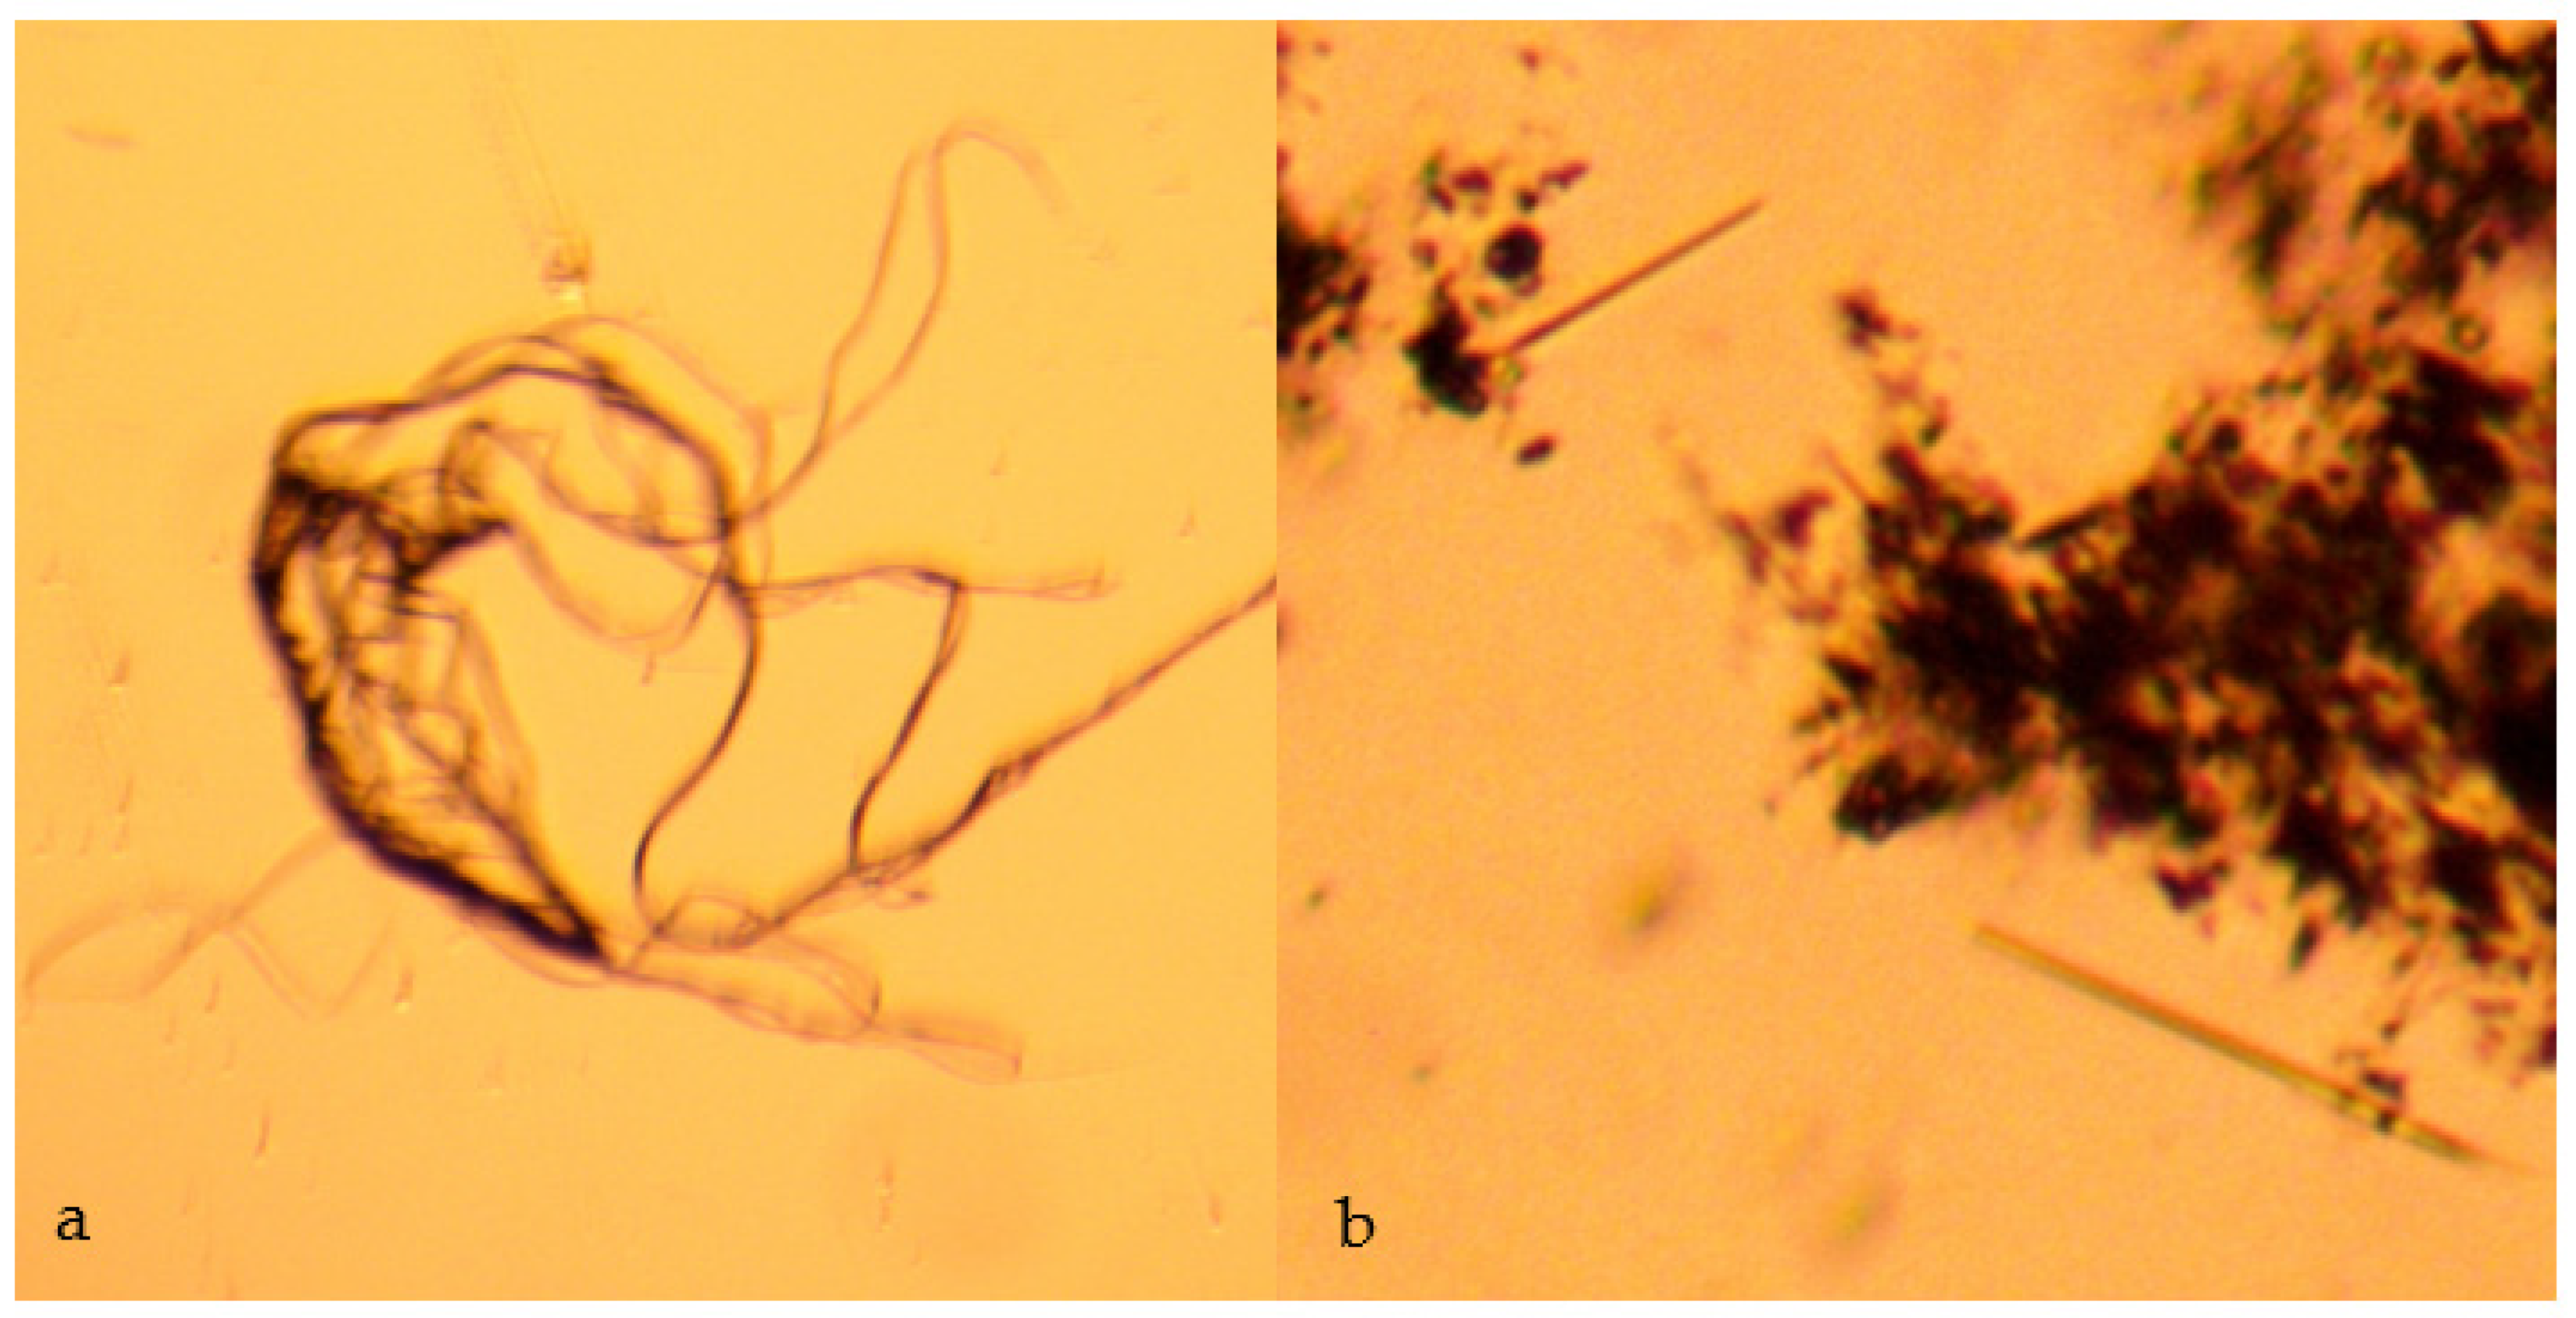
Some biological experiments have demonstrated that, if the PRB or the injected n-Fe0 is contaminated with Shewanella putrefacients, then the aging of the Fe0 (Figure 1) can be partially reversed; this allows an in situ reactivation of the Fe0 to occur [39,40]. All PRBs and zones of Fe0 injection contain iron bacteria. These bacteria use the Fe2+ ions present within the pore spaces of the PRB to form an external shell of Fe(OH)3 or FeOOH (Figure 2). Once the bacteria dies, these shells (exoskeletons) form high permeability tubes within the corrosion crust. In these PRBs, the normal abiogenic decline in the particulate ZVI permeability with time may be partially offset by the development of residual, high permeability iron bacteria exoskeletons (Figure 2). These may extend through the corrosion crusts of the Fe0 (Figure 1).

1.6. Aquifer Contaminants

Aquifer contaminants fall into five broad categories:
  • Group 1: anthropogenic, immiscible fluid plumes within a soil or aquifer (Figure A1a), e.g., oils [41,42,43,44,45,46,47,48,49,50];
  • Group 2: anthropogenic, miscible and soluble contaminant fluid plumes (Figure A1b), e.g., organo-halides, organo-nitrates, explosive residues, pesticides, herbicides, dyes, etc. [23,49,50,51,52,53,54];
  • Group 3: seawater incursion of saline water into an aquifer (Figure A1c) [55,56,57]. This can be associated with anthropogenic aquifer depletion in coastal areas [56,57];
  • Group 4: dispersed naturally sourced contaminants (Figure A1c), e.g., As [58,59,60], Se [61,62,63,64], NaCl, etc., within a confined aquifer, unconfined aquifer, or a soil;
  • Group 5: soil contaminated by salinization associated with agricultural activity or natural processes, soils contaminated by chemicals and left by chemical spills, and chemicals in vertically migrating groundwater mounds in areas of anthropogenic activity [65,66,67].

1.7. Reconstruction of the Aquifer Potentiometric Surface

Groups 1, 2 and 3 plumes, and their plume boundaries, migrate with time within the aquifer. Their migration rates and the direction of migration are controlled by the potentiometric surface within the aquifer, and by the aquifer permeability and recharge/discharge point sources that affect the aquifer.
The potentiometric surface within an aquifer is relatively easy to reconstruct [68,69,70,71]. Fluid will flow from a point of high (natural or artificial) potential (e.g., high pressure, or head), to a point of low (natural, or artificial) potential (e.g., low pressure or head) [68].
If the fluids within an aquifer are flowing in a direction x, the insertion of a ring of recharge points (injection wells, infiltration devices) around the plume can be used to create a mound of stationary fluid within the aquifer [68] (Figure A1). If the center of the mound contains an abstraction well and the abstracted water is returned to the injection wells, then the ring of recharge points will surround a stationary hydrodynamic mound, or plume, of fluid. This stationary plume of fluid will have little, or no, effective interaction with the surrounding water body [68] (Figure A1).
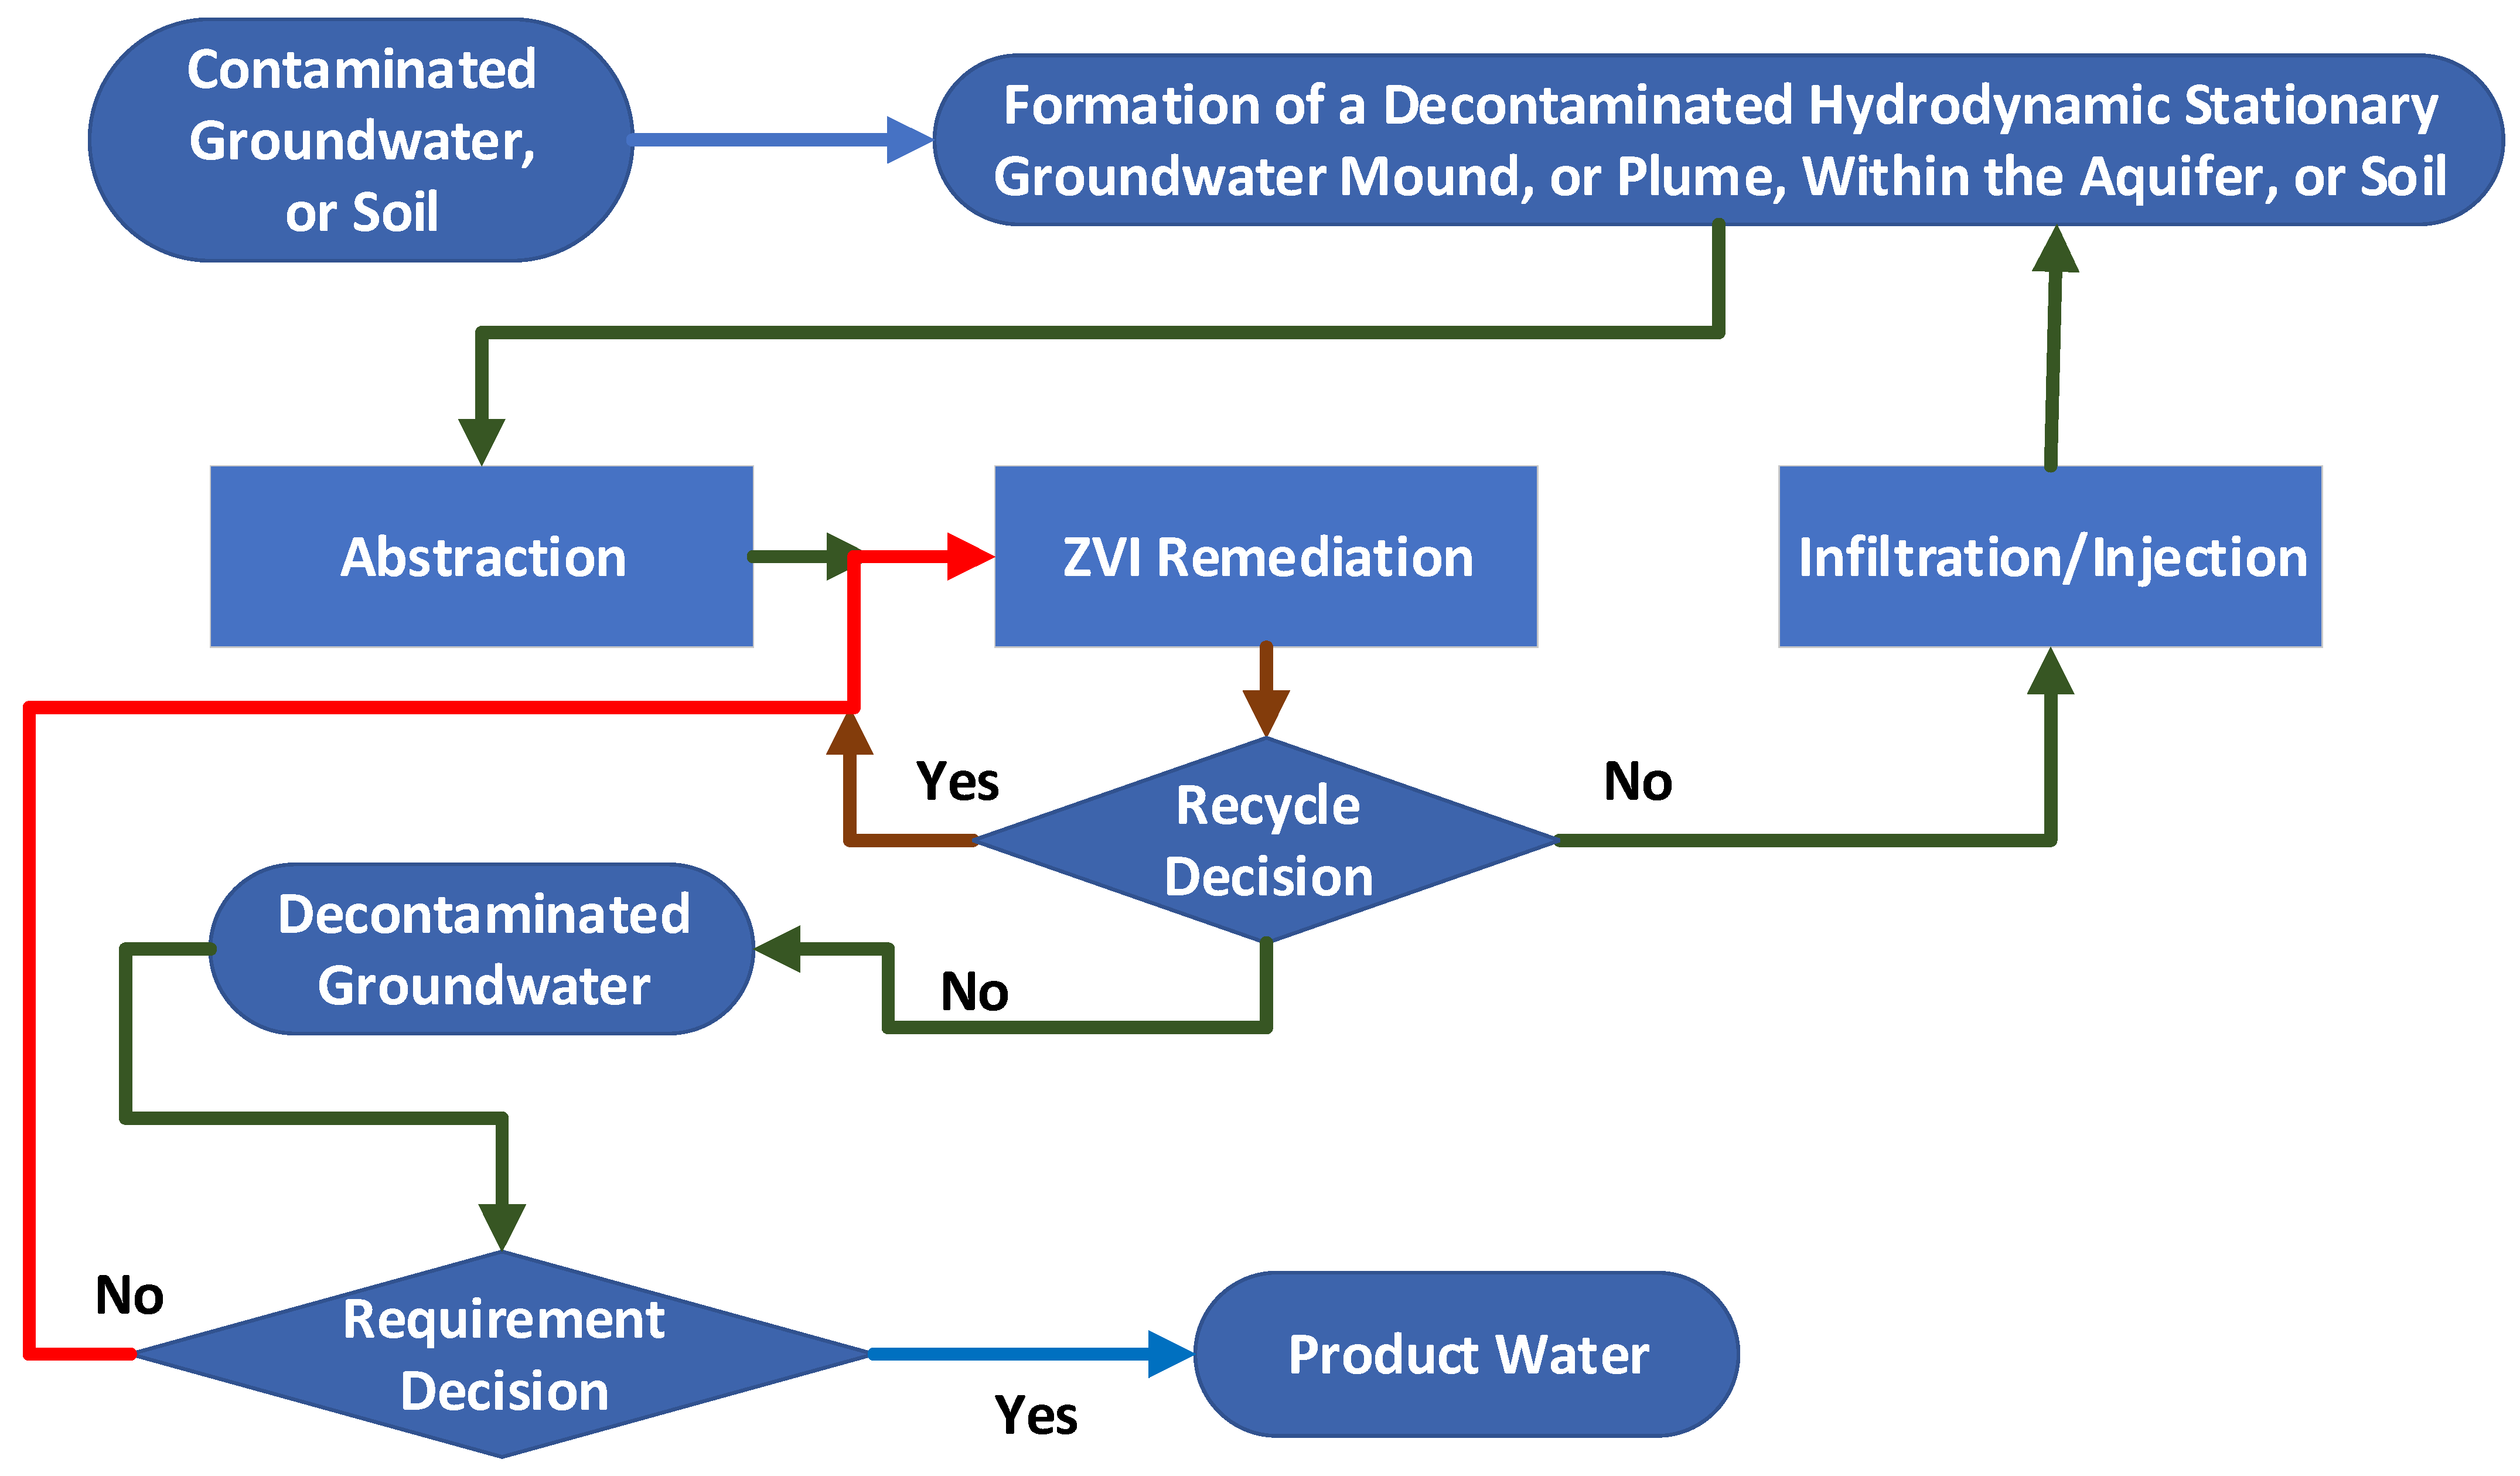
While the detailed hydrology of the stationary plume is complex and site specific, the general process design of the stationary plume is relatively simple. Leakage into, and out of, a plume, is a function of abstraction and injection rates. If the abstracted water is passed through a reactor containing ZVI before being reinjected, then it will be possible to decontaminate the constructed stationary plume in a controlled manner. This can be achieved within a definable and predictable time frame, using a defined amount of ZVI.

1.7.1. Group 1 and 2 Plumes

If the original plume was a Group 1 plume (e.g., gasoline) or a Group 2 plume (e.g., trichloroethylene, dissolved heavy metal salts, dissolved radionuclides, dissolved organic pollutants, etc.), then following decontamination, the stationary plume can be allowed to dissipate into the wider aquifer environment. This dissipation requires the abstraction and injection operations to cease. Site remediation will require the plugging of the injection and abstraction wells, coupled with a removal of their well heads.

1.7.2. Seawater Incursion

Group 3 seawater incursion is associated with an aquifer that has both freshwater recharge and seawater recharge at different points along its length. The potential associated with seawater recharge is controlled by the sea level, and will cyclically vary during the day. The magnitude of the daily cycle variation will vary during a year. The magnitude of this variation is a function of the local tidal range. In most inland freshwater aquifers, the initial water table elevation is above that of sea level. Anthropogenic aquifer depletion reconstructs the potentiometric surface within the aquifer to a negative slope from the sea towards the land within the depleted area (i.e., the net flow is from the sea towards the land). This results in seawater incursion into the aquifer. The reconstruction of the potentiometric surface in this area, through the creation of stationary plumes, may allow the incursion to be stabilized or reversed, and allow the salinized section of the aquifer to be desalinated.

1.7.3. Group 4 Aquifers

The water contained within Group 4 aquifers, containing NaCl, As, Se, etc., can be decontaminated through the creation of hydrodynamic stationary plumes. Once the plume has been decontaminated, it can be used to provide a source of decontaminated water for anthropogenic use.

1.7.4. Group 5 Contaminated Soils

The soils, located below areas of anthropogenic activity, may become contaminated with the organic chemicals, herbicides, inorganic chemicals, sewage, pesticides, metals, nitrates, oils, or salts, that are associated with the infiltration of water, develop at mineral pans, or are concentrated at locations of permeability change within the soil. These Group 5 contaminated soils are located above the regional confined, unconfined, or perched aquifers. A process of infiltration and abstraction can be used to create hydrodynamic groundwater mounds within these soils. These hydrodynamic groundwater mounds can be used to decontaminate the soils.

1.8. Study Purpose

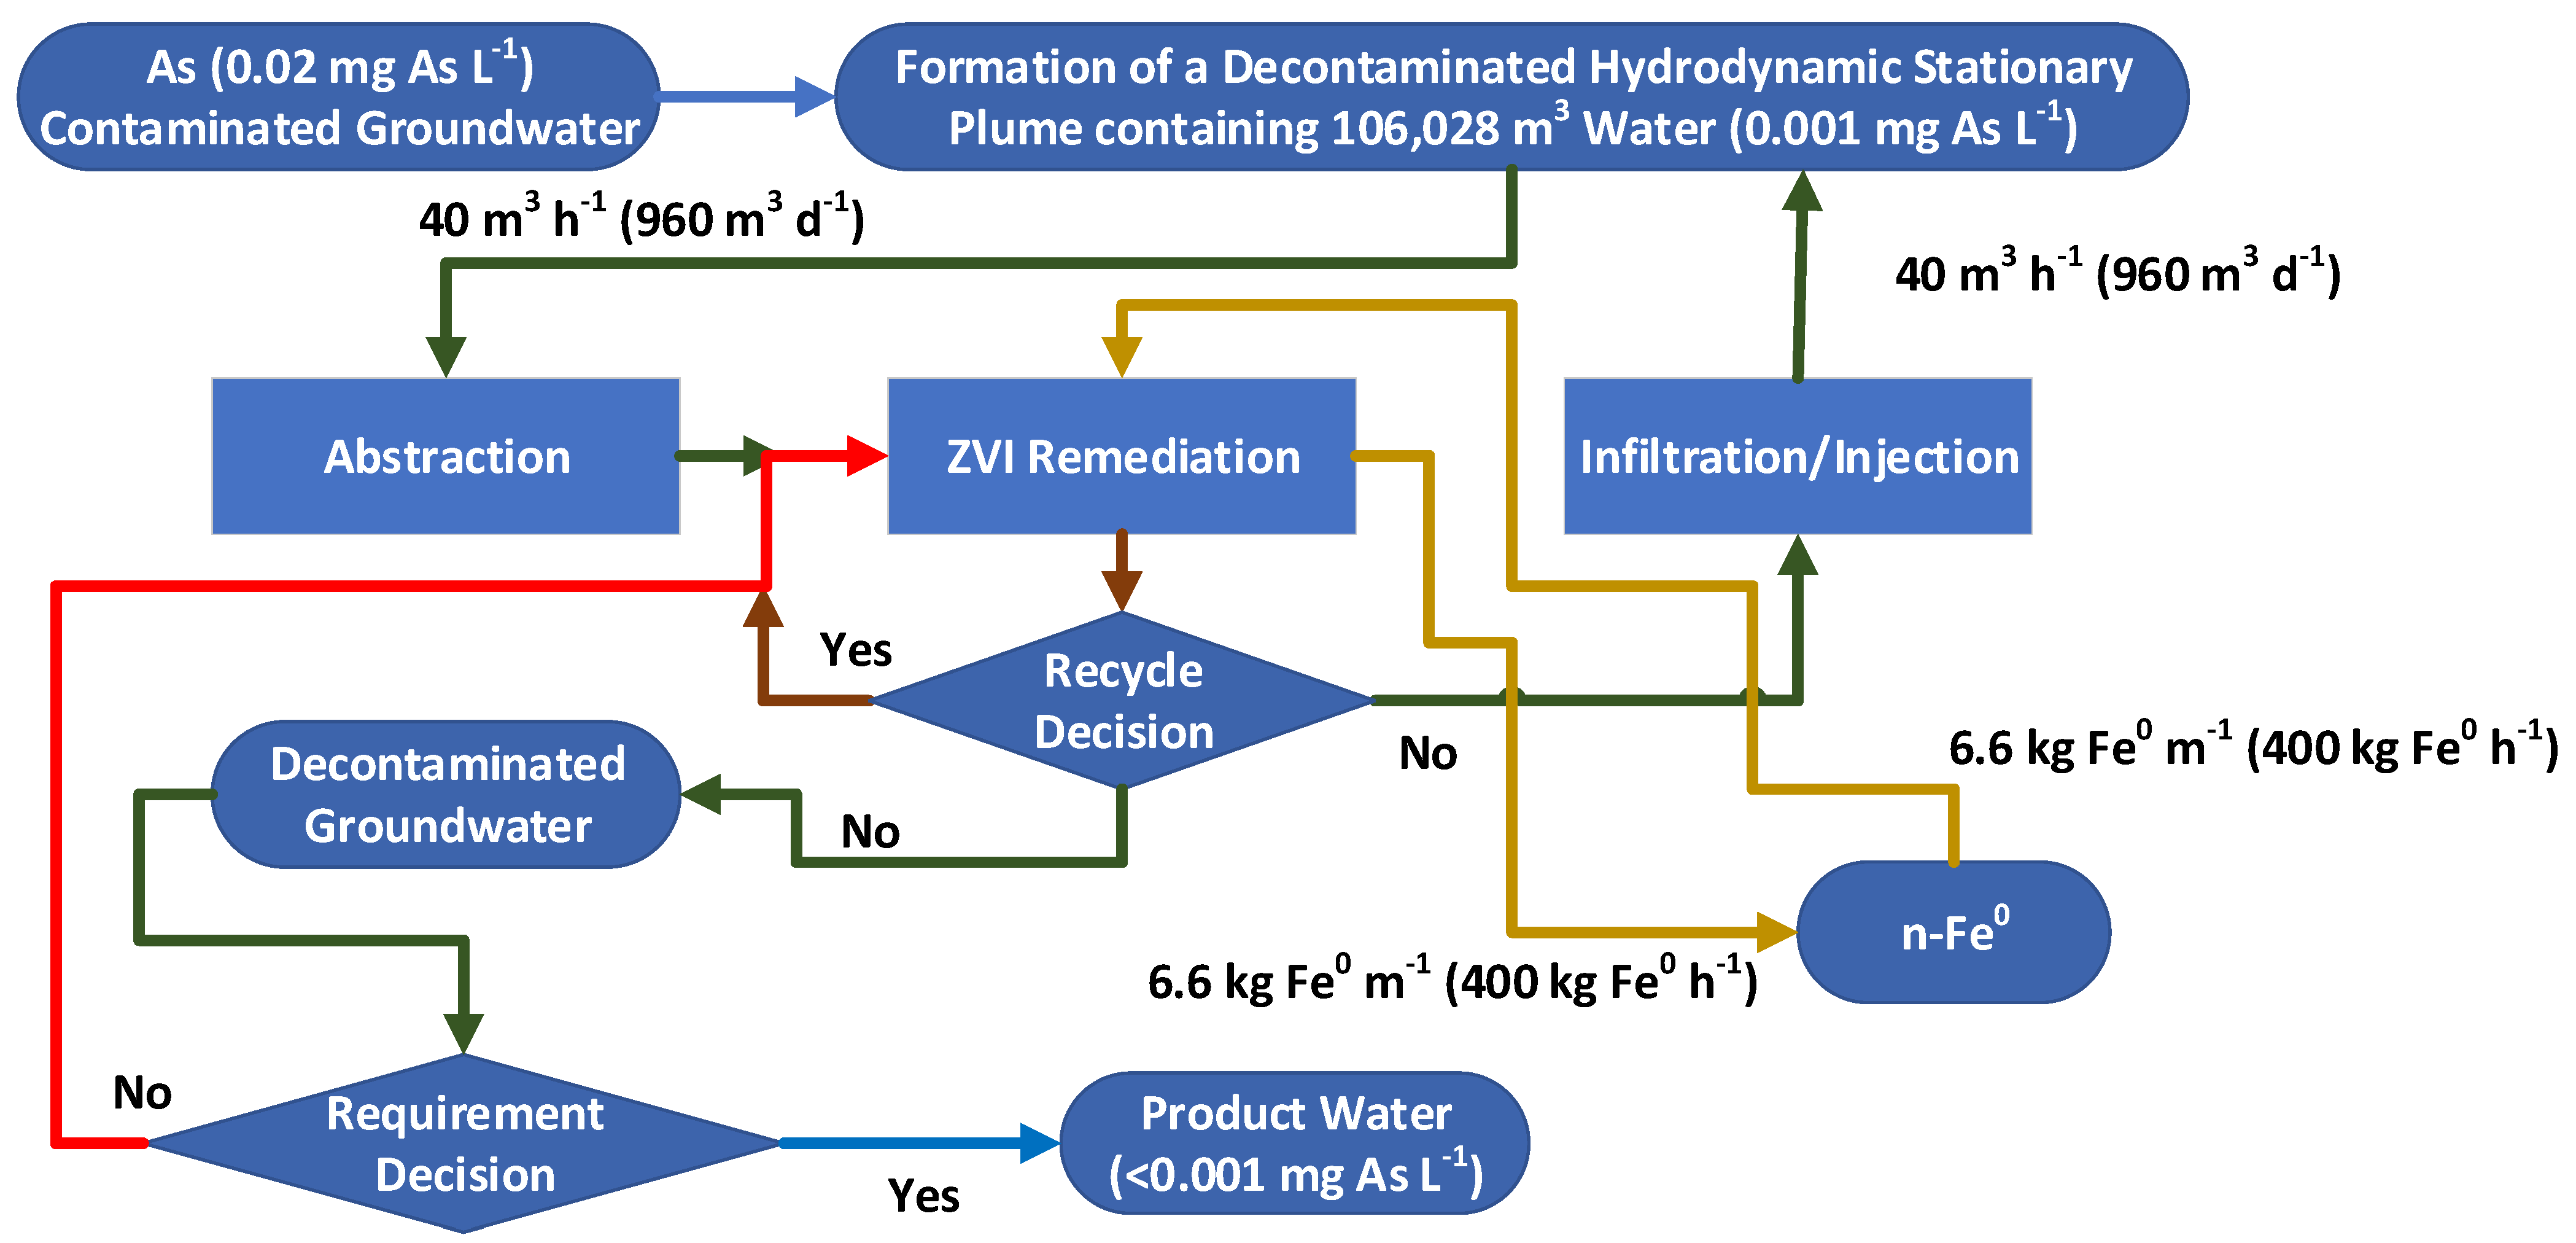
This study is a scoping study that is designed to determine whether the Group 1 to Group 5 hydrodynamic stationary plumes and groundwater mound routes may provide a viable technical alternative for aquifer decontamination through the use of a PRB or injected n-Fe0. The evaluated analysis process flow is summarized in Figure 3.

2. Materials and Methods

This scoping study integrates hydrodynamic modelling, chemical process modelling and published experimental ZVI chemical remediation data to assess the viability of using a hydrodynamic aquifer reconstruction (Figure 3).
Two hydrodynamic approaches are considered, and are as follows:
  • Firstly, the formation of stationary hydrodynamic plumes (SHP) in both confined and unconfined aquifers. The issues associated with the advection–diffusion migration of pollutants [72] across the hydrodynamic boundaries of the SHP, due to chemical potential gradients, is not addressed in this study; the detailed modelling of the aquifer recharge using wells [73] associated with the periphery of the SHP is outside the scope of this study;
  • Secondly, the formation of perched groundwater mounds (PGM) in soils located above an unconfined aquifer or an aquitard [74,75,76]. These stationary plumes (PGM) are designed to decontaminate part of the groundwater contained within an unconfined aquifer or soil. These groundwater mounds are created using a freshwater source. The PGM is used to dissolve salts (contaminant ions) within the soil, or an unconfined aquifer. These ions are then abstracted with the water, from the PGM, to allow for ion recovery using a surface located ZVI reactor, and for the appropriate disposal of the recovered pollutants.
The Appendix A, Appendix B, Appendix C, Appendix D, Appendix E, Appendix F, Appendix G, Appendix H and Appendix I are used to present the underlying hydrological/hydrodynamic/chemical principles, process assumptions, methods, and illustrative examples allow remediation to occur. They are documented as follows:
  • Appendix A—Process assumptions
    • Stationary Hydrodynamic Plume Assumptions
    • Example Stationary Hydrodynamic Plume
    • Perched Groundwater Mound Assumptions
  • Appendix B—Reaction Process Assumptions
    • Confined or Unconfined Aquifer Treatment
    • Stationary Groundwater Mound Treatment
  • Appendix C—ZVI Formation
    • Formation via an Fe3O4 Intermediary
    • n-Fe0 Formation using Borohydrides
    • n-Fe0 Formation using Dithionite or Hydrosulfite Ions (S2O42−)
    • n-Fe0 Formation using Hydrazine
    • n-Fe0 Formation using Organic Reductants
    • Regeneration of n-Fe0
  • Appendix D—Contaminant Removal Kinetic Models
    • Adsorbent Models
  • Appendix E—Contaminant Processing Assumptions
    • Redox Remediation
  • Appendix F—Reactor Assumptions;
  • Appendix G—Creation of a Stationary Hydrodynamic Plume
  • Appendix H—Formation of a Groundwater Mound
    • Chemical Potential
    • Standard Infiltration Groundwater Mound
    • Vertically Static, Laterally Expanding Groundwater Mound
    • Reconstructing a Perched Groundwater Mound to Remediate the Soil
    • Modelling the Remediation of soil using a Groundwater Mound
  • Appendix I—Arsenic Removal
    • Unsupported n-ZVI
    • Active Carbon (AC)-Supported n-ZVI (C0@n/m-Fe0)
    • Biochar (BC)-Supported n-ZVI (C0@n/m-Fe0)

2.1. Data Sources

This study utilizes measured kinetic data and stoichiometric information from the academic literature in order to establish what the constraints on remediating an aquifer, using a stationary plume or groundwater mound, may be.

2.2. Hydrological Modelling

For the purposes of this study, all modelling is performed at a relatively high level. It is assumed that the basic flux equation applies, where the flow rate, J, at any point located at a 3D location, x, y, z (where x, y and z, are spatial reference points), is defined for flow in a x direction, Jx, as follows:
Jx, m3 m−2 s−1 = kx Px,
where kx = permeability in a x direction, m3 m−2 s−1 P−1; Px = pressure, Pa, potential, or head, expressed in pressure of the potentiometric surface, head (m, ft), or vertical length, relative to a reference elevation. Solving the basic flux equation for simultaneous flow in the x, y and z directions is normally undertaken using a variant of the Richards equation. In this study, the hydrodynamic stationary plume modelling assumes homogeneity, where kx = ky = kz. The hydrodynamic perched groundwater plume modelling assumes kx = ky > kz. The x, y, z subscripts indicate the flow directions.
The 3D flow rates between each cell, where the stationary plume or groundwater mound is subdivided into n × 1 m3 cells, is assumed to be constant with time, when P remains constant.
The hydrodynamic stationary plume structure requires that: J entering the plume (J1) = J exiting the plume (J2). When (J1) > (J2), the outer margins of the plume expand into the surrounding aquifer. The amount of expansion is controlled by the lateral dissipation of the potential associated with inflow. When (J1) < (J2), the plume may receive fluids from the surrounding aquifer.
In the field, assumptions and analyses have to be made about aquifer heterogeneity, the Dietz shape factors [77,78], and the associated Euler constants [78], which are associated with both the abstraction and injection points. The modelling associated with both the abstraction wells [77,78,79] and injection wells can be very complex [80,81,82,83,84,85].
In this study, it is assumed that the location of the injection and abstraction points have considered these items, and that (J1) = (J2).

2.3. Aquifer Remediation Modelling

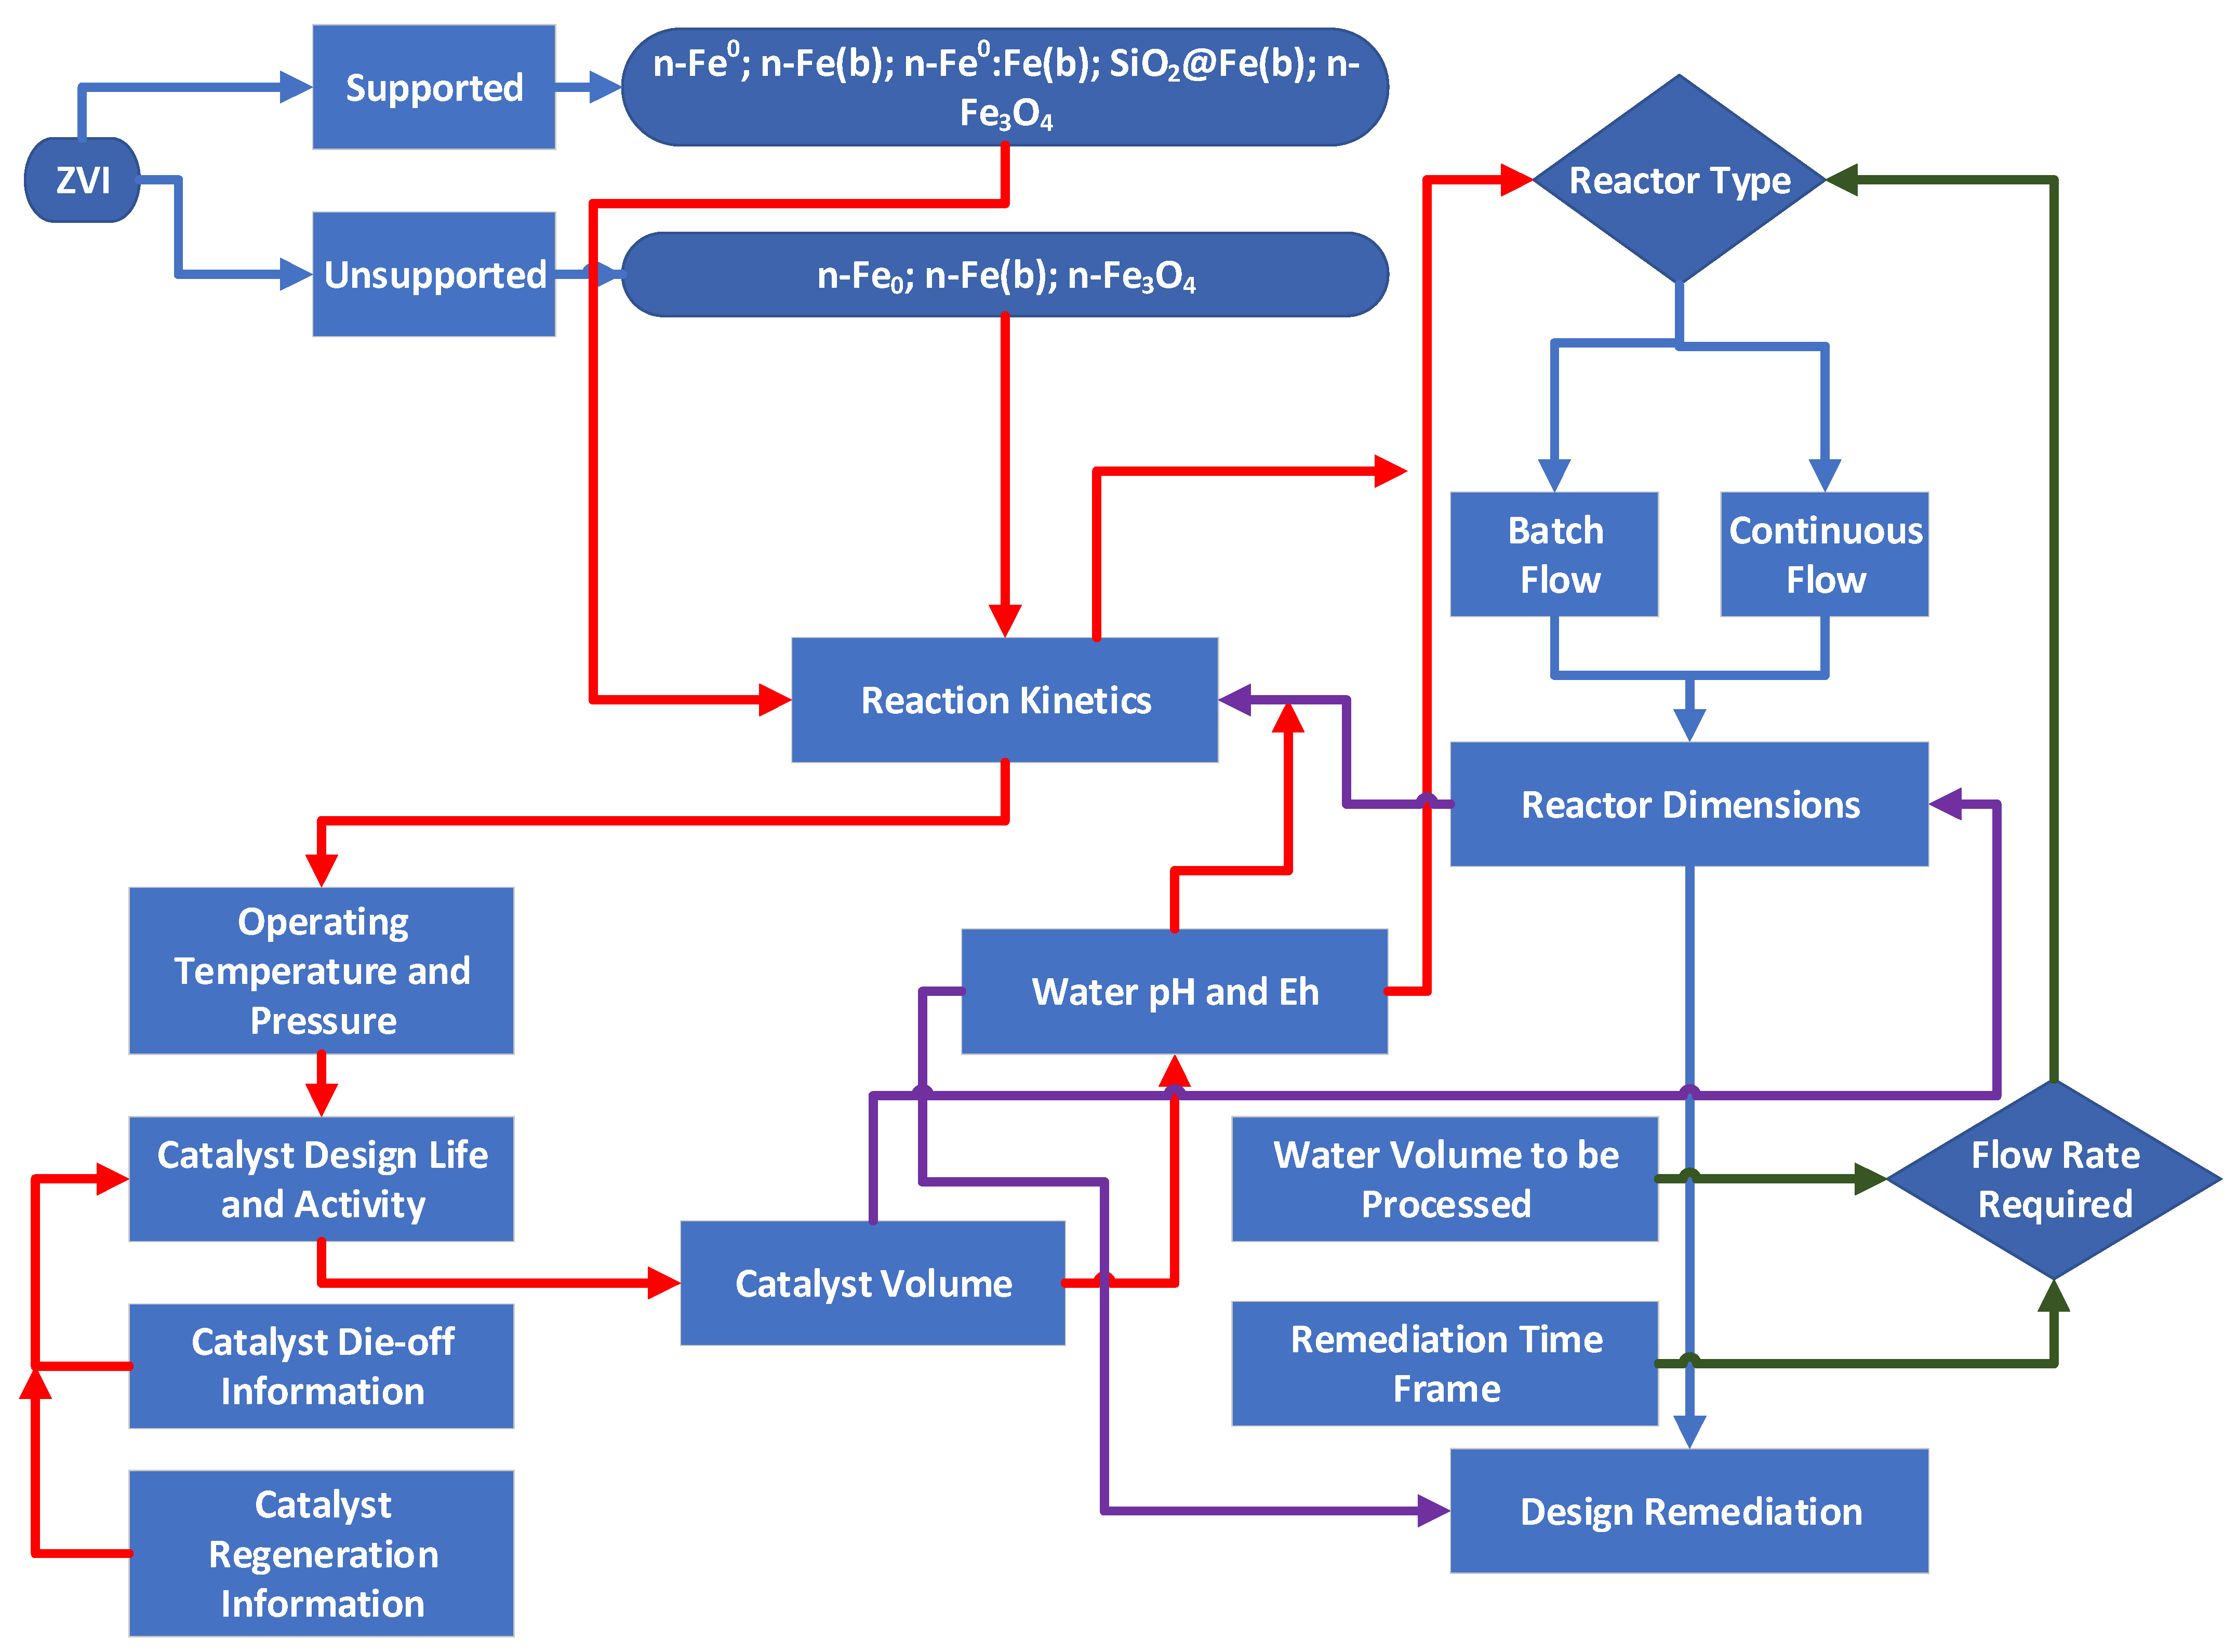
For the purposes of this study, it is assumed that chemical potential differences will ensure that all the soluble ions held in the irreducible water saturation (Swir) will equilibrate with the concentration of the same ions in the mobile water saturation (Sw). This assumption allows the surface remediation of Sw, followed by reinjection, in order to effectively remove the pollutant from the Swir. The remediation flowchart adopted in this study is summarized in Figure 4.

3. Modelling Remediation

Figure 3 and Figure 4 indicate that a key element in the decontamination process is the ZVI reactor. There are a large number of diverse views as to how ZVI remediates pollutants [7,86,87,88,89,90]. ZVI is a smart material and can operate using several routes simultaneously [91].
The behavior of ZVI is unusual. Its sensitivity to changes in Eh, pH, temperature, pressure, light, and chemical compounds, allow it to be self-sensing and to undertake a multitude of functions simultaneously in a controlled manner [91]. In this study, ZVI is assumed to be able to simultaneously undertake a number of catalytic, hydrogenation, redox, and auto-activation reactions.

3.1. Fe-Reaction, Adsorption and Redox Interpretations

Two assumptions permeate through the ZVI and PRB literature:
  • Assumption 1: ZVI reacts directly with a contaminant ion to remove it. Contaminant removal is by reduction, while the Fe0 is oxidized. The evidence for this interpretation is based on the observation that a soluble contaminant has been reduced to allow its precipitation. At the same time, the Fe0 has been oxidized to form an oxyhydroxide, e.g., [7]. There is no doubt that the two reaction start and end products occur. For example [7]:
Fe0 + CrO42− + 8H3O+ = Fe3+ + Cr3+ + 12H2O,
(1 − x)Fe3+ + xCr3+ + 2H2O = Fe(1−x)CrxOOH + 3H+,
This model results in 1 g of Fe0 removing < 1 g of Cr0, and demonstrates that the reactions in Equations (3) and (4) are dependent on each other. The recovered Cr is retained in the PRB. The redox model adopted in this study assumes that the oxidation of Fe0 to Fe3+, and the reduction of Cr6+ to Cr3+, are independent reactions (e.g., US9909221B2; US10913665B2; US11370677B2). This model assumes that the actual redox remediation and precipitation reaction is as follows [92]:
CrO42−(aq) + 5H+ + 3e = CrOOH(s) + 2H2O,
The driving force for this redox reaction is the availability of H+ and e ions. These are produced as a by-product of the Fe0-catalyzed decomposition of water [91]. The equilibrium reaction quotient (Q) [92,93] for this precipitation reaction is favored by decreasing Eh in the water, where at 298 K and 0.1 MPa, the following is determined [92]:
Log(Q) = Log(CrO42−) = (Eh − (1.386 − 0.0985pH))/0.0197,
This Nernstian relationship demonstrates that decreasing Eh (V), while maintaining a constant pH, will result in the precipitation of CrOOH(s) [92]. This analysis indicates that the redox Eh and pH conditions, suitable for n-CrOOH precipitation [92], could occur in the Fe0 hydration shell, in the FexOyHz hydration shells, in the water adjacent to the corroded Fe0 (as entrained n-CrOOH particles (Figure 1)), or on the surface of FexOyHz or Fe0 particles. If the Cr removal reaction is redox [92], as suggested in reference [92] and patents US9909221B2, US10913665B2, and US11370677B2, then 1 g of Fe0 will be able to remove >> 1 g of Cr0.
This redox model [92] demonstrates that the oxidation of Fe0 is not a necessary pre-requisite for the reduction of CrO42−(aq), as required by Approach 1 [7]. Either of these approaches, or an alternative approach, may be the correct explanation for the observed production of CrOOH and Cr(OH)3 precipitates.
2.
Assumption 2: ZVI reacts directly with the contaminant and chemically adsorbs the contaminant onto its surface [94,95,96,97,98,99]. This approach assumes that the Fe0 becomes functionalized, e.g.,
2Fe0 + H2O = Fe0:H+ + Fe0:OH,
This allows CrO42−(aq) to be adsorbed, as follows:
2Fe0:H+ + CrO42−(aq) + 2OH = 2Fe0:H+:CrO42− + 2OH = 2FeOOH + CrOOH + H+ + 3e,
The redox approach assumes (Equation (6)) that the rate constant increases for CrOOH production as Log(Q) decreases. A Log(Q) value of >0 requires an Eh of >0.5 at pH = 9. The Fe0 surface at pH 9 can react as follows:
Fe0 = Fe2+ + 2e,
where
Log(Q) = Log(Fe2+) = (Eh − (−0.44))/0.0295,
At pH = 9, the Eh of the Fe0 will be −0.44 V, and Log(CrO42−) at this surface will be −46.47. Since the rate constant, k, for the forward reaction increases, as Log(Q) decreases, it is probable that the precipitation of CrOOH on the Fe0 surface would be virtually instantaneous. In this instance, the reaction would not be an adsorption reaction. Instead, it would be a redox surface precipitation reaction. This interpretation is consistent with reference [92] and patents US9909221B2, US10913665B2, and US11370677B2.
There are numerous experimental examples where the redox conditions in the water body do not allow the precipitation of the ion. However, the soluble ion concentration has been demonstrated to decline with time in the water body. In these examples (e.g., reference [99]), analyses of the iron surface demonstrate either a chemical adsorption or a physical adsorption of the removed ion on the iron surface, or adsorption/concentration within its hydration shell. The redox model [92] interprets this adsorption as indicating that Log(Q) was >0 at the measured locations within the water body. It assumes that the observed concentration at the Fe0 surface indicates a lower value of Log(Q) (i.e., Log (Q) <0) on the Fe0 surface. This results in a chemical potential difference between the Fe0 surface and the water body. This potential difference accounts (under a redox model) for the observed concentration of the ions, with their apparent (or interpreted) adsorption.
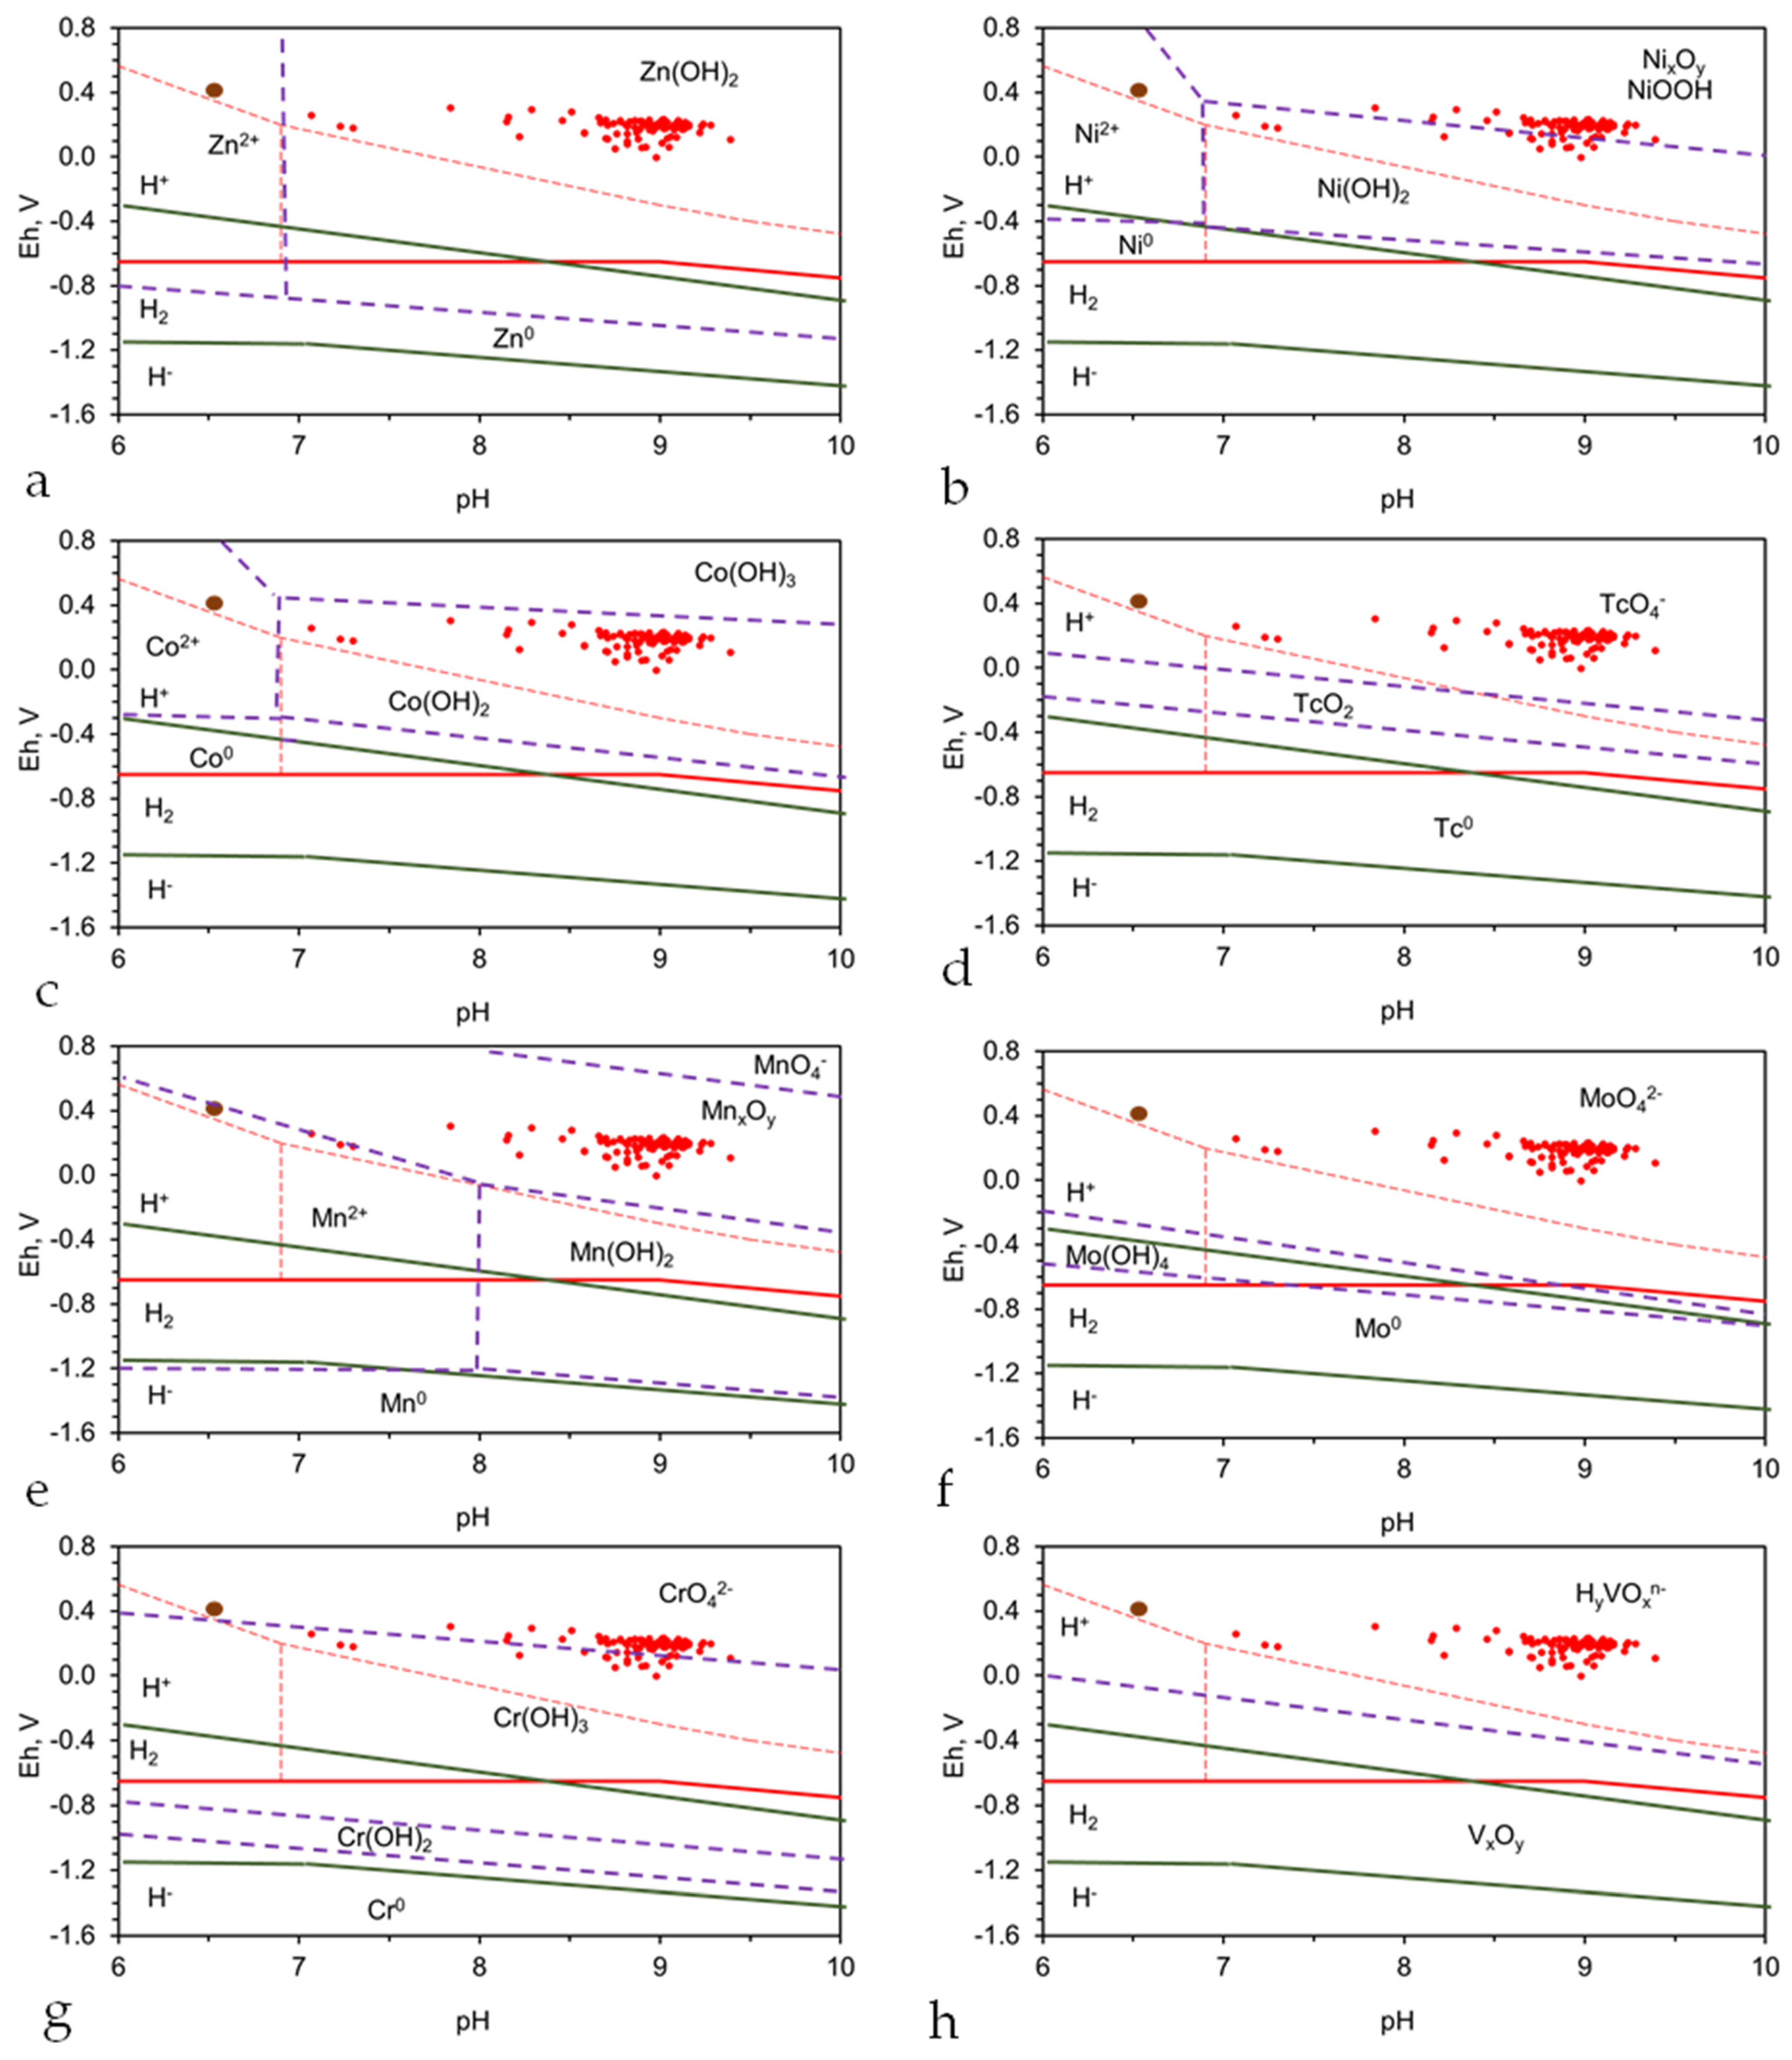
The approach taken in this study assumes that all the ZVI remediation reactions that are considered can be interpreted as redox reactions [92]. It is assumed that Log(Q) and the rate constant, k, for the appropriate remediation reaction is a function of the Eh and pH of the water, FexOyHz and Fe0 (Figure 1). This is demonstrated in Figure A13 and Figure A14. As noted above, this redox remediation view is not universally held, and alternative interpretations of the stoichiometry may be preferred by others.

3.2. Redox Changes

The placement of ZVI in water changes the Eh and pH of the water [100,101]. Continuous flow trials (Appendix E, Figure A13 and Figure A14) demonstrate that the Eh and pH shifts can be maintained through the processing of 1500–25,000 m3 t−1 of ZVI. These shifts place the redox regime of the product water within the zone of n-Fe(a,b,c) polymer formation (Figure A10). This will result (for the example of feed water) in Log(Q) changing sufficiently to result in the precipitation (Figure A11 and Figure A12) of all or part of the ion in the following locations:
(i)
Mode A: On the ZVI surface
(ii)
Mode B: In the hydration shell of the ZVI, where the Eh and pH conditions of the shell are intermediate between those in the water body and on the ZVI surface;
(iii)
Mode C: In the main water body.
The reaction quotient (Log(Q)) at each of these three locations is directly related to the PSE (Equation (1)).
Mode A: Contaminant precipitation on the Fe0 surface is dependent on the continuing access of the water (from the water body) to the appropriate redox conditions provided by Fe0. This water will travel through the Fe(a,b,c) polymer crust (Figure 1) from the water body by diffusion, and to a lesser extent by viscous flow. Ion removal may cease when the (i) site availability decreases, or when (ii) the formation of oxyhydroxides on the Fe0 has resulted in an increase in Eh and/or change in pH, relative to those present on the surface of fresh Fe0. This type of precipitation may mimic ion removal, using a conventional adsorption reaction. It is most likely to occur when the redox conditions in the water do not favor rapid precipitation. It is commonly associated with a high chemical potential gradient between Log(Q) on the Fe0, and Log(Q) in the water body;
Mode B: This will result in contaminant precipitation, both on the Fe0 surface and as entrained nano-particles within the hydration shell. It will also result in precipitation as nano-particles, within the porosity, associated with the Fe0. Ion removal may be described using a pseudo-zero to second order reaction.
Mode C: This will result in contaminant precipitation, as entrained nano-particles and aggregated colloids within the water body. It will also result in precipitation on surfaces within the reactor (e.g., conduit walls, reactor walls). Ion removal may be described using a pseudo-first to second order reaction.

3.2.1. pH Changes

It is obvious (Figure A1c) that, if the aquifer pH is P1, and the plume contains x m3,, that the abstraction of y m3 with a transformation of pH to P2 in a reactor, will, following reinjection, result in a revised simplified aquifer pH (RP) of the following form:
RP = ((P1 × (xy)) + (P2 × (y))/x,
Since P1 = −Log10[H3O+], a pH of 6 signifies that there are 10−6 moles of H3O+ L−1. If P1 = a pH of 10, this signifies that there are 10−10 moles of H3O+ L−1. If y = 1 and x = 10, based on pH, Rp = 6.4 (Equation (11)).
This revised aquifer pH may partially reverse the remediation when the remediated contaminant products are retained in the injected/infiltrated water. This is because, while Log(Q) at pH = 6 is positive, and Log(Q) at pH = 10 is negative, Log (Q) in the water will increase (as the pH approaches 6.0) and may turn from negative to positive, thereby favoring the reverse reaction, as follows:
kobs = kforwardkreverse,
kobs = observed rate constant; kforward = forward rate constant; kreverse = reverse rate constant.
A similar situation occurs with Eh. However, over time, the pH, Eh, and PSE (Equation (1)) of the hydrodynamic stationary plume or hydrodynamic perched groundwater plume will stabilize.

3.2.2. ZVI Characteristics

ZVI has a number of characteristics:
(i)
Its zeta potential in water switches from a positive value to a negative value as the pH increases [100]. The pH (7.5 to 8.5) where this switch occurs (the iso electric point (IEP)) can decrease as the Pw increases. Pw = weight of Fe0 in the water, g L−1.
(ii)
For a specific Fe0 particle size and Pw, the product water pH increases with time to an equilibrium level [100]. For a specific reaction time, pH increases as Pw increases [100]. Consequently, in a continuous flow reactor containing a fixed volume of Fe0, the product water pH decreases as the water flow rate increases. i.e., pH is a function of the space velocity, SV:
SV = FR/Pv,
FR = water flow rate m3 Unit time−1; Pv = volume (m3) or weight of Fe0.
(iii)
For a specific Fe0 particle size and Pw, the product water Eh decreases with time to an equilibrium level [100]. For a specific reaction time, Eh decreases as Pw increases [100]. Consequently, in a continuous flow reactor containing a fixed volume of Fe0, the product water Eh increases as the water flow rate increases. i.e., Eh is a function of the space velocity, SV. This, in turn, establishes that the PSE (Equation (1)) is also a function of SV.
(iv)
pH increases and Eh decreases for a specific value of Pw, as as (the particle surface area, m2 g−1) increases, and the particle size decreases. It is not unreasonable to expect that, for a particle size of <50 nm, as of >20 m2 g−1, and a Pw of >0.2 g L−1, the water Eh to reduce by <−0.8 V and the pH to increase by >3 units after approximately 15 min in a batch reactor [100].

3.2.3. Impact of Space Velocity in a Continuous Flow Reactor

Most experimental data is based on a batch operation, where the Fe0 is discarded after a single use. The economic viability of the proposed remediation application requires each batch of Fe0 to be reused, to process multiple volumes of water.
The experimental results (e.g., Figure A10, Figure A11, Figure A12, Figure A13 and Figure A14) indicate that, in a fixed bed reactor with a single charge of Fe0, the continuous flow processing rate (PR) can exceed 25,000 m3 t−1 of Fe0. These experimental results establish that the amount of Fe0 required to increase pH and decrease Eh by a constant amount can be assessed, as follows:
PR, m3 unit weight−1 = SV × tp,
where tp = cumulative processing time. The magnitude of the pH increase and Eh decrease for a specific as and specific FR, increases as Pv (in the reactor) increases. During a prolonged processing time, the Fe0 surface will gradually corrode to create a surface covered in Fe(a,b,c) polymers (Figure 1). After the polymer:Fe0 ratio exceeds a critical value, the observed PSE will start to increase. When the PSE exceeds a critical value, the Fe0 in the reactor will need to be either replaced or regenerated.

3.2.4. Use of Fe0 to Produce Entrained n-Fe(a,b,c) Polymers

Some remediation reactors use the Fe0 to restructure and repurpose the Fen+ ions contained within the water body, in order to produce entrained n-Fe(a,b,c) polymers (which are retained within the water body). These entrained polymers are used to remove pollutants by reaction and adsorption [101]. For these reactions, PR can exceed 3,000,000 m3 t−1 of Fe0 [101].
Other remediation reactors use supported Fe0:Fe(a,b,c) [102] or SiO2@Fe(a,b,c) polymers [103] to catalyse the formation of entrained n-Fe(a,b,c) polymers. These polymers are used to remove pollutants (e.g., Na+ and Cl ions) by reaction and adsorption. For these reactions, PR can exceed 3,000,000 m3 t−1 of Fe0 [103].

3.3. Remediation Rate Constant

All remediation reactions operate at different rates [92,93]. A specific reaction will have a rate constant, which is a function of water composition, pollutant concentration, temperature, pressure, reactor type and turbulence within the reaction environment [92,93,104,105].
The remediation rate constant [93] for a specific as, specific FR, and specific Pv, may decline with time, as the initially available reaction sites on the Fe0 become blocked (or poisoned) with precipitated remediation (and oxyhydroxide) products [106].

3.4. Remediation of Immiscible Liquids (Oils)

Immiscible liquids include halogen organics and oils [107,108,109,110,111,112]. As the pollutant plume migrates through the aquifer, it will create a porosity containing mobile water (Sw), irreducible (immobile) water (Swir), mobile oil (So) and irreducible (immobile) oil (Soir). The ratio of So:Soir will decrease towards the plume margins.
Encasing the pollutant plume within a hydrodynamic stationary mound (Figure A1a), will result in a situation where the mobile oil migrates towards the abstraction well, leaving a residual porosity containing Sw, Swir and Soir. The recovered oil, or immiscible fluid, is removed in the reactor. Soir may account for 20–70% of the oil or immiscible liquid present in the aquifer. A substantial part of the residual irreducible oil, or immiscible liquid, may be recoverable from the aquifer through the injection/infiltration of surfactants or polymers, which are designed to reduce their viscosities, etc. The use of surfactants to recover Soir is well established in the hydrocarbon industry (US7581594B2; US8146666B2; US20150233223A1), and has been used in the subsurface to help remove contaminant plumes [108,109,110,111,112]. It has been demonstrated that lowering the salinity of the aquifer pore-waters can reduce Soir and increase So (US8550163B2). The ZVI reactor (Figure 3 and Figure 4), may, when remediating an immiscible oil, be used to both degrade the oil [101] and desalinate the water [102,103]; this is prior to the injection/infiltration of the product water into the hydrodynamic stationary plume.
The surface recovery of the water + immiscible liquid will allow the separation and recovery of all or part of the liquid, prior to the residual water being transferred to a ZVI reactor (Figure 3 and Figure 4). A variety of ZVI remediation approaches have been used to remove residual hydrocarbons and their associated miscible liquids and solutes from water. These are documented extensively elsewhere, e.g., references [113,114,115,116,117,118,119].

3.5. Removal of Ionic Salts (Anions and Cations)

Redox ion removal from a hydrodynamic stationary plume or a hydrodynamic perched groundwater mound requires the removal of the precipitate from the product water before reinjection and the precipitation of an ion; this is as either M0 MOx, MOOH, or M(OH)x within the reactor (Figure 3 and Figure 4).
Using this approach, a suitably designed and operated ZVI redox reactor would expect to recover the following [91]: Ag, Al, Am, Au, As, Ba, Be, Bi, Ca, Cd, Ce, Co, Cr, Cu, Dy, Er, Eu, Fe, Ga, Gd, Ge, Hf, Hg, Ho, In, Ir, In, La, Lu, Mg, Mn, Mo, Nb, Nd, Ni, Np, Os, Pb, Pd, Pm, Po, Pr, Pu, Re, Rh, Ru, S, Sb, Sc, Se, Sm, Sn, Sr, Ta, Tb, Tc, Te, Th, Ti, Tm, U, V, W, Y, Yb, Zn, and Zr.
Monovalent metals (e.g., K, Li, Na) and common anions H2−xCO3x−, H2−xSO4x−, Cl, Br, F, NOx, H2−xPO4x− can also be removed in a suitably designed and operated ZVI redox reactor [100,101,102,119,120].
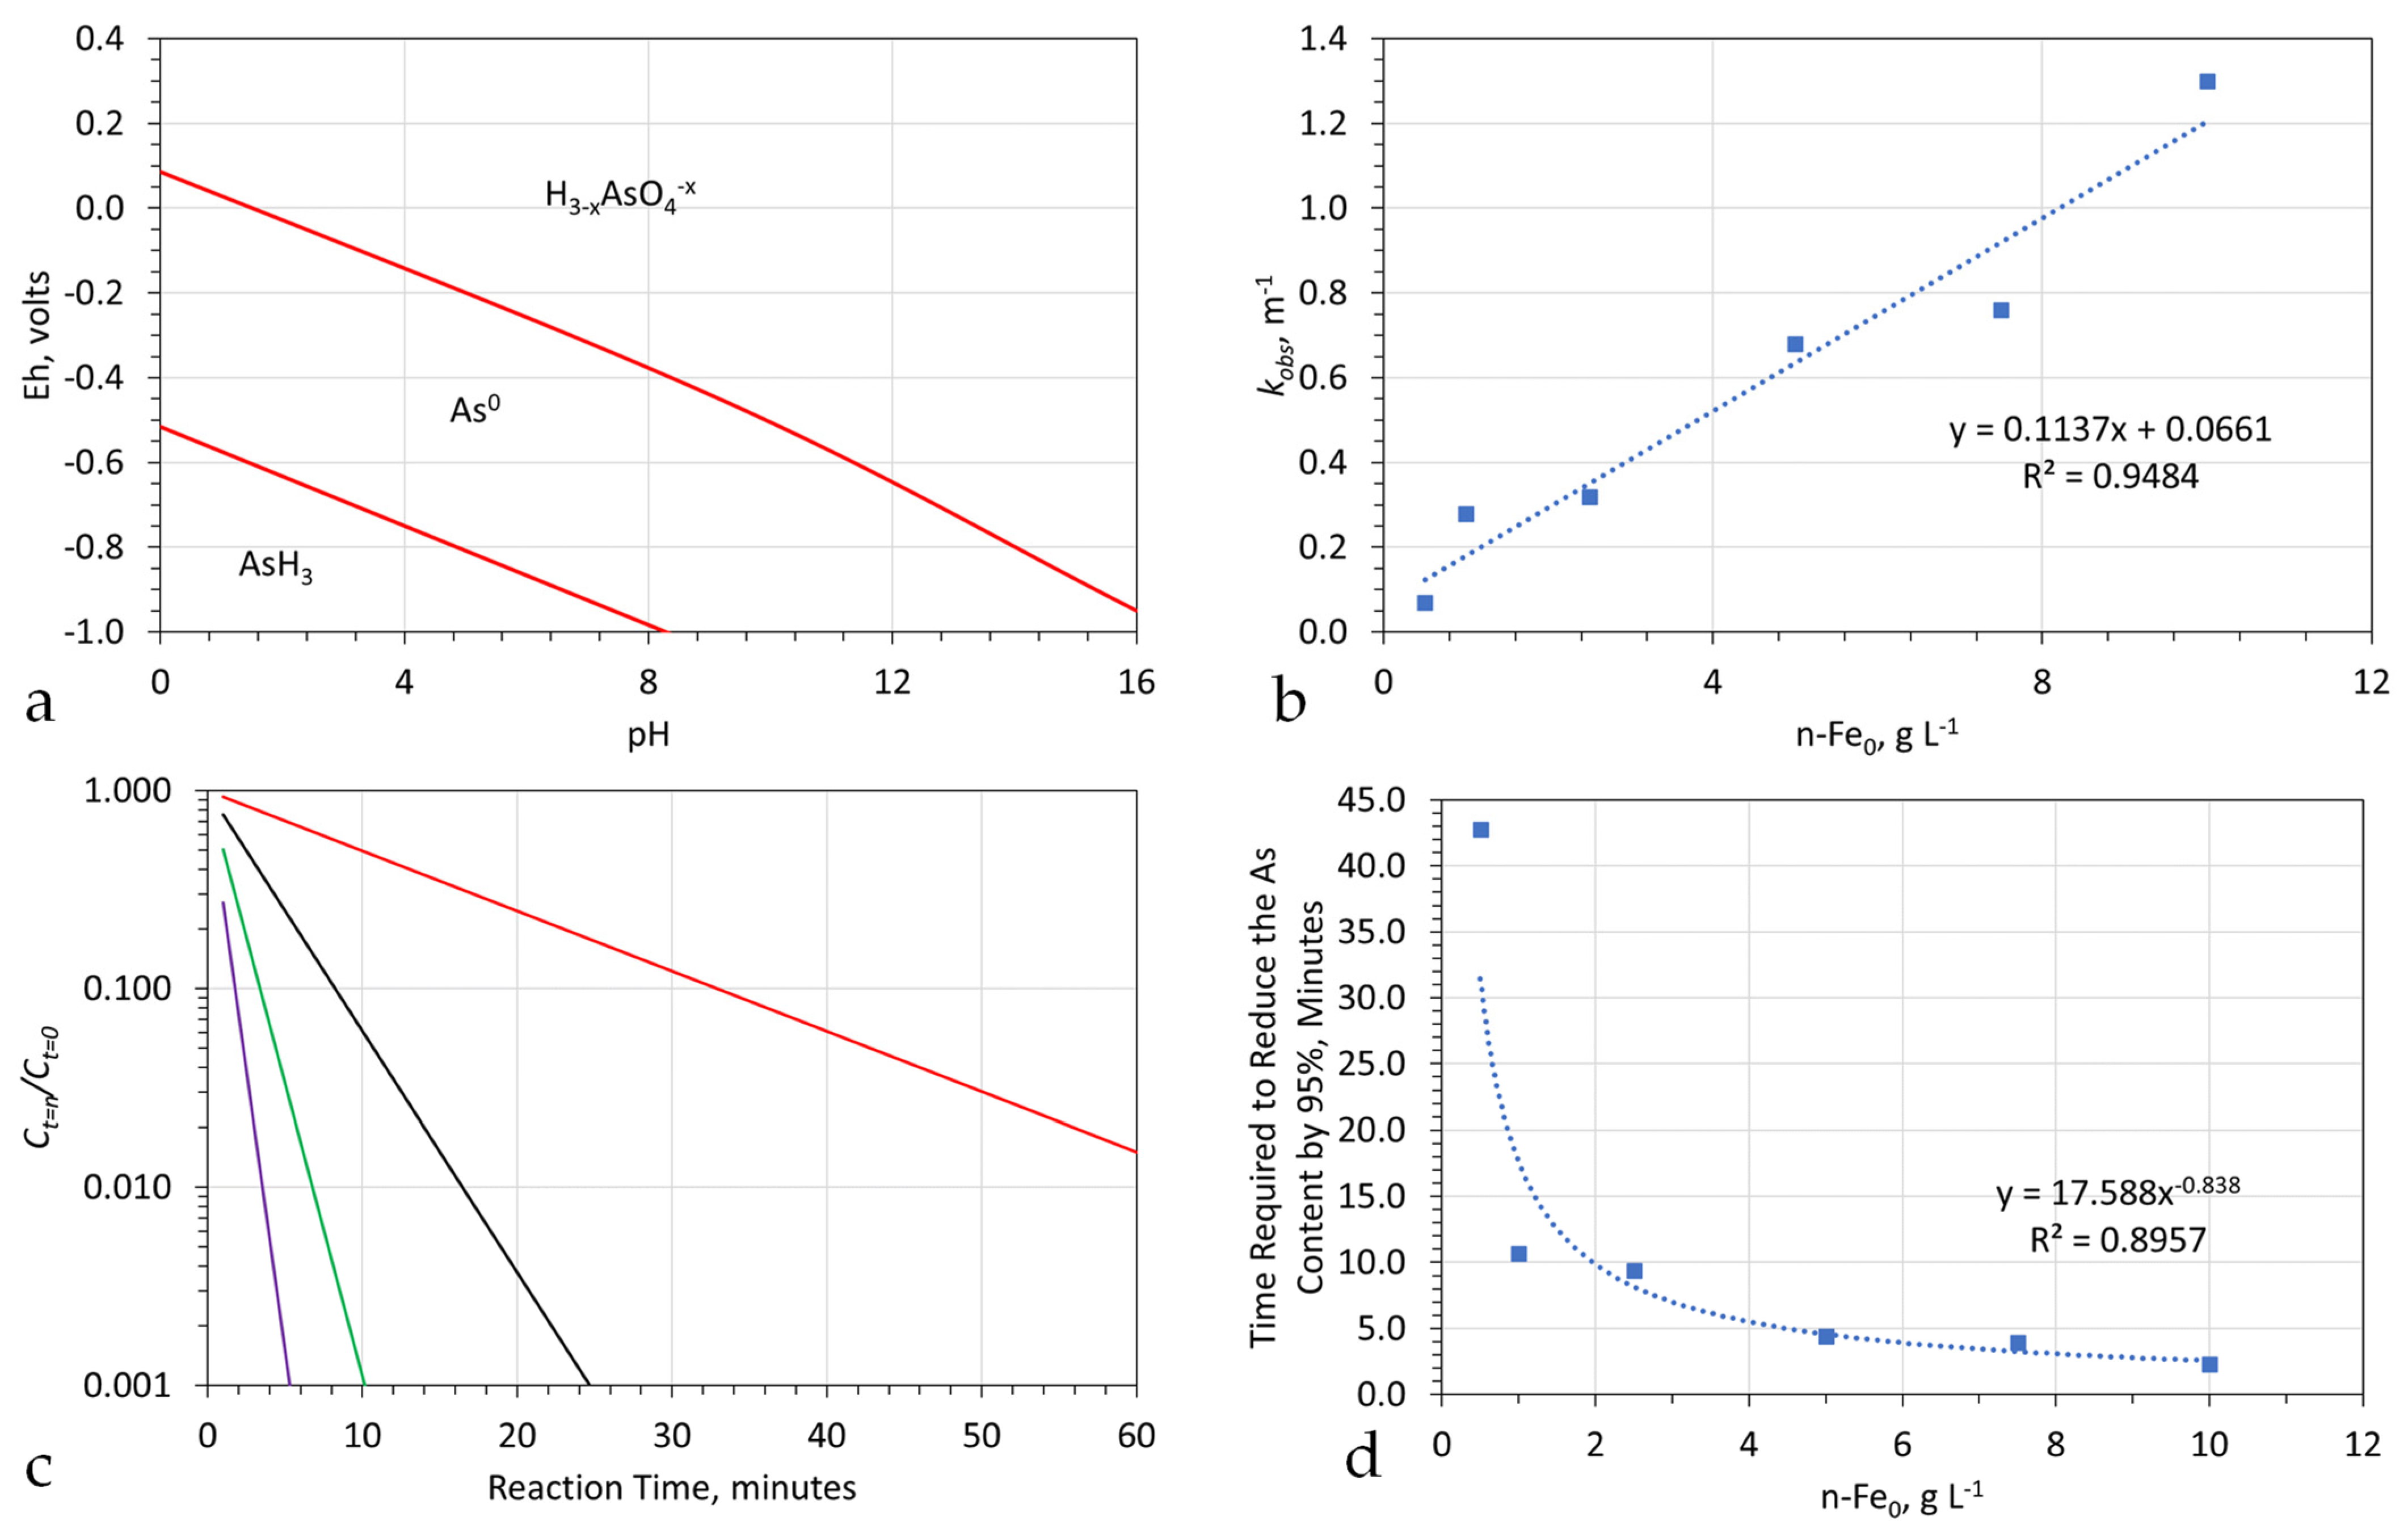
The basic principles of ion removal (within a stationary plume or a perched groundwater mound) are the same in each example. In this study, the removal of As (Appendix I) is used to demonstrate the redox removal of a multi-valent ion from a hydrodynamic stationary plume, or perched groundwater mound.
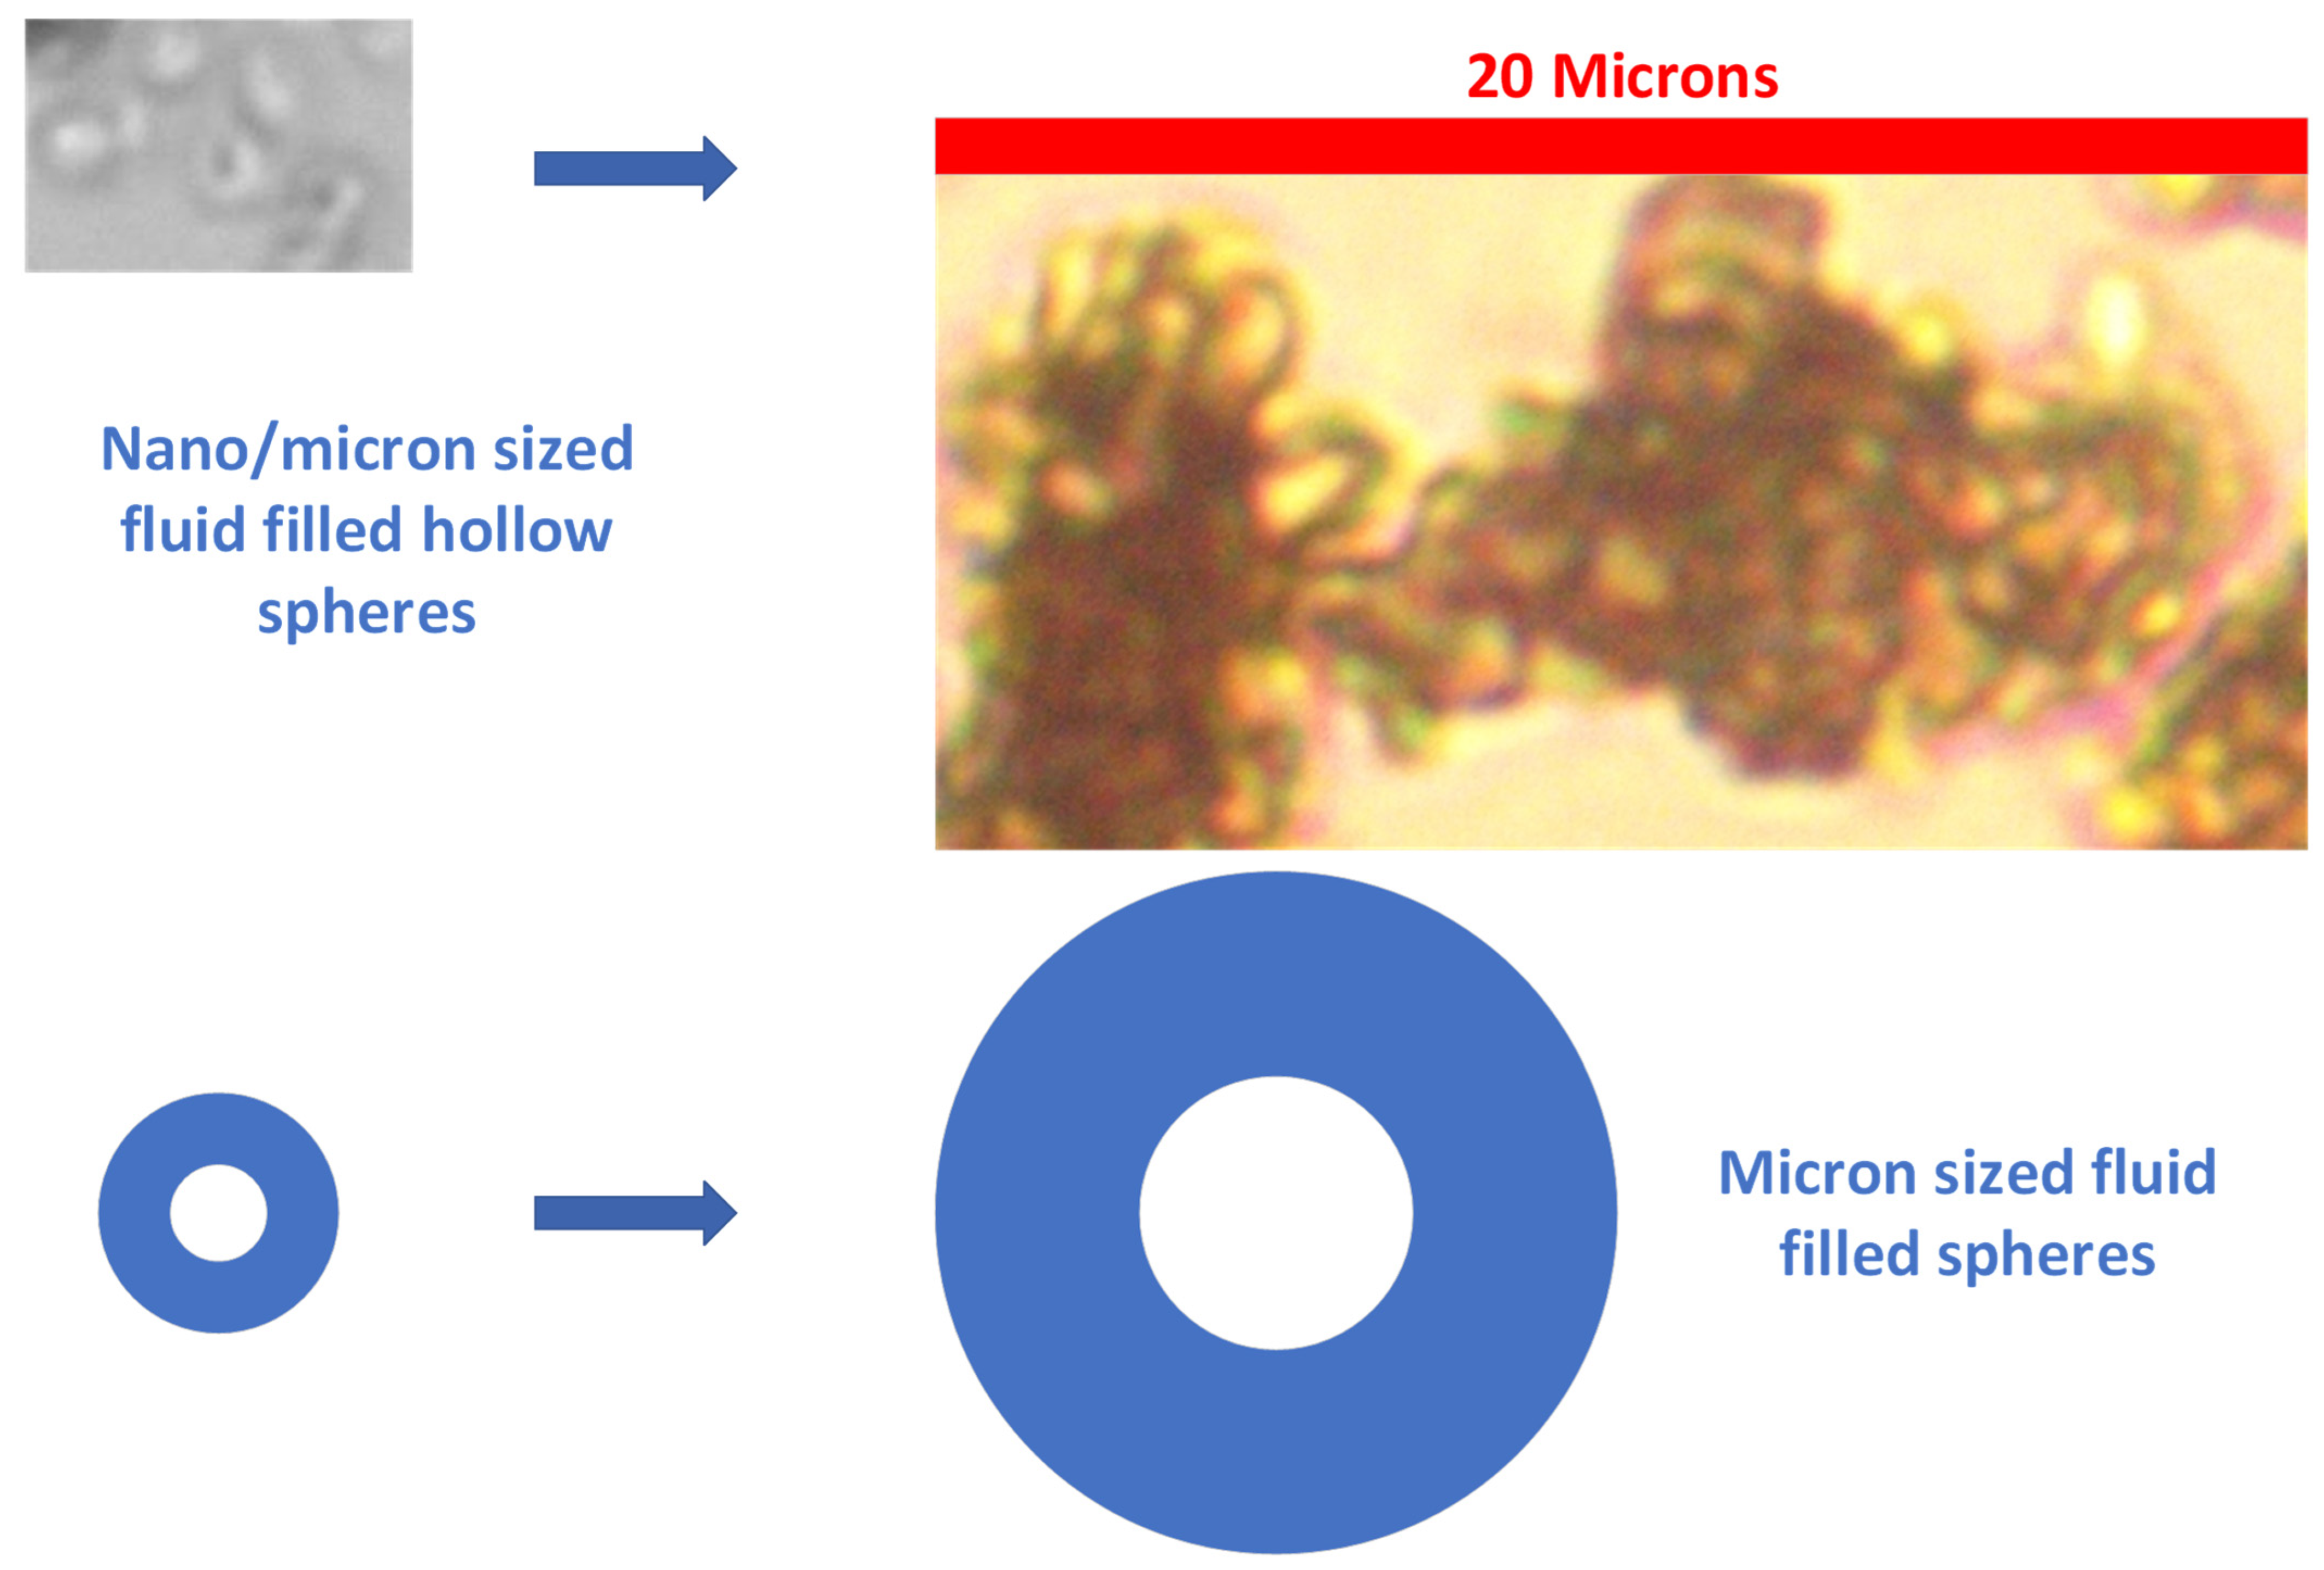
The removal of monovalent ions (e.g., Na+, Cl) is more complex, where removal involves catalytic removal by Fe(a,b,c) polymers [120,121] or n-Fe0:Fe(a,b,c) polymers [121]. The chemical products associated with ion removal, using the polymers or Fe0, have not been defined. However, in saline water, n-Fe0 and n-Fe0:Fe(a,b,c) polymers reorientate to initially form hydrogen and water-filled spheres [121]. These then grow with time, and sequester (by desorption) ions adsorbed from the water body into their hollow cores (e.g., Na+, Cl, Ca2+, Mg2+, HCO3, SO42−) [121]. A typical example is provided in Figure 5. The mechanism associated with this process is described elsewhere [102,122].
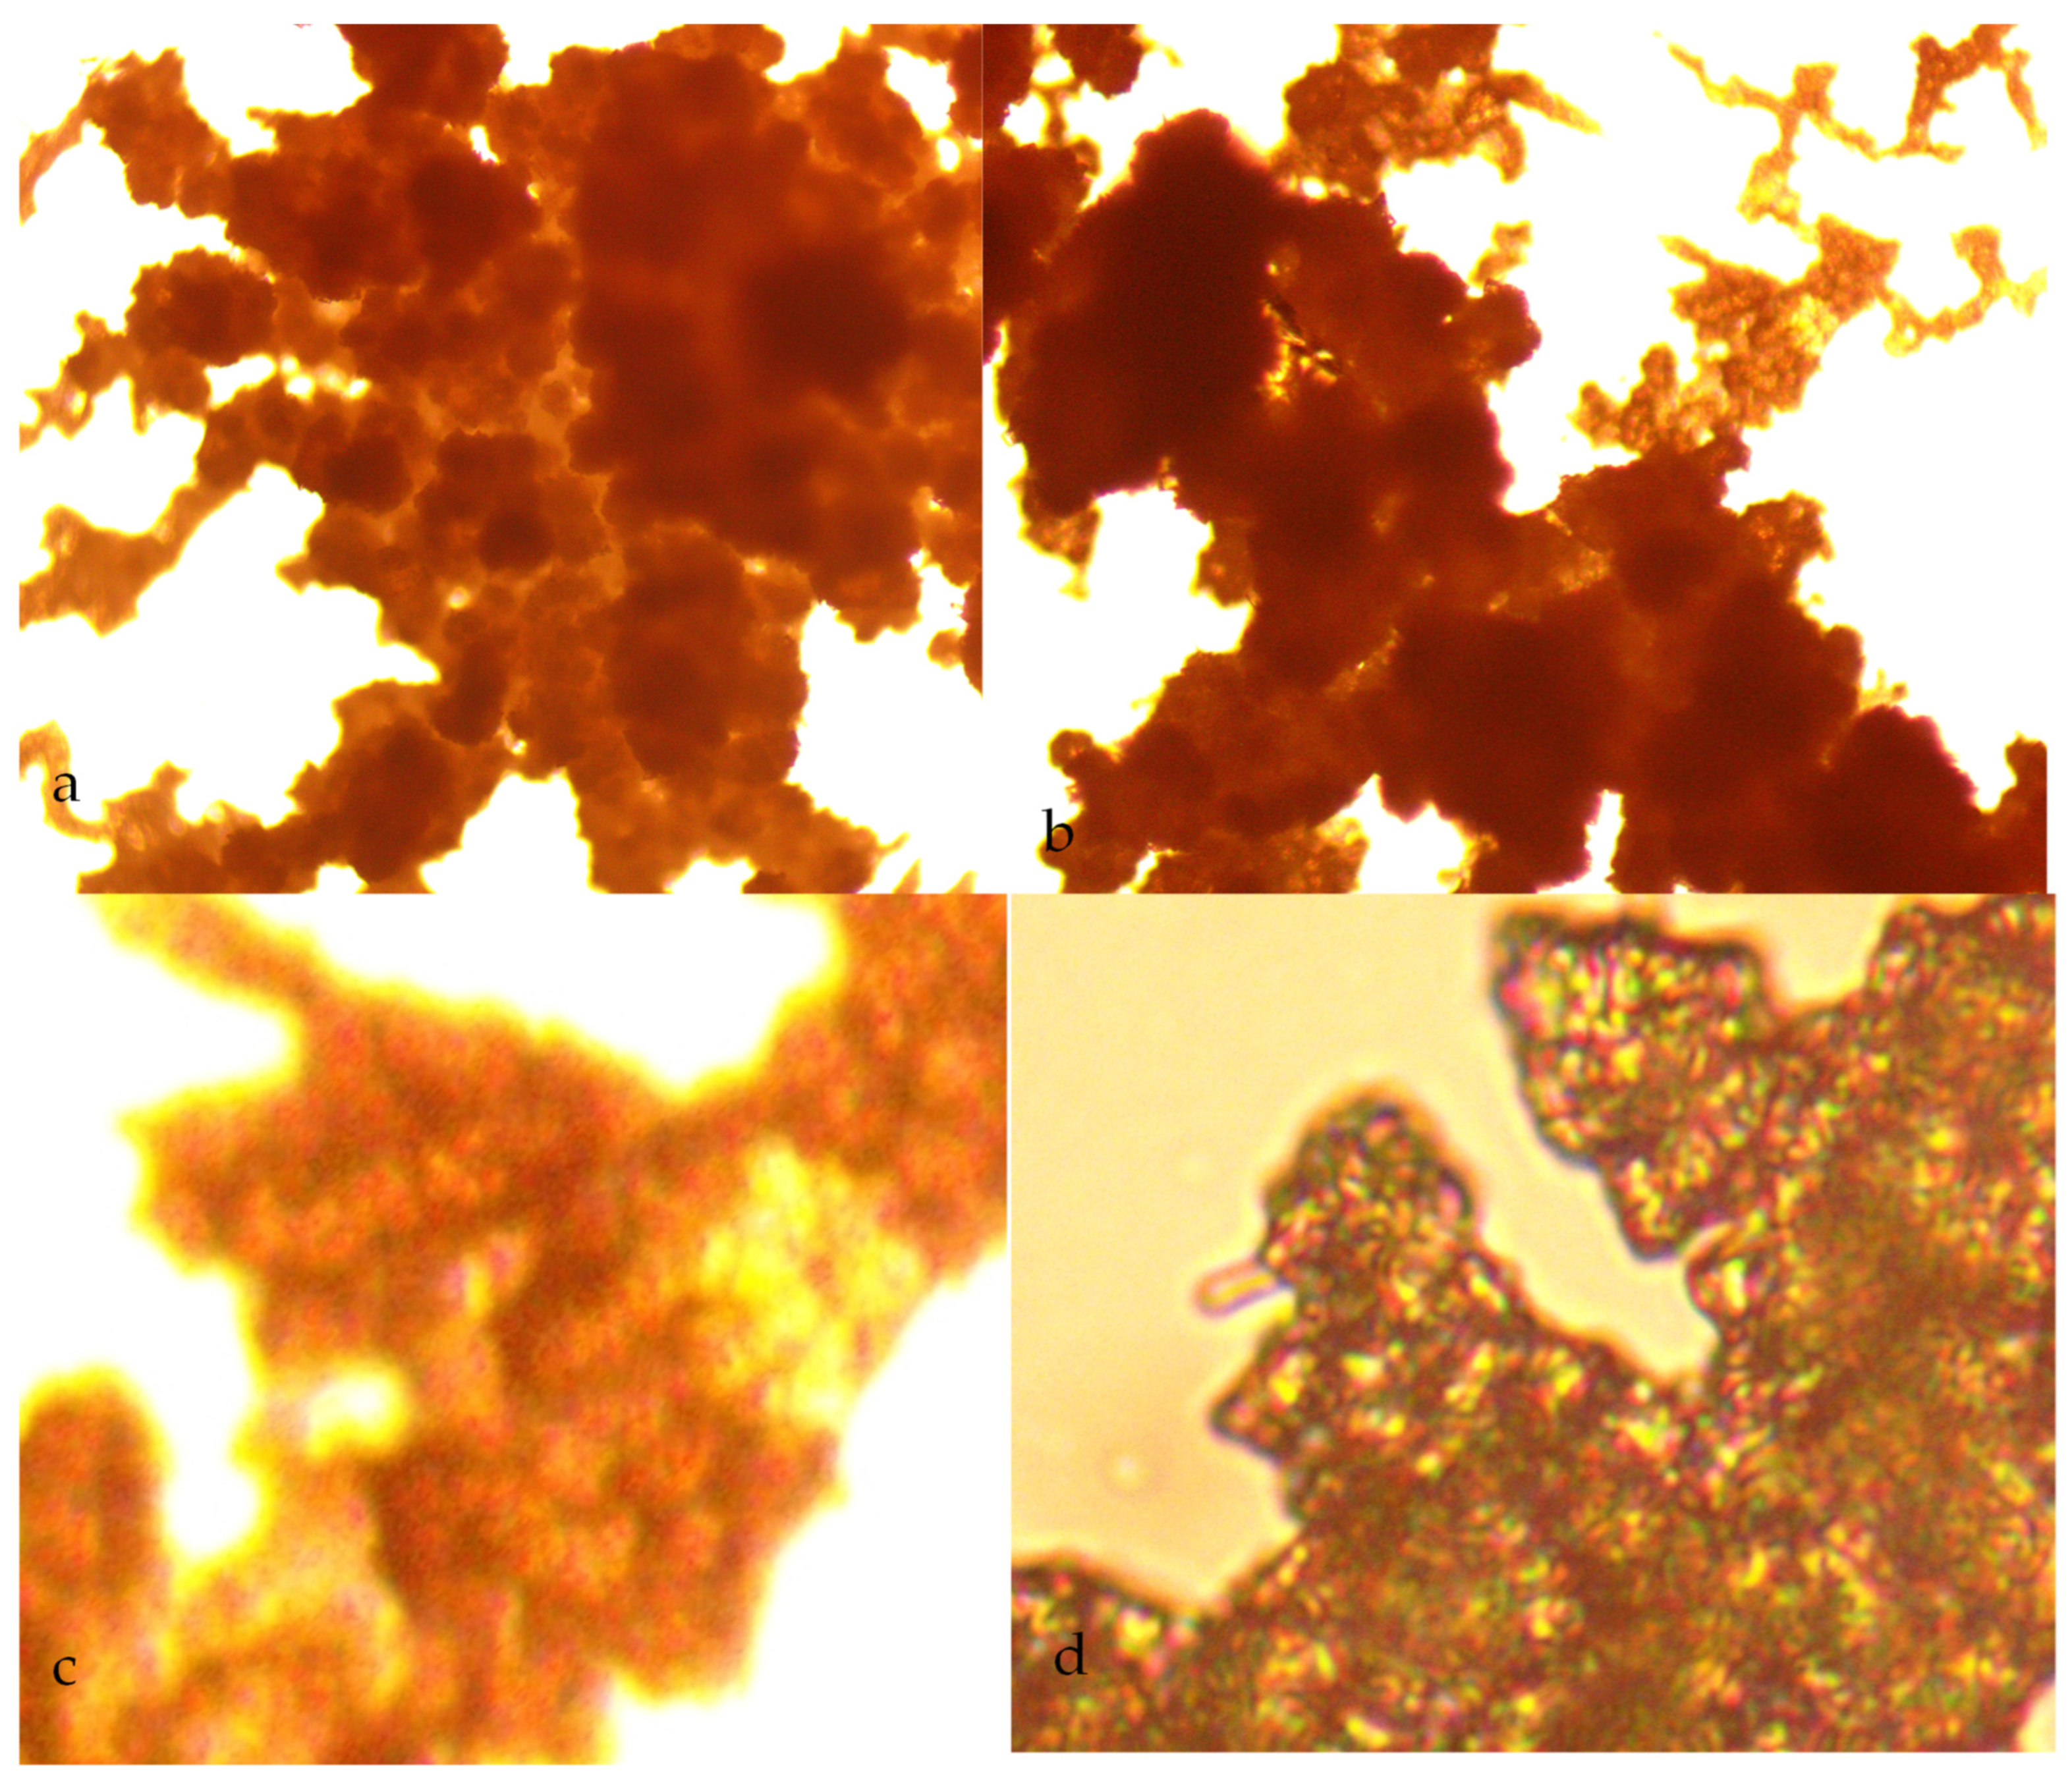
n-Fe(b) polymers, when first placed in water, form a mixture of agglomerated networks and colloids (Figure 6a–c) comprised of fluid-filled n-Fe(a,b,c) nano/micron-sized spheres [121]. These spheres sequester ions into their hollow cores (e.g., Na+, Cl, Ca2+, Mg2+, HCO3, SO42−). These sequestered minerals (e.g., NaCl) crystallize within the hollow spheres as the polymers are dried (Figure 6d).

4. Applications

The hydrodynamic groundwater plume (or mound), can be used to decontaminate the aquifer or soil. The process duration, as demonstrated in the Appendix A, Appendix B, Appendix C, Appendix D, Appendix E, Appendix F, Appendix G, Appendix H and Appendix I, is a function of the size of the contaminated area and the pollutant considered.
Natural contaminants, such as NaCl or As, can be removed from the hydrodynamic groundwater plume (or mound). The plume can then be used as an anthropogenic source of water. Abstraction for anthropogenic use only occurs when the water composition falls between the pre-set limits (e.g., salinity (NaCl) between 0.5 and 2.5 g L−1 for irrigation applications).
The general remediation process followed for all contaminants is:
  • Identify the contaminant plume and define its extent (Figure A1);
  • Establish the nature of the aquifer, in terms of permeability, porosity and fluid flow characteristics for both the water and the contaminant;
  • Define a target area, and gross rock (aquifer) volume, for the construction of the stationary hydrodynamic mound (Figure A1 and Figure A17), using a mixture of infiltration and abstraction wells;
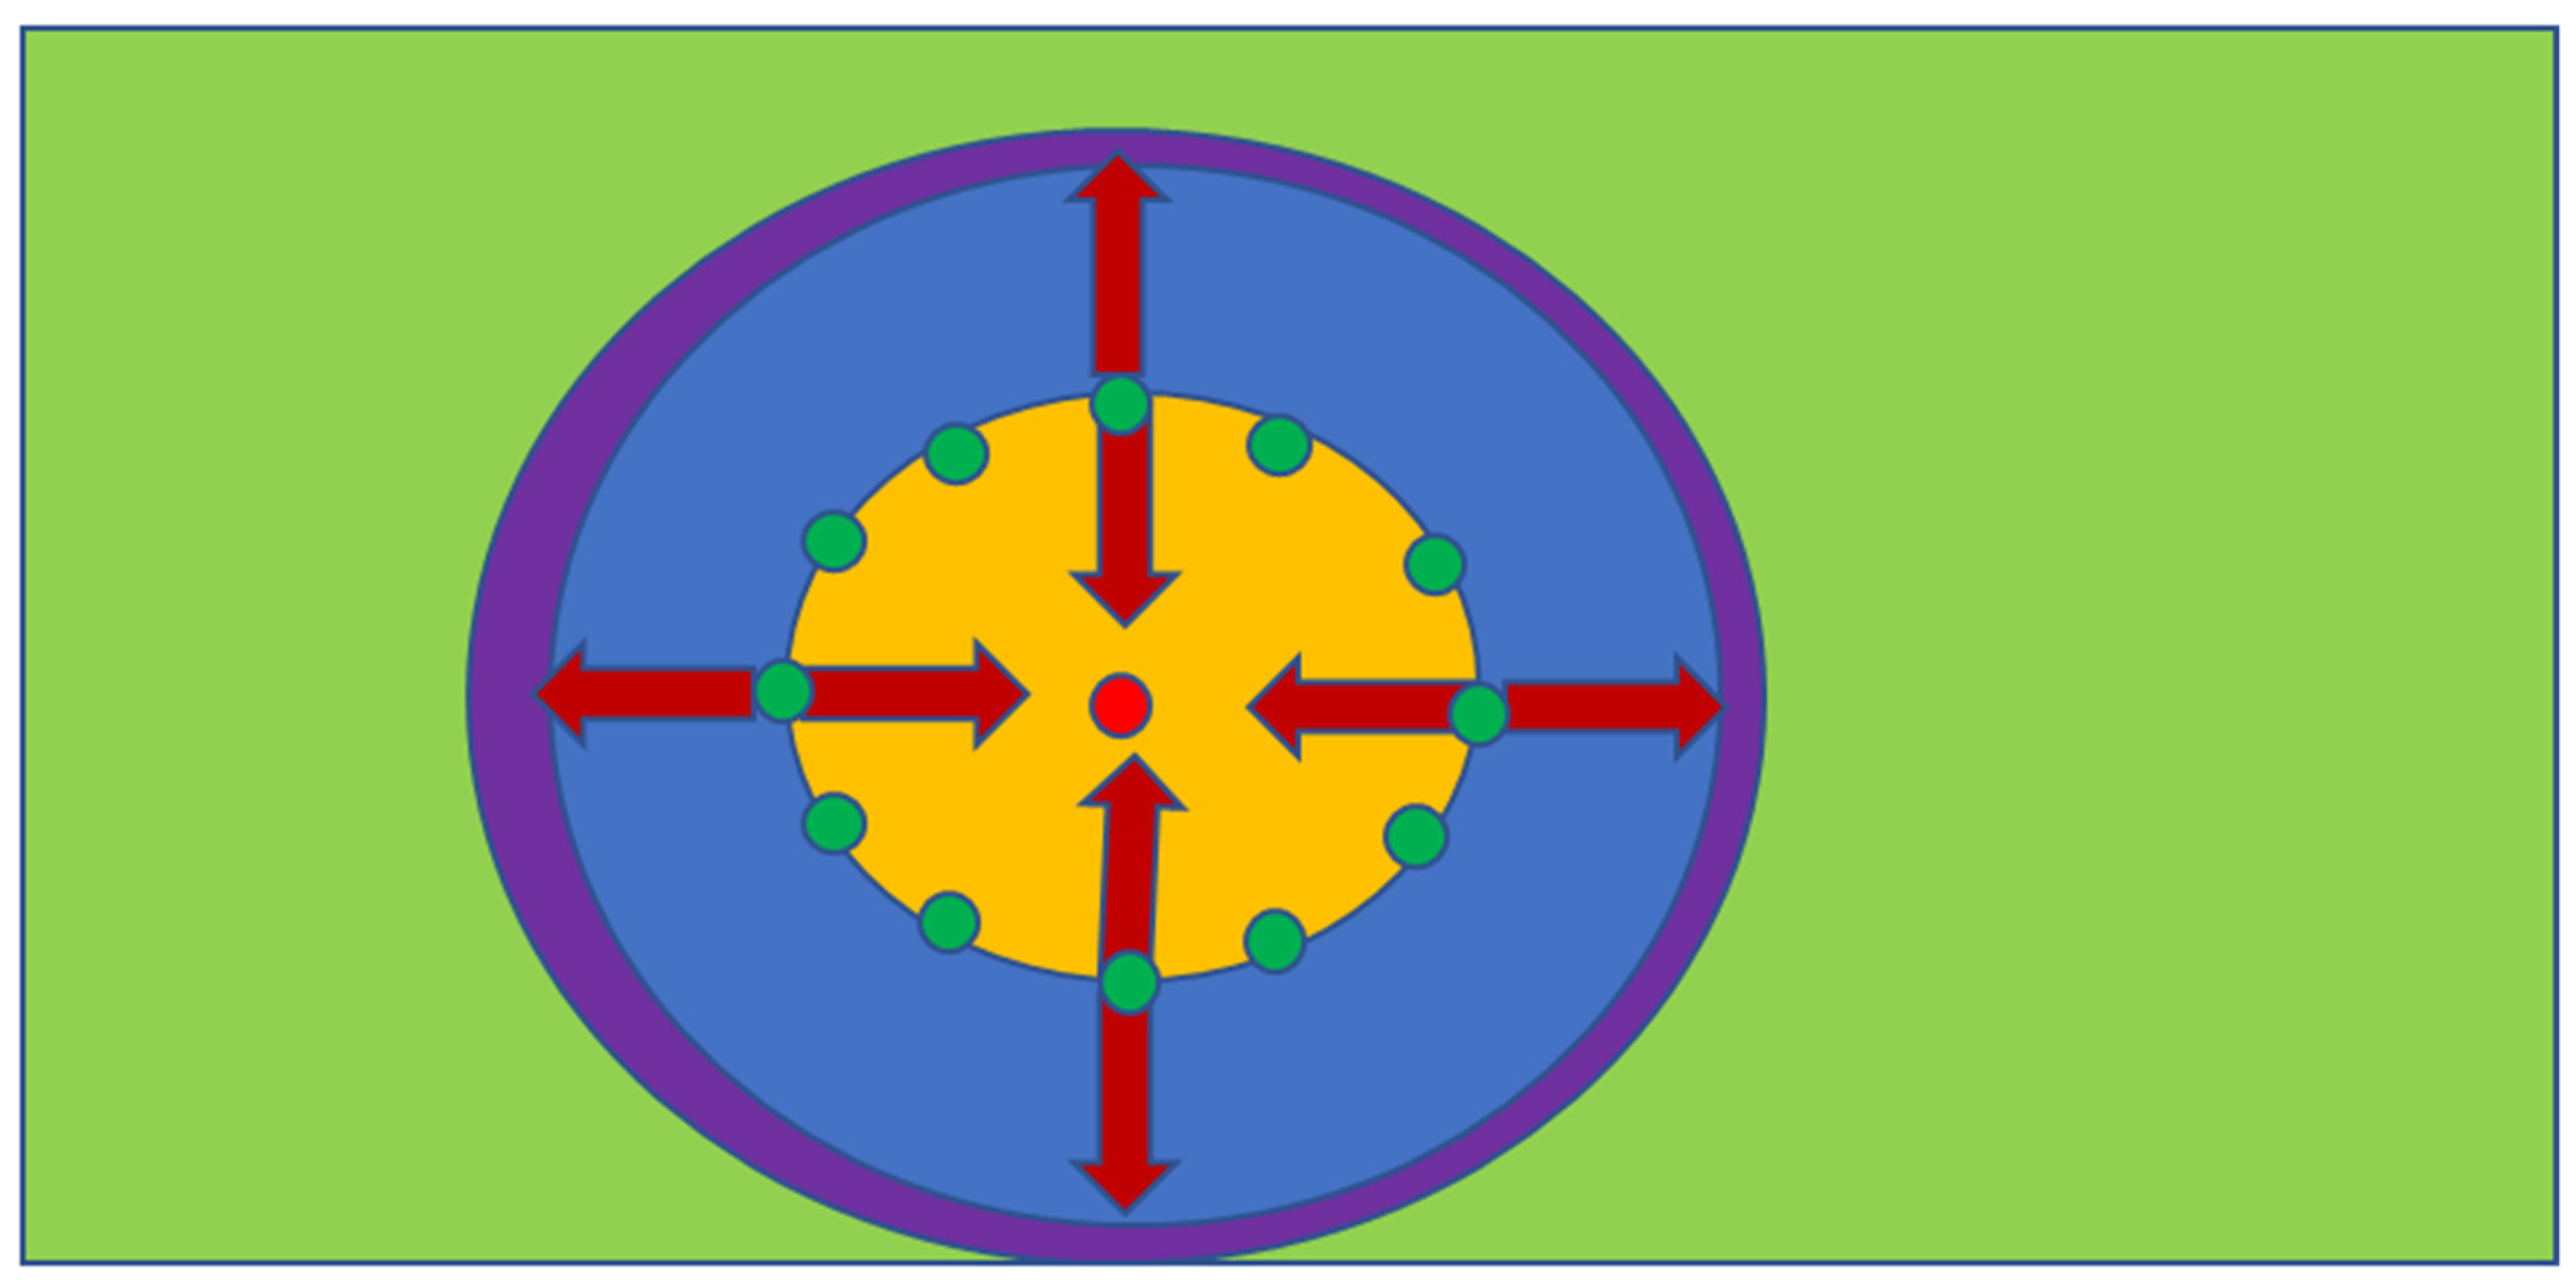
  • Insert the required infiltration and abstraction wells (Figure A17). Start abstracting water from the central part of the mound, and reinjecting/infiltrating water around the periphery (Figure 3). The potentiometric surface across the area will reorientate, to create a stationary hydrodynamic mound, e.g., Figure 7. The hydrology of this change is summarized in Appendix A and Appendix I.
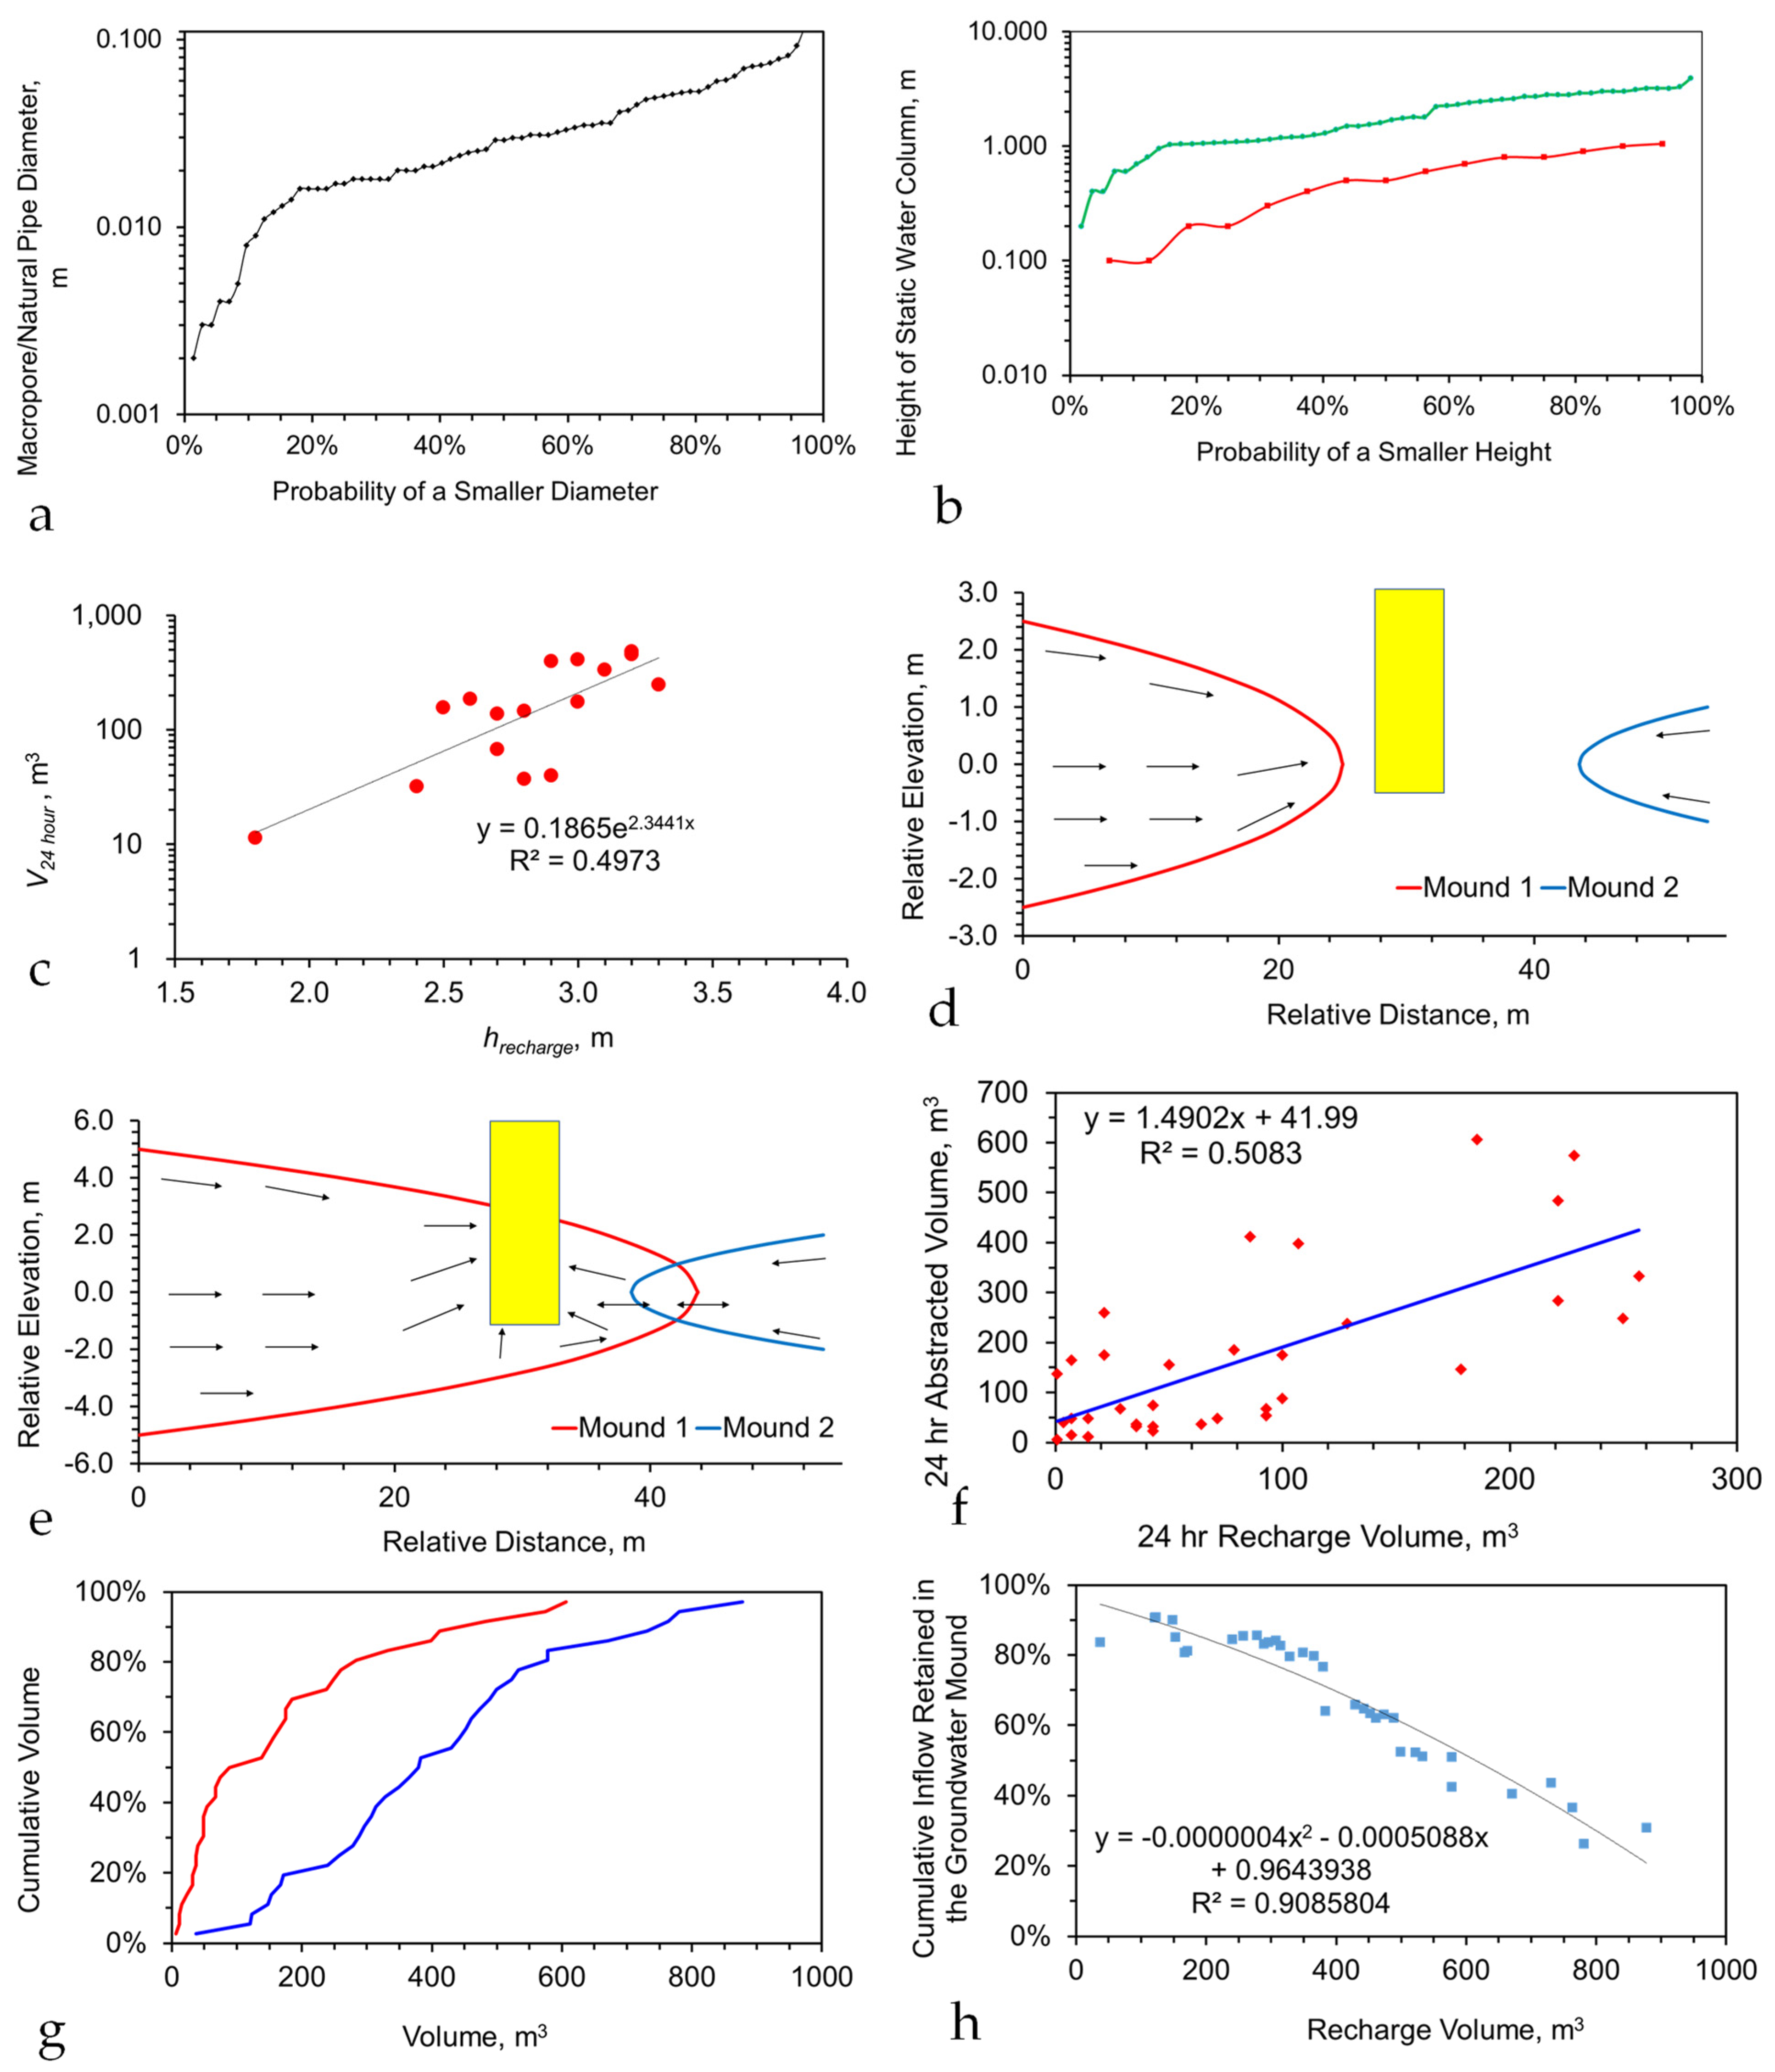
  • An idealized mound structure is shown in Figure 7. The idealized mound has no water leakage from the aquifer, into the hydrodynamic mound. In an idealized environment the contaminant concentration will reduce to zero, within the mound, over a short time span (Figure A2a). In reality, there will always be some fluid leakage, from the wider aquifer into the mound. This leakage, will control the amount of remediation, which is possible (e.g., Figure A2b), at a specific aquifer location, when the contaminant, is a natural pollutant (e.g., As). When the contaminant is an anthropogenic pollutant, fluid leakage from the wider aquifer, will not affect the ability of the process to remove the pollutant. The expected pollutant removal profile, in this situation, is shown in Figure A2a.
  • The choice of ZVI (Appendix C) used in the reactor (Figure A6), and the reactor type selected will define the reactor size required, the amount of ZVI required, the Eh and pH of the product water (Figure A13 and Figure A14), and the amount of water, which can be processed by, a single batch of ZVI. For example, Appendix I examines (e.g., Figure A29) the removal of As, using three different forms of n-Fe0. The same level of removal, could be achieved, with each form of n-Fe0. However, the amount of n-Fe0 varies, by a factor of 10, between the different types of n-Fe0. The example, n-Fe0 formulations in Appendix I, indicate that to achieve the idealized outcome, illustrated in Figure A2a, the reactor, processing 40 m3 h−1, would require 400 kg n-Fe0 h−1, or 40 kg n-Fe0:AC h−1; or 80 kg n-Fe0:BC h−1. Using 400 kg n-Fe0:AC h−1, would significantly reduce the remediation time (e.g., Figure A2c). Therefore, the process economics and remediation duration, is impacted by the type Fe0 selected, and the amount used. These details are site specific.
  • The redox modification within the reactor (Figure A13 and Figure A14) will result in the Eh of the stationary mound decreasing with time, while its pH will in-crease with time.

4.1. Example Aquifer Desalination

As an example, a traveling line reactor train (internal volume 3.76 L, 0.0423 m O.D.; water flow rate 0.4 L m−1 (24 L h−1)), processing saline water (pH = 9.06; Eh = 0.215 V; PSE = 0.0237 V; Cl = 7.89 g L−1; Na+ = 6.03 g L−1), produced a product water over 10 h with an average composition of pH = 12.58, Eh = −0.53 V, PSE = −0.042 V, Cl = 1.39 g L−1, and Na+ = 0.97 g L−1, using a sol-gel Fe(a,b,c) polymer constructed from 0.4 g L−1 of FeSO4 + 0.13 cm3 L−1 of formic acid + 0.06 g L−1 of tartaric acid + 0.38 g L−1 of CaO + 0.16 g L−1 of K2CO3; + 0.27 g L−1 of CaCO3 + 0.18 g L−1 of MnO2 + 0.36 g L−1 of ZnO. This reactor, achieved an 82.3% Cl removal and an 83.9% Na+ ion removal, over a reaction period of 9.4 min. Increasing the reactor O.D. to 0.2 m would allow 40 m3 h−1 (960 m3 d−1) to be processed using 67 parallel reactor trains.
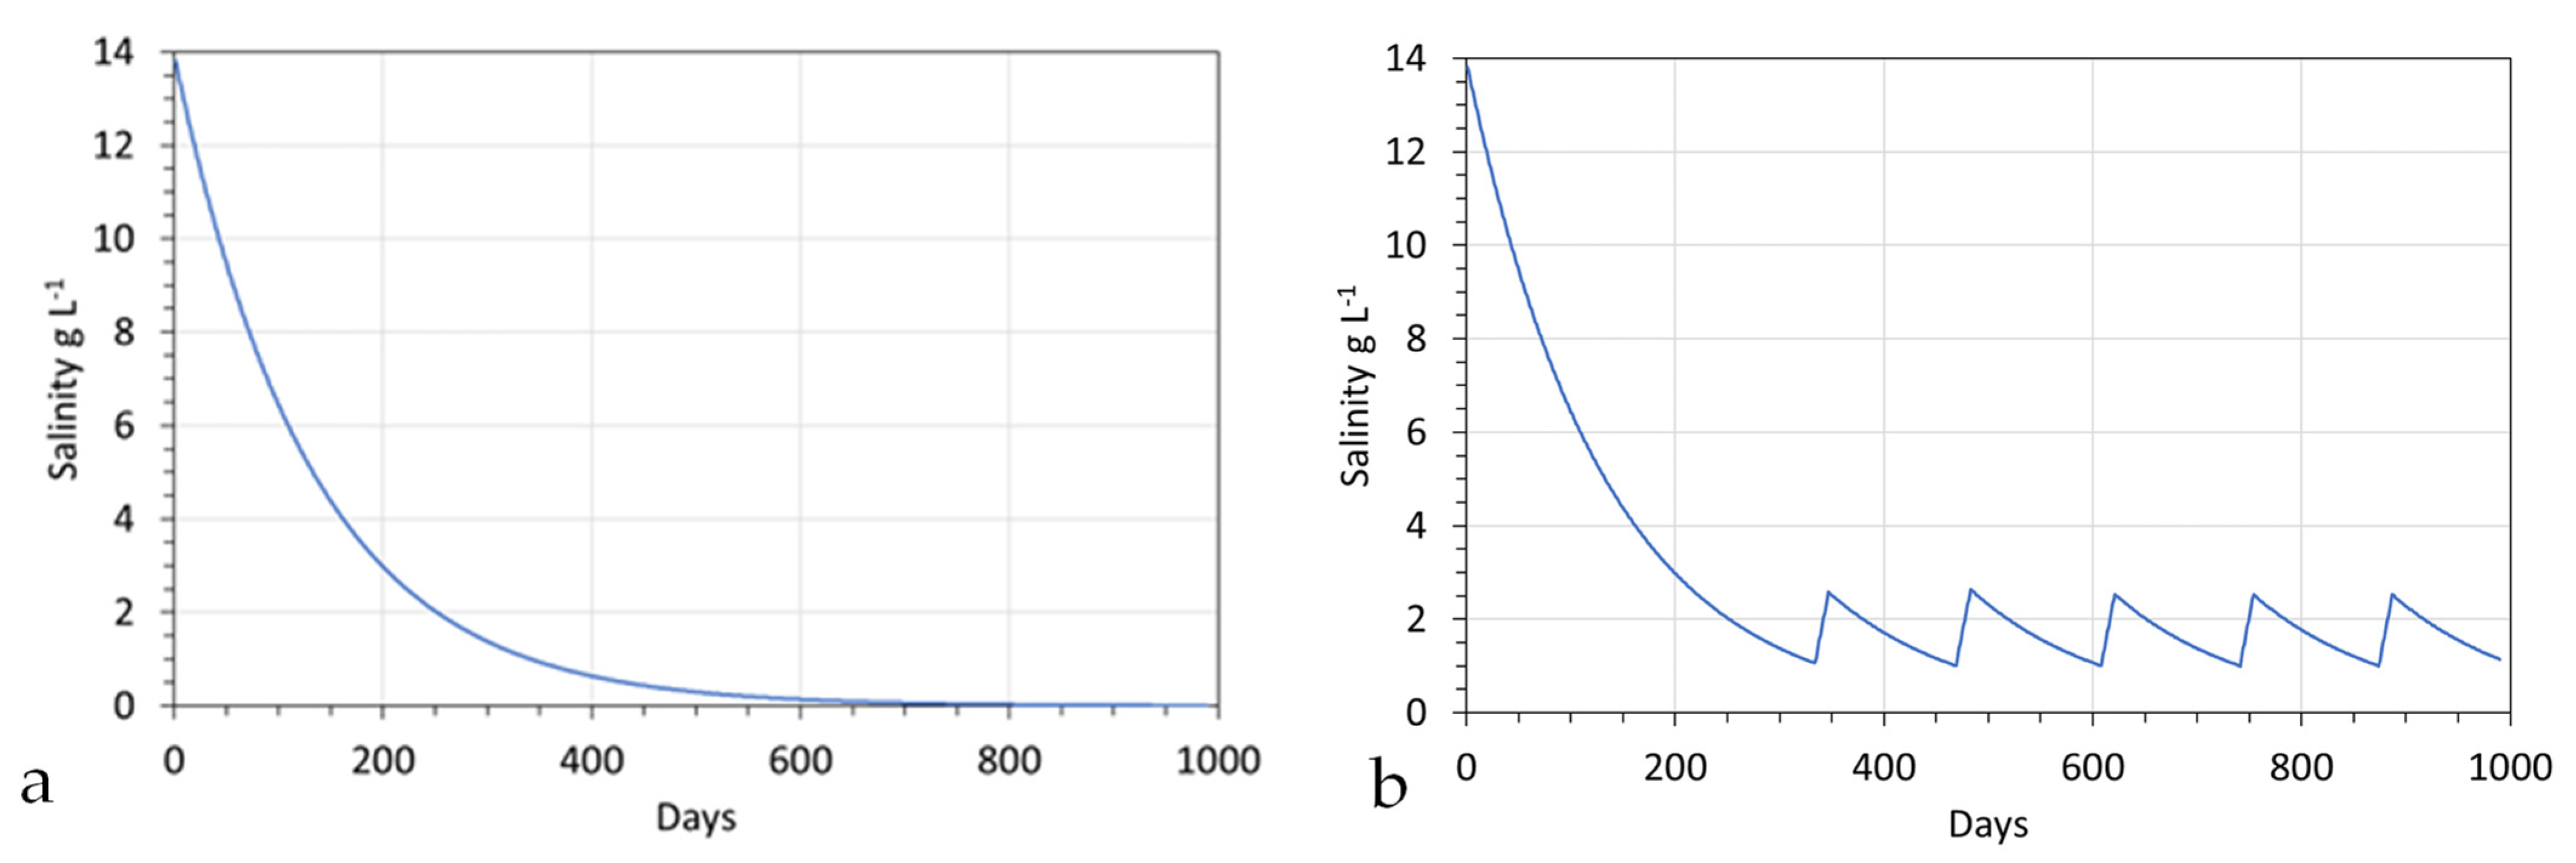
If the stationary plume held 100,000 m3, then abstraction of 40 m3 h−1 (960 m3 h−1), followed by a reinjection of 40 m3 h−1, would result in a gradual decline in the salinity of the hydrodynamic stationary plume (Figure 8a). This profile form is common to all perched groundwater mounds and hydrodynamic stationary plumes during the initial desalination or decontamination phase.
Once the plume, or mound, has achieved the desired ion concentration, it can be allowed to dissipate into the aquifer or soil. Alternatively, it can be used as a source of decontaminated water for anthropogenic use. This will, in the case of a stationary plume, result in water from the aquifer replacing the abstracted water. This will then lead to a rise in the salinity (or contaminant concentration) of the stationary plume [121]. Once the contaminant concentration exceeds a critical level, abstraction for anthropogenic use ceases until the contaminant concentration reaches a new lower base level [121]. An example of an application where the stationary plume salinity oscillates between a higher value (2.5 g L−1) and a lower value (1 g L−1) during periods of abstraction is provided in Figure 8b.

4.2. Groundwater Mound Decontamination

In many areas, the soil permeability characteristics are not suitable to allow the formation of a perched groundwater mound, and the groundwater mound will descend until it intersects with either an aquitard or an unconfined aquifer. Where the groundwater mound intersects with an unconfined aquifer, it may dissipate into the aquifer [123]; this is after it has initially formed a lens or mound of decontaminated water, resting in/on the upper surface of the unconfined waterbody [123,124]. Continual recharge may make the freshwater lens a permanent or semi-permanent feature that can be exploited for anthropogenic use [123]. The morphology and longevity of the decontaminated lenses is a function of the water density contrast between the decontaminated lens and the surrounding decontaminated aquifer, and the lens recharge rate and the flow rate within the aquifer [125]. These decontaminated (e.g., desalinated) lenses can be used to provide sources of fresh water for anthropogenic use [125]. While previous studies [123,124,125] use natural recharge to create the freshwater lenses, this study has demonstrated that a hydrodynamic descending perched groundwater mound, or a hydrodynamic stationary plume, could be used to produce freshwater lenses, freshwater groundwater mounds, or freshwater stationary plumes in saline confined or unconfined aquifers and soils. This approach may provide a larger and more sustainable access to freshwater within areas where natural freshwater lenses are associated with saline unconfined aquifers.

5. Conclusions

The decontamination of an aquifer or soil that is either naturally contaminated (e.g., saline water) or contaminated as a result of anthropogenic activity, can be undertaken using a PRB or an injected n-Fe0. This study has examined whether it is conceptually possible to decontaminate these soils or aquifers using either hydrodynamic stationary plumes or hydrodynamic perched groundwater mounds. The contaminated water is abstracted from the stationary plume or the perched groundwater mound. It is then decontaminated using a reactor containing ZVI, before being reinjected into the stationary plume or the perched groundwater mound.
Integrated hydrological, hydrodynamic and ZVI redox/catalytic/adsorbent kinetic modelling suggests the following:
  • Immiscible liquids, which are lighter than water, can be abstracted from the aquifer (or soil) using both a water flood and a surfactant flood approach. The liquids are either recovered or are processed in a surface reactor containing ZVI before the residual water is reinjected.
  • The miscible liquids and dissolved ionic salts that are contained in contaminant plumes can be abstracted from an aquifer, by converting a part of the aquifer into a stationary plume. This results in both the sub-surface dilution of the contaminant and the surface-based ZVI remediation of the contaminant.
  • The miscible liquids and dissolved ionic salts that are contained in naturally contaminated aquifers can be abstracted from an aquifer by converting a part of the aquifer to a stationary plume. This results in surface-based ZVI remediation of the contaminant, followed by the reinjection of the decontaminated water in order to produce a diluted contaminant level. Following a prolonged period of operation, the process will produce a decontaminated aquifer within the stationary plume.
  • The miscible liquids and dissolved ionic salts that are contained in naturally (and anthropogenically) contaminated soils can be abstracted from a soil by converting a part of the soil to a perched groundwater mound. This results in the surface-based ZVI remediation of the contaminant, followed by the reinjection of the decontaminated water, which produces a diluted contaminant level. Following a prolonged period of operation, this process produces a decontaminated soil within the groundwater mound.
Experiments have established that the effective processing of the contaminated water in surface-based reactors could be operated with a redox reaction; this would involve increasing the pH by 1 to 4 units and decreasing the Eh by 0.1 to 0.5 V over a sustained period. The magnitude of the pH increase and the Eh decrease increases with the decreasing space velocity, decreasing particle size, and increasing particle surface area. These experiments suggest that it may be possible to use a single ZVI charge to process >25,000 m3 t−1 of ZVI.
Hydrodynamic models established the technical viability of creating a hydrodynamic stationary plume. Integrating these models with surface-based ZVI water treatment kinetic data, indicates that the stationary plumes can be used to decontaminate reservoirs areas, zones, or volumes, that contain contaminant plumes or natural contaminants.
Infiltration experiments have established that it is possible to sequester large volumes of water in perched groundwater mounds, and that it is possible to abstract water from these mounds. Integrating this experimental data with surface-based ZVI water treatment kinetic data indicates that these mounds could be used to decontaminate soils, and could act as repositories or reservoirs of decontaminated (or desalinated) water for anthropogenic use.

Funding

This research received no external funding.

Data Availability Statement

All data used in this study is provided in the figures and appendices.

Acknowledgments

The three reviewers and the Academic Editors are thanked for their constructive comments.

Conflicts of Interest

The author declares no conflict of interest.

Appendix A. Process Assumptions

The basic process design is summarized in Figure 3 and Figure 4. This includes three key operational elements. These operational elements are as follows: reactor containing ZVI, one or more abstraction wells, one or more injection wells, and infiltration devices (e.g., soakaways, infiltration trenches, permeable pavements, ditches, detention/attenuation basins, etc.). The combination of injection/infiltration and abstraction is used to create the stationary hydrodynamic plume.

Appendix A.1. Stationary Hydrodynamic Plume in a Confined or Unconfined Aquifer

Stationary contaminant plumes, or quasi-stationary contaminant plumes, can develop naturally within an aquifer [126,127], or they can be created through the use of abstraction and injection wells [102].
Natural stationary plumes (Figure A1), where the contaminant is immiscible and less dense than water (e.g., oils), form hydrodynamically trapped accumulations, located at the junction of the aquifer with the overlying aquitard (confined aquifer), at the air-water/fluid interface (unconfined aquifer), or at locations of permeability change within the aquifer [68,126].
The hydrodynamic abstraction process, from the aquifer, will merge and aggregate immiscible droplets as they are removed from the aquifer, prior to the water’s entry to the ZVI reactor. A wide variety of apparatus and separators are commercially available to remove the oil, immiscible liquids, and entrained solid particles from the abstracted water. They have been widely used in the oil/gas abstraction industry, the petrochemical industry, and in mitigating the hydrocarbon pollution that is associated with storm water runoff from roads. This separation technology is in a state of continual evolution, e.g., US20110147302A1; US20200330991A1; US10000391B2; US11261595B2.
This process (Figure 3 and Figure 4) simplifies the overall remediation process, and removes much of the outcome uncertainty associated with the existing PRB and injected Fe0 processes. Oils entering the PRB may be degraded by the Fe0 [101], or degraded by emulsified n-Fe0 injected into the aquifer ([128]; US7037946B1; US6664298B1). The non-aqueous phase liquids (NAPL) may be treated within the aquifer, upstream of the PRB. This treatment involves the injection of a chemical agent into the aquifer, which is designed to dissolve the NAPL (US8764988B2; US9884771B1; [129,130]).

Appendix A.1.1. Soluble, or Miscible, Contaminant Plume

Most hydrodynamic plumes comprise a soluble or miscible contaminant (Figure A1), whose concentration extends into the aquifer or soil from a point source. They can be dissipated by biodegradation, solute dilution in the aquifer (by chemical potential migration), and by the chemical treatment of the aquifer (e.g., by ZVI) to remove the pollutant.
The plume is created by fluid dissipation from one or more point sources. The contaminant plume at a time t is three dimensional in form, and varies in shape and size with time. In a typical aquifer, it is located within the aquifer between the upper and lower aquitards. The highest concentration of pollutant in the plume occurs at the point source and can be termed Cp0. At any other x,y,z location within the aquifer, the concentration of the pollutant is Cx,y,z.
The location of the contaminant plume can be mapped, at any given time, by determining the values of Cx,y,z throughout the aquifer. The normalized contaminant concentration at each x,y,z location, CNxyz, becomes, as follows:
CNxyz = Cx,y,z/Cp0,
The contaminant plume is orientated in the direction of aquifer flow, and the normalized contaminant concentration decreases towards its upper, lower, and lateral margins. Naturally contaminated aquifers (e.g., saline aquifers) have a CNxyz of 1 (Figure A1).

Appendix A.1.2. Creating a Hydrodynamic Stationary Plume

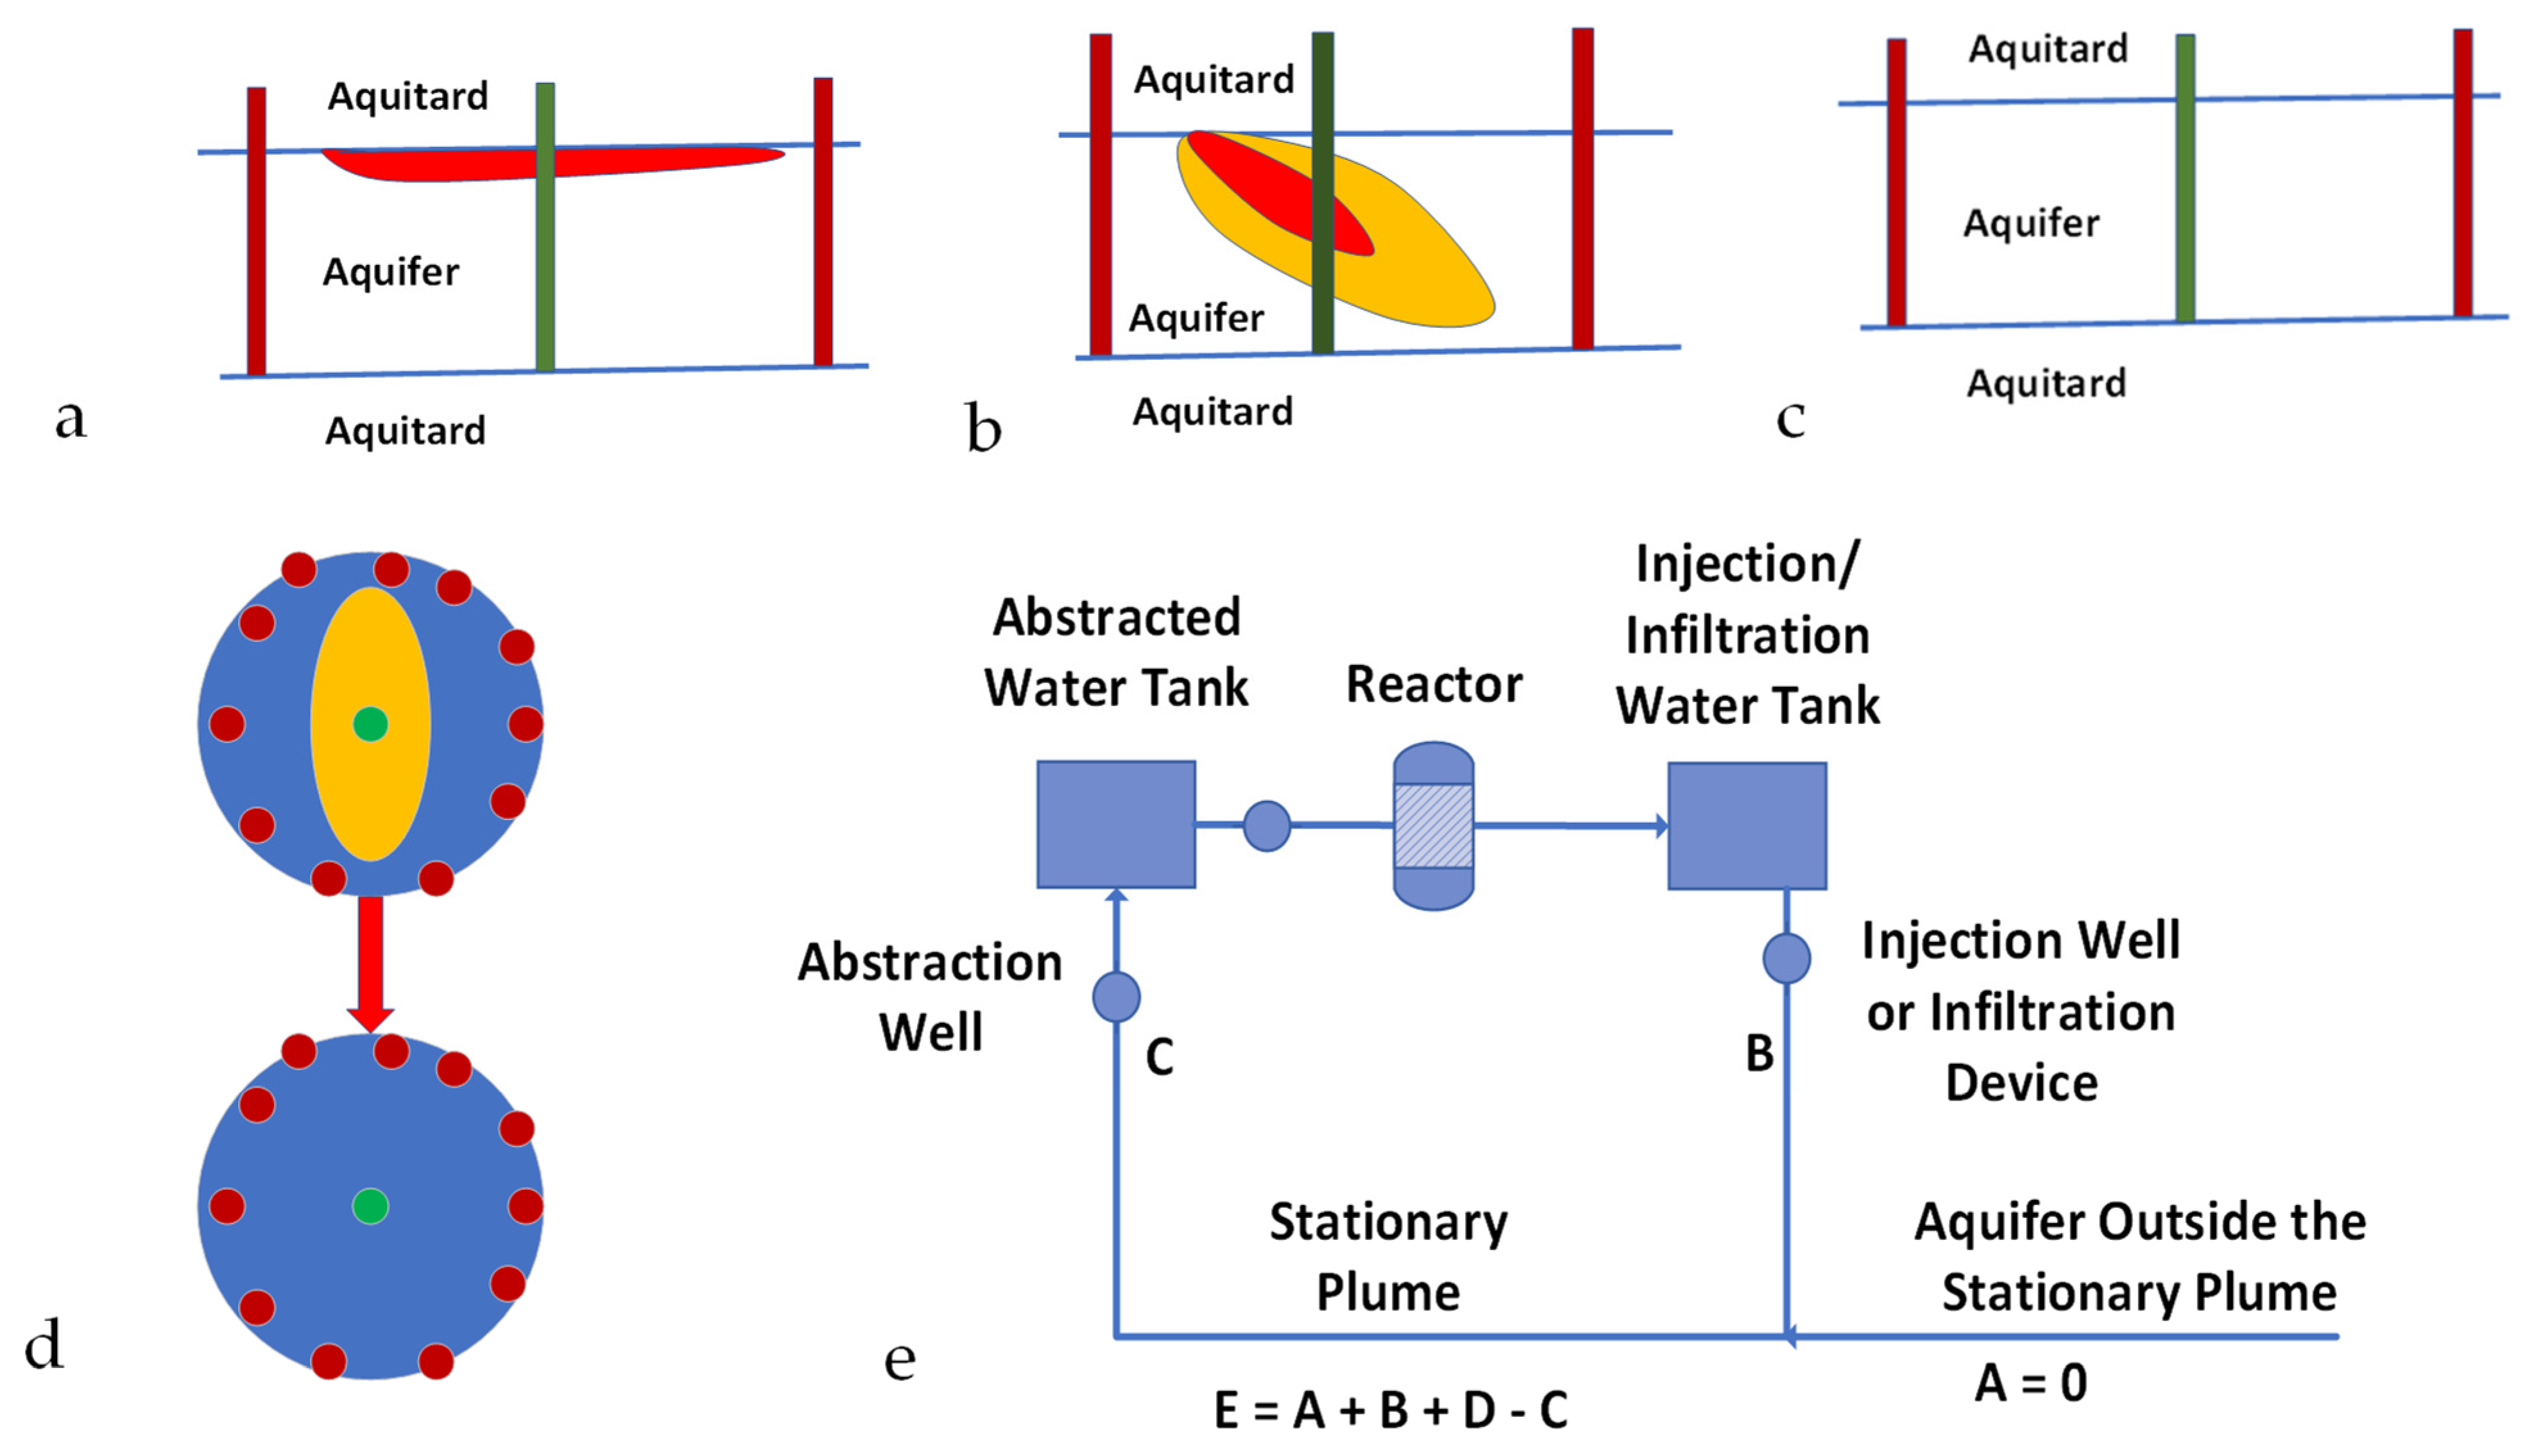
The hydrodynamic stationary plume is created by isolating a contaminated aquifer area by a ring of injection wells surrounding an abstraction well (Figure A1). The assumptions made (Figure A1) in creating and decontaminating the stationary plume [102] are as follows:
  • A volume of water [C] is continuously abstracted from the abstraction well. This water is directed to a storage tank before being processed in a reactor.
  • The water exiting the reactor is passed to a storage tank before being distributed and the volume (B) is injected, or infiltrated, back into the aquifer at a number of recharge points.
  • The water within the stationary plume (E) comprises water infiltrating from the injection wells/infiltration wells (B), plus makeup water from the surrounding aquifer (A), plus irreducible water, Swir (D) within the aquifer, minus abstracted water (C). Sw = E − Swir (D) = mobile water saturation.
  • For base case modelling, it is assumed that A = 0 m3 h−1, and C = 40 m3 h−1.
All confined and unconfined aquifers contain an irreducible water saturation (Swir) and a moveable water saturation (Sw) [131,132,133]. Prior to the construction of the stationary plume, the contaminant concentration in the Swir (g L−1) = the contaminant concentration in the Sw (g L−1). The porosity, ϕ, of the aquifer will, in a confined aquifer, contain only Sw and Swir.
In an unconfined aquifer, where the water table level (potentiometric surface) varies with time, the aquifer will contain Sw + Swir, but will also contain, in zones that are not permanently water saturated, mobile air, Sa, and an irreducible air saturation, Sair [134,135,136,137]. In aquifers where immiscible hydrocarbons or chemicals are present, the porosity may contain an irreducible gas saturation, Sgir, a moveable gas saturation, Sg, an irreducible immiscible liquid saturation Soir, and a moveable immiscible liquid saturation, So [138,139,140,141].
For the purposes of this study, as a simplification, the confined and unconfined aquifers are assumed to only contain water. Where the pollutant is an immiscible liquid or gas, the potentiometric surfaces associated with both the water and the other fluids will be different [68].
Figure A1. Hydrodynamic Stationary Plume Remediation. The hydrodynamic plume is defined by a volume separated by two or more injection wells containing an abstraction well; Green = abstraction well; Brown = injection/infiltration wells. (a), Light immiscible liquid plume (red); (b), Soluble ion or miscible liquid plume (red, orange); The contaminant plume occupies a fraction of the stationary plume volume; (c), Aquifer containing a natural contaminant, e.g., NaCl, As, etc.; (d), Plan view of a hydrodynamic stationary plume, showing removal of the pollutant plume (orange) over time; (e), Process flow diagram, which is designed to create a decontaminated hydrodynamic stationary plume.
Water 15 00540 g0a1

Appendix A.2. Example Operation of a Stationary Plume
If the average contaminant concentration in the aquifer water (E) at time t = 0 is 1 g L−1, and the hydrodynamic stationary plume (Figure A1c) contains 106,028 m3 of water (Sw + Swir), of which Sw = 74,220 m3, then the total contaminant concentration within the plume is 106.028 t.
The initial removal of 40 m3 h−1 (960 m3 d−1), C (Figure A1), via the abstraction well, at time t = 0, will remove 0.96 t of contaminant d−1. If the reactor is able to remove 95% of the pollutant, then the water (B) returning (Figure A1) to the stationary plume (960 m3 d−1) will contain 0.048 t of contaminant.
By the end of day 1, the residual contaminant concentration in the plume (Figure A1c) is calculated using a contaminant mass balance, where
[Et=1], t = [Et=0] − [Ct=0] + [Bt=0] + [At=0],
If the inflow from the wider aquifer [At=0] is 0 m3 d−1, then
105.368 (0.9937 g L−1) = 106.028 − 0.96 + 0.048 + 0.00,
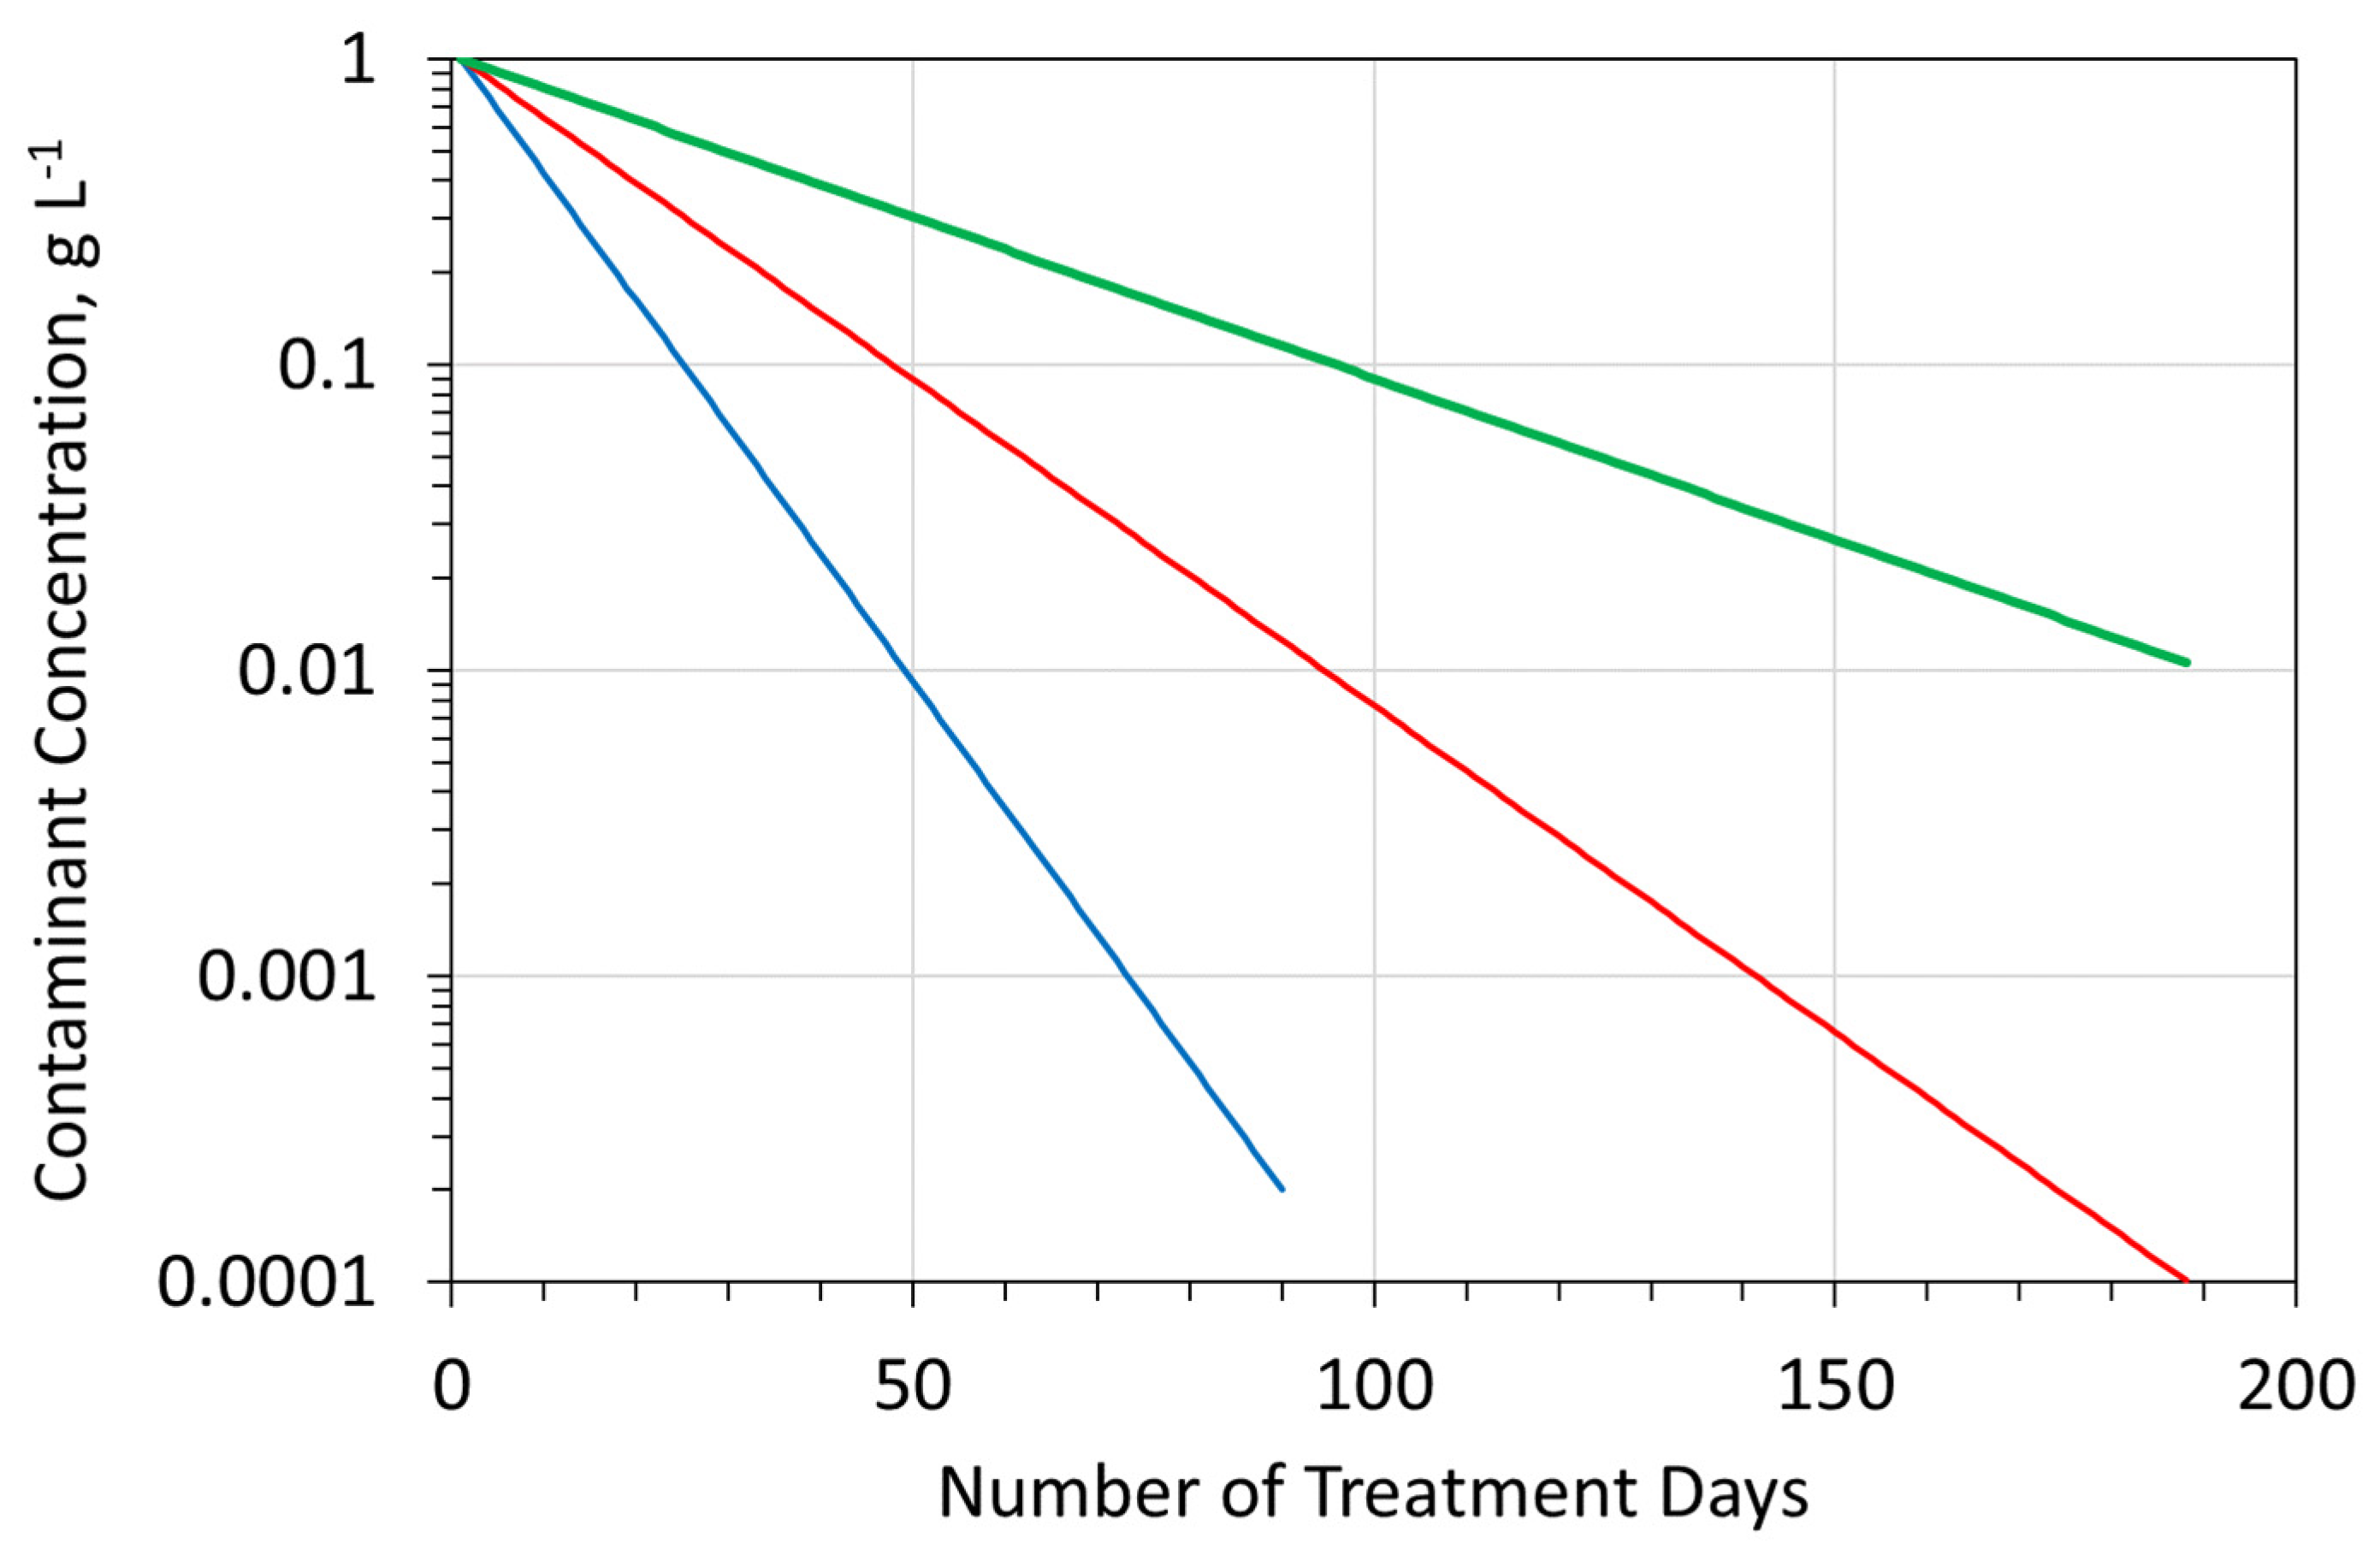
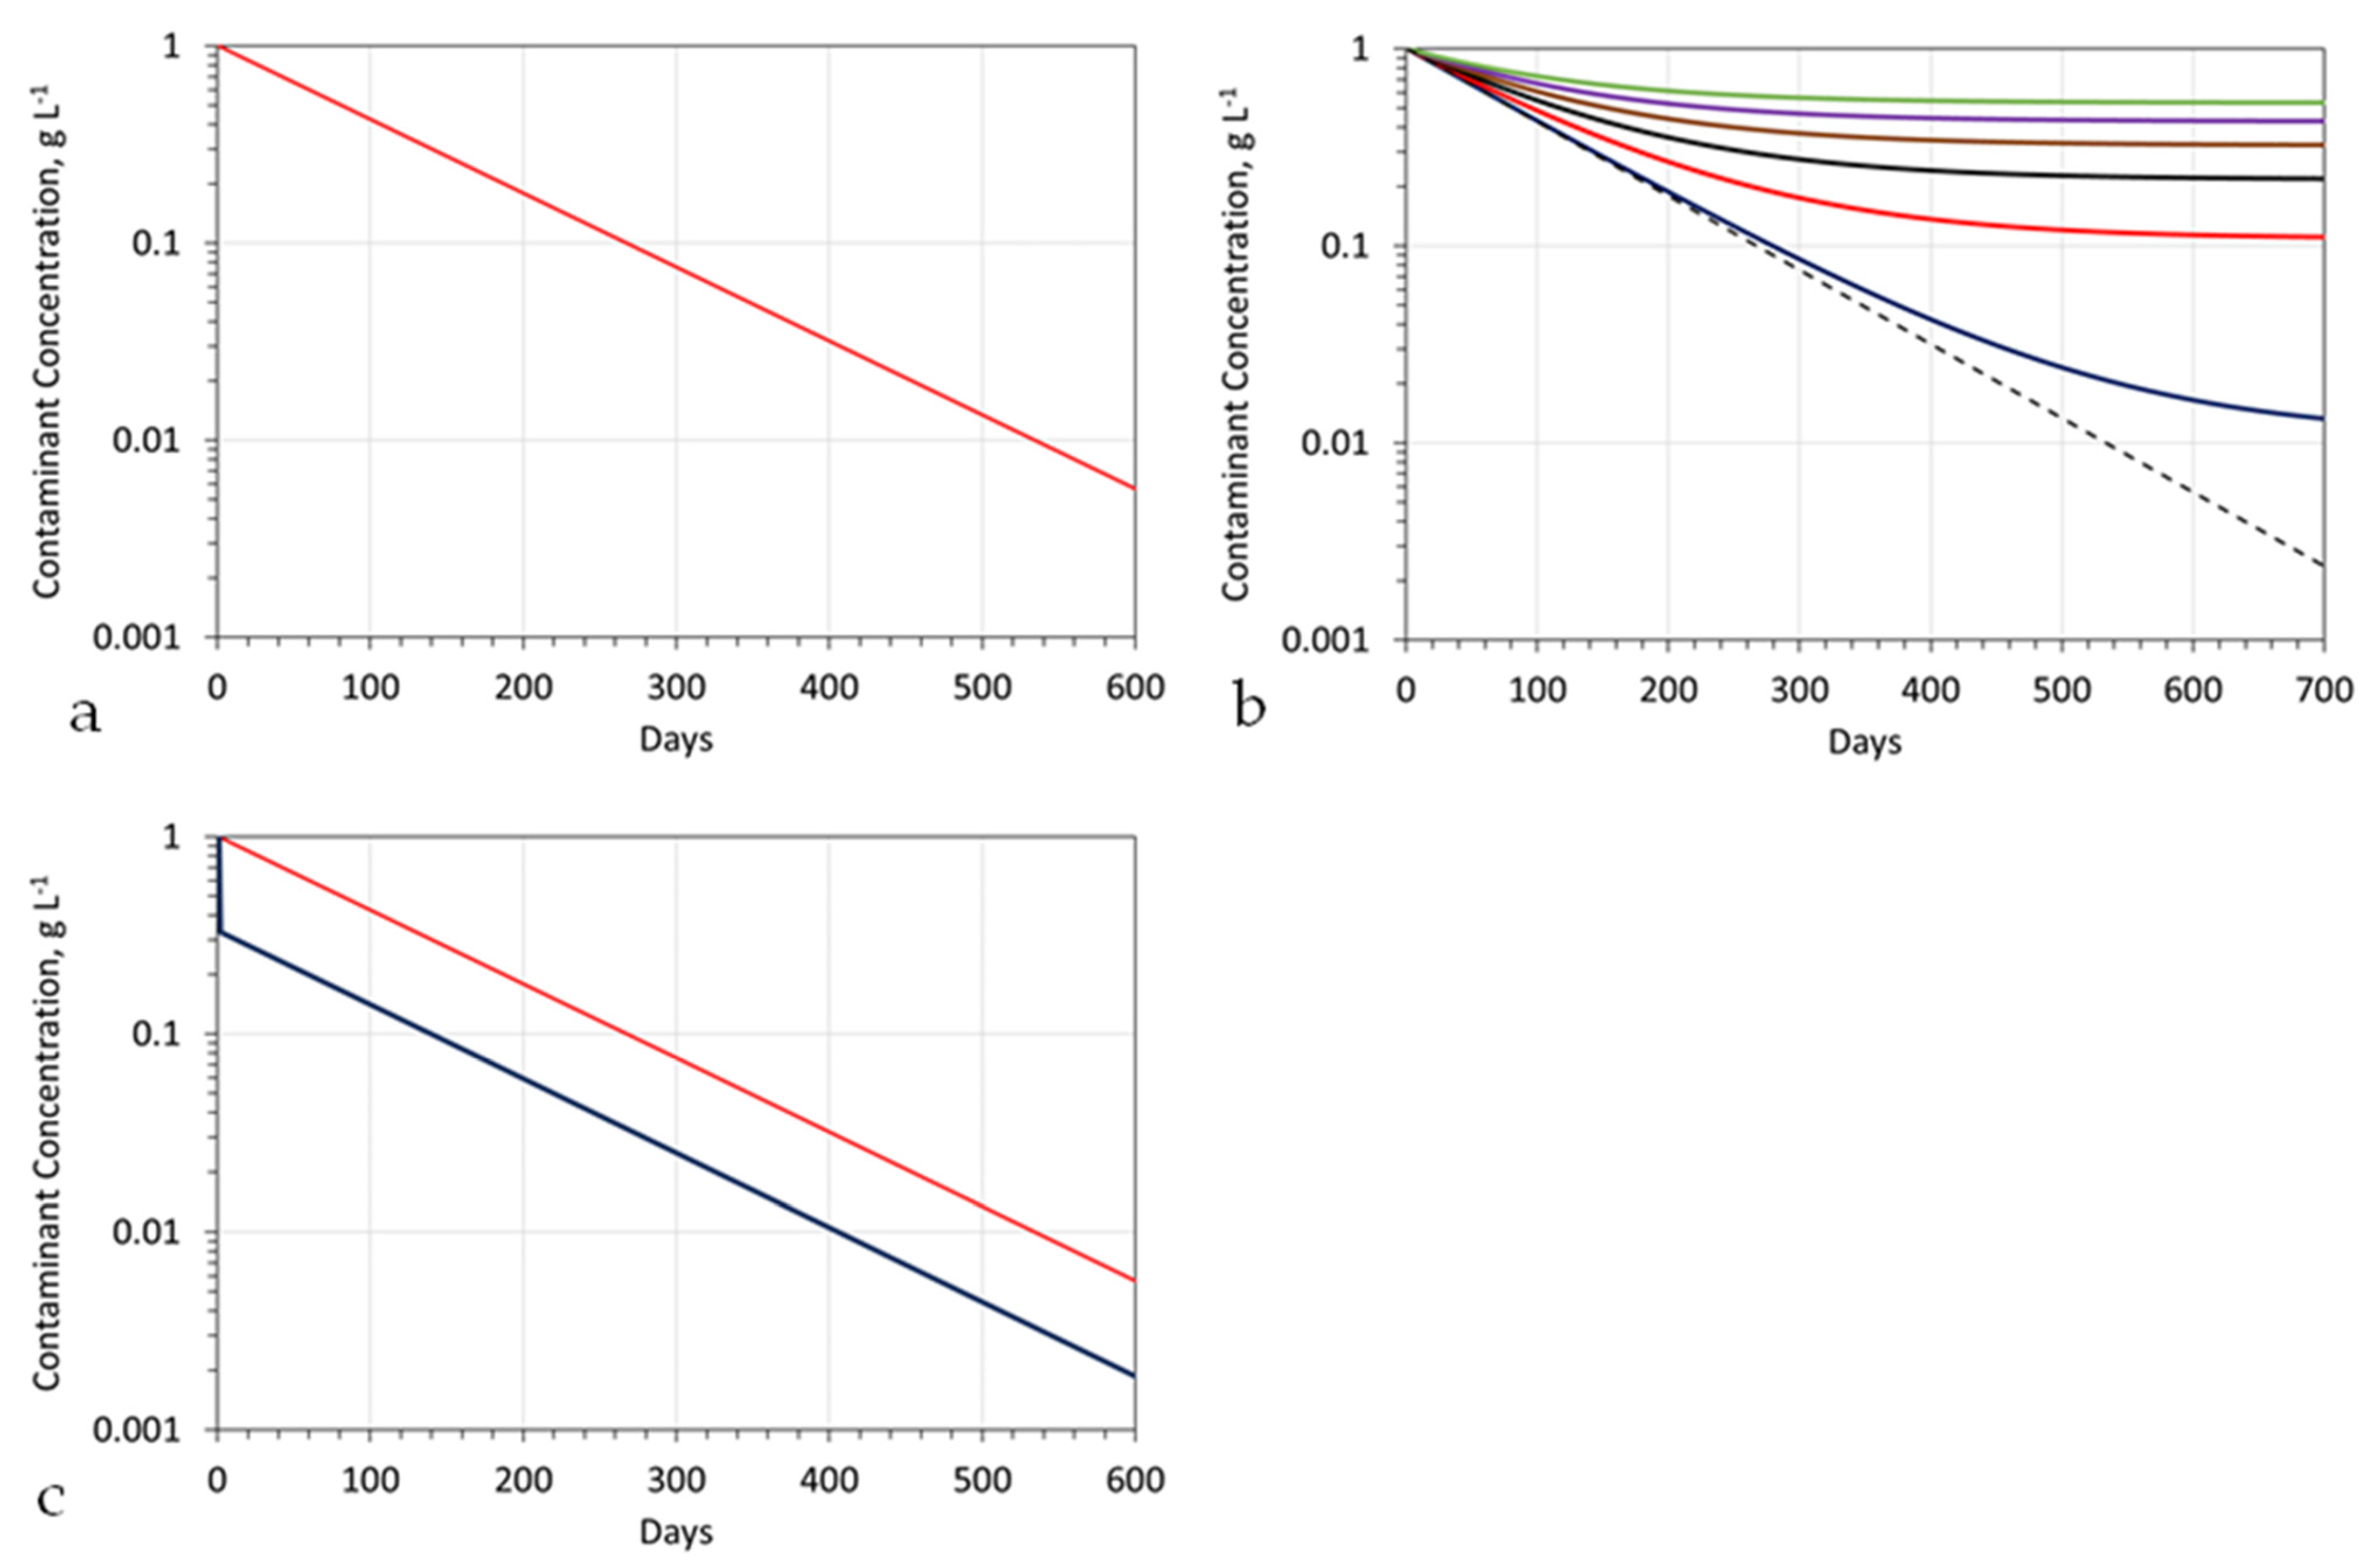
Repeating this process for 365 days will (assuming there is a transfer of contaminant from Swir to Sw, in response to changes in the chemical potential (Appendix B)), result in the contaminant concentration in the stationary mound reducing from 1 g L−1 to 0.043 g L−1 (Figure A2a). Extending the treatment period to 730 days (2 years) would be expected to reduce the contaminant concentration further, to 0.0018 g L−1.
For a first model approximation, it is reasonable to assume that A = 0 m3 d−1. In reality, a stationary mound is leaky. Therefore, it is not unreasonable to assume that A will be between 10 and 400 m3 d−1 (Figure A2b). Since the injection wells are located around the periphery of the plume, it is reasonable to expect that the inflow water, B, will have a proportional loss, BL, to the wider aquifer, which is exactly equal to A where the water mass balance is as follows:
[Et=1], m3 = [Et=0] – [Ct=0] + ([Bt=0] (1 − BL)) + ([At=0] = ([Bt=0] (BL)),
The fluid exchange represented by [A] controls the length of time taken to decontaminate the plume and the maximum achievable level of decontamination (Figure A2b). The exact value of [A] that is applicable to a specific project is a function of the site-specific stationary plume design, actual aquifer conditions, and actual operating conditions. The ratio of the actual achieved final contaminant concentration to the expected final contaminant concentration is an efficiency measure, which reflects the actual efficiency of the installed hydrological operation, combined with the installed chemical operation.
Figure A2. Example pollutant concentration in a stationary plume as a function of processing time, for B = 960 m3 d−1: Stationary Plume details as per Table A1. Initial contaminant concentration = 1 g L−1; (a), pollutant concentration versus time for A = 0; plume Type = Figure A1c; (b), pollutant concentration versus time for black dashed line: A = 0 m3 d−1; blue line: A = 10 m3 d−1; red line: A = 100 m3 d−1; black line: A = 200 m3 d−1; brown line: A = 300 m3 d−1; purple line: A = 400 m3 d−1; green line: A = 500 m3 d−1; plume Type = Figure A1c; (c), pollutant concentration versus time for A = 0; blue = contaminant plume volume is 33% of the stationary plume volume; red = contaminant plume volume is 100% of the stationary plume volume; plume type = Figure A1b; dilution of the stationary plume by a water volume, (which is less than the abstracted water/reinjected water volume, assuming 95% remediation) will show a similar relationship between contaminant concentration and processing days.
Water 15 00540 g0a2

Appendix A.3. Stationary Groundwater Mound Created in Soil

The assumptions made (Figure A3) in creating and decontaminating the perched stationary groundwater mound in the soil are as follows:
  • The soil contains a contaminant that is soluble in water;
  • The soil either overlies an aquitard, or has a horizontal permeability that is substantially greater than its vertical permeability.
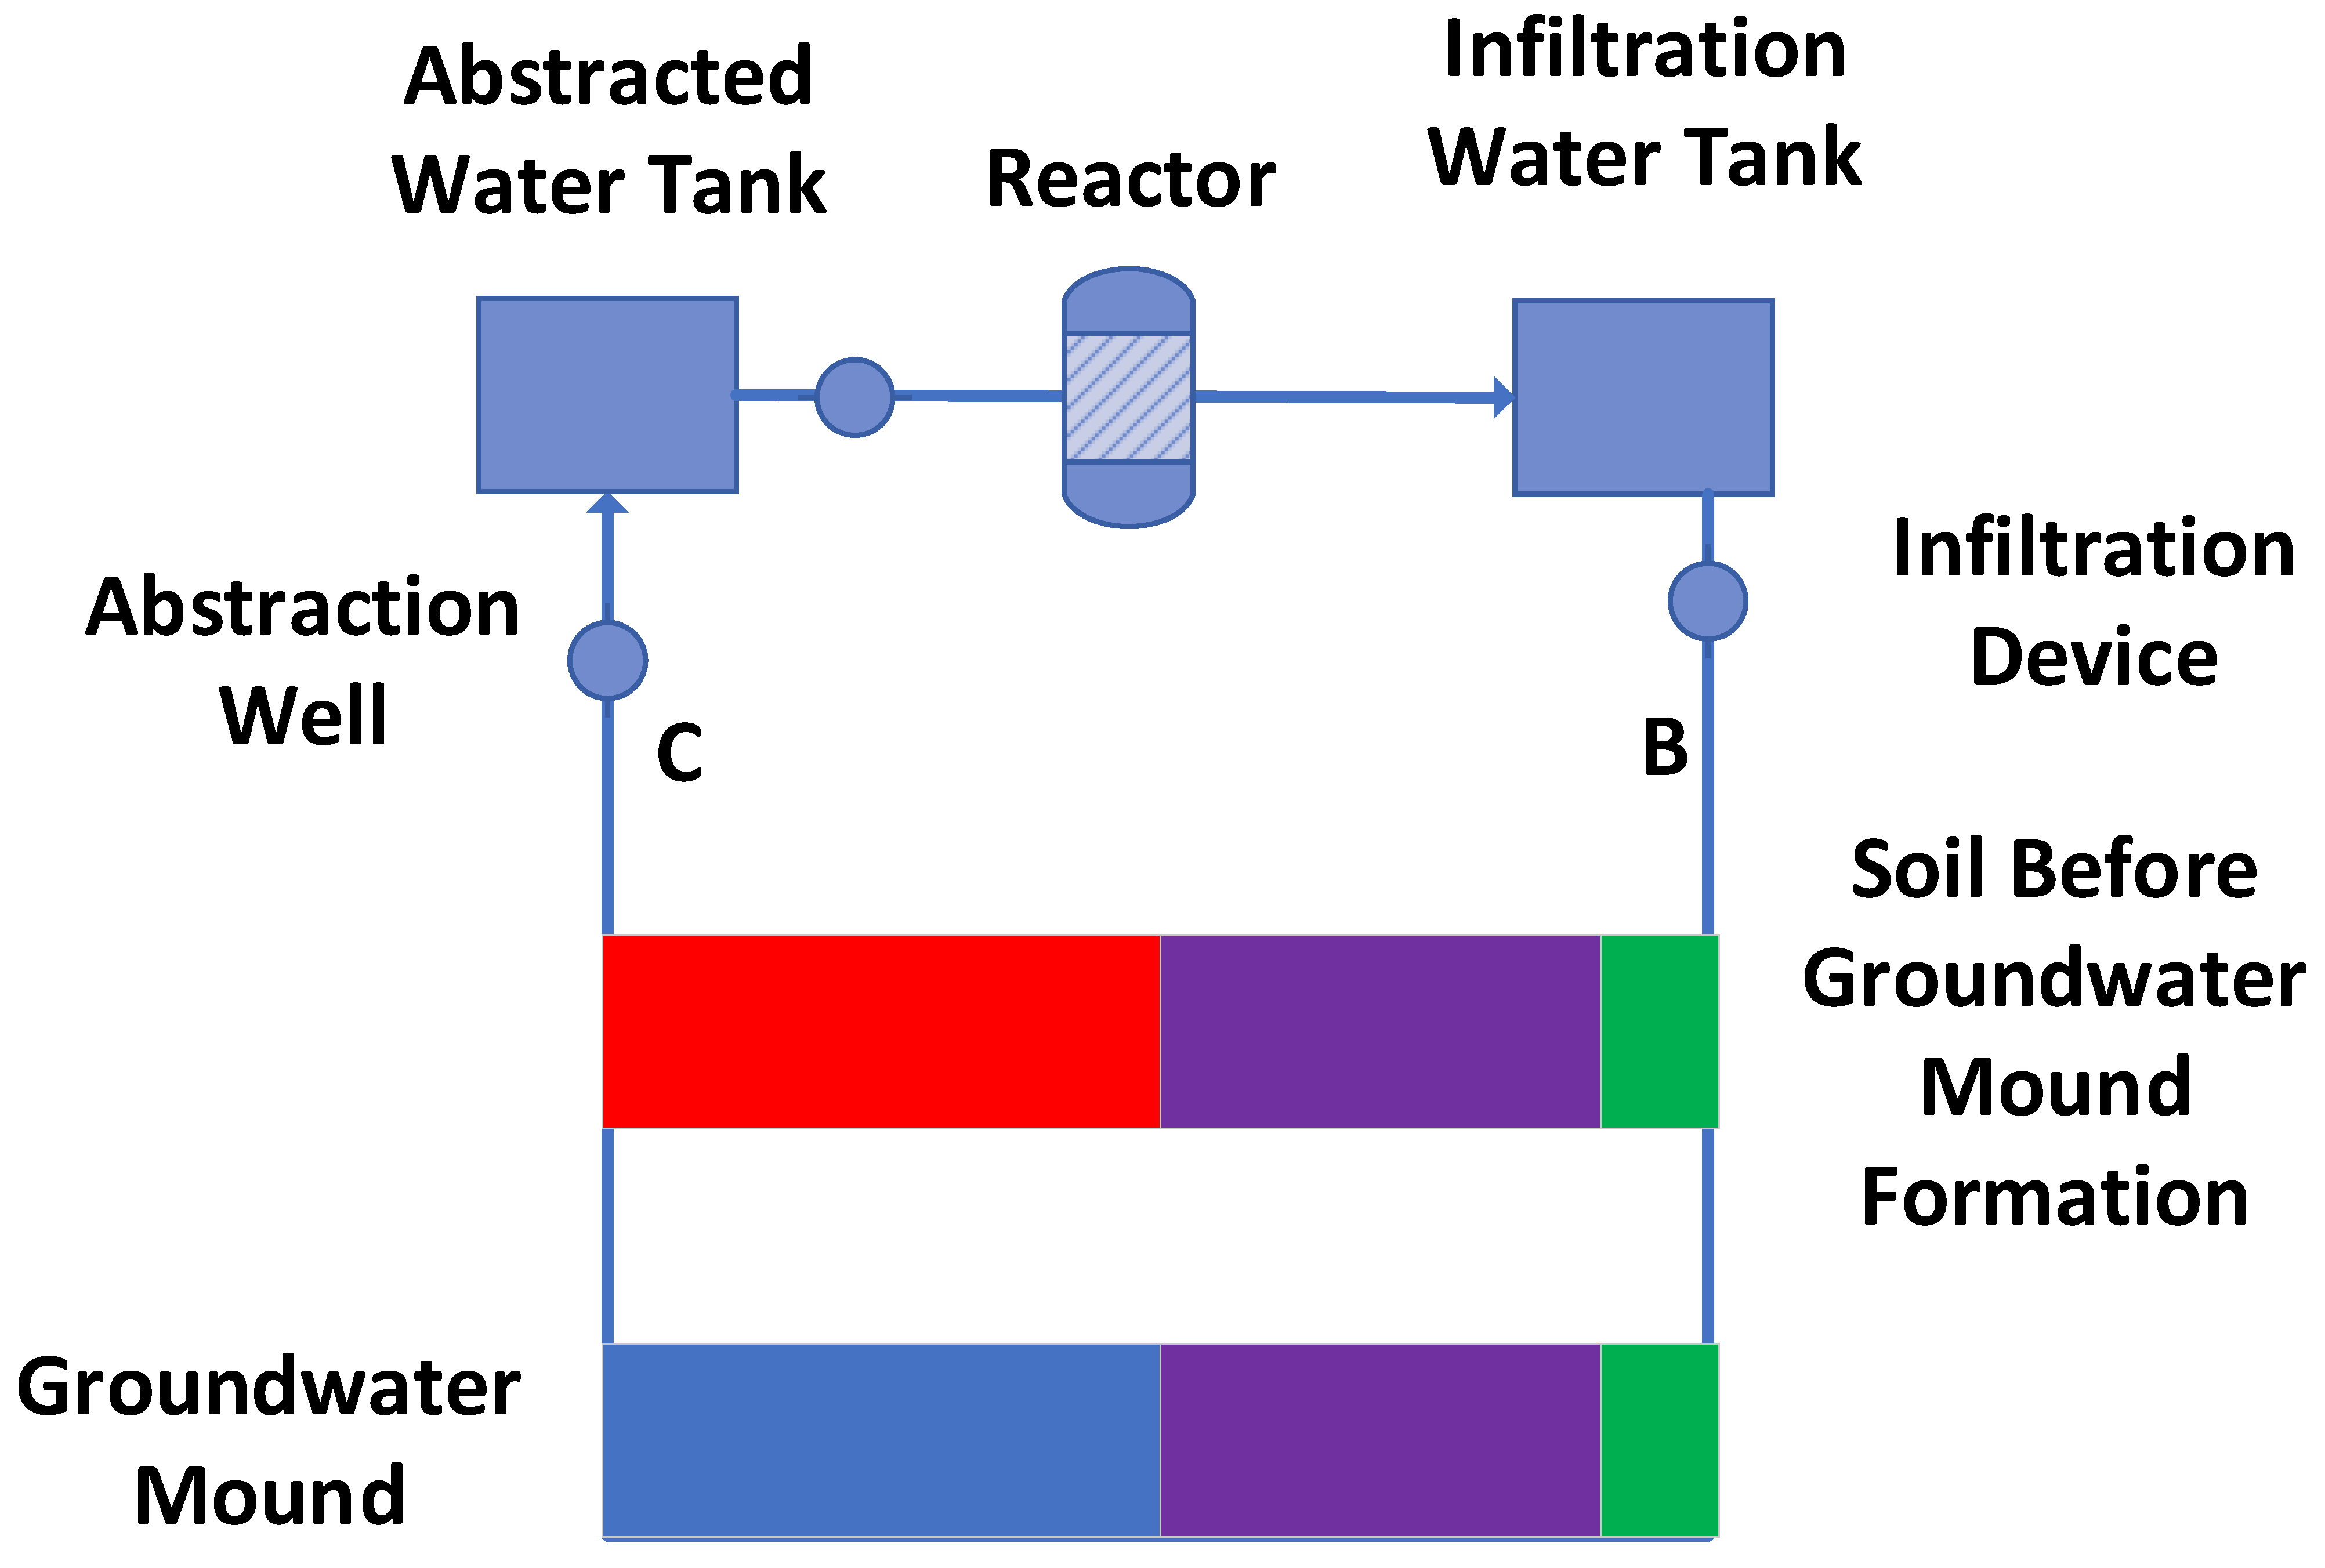
Prior to the formation of the perched stationary groundwater mound, the soil porosity will contain a moveable air saturation, Sa, and both an irreducible air saturation, Sair and an irreducible water saturation, Swir (Figure A3). The perched stationary groundwater mound is created (Figure A3) by replacing, within the soil, the moveable air, Sa, with moveable water, Sw [142].
Initially, this creates a situation (Figure A3) where the water volume entering the groundwater mound [B] is substantially greater than the water volume [C] abstracted from the mound. Here, [C] = [B]BL1. BL1 = a measurable parameter calculated as [C]/[B], where [(1-[B]BL1)] = [D] + [E]; [D] = moveable water, which is reservoired within the mound to replace Sa; [E] = water lost to the system due to reaction, evaporation, infiltration outside the groundwater mound. Part of [E] will increase Swir within the mound. The remediation operation inceases at time t = n. At time t = 0, Swir = g % of the soil porosity, ϕsoil; at time t = n, Swir = (g + r) % of the soil porosity. Part of this increase in Swir can be accounted for by the presence of hydroscopic clays (e.g., smectites, etc.). Furthermore, abstraction from the groundwater mound will result in some erosion and the removal of clays and silts from the interior of the mound. Consequently, the average porosity of the soil within the mound at t = 0 may be less than its average porosity at t = n. These relationships are complex, and are site specific. In this study, it is assumed that, ϕsoil, Sair and Swir remain constant with time.
Figure A3. Process flow diagram associated with creating and operating a stationary groundwater mound in contaminated soil. Green = Sair; Red = Sa; Purple = Swir, Blue = Sw.
Water 15 00540 g0a3

Water Mass Balance During Operation

The typical soil is unconsolidated and poro-elastic [142,143]. Its vertical permeability is normally < than its horizontal permeability [135,136,137,138,139,140,141,142,143,144]. This poro-elasticity [144,145,146,147] results in a loss of potential (head), as the water migrates away from the infiltration device (Figure A4). The loss of potential increases with the distance from the base or sides of the device, and is directly proportional to the soil permeability.
It is reasonable to assume (Figure A3) that
  • A volume of water [C] is continuously abstracted from the aquifer. This water is directed to a storage tank, before being processed in a reactor.
  • The water exiting the reactor is passed to a storage tank before being distributed. A water volume [B] is infiltrated or injected back into the groundwater mound.
  • Initially [B] > [C]. Following the formation of the groundwater mound, [C] will be approximate to [B]. [C] can, for short periods, exceed [B]. This situation occurs during periods when increases in permeability are associated with increases in ϕsoil, combined with decreases in Swir.
  • The total volume of water placed in the groundwater mound will normally be more than the cumulative amount of water abstracted from the groundwater mound. This shortfall will be approximate to the pore volume, occupied by Sw within the groundwater mound.
Figure A4. Pressure Losses associated with infiltration: (a), example of pressure loss with depth below a 4 m water column in an infiltration device; (b), example impact of lateral pressure loss on the lateral extent of a groundwater mound. Green arrow indicates the direction of increasing pressure loss. Red dots: pressure loss is low (x% m−1); brown dots: pressure loss is higher ((x + y)% m−1); blue dots: pressure loss is even higher ((x + y + z)% m−1).
Water 15 00540 g0a4
A typical stationary groundwater mound (Figure A3), constructed in boulder clay (or another clay/soil type) [142], may contain 300 m3 of Sw, 700 m3 of Swir, or 150 m3 of Sair, combined with an average contaminant concentration of 1 g L−1. Operating the groundwater mound with an average abstraction rate and recharge rate of 96 m3 d−1 will result in decontamination over a relatively short time period. The decontamination rate is a function of the efficiency of the surface-based reactor. For example (Figure A5), if a 95% ion removal is possible in the reactor, then a 99% groundwater mound decontamination may be achievable within 50 days. The amount of decontamination achieved within a specific time frame decreases as the efficiency of ion removal in the surface-based reactor decreases (Figure A5).
Figure A5. Relationship between surface based reactor, ion removal efficiency, time, and contaminant concentration in the groundwater mound. Blue is base case; red and green = lower ion removal efficiencies.
Water 15 00540 g0a5

Appendix B. Reaction Process Assumptions

Appendix B.1. Confined Aquifer, or Unconfined Aquifer, Treatment
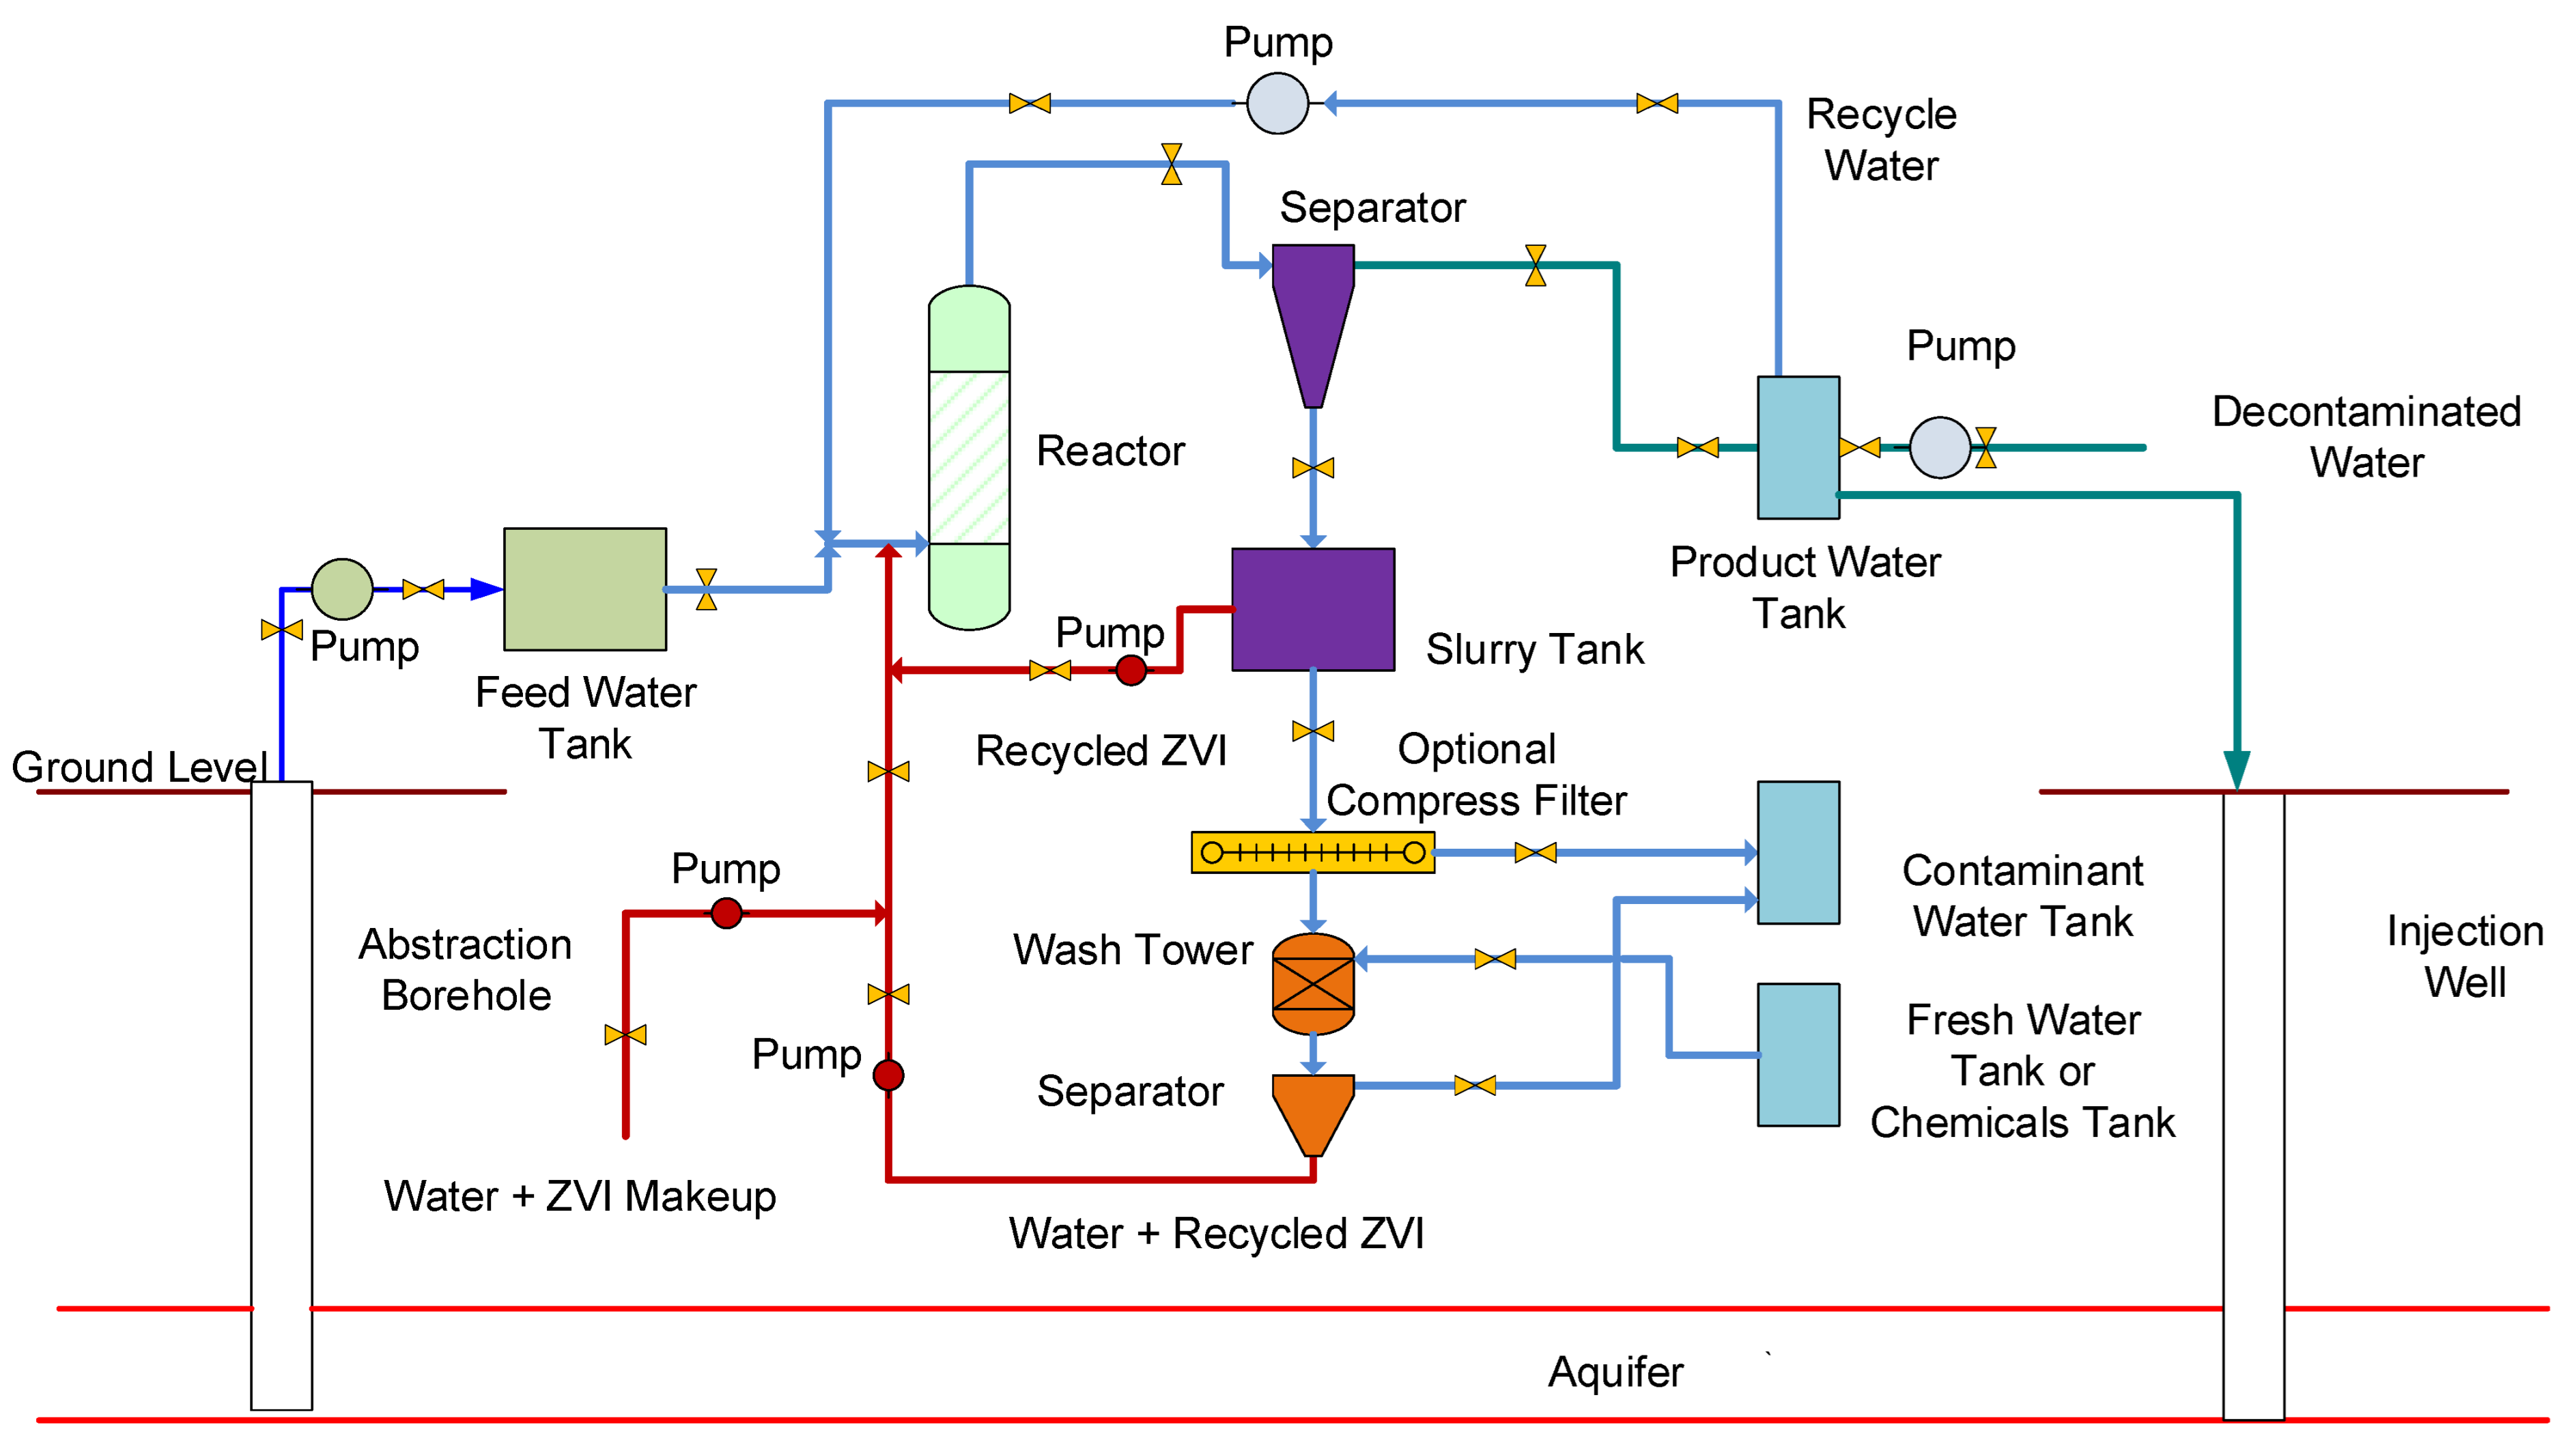
The chemical process assumptions required to treat a hydrodynamic stationary plume using ZVI are summarized in Figure A6. The recovered water (from an abstraction borehole) is passed into a reactor containing ZVI. The process flow shown in Figure A6 can be used with n-ZVI, m-ZVI, and ZVI; the ZVI is operated as an adsorbent, reactant, catalyst or redox modifier, and can be supported or unsupported.
This process incorporates both water recycle and ZVI recycle within the external reaction environment. The separator type is not defined, but can be gravitational, centrifugal, magnetic, or another type of separator. A separator may not be required when the ZVI is supported on supports that are retained in the reactor, e.g., membranes, monoliths pellets, etc.
Figure A6. Process flow diagram for the decontamination of a confined aquifer, or unconfined aquifer.
Water 15 00540 g0a6

Appendix B.2. Stationary Groundwater Mound Treatment
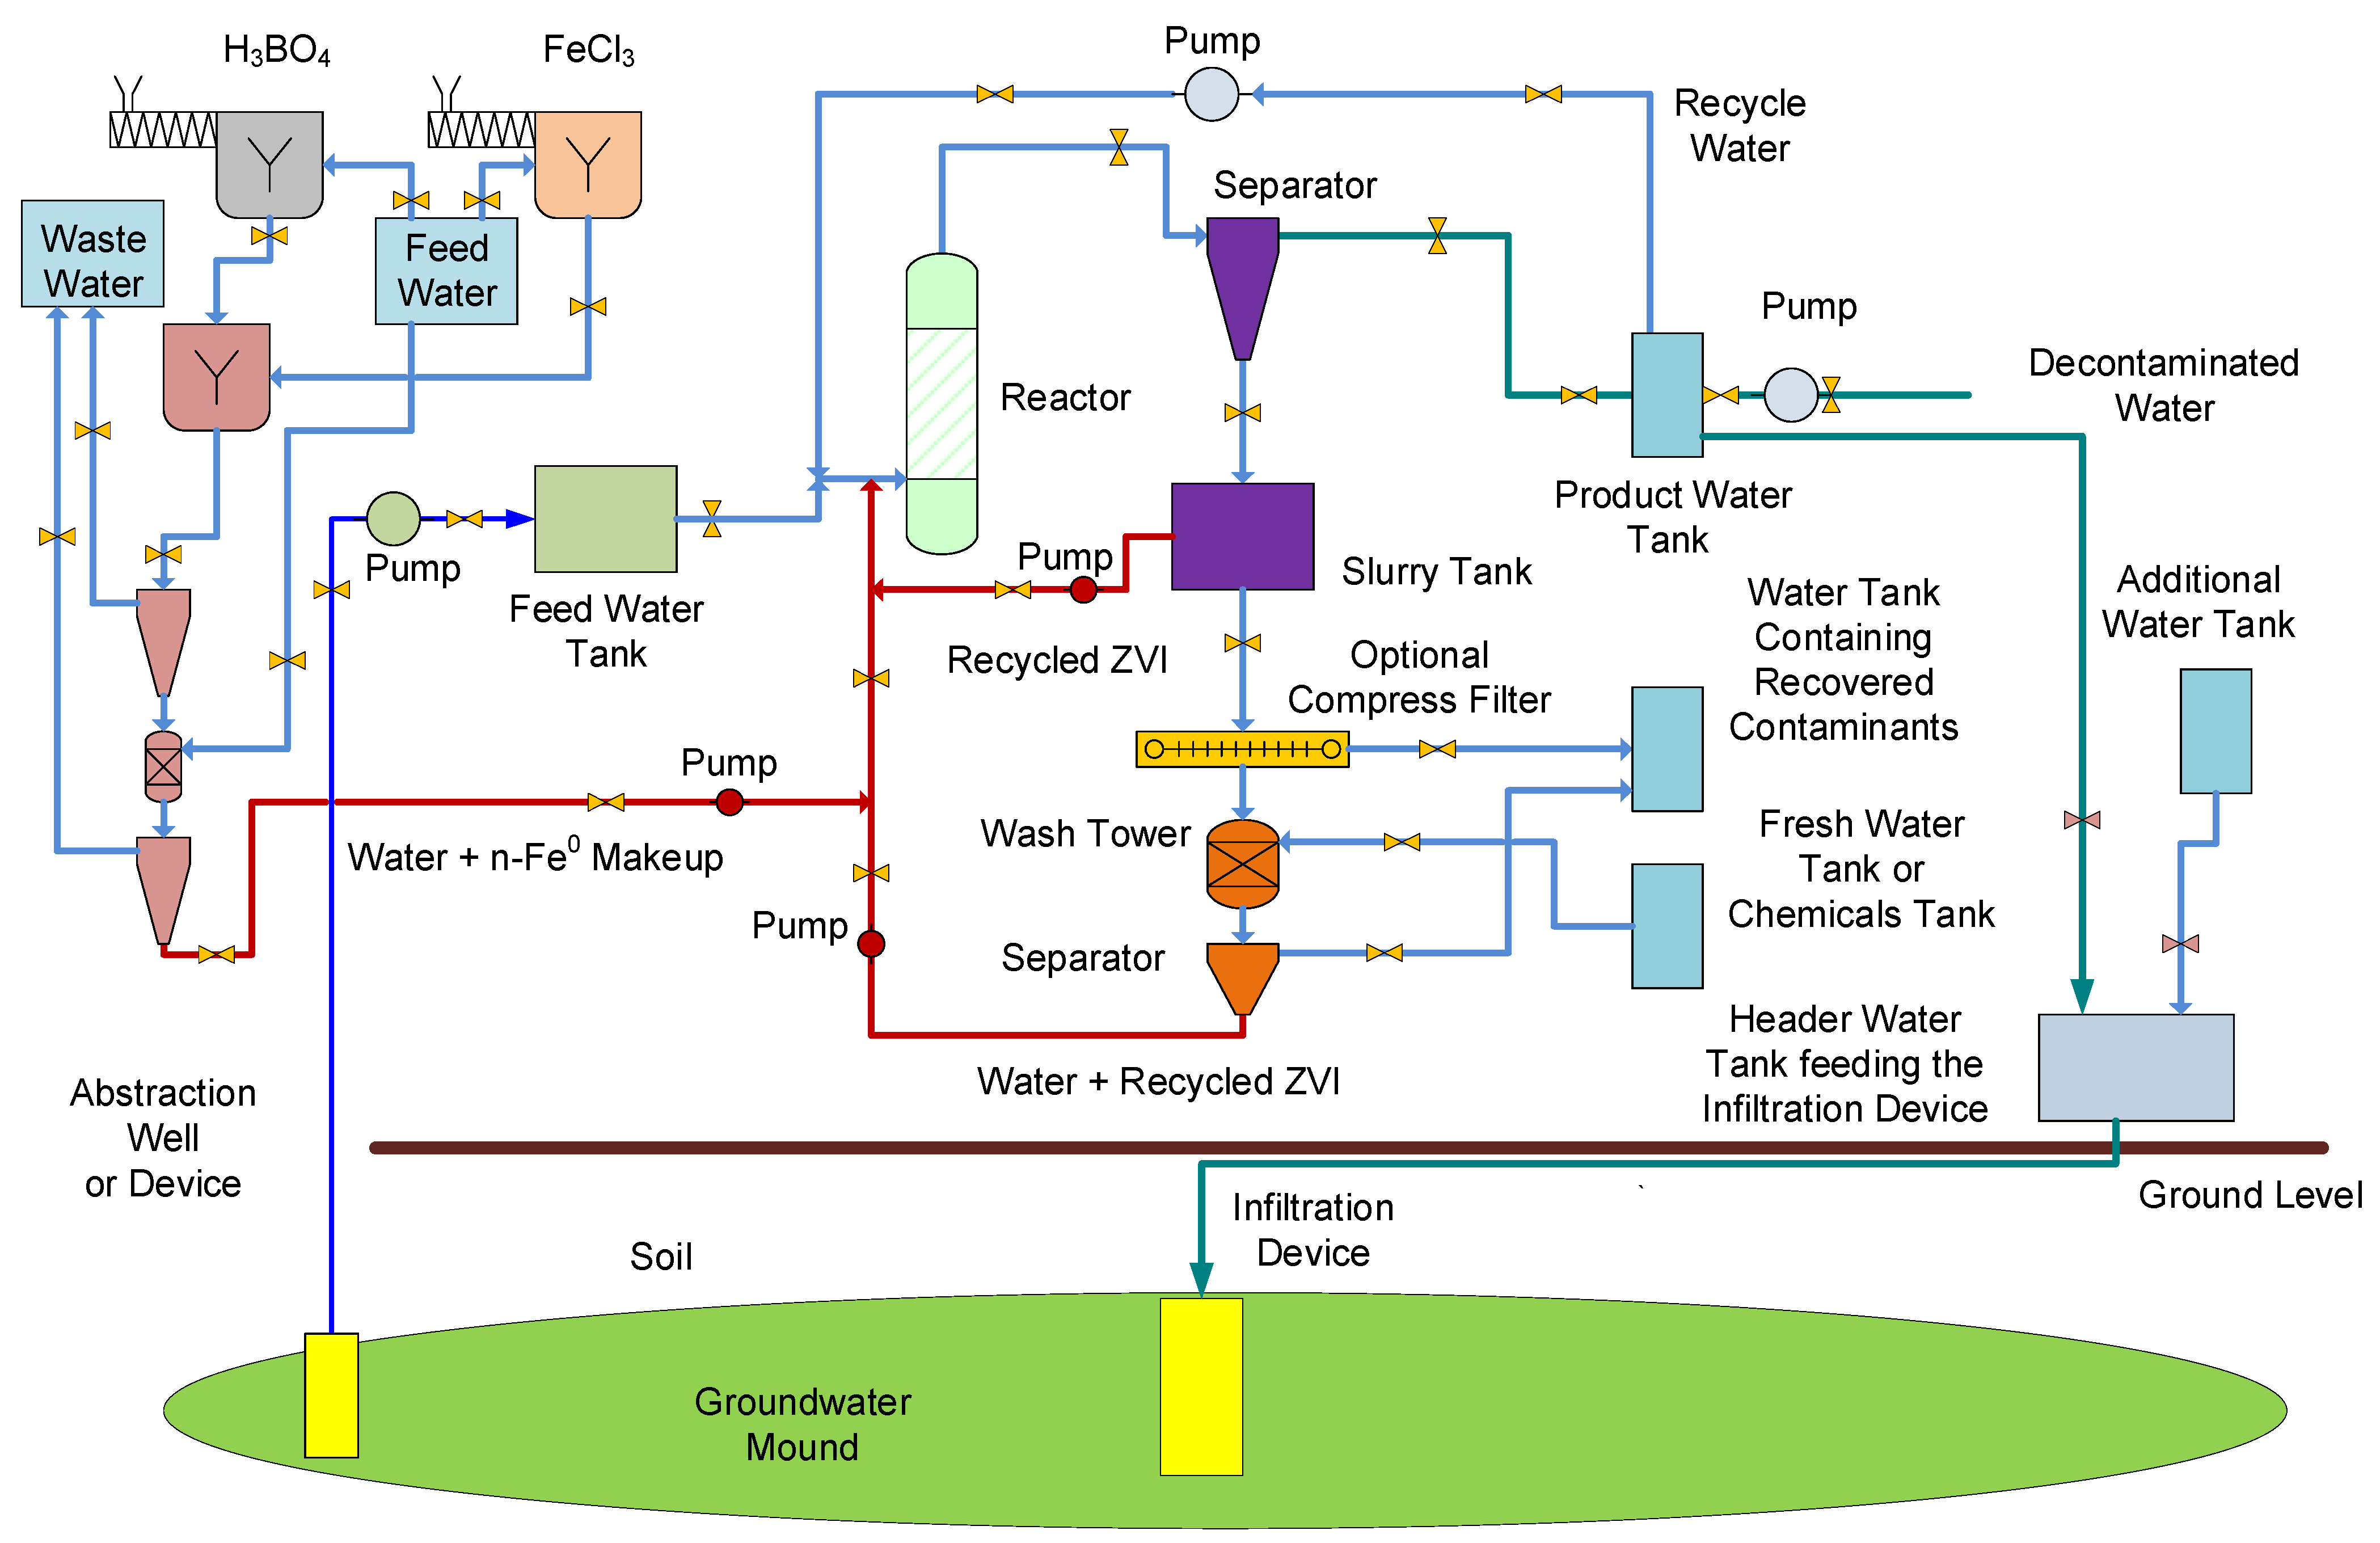
The soil contained in a vertically descending groundwater mound can be treated using a surface-based reactor process flow, of the type shown in Figure A6.
The chemical process assumptions required to treat a hydrodynamic stationary groundwater mound, using n-ZVI, are summarized in Figure A7. The recovered water (from the abstraction point) is passed into a reactor containing n-ZVI. This process flow diagram demonstrates that the onsite manufacture of n-Fe0 can be integrated into the overall treatment when a reductant (e.g., H3BO4) is added to a soluble iron salt (e.g., FeCl3).
Figure A7. Process flow diagram illustrating how n-Fe0 could be used to remediate a soil using a constructed groundwater mound.
Water 15 00540 g0a7

Appendix C. ZVI Formation

A variety of different methods have been used in the academic literature to manufacture n-Fe0. m-Fe0 and Fe0 powders and filings are normally manufactured by grinding or milling larger pieces of Fe0. n-Fe0 can be constructed by grinding or milling m-Fe0 or Fe0.
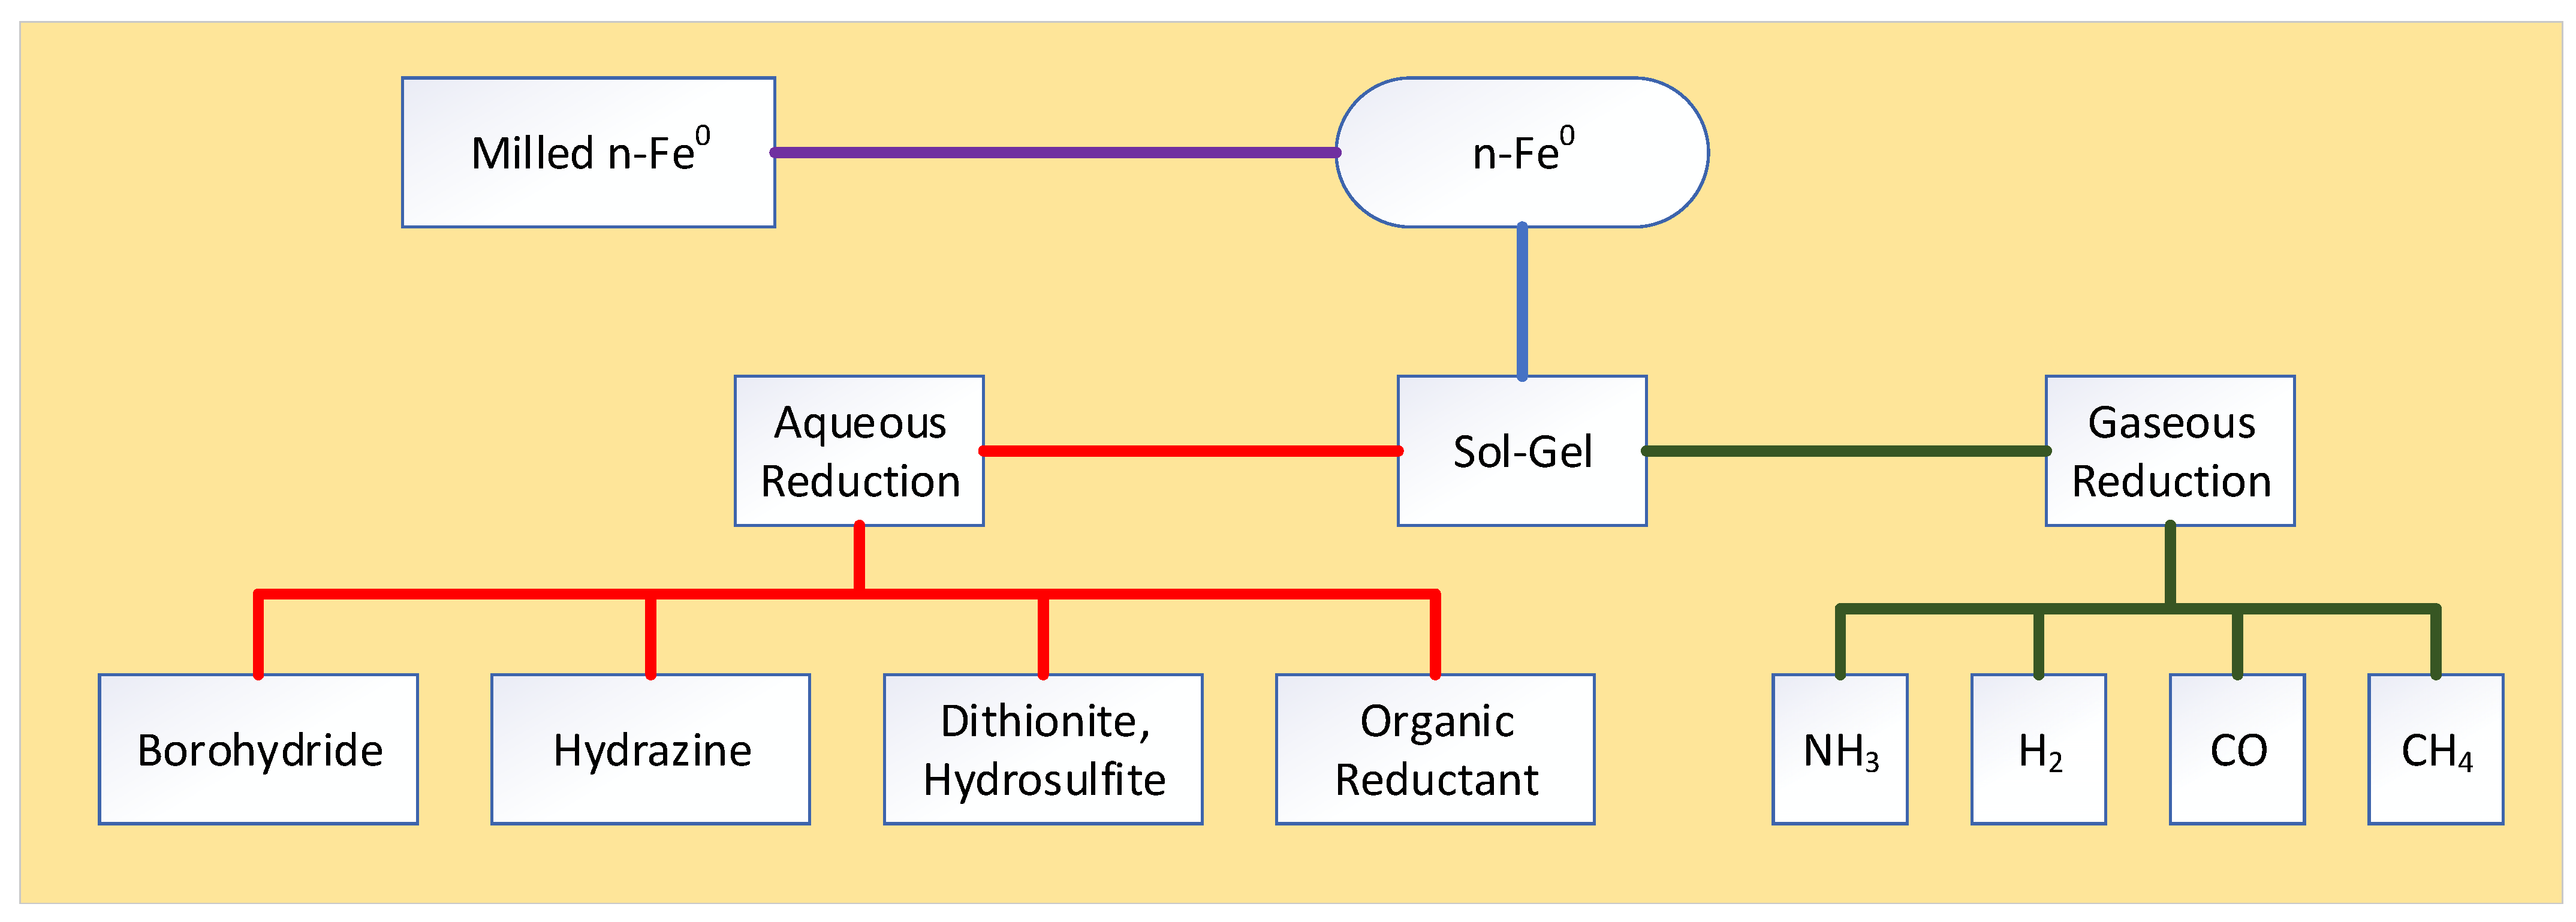
More commonly, n-Fe0 is manufactured from the reduction of iron carbonyls in a gaseous environment, or by adding a liquid reductant or a gaseous reductant (Figure A8) to a dissolved iron salt in water. n-Fe0 formation from an iron pentacarbonyl (IPC) gas takes the following form [148,149,150]:
Fe(CO)5 = Fe0 + 5CO,
Figure A8. Principal approaches used to manufacture n-Fe0.
Water 15 00540 g0a8

Appendix C.1. Approach 1—Formation via an Fe3O4 Intermediary

An example formulation [151] uses an aqueous solution of the metal precursors (e.g. [Fe(NO3)3 9H2O] + any other promoters, e.g., [Cu(NO3)2 4H2O], La(NO3)3, etc.). The Fe + promoters (Cu, La, Pt, etc.) are present in the solution in their required molar metal ratios. This solution is then mixed with an “oil phase” (typically an alcohol, e.g., 60% butanol + 40% chloroform (trichloromethane)), and may be mixed with a surfactant (e.g., the anionic surfactant sodium dodecyl sulfate (SDS)). An example ratio may be 10% aqueous phase + 70% oil phase + 20% surfactant.
If the catalyst is required to be placed on a support, the support is immersed in the solution and left to stand for a period, e.g., 24 h. Modifications to this approach may be made for some specialist supports, e.g., carbon-nanotubes (CNT).
An aqueous reductant solution (e.g., 30% NH4OH) is prepared separately. It is used to precipitate the n-Fe0 by adding it to the water + oil + surfactant mixture. The solid product is recovered and washed with deionized water and ethanol. The washed product (Fe3O4) is then dried at 393 K. It is then calcined in air for around 6 h at 773 K. The product is then crushed and sieved to form pellets (or particles) within the size range 100–180 microns. The crushing and sieving approach is not always adopted if the catalyst is placed on a support. This approach was first adopted in the 1920s and there is substantial historical and current patent literature and academic literature outlining the alternative routes and formulations, based on this generic approach.

Appendix C.1.1. Reduction of n-Fe3O4 Using H and CO to Form n-Fe0

The catalyst is air stable. It can be placed directly in the reactor, or it can be mixed with inert material (e.g., quartz (sand) grains, silica gel, activated carbon, diatomite, Al2O3, etc.), prior to placement in the reactor. The inert material is used to increase permeability within the ZVI bed, and may contain some adsorbent qualities (e.g., silica gel, active carbon). An example mixture for fixed bed operation is Fe3O4 + quartz grains (250–500 microns) using a 1:4 weight ratio (or similar).
The catalyst is activated using H2 gas to convert the Fe3O4 to Fe0 (Fe3O4 + 4H2 = 4H2O + 3Fe0). A typical activation procedure may take the following form: (i) a 5%H2/95%N2 gas stream (15.1 L h−1 g−1 Fe at 0.1 MPa) is passed through the ZVI bed; (ii) the temperature of the gas and the ZVI bed is increased from ambient (e.g., 298 K) to 650 K, at a rate of 5 K m−1; (iii) the gas and the ZVI bed are maintained at this temperature for 1 h, before being reduced to 543 K; and (iv) a gas comprising 1 CO: 1 H2 is then passed through the catalyst bed, at a rate of 3 L h−1 g−1 at 0.1 MPa, for a period of 1 to 48 h. This stage of the activation process is designed to produce FexCy + H2O, where xFe0 + yCO + yH2 = FexCy + yH2O. Variants of this approach are provided in the patent literature, e.g., US20100160156A1; US9259717B2; US20170087543A1. A modification of this approach coats the activated catalyst with carbon, to create an air stable Fe0 catalyst, to allow transport and long term storage (US9815046B2).
The catalyst particles typically have a surface area of approximately 40–45 m3 g−1, a porosity of approximately 30%, and an average pore diameter of approximately 14 nm. The activated catalyst can be used for gas phase or aqueous phase reactions. The activation of this type of Fe0 (within a reactor) has been undertaken since 1900, using one or more of CO, H2, NH3, and CH4 as a reductant. An extensive number of documents in the academic and patent literature address the alternative approaches.

Appendix C.1.2. Methodology Variants

The basic approach creates an initial Fe3O4 product, which is then reduced in the reaction environment to form n-Fe0. Variants change or remove the oil and surfactant phases. The iron species may be changed to an alternative ionic salt, e.g., FeClx, FeSO4. The hydroxide may be changed to an alternative, e.g., NaOH, KOH, etc. The reducing gases may include other species, e.g., CxHy, CxHyOz, NH3.
This generic approach provides a low-cost methodology for the volume production of a n-Fe0 catalyst, which can be safely transported. The on-site activation process removes handling problems and the associated safety problems.

Appendix C.2. Approach 2—n-Fe0 Formation Using Borohydrides

An alternative approach is to use a borohydride to reduce a Fen+ salt to Fe0. An example formulation creates an aqueous solution of the metal precursors (e.g., [Fe(NO3)3 9H2O] + any other promoters, e.g., [Cu(NO3)2 4H2O], La(NO3)3, etc.) in the required molar metal ratios. A solution of a borohydride (e.g., Na3BH4) is then added to precipitate the n-Fe0:
Fe3+ + 3BH4 + 9H2O = 2Fe0 + 3B(OH)3 + 10.5H2.

Appendix C.2.1. Basic Construction of Unsupported n-Fe0

Unsupported n-Fe0 can be manufactured by the dropwise addition of 1.6 M of NaBH4 to 1 M of FeCl3[6H2O]. The basic reaction is as follows:
(Fe((H2O)6))3+ + 3Cl + 3Na+ + 3BH4 = Fe0 + 3B(OH)3 + 10.5H2 + 3Na+ + 3Cl,
B(OH)3 = H2O + HBO2,
This process allows n-Fe0 to be created for a basic material (FOB) cost of around USD 65,000 t−1. FOB = free of board.
An alternative approach prepares n-Fe0 from a solution of 0.023 M FeCl3[6H2O] and 0.125 M of NaBH4. The overall manufacturing process takes < 1 h. The manufacturing reaction is summarized as follows:
4Fe3+ + 12Cl + 3Na+ + 3BH4 + 9H2O = 4Fe0 + 3H2BO3 + 6H2 + 3Na+ + 6H2 + 12Cl,
The spherical particles fall within the size range of 20 to 200 nm, and have an average surface area of 15 to 40 m2 g−1. They aggregate and form chains within the water. Increasing the Fe:borohydride ratio can result in the dominant product being n-Fe3O4, or a mixture of n-Fe0 and n-Fe3O4. An approach that produces air stable nano-particles, where the particle has an Fe0 core surrounded by an Fe3O4 coating, is described in US20100047180A1.

KR100975822B1 Manufacturing Method

Korean Patent KR100975822B1 established an approach, where either FeSO4 or FeCl3 was dissolved in a water:ethanol mixture, containing between 10 and 99% ethanol, preferably 60–99% ethanol. Increasing the ethanol to water ratio increased the BET surface area (as, m2 g−1) and decreased the n-Fe0 particle size in a controlled manner. An ethanol:water ratio of 90% was found to have an as of >60 m2 g−1, and a particle size of <20 nm. The NaBH4, KBH4, or LiBH4 solution was constructed using deionized water, which had been purged with N2, to produce a dissolved oxygen concentration of <0.8 mg L−1.
The rate of borohydride addition to the solution containing the iron ions controls the degree of particle aggregation. Particle aggregation increases with an increase in the rate of borohydride addition. The particle surface area increases and the particle size decreases as the ratio of borohydride to iron ions in the solution increases. Mechanical agitation of the mixture reduces the particles’ rate of aggregation. This approach allows the n-Fe0 to have a surface area, as, within the range 40–70 m2 g−1. Individual particles have a size range where >80% can be <20 nm. The particle aggregates may be in the size range 300–600 nm. The particles have a thin Fe3O4 surface coating.
The n-Fe0 product is recovered using a magnetic separator washed in ethanol, before being freeze dried. The dried n-Fe0 is then stored in aerobic conditions.

US20070022839A1 Manufacturing Method

US Patent US20070022839A1 modifies the n-Fe0 manufacturing process, by creating two aqueous solutions. The first solution contains FeSO4 and FeCl2. The second solution contains one or more of NaBH4, KBH4, and LiBH4, plus a base selected from NH4OH, NaOH, KOH, carbonate, bicarbonate, borate, and phosphate.
This patent seeks to solve the problem where
4Fe2+ + BH4 + 3H2O = 4Fe0 + H3BO3 + 7H+,
and the produced n-Fe0 then ionizes to release H2 gas:
4Fe0 + 7H+ = 0.5Fe0 + 3.5Fe2+ + 3.5H2,
The addition of a base increases the n-Fe0 yield by a factor of up to 8:
4Fe2+ + BH4 + 7NH4OH = 4Fe0 + H3BO3 + 7NH4+ +4H2O,
The morphology of the n-Fe0 particles produced is a function of the amount of base used. When no base is used, the particles are spherical. The addition of a base produces needle-like or flower-like n-Fe0 particles. This has the effect of increasing as from around 25 m2 g−1 for a spherical particle, to >80 m2 g−1 (typically 70–130 m2 g−1) for the flower-like or needle-like particles, 40–120 nm in diameter. The Fe0 yield is 0.65–0.75 g g−1 of borohydride.

Appendix C.2.2. Active Carbon Supported n-Fe0 [C0@Fe0]

Active carbon-supported n-Fe0 (8.2 wt% loading) is created, by first saturating activated carbon with 1 M of FeSO4 (or another ion salt) solution. Then, 0.2 M of NaBH4 is added in a dropwise manner, to reduce the ferrous ions to n-Fe0.
2Fe2+ + 2SO42− + Na+ + BH4 + H2O + 2[C0y@Fe0] + BO2 + 2H2 + Na+ + 3H+ + 2SO42−,
Then, 112 g Fe0 is produced from the reaction of 556 g of FeSO4[7H2O] + 38 g of NaBH4. This process allows n-Fe0 to be created for a basic material (FOB) cost of around USD 12 kg−1.

Appendix C.2.3. Biochar Supported n-Fe0

Biochar (BC)-supported n-ZVI can be created by first mixing a solution of 0.1 M of FeCl3[6H2O] with 17 g of BC L−1. Then, 0.36 M of NaBH4 is added to the solution to precipitate the n-Fe0. The overall manufacturing process takes 3 to 4 h. The reaction is summarized as follows:
4Fe3+ + 12Cl + 3Na+ + 3BH4 + 9H2O = 4Fe0 + 3H2BO3 + 6H2 + 3Na+ + 12H+ + 12Cl,

Appendix C.3. Approach 3—n-Fe0 Formation Using Dithionite or Hydrosulfite Ions (S2O42−)

An alkali (pH = >10) aqueous solution of the metal precursors (e.g., [Fe(NO3)3 9H2O] + any other promoters, e.g., [Cu(NO3)2 4H2O], La(NO3)3, etc.) is constructed using the required molar metal ratios. A solution of a dithionite (e.g., Na2S2O4) is then used to precipitate the n-Fe0, or Fe3O4 [152,153,154]:
Fe(OH)2 + S2O42− + 2OH = Fe0 + 2H2O + 2SO42−,
3Fe(OH)2 + S2O42− + 2OH = Fe3O4 + 4H2O + 2SO42−,
[FeCl2[H2O]4] + Na2S2O4 + 2NaOH = Fe0 + 6H2O + 4Na+ + 2Cl + 2SO42−,
Production of 1 t Fe0 requires 3.5 t [FeCl2[H2O]4] + >1.43 t NaOH + 3.7 t Na2S2O4.
[FeSO4[H2O]7] + Na2S2O4 + 2NaOH = Fe0 + 9H2O + 4Na+ + 3SO42−,
This approach has the potential to reduce the material costs associated with producing n-Fe0 to below USD 9000 t−1.

US Patent US8283034B2

US Patent US8283034B2 creates a first solution that contains one or more of the following: FeSO4, FeCl2, FeBr2, FeI2, Fe(NO3)2, FeCO3, and Fe3(PO4)2. A second solution, containing one or more of Na2S2O4, Li2S2O4, K2S2O4, MgS2O4, and CaS2O4, is then created. A hydroxide compound, selected from one or more of LiOH, NaOH, KOH, Mg(OH)2, and Ca(OH)2, is added to the first solution to increase its pH into the range 9 to 14. This will result in the formation of a green rust precipitate. The stepwise addition of the second solution to the first solution will result in the reduction of the green rust precipitate and the residual Fen+ ions to n-Fe0. Nanoparticle formation requires anoxic conditions, i.e., the water is saturated with N2, N2 + CO2,, or a reducing gas, and the pH is >10. No n-Fe0 formation occurs when the saturating gas is air. This approach produces a particle size within the range of 0.1 to 3000 nm, and an n-Fe0 aggregate size within the range 0.1 to 100 microns.

Appendix C.4. Approach 4—n-Fe0 Formation Using Hydrazine

An alkaline aqueous solution of the metal precursors (e.g., [Fe(NO3)3 9H2O] + any other promoters, e.g., [Cu(NO3)2 4H2O], La(NO3)3, etc.) is constructed using the required molar metal ratios. A solution of a hydrazine is then used to precipitate the n-Fe0 [155]:
4Fe(OH)3 + 3N2H4 = 4Fe0 + 12 H2O + 3N2,
Hydrazine costs are very variable, and range from <USD 5000 t−1 to >30,000 t−1.

Appendix C.5. Approach 5—n-Fe0 Formation Using Organic Reductants

An aqueous solution of the metal precursors (e.g., [Fe(NO3)3 9H2O] + any other promoters, e.g., [Cu(NO3)2 4H2O], La(NO3)3, etc.) is constructed using the required molar metal ratios. A solution of an organic reductant (e.g., polyphenol) is then used to precipitate the n-Fe0. The reduction chemistry is complex and 1 mole of Fe salt will produce <1 mol Fe0 with most organic reductants [101].

Appendix C.5.1. Canadian Patent CA2728987C

CA2728987C describes a method for producing n-Fe0 particles, using organic reductants. The approach adopted is as follows:
  • A metal ion solution is created from ferric chloride (FeCl3), ferrous sulfate (FeSO4), ferric nitrate (Fe(NO3)3, a metal chelate, Fe(III)-EDTA, Fe(III)-citric acid, Fe(III)-EDDS, Fe(I1)-EDTA, Fe(II)-citric acid, and Fe(II)-EDDS);
  • An organic reductant solution is created from one or more of the following: tea extract, green tea extract, coffee extract, lemon balm extract, sorghum bran, sorghum bran extract, polyphenolic flavonoid, flavonoid, flavonol, flavone, flavanone, isoflavone, flavans, flavanol, anthocyanins, proanthocyanins, carotenoids, catechins, quercetin, and rutin;
  • The metal ion solution is combined with the organic reductant and the plant-based surfactant, in order to produce n-Fe0 particles (20–250 nm);
  • A plant-based surfactant is added to the solution containing the n-Fe0 to provide an activated (cationic or anionic) coating to the n-Fe0 particles. The surfactant is selected from one or more of the following: castor oil, coca oil, coconut oil, soy oil, cotton seed oil, naturally occurring plant oil, ethoxylated corn oil, ethoxylated palm oil, ethoxylated soybean oil, ethoxylated castor oil, ethoxylated coconut oil, polyoxyethylene castor oil, polyethylene glycol castor oil, ethoxylated coconut fatty acid, polyethylene glycol ester of coconut fatty acid, ethoxylated coconut oil fatty acid, polyethylene glycol monoester of coconut oil fatty acid, polyethylene glycol monococonut ester, ethoxylated coca oil, ethoxylated coco fatty acid, polyethylene glycol cocoate, polyethylene glycol monococoate, polyethylene glycol monococonut ester, monococoate polyethylene glycol, monococonut oil fatty acid ester of polyethylene glycol, polyoxyethylene monococoate, polyethylene glycol cocamide, polyethylene glycol coconut amide, polyoxyethylene coconut amide, amidified ethoxylated coconut fatty acid, ethoxylated monoethanolamide of a coconut oil fatty acid, yucca extract, soapwood extract, or extracts of other plants that produce saponins.

Appendix C.5.2. US Patent US7963720B2

US7963720B2 describes a method for producing n-Fe0 particles using organic reductants. The approach adopted is as follows:
  • A packed bed reactor containing ASTM 20/30 sand is created. The specification example uses a column 3 m long and 0.3 m in diameter (containing 0.21 m3 sand). The expected pore volume is around 0.1 m3 (100 L);
  • A 0.1 M iron ion solution of Fe(NO3)3 is created;
  • A plant extract is created in deionized water, by heating dried green tea or dried lemon balm leaves to 80 °C;
  • The two liquids are injected at a rate of 0.15 cm3 m−1 (each, 0.3 cm3 m−1) into the base of the sand column;
  • The n-Fe0 is present in the water within the sand column, and in the product water produced from the sand column;
  • The recovered particles can be coated with an organic polymer by mixing the solution containing the n-Fe0 with a solution containing the organic polymer.

Appendix C.5.3. Chinese Patent CN106077624B

CN106077624B creates n-Fe0 particles coated with a poloxamer (PF-nZVI). The average particle size is 70–80 nm. The procedure used is as follows:
  • A solution is made of FeSO4, plus the poloxamer (e.g., poloxamer F68, poloxamer F108 and poloxamer F127);
  • A second solution is made using either a borohydride or a green tea extract solution, made by soaking tea leaves in water;
  • The reductant solution is added to the first solution, to precipitate the formation of PF-nZVI;

Appendix C.5.4. Chinese Patent CN112755963A

CN112755963A creates an n-Fe0 that is capped in alginate. The approach adopted is as follows:
  • A mixed solution of green tea extract, sodium alginate, and ferrous sulphate is formed. This contains green tea n-Fe0 (GT-nFe0);
  • Calcium chloride is added to the solution to precipitate the formation of calcium alginate (CA). This produces GT-nFe0@CA particles. The product is magnetic, does not degrade easily, and can be used to process multiple batches of water.

Appendix C.5.5. Chinese Patent CN109967024B

CN109967024B creates n-Fe0 using vitamin C and green tea extract. The procedure adopted is as follows:
  • A solution of iron sulphate is created;
  • A reductant solution of green tea extract plus vitamin C is created;
  • The reductant solution is added to the solution containing Fen+ ions to precipitate n-Fe0.

Appendix C.5.6. Chinese Patent CN113477214A

CN113477214A modifies the green n-Fe0 manufacturing approach. This approach incorporates the substantial quantity of organic waste (e.g., tea leaves, plant stems, etc.) produced to form an organic reductant. The approach adopted is as follows:
  • A solution of green tea text extract is created;
  • Its pH is adjusted into the range 6 to 7 using NaOH;
  • The residual plant material is carbonized to obtain a residual carbon;
  • A ferric salt solution is created;
  • The ferric salt solution, green tea extract and the residual carbon are mixed to produce a green n-Fe0-based biomass suspension.
This series of examples of green n-Fe0 manufacturing approaches is not exclusive. The process was first developed in 1834 by Runge [156], and was widely used as a test for phenols in the 1800s and 1900s. The process has also been used to rust proof iron. Dipping iron into an organic extract covers the iron with a colored Fe-organic coating, which effectively reduces its corrosion rate. The precipitate is either colorless, white, yellow, brown, green, blue, violet, purple, red, and black in color, and varies with the composition of the “green” reductant. A precipitate is produced with the following: phenols, substituted phenols, enols, ketoacids, ketones, some alkaloids, some sugars, amides, some carboxylic acids, amino acids, urea, and polyphenols. Precipitate formation can require the pH to be shifted from acidic to alkali conditions. Example colors are as follows [102]: phenols = violet/black; pyrocatechol = deep green; resorcinol = deep violet; hydroquinone = green to brown; pyrogallol = brown; phloroglucinol = violet; o-cresol = deep blue to turbid green; m-cresol = violet; p-cresol = deep blue; nitro-phenol = wine red (Shiraz); salicylic acid = deep violet; napthol = white; orcin = violet; histidine = green; leucine = grayish violet; isoleucine = olive; methionine = violet; norvaline = olive; phenylalanine = green; tryptophan = cherry red; tyrosine = yellow; valine = yellow; tannins = green; ketoisocaproic acid = gray violet; ketomethylthiobutyric acid = violet; phenylpyruvic acid = green; indole-pyruvic acid = cherry red; hydroxyphenylpyruvic acid = yellow; ketoisovaleric acid = yellow; gallic acid = violet. The n-Fe0 produced by this process invariably consists of a magnetic n-Fe0 core, which is surrounded by a n-Fe-organic polymer coating or a n-Fe-hydroxycarboxylate coating.
Unlike the other n-Fe0 manufacturing processes, which are associated with a substantial Eh decrease during n-Fe0 formation, this manufacturing process may not result in a significant Eh change in the water body. The redox (Eh-pH) regime during manufacture tends to stay within the FeIII oxidation number stability zone. The probable explanation for this is that the initial precipitant is a n-Fe-organic polymer, or a n-Fe-hydroxycarboxylate. The agglomeration of these particles creates conditions within the agglomerate that allow part of the n-Fe-organic polymer, or n-Fe-hydroxycarboxylate, to reduce to n-Fe0. Therefore, the major Eh change is located between the outer surface of the agglomerate hydration shell and the n-Fe0 core of the agglomerate.

Appendix C.6. Regeneration of n-Fe0

n-Fe0, m-Fe0, and Fe0 oxidize and corrode during operation. Part of the Fe0 charge is lost into the product water in the form of Fen+ ions. This loss increases as the treated water pH reduces below 7.
The resultant FexOyHz product (aged ZVI, (A-ZVI)) can be reactivated as Fe0 through one of a series of approaches. It can obviously be reconstituted as Fe0 by smelting at 1500–1900 K. The alternatives are gaseous reduction, acidification, and reconstitution.

Appendix C.6.1. Gaseous Reduction

The A-ZVI is heated in an anoxic environment containing H2:N2, H2:CO, H2:CO:CxHy, NH3, or another reducing gas combination. The reduction temperature is within the range 400 to 800 K, for a period of between 1 h and 72 h. Numerous methods for A-ZVI regeneration have been developed over the last 100 years. Examples are provided by US6869978B2 (using pressure adjustment in the reactor) and US6486220B1 (using steam). Other reactivation approaches include first oxidizing the Fe0:Fe(a,b,c) to Fe3O4, before reducing the Fe3O4 to Fe0, e.g., US7964156B2; US8431507B2;US10099213B2.

Appendix C.6.2. Acidification and Regeneration

A-ZVI is treated with a deoxygenated acid (e.g., HCl) to dissolve the hydroxides on its surface (FeOOH, Fe(OH)n). The particles are then washed with deoxygenated water + an alcohol (e.g., ethanol), prior to being anaerobically dried. The acid-treated product (T-ZVI) is now available for use; this is demonstrated in the following:
Fe0:Fe(OH)3 + 3HCl = Fe0 + Fe3+ + 3H2O + 3Cl,
The liquids are then optionally processed with a hydride to recover the dissolved Fen+ ions as n-Fe0, e.g.,
4Fe3+ + 3BH4 + 9H2O = 4Fe0 + 3H2BO3 + 12H+ + 6H2.
Water treatment studies have demonstrated that a batch of A-ZVI can be acid treated at least 50 times for the removal of Cd, Cu, Cr, Ni, Pb, Zn following regeneration, without a loss of activity [157].
When the targeted removed ions are anions, an alternative regeneration procedure is sometimes used, where the A-ZVI is treated with caustic substances (NaOH) that are designed to increase the pH to >13, or with acid solutions that are designed to decrease the pH to <2 [157]. These approaches allow the removed metals to be concentrated and recovered from the A-ZVI [157,158].

Appendix D. Contaminant Removal Kinetic Models

The kinetic data that is associated with contaminant removal by ZVI and available in academic publications is highly variable. The approach adopted in this study is as follows:
  • All published data is normalized to a multi-train plant processing 40 m3 h−1 for the treatment of a stationary plume in an aquifer or unconfined aquifer, or 4 m3 h−1 for the treatment of a stationary groundwater mound in soil;
  • Where sufficient data is available, the first order rate constant is determined as a function of ZVI concentration, g L−1. The assumption made [93] is as follows:
Ln (Ct=n/Ct=0) = −kobs × t + Ln (1),
Ct=n = Pollutant concentration at time t = n; Ct=0 = Initial pollutant concentration; kobs = observed rate constant; t = reaction time; Ln (1) = Ln (Ct=n/Ct=0) when n = 0. The observed rate constant can be simplistically viewed [106,120,121,122] as follows:
kobs = kins × as × Pw × f,
kins = the intrinsic normalised rate constant for when, as = 1, Pw = 1, and f = 1. as = particle surface area, m2 g−1; Pw = ZVI concentration, g L−1; and f = site loss factor, f < 1. A plot of kobs versus Pw will form a linear relationship with a slope [kins × as × f]. f is unique to the particular reaction environment. It decreases with the increasing reuse of the catalyst. When the catalyst is fresh, f is normally between 0.4 and 0.8; it may also change with the initial contaminant concentration.
Some ion removal reactions are second-order [93], where a plot of 1/(Ct=n/Ct=0) versus reaction time is a straight line, or zero-order, where a plot of (Ct=n/Ct=0) versus the reaction time is a straight line [93].
Pollutant removal results from either a catalytic reaction, direct precipitation of the cation (e.g., C0, S0, Cu0, Au0, Ag0, Pb0, Ca(OH)2, CaCO3, etc.), direct reaction with the pollutant, or the adsorption of the pollutant. This can be a physical adsorption or a chemical adsorption. It can sometimes be difficult to distinguish which route has been adopted.
The basic data collected to analyze the adsorption is summarized using a normalized mass balance for a batch reactor in the following form:
qt=n = (Ct=0Ct=n)/Pw,
where qt=n = weight (g) of the pollutant adsorbed per unit weight (g) of ZVI at time t = n; Ct=0 = initial pollutant concentration, g L−1; Ct=n = pollutant concentration at time t = n, g L−1; and Pw = weight of ZVI placed in the reactor, g L−1. For a continuous flow, fixed bed or fluidised bed reactor, the following is used:
qt=n = (Vw(ct=0ct=n))/wZVI,
where Vw = water volume, L, passed through the reactor between time t = 0, and time t = n; ct=0 = cumulative initial pollutant concentration, g, entered into the reactor; ct=n = cumulative pollutant concentration, g, remaining in the product water at time t = n, g L−1; wZVI = weight of ZVI placed in the reactor, g.
All adsorbents have a maximum level of pollutant adsorption (mg g−1), termed qe, and at any specific time, the value of qt=n will fall within the range provided by the lower boundary limit of 0, and the upper boundary limit of qe. The maximum level of pollutant adsorption is normally obvious from a graphical plot of qt=n versus time:
qt=n = (Vw(ct=0ct=n))/wZVI,
A pseudo first order adsorption profile, assumes the following form:
qt=n = qe [1 − exp(− k1t),
where k1 = a velocity constant, unit time. A pseudo second order adsorption profile assumes the following form:
qt=n = ((qe)2 k2t)/(1+ (qek2t)),
k2 = a velocity constant, unit time, g mg−1 time−1. It is not always easy to identify which adsorption route is correct and a variety of approaches have been proposed, e.g., Langmuir, Freundlich, etc.
Observed, simple catalytic reaction, reaction rate constants, kobs, follow the Arrhenius relationship [93,106]:
kobs = Ap e(−Ea(RT)),
where Ap = the pre-exponential or Arrhenius factor; Ea = activation energy for the reaction, R = ideal gas constant, and T is temperature, K. Lowering the activation energy increases kobs, and reduces the time required to achieve a specific outcome under the same conditions. For every forward reaction, there is a reverse reaction; kobs can be visualized as the following [93,106]:
kobs = kforward reactionkreverse reaction,
The forward and backward rate constants define the equilibrium constant, Keq, for the reaction. The equilibrium constant defines the equilibrium ratio of reactants and products in a closed system. The reaction quotient, Qrq, gives the net direction of a reaction: if Qra < Keq, the reaction proceeds in the forward direction [93,106]. At equilibrium, Qra = Keq. In a typical reaction system, Qra < Keq [93,106]. In most reactions, the bulk of the forward reaction occurs over a time, tr. This time tr is normally a fraction of the time teq required to reach equilibrium. For example, 75 % of the pollutant may be removed in 1 h, while the reaction equilibrium results in the removal of 98% over 100 h. In this study, tr is set at between 0.1 and 24 h, with the objective of removing >95% of the pollutant.

Appendix E. Contaminant Processing Assumptions

The pollutant is removed via any of the following processes:
  • Removed by a direct reaction with the Fe0 [159,160,161,162,163,164]; in this instance, the pollutant may be precipitated as a pollutant Fe-hydroxyoxide, either on the n-Fe0 surface, or as colloids and flocculates in the water [1,2,3,4,5,6,7];
  • Removed by an equilibrium redox reaction [165,166,167,168], when the n-Fe0 adjusts the pH and Eh of the water to favor the precipitation of the pollutant, as one of a hydroxide, oxide, carbonate, sulphate, metal, or non-metal [92]. The precipitate is either entrained in the water or is physically adsorbed on the n-Fe0 particle surface.
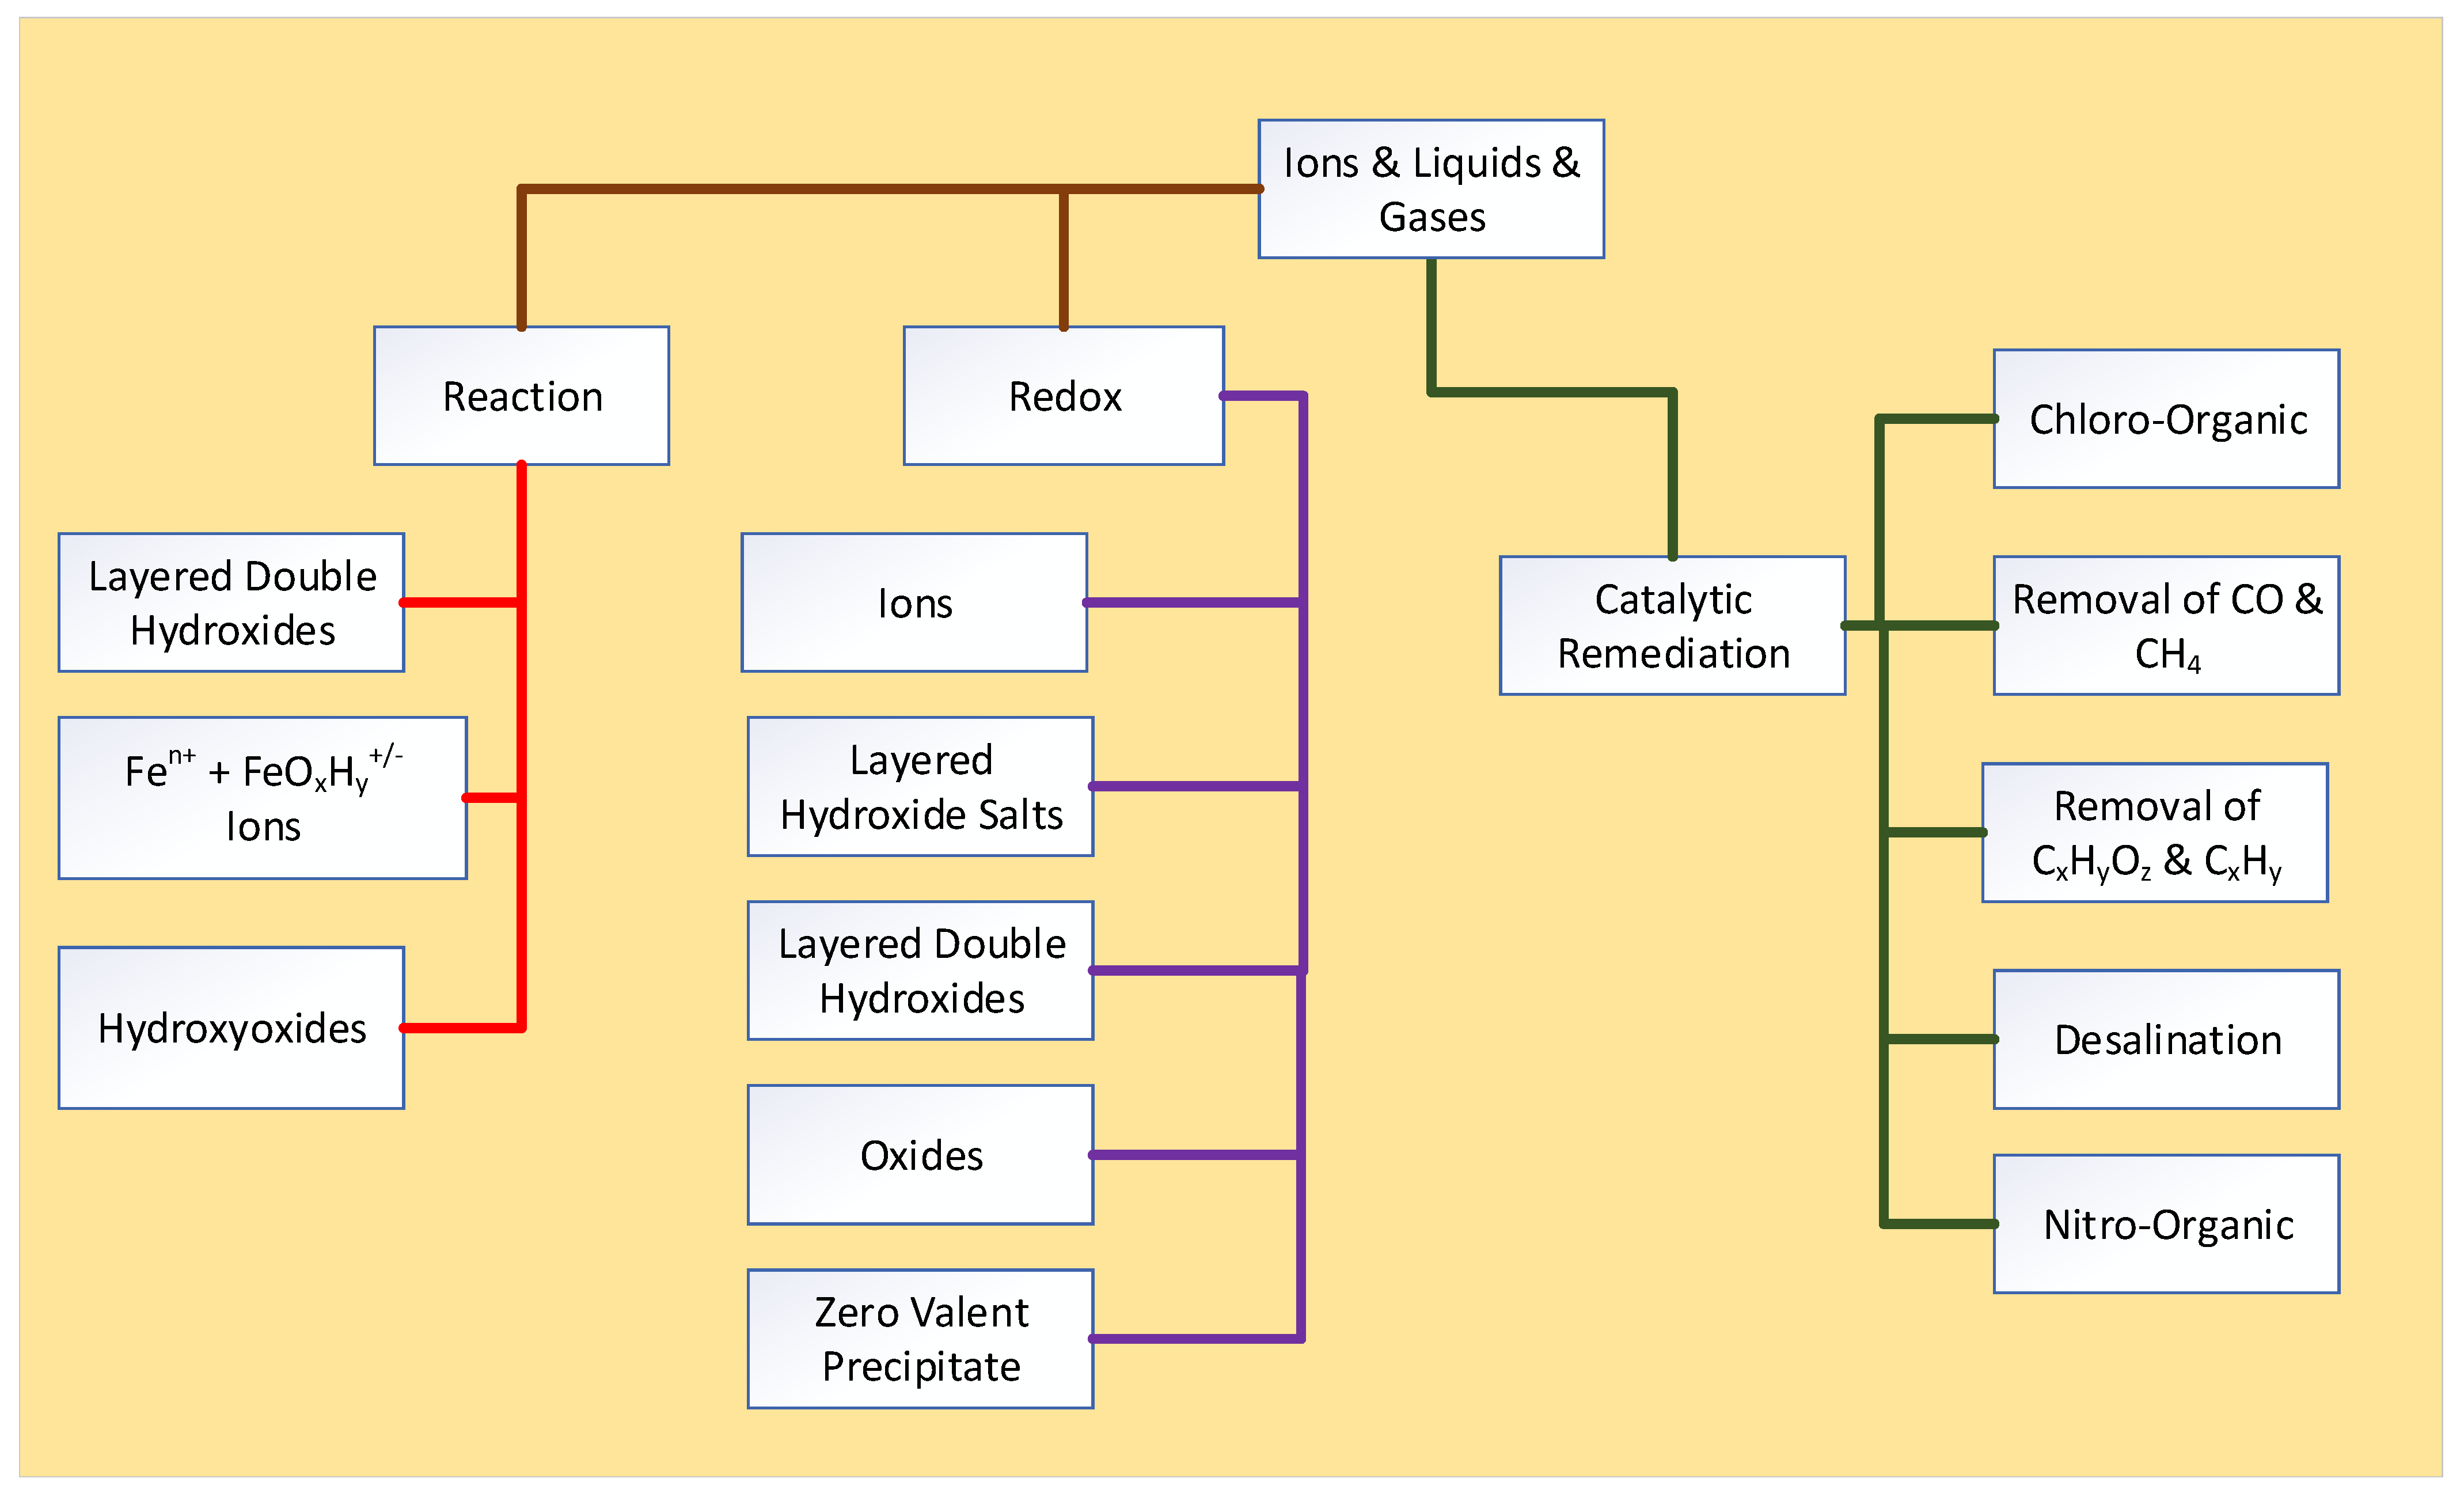
  • Removed by an n-Fe0 catalyzed reaction within the water [91,102,103,120,121,122,169,170,171].
The different remediation reaction routes are summarized in Figure A9. Fe0 is sometimes described as a smart material [91], as it can simultaneously undertake a number of reaction routes. From the perspective of maximizing the life expectancy of an Fe0 charge, the preferred reaction routes are always either catalytic or redox-facilitated reaction routes. This is because these reaction routes leave the Fe0 unchanged [93].
Redox remediation reactions (Figure A9), which involve the reduction of an ion, either convert the ion to a benign ion form, or convert the ion to a precipitate or gas [92,93]. In this environment, the oxidation of Fe0 and the formation of Fe ions and precipitates is incidental, and eventually results in a first increase in Eh, followed by a subsequent decrease in pH [165,166,171]. Most ZVI remediation studies only record the change in the pollutant concentration [172]. The redox reactions can be used to recover pollutant metals and some non-metals in their zero-valent form [101,173].
Catalytic reactions (Figure A9) are more complex than redox reactions, but commonly sequentially reduce or breakdown a complex contaminant to simpler compounds, e.g., TCE [174,175,176,177,178]. In some instances, they sequester the removed contaminant into dead-end porosity, associated with the oxyhydroxide corrosion products [122].
Iron corrosion reactions (Figure A9) tend to sequester ions within the inter-layer porosity, intra-layer porosity, and the associated hydration shells of iron oxyhydroxide (layered double hydroxide, LDH) products [179,180,181,182]. In this study, the view taken is that the principal ZVI remediation routes are redox and catalytic (Figure A9).
Figure A9. Remediation reaction routes resulting from water treatment with Fe0.
Water 15 00540 g0a9

Appendix E.1. Redox Remediation

pH Changes Resulting from the Presence of Fe0

The addition of n-Fe0, m-Fe0, or Fe0 to water results, initially, in an increase in the water pH and a decrease in the water Eh [165,166,171]. This occurs because Fe0 acts as a catalyst for the decomposition of water [91]. The principal decomposition reaction is as follows [92]:
H2O = H+ + OH,
The release of OH ions increases the water pH. The water Eh and pH (Figure A10) controls whether hydrogen is present as H+ ions (Hydrogen Stability Zone 0) [91], H2(gas) (Hydrogen Stability Zone 1) [91], or H ions (Hydrogen Stability Zone 2) [91]; an example of this is as follows [92]:
2H+ + 2e = H2,
H+ + 2e = H.
The surface of Fe0 is located in Hydrogen Stability Zone 1 (Figure A10a) [91]; at a pH of <7 [92], the Eh is controlled by the reaction [92]:
Fe0 = Fe2+ + 2e; Eh,V = −0.44 + 0.0295 Log(Fe2+),
Figure A10. Redox Regimes. (a), The main redox regimes associated with ZVI water remediation. Red solid and dashed lines represent the equilibrium outcome redox fences. Green lines indicate the redox fences for Hydrogen Stability Zones 0, 1, 2. Brown dot is the example fresh water composition. (b), redox regimes showing H2O2 Redox boundary (purple dashed line); red dots are product water outcomes over an 1850 h period, where a cumulative total of 237 m3 water is flowed continuously through a 0.5 kg particulate m-Fe0 bed.
Water 15 00540 g0a10
The Eh on the surface of the Fe0 and the Fe0 hydration shells is within the range of −0.65 to −0.45 volts over the pH range −2 to 7; it is below this at higher pH (Figure A10a). The general shift in water pH on the Fe0 surface during remediation (Figure A10a) moves the dominant hydrogen product from H2(gas) at pH <8.3 to H+ ions (Figure A10a). The example analysis in Figure A10a produces a product water within the 2OH = H2O2 + 2e = O2 + 2H+ + 2e redox fence zone [92] (Figure A10b).
This observation (Figure A10b) has a number of important implications:
  • The Fe0 surface and the water body are in hydrogen stability zone 0;
  • The water body is located within the 2OH = H2O2 + 2e = O2 + 2H+ + 2e redox fence zone. Consequently, some of the contaminants within the water may be remediated using a Fenton Type of Reaction.
The redox implications [92] for the remediation of the observed Eh and pH shift (Figure A11) are as follows:
  • Polonium: Po0 will be expected to precipitate on the Fe0 (Figure A11a);
  • Tellurium: Te0 will be expected to precipitate on the Fe0 (Figure A11b);
  • Selenium: Se0 will be expected to precipitate on the Fe0 (Figure A11c);
  • Bismuth: Bi0 will be expected to precipitate on the Fe0 and Bi(OH)3 within the water body (Figure A11d);
  • Antimony: Sb0 will be expected to precipitate on the Fe0 (Figure A11e);
  • Arsenic: As0 will be expected to precipitate on the Fe0 (Figure A11f);
  • Nitrogen: Nitrates and nitrites will expect to reduce to NH4+ or NH4OH on contact with the Fe0 (Figure A11g);
  • Lead: Pb0 will be expected to precipitate on the Fe0 (Figure A11h), and Pb(OH)2 and PbO2 within the water body (Figure A11h);
  • Thallium: Tl0 will be expected to precipitate on the Fe0 (Figure A11i); the oxygenation of the residual water would be expected to precipitate the residual Tl+ ions as Tl(OH)3 (Figure A11i);
  • Cadmium: Cd0 will be expected to precipitate on the Fe0 (Figure A11j) and Cd(OH)2 within the water body (Figure A11j);
  • Zinc: Zn(OH)2 will be expected to precipitate on the Fe0 and within the waterbody (Figure A12a);
  • Nickel: Ni0 will be expected to precipitate on the Fe0 (Figure A12b), and on Ni(OH)2, Ni(OH)3, and NiOOH within the water body (Figure A12b);
  • Cobalt: Co0 will be expected to precipitate on the Fe0 (Figure A12c) and Co(OH)2 within the water body (Figure A12c);
  • Technetium: Tc0 will be expected to precipitate on the Fe0 (Figure A12d);
  • Manganese: Mn(OH)2 will be expected to precipitate on the Fe0 (Figure A12e) and MnxOy within the water body (Figure A12e);
  • Molybdenum: Mo0, or M(OH)4 will be expected to precipitate on the Fe0 (Figure A12f);
  • Chromium: Cr(OH)3 will be expected to precipitate on the Fe0 and in the water (Figure A12g);
  • Vanadium: VxOy will be expected to precipitate on the Fe0 (Figure A12h).
These redox examples are not exclusive, and indicate the range of ions that could potentially be removed by a simple Eh and pH shift in the water composition. If the feed water was acidic, the range of ions that could be removed by the observed Eh and pH shift is substantially larger [92].
The redox analysis does not indicate the ion removal rate, but it does indicate that the removal rate on the Fe0 will be enhanced by increasing as, Pw, and by increasing the amount of time the water spends in contact with the Fe0.
Figure A11. Eh and pH of product water (red dots) relative to redox fence locations. (a), Polonium; (b), Tellurium; (c), Selenium; (d), Bismuth; (e), Antimony; (f), Arsenic; (g), Nitrate/Nitrite; (h), Lead; (i), Thallium; (j) Cadmium. Dashed Purple Line = contaminant redox fence boundary; Eh:pH product water data: Figure A10; Brown data point = feed water.
Water 15 00540 g0a11
Figure A12. Eh and pH of product water (red dots) relative to redox fence locations. (a), Cadmium; (b), Nickel; (c), Cobalt; (d), Technetium; (e), Manganese; (f), Molybdenum; (g), Chromium; (h), Vanadium. Dashed Purple Line = contaminant redox fence boundary; Eh:pH product water data: Figure A10; Brown data point = feed water.
Water 15 00540 g0a12
Any pollutant ion coming in physical contact with the Fe0 will adjust its equilibrium state to the redox conditions on the Fe0 surface. Each of these examples can be described by a generic reaction of the following form:
aA + bB = cC + dD,
The reaction quotient, Qr, is determined as follows [92,93]:
Qr = ([Ci]c [Di]d)/([Ai]a [Bi]b).
The subscript [i] indicates the number of moles of the reactant or product. Precipitated products and water are excluded from the calculation of Qr by convention [92,93]. The reaction moves forward when Qr < Kr, where Kr is the equilibrium constant for the reaction. In the contaminated groundwater or soil, at time t = 0, Qr = Kr. The combination of the decrease in Eh, combined with the increase in pH, results in Qr < Kr. For example, if the water pH is 4, and the n-Fe0 increases the pH to 7, then from Figure A12g, the equilibrium Cr3+ concentration will have changed from Log (−7.4) moles, to Log(−16.5) moles; Qr is < Kr until the Cr3+ concentration has been reduced. Qr indicates the reaction direction, but not its speed.
The free energy change in the remediation reaction, ΔG, is provided by the following equation:
ΔG = ΔGo + RT Ln(Qr) = −FEcell,
where R = gas constant; T = temperature, K; F = Faraday constant; Ecell = the reaction EMF (electromotive force) = observed Eh; ΔGo = −FEocell; Eocell = Eocathodic reactionEoanodic reaction = (0.0592/n) Kr. n = number of electrons transferred in the reaction. For a pH-independent remediation reaction, the following is used [93,96]:
Ecell = Eh = Eocell − 2.303RT/nF Log(Qr),
The consideration of pH results is shown in the following [92,93]:
Ecell = Eh = Eocell (−)# 2.303RTm/nF pH (−)* 2.303RT/nF Log(Qr),
For T = 298 K and n = 1, 2.303RTm/nF = 0.0591; m = number of hydrogen ion moles transferred. Here, (−)* = [−] when the ion is a reactant, and [+] when the ion is a product. (−)# = [−] when H+ is a product, and [+] when H+ is a reactant.
Fe0 remediation reactions are essentially a passive electrolysis reaction, where Fe0 acts as a direct, or indirect, source of OH ions, H+ ions and e. Indirect reactions result from the interaction of the catalyzed products of water decomposition with other ions in the water. Direct reactions result from the reaction of the Fe0 with components in the water.
For example, for selenium remediation, the reaction may be as follows [92]:
SeO32− + 6H+ + 4e = Se0 + 3H2O,
The associated ZVI-induced redox catalytic water decomposition reaction is as follows [92]:
6H2O = 2H+ + 3H2O2 +2H2,
2H2 = 4H+ + 4e,
3H2O2 + 6H+ + 6e = 6H2O,
The number of electrons transferred in the remediation reaction, n, = 4, and 4 moles of electrons (n) are equivalent to 1 mole Se0 (n3). If the n-Fe0 charge is able to generate 1 mole H2 per minute, then the reaction environment has the potential to generate 4 moles of electrons per minute. If all of these electrons are utilized in forming Se0, then the current generated, IZVI, amperes, by the presence of the n-Fe0 can be estimated as follows [93]:
IZVI = n1F/t,
One mole of electrons = 9.65 × 10⁴ Coulombs = F = Faraday constant, t = time, seconds. n1 = number of electrons produced, which are available to produce y moles of Se0; n1 < n. The rates of water decomposition and hydrogen production by Fe0 are a function of the water composition, temperature, ZVI particle size, ZVI surface area, ZVI concentration and ZVI composition.
If the Fe0 produces x moles H2 L−1 t−1, [M1], and only a fraction [a1], e.g., 10%, is retained in the water as H+ + ne, (where 2n = [a1][M1]) and only a fraction of the resulting electrons [a2] are available to produce Se0, then [93] the following is formulated:
IZVI = (2[a1][M1][a2])F/t,
The amount of Se0 precipitated, g L−1, by the Fe0 becomes the following:
Se0, g L−1 t−1 = IZVI (n/F)(n3/n)(MWSe/n3),
where MWse = molecular weight of Se0. These general redox principles apply to the removal of all ions. The key drivers are the change in pH (either positive or negative), the change in Eh, and the associated changes in chemical potential. Where the remediation is associated with the rate of production of H2(gas) or H ions, the n-Fe0 may need to be supplemented with Al0, Si0, or another component [91]. The reaction environment may also need to be deoxygenated.
The remediation principles for different pollutants are similar, and the list of potential pollutants that can be removed by n-Fe0, m-Fe0, or Fe0 extends to several hundred. This analysis indicates that the rate constants, associated with many of the remediation reactions, may be enhanced by electrolysis combined with ZVI degradation.

Appendix F. Reactor Assumptions

Almost all published experimental data is for one of the following: (i) batch flow continuously stirred reactors; (ii) batch flow static diffusion reactors, and (iii) continuous flow, fixed bed reactors. The reactor sizes typically fall in the range 0.01 to 5 L for batch flow trials, and flow rates of 0.1 to 1 L h−1 for continuous flow trials.
The assumption made in this study is that remediations are redox catalyzed by ZVI, where the ZVI increases pH, decreases Eh, and adjusts the relative availability of H+, H, H2, H, OH-, OH, e, O, O2, H2O2, O2, and O2−. Therefore, the key measurable parameters are Eh and pH.
Multi-train reactors are constructed from a collection of low-volume reactor trains operating in parallel. This allows, for batch flow operation, different trains to be at different stages of remediation, and for continuous flow reactors, the number of trains online to be adjusted with time, to accommodate changes in the permeability and reactivity of the ZVI.

Appendix F.1. Continuous Flow, Fixed Bed Examples

Two reactor trains (Figure A13 and Figure A14) were created based on the concept of a multi-train continuous flow reactor, where each fixed-bed reactor train was created using 0.04 m. O.D. ABS tubing. The feed water parameters were as follows: pH = 6.52; Eh = 0.415 volts; and EC (electrical conductivity) = 0.306 dSm−1. The parameters measured were ORP, pH and EC, using Hanna meters. The pH was calibrated at pH 4, 7 and 10. The ORP was calibrated with Eh, at pH 4 and 7, using a quinhydrone calibration.

Appendix F.1.1. Train A Construction

Train A contained the following (Figure A13):
  • Reactor: 0.5 m × 0.04 m O.D. ABS;
  • ZVI: containing 0.5 kg of m-Fe0 powder (2 to 80 micron particle size);
  • Operating time period: 1840 h of continuous operation;
  • Average flow rate: 0.81 L kg−1 of Fe0 h−1;
  • Water volume processed: 745 L train−1.

Appendix F.1.2. Train B Construction

Train B contained the following (Figure A14):
  • Reactor: 3 m × 0.04 m O.D. ABS;
  • ZVI: containing 0.4 kg of Fe0 on a fibrous support;
  • Operating time period: 1840 h of continuous operation;
  • Average flow rate: 25 L kg−1 of Fe0 h−1;
  • Water volume processed: 18,400 L train−1;
  • The continuous flow experiment was repeated using a 3 m long, 0.04 m O.D; reactor containing 0.4 kg of Fe0 held on a fibrous support with 80% porosity;
  • The reactor was operated for 1840 h continuously at an average flow rate of 0.81 L kg−1 of Fe0 h−1, processing >1500 m3 water t−1 Fe0.

Appendix F.1.3. Operational Results (Train A)

The key operational observations are as follows (Figure A13):
  • The product water Eh was reduced relative to the feed water (Figure A13a) by an average of −221.6 mV (standard deviation = 61.8);
  • The product water pH was increased relative to the feed water (Figure A13b) by an average of 1.87 units (standard deviation = 0.92); The principal Eh:pH change impacting the water for the initial cumulative 1100 m3 t−1 Fe0 was Eh;
  • The average PSE change, relative to the feed water, was −0.118 V.
  • The product water EC was increased initially due to the release of Fe ions (Figure A13c); after about 800 cumulative m3 t−1 had been produced, the EC of the product water started to decline below that of the feed water;
  • The fixed-bed reactor was provided with a constant head of 1.3 m and a constant supply of feed water. The expected flow rate, based on particle size and head, was 12–16 m3 h−1 t−1. Initial declines over the first 140 h (and next 400 h) were reversed by particle agitation (Figure A13d). The flow rate decline after 900 h was due solely to the destruction of permeability due to the formation of Fe(OH)x minerals in the Fe0 bed. At the end of 1840 h, the particle bed was solid. This decline in the flow rate was associated with an increase in pH, a decrease in EC, and a decrease in Eh.
These observations indicate that a PRB is likely to reduce the permeability of the aquifer substantially (e.g., by 2 to 3 orders of magnitude) after a short period of time (Figure A13e). They also indicate that a surface-based reactor will require the Fe0 to be either held in a moving-bed reactor, stirred reactor, revolving-drum reactor, fluidized-bed reactor, or a fixed-bed reactor, where the Fe0 is held in a porous support.

Appendix F.1.4. Operational Results (Train B)

The continuous flow experiment was repeated using a 3 m long, 0.04 m O.D. reactor, containing 0.4 kg Fe0, held on a fibrous support (steel wool) with 80% porosity (Figure A14). For Train B, The principal differences are as follows (Figure A14):
  • A higher flow rate and cumulative water volume processed is achievable, due to the higher permeability (and porosity) of the ZVI bed;
  • The magnitude of the Eh and pH changes observed was lower than those observed in Figure A13, indicating that the change in Eh and pH is a function of the space velocity, SV (where the SV = Volume of water processed per unit time per unit volume or weight of ZVI contained in the reactor).
Figure A13. Example flow rate of water (Train A) through a fixed-bed reactor (0.5 m × 0.04 m O.D.) containing 0.5 kg of Fe0 powder (2 to 80 micron particle size). Head = 1.3 m (13,000 Pa); a reactor containing 1 t of Fe0 would have the dimensions (0.5 m high × 1.8 m O.D.). The feed water parameters were as follows: pH = 6.52; Eh = 0.415 volts; and EC = 0.306 dSm−1. The reactor was operated for 1840 h. (a), Eh change; (b), pH change; (c), EC change; (d); water flow rate, normalize to a commercial scale; (e), The permeability of the Fe0 bed; (f), Pourbaix diagram showing product water composition, Eh of the Fe0 surface (red line), and principal Fe ions and precipitates.
Water 15 00540 g0a13
Figure A14. Example flow rate of water (Train B) through a fixed-bed reactor (3 m × 0.04 m O.D.) containing 0.4 kg of supported Fe0 with 80% porosity. Head = 1.3 m (13,000 Pa); a reactor containing 1 t of Fe0 would have the dimensions (3 m high × 1.8 m O.D, or be multi-tubular). The feed water parameters were as follows: pH = 6.52; Eh = 0.415 volts; and EC = 0.306 dSm−1. The reactor was operated for 1840 h. (a), Eh change; (b), pH change; (c), EC change; (d); water flow rate, normalize to a commercial scale; (e), Permeability of the Fe0 bed; (f), Pourbaix diagram showing product water composition, Eh of the Fe0 surface (red line), and principal Fe ions and precipitates.
Water 15 00540 g0a14

Appendix F.2. Significance of the Operational Results

The reactor trial results (Figure A14) indicate that a stable flow rate and permeability is achievable if the reactor has a high structural porosity with large pore throats. This type of permeability is provided by the following: (i) large particles, with large voids and pore throats, (e.g., ZVI held in gabions); (ii) fibrous metal wools or fibrous material coated in Fe0 (e.g., fibrous mats); (iii) ZVI coated on inert particles; (iv) mixtures of ZVI and inert particulate material where the inert material forms a substantial portion of the particle bed; (v) fluidized and slurry ZVI beds; (vi) moving ZVI beds (e.g., rotating-drum reactor, paddle reactor, continuously stirred reactor); (vii) static diffusion reactors; and (viii) rapid catalytic pressure swing adsorption–desorption reactors.
The trial results (Figure A13) indicate that, as the pore throat diameter:pore size ratio decreases, the probability that the permeability will decrease significantly, after a critical time period, increases significantly. This critical time period will decrease as the particle size decreases. This problem affects all the fixed-bed ZVI reactors and PRBs. The problem results from the gradual oxidation of Fe0 to form Fen+ ions, coupled with the subsequent precipitation of these ions, to form Fe(OH)x and FeOOH.

Appendix F.2.1. PRB Formed Using Injected n-Fe0

Injected n-Fe0, placed into a porous aquifer to create a PRB or a treatment zone within an aquifer, shows a different vectorial flow response to the water flow direction [183]. This is expected from the basic hydrodynamic theory [68,121,184,185,186,187,188], which is summarized in Appendix G. This differential flow is not normally considered in the design of PRBs created using injected n-Fe0 [189,190].
The energy potential of the hydrodynamic surface, prior to n-Fe0, is Φ1 [68]. The energy potential of the hydrodynamic surface associated with the n-Fe0, is Φ2 [68]:
Φ1 = gZ1 + P/D1,
Φ2 = gZ1 + P/D2,
where Z1 = elevation of the aquifer at a location x:y:z, relative to a datum; g = acceleration due to gravity; P = measured aquifer pressure; D1 = density of the formation water; and D2 = density of the n-Fe0. D2, when initially injected, has a density of 7.874 g cm−3. This density reduces rapidly as the n-Fe0 aggregates and catalyzes hydrogen production [101,102]. The resultant aggregated particles (Figure 5) are motile, have a density of <1 g cm−3, and assume Janus characteristics [101,191]. D2 increases with the increasing distance from the injection point. This creates a situation where the potential associated with n-Fe0 increases with the increasing distance from the injection point (Figure A15a), until the n-Fe0 density reduces below 1 g cm−3. The net impact of this change is, for the n-Fe0, to initially sink within the aquifer in the direction of flow (Figure A15b). Once the density reduces to <1, the n-Fe0 starts to rise; otherwise, it remains at a stationary level in the direction of flow. This is the expected position associated with hydrodynamic modelling and the observed experimental position [182].
The rising, migrating and aggregating n-Fe0 spheres (Figure 5 and Figure A15b) may grow to a size that is greater than the pore throat diameter. When this occurs, the pore is effectively transformed from an open pore to a dead-end pore. Over time, this n-Fe0 will form Fe(a,b,c) polymers. These polymers will close, or severely reduce the pore throat diameter. The net effect is a reduction in the aquifer permeability. This change occurs in both the aquifers affected by n-Fe0 injection and the fixed-bed reactors containing n-/m-Fe0 [101,102], as illustrated in Figure A13.
Figure A15. Injected n-Fe0 hydrodynamic modelling. (a), variation in potential with distance from the injection location. Blue line = water; red line = n-Fe0; blue arrow = direction of water flow; (b), Depth of the ZVI body within the aquifer as a function of distance from the injection point.
Water 15 00540 g0a15

General Porosity Closure Mechanisms

Immediately following injection, no n-Fe0 particle is attached to the surface of the mineral grains within the aquifer, and the particles are able to move within the aquifer, through the pores [192], when the pore throat diameter is less than the n-/Fe0 particle diameter (Figure A15). Obviously, following the initial high velocity injection, the particle velocity will slow, and as it slows, there will be a tendency for the entrained particles to settle and become trapped within the pores.
When H2 gas generation occurs, the gas bubbles aggregate [101], reduce the particle density [101], and can block pore throats [192], thereby reducing the permeability. n-Fe0 particles will tend to adhere to the exterior of the gas bubble [101,192]. Experiments [142] using air have demonstrated that the air bubbles can close (block) the pore throats in coarse quartz sand and clays (Figure A16).
Figure A16. Permeability loss associated with rising gases. (a), Unconsolidated quartz sand in a rising water column, showing pore throat blockage by rising gas (air) bubbles. Field of view = 1.5 cm; (b), Clay showing clod structure, with clay clods separated by a pore network. Water is flowing through the clay via the porosity. Rising gas bubbles accumulate in the pores and can block the pore throats. Field of view = 5 mm.
Water 15 00540 g0a16
In addition to pore throat blocking by physical particle size blocking, and the precipitation of Fe(a,b,c) polymers (FexOyHz [H2O]n) and colloids within the porosity, the main processes associated with electro-chemical pore blocking by n-Fe0 are as follows [193,194,195,196,197]: (i) irreversible attachment associated with Van der Waals forces; (ii) reversible attachment, if the electrostatic repulsion derived from the electrical double layer (EDL) and the attraction resulting from the Van der Waals forces are similar; (iii) irreversible attachment when EDL forces dominate; (iv) ripening phenomenon, where the irreversibly attached particles (n-Fe0, n-Fe0:Fe(a,b,c), n-Fe(a,b,c)) attract and retain migrating particles (n-Fe0, n-Fe0:Fe(a,b,c), n-Fe(a,b,c)) and ions (Fen+; FeOH+, FeOH2+, Fe(OH)2+, Fe(OH)3+, etc.); (v) chemo-potential movements; (vi) redox attraction; and (vii) volume expansion of stationary n-Fe0 particles resulting from their conversion from n-Fe0 to Fe0:Fe(a,b,c) and n-Fe(a,b,c) polymers. This change may conservatively increase the particle volume by a factor of 6 [198,199]. Once trapped gases, trapped water, and the accretion of oxyhydroxides and carbonates from the water contained with the pores are considered, the actual volume increase may be by a factor of between 5 and 15. In many colloidal particles where the polymer surrounds an aqueous core, the measured ratio [120,121] of [FexOyHz [H2O]n]:H2O may be between 1:0.5 and 1:5; in the [FexOyHz [H2O]n], the ratio of x:n may exceed 1:10.

Appendix F.2.2. PRB Formed Using Fe0

A PRB created using Fe0 will show a reduction in permeability with time, due to the formation of Fe(a,b,c) polymers, blocking flow pathways with the PRB. This feature of Fe0 was first demonstrated during the period 1880/3 at the Antwerp Waterworks [101]. Processed water flows reduced from 10,000 m3 d−1 to <5000 m3 d−1, due to permeability loss in a 900 t of Fe0 (DRI) filter bed [101]. This permeability loss was attributed to the formation of Fe(a,b,c) polymers [101]. It is reasonable to expect a similar permeability outcome with each installed PRB [198,199,200]. Most PRB researchers assign PRB permeability loss solely to the volume expansion associated with the formation of Fe(a,b,c) polymers.
In most instances, when a PRB is installed, no flow rate monitoring is undertaken either side of the PRB. Flow rate monitors are not normally installed within a PRB, though patents, which would allow their placement within a PRB, have been granted (US11454114B2). Monitoring is normally undertaken for the water composition either side of the PRB. Permeability changes within the aquifer and in the PRB over time can also be monitored using non-invasive geophysical techniques (US6289284B1).
A PRB containing 900 t of Fe0 may only be required to process 5–50 m3 d−1. However, the Antwerp Waterworks established that this volume of 100% Fe0 should be able to process >10,000 m3 d−1 [101]. A Shanghai Waterworks established that this volume of 98% Fe0 + 2% Cu0 should be able to process >65,000 m3 d−1 [101]. Therefore, a decline in the PRB permeability in two orders of magnitude (Figure A13) would only reduce the PRB capacity to between 100 and 650 m3 d−1. In this example, this magnitude of permeability reduction would not affect the ability of the PRB to process 5–50 m3 d−1.
Current PRB design guidance suggests the following: (i) the PRB permeability should be at least an order of magnitude greater than that of the aquifer [4,201,202,203]; and (ii) the PRB thickness should provide sufficient residence time to allow the appropriate remediation reactions to occur. Experiments have demonstrated that this permeability loss within a PRB increases as the particle size decreases [16].
Permeability loss can be prevented or restricted by the following measures: (i) providing the Fe0 particles with cathodic protection [93,101]; and (ii) mixing the Fe0 with another material to reduce permeability loss (US7347647B2), e.g., a pelleted (25 mm × 30 mm × 70 mm) mixture of Fe0 + commutated fibrous organic material in a weight ratio of between 1:1 and 1:500,000. This mixture (e.g., 1:20 weight ratio), over a 300 day period, when compared with 100% Fe0, produced an average pH that was 1 to 2 units lower than Fe0, and an Eh that was 0.05 to 0.1 V lower than Fe0. Other examples that include mixing the Fe0 with pumice, lapillus, biochar, limestone, or another inert material are provided in the following references: [4,199,204,205,206,207,208,209].

Appendix G. Creation of a Stationary Hydrodynamic Plume

The exact details associated with the construction and operation of a stationary plume will be site specific. The plume may be designed using a hydrological software package, such as Modflow, or a petroleum/reservoir engineering equivalent, such as Eclipse. Alternatively, the stationary plume may be designed by a civil (or chartered) engineer or hydrologist, using conventional software packages, such as Excel.
The information required for the aquifer, prior to its hydrodynamic reconstruction, is as follows:
  • The aquifer parameters, depth to base (and top if confined), potentiometric surface, contaminant plume location, contaminant plume chemistry, chemistry of the surrounding water, aquifer porosity, and aquifer permeability;
  • The proposed abstraction well details, including the negative head (or pressure) created by the well;
  • The proposed injection well or infiltration device details, including expected positive head (or pressure during recharge);
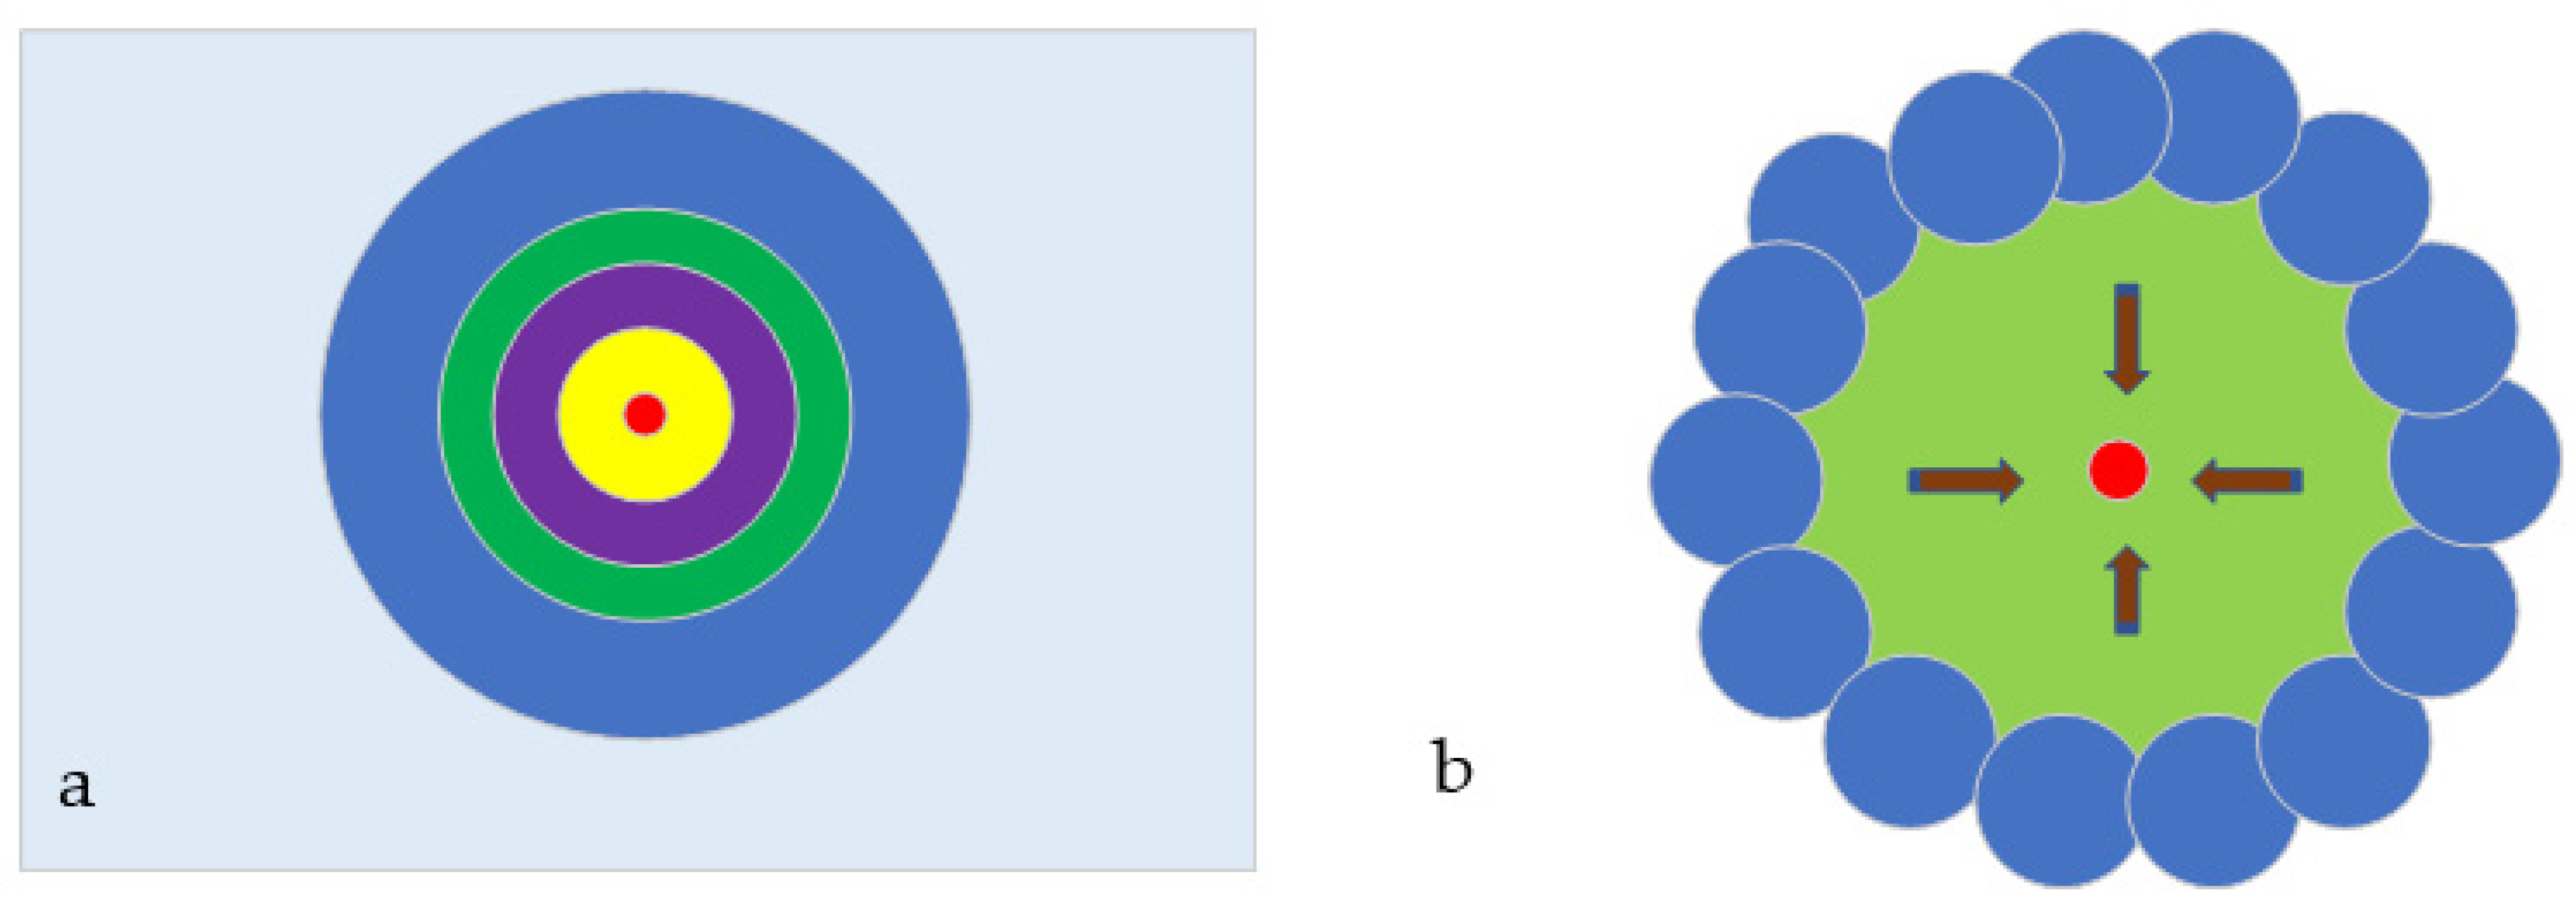
  • The location, volume, and nature of the contaminant plume (Figure A1), and location and volume of the constructed stationary plume (Figure A1).
If the contaminant plume is an immiscible liquid (Figure A1a), then the stationary plume will be designed to maximize the recovery of the mobile immiscible fluid. Surfactants or another fluid may be injected into the stationary hydrodynamic plume to aid the recovery of the irreducible, immiscible liquid(s) within the pores.
If the contaminant fluid is an anthropogenic miscible fluid or a soluble ion (Figure A1b), then the volume of the contaminant plume (Vcp) will be less than the volume of the stationary plume (Vsp). While the abstraction well will target the heart of the contaminant plume, it is likely that the recirculation process (associated with forming and maintaining the stationary hydrodynamic plume) will rapidly dilute the pollutant across the entire stationary plume volume. Therefore, if the average contaminant concentration (Cav) in the contaminant plume is 1 g L−1, and the respective volumes are Vcp = 100 m3 and Vsp = 5000 m3, then the expected average concentration of the pollutant across the stationary plume (Cavp) will be 0.02 g L−1, as follows:
Cavp = Cav × Vcp/Vsp.
If the contaminant fluid is a natural miscible fluid or a soluble ion (Figure A1c), then the volume of the contaminant plume (Vcp) will be equal to the volume of the stationary plume (Vsp). In this instance, Cavp = Cav.
As an initial assumption, the aquifer is considered to be homogenous, with a permeability, k; this is isotropic in the x, y, z directions, where kx = ky = kz. The placement of an abstraction well in this aquifer will result in the creation of radial flow into the well; this will have a pressure distribution that can be defined [78] as follows:
Pe-Pwf = (A)(B),
where Pwf = Pressure or head of the aquifer at the abstraction well bore; Pe = Steady state pressure or head of the aquifer; (A) = qμ/(kh); (B) = (Ln(re/rw) + 3/4 + S); rw = well bore radius; re = outer boundary radius of radial influence; S = skin factor; h = head, or pressure, measured as m, ft, psi, or Pa; k = permeability expressed as m3 m−2 s−1 h−1; q = constant production rate; μ = fluid viscosity; and Pe-Pwf = change in the potentiometric surface, relative to the previous position. A common approximation is as follows [78]:
Pe-Pwf = q/(2πT) Ln(re/rw),
where T = transmissibility. These assumptions assume that the aquifer is confined, has a uniform thickness, has an infinite extent, is homogenous, is isotropic, and is fully penetrated by the well. This creates a radial change in Pe-Pwf around the injection well or the abstraction well [77] (Figure A17a). The radial infiltration wells are placed in a ring around the required area of the stationary mound (Figure A17b). Their positioning requires the infiltration/injection ring to have a pressure (Pe-Pwf), where P is always greater than Pe.
Figure A17. Conceptual model for a hydrodynamic stationary mound. (a), Example of radial head changes as a function of abstraction or injection. red = injection well, Pwf; light blue = aquifer head, Pe; blue, green, purple and yellow = different values of P between Pe and Pwf. (b), Conceptual model for a stationary plume (green), where blue circles indicate areas where Pe-Pwf > Pe is associated with injection or infiltration; red circle is abstraction well. Arrows indicate fluid flow directions within the plume. The blue ring of infiltration/injection devices creates a zone of high potential surrounding the contaminant plume. The full width of the hydrodynamic stationary plume is schematically illustrated in Figure 7.
Water 15 00540 g0a17
The energy potential of the hydrodynamic surface prior to the creation of the stationary plume, Φr, is as follows [68]:
Φr = gZ + P/Dr,
where Z = elevation of the aquifer relative to a datum; g = acceleration due to gravity; P = measured aquifer pressure; and Dr = density of the formation water. Within the stationary plume (Figure A17b), two items change, Dr and P. The energy potential within the stationary plume, Φp, (Figure A17b) is as follows [68]:
Φp = gZ + P/Dp,
where Dp= water density within the stationary plume, e.g., between 1.0 and 1.14 g L−1. Fluid flow is from locations of high potential to areas of low potential. The infiltration wells/injection wells represent points of high potential, while the abstraction well(s) represents an area, or point, of low potential.
For the purposes of this scoping study, the assumptions made are summarized in Table A1. The irreducible water saturation (Swir) of an aquifer is a function of its permeability, pore-throat size, its proportion of porosity that is dead end, and its permeability. The irreducible water saturation can be measured, but it can also be estimated using a number of models. For example, the following can be used [210,211]:
Timur model: Swir = ((134(porosity)4.4)/(k (md)))0.5,
Permeability, k, is expressed in millidarcies (md). A permeability of 1 darcy is a permeability of 1 m3 m−2 s−1 10,000 Pa = 1 × 10⁻⁵ m3 m−2 s−1 Pa−1. Here, 1 darcy, d = 1000 millidarcy, md.
The Tixier model is as follows: Swir = (250(porosity)3)/(k (md))0.5,
The Coates–Dumanoir model is as follows: Swir = (100(porosity)2)/ (100(porosity)2 + (k (md))0.5).
Each model [210,211] gives a different outcome for the irreducible water saturation (Table A1). For the purposes of this study, it is assumed that Swir = 30%. The reducible, or mobile, water saturation, Sw, is calculated as 1 − Swir.
The skin factor, S, can be defined as follows[78]:
S = (ke – ka)/ka + Ln (ra/rw),
where k = ke = average effective permeability of the aquifer; ra = radius of formation affected by formation damage, associated with well installation and operation; and ka = average permeability within formation damaged zone.
The gross rock volume (GRV) within the stationary plume = 353,429 m3. The total water volume within the stationary plume = 106,028 m3, of which 74,220 m3 is mobile and can be processed. The ground area covering the stationary plume = 7.07 ha. For modelling purposes, it is assumed that Vcp = Vsp (Figure A1c). If Vcp < Vsp (Figure A1b), then the modelled results will need to be adjusted.
Table A1. Parameters associated with the hydrodynamic stationary plume.
ItemParameterValue
1Aquifer Thickness, m5
2Aquifer Porosity30%
3Aquifer Permeability, m3 m−2 s−1 Pa−1
3aVertical (z) direction5 × 10−6
3bHorizontal (x) direction5 × 10−6
3cHorizontal (y) direction5 × 10−6
4Stationary plume radius, m150
5Gross Rock volume within the plume, m3353,429
6Net to Gross Ratio for the aquifer1
7Saturations
7aIrreducible Water Saturation
7aaTixier Model30.19%
7abTimur Model3.66%
7acCoates Dumanoir Model28.70%
7adAssumed for Modelling30.00%
7bReducible Water Saturation70.00%
8Total Mobile Water volume, m374,220
9Ground area covered by the stationary plume, ha7.07
The conceptual model outlined in Figure A17 assumes the following: (i) that the aquifer is confined between an upper aquitard and a lower aquitard (Figure A1); (ii) infiltration and abstraction devices are lined between the ground surface and the aquifer with an impermeable lining (Figure A1), and (iii) the discharge of water to, or the abstraction of water from, the aquifer is through a perforated liner, which extends between the upper aquitard and the lower aquitard (Figure A1).
This structuring ensures the following: (i) that all the water flow within the infiltration and abstraction devices is in a z direction within the annulus; (ii) that all water flow within the aquifer is within a x and a y direction; (iii) that the water level (above the natural potentiometric surface, associated with infiltration devices) is a positive store of potential energy (Figure A18a); (iv) that the water level (below the natural potentiometric surface, associated with abstraction devices) is a negative store of potential energy (Figure A18b); and (v) that fluid flow is always from points of positive potential energy to points of negative, or less positive, potential energy (Figure A2). This potential energy (applied pressure) dissipates with the increasing lateral distance from the point source. The rate of dissipation is a function of pore size, pore throat size, the proportion of dead-end pores, and the presence of open fractures, etc.
Figure A18. The conceptual potentiometric surfaces: (a), associated with an infiltration well or injection well in a homogenous confined aquifer, or a homogenous unconfined aquifer; and (b), associated with an abstraction well in a homogenous confined aquifer, or homogenous unconfined aquifer. Fluid flow is in the direction of decreasing potential. x-, y-, z-axial units are meters. Colors are potential expressed in m (head), Pa, or potential. Brown is the highest potential.
Water 15 00540 g0a18
The transport through the aquifer in (or from) a x or y direction takes place as a result of a driving force acting on the water feed i.e.,
J = −A dX/dx,
where J = flux, A = phenomenal coefficient (e.g., permeability, hydraulic conductivity), dX/dx = driving force expressed as a gradient of x along a co-ordinate perpendicular to the direction of transport. The principal driving force is pressure (hydraulic head). The driving force is a function of the water depth within the annulus of the infiltration/injection device, or of the abstraction well.

Appendix H. Formation of a Groundwater Mound

Soils located above an unconfined aquifer, or an aquitard, are commonly contaminated with anthropogenic chemicals, resulting from agricultural, industrial, petrochemical, or military activities. In many areas, local fluid discharges from septic tanks, cess pits, and foul waste treatment plants are also discharged into the soil. These pollutants may enter the underlying unconfined aquifer, or may be retained in the soil. When they enter the unconfined aquifer, they can be remediated using a stationary hydrodynamic plume. If they are retained in the soil as either exchangeable cations/anions within clay/organic structures, as precipitates within the porosity, or as ions contained within the irreducible water within the porosity, then infiltrating fresh water into the soil will remobilize all or part of these contaminant ions.

Appendix H.1. Chemical Potential

The underlying assumption is that mobile ions migrate spontaneously from a region of high chemical to a region of low chemical potential (fresh water), where the following is formulated [212]:
ΔG = (μBμA) Δni = ΔGA + ΔGB,
where ΔG = total change in the Gibbs free energy of the system; μB = chemical potential of the ion in the freshwater; μA = chemical potential of the ion contained in the pores and clay prior to the addition of the fresh water; and Δni = number of moles transferred, where ΔGA = μA (−Δni) and ΔGB = μB (+Δni). If μB < μA, there will be a net flow of ions to the fresh water.
The chemical potential of an ion, μi, is as follows [212]:
μi = μi* + RT ln(xi),
where μi* = the chemical potential the solute, i, would have when, xi = 1, and Henry’s law is obeyed over the range 0 ≤ xi ≤ 1; R = gas constant; T = temperature, K; xi = Mmi/(1 + Mmi); M = molar mass of the solvent (water); and mi = molality of the solute. The creation of the groundwater mound maintains M while reducing mi, i.e., it reduces ln(xi).
The negative magnitude of ΔG decreases with time to 0 as the fresh water interacts with the soil. At this point, there is an equilibrium between the ion concentration in the groundwater mound the ion concentration in the irreducible water, and the exchangeable ion concentrations within the adjacent clays. At this point, the ion concentration in the moveable water and the irreducible water in the soil is the same. For example, if at time t = 0, the irreducible water ha an ion saturation, is, of 1 mg L−1, and the irreducible water, Swir, = 50% of the total pore water, after the fresh water is added, then at time t = n, when ΔG = 0, is, = 0.5 mg L−1. The replacement of the moveable water with fresh water at time t = n will again decrease ΔG. ΔG will then reduce to 0 at time t = n + m. At this point, is = 0.25 mg L−1. In most soils, 0 < Swir < 50%. Swir is measured as follows:
Swir = (ϕdϕa)/ ϕd,
where ϕd = total porosity of the soil; and ϕa = porosity of the drained soil following saturation with water. There are a large number of models that can predict Swir as a function of permeability, sediment type, and porosity [213,214,215,216].
Solubility models are complex, and will vary for different ions and ion concentrations. It follows that, for a specific ion, the change in the ion concentration in the moveable water will be a function of both the ion diffusion rate and its dissolution rate (if it has crystallized). The initial water charge forming the groundwater mound is used to mobilize the contaminant ions, such that they move into the moveable water fraction of the porosity from the irreducible water fraction. The function of the subsequent water charge to the mound is to continuously flush the contaminants from the mound by both removing water and by replacing the removed water with freshwater, in order to maintain a negative ΔG within the moveable water volume contained within the mound.

Appendix H.2. Standard Infiltration Groundwater Mound
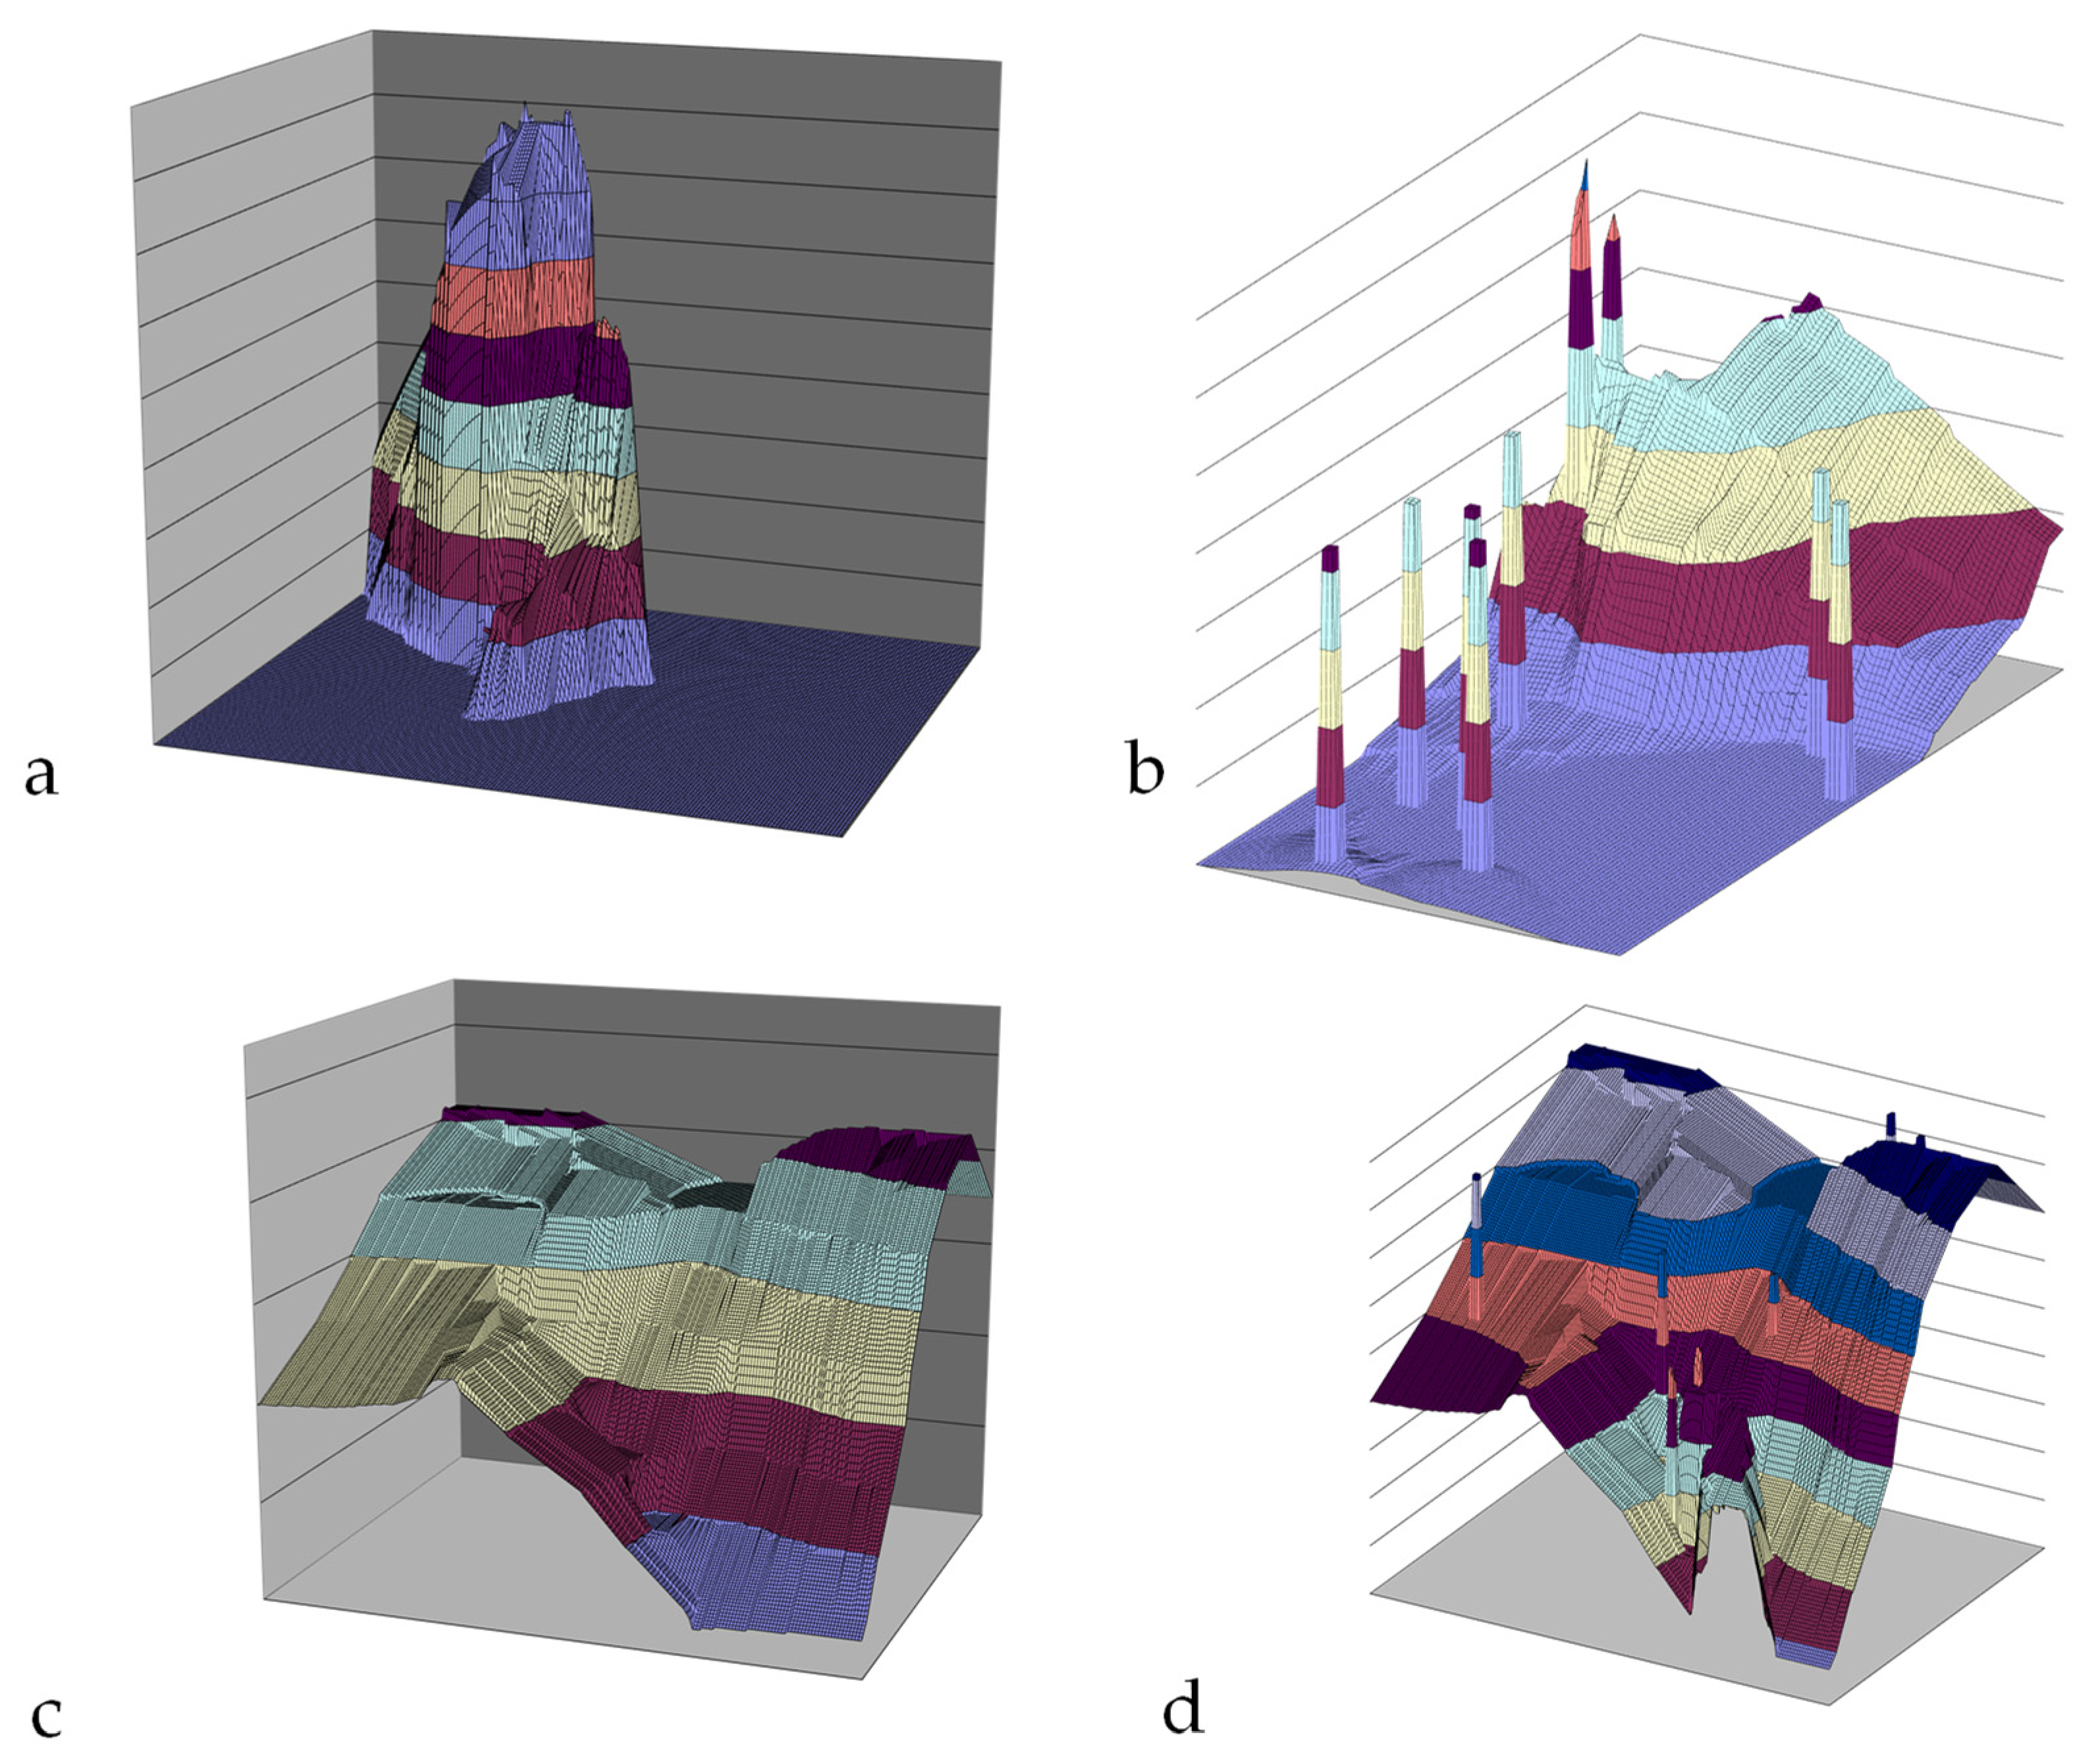
The groundwater mound is created by infiltrating water into the ground, in order to provide a recharge point. A standard infiltration model assumes that the infiltration devices will discharge directly and vertically into the underlying water table (Figure A19a). This assumption creates a descending and vertical groundwater mound, and an aquifer recharge point, for an underlying unconfined aquifer (Figure A19a). The insertion of multiple infiltration devices may have only a limited impact on the potentiometric surface (Figure A19b). The underlying water table may be irregular (Figure A19c). In this instance, the presence of infiltration devices may modify the potentiometric surface (Figure A19d).
Figure A19. Potentiometric surface associated with conventional infiltration devices, discharging to an unconfined aquifer. (a), Example of the potentiometric surface associated with an infiltration device. (b), Example of an irregular potentiometric surface receiving water from nine infiltration devices; (c), Example of an irregular potentiometric surface; (d) Example of an irregular potentiometric surface, following the installation of infiltration devices.
Water 15 00540 g0a19

Appendix H.3. Vertically Static, Laterally Expanding Groundwater Mound

In sediments where the horizontal permeability is greater than the vertical permeability, the infiltrating water may form a perched, hydrodynamically trapped groundwater mound [142]. The mound may be perched above an aquitard, or an unconfined aquifer.

Modelling the Upper Surface of the Mound

The upper surface of the groundwater mound can be modelled using the Dupuit approximation [142]. There are a large number of different groundwater models that can be used to model and construct a ground water mound [142,217,218,219]. It is possible to use the approach described in this study to create a perched freshwater groundwater mound within a saline unconfined aquifer [125]. In this study, the upper surface elevation (zx) of the groundwater mound at a distance x from the infiltration device approximates to the following:
zx = (zj2 − [zj2zD2](x/D))0.5,
where zD = the elevation (m) of the groundwater mound at a distance D (m) from the infiltration device where x < D; and zj = the elevation (m) of the groundwater mound in the infiltration device. The maximum width (m) of the groundwater mound during recharge (D) will approximate to the base of the device, i.e., zD = the elevation of the base of the infiltration device.
The maximum distance (D) is a function of the horizontal permeability of the sediment. Unconsolidated sediments (clays, silts) tend to be poro-elastic, and contain a variety of fractures, nano, micro, and macro. Their permeability also tends to be anisotropic, with horizontal permeabilities, kh, being perhaps 10 to 100 times the vertical permeability, kv, where anisotropy, AD, is calculated as follows [142]:
AD = kh/kv,
The vertical flow rate, Jv, into sediment through the base of an infiltration device is determined as follows [142]:
Jv = kv ABPv
where AB = area of the base of the infiltration device, m2; and PV = pressure applied to the base of the device by the height of the water column (hc, m) in the infiltration device, e.g., Pv, Pa = 10,000 × hc. The horizontal flow rate, Jh, into the sediment through the sides of an infiltration device is determined for each depth increment, e.g., 0.1 m, as follows:
Jh = kh ASPh
where AS = area of the sides of the infiltration device, m2; and Ph = average pressure applied to the sides of the device by the height of the water column (hc, m) in the infiltration device, in the appropriate depth interval. If the top of the water column is located at the top of the perforated interval of the sides of the infiltration device, hp, then Ph, Pa = 10,000 × (hp + hc)/2. An example illustrating the effect of anisotropy on the horizontal infiltration rate and the overall infiltration rate is provided in Figure A20, assuming that the water depth in the infiltration device is maintained at a constant level.
Figure A20. Impact of anisotropy. (a), Horizontal infiltration rate, per 0.1 m interval, versus water column height. kv = 0.09 m3 m2 unit time−1; blue line: AD = 0.1; brown line: AD = 1.0; purple line: AD = 10; red line: AD = 30; Black line: AD = 100; (b), infiltration rate versus anisotropy (AD). Blue = infiltration through base of infiltration device (3.14 m2); Green = infiltration through sides of the infiltration device (6.28 m2); Red = total infiltration; constant average water depth in the infiltration device = 2 m.
Water 15 00540 g0a20
This information (Figure A20) can be used to model the upper surface of the mound. If the unit time (Figure A20) is 1 h, kv = 0.09 m3 m2 h−1, and the average sediment porosity is 50%, then at the end of 1 h, the vertical water column will extend 0.7 m below the infiltration device. The implied groundwater mound shape, after 1 h, is summarised in Figure A21a,b for AD = 30. Increasing the operating period increases the size of the associated groundwater mound. There is a pressure loss as the water descends or travels laterally. This pressure loss effect increases as k decreases, and can create a perched groundwater mound that is effectively static within the soil sequence.
Figure A21. Groundwater mound during formation. (a), Lateral extent from the infiltration device versus depth relative to the base of the infiltration device. Here, 0 m = base of the device (datum), and 2 m = top of the water column within the infiltration device. Black is the form calculated from the permeability data; Red = the associated Dupuit envelope. (b), Dupuit envelope for the groundwater mound. Blue = water within the infiltration device; Red = air filled portion of the infiltration device.
Water 15 00540 g0a21

Appendix H.4. Reconstructing a Perched Groundwater Mound to Remediate the Soil
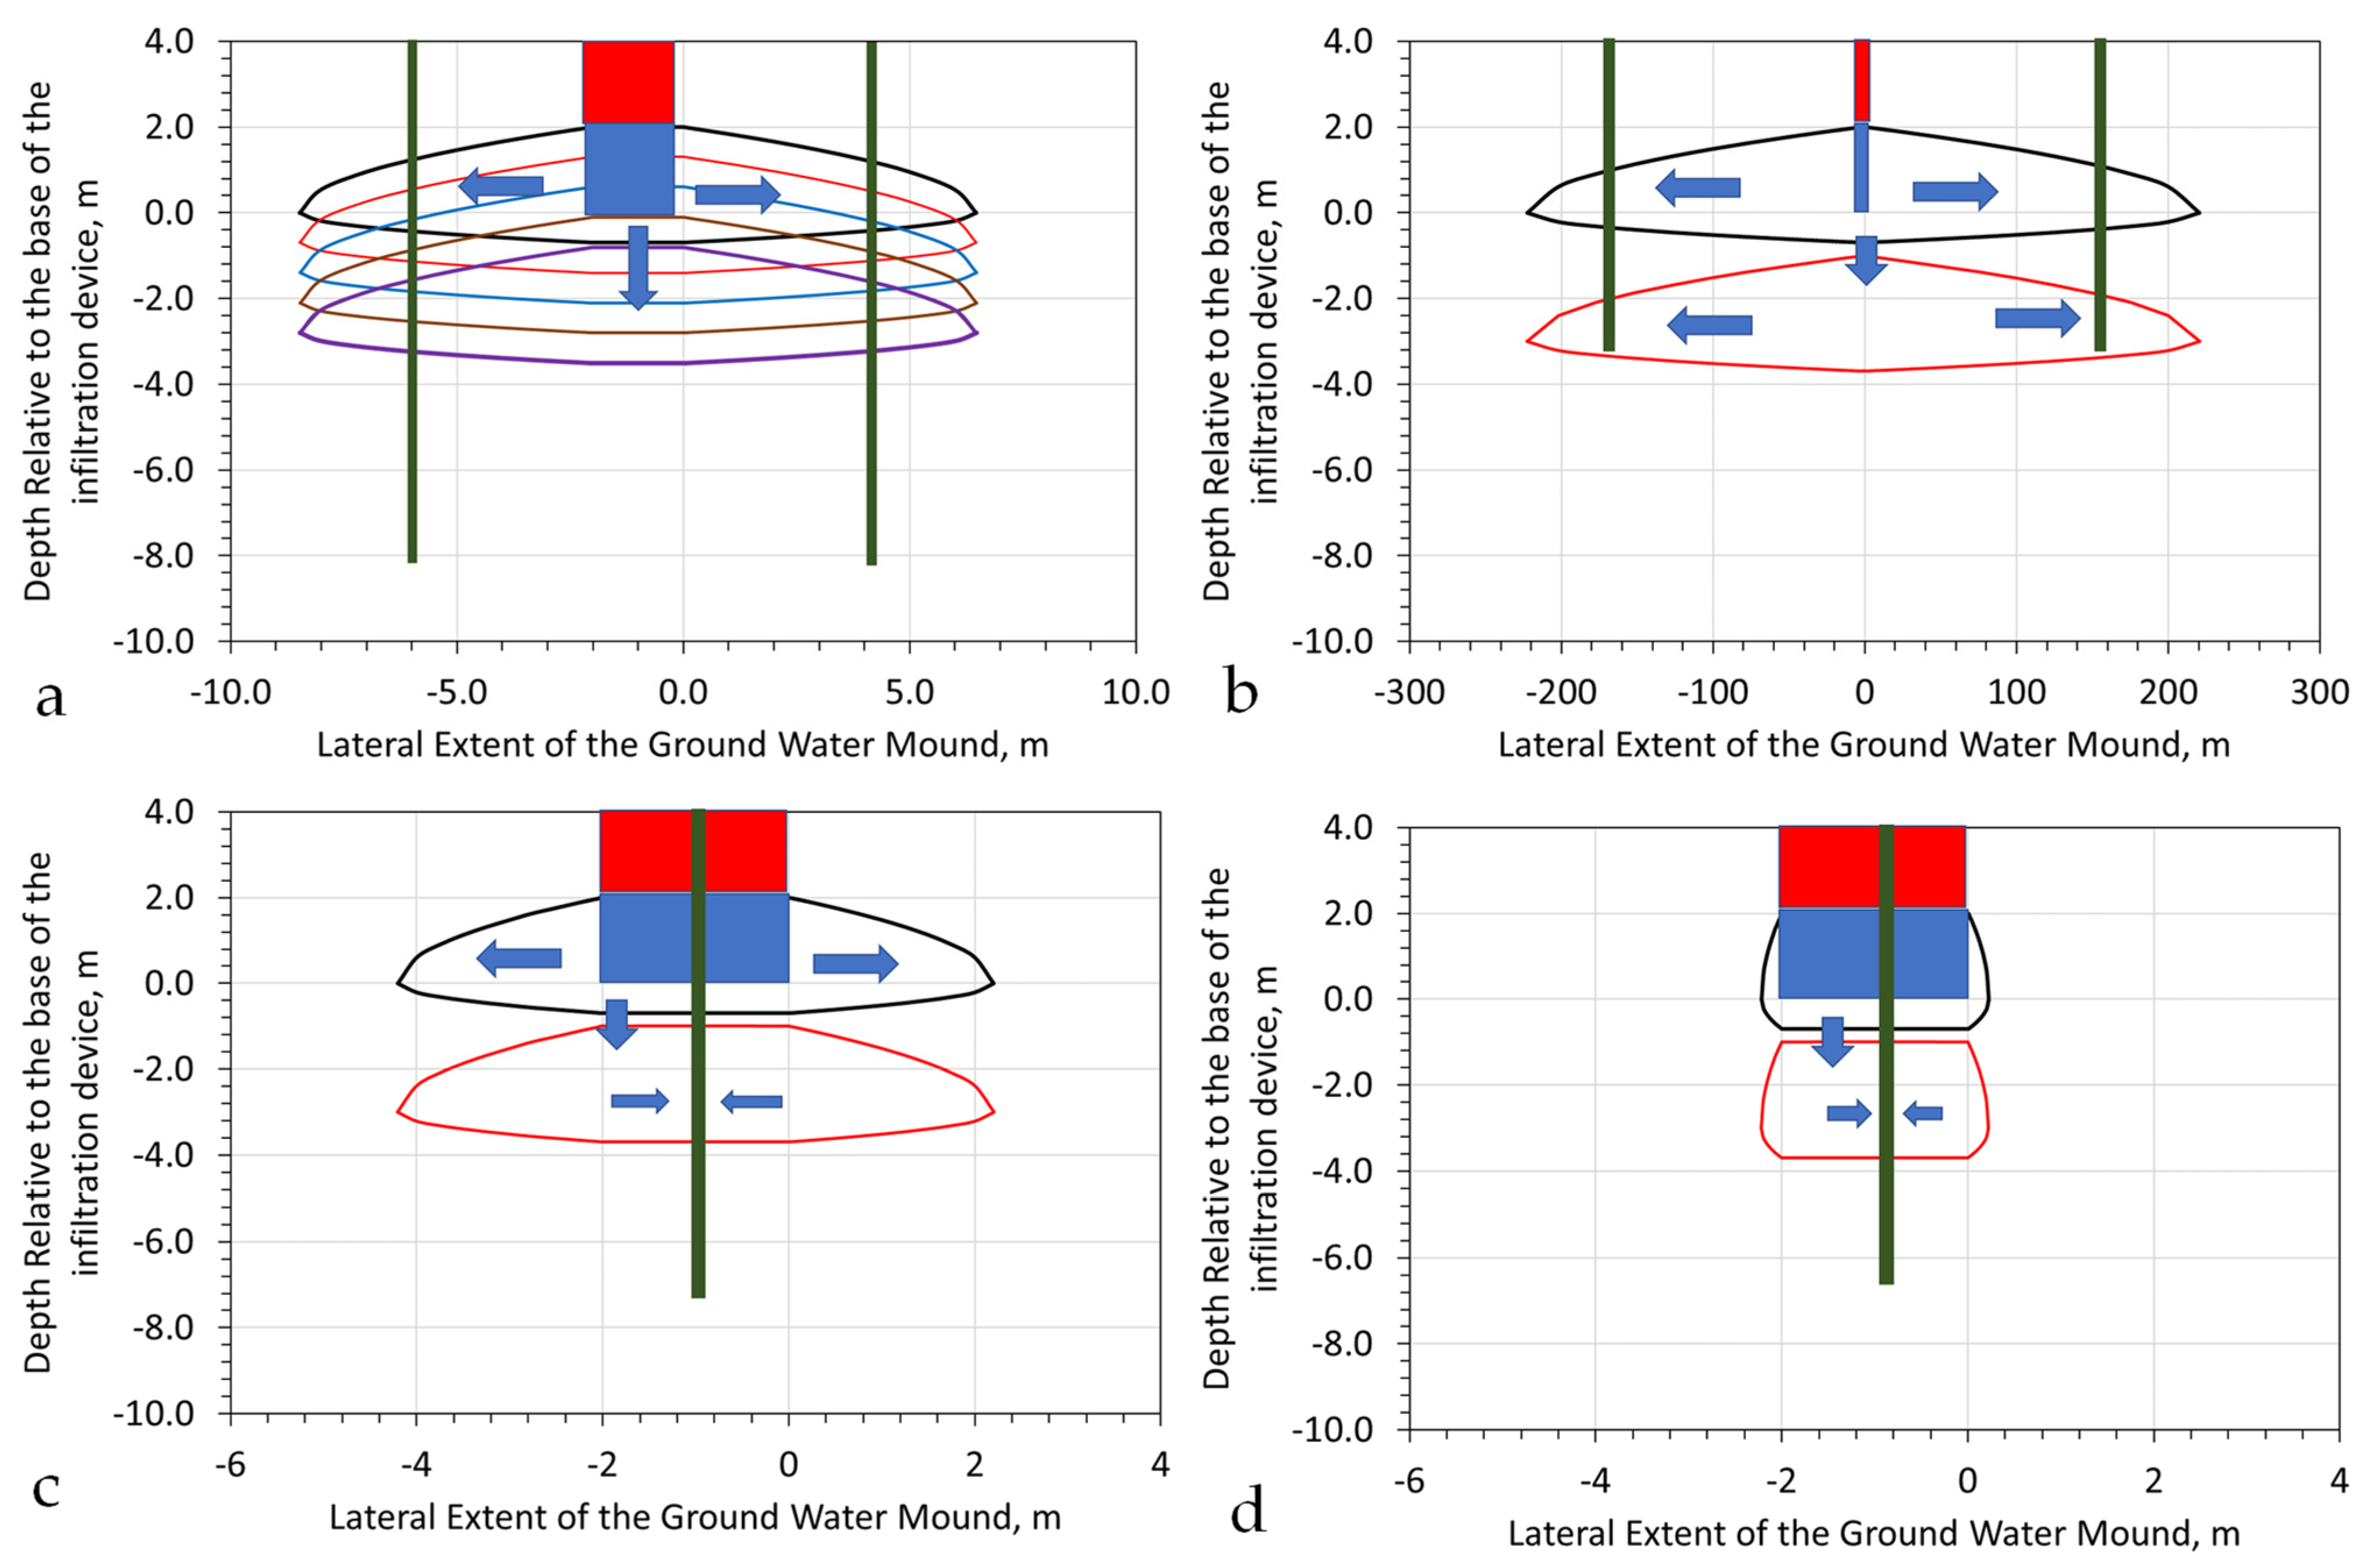
In a confined or unconfined aquifer, the optimal remediation strategy requires the creation of a stationary plume, where an abstraction well is surrounded by infiltration devices. The remediation of perched groundwater plumes or polluted soils may require a different strategy. This strategy requires an infiltration of an initial volume of water from an infiltration device located over the polluted zone. Water is abstracted from the periphery of the groundwater mound for processing, prior to infiltration. Examples of groundwater mound structures of this type are shown in Figure A22a,b.
Figure A22. Remediation strategies associated with contaminated soils using groundwater mounds. (a), Groundwater mound, showing the increasing size of the mound over 5 h. AD = 30; (b), Groundwater mound, showing the increasing size of the mound over 4.3 h. AD = 1000; (c), Groundwater mound, showing the increasing size of the mound over 4.3 h. AD = 10; (d), Groundwater mound, showing the increasing size of the mound over 4.3 h. AD = 1; Blue arrows = water flow directions; Green columns = abstraction wells; Blue column = water within the infiltration device; Red column = air in the infiltration device above the air–water contact.
Water 15 00540 g0a22
While soil remediation can be addressed using a central infiltration device surrounded by abstraction wells, when AD > 10, when AD < 10, the bulk of the groundwater mound is located immediately below the infiltration device. In this instance, the most effective soil remediation strategy is to locate the abstraction well, which is below the infiltration device (Figure A22c,d).
Most contaminated soils cover a wide area, and cannot be addressed by a single infiltration device. In this instance, infiltration is used to create a series of overlapping ground water mounds, which are interspersed with abstraction wells. They are designed to pass fresh water or decontaminated water into the mound, and abstract contaminated water through the abstraction wells. When AD exceeds a critical value, e.g., 10, it may be possible to use a single abstraction well to abstract water from several overlapping groundwater mounds. Most contaminated soils extend to <10 m below the ground surface. This allows both the infiltration wells and the abstraction wells to be created using simple lined auger boreholes. This approach can be used to rapidly provide a rectangular grid (or other form of grid) of both abstraction and infiltration points, in order to allow the rapid treatment of the contaminated soil.
Specific points to note are as follows:
  • The local sediment permeability will dictate the parameters of the perched groundwater mound. Its rate of descent is a function of the vertical permeability.
  • Infiltration devices are normally designed to discharge the sequestered water, primarily in a z-direction, where the vertical flow rate is as follows:
Jz = kz (Pz × PLz),
where Jz = Vertical flow rate from the infiltration devices; kz = vertical permeability; Pz = pessure applied by the water column; and PLz = pressure loss fraction. If no pressure loss occurs, PLz = 1. The horizontal flow rates are as follows:
Jx,y = kx,y (Px,y × PLx,y),
where Jx,y = Vertical flow rate from the infiltration devices; kx,y = vertical permeability; Px,y = pressure applied by the water column; and PLx,y = pressure loss fraction. If no pressure loss occurs, PLx,y = 1.
The water infiltration rate, both lateral and vertical, is controlled by the ability of the displaced air to escape from a pore (Figure A16). This is a function of both the pore throat size and the pore tortuosity [142]. The air blocks pore throats, converting interconnected pores into dead-end pores. Therefore, many soils display a poro-elastic permeability, which reflects the changing nature of the permeability of the soil to air, where a counter current of water and air exists [142]. The soil permeability to water tends to jump by several orders of magnitude with an increase in pressure (water column height in the infiltration device) [142]. These changes reflect the point at which the bulk of the trapped air becomes mobile, and access via water to semi-blocked or blocked nano fractures and macropores, etc., becomes possible. This may reflect the formation of natural pipes (or accessing of natural pipes) within the groundwater mound.

Appendix H.5. Conceptual Example of Operation
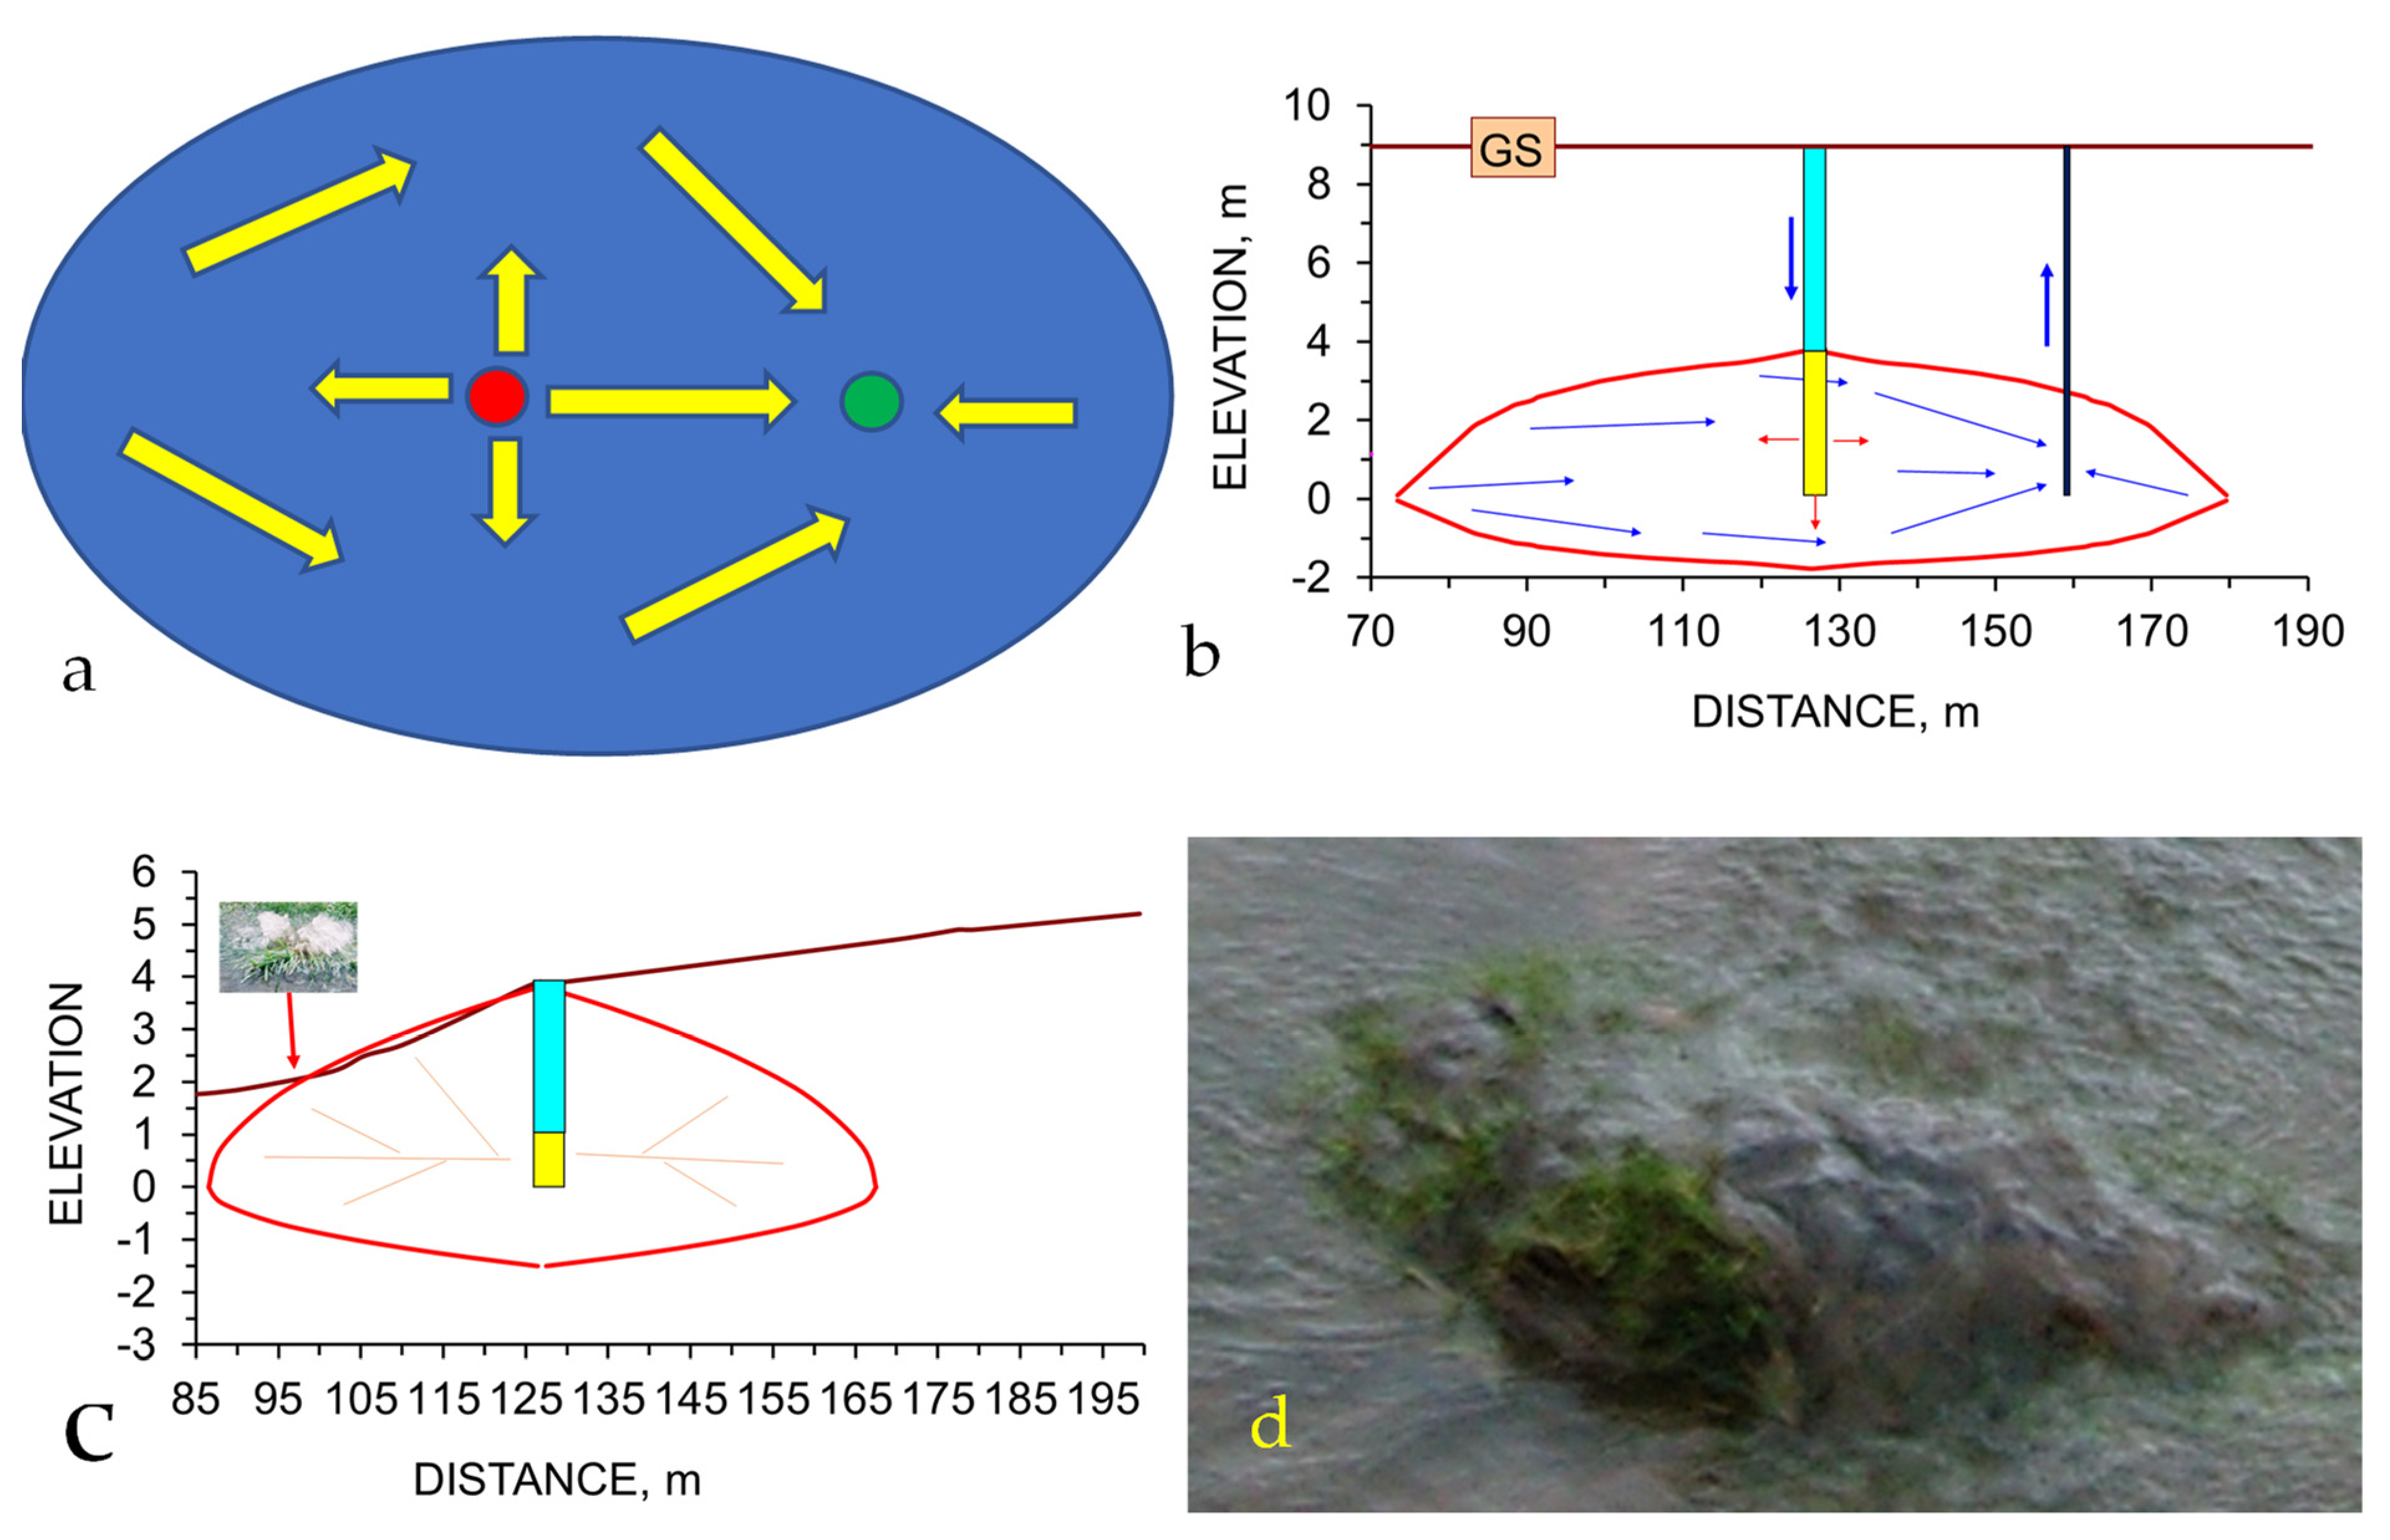
A conceptual groundwater mound structure, containing an infiltration device and an abstraction well, is shown in Figure A23a,b. The infiltration device is used to create the mound, while the abstraction well is used to drain the mound water + contaminants. In low permeability sediments and soils, it is not uncommon for the water level in the groundwater mound to rise above the top of the perforated infiltration zone (Figure A23c). In the example shown in Figure A23c, the groundwater mound locally reaches the ground surface (Figure A23d). In low permeability soils, much of the water transport within the mound is in activated natural pipes and pressure opened fractures, etc. [142]. These natural pipes, when they intersect the ground surface, cause an overland flow discharge (Figure A23c,d). These natural pipes can be tapped, in order to provide a discharge of contaminated water from the groundwater mound. This discharge can be trapped and piped to a reactor for processing.
Figure A23. Conceptual groundwater mound being used to simultaneously infiltrate and abstract water. (a), plan view; red = infiltration device; green = abstraction well. Yellow arrows = water flow directions, (b) cross-sectional view of the groundwater mound. GS = ground surface; red arrows = infiltration flow directions; Blue arrows = abstraction flow directions; yellow = perforated infiltration device; blue = feeder pipes to the infiltration device; purple = abstraction well. (c), constructed groundwater mound in clay soil. yellow = perforated infiltration device; blue = feeder chamber to the infiltration device; (d), high pressure water discharging, as overland flow, from vertical natural pipes (abstraction point, Figure A23c) within the groundwater mound (field of view = 50 cm).
Water 15 00540 g0a23

Appendix H.6. Modelling the Remediation of Soil Using a Groundwater Mound

There are a number of different ways the water can be abstracted from the groundwater mound. The options that have been adopted include the following:
  • Placement of an abstraction borehole, or boreholes, at appropriate locations around the margins of the groundwater mound;
  • Placement of an abstraction (infiltration) device located at the feather edge of the groundwater mound (Figure A24a). This device is designed to reorientate the flowlines within the groundwater mound towards the infiltration device. This results in the water level rising in the abstraction (infiltration) device (Figure A24b).
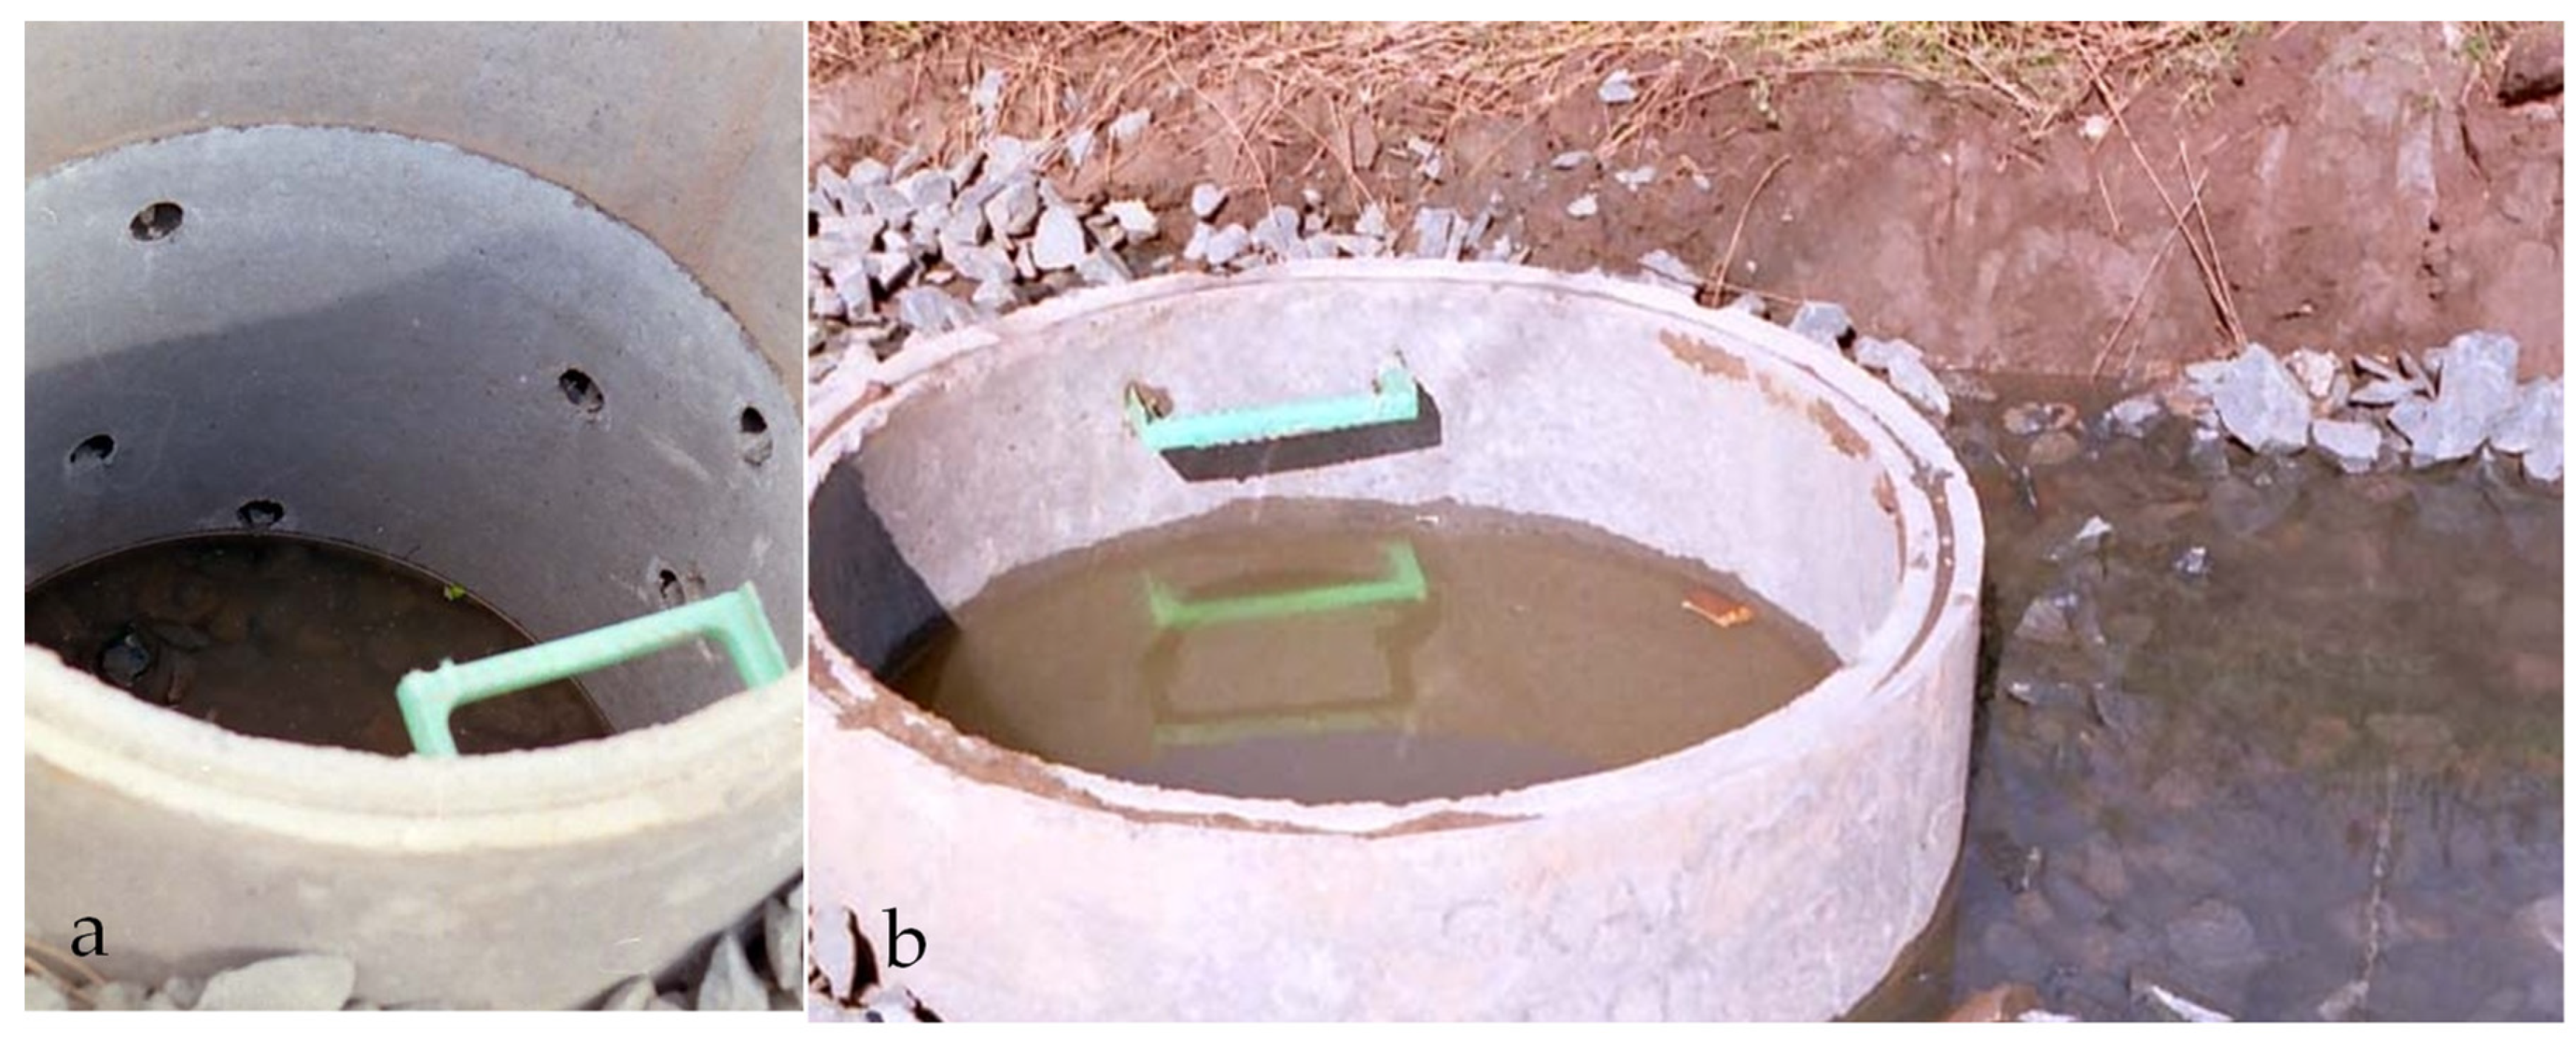
A groundwater mound, located in unconsolidated soil, will develop a network of carrier macropores and natural pipes [142]. They act as the main conduits for fluid flow and fluid dispersion within the groundwater mound. They connect to a series of interconnected micro-pores and nano-pores within the soil. This network allows the rapid dispersal of water into the mound, and a rapid recovery of water from the mound. The measured size distribution for the natural horizontal pipes associated with groundwater mounds in boulder clay is provided in Figure A25a. These pipes form during periods of recharge, with contemporary discharge from the mound.
Figure A24. Abstraction device (1.2 m OD), which was designed to access water within a shallow groundwater mound. (a), constructed device showing a perforated chamber surrounded by coarse gravel, with interception of the feather edge of the groundwater mound at its base. The water level is >1.2 m below the ground surface; (b), the same abstraction infiltration device 24 h later, showing the groundwater mound surface located 0.2 m below the ground surface.
Water 15 00540 g0a24
The placement of an abstraction device on the groundwater mound feather edge (Figure A24a) will give rise to a situation where the water level in the abstraction device is less than the water level in the recharge device (Figure A25a,b). The volume of water abstractable over a 24 h period from the abstraction device (Figure A24b) is a function of the water column height in the recharge device (Figure A25c).
The formation of natural horizontal pipes allows the abstraction device to be placed between groundwater mounds (Figure A25d). The air-filled natural pipes act as advance conduits for the infiltrating mound. When the pipes extend into, and intersect, an abstraction device, the mound is able to rapidly discharge the air contained within the pipes and replace the air with water. This process can allow a single abstraction device to obtain water from more than one groundwater mound (Figure A25e).
If abstraction from, and recharge to, the groundwater mound is operated episodically, it is possible for a fresh recharge to remobilize relict water that is contained within the soil (Figure A25f). An analysis of cumulative recharge and cumulative outflow from the groundwater mound (Figure A25g) indicates that a significant proportion of the recharge water is retained in the groundwater mound. Analysis of the cumulative retention indicates that, initially, most of the recharge water is stored in the groundwater mound. However, once the recharge volume exceeds a critical value, much of the relict water is remobilized and is available for abstraction (Figure A25h).
The performance and construction details of a groundwater mound are site specific. The example data set (Figure A25) indicates that it may be possible to abstract significant volumes from a set of groundwater mounds when a well-developed set of macro-pores/natural pipes have established within the mound. Pipe formation and enlargement tends to be associated with high levels of entrained clay/silt entering the abstraction device.
Figure A25. Example groundwater mound parameters in boulder clay, Central Scotland, UK. (a), macropore/natural pipe diameters; (b), relationship between water levels in the recharge device (green) and the abstraction device (red); (c), relationship between water levels in the recharge device, and the water volume abstracted over a 24 h period from the abstraction device; (d), example placement of an abstraction device (yellow) between two groundwater mounds. Arrows indicate water flow directions; (e), example of a groundwater mound expanding its range to accommodate the presence of an abstraction device (yellow). Arrows indicate water flow directions; (f), example of recharge volumes to a groundwater mound, and associated discharge volumes; (g), relationship between cumulative infiltration/recharge (blue) into the groundwater mound and cumulative abstraction (red) over a 15-day period; (h), relationship between cumulative inflow into a groundwater mound and cumulative outflow over a 15-day period.
Water 15 00540 g0a25
The example recharge and abstraction information, in Figure A25h, suggests that it may be possible to quickly remediate a metal polluted soil.
The pH redox constraints are as follows [92]:
  • Beryllium, Aluminum, Thorium, Uranium, Zirconium, Hafnium, Rhodium, Gallium—removable provided the groundwater mound has a pH of <3/4;
  • Magnesium—removable provided the groundwater mound has a pH of <10;
  • Cerium, Dysprosium, Holmium, Terbium, Gadolinium, Europium, Samarium, Scandium, Yttrium, Lanthanum, Praseodymium, Neodymium, Promethium, Thulium, Lutetium, Ytterbium, Erbium, Manganese, Iron, Cobalt, Nickel, Copper, Silver, Zinc, Cadmium, Indium, Lead, Bismuth—removable provided the groundwater mound has a pH of <7/8;
  • Vanadium, Molybdenum, Antimony,—removable provided the groundwater mound has a pH of >5/6;
  • Chromium, Sodium, Potassium, Lithium, Technetium, Rhenium, Thallium, Carbon, Arsenic, Phosphorous, Sulphur, Selenium, Tellurium, Fluoride, Chloride, Bromide, Iodide—no effective pH constraints.
The pH information indicates the pH interval, over which the appropriate cation is soluble. The feed water pH for the water entering the groundwater mound should be structured to maximize the solubility of the target ions within the soil.
The construction of a simple groundwater mound in contaminated clay-like soils that contain around 1000 m3 of net porosity, with a single abstraction device and a single infiltration device, could, depending on the soil composition, result in the net storage of about 250 to 320 m3 of the infiltrated water (Figure A25). An analysis of the flow rates (Figure A26a) suggests that the bulk of the recharge during the initial 180 h is retained within the mound. Thereafter, a substantial portion of the retained (relict) water is discharged from the mound (Figure A26b). This remobilized retained water will contain dissolved salts from the contaminated soil.
Figure A26. Observed operation of a groundwater mound located in boulder clay (Scotland, UK). (a), Flow rate versus time. Red = abstraction; blue = recharge; (b) rate of storage into the groundwater mound. Positive values indicate that the recharge exceeds abstraction; negative values indicate that the abstraction exceeds the recharge and that relict/retained water is being included in the abstracted water flows.
Water 15 00540 g0a26

Appendix I. Arsenic Removal

As is present in some groundwater and polluted plumes as H3-xAsO4−x ions. The World Health Organization recommend that drinking-quality water contains <0.01 mg L−1 [220]. ZVI removes As via a direct reaction to form FeAs oxyhydroxides by the redox precipitation of As0, and by the physical adsorption of As oxides and hydroxides.
ZVI changes the Eh and pH of the water adjacent to the n-Fe0 grains. This change facilitates (Figure A27a) the precipitation of As0, from H3−xAsO4−x ions. The precipitated n-As0 forms discrete particles and is also physically adsorbed on the n-Fe0 surface. Most As decontamination studies measure the H3−xAsO4−x ion concentrations in the feed and product water, but do not measure the precipitated concentrations of As0.
Example redox reactions, which result in As0 formation, include the following [92]:
H3−xAsO4−x = As0 + H3−xO4−x,
H3AsO4 + 5H+ = As0 + 4H2O,
AsO4−3 + 4H2O = As0 + 5OH +3OH,
The removal reactions are a pseudo first-order reaction, and may involve a number of ionic intermediary steps.

Appendix I.1. Unsupported n-ZVI

The observed As removal details [221], using borohydride-produced n-Fe0, are provided in Figure A27. The adsorbed As0 can be recovered (in solution) from the n-Fe0 by soaking the recovered n-Fe0 in 0.1 M of NaH2PO4 for a period of >18 h. The n-Fe0 can then either be returned to the reactor, or can be reprocessed (reduced) with NaBH4, prior to being returned to the reactor.
The maximum adsorption capacity of n-Fe0, qm, can be assessed using the adsorption theorem. The Freundlich assessment is as follows [221]:
qm = KF C1/n,
where C = amount of adsorbed As, mg L−1 solute; KF = Freundlich adsorption capacity mg g−1 n-Fe0; and n = Freundlich adsorption intensity. At 25 °C, KF = 3.5 mg g−1, and n = 3.27. The adsorption capacity decreases with an increase in the temperature.
Figure A27. Arsenic—Uncoated n-ZVI, 10–100 nm, as = 37.2 m2 g−1. (a), Redox stability fields. (b), relationship between the observed rate constant and Fe0 concentration, g L−1 (Pw) 10–100 nm, as = 37.2 m2 g−1; As ion concentration = 100 mg L−1. If the intercept is set at 0, then kobs = 0.123 Pw, R2 = 0.9793, and kobs = 0.0033 Pw as; (c), As concentrations as a function of reaction time and n-Fe0 concentration. Red = 0.5 g L−1; black = 1 g L−1; green = 5 g L−1; purple = 10 g L−1; (d), time required to remove 95% of the As, versus Pw.
Water 15 00540 g0a27
A travelling line reactor (Figure A28) processing 40 m3 h−1 and receiving 10 g of n-Fe0 L−1, in order to achieve 95% ion removal, would require a series of reactor trains (e.g., five trains, where each train contained a 20 m long, 0.2 m diameter traveling line reactor (3.2 m3 total volume) (Figure A28)). The net reaction time required to achieve 95% removal is 5 min (Figure A27).
This approach would be expected to reduce the As concentration in the hydrodynamic stationary plume, or hydrodynamic perched groundwater mound, by 95% over a period of 300–700 days (Figure A2). The design’s conceptual process flow is summarized in Figure A29.
The actual physical amount within the aquifer for As is a function of the following:
  • Leakage volumes (A) into the hydrodynamic stationary plume (Figure A1) from the surrounding aquifer;
  • The pH and Eh of the water entering and leaving the reactor (Figure A27);
  • The reduction in site availability for the adsorption of As0 on the n-Fe0 following each usage if it is not regenerated following each use.
Figure A28. Example process flow for a traveling line reactor train complex, using entrained n-Fe0, processing 40 m3 h−1.
Water 15 00540 g0a28
Figure A29. Example process flow for a hydrodynamic stationary plume located in an arsenic contaminated aquifer, remediated using n-Fe0.
Water 15 00540 g0a29

Appendix I.2. Active Carbon (AC) Supported n-ZVI (C0@n/m-Fe0)

AC-supported n-Fe0 can be created using a variety of different approaches and reductants. C0@n-Fe0 is highly porous, and tends to sequester adsorbed species within its porosity (e.g., Figure A30). The n-Fe0 particles coat the pores and impregnate the porosity of the activated carbon granules [222]. Typically, this reduces the as of the C0 from around 800 m2 g−1 to around 70 m2 g−1, and can substantially reduce the C0 open porosity by filling in pores, blocking pore throats and converting part of the open porosity to dead-end porosity [222].
Pellets of this form result in a slow As adsorption. Ion removal follows a straight-line relationship between Ct=n and time, with a distinct change in slope when the C0@n-Fe0 e particles are saturated with As0 [222].
Adsorption is assumed to follow the following reaction [222]:
H3AsO3 + Fe0 = FeO2AsOH = Fe(OH)3@As0,
The Boyd adsorption model [222] assumes that the adsorption isotherm, Yt, can be defined as follows:
Yt = (Ct=0Ct−n)/(Ct=0Ct=e),
where Ct=e = As concentration in the water when adsorption ceases; Ct=0 = Initial As concentration in the water, e.g., As = 2 mg L−1; and Ct=n = As concentration in the water at time t = n.
A graphical plot of t0.5 ([hours]0.5) versus Yt, will produce two distinct linear stages:
  • The initial stage (e.g., 0.3Yt [t0.5]−1 for t0.5 = <3) may relate to adsorption onto Fe0 or sequestration within the AC macropores.
  • The second stage (e.g., 0.01Yt [t0.5]−1 + Yt = 0.9, for t0.5 = >3) may relate to adsorption within micro-pores and meso-pores.
Figure A30. Photomicrograph of C0@n-Fe0. Reflected light, false color image. Purple = C0; blue = porosity coated in n-Fe0; yellow = adsorbed precipitated contaminant held within the porosity. Field of view = 0.1 mm.
Water 15 00540 g0a30
The commercially effective time period for As removal ends when t0.5 = 3 (9 h). This adsorbent has been demonstrated to be effective without a loss of activity over eight adsorption and desorption cycles. With this, a 100% desorption of the adsorbed As was achieved by soaking the recovered AC/Fe in 0.1 M of NaOH solution for 12 h [222].
This adsorbent has a slower ion removal rate than n-Fe0, and will require a larger set or reaction trains. For example, a reactor (Figure A26) processing 40 m3 h−1 (Ct=0 = 0.01 mg of As (H3-xAsO4−x)) and receiving 1 g of n-Fe0/AC L−1, in order to achieve 90% ion removal, would require nine traveling line reactor trains operating in parallel. Each travelling train reactor would be 35 m long (0.4 m O.D). The reactors would require 40 kg of n-Fe0/AC h−1. Each n-Fe0 charge would be expected to process 56,000 m3 before requiring replacement, with the subsequent desorption of As from the n-Fe0/AC. The reactor could probably be operated with an n-Fe0/AC inventory of 1000 to 1500 kg, over the 300–700-day processing period required (Figure A2), in order to reduce the overall ion concentration in the stationary plume to 0.0005 mg As L−1.

Appendix I.3. Biochar (BC) Supported n-ZVI (C0@n/m-Fe0)

The general manufacturing approach for BC-n-Fe0, using a borohydride, is summarised in Appendix C. The mass ratio of ZVI to BC assumes that the reduction reaction was taken to completion, and that 20 wt% of the FeCl3[6H2O] entered into the reaction environment formed Fe0. The remaining 80 wt% remained in the reaction environment as Cl ions, H2O, etc. For example, the manufacture of n-Fe-BC from the placement of 10 kg of BC and 10 kg of FeCl3[6H2O] would be expected to manufacture n-Fe-BC with a ratio of 1:5.
Adsorption is a function of the mass of Fe-BC added to the water, BC formation temperature and the Fe:BC weight ratio. Experiments [223] using 6.25 g of Fe-BC L−1, with 80 mg of As L−1 + 30 mg of Cd L−1, established that the highest adsorption rates were obtained when the Fe:BC weight ratio was [1:1]. Removal followed a two-stage process, where a fast linear removal of the contaminant (calculated as [(Ct=0Ct=n)/(weight Fe-BC)] was followed by a slower linear removal of the contaminant. The inflexion point occurs after about 1 h, and is associated with the removal of 160 mg of As + 45 mg of Cd g−1 Fe-BC.
For example, a reactor (Figure A28) processing 40 m3 h−1, receiving 10 g of n-Fe0-BC L−1 to achieve 90% ion removal, would require two reactor trains operating in parallel. Each train processes 40 m3 (for 1 h) to achieve 90% ion removal. Each 40 m3 batch of water will be processed by 400 kg of n-Fe0-BC. If the feed water contained 0.01 mg of As L−1, then each n-Fe0-BC charge would be expected to process 40 m3 h−1 for >50 years before requiring replacement, with the subsequent desorption of As from the n-Fe0-BC.

References

  1. Zhu, F.; Tan, X.; Zhao, W.; Feng, L.; He, S.; Wei, L.; Yang, L.; Wang, K.; Zhao, Q. Efficiency assessment of ZVI-based media as fillers in permeable reactive barrier for multiple heavy metal-contaminated groundwater remediation. J. Hazard. Mater. 2022, 424, 127605. [Google Scholar] [CrossRef] [PubMed]
  2. Medawela, S.; Indraratna, B.; Athuraliya, S.; Lugg, G.; Nghiem, L.D. Monitoring the performance of permeable reactive barriers constructed in acid sulfate soils. Eng. Geol. 2022, 296, 106465. [Google Scholar] [CrossRef]
  3. Thisani, S.K.; Kallon, D.V.V.; Byrne, P. Co-remediation of acid mine drainage and industrial effluent using passive permeable reactive barrier pre-treatment and active co-bioremediation. Minerals 2022, 12, 565. [Google Scholar] [CrossRef]
  4. Yang, H.; Liu, Q.; Hu, R.; Ptak, T.; Taherdangkoo, R.; Liu, Y.; Noubactep, C. Numerical case studies on long-term effectiveness of metallic iron based permeable reactive barriers: Importance of porosity heterogeneity of the barrier. J. Hydrol. 2022, 612, 128148. [Google Scholar] [CrossRef]
  5. Henderson, A.D.; Demond, A.H. Long-term performance of zero-valent iron permeable reactive barriers: A critical review. Environ. Eng. Sci. 2007, 24, 401–423. [Google Scholar] [CrossRef] [Green Version]
  6. Wilkin, R.T.; Puls, R.W.; Sewell, G.W. Long-term performance of permeable reactive barriers using zero-valent iron: Geochemical and microbiological effects. Groundwater 2003, 41, 493–503. [Google Scholar] [CrossRef]
  7. Lawrinenko, M.; Kurwadkar, S.; Wilkin, R.T. Long–term performance evaluation of zero-valent iron amended permeable reactive barriers for groundwater remediation—A mechanistic approach. Geosci. Front. 2022, 14, 101494. [Google Scholar] [CrossRef]
  8. Ahn, J.Y.; Kim, C.; Jun, S.C.; Hwang, I. Field-scale investigation of nanoscale zero-valent iron (NZVI) injection parameters for enhanced delivery of NZVI particles to groundwater. Water Res. 2021, 202, 117402. [Google Scholar] [CrossRef] [PubMed]
  9. Zhao, X.; Liu, W.; Cai, Z.; Han, B.; Qian, T.; Zhao, D. An overview of preparation and applications of stabilized zero-valent iron nanoparticles for soil and groundwater remediation. Water Res. 2016, 100, 245–266. [Google Scholar] [CrossRef] [Green Version]
  10. Galdames, A.; Ruiz-Rubio, L.; Orueta, M.; Sánchez-Arzalluz, M.; Vilas-Vilela, J.L. Zero-valent iron nanoparticles for soil and groundwater remediation. Int. J. Environ. Res. Public Health 2020, 17, 5817. [Google Scholar] [CrossRef]
  11. Su, C.; Puls, R.W.; Krug, T.A.; Watling, M.T.; O’Hara, S.K.; Quinn, J.W.; Ruiz, N.E. Travel distance and transformation of injected emulsified zerovalent iron nanoparticles in the subsurface during two and half years. Water Res. 2013, 47, 4095–4106. [Google Scholar] [CrossRef] [PubMed]
  12. Molin, J.; Valkenburg, J.; Seech, A.; Oesterreich, R.; Son, J. Long-term evaluation of an EHC injection permeable reactive barrier in a sulfate-rich, high-flow aquifer. Remediat. J. 2019, 29, 17–29. [Google Scholar] [CrossRef]
  13. Arnason, J.G.; Harkness, M.; Butler-Veytia, B. Evaluating the Subsurface Distribution of Zero-Valent Iron Using Magnetic Susceptibility. Groundw. Monit. Remediat. 2014, 34, 96–106. [Google Scholar] [CrossRef]
  14. Truex, M.J.; Vermeul, V.R.; Mendoza, D.P.; Fritz, B.G.; Mackley, R.D.; Oostrom, M.; Wietsma, T.W.; Macbeth, T.W. Injection of Zero-Valent Iron into an Unconfined Aquifer Using Shear-Thinning Fluids. Groundw. Monit. Remediat. 2011, 31, 50–58. [Google Scholar] [CrossRef]
  15. Caré, S.; Crane, R.; Calabrò, P.S.; Ghauch, A.; Temgoua, E.; Noubactep, C. Modeling the permeability loss of metallic iron water filtration systems. Clean–Soil Air Water 2013, 41, 275–282. [Google Scholar] [CrossRef] [Green Version]
  16. Santisukkasaem, U.; Das, D.B. A non-dimensional analysis of permeability loss in zero-valent iron permeable reactive barrier (PRB). Transp. Porous Media 2019, 126, 139–159. [Google Scholar] [CrossRef] [Green Version]
  17. Medawela, S.; Indraratna, B.; Rowe, R.K. The reduction in porosity of permeable reactive barriers due to bio-geochemical clogging caused by acidic groundwater flow. Can. Geotech. J. 2022. [Google Scholar] [CrossRef]
  18. Singh, R.; Chakma, S.; Birke, V. Performance of field-scale permeable reactive barriers: An overview on potentials and possible implications for in-situ groundwater remediation applications. Sci. Total Environ. 2022, 858, 158838. [Google Scholar] [CrossRef]
  19. Vogan, J.L.; Focht, R.M.; Clark, D.K.; Graham, S.L. Performance evaluation of a permeable reactive barrier for remediation of dissolved chlorinated solvents in groundwater. J. Hazard. Mater. 1999, 68, 97–108. [Google Scholar] [CrossRef] [PubMed]
  20. Noubactep, C. The suitability of metallic iron for environmental remediation. Environ. Prog. Sustain. Energy 2010, 29, 286–291. [Google Scholar] [CrossRef]
  21. Stipp, S.L.S.; Hansen, M.; Kristensen, R.; Hochella, M.F., Jr.; Bennedsen, L.; Dideriksen, K.; Balic-Zunic, T.; Leonard, D.; Mathieu, H.J. Behaviour of Fe-oxides relevant to contaminant uptake in the environment. Chem. Geol. 2002, 190, 321–337. [Google Scholar] [CrossRef]
  22. Mu, Y.; Jia, F.; Ai, Z.; Zhang, L. Iron oxide shell mediated environmental remediation properties of nano zero-valent iron. Environ. Sci. Nano 2017, 4, 27–45. [Google Scholar] [CrossRef]
  23. Krok, B.; Mohammadian, S.; Noll, H.M.; Surau, C.; Markwort, S.; Fritzsche, A.; Nachev, M.; Sures, B.; Meckenstock, R.U. Remediation of zinc-contaminated groundwater by iron oxide in situ adsorption barriers–From lab to the field. Sci. Total Environ. 2022, 807, 151066. [Google Scholar] [CrossRef] [PubMed]
  24. Jabbar, K.Q.; Barzinjy, A.A.; Hamad, S.M. Iron oxide nanoparticles: Preparation methods, functions, adsorption and coagulation/flocculation in wastewater treatment. Environ. Nanotechnol. Monit. Manag. 2022, 17, 100661. [Google Scholar] [CrossRef]
  25. Baby, R.; Hussein, M.Z.; Abdullah, A.H.; Zainal, Z. Nanomaterials for the Treatment of Heavy Metal Contaminated Water. Polymers 2022, 14, 583. [Google Scholar] [CrossRef]
  26. Singh, R.; Chakma, S.; Birke, V. Numerical modelling and performance evaluation of multi-permeable reactive barrier system for aquifer remediation susceptible to chloride contamination. Groundw. Sustain. Dev. 2020, 10, 100317. [Google Scholar] [CrossRef]
  27. Obiri-Nyarko, F.; Kwiatkowska-Malina, J.; Malina, G.; Kasela, T. Geochemical modelling for predicting the long-term performance of zeolite-PRB to treat lead contaminated groundwater. J. Contam. Hydrol. 2015, 177, 76–84. [Google Scholar] [CrossRef]
  28. Ma, L.; Zhang, C.; Liu, S.; Luo, Q.; Zhang, R.; Qian, J. Sensitivity analysis of factors influencing pollutant removal from shallow groundwater by the PRB method based on numerical simulation. Environ. Sci. Pollut. Res. 2022, 29, 82156–82168. [Google Scholar] [CrossRef]
  29. Zheng, K.; Luo, X.; Tan, Y.; Li, Z.; Wang, H.; Chen, T.; Zhao, L.; Zhan, L. Passive convergence-permeable reactive barrier (PC-PRB): An effective configuration to enhance hydraulic performance. Front. Environ. Sci. Eng. 2022, 16, 156. [Google Scholar] [CrossRef]
  30. Sarin, P.; Snoeyink, V.L.; Lytle, D.A.; Kriven, W.M. Iron corrosion scales: Model for scale growth, iron release, and colored water formation. J. Environ. Eng. Asce 2004, 130, 364–373. [Google Scholar] [CrossRef]
  31. Bottero, J.Y.; Manceau, A.; Villieras, F.; Tchoubar, D. Structure and mechanisms of formation of iron oxide hydroxide (chloride) polymers. Langmuir 1994, 10, 316–319. [Google Scholar] [CrossRef]
  32. Spiro, T.G.; Allerton, S.E.; Renner, J.; Terzis, A.; Bils, R.; Saltman, P. The Hydrolytic Polymerization of Iron(III). J. Am. Chem. Soc. 1966, 88, 2721–2726. [Google Scholar] [CrossRef]
  33. Dong, H.; Gao, B.; Yue, Q.; Sun, S.; Wang, Y.; Li, Q. Floc properties and membrane fouling of different monomer and polymer Fe coagulants in coagulation–ultrafiltration process: The role of Fe (III) species. Chem. Eng. J. 2014, 258, 442–449. [Google Scholar] [CrossRef]
  34. Chen, D.-W.; Liu, C.; Lu, J.; Mehmood, T.; Ren, Y.-Y. Enhanced phycocyanin and DON removal by the synergism of H2O2 and micro-sized ZVI: Optimization, performance, and mechanisms. Sci. Total Environ. 2020, 738, 140134. [Google Scholar] [CrossRef] [PubMed]
  35. Allerton, S.E.; Renner, J.; Colt, S.; Saltman, P. Viscosity studies on the behavior of inorganic iron polymers in aqueous solution. J. Am. Chem. Soc. 1966, 88, 3147–3148. [Google Scholar] [CrossRef]
  36. Sommer, B.A.; Margerum, D.W.; Renner, J.; Saltman, P.; Spiro, T.G. Reactivity and aging in hydroxy-iron (III) polymers, analogs of ferritin cores. Bioinorg. Chem. 1973, 2, 295–309. [Google Scholar] [CrossRef]
  37. Du, Q.; Zhang, S.; Pan, B.; Lv, L.; Zhang, W.; Zhang, Q. Effect of spatial distribution and aging of ZVI on the reactivity of resin–ZVI composites for arsenite removal. J. Mater. Sci. 2014, 49, 7073–7079. [Google Scholar] [CrossRef]
  38. Wang, Q.; Lee, S.; Choi, H. Aging study on the structure of Fe0-nanoparticles: Stabilization, characterization, and reactivity. J. Phys. Chem. C 2010, 114, 2027–2033. [Google Scholar] [CrossRef]
  39. Yang, Z.; Wang, X.L.; Li, H.; Yang, J.; Zhou, L.Y.; Liu, Y.D. Re-activation of aged-ZVI by iron-reducing bacterium Shewanella putrefaciens for enhanced reductive dechlorination of trichloroethylene. J. Chem. Technol. Biotechnol. 2017, 92, 2642–2649. [Google Scholar] [CrossRef]
  40. Li, H.; Chen, S.; Ren, L.Y.; Zhou, L.Y.; Tan, X.J.; Zhu, Y.; Belver, C.; Bedia, J.; Yang, J. Biochar mediates activation of aged nanoscale ZVI by Shewanella putrefaciens CN32 to enhance the degradation of Pentachlorophenol. Chem. Eng. J. 2019, 368, 148–156. [Google Scholar] [CrossRef]
  41. Guiguer, N. Numerical modelling of the fate of residual immiscible fluids in saturated porous media. Water Sci. Technol. 1991, 24, 261–270. [Google Scholar] [CrossRef]
  42. Corapcioglu, M.Y.; Baehr, A. Immiscible contaminant transport in soils and groundwater with an emphasis on petroleum hydrocarbons: System of differential equations vs single cell model. Water Sci. Technol. 1985, 17, 23–37. [Google Scholar] [CrossRef]
  43. Corapcioglu, M.Y.; Baehr, A.L. A compositional multiphase model for groundwater contamination by petroleum products: 1. Theoretical considerations. Water Resour. Res. 1987, 23, 91–200. [Google Scholar] [CrossRef]
  44. Ostendorf, D.W. Long term fate and transport of immiscible aviation gasoline in the subsurface environment. Water Sci. Technol. 1990, 22, 37–44. [Google Scholar] [CrossRef]
  45. Mercer, J.W.; Cohen, R.M. A review of immiscible fluids in the subsurface: Properties, models, characterization and remediation. J. Contam. Hydrol. 1990, 6, 107–163. [Google Scholar] [CrossRef]
  46. Liu, H.H.; Dane, J.H. A criterion for gravitational instability in miscible dense plumes. J. Contam. Hydrol. 1996, 23, 233–243. [Google Scholar] [CrossRef]
  47. Rossabi, J.; Jackson, D.G.; Vermeulen, H.H.; Looney, B.B. Dense non-aqueous phase liquid chlorinated contaminant detected far from the source release area in an aquifer. Commun. Earth Environ. 2022, 3, 223. [Google Scholar] [CrossRef]
  48. Castro, A.R.; Martins, G.; Salvador, A.F.; Cavaleiro, A.J. Iron Compounds in Anaerobic Degradation of Petroleum Hydrocarbons: A Review. Microorganisms 2022, 10, 2142. [Google Scholar] [CrossRef] [PubMed]
  49. Takai, S.; Shimada, T.; Takeda, S.; Koike, K. Evaluating the effectiveness of a geostatistical approach with groundwater flow modeling for three-dimensional estimation of a contaminant plume. J. Contam. Hydrol. 2022, 251, 104097. [Google Scholar] [CrossRef] [PubMed]
  50. Earnden, L.; Marangoni, A.G.; Laredo, T.; Stobbs, J.; Marshall, T.; Pensini, E. Decontamination of water co-polluted by copper, toluene and tetrahydrofuran using lauric acid. Sci. Rep. 2022, 12, 15832. [Google Scholar] [CrossRef]
  51. Badmus, G.O.; Ogungbemi, O.S.; Enuiyin, O.V.; Adeyeye, J.A.; Ogunyemi, A.T. Delineation of leachate plume migration and appraisal of heavy metals in groundwater around Emirin dumpsite, Ado-Ekiti, Nigeria. Sci. Afr. 2022, 17, e01308. [Google Scholar] [CrossRef]
  52. Shen, H.; Huang, Y.; Su, Y. Progress in the development and application of permeable reaction barriers for remediation of dissolved oil contaminants in groundwater. Water Environ. J. 2022, 36, 188–198. [Google Scholar] [CrossRef]
  53. Nugraha, G.U.; Bakti, H.; Lubis, R.F.; Nur, A.A. Seawater intrusion mapping using hydrochemical ionic ratio data: An application in northern part of Jakarta groundwater basins, Indonesia. Arab. J. Geosci. 2022, 15, 1575. [Google Scholar] [CrossRef]
  54. Manivannan, V.; Manoj, S.; RamyaPriya, R.; Elango, L. Delineation and quantification of groundwater resources affected by seawater intrusion along the east coast of India. Environ. Earth Sci. 2022, 81, 300. [Google Scholar] [CrossRef]
  55. Yang, J.-S.; Jeong, Y.-W.; Agossou, A.; Sohn, J.-S.; Lee, J.-B. GALDIT Modification for Seasonal Seawater Intrusion Mapping Using Multi Criteria Decision Making Methods. Water 2022, 14, 2258. [Google Scholar] [CrossRef]
  56. Selvakumar, S.; Chandrasekar, N.; Srinivas, Y.; Selvam, S.; Kaliraj, S.; Magesh, N.S.; Venkatramanan, S. Hydrogeochemical processes controlling the groundwater salinity in the coastal aquifers of Southern Tamil Nadu, India. Mar. Pollut. Bull. 2022, 174, 113264. [Google Scholar] [CrossRef]
  57. Askri, B.; Ahmed, A.T.; Bouhlila, R. Origins and processes of groundwater salinisation in Barka coastal aquifer, Sultanate of Oman. Phys. Chem. Earth Parts A/B/C 2022, 126, 103116. [Google Scholar] [CrossRef]
  58. Sarkar, A.; Paul, B.; Darbha, G.K. The groundwater arsenic contamination in the Bengal Basin-A review in brief. Chemosphere 2022, 299, 134369. [Google Scholar] [CrossRef]
  59. Raju, N.J. Arsenic in the geo-environment: A review of sources, geochemical processes, toxicity and removal technologies. Environ. Res. 2022, 203, 111782. [Google Scholar] [CrossRef]
  60. Haskell, D.; Heo, J.; Park, J.; Dong, C. Hydrogeochemical Evaluation of Groundwater Quality Parameters for Ogallala Aquifer in the Southern High Plains Region, USA. Int. J. Environ. Res. Public Health 2022, 19, 8453. [Google Scholar] [CrossRef]
  61. Hao, L.; Zhang, S.; Luo, K. Content of Selenium and Other Elements, Water Quality, Health Risks and Utilization Prospect in Natural Water of Southern Qinling-Daba Mountains, Southern Shaanxi, China. Expo. Health 2022, 14, 29–47. [Google Scholar] [CrossRef]
  62. Lashari, A.A.; Kazi, T.G.; Baig, J.A.; Afridi, H.I.; Memon, A.A. Speciation of the Selenium in Groundwater Samples of Different Aquifers from Coal Mining Fields: Applied a Green Analytical Technique. Water Air Soil Pollut. 2022, 233, 1–11. [Google Scholar] [CrossRef]
  63. Ma, X.; Yang, Z.; Yu, T.; Guan, D.X. Probability of cultivating Se-rich maize in Se-poor farmland based on intensive field sampling and artificial neural network modelling. Chemosphere 2022, 309, 136690. [Google Scholar] [CrossRef]
  64. Usman, M.; Jellali, S.; Anastopoulos, I.; Charabi, Y.; Hameed, B.H.; Hanna, K. Fenton oxidation for soil remediation: A critical review of observations in historically contaminated soils. J. Hazard. Mater. 2022, 424, 127670. [Google Scholar] [CrossRef] [PubMed]
  65. Lin, H.; Wang, Z.; Liu, C.; Dong, Y. Technologies for removing heavy metal from contaminated soils on farmland: A review. Chemosphere 2022, 305, 135457. [Google Scholar] [CrossRef] [PubMed]
  66. Rajendran, S.; Priya, T.A.K.; Khoo, K.S.; Hoang, T.K.; Ng, H.S.; Munawaroh, H.S.H.; Karaman, C.; Orooji, Y.; Show, P.L. A critical review on various remediation approaches for heavy metal contaminants removal from contaminated soils. Chemosphere 2022, 287, 132369. [Google Scholar] [CrossRef] [PubMed]
  67. Kim, S.H.; Woo, H.; An, S.; Chung, J.; Lee, S.; Lee, S. What determines the efficacy of landfarming for petroleum-contaminated soils: Significance of contaminant characteristics. Chemosphere 2022, 290, 133392. [Google Scholar] [CrossRef]
  68. Dahlberg, E.C. Applied Hydrodynamics in Petroleum Exploration; Springer: New York, NY, USA, 1982. [Google Scholar]
  69. Kulatilake, P.H. Probabilistic potentiometric surface mapping. J. Geotech. Eng. 1989, 115, 1569–1587. [Google Scholar] [CrossRef]
  70. Gunawardhana, L.N.; Al-Harthi, F.; Sana, A.; Baawain, M.S. Analytical and numerical analysis of constant-rate pumping test data considering aquifer boundary effect. Environ. Earth Sci. 2021, 80, 543. [Google Scholar] [CrossRef]
  71. Momm, H.G.; Bingner, R.L.; Moore, K.; Herring, G. Integrated surface and groundwater modeling to enhance water resource sustainability in agricultural watersheds. Agric. Water Manag. 2022, 269, 107692. [Google Scholar] [CrossRef]
  72. Alhama, I.; García-Ros, G.; Icardi, M. Non-Stationary Contaminant Plumes in the Advective-Diffusive Regime. Mathematics 2021, 9, 725. [Google Scholar] [CrossRef]
  73. Fuentes, C.; Chávez, C.; Quevedo, A.; Trejo-Alonso, J.; Fuentes, S. Modeling of Artificial Groundwater Recharge by Wells: A Model Stratified Porous Medium. Mathematics 2020, 8, 1764. [Google Scholar] [CrossRef]
  74. Currie, D.; Laattoe, T.; Walker, G.; Woods, J.; Smith, T.; Bushaway, K. Modelling Groundwater Returns to Streams from Irrigation Areas with Perched Water Tables. Water 2020, 12, 956. [Google Scholar] [CrossRef] [Green Version]
  75. Fan, X.; Xu, H.; Jin, G.; Lv, Y.; Wu, S.; Wu, T. Regional differences in influence of intermediate cover permeability on perched leachate in landfill. Urban Clim. 2022, 42, 101094. [Google Scholar] [CrossRef]
  76. Lu, P.; Sheng, Z.; Zhang, Z.; Miller, G.; Reinert, S.; Huang, M. Effect of multilayered groundwater mounds on water dynamics beneath a recharge basin: Numerical simulation and assessment of surface injection. Hydrol. Process. 2021, 35, e14193. [Google Scholar] [CrossRef]
  77. Polat, C. Gaussian formulation based correlation for Dietz shape factor. Upstream Oil Gas Technol. 2021, 7, 100059. [Google Scholar] [CrossRef]
  78. Dake, L.P. Fundamentals of Reservoir Engineering; Elsevier: Amsterdam, The Netherlands, 1998; p. 443. [Google Scholar]
  79. Johansen, T.E.; Cao, J. A new theory for flow computations in a large class of anisotropic media with applications to well productivity modeling. J. Pet. Sci. Eng. 2022, 208, 109366. [Google Scholar] [CrossRef]
  80. Kulkarni, N.H. Numerical simulation of groundwater recharge from an injection well. Int. J. Water Resour. Environ. Eng. 2015, 7, 75–83. [Google Scholar]
  81. Allow, K.A. The use of injection wells and a subsurface barrier in the prevention of seawater intrusion: A modelling approach. Arab. J. Geosci. 2012, 5, 1151–1161. [Google Scholar] [CrossRef]
  82. Zheng, S.; Sharma, M. Coupling a Geomechanical Reservoir and Fracturing Simulator with a Wellbore Model for Horizontal Injection Wells. Int. J. Multiscale Comput. Eng. 2022, 20, 23–55. [Google Scholar] [CrossRef]
  83. Khomine, A.; János, S.; Balázs, K. Potential solutions in prevention of saltwater intrusion: A modelling approach. In Advances in the Research of Aquatic Environment; Springer: Berlin/Heidelberg, Germany, 2011; Volume 1, pp. 251–257. [Google Scholar] [CrossRef]
  84. Luyun, R., Jr.; Momii, K.; Nakagawa, K. Effects of recharge wells and flow barriers on seawater intrusion. Groundwater 2011, 49, 239–249. [Google Scholar] [CrossRef]
  85. Sriapai, T.; Walsri, C.; Phueakphum, D.; Fuenkajorn, K. Physical model simulations of seawater intrusion in unconfined aquifer. Songklanakarin J. Sci. Technol. 2012, 34, 679–687. [Google Scholar]
  86. Zhou, L.; Li, Z.; Yi, Y.; Tsang, E.P.; Fang, Z. Increasing the electron selectivity of nanoscale zero-valent iron in environmental remediation: A review. J. Hazard. Mater. 2022, 421, 126709. [Google Scholar] [CrossRef] [PubMed]
  87. Liang, W.; Wang, G.; Peng, C.; Tan, J.; Wan, J.; Sun, P.; Li, Q.; Ji, X.; Zhang, Q.; Wu, Y.; et al. Recent advances of carbon-based nano zero valent iron for heavy metals remediation in soil and water: A critical review. J. Hazard. Mater. 2022, 426, 127993. [Google Scholar] [CrossRef] [PubMed]
  88. Tang, H.; Wang, J.; Zhang, S.; Pang, H.; Wang, X.; Chen, Z.; Li, M.; Song, G.; Qiu, M.; Yu, S. Recent advances in nanoscale zero-valent iron-based materials: Characteristics, environmental remediation and challenges. J. Clean. Prod. 2021, 319, 128641. [Google Scholar] [CrossRef]
  89. Li, Q.; Chen, Z.; Wang, H.; Yang, H.; Wen, T.; Wang, S.; Hu, B.; Wang, X. Removal of organic compounds by nanoscale zero-valent iron and its composites. Sci. Total Environ. 2021, 792, 148546. [Google Scholar] [CrossRef] [PubMed]
  90. Cao, V.; Bakari, O.; Kenmogne-Tchidjo, J.F.; Gatcha-Bandjun, N.; Ndé-Tchoupé, A.I.; Gwenzi, W.; Njau, K.N.; Noubactep, C. Conceptualizing the Fe0/H2O System: A Call for Collaboration to Mark the 30th Anniversary of the Fe0-Based Permeable Reactive Barrier Technology. Water 2022, 14, 3120. [Google Scholar] [CrossRef]
  91. Antia, D.D.J. Remediation of Saline Wastewater Producing a Fuel Gas Containing Alkanes and Hydrogen Using Zero Valent Iron (Fe0). Water 2022, 14, 1926. [Google Scholar] [CrossRef]
  92. Pourbaix, M. Atlas of Electrochemical Equilibria in Aqueous Solutions, 2nd ed.; Library of Congress Catalog Card No. 65-11670; Franklin, J.A., Translator; NACE International: Houston, TX, USA, 1974; p. 644. [Google Scholar]
  93. Ebbing, D.D.; Gammon, S.D. General Chemistry, 8th ed.; Houghton Mifflin Company: New York, NY, USA, 2005; ISBN 0618399429. [Google Scholar]
  94. Dehgani, Z.; Ghaedi, M.; Sabzehmeidani, M.M.; Adhami, E. Removal of paraquat from aqueous solutions by a bentonite modified zero-valent iron adsorbent. New J. Chem. 2020, 44, 13368–13376. [Google Scholar] [CrossRef]
  95. Zhao, X.; Dou, X.; Mohan, D.; Pittman, C.U., Jr.; Ok, Y.S.; Jin, X. Antimonate and antimonite adsorption by a polyvinyl alcohol-stabilized granular adsorbent containing nanoscale zero-valent iron. Chem. Eng. J. 2014, 247, 250–257. [Google Scholar] [CrossRef]
  96. Xing, M.; Wang, J. Nanoscaled zero valent iron/graphene composite as an efficient adsorbent for Co (II) removal from aqueous solution. J. Colloid Interface Sci. 2016, 474, 119–128. [Google Scholar] [CrossRef] [PubMed]
  97. Awang, N.A.; Wan Salleh, W.N.; Aziz, F.; Yusof, N.; Ismail, A.F. A review on preparation, surface enhancement and adsorption mechanism of biochar-supported nano zero-valent iron adsorbent for hazardous heavy metals. J. Chem. Technol. Biotechnol. 2022, 98, 22–44. [Google Scholar] [CrossRef]
  98. Yin, L.; Liu, L.; Lin, S.; Owens, G.; Chen, Z. Synthesis and characterization of Nanoscale Zero-Valent Iron (nZVI) as an adsorbent for the simultaneous removal of As (III) and As (V) from groundwater. J. Water Process Eng. 2022, 47, 102677. [Google Scholar] [CrossRef]
  99. Ainiwaer, M.; Zeng, X.; Yin, X.; Wen, J.; Su, S.; Wang, Y.; Zhang, Y.; Zhang, T.; Zhang, N. Thermodynamics, Kinetics, and Mechanisms of the Co-Removal of Arsenate and Arsenite by Sepiolite-Supported Nanoscale Zero-Valent Iron in Aqueous Solution. Int. J. Environ. Res. Public Health 2022, 19, 11401. [Google Scholar] [CrossRef] [PubMed]
  100. Sun, Y.P.; Li, X.Q.; Cao, J.; Zhang, W.X.; Wang, H.P. Characterization of zero-valent iron nanoparticles. Adv. Colloid Interface Sci. 2006, 120, 47–56. [Google Scholar] [CrossRef]
  101. Antia, D.D.J. Water Treatment and Desalination Using the Eco-materials n-Fe0 (ZVI), n-Fe3O4, n-FexOyHz[mH2O], and n-Fex[Cation]nOyHz[Anion]m [rH2O]. In Handbook of Nanomaterials and Nanocomposites for Energy and Environmental Applications, 1st ed.; Kharissova, O.V., Torres-Martínez, L.M., Kharisov, B.I., Eds.; Springer: Berlin/Heidelberg, Germany, 2021; pp. 3159–3242. [Google Scholar] [CrossRef]
  102. Antia, D.D.J. Provision of Desalinated Irrigation Water by the Desalination of Groundwater Abstracted from a Saline Aquifer. Hydrology 2022, 9, 128. [Google Scholar] [CrossRef]
  103. Antia, D.D.J. Catalytic Partial Desalination of Saline Water. Water 2022, 14, 2893. [Google Scholar] [CrossRef]
  104. Varghese, P.; Varma, A. Catalytic reactions in transport-line reactors. Chem. Eng. Sci. 1979, 34, 337–343. [Google Scholar] [CrossRef]
  105. Carberry, J.J. Chemical and Catalytic Reaction Engineering; Dover Publications, Inc.: New York, NY, USA, 2001. [Google Scholar]
  106. Twigg, M.V. Catalyst Handbook; Wolfe Publishing, Ltd.: London, UK, 1989. [Google Scholar]
  107. Wang, X.; Ren, L.; Long, T.; Geng, C.; Tian, X. Migration and remediation of organic liquid pollutants in porous soils and sedimentary rocks: A review. Environ. Chem. Lett. 2022, 20, 1–18. [Google Scholar] [CrossRef]
  108. Vu, K.A.; Mulligan, C.N. Utilization of a biosurfactant foam/nanoparticle mixture for treatment of oil pollutants in soil. Environ. Sci. Pollut. Res. 2022, 29, 88618–88629. [Google Scholar] [CrossRef]
  109. Ang, C.C.; Abdul, A.S. Aqueous surfactant washing of residual oil contamination from sandy soil. Groundw. Monit. Remediat. 1991, 11, 121–127. [Google Scholar] [CrossRef]
  110. Lamont, K.; Marangoni, A.G.; Pensini, E. Emulsion locks’ for the containment of hydrocarbons during surfactant flushing. J. Environ. Sci. 2020, 90, 98–109. [Google Scholar] [CrossRef] [PubMed]
  111. Harwell, J.H.; Sabatini, D.A.; Knox, R.C. Surfactants for ground water remediation. Colloids Surf. A Physicochem. Eng. Asp. 1999, 151, 255–268. [Google Scholar] [CrossRef]
  112. Amanat, N.; Barbati, B.; Rossi, M.M.; Bellagamba, M.; Buccolini, M.; Galantini, L.; Petrangeli Papini, M. Synthetic and Natural Surfactants for Potential Application in Mobilization of Organic Contaminants: Characterization and Batch Study. Water 2022, 14, 1182. [Google Scholar] [CrossRef]
  113. Drzewicz, P.; Perez-Estrada, L.; Alpatova, A.; Martin, J.W.; Gamal El-Din, M. Impact of peroxydisulfate in the presence of zero valent iron on the oxidation of cyclohexanoic acid and naphthenic acids from oil sands process-affected water. Environ. Sci. Technol. 2012, 46, 8984–8991. [Google Scholar] [CrossRef]
  114. Pourrezaei, P.; Alpatova, A.; Khosravi, K.; Drzewicz, P.; Chen, Y.; Chelme-Ayala, P.; El-Din, M.G. Removal of organic compounds and trace metals from oil sands process-affected water using zero valent iron enhanced by petroleum coke. J. Environ. Manag. 2014, 139, 50–58. [Google Scholar] [CrossRef]
  115. Nasehi, S.A.; Uromeihy, A.; Nikudel, M.R.; Morsali, A. Use of nanoscale zero-valent iron and nanoscale hydrated lime to improve geotechnical properties of gas oil contaminated clay: A comparative study. Environ. Earth Sci. 2016, 75, 1–20. [Google Scholar] [CrossRef]
  116. Mu, S.; Chen, X.; Luo, Y.; Zhang, J. Degradation of petroleum hydrocarbons in oil-based drilling cuttings by a zero-valent iron Fenton-like advanced oxidation system. Process. Saf. Environ. Prot. 2022, 168, 883–891. [Google Scholar] [CrossRef]
  117. Zhang, M.; Zhang, L.; Tian, S.; Zhu, S.; Chen, Z.; Si, H. The effect of zero-valent iron/Fe3+ coupling and reuse on the properties of anoxic sludge. J. Clean. Prod. 2022, 344, 131031. [Google Scholar] [CrossRef]
  118. Haneef, T.; Ul Mustafa, M.R.; Rasool, K.; Ho, Y.C.; Mohamed Kutty, S.R. Removal of polycyclic aromatic hydrocarbons in a heterogeneous Fenton like oxidation system using nanoscale zero-valent iron as a catalyst. Water 2020, 12, 2430. [Google Scholar] [CrossRef]
  119. Peng, Z.; Xiong, C.; Wang, W.; Tan, F.; Wang, X.; Qiao, X.; Wong, P.K. Hydrophobic modification of nanoscale zero-valent iron with excellent stability and floatability for efficient removal of floating oil on water. Chemosphere 2018, 201, 110–118. [Google Scholar] [CrossRef]
  120. Antia, D.D.J. Desalination of irrigation water using metal polymers. Water 2022, 14, 3224. [Google Scholar] [CrossRef]
  121. Antia, D.D.J. Partial Desalination of Saline Groundwater, Including Flowback Water, to Produce Irrigation Water. Hydrology 2022, 9, 219. [Google Scholar] [CrossRef]
  122. Antia, D.D.J. Purification of Saline Water Using Desalination Pellets. Water 2022, 14, 2639. [Google Scholar] [CrossRef]
  123. Rotz, R.; Milewski, A.; Rasmussen, T.C. Transient Evolution of Inland Freshwater Lenses: Comparison of Numerical and Physical Experiments. Water 2020, 12, 1154. [Google Scholar] [CrossRef] [Green Version]
  124. Jazayeri, A.; Werner, A.D.; Wu, H.; Lu, C. Effects of River Partial Penetration on the Occurrence of Riparian Freshwater Lenses: Experimental Investigation. Water Resour. Res. 2021, 57, e2021WR029728. [Google Scholar] [CrossRef]
  125. Kacimov, A.R.; Obnosov, Y.V. Analytic solutions for fresh groundwater lenses floating on saline water under desert dunes: The Kunin-Van Der Veer legacy revisited. J. Hydrol. 2019, 574, 733–743. [Google Scholar] [CrossRef]
  126. Anneser, B.; Einsiedl, F.; Meckenstock, R.U.; Richters, L.; Wisotzky, F.; Griebler, C. High-resolution monitoring of biogeochemical gradients in a tar oil-contaminated aquifer. Appl. Geochem. 2008, 23, 1715–1730. [Google Scholar] [CrossRef]
  127. Gutierrez-Neri, M.; Ham, P.A.S.; Schotting, R.J.; Lerner, D.N. Analytical modelling of fringe and core biodegradation in groundwater plumes. J. Contam. Hydrol. 2009, 107, 1–9. [Google Scholar] [CrossRef] [PubMed]
  128. Quinn, J.; Geiger, C.; Clausen, C.; Brooks, K.; Coon, C.; O'Hara, S.; Krug, T.; Major, D.; Yoon, W.S.; Gavaskar, A.; et al. Field demonstration of DNAPL dehalogenation using emulsified zero-valent iron. Environ. Sci. Technol. 2005, 39, 1309–1318. [Google Scholar] [CrossRef] [PubMed]
  129. Bajagain Jeong, S.W. Degradation of petroleum hydrocarbons in soil via advanced oxidation process using peroxymonosulfate activated by nanoscale zero-valent iron. Chemosphere 2021, 270, 128627. [Google Scholar] [CrossRef] [PubMed]
  130. Song, Y.; Fang, G.; Zhu, C.; Zhu, F.; Wu, S.; Chen, N.; Wu, T.; Wang, Y.; Gao, J.; Zhou, D. Zero-valent iron activated persulfate remediation of polycyclic aromatic hydrocarbon-contaminated soils: An in situ pilot-scale study. Chem. Eng. J. 2019, 355, 65–75. [Google Scholar] [CrossRef]
  131. El Sharawy, M.S.; Gaafar, G.R. Impacts of petrophysical properties of sandstone reservoirs on their irreducible water saturation: Implication and prediction. J. Afr. Earth Sci. 2019, 156, 118–132. [Google Scholar] [CrossRef]
  132. Behrenbruch, P.; Yuan, C.; Truong, N.B.; Do Huu, P.; Hoang, T. Defining irreducible water saturation using global characteristics envelopes and novel correlations. APPEA J. 2016, 56, 1–10. [Google Scholar] [CrossRef]
  133. Stalheim, S.O.; Eidesmo, T.; Rueslåtten, H. Influence of wettability on water saturation Taktak, F.; Rigane, A.; Boufares, T.; Kharbachi, S.; Bouaziz, S. Modelling approaches for the estimation of irreducible water saturation and heterogeneities of the commercial Ashtart reservoir from the Gulf of Gabès, Tunisia. J. Pet. Sci. Eng. 2011, 78, 376–383. [Google Scholar]
  134. Shen, J.; Qin, Y.; Wang, G.X.; Fu, X.; Wei, C.; Lei, B. Relative permeabilities of gas and water for different rank coals. Int. J. Coal Geol. 2011, 86, 266–275. [Google Scholar] [CrossRef]
  135. Sun, C.; McClure, J.E.; Mostaghimi, P.; Herring, A.L.; Shabaninejad, M.; Berg, S.; Armstrong, R.T. Linking continuum-scale state of wetting to pore-scale contact angles in porous media. J. Colloid Interface Sci. 2020, 561, 173–180. [Google Scholar] [CrossRef] [Green Version]
  136. Moridis, G.J.; Reddell, D.L. Secondary water recovery by air injection: 3. Evaluation of feasibility. Water Resour. Res. 1991, 27, 2369–2379. [Google Scholar] [CrossRef]
  137. Stalheim, S.O.; Eidesmo, T.; Rueslåtten, H. Influence of wettability on water saturation modelling. J. Pet. Sci. Eng. 1999, 24, 243–253. [Google Scholar] [CrossRef]
  138. Chen, M.; Al-Maktoumi, A.; Al-Mamari, H.; Izady, A.; Nikoo, M.R.; Al-Busaidi, H. Oxygenation of aquifers with fluctuating water table: A laboratory and modeling study. J. Hydrol. 2020, 590, 125261. [Google Scholar] [CrossRef]
  139. Dembicki, H., Jr.; Anderson, M.J. Secondary migration of oil: Experiments supporting efficient movement of separate, buoyant oil phase along limited conduits. AAPG Bull. 1989, 73, 1018–1021. [Google Scholar]
  140. Yahyaoui, S.; Akkal, R.; Khodja, M.; Ahmed Zaid, T. On the Water-Oil Relative Permeabilities of Southern Algerian Sandstone Rock Samples. Energies 2022, 15, 5687. [Google Scholar] [CrossRef]
  141. Masoomi, R.; Torabi, F. A new computational approach to predict hot-water flooding (HWF) performance in unconsolidated heavy oil reservoirs. Fuel 2022, 312, 122861. [Google Scholar] [CrossRef]
  142. Antia, D.D.J. Formation and Control of Self-Sealing High Permeability Groundwater Mounds in Impermeable Sediment: Implications for SUDS and Sustainable Pressure Mound Management. Sustainability 2009, 1, 855–923. [Google Scholar] [CrossRef] [Green Version]
  143. Gui, M.-W.; Alebachew, A.A. Responses of Laterally Loaded Single Piles Subjected to Various Loading Rates in a Poroelastic Soil. Appl. Sci. 2022, 12, 617. [Google Scholar] [CrossRef]
  144. Vgenopoulou, I.; Beskos, D.E. Dynamic poroelastic soil column and borehole problem analysis. Soil Dyn. Earthq. Eng. 1992, 11, 335–345. [Google Scholar] [CrossRef]
  145. Coppola, A.; Gerke, H.H.; Comegna, A.; Basile, A.; Comegna, V. Dual-permeability model for flow in shrinking soil with dominant horizontal deformation. Water Resour. Res. 2012, 48, 11376. [Google Scholar] [CrossRef]
  146. Lu, M.M.; Xie, K.H.; Guo, B. Consolidation theory for a composite foundation considering radial and vertical flows within the column and the variation of soil permeability within the disturbed soil zone. Can. Geotech. J. 2010, 47, 207–217. [Google Scholar] [CrossRef]
  147. Wilkinson, W.B.; Shipley, E.L. Vertical and horizontal laboratory permeability measurements in clay soils. Dev. Soil Sci. 1972, 2, 285–298. [Google Scholar]
  148. Phillips, J.; Clausen, B.; Dumesic, J.A. Iron pentacarbonyl decomposition over grafoil. Production of small metallic iron particles. J. Phys. Chem. 1980, 84, 1814–1822. [Google Scholar] [CrossRef]
  149. Santos, J.; Phillips, J.; Dumesic, J.A. Metal-support interactions between iron and titania for catalysts prepared by thermal decomposition of iron pentacarbonyl and by impregnation. J. Catal. 1983, 81, 147–167. [Google Scholar] [CrossRef]
  150. Maruyama, T.; Shinyashiki, Y. Iron–iron oxide composite thin films prepared by chemical vapor deposition from iron pentacarbonyl. Thin Solid Film. 1998, 333, 203–206. [Google Scholar] [CrossRef]
  151. Pour, A.N.; Housaindokht, M.R.; Tayyari, S.F.; Zarkesh, J. Fischer-Tropsch synthesis by nano-structured iron catalyst. J. Nat. Gas Chem. 2010, 19, 284–292. [Google Scholar] [CrossRef]
  152. Amonette, J.E.; Szecsody, J.E.; Schaef, H.T.; Gorby, Y.A.; Fruchter, J.S.; Templeton, J.C. Abiotic Reduction of Aquifer Materials by Dithionite: A Promising In-Situ Remediation Technology; (No. PNL-SA--24505); Pacific Northwest Lab.: Richland, WA, USA, 1994. [Google Scholar]
  153. Sun, Q.; Feitz, A.J.; Guan, J.; Waite, T.D. Comparison of the reactivity of nanosized zero-valent iron (nZVI) particles produced by borohydride and dithionite reduction of iron salts. Nano 2008, 3, 341–349. [Google Scholar] [CrossRef]
  154. Ma, X.; He, D.; Jones, A.M.; Collins, R.N.; Waite, T.D. Reductive reactivity of borohydride-and dithionite-synthesized iron-based nanoparticles: A comparative study. J. Hazard. Mater. 2016, 303, 101–110. [Google Scholar] [CrossRef]
  155. Xiaomin, N.; Xiaobo, S.; Huagui, Z.; Dongen, Z.; Dandan, Y.; Qingbiao, Z. Studies on the one-step preparation of iron nanoparticles in solution. J. Cryst. Growth 2005, 275, 548–553. [Google Scholar] [CrossRef]
  156. Runge, F.F. Ueber einige Produkte der Steinkohlendestillation. Ann. Der Phys. Und Chem. 1834, 107, 65–78. [Google Scholar] [CrossRef] [Green Version]
  157. Edwards, M.; Benjamin, M.M. Regeneration and reuse of iron hydroxide adsorbents in treatment of metal-bearing wastes. J. Water Pollut. Control Fed. 1989, 61, 481–490. [Google Scholar]
  158. Chen, A.S.; Sorg, T.J.; Wang, L. Regeneration of iron-based adsorptive media used for removing arsenic from groundwater. Water Res. 2015, 77, 85–97. [Google Scholar] [CrossRef]
  159. Lang, Y.; Yu, Y.; Zou, H.; Ye, J.; Zhang, S. Performance and Mechanisms of Sulfidated Nanoscale Zero-Valent Iron Materials for Toxic TCE Removal from the Groundwater. Int. J. Environ. Res. Public Health 2022, 19, 6299. [Google Scholar] [CrossRef]
  160. Xiao, M.; Hu, R.; Ndé-Tchoupé, A.I.; Gwenzi, W.; Noubactep, C. Metallic Iron for Water Remediation: Plenty of Room for Collaboration and Convergence to Advance the Science. Water 2022, 14, 1492. [Google Scholar] [CrossRef]
  161. Curcio, G.M.; Limonti, C.; Siciliano, A.; Kabdaşlı, I. Nitrate Removal by Zero-Valent Metals: A Comprehensive Review. Sustainability 2022, 14, 4500. [Google Scholar] [CrossRef]
  162. Ullah, S.; Faiz, P.; Leng, S. Synthesis, Mechanism, and Performance Assessment of Zero-Valent Iron for Metal-Contaminated Water Remediation: A Review. Clean–Soil Air Water 2020, 48, 2000080. [Google Scholar] [CrossRef]
  163. Sun, J.; Tian, A.; Feng, Z.; Zhang, Y.; Jiang, F.; Tang, Q. Evaluation of Zero-Valent Iron for Pb(II) Contaminated Soil Remediation: From the Analysis of Experimental Mechanism Hybird with Carbon Emission Assessment. Sustainability 2021, 13, 452. [Google Scholar] [CrossRef]
  164. Hu, R.; Yang, H.; Tao, R.; Cui, X.; Xiao, M.; Amoah, B.K.; Cao, V.; Lufingo, M.; Soppa-Sangue, N.P.; Ndé-Tchoupé, A.I.; et al. Metallic Iron for Environmental Remediation: Starting an Overdue Progress in Knowledge. Water 2020, 12, 641. [Google Scholar] [CrossRef] [Green Version]
  165. Antia, D.D.J. Sustainable Zero-Valent Metal (ZVM) Water Treatment Associated with Diffusion, Infiltration, Abstraction, and Recirculation. Sustainability 2010, 2, 2988–3073. [Google Scholar] [CrossRef] [Green Version]
  166. Antia, D.D.J. Groundwater water remediation by static diffusion using nano-zero valent metals [ZVM](Fe0, Cu0, Al0), n-FeHn+, n-Fe(OH)x, n-FeOOH, n-Fe-[OxHy](n+/−). In Nanomaterials for Environmental Protection, 1st ed.; Kharisov, B.I., Kharissova, O.V., Dias, H.V.R., Eds.; Wiley Inc.: Hoboken, NJ, USA, 2014; Chapter 1; pp. 3–25. [Google Scholar]
  167. Xu, Z.; Wan, Z.; Sun, Y.; Gao, B.; Hou, D.; Cao, X.; Komárek, M.; Ok, Y.S.; Tsang, D.C. Electroactive Fe-biochar for redox-related remediation of arsenic and chromium: Distinct redox nature with varying iron/carbon speciation. J. Hazard. Mater. 2022, 430, 128479. [Google Scholar] [CrossRef] [PubMed]
  168. Pasinszki, T.; Krebsz, M. Synthesis and Application of Zero-Valent Iron Nanoparticles in Water Treatment, Environmental Remediation, Catalysis, and Their Biological Effects. Nanomaterials 2020, 10, 917. [Google Scholar] [CrossRef]
  169. Antia, D.D.J. ZVI (Fe0) desalination: Catalytic partial desalination of saline aquifers. Appl. Water Sci. 2018, 8, 71. [Google Scholar] [CrossRef] [Green Version]
  170. Lee, J.E.; Park, Y.-K. Applications of Modified Biochar-Based Materials for the Removal of Environment Pollutants: A Mini Review. Sustainability 2020, 12, 6112. [Google Scholar] [CrossRef]
  171. Antia, D.D.J. Modification of Aquifer Pore-Water by Static Diffusion Using Nano-Zero-Valent Metals. Water 2011, 3, 79–112. [Google Scholar] [CrossRef] [Green Version]
  172. Gong, L.; Qi, J.; Lv, N.; Qiu, X.; Gu, Y.; Zhao, J.; He, F. Mechanistic role of nitrate anion in TCE dechlorination by ball milled ZVI and sulfidated ZVI: Experimental investigation and theoretical analysis. J. Hazard. Mater. 2021, 403, 123844. [Google Scholar] [CrossRef] [PubMed]
  173. Noubactep, C. Metallic iron for the removal of metals and metalloids from aqueous solutions: An old-timer view. Curr. Opin. Environ. Sci. Health 2021, 22, 100256. [Google Scholar] [CrossRef]
  174. Liu, X.; Wu, M.; Zhao, J. Removal of Trichloroethylene from Water by Bimetallic Ni/Fe Nanoparticles. Water 2022, 14, 1616. [Google Scholar] [CrossRef]
  175. Wei, J.; Qian, Y.; Liu, W.; Wang, L.; Ge, Y.; Zhang, J.; Yu, J.; Ma, X. Effects of particle composition and environmental parameters on catalytic hydrodechlorination of trichloroethylene by nanoscale bimetallic Ni-Fe. J. Environ. Sci. 2014, 26, 1162–1170. [Google Scholar] [CrossRef] [PubMed]
  176. Divakar, D.; Romero-Sáez, M.; Pereda-Ayo, B.; Aranzabal, A.; González-Marcos, J.A.; González-Velasco, J.R. Catalytic oxidation of trichloroethylene over Fe-zeolites. Catal. Today 2011, 176, 357–360. [Google Scholar] [CrossRef]
  177. Liu, J.; Peng, C.; Shi, X. Preparation, characterization, and applications of Fe-based catalysts in advanced oxidation processes for organics removal: A review. Environ. Pollut. 2022, 293, 118565. [Google Scholar] [CrossRef]
  178. Ma, H.; Ai, J.; Lu, C.; Hansen, H.C.B. Element doping of biochars enhances catalysis of trichloroethylene dechlorination. Chem. Eng. J. 2022, 428, 132496. [Google Scholar] [CrossRef]
  179. Christiansen, B.C.; Balic-Zunic, T.; Petit, P.O.; Frandsen, C.; Mørup, S.; Geckeis, H.; Katerinopoulou, A.; Stipp, S.S. Composition and structure of an iron-bearing, layered double hydroxide (LDH)–Green rust sodium sulphate. Geochim. Cosmochim. Acta 2009, 73, 3579–3592. [Google Scholar] [CrossRef]
  180. Platte, T.; Finck, N.; Mangold, S.; Polly, R.; Geckeis, H. Retention of Iodide and Chloride by Formation of a Green Rust Solid Solution GR-Cl1–x I x: A Multiscale Approach. Inorg. Chem. 2021, 60, 10585–10595. [Google Scholar] [CrossRef]
  181. Al Mamun, A.; Onoguchi, A.; Granata, G.; Tokoro, C. Role of pH in green rust preparation and chromate removal from water. Appl. Clay Sci. 2018, 165, 205–213. [Google Scholar] [CrossRef]
  182. Perez, J.P.H.; Schiefler, A.A.; Rubio, S.N.; Reischer, M.; Overheu, N.D.; Benning, L.G.; Tobler, D.J. Arsenic removal from natural 2110 groundwater using ‘green rust’: Solid phase stability and contaminant fate. J. Hazard. Mater. 2021, 401, 123327. [Google Scholar] [CrossRef] [PubMed]
  183. Andrei, F.; Sappa, G.; Boni, M.R.; Mancini, G.; Viotti, P. Mobility of nZVI in a Reconstructed Porous Media Monitored by an Image Analysis Procedure. Water 2021, 13, 2797. [Google Scholar] [CrossRef]
  184. Hubbert, M.K. Entrapment of petroleum under hydrodynamic conditions. AAPG Bull. 1953, 37, 1954–2026. [Google Scholar]
  185. Schowalter, T.T. Mechanics of secondary hydrocarbon migration and entrapment. AAPG Bull. 1979, 63, 723–760. [Google Scholar]
  186. Schowalter, T.T.; Hess, P.D. Interpretation of subsurface hydrocarbon shows. AAPG Bull. 1982, 66, 1302–1327. [Google Scholar]
  187. Valderrama, M. Secondary migration of heavy oil in low dip basins. AAPG Bull. 2022, 106, 1923–1937. [Google Scholar] [CrossRef]
  188. Nguindjel, A.D.C.; de Visser, P.J.; Winkens, M.; Korevaar, P.A. Spatial programming of self-organizing chemical systems using sustained physicochemical gradients from reaction, diffusion and hydrodynamics. Phys. Chem. Chem. Phys. 2022, 24, 23980–24001. [Google Scholar] [CrossRef] [PubMed]
  189. Raychoudhury, T. Transport behaviour of different metal-based nanoparticles through natural sediment in the presence of humic acid and under the groundwater condition. J. Earth Syst. Sci. 2020, 129, 1–12. [Google Scholar]
  190. Dibyanshu, K.; Chhaya, T.; Raychoudhury, T. A review on the fate and transport behavior of engineered nanoparticles: Possibility of becoming an emerging contaminant in the groundwater. Int. J. Environ. Sci. Technol. 2022, 1–24. [Google Scholar] [CrossRef]
  191. Antia, D.D.J. Irrigation water desalination using PVP (polyvinylpyrrolidone) coated n-Fe0 (ZVI, zero valent iron). In New Polymer Nanocomposites for Environmental Remediation; Hussain, C.M., Mishra, A., Eds.; Elsevier: Amsterdam, The Netherlands, 2018; pp. 541–600. [Google Scholar]
  192. He, H.; Wu, T.; Chen, Y.F.; Yang, Z. A pore-scale investigation of microplastics migration and deposition during unsaturated flow in porous media. Sci. Total Environ. 2023, 858, 159934. [Google Scholar] [CrossRef]
  193. Viotti, P.; Sappa, G.; Tatti, F.; Andrei, F. nZVI Mobility and Transport: Laboratory Test and Numerical Model. Hydrology 2022, 9, 196. [Google Scholar] [CrossRef]
  194. Mondal, A.; Dubey, B.K.; Arora, M.; Mumford, K. Porous media transport of iron nanoparticles for site remediation application: A review of lab scale column study, transport modelling and field-scale application. J. Hazard. Mater. 2021, 403, 123443. [Google Scholar] [CrossRef] [PubMed]
  195. Bianco, C.; Tosco, T.; Sethi, R. A 3-dimensional micro- and nanoparticle transport and filtration model (MNM3D) applied to the migration of carbon-based nanomaterials in porous media. J. Contam. Hydrol. 2016, 193, 10–20. [Google Scholar] [CrossRef] [Green Version]
  196. Ma, C.; Huangfu, X.; He, Q.; Ma, J.; Huang, R. Deposition of engineered nanoparticles (ENPs) on surfaces in aquatic systems: A review of interaction forces, experimental approaches, and influencing factors. Environ. Sci. Pollut. Res. 2018, 25, 33056–33081. [Google Scholar] [CrossRef]
  197. Elimelech, M.; O’Melia, C.R. Effect of Particle Size on Collision Efficiency in the Deposition of Brownian Particles with Electrostatic Energy Barriers. Langmuir 1990, 6, 1153–1163. [Google Scholar] [CrossRef]
  198. Yang, H.; Hu, R.; Ruppert, H.; Noubactep, C. Modeling porosity loss in Fe0-based permeable reactive barriers with Faraday’s law. Sci. Rep. 2021, 11, 16998. [Google Scholar] [CrossRef]
  199. Bilardi, S.; Calabrò, P.S.; Moraci, N. Reactive and Hydraulic Behavior of Granular Mixtures Composed of Zero Valent Iron. Water 2022, 14, 3613. [Google Scholar] [CrossRef]
  200. Domga, R.; Togue-Kamga, F.; Noubactep, C.; Tchatchueng, J.B. Discussing porosity loss of Fe0 packed water filters at ground level. Chem. Eng. J. 2015, 263, 127–134. [Google Scholar] [CrossRef]
  201. Moraci, N.; Lelo, D.; Bilardi, S.; Calabrò, P.S. Modelling long-term hydraulic conductivity behaviour of zero valent iron column tests for permeable reactive barrier design. Can. Geotech. J. 2016, 53, 946–961. [Google Scholar] [CrossRef]
  202. Moraci, N.; Bilardi, S.; Calabrò, P.S. Critical aspects related to Fe0 and Fe0/pumice PRB design. Environ. Geotech. 2016, 3, 114–124. [Google Scholar] [CrossRef]
  203. Bilardi, S.; Calabrò, P.S.; Moraci, N. A Review of the Hydraulic Performance of Permeable Reactive Barriers Based on Granular Zero Valent Iron. Water 2023, 15, 200. [Google Scholar] [CrossRef]
  204. Yang, H.; Hu, R.; Ndé-Tchoupé, A.I.; Gwenzi, W.; Ruppert, H.; Noubactep, C. Designing the next generation of Fe0-based filters for decentralized safe drinking water treatment. Processes 2020, 8, 745. [Google Scholar] [CrossRef]
  205. Zhou, Z.; Liu, P.; Wang, S.; Finfrock, Y.Z.; Ye, Z.; Feng, Y.; Li, X. Iron-modified biochar-based bilayer permeable reactive barrier for Cr (VI) removal. J. Hazard. Mater. 2022, 439, 129636. [Google Scholar] [CrossRef]
  206. Plessl, K.; Russ, A.; Vollprecht, D. Application and development of zero-valent iron (ZVI) for groundwater and wastewater treatment. Int. J. Environ. Sci. Technol. 2022, 1–16. [Google Scholar] [CrossRef]
  207. Njaramba, L.K.; Park, J.B.; Lee, C.S.; Nzioka, A.M.; Kim, Y.J. Permeable reactive barriers with zero-valent iron and pumice for remediation of groundwater contaminated with multiple heavy metals. Environ. Eng. Sci. 2021, 38, 245–255. [Google Scholar] [CrossRef]
  208. Bilardi, S.; Calabrò, P.S.; Moraci, N.; Madaffari, M.G.; Ranjbar, E. A comparison between Fe0/pumice and Fe0/lapillus mixtures in permeable reactive barriers. Environ. Geotech. 2019, 7, 524–539. [Google Scholar] [CrossRef]
  209. Calabrò, P.S.; Bilardi, S.; Moraci, N. Advancements in the use of filtration materials for the removal of heavy metals from multicontaminated solutions. Curr. Opin. Environ. Sci. Health 2021, 20, 100241. [Google Scholar] [CrossRef]
  210. Peng, L.; Zhang, C.; Ma, H.; Pan, H. Estimating irreducible water saturation and permeability of sandstones from nuclear magnetic resonance measurements by fractal analysis. Mar. Pet. Geol. 2019, 110, 565–574. [Google Scholar] [CrossRef]
  211. Adebayo, T.A. Irreducible water saturation and porosity mathematical models for Kwale sands. Pet. Coal 2015, 57, 412–423. [Google Scholar]
  212. Castellan, G.W. Physical Chemistry, 3rd ed.; Adison Wesley: Reading, MA, USA, 1983. [Google Scholar]
  213. Ataie-Ashtiani, B.; Hassanizadeh, S.M.; Celia, M.A. Effects of heterogeneities on capillary pressure–saturation–relative permeability relationships. J. Contam. Hydrol. 2002, 56, 175–192. [Google Scholar] [CrossRef] [PubMed]
  214. Mufti, S.; Das, A. An advanced pore-scale model for simulating water retention characteristics in granular soils. J. Hydrol. 2022, 615, 128561. [Google Scholar] [CrossRef]
  215. Bai, X.; Jia, X.; Zhao, C. Prediction of the van Genuchten model soil hydraulic parameters for the 5-m soil profile in China’s Loess Plateau. Catena 2022, 210, 105889. [Google Scholar] [CrossRef]
  216. Honda, H.; Magara, K. Estimation of irreducible water saturation and effective pore size of mudstones. J. Pet. Geol. 1982, 4, 407–418. [Google Scholar] [CrossRef]
  217. Kacimov, A.R. Dynamics of groundwater mounds: Analytical solutions and integral characteristics. Hydrol. Sci. J. 1997, 42, 329–342. [Google Scholar] [CrossRef]
  218. Khan, M.Y.; Kirkham, D.; Handy, R.L. Shapes of steady state perched groundwater mounds. Water Resour. Res. 1976, 12, 429–436. [Google Scholar] [CrossRef]
  219. Youngs, E.G. An examination of computed steady-state water-table heights in unconfined aquifers: Dupuit-Forchheimer estimates and exact analytical results. J. Hydrol. 1990, 119, 201–214. [Google Scholar] [CrossRef]
  220. World Health Organization. Guidelines for Drinking-Water Quality: Incorporating the First and Second Addenda, 4th ed.; WHO: Geneva, Switzerland, 2022. [Google Scholar]
  221. Kanel, S.R.; Manning, B.; Charlet, L.; Choi, H. Removal of arsenic (III) from groundwater by nanoscale zero-valent iron. Environ. Sci. Technol. 2005, 39, 1291–1298. [Google Scholar] [CrossRef]
  222. Zhu, H.; Jia, Y.; Wu, X.; Wang, H. Removal of arsenic from water by supported nano zero-valent iron on activated carbon. J. Hazard. Mater. 2009, 172, 1591–1596. [Google Scholar] [CrossRef]
  223. Yang, D.; Wang, L.; Li, Z.; Tang, X.; He, M.; Yang, S.; Liu, X.; Xu, J. Simultaneous adsorption of Cd (II) and As (III) by a novel biochar-supported nanoscale zero-valent iron in aqueous systems. Sci. Total Environ. 2020, 708, 134823. [Google Scholar] [CrossRef]
Figure 1. Corrosion structure of Fe0. The corrosion products are commonly called rust or scale. Red = Fe0; Blue = water; Porous zone = Green + yellow + brown zones: Green = Fe2+ products (Fe(OH)2, Fe(OH)+, FeCO3; Yellow = Green rust products ([Fe2+]n[Fe3+]m(OH)y; ([Fe2+]n[Fe3+]m(OH)y)z+/−); Brown = Fe3+ mononuclear hydroxyl polymers (Fe(a) products (Fe3+; Fe(OH)3; Fe(OH)2+; Fe(OH)2+; Fe(OH)4 (Fe2(OH)24+; Fe3(OH)45+; FeOOH; Fe3O4); Laminate shell = Orange stripe = hydroxyl species: Fe3O4, FeOOH, Fe2O3, Fe(b) polynuclear polymers (e.g., Fe(OH)24+; Fe(O2H6)3+; Fe3(OH)45+; Fe5(OH)96+); Oxyhydroxide surface = Green diagonal stripe = Fe(c) larger colloidal polymers (Fe(OH)x; FeOOH); For a specific water body pH, the Eh present on the particle and in the particle porosity varies. At a water = pH 8, for fresh Fe0, the Eh at the water:Fe0 is −0.5198 V. The Eh of the water body is >−0.5198 V. In the corroded Fe0 at pH 8, the Eh values are as follows: red:green boundary = −0.5198 V; yellow:brown boundary = −0.207 V; The Eh of the water body is >−0.207 V. The pH of the red:green boundary will be 1 to 4 units lower than the average pH within the water body. This will reduce the Eh at this point by a further −0.05 to −0.24 V.
Water 15 00540 g001
Figure 2. Examples of iron bacteria. (a), Complex iron bacteria and colonial filaments with a well-developed iron exoskeleton. Field of view = 0.31 mm; (b), Simple rod-like, colonial, filamented, iron bacteria growing in n-Fe0. Field of view = 0.168 mm. Iron bacteria species are normally identified using DNA/RNA analyses. The filaments become high-permeability hollow (Fe(OH)3/FeOOH) tubes when the bacterium dies.
Water 15 00540 g002
Figure 3. Process flow diagram showing the key elements associated with producing a decontaminated hydrodynamic stationary plume within an aquifer, or a decontaminated hydrodynamic perched stationary groundwater mound in soil.
Water 15 00540 g003
Figure 4. ZVI remediation flow chart, used to create a design remediation for a hydrodynamic stationary plume or a perched hydrodynamic groundwater mound. Fe(b) = iron oxyhydroxide polymers.
Water 15 00540 g004
Figure 5. n-Fe0 (50 nm) in saline water, illustrating the initial entrained n-Fe0:Fe(a,b,c) sphere formation (within 1 h), and their subsequent growth and mineralization encasing the ions removed from the water body. Field of view of the grey insert photograph is 5.7 microns.
Water 15 00540 g005
Figure 6. n-Fe(b)@Ca@Mn polymer (0.2 g Fe L−1). Feed water (seawater): Cl = 26.55 g L−1; Na+ = 17.21 g L−1; pH = 8.31; Eh = 0.372 V; PSE = 0.0447 V; Product water = Cl = 9.64 g L−1; Na+ = 2.50 g L−1; pH = 12.54; Eh = −0.098 V; PSE = −0.0078 V; Desalination period: 241 h. Temperature: 278 to 283 K. (a), Hydrated n-Fe(b) agglomerate in the product water with dendrites radiating from the agglomerate, Field of view = 0.096 mm; (b), Hydrated n-Fe(b) agglomerate dendrite in the product water, Field of view = 0.066 mm. (c), Hydrated dendrite, enlarged from Figure 6b showing cellular nature of the dendrite where it is constructed from agglomerated collections of pseudo-spheres. Field of view = 0.015 mm. (d), Dried n-Fe(b) agglomerate dendrite, showing cellular structure containing precipitated sequestered minerals (NaCl), Field of view = 0.03 mm.
Water 15 00540 g006
Figure 7. Idealized stationary hydrodynamic mound, or plume. Red circle = abstraction well. This represents a locus of minimum, or negative, potential; Green = infiltration/injection well. These represent loci of maximum positive potential. Green background: Potentiometric surface in the aquifer; Blue circle = zone where the potentiometric surface values decrease from the infiltration loci, to the lower level in the surrounding aquifer; Yellow circle = zone where the potentiometric surface values decrease from the infiltration loci, to the lower level in the abstraction well. Arrows indicate water flow directions. Purple circle area = equilibrium zone, where the potential in the aquifer = the potential on the outer margins of the hydrodynamic mound (i.e., a zone, where fluid flow is stagnant).
Water 15 00540 g007
Figure 8. Contaminant concentration in a 100,000 m3 stationary plume, with abstraction of 960 m3 d−1. (a), The expected contaminant concentration if 960 m3 d−1 is reinjected into the plume; (b), Expected contaminant concentration if 960 m3 d−1 is reinjected into the plume to maintain its structure; and when the salinity is between 1 g L−1 and 2.5 g L−1, 960 m3 d−1 is abstracted for anthropogenic use.
Water 15 00540 g008
Disclaimer/Publisher’s Note: The statements, opinions and data contained in all publications are solely those of the individual author(s) and contributor(s) and not of MDPI and/or the editor(s). MDPI and/or the editor(s) disclaim responsibility for any injury to people or property resulting from any ideas, methods, instructions or products referred to in the content.