Influence of Water Treatment Technology on the Stability of Tap Water
Abstract
:1. Introduction
2. Materials and Methods
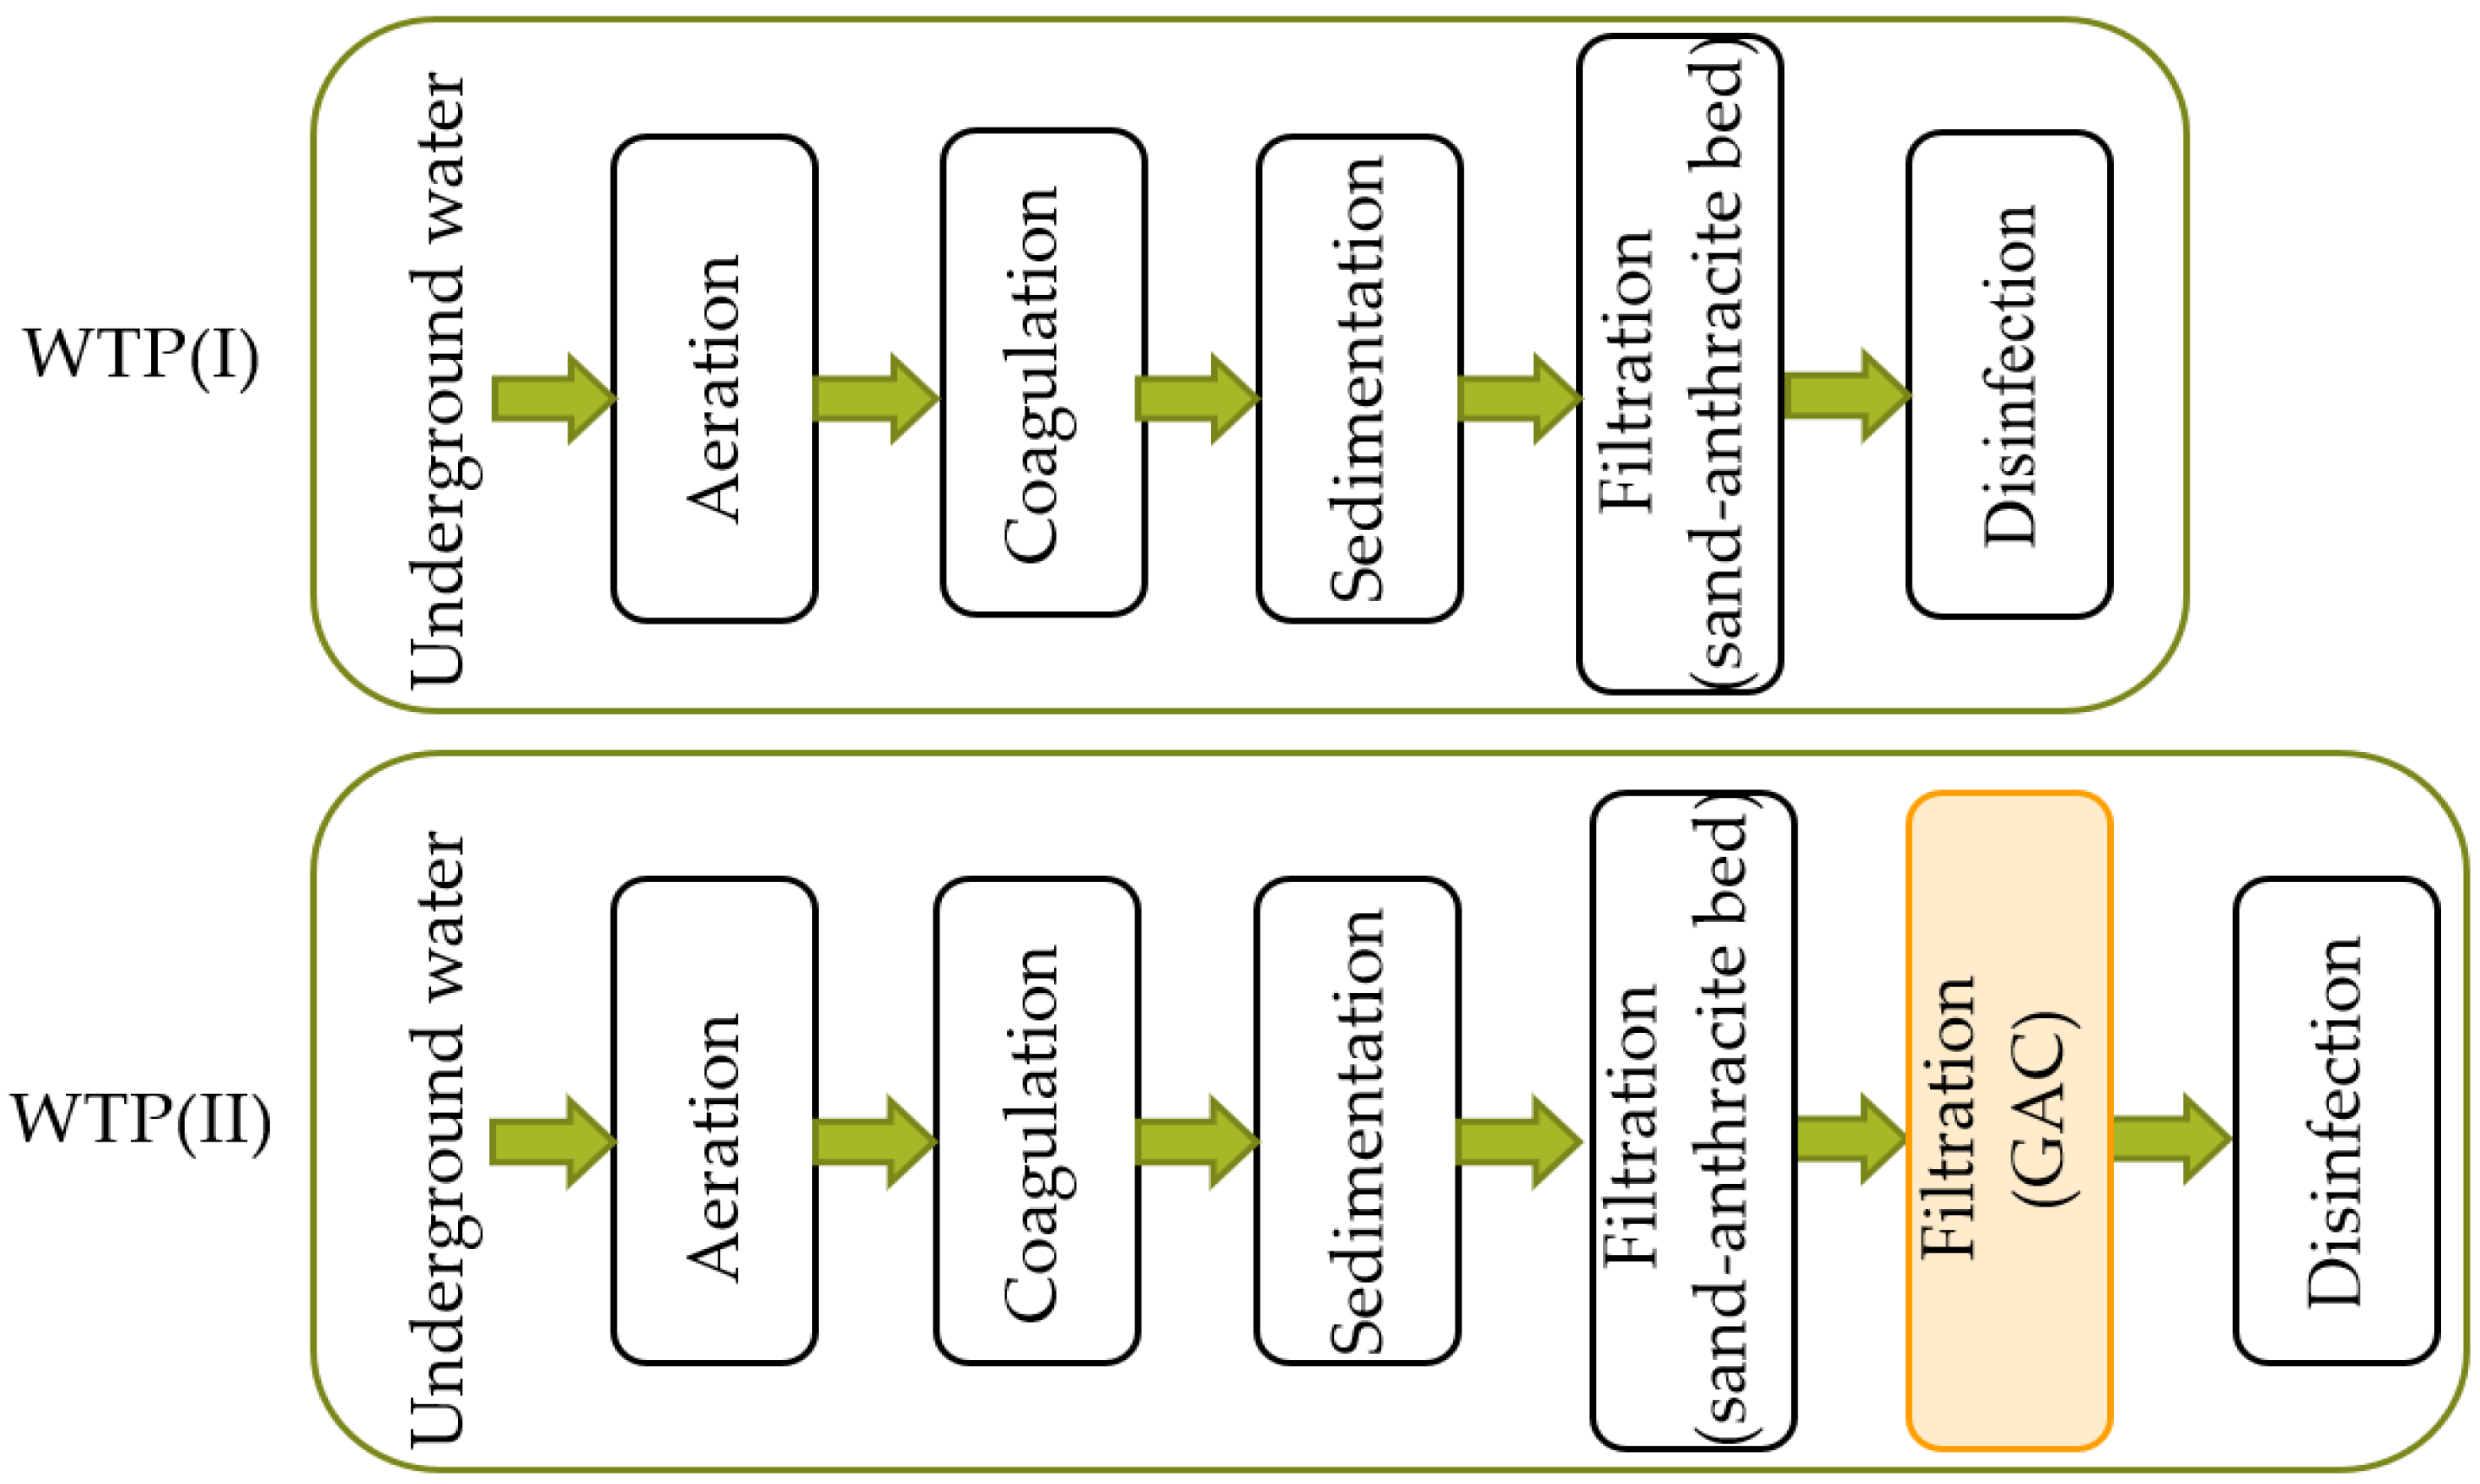
2.1. Characteristics of the Research Object
2.2. Determination of Stability of the Treated Water
2.3. Method of Estimating the Risk of Instability of Tap Water
- E(Ci|Ci ≥ Cgr)—the expected value of losses Ci greater the limit losses Cgr,
- Pi—the probability of losses Ci,
- S1—BDOC content indicator [g C/m3],
- S2—Ninorg content indicator [g N/m3],
- S3—PO43− content indicator [g PO43−/m3].
- PS—the probability of not exceeding the limit values S1, S2, S3,
- PSi—the probability of not exceeding the limit values S1, S2, S3 in a given water sample,
- PP—the probability of exceeding the limit values S1, S2, S3,
- PPi—the probability of exceeding the limit values S1, S2, S3 in a given water sample.
- I1—criterion corresponding to the value determined for the Langelier index,
- I2—criterion corresponding to the value determined for the Ryznar index,
- I3—criterion corresponding to the value determined for the Strohecker index.
2.4. Assessment of the Impact of Treatment Technology on the Formation of Biofilm on the Installation Material
3. Results
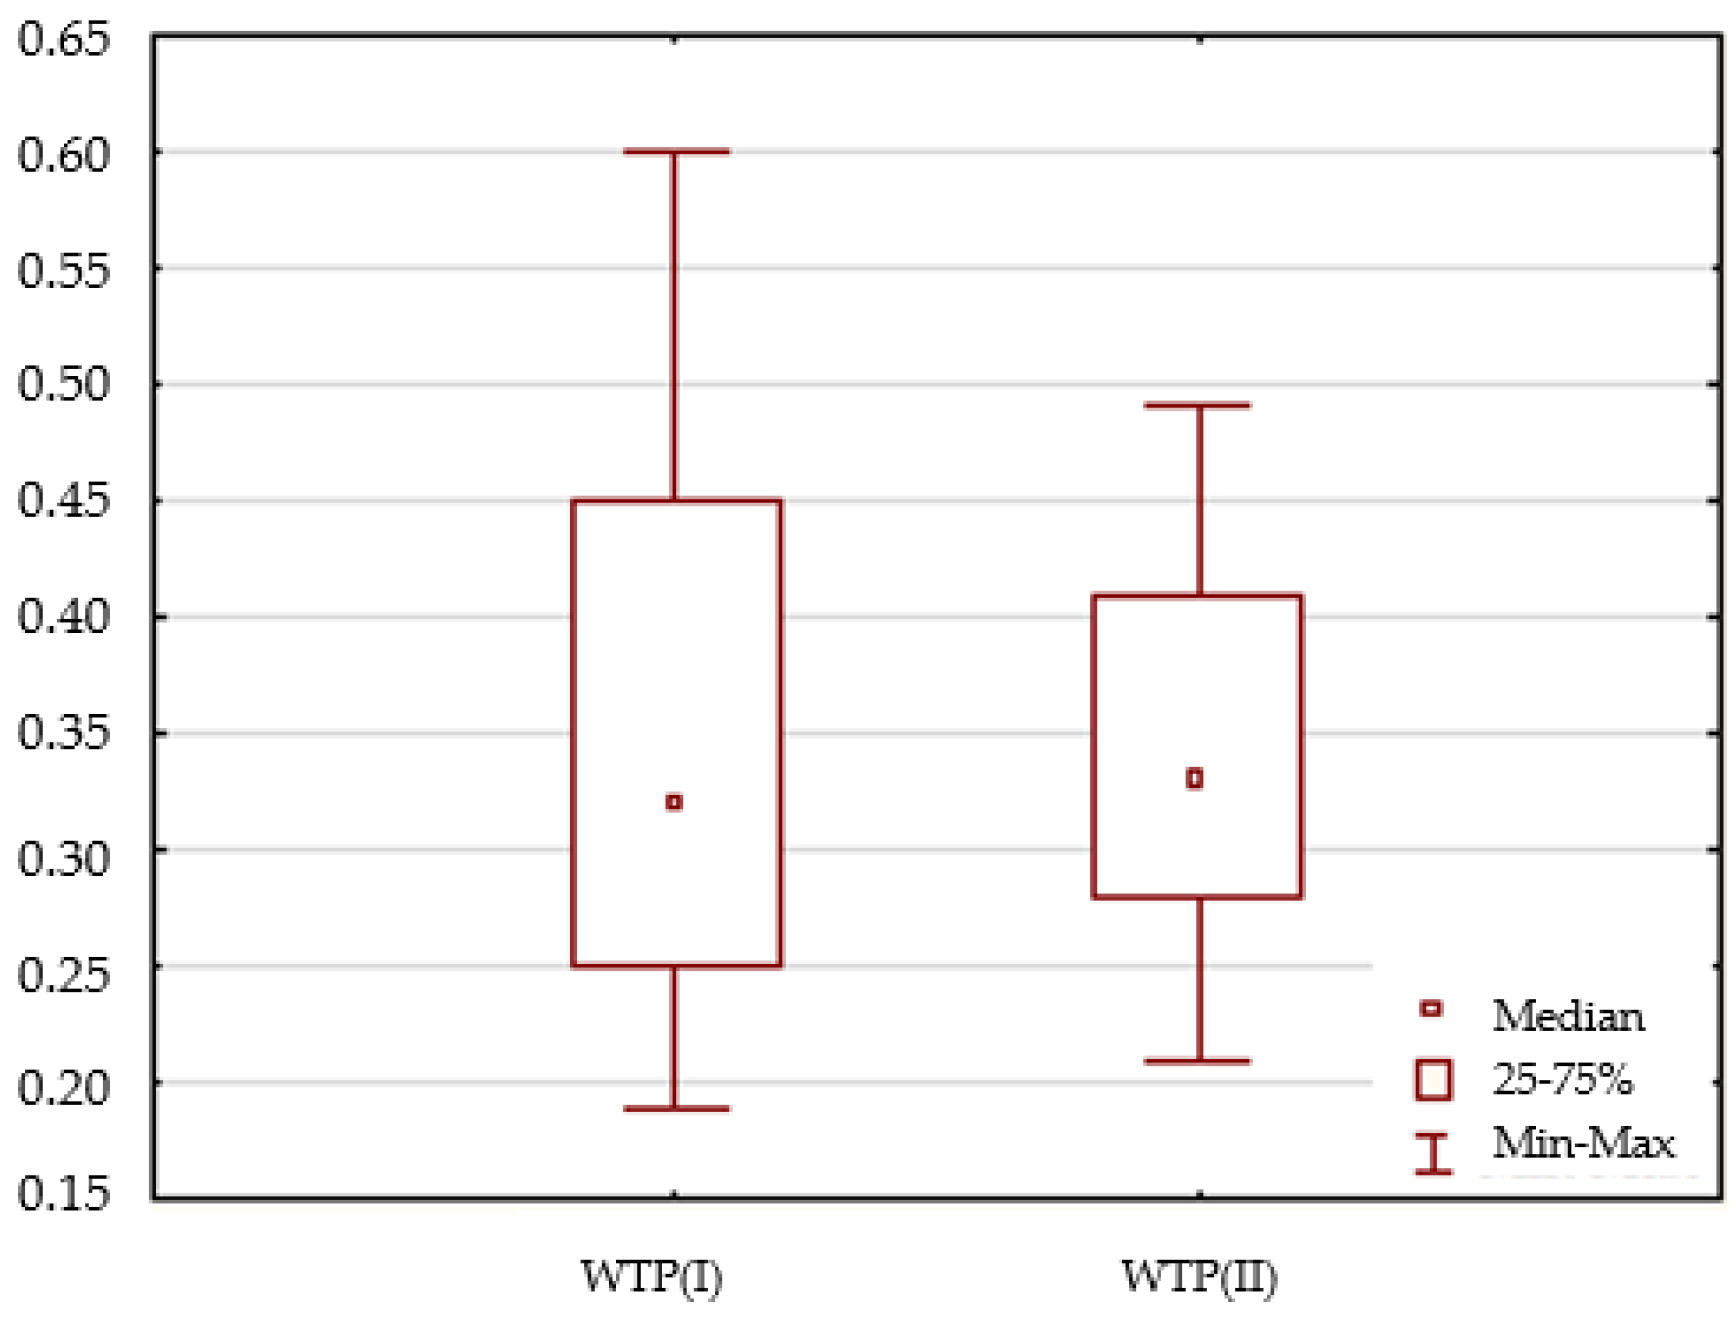
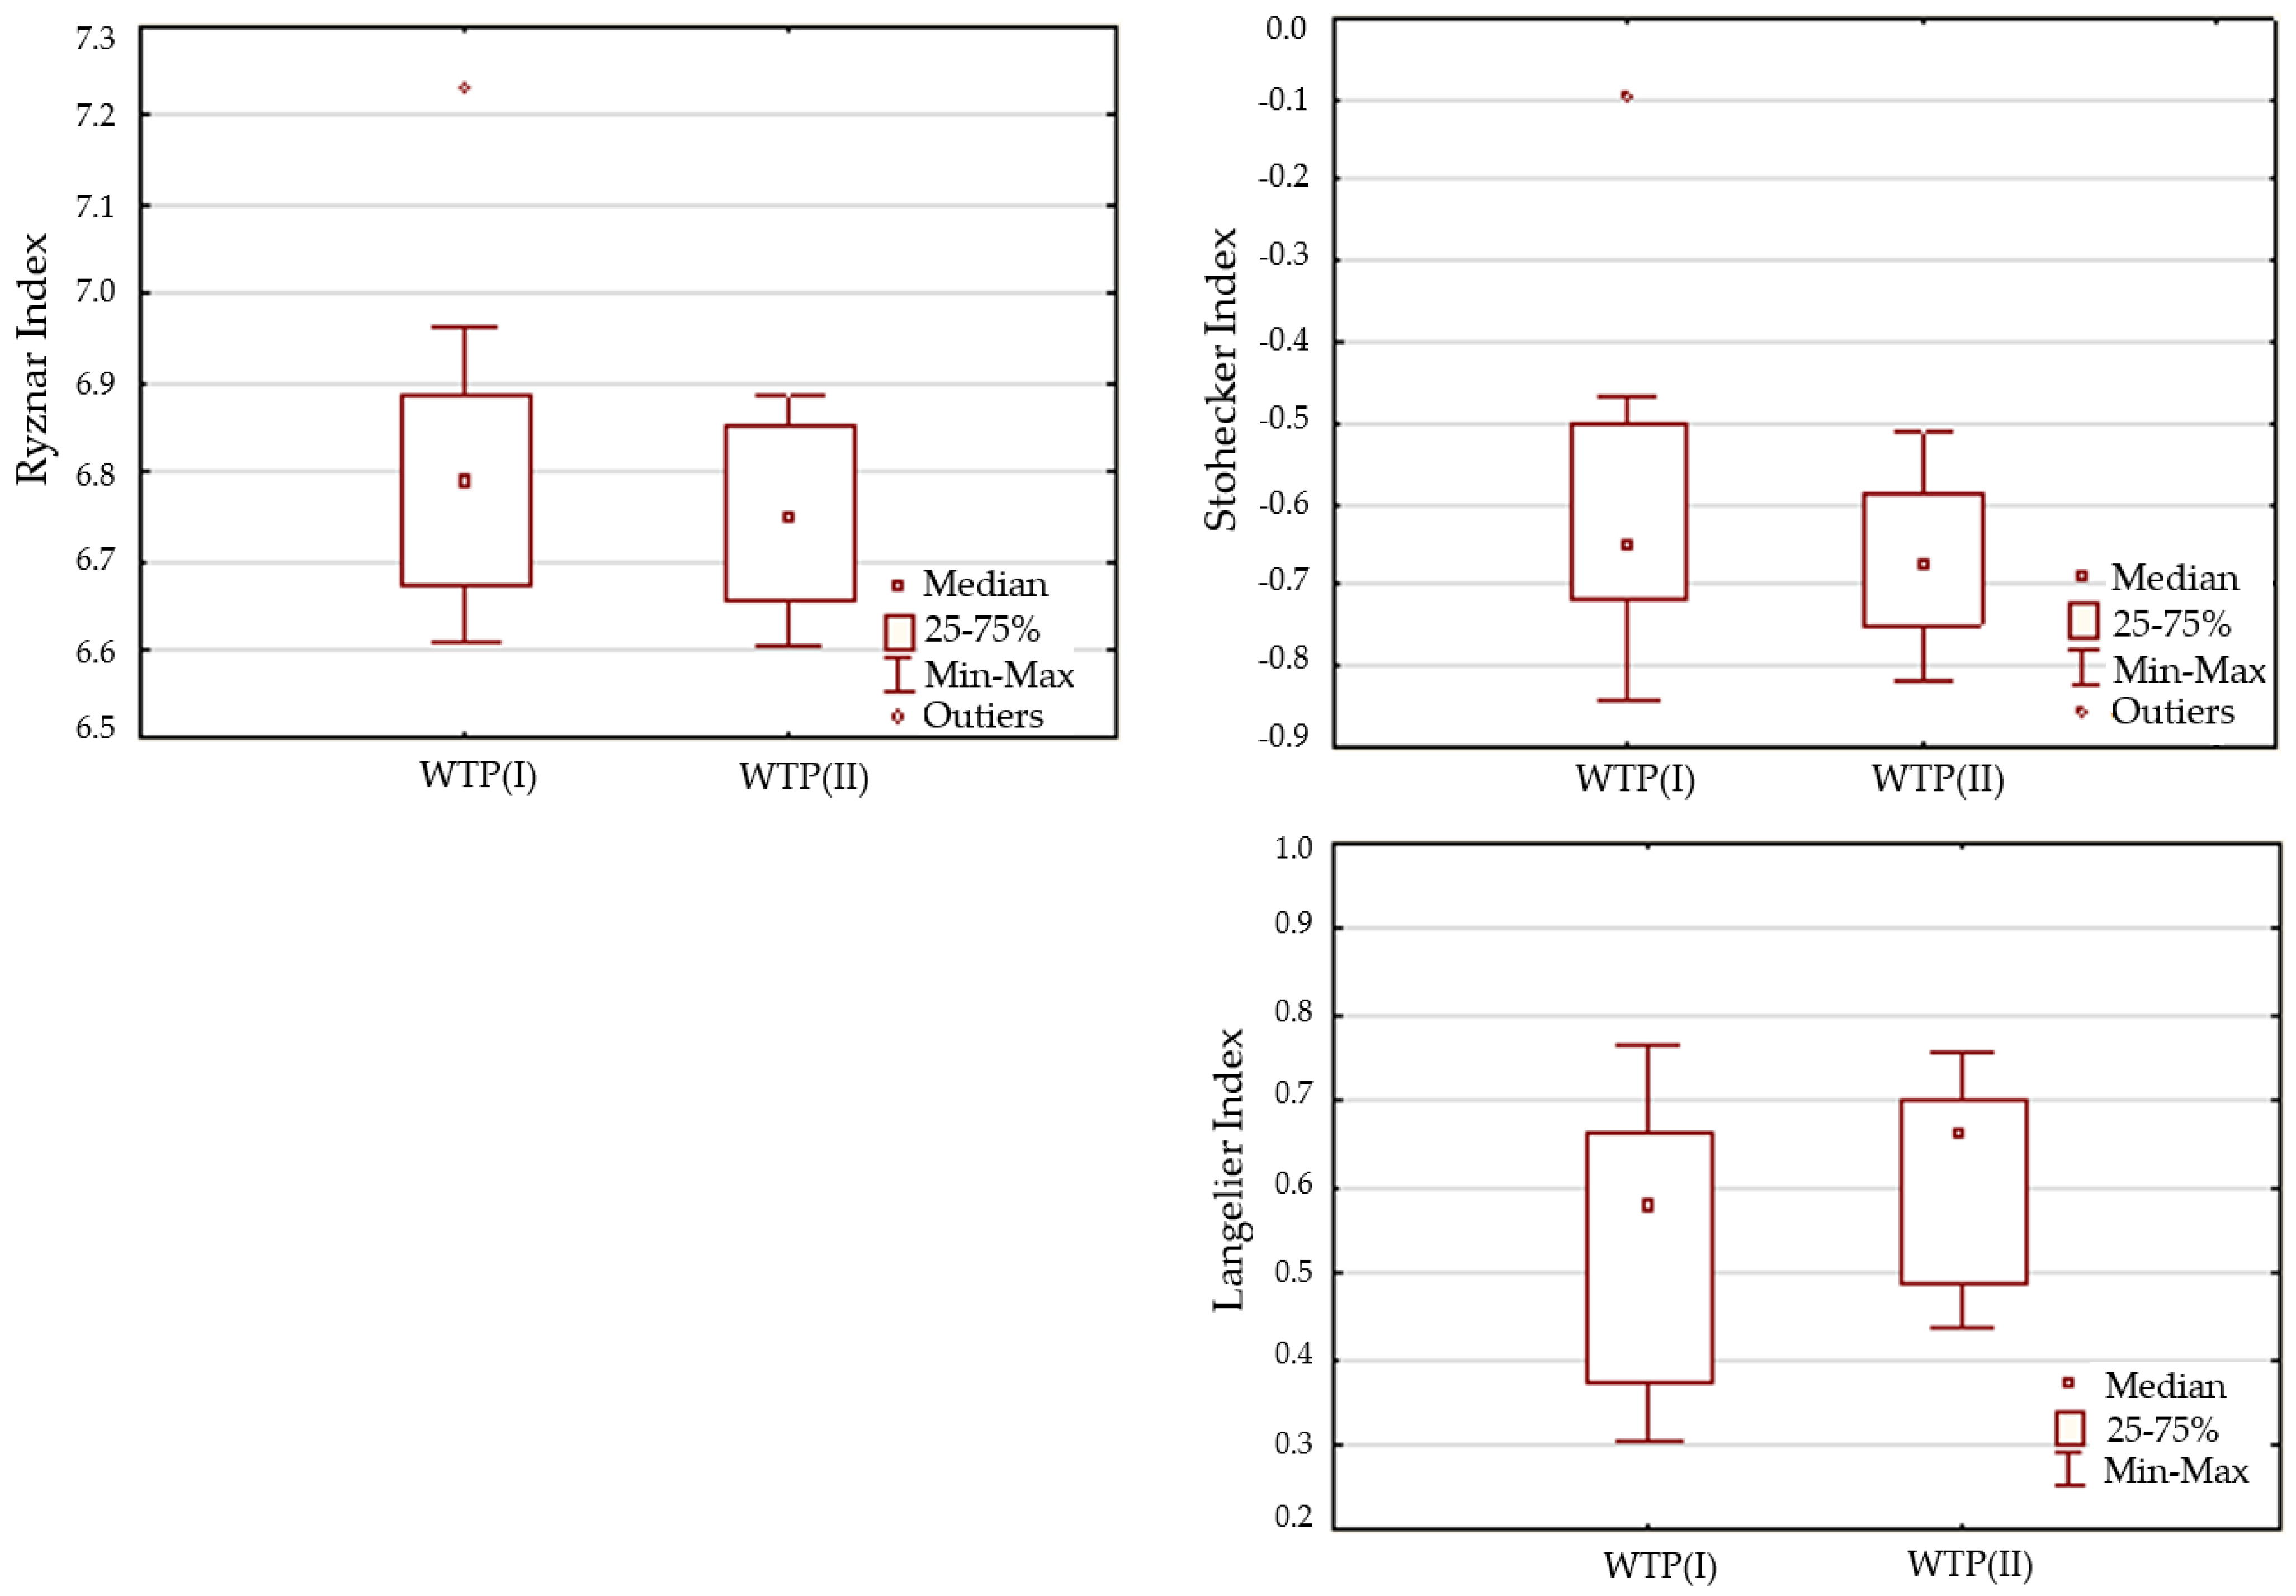
3.1. Physical and Chemical Stability
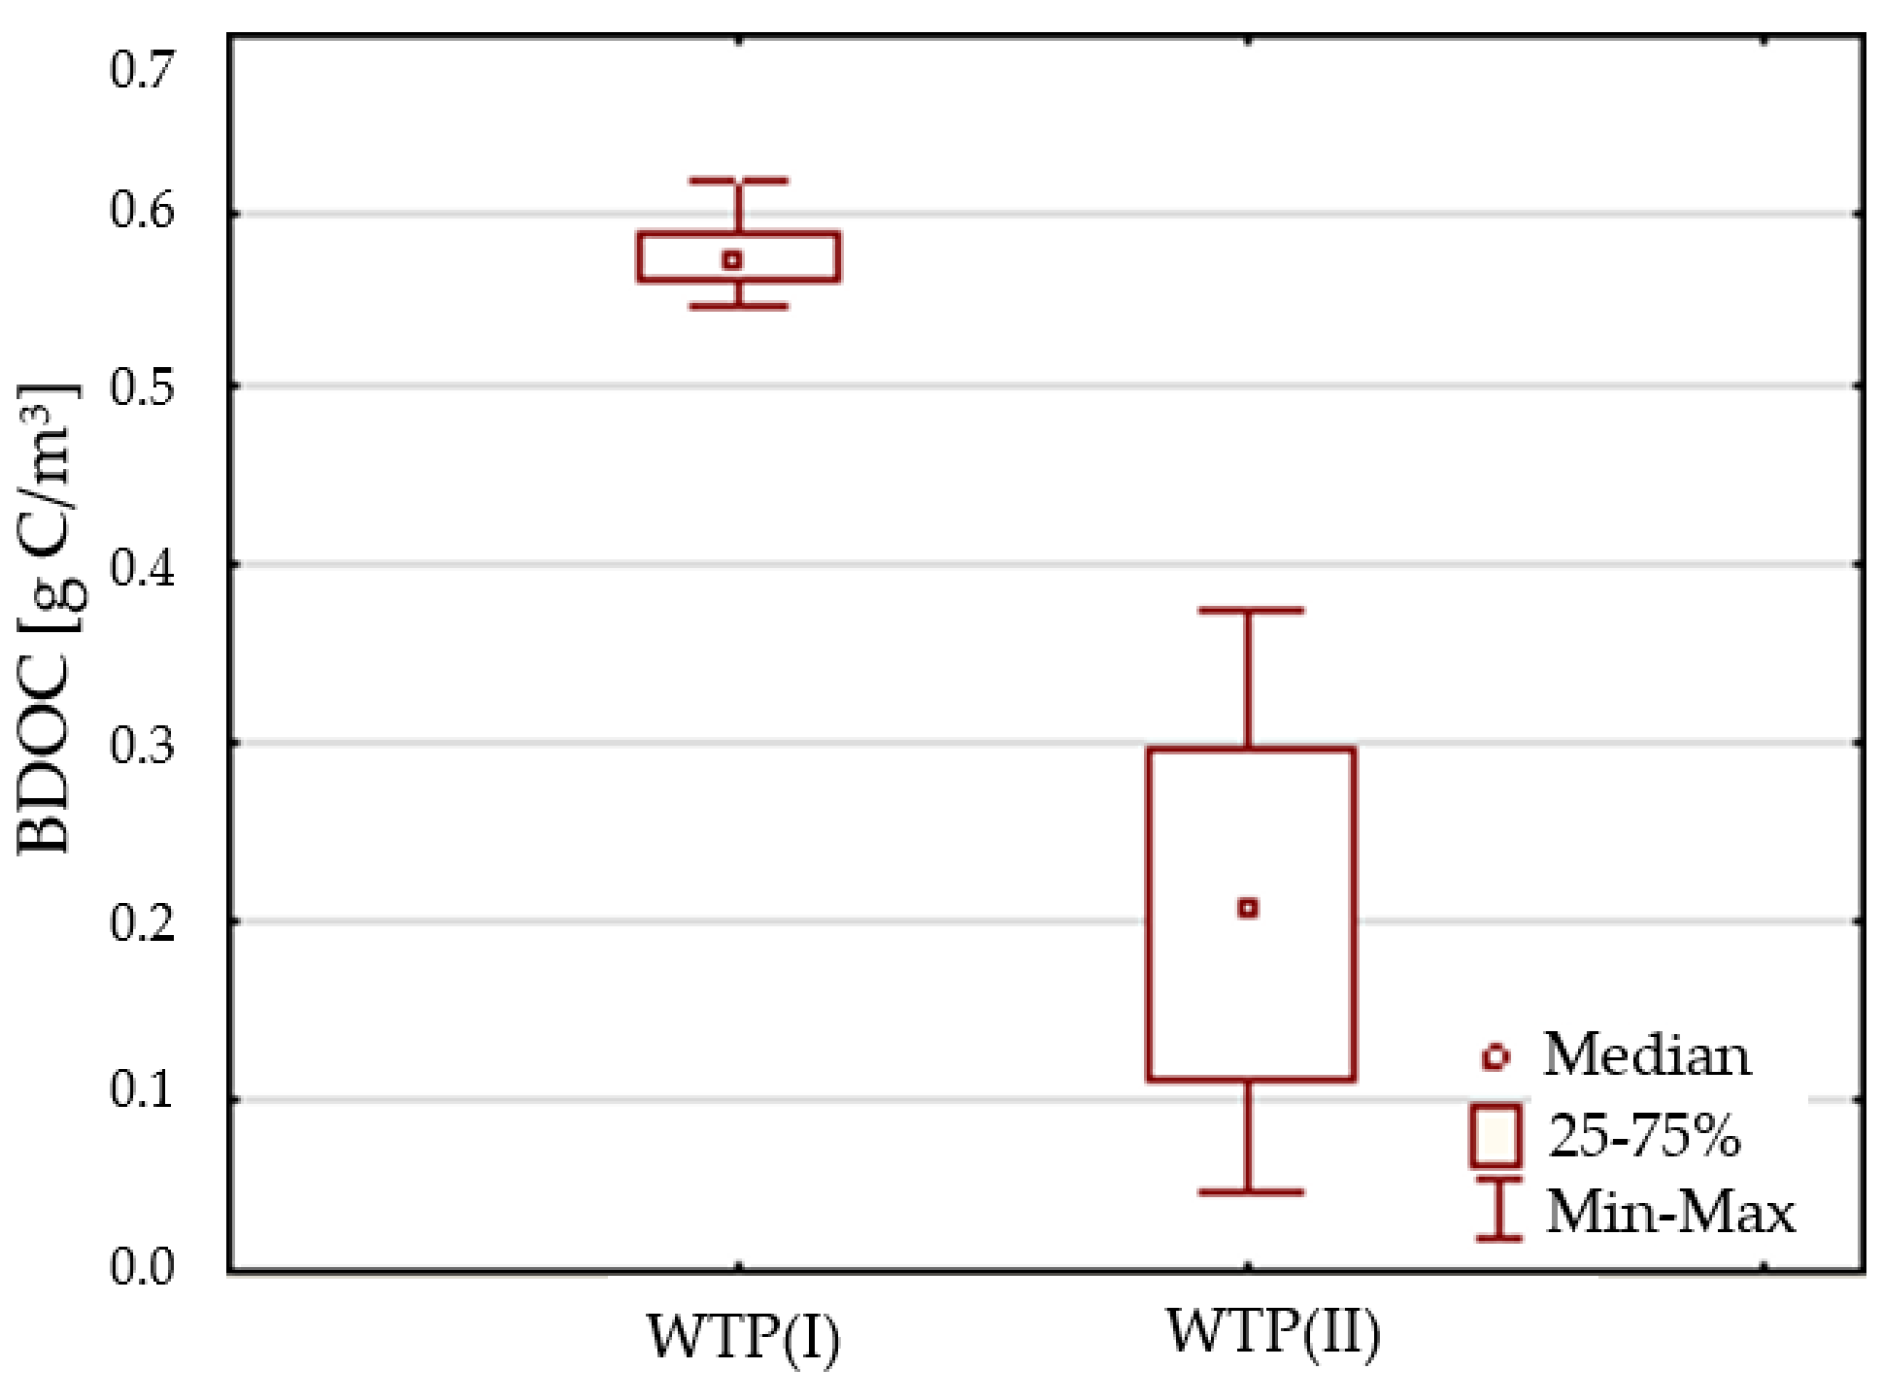
3.2. Biological Stability
- (1)
- Tolerated risk: 0.019702—WTP(I) and 0.734118—WTP(II),
- (2)
- Controlled risk: 0.970497—WTP(I) and 0.263289—WTP(II),
- (3)
- Unacceptable risk: 0.009801—WTP(I) and 0.002593—WTP(II) (Table 9).
4. Discussion
5. Conclusions
Author Contributions
Funding
Conflicts of Interest
References
- Liu, G.; Verberk, J.Q.J.C.; Van Dijk, J.C. Bacteriology of Drinking Water Distribution Systems: An Integral and Multidimensional Review. Appl. Microbiol. Biotechol. 2013, 97, 9265–9276. [Google Scholar] [CrossRef]
- Baloïtcha, G.M.P.; Mayabi, A.O.; Home, P.G. Evaluation of Water Quality and Potential Scaling of Corrosion in the Water Supply Using Water Quality and Stability Indices: A Case Study of Juja Water Distribution Network, Kenya. Heliyon 2022, 8, e09141. [Google Scholar] [CrossRef]
- Liu, G.; Ling, F.Q.; van der Mark, E.J.; Zhang, X.D.; Knezev, A.; Verberk, J.Q.J.C.; van der Meer, W.G.J.; Medema, G.J.; Liu, W.T.; van Dijk, J.C. Comparison of Particle-Associated Bacteria from a Drinking Water Treatment Plant and Distribution Reservoirs with Different Water Sources. Sci. Rep. 2016, 6, 20367. [Google Scholar] [CrossRef] [PubMed]
- van der Wielen, P.W.J.J.; Bakker, G.; Atsma, A.; Lut, M.; Roeselers, G.; de Graaf, B. A Survey of Indicator Parameters to Monitor Regrowth in Unchlorinated Drinking Water. Environ. Sci. Water Res. Technol. 2016, 2, 683–692. [Google Scholar] [CrossRef]
- Favere, J.; Buysschaert, B.; Boon, N.; De Gusseme, B. Online Microbial Fingerprinting for Quality Management of Drinking Water: Full-Scale Event Detection. Water Res. 2020, 170, 115353. [Google Scholar] [CrossRef] [PubMed]
- Płuciennik-Koropczuk, E.; Kumanowska, P. Chemical Stability of Water in the Water Supply Network—Preliminary Research. Civ. Environ. Eng. Rep. 2018, 28, 79–89. [Google Scholar] [CrossRef] [Green Version]
- World Health Organization. Guidelines for Drinking-Water Quality, 4th ed.; World Health Organization: Geneva, Switzerland, 2011; ISBN 978-92-4-154815-1. [Google Scholar]
- Vreeburg, J.H.G.; Schippers, D.; Verberk, J.Q.J.C.; van Dijk, J.C. Impact of Particles on Sediment Accumulation in a Drinking Water Distribution System. Water Res. 2008, 42, 4233–4242. [Google Scholar] [CrossRef]
- Liu, G.; Zhang, Y.; Knibbe, W.-J.; Feng, C.; Liu, W.; Medema, G.; van der Meer, W. Potential Impacts of Changing Supply-Water Quality on Drinking Water Distribution: A Review. Water Res. 2017, 116, 135–148. [Google Scholar] [CrossRef]
- Vreeburg, I.J.; Boxall, J.B. Discolouration in Potable Water Distribution Systems: A Review. Water Res. 2007, 41, 519–529. [Google Scholar] [CrossRef]
- Fish, K.E.; Sharpe, R.L.; Biggs, C.A.; Boxall, J.B. Impacts of Temperature and Hydraulic Regime on Discolouration and Biofilm Fouling in Drinking Water Distribution Systems. PLoS Water 2022, 1, e0000033. [Google Scholar] [CrossRef]
- Dang, Y.T.H.; Power, A.; Cozzolino, D.; Dinh, K.B.; Ha, B.S.; Kolobaric, A.; Vongsvivut, J.; Truong, V.K.; Chapman, J. Analytical Characterisation of Material Corrosion by Biofilms. J. Bio-Tribo-Corros. 2022, 8, 50. [Google Scholar] [CrossRef]
- Cerrato, J.M.; Falkinham, J.O.; Dietrich, A.M.; Knocke, W.R.; McKinney, C.W.; Pruden, A. Manganese-Oxidizing and -Reducing Microorganisms Isolated from Biofilms in Chlorinated Drinking Water Systems. Water Res. 2010, 44, 3935–3945. [Google Scholar] [CrossRef] [PubMed]
- Jachimowski, A. Factors affecting water quality in a water supply network. J. Ecol. Eng. 2017, 18, 110–117. [Google Scholar] [CrossRef]
- García-Ávila, F.; Ramos-Fernández, L.; Zhindón-Arévalo, C. Estimation of Corrosive and Scaling Trend in Drinking Water Systems in the City of Azogues, Ecuador. Rev. Ambiente Água 2018, 13, 1. [Google Scholar] [CrossRef]
- Wang, Q.; Tao, T.; Xin, K. The Relationship between Water Biostability and Initial Bacterial Growth Variations to Different Organic Carbon Concentrations. Procedia Eng. 2014, 89, 160–167. [Google Scholar] [CrossRef] [Green Version]
- Zhang, J.; Li, W.-Y.; Wang, F.; Qian, L.; Xu, C.; Liu, Y.; Qi, W. Exploring the Biological Stability Situation of a Full Scale Water Distribution System in South China by Three Biological Stability Evaluation Methods. Chemosphere 2016, 161, 43–52. [Google Scholar] [CrossRef]
- Wolska, M. Usuwanie substancji biogennych w technologii oczyszczania wody przeznaczonej do spożycia przez ludzi; Oficyna Wydawnicza Politechniki Wrocławskiej: Wrocław, Poland, 2015. (In Polish) [Google Scholar]
- Prest, E.I.; Hammes, F.; van Loosdrecht, M.C.M.; Vrouwenvelder, J.S. Biological Stability of Drinking Water: Controlling Factors, Methods, and Challenges. Front. Microbiol. 2016, 7, 1. [Google Scholar] [CrossRef] [Green Version]
- Niquette, P.; Servais, P.; Savoir, R. Bacterial Dynamics in the Drinking Water Distribution System of Brussels. Water Res. 2001, 35, 675–682. [Google Scholar] [CrossRef]
- LeChevallier, M.W.; Shaw, N.E.; Kaplan, L.A.; Bott, T.L. Development of a rapid assimilable organic carbon method for water. App. Environ. Microb. 1993, 59, 1526–1531. [Google Scholar] [CrossRef] [Green Version]
- Prévost, M.; Rompré, A.; Coallier, J.; Servais, P.; Laurent, P.; Clément, B.; Lafrance, P. Suspended Bacterial Biomass and Activity in Full-Scale Drinking Water Distribution Systems: Impact of Water Treatment. Water Res. 1998, 32, 1393–1406. [Google Scholar] [CrossRef]
- Fang, W.; Hu, J.Y.; Ong, S.L. Influence of Phosphorus on Biofilm Formation in Model Drinking Water Distribution Systems. J. Appl. Microbiol. 2009, 106, 1328–1335. [Google Scholar] [CrossRef] [PubMed]
- Wolska, M.; Mołczan, M. Ocena Stabilności Wody Wprowadzanej Do Sieci Wodociągowej. Ochr. Sr. 2015, 37, 51–56. (In Polish) [Google Scholar]
- Francisque, A.; Rodriguez, M.J.; Miranda-Moreno, L.F.; Sadiq, R.; Proulx, F. Modeling of Heterotrophic Bacteria Counts in a Water Distribution System. Water Res. 2009, 43, 1075–1087. [Google Scholar] [CrossRef] [PubMed]
- Vital, M.; Hammes, F.; Egli, T. Competition of Escherichia coli O157 with a Drinking Water Bacterial Community at Low Nutrient Concentrations. Water Res. 2012, 46, 6279–6290. [Google Scholar] [CrossRef]
- Nescerecka, A.; Rubulis, J.; Vital, M.; Juhna, T.; Hammes, F. Biological Instability in a Chlorinated Drinking Water Distribution Network. PLoS ONE 2014, 9, e96354. [Google Scholar] [CrossRef] [Green Version]
- Gillespie, S.; Lipphaus, P.; Green, J.; Parsons, S.; Weir, P.; Juskowiak, K.; Jefferson, B.; Jarvis, P.; Nocker, A. Assessing Microbiological Water Quality in Drinking Water Distribution Systems with Disinfectant Residual Using Flow Cytometry. Water Res. 2014, 65, 224–234. [Google Scholar] [CrossRef]
- Zhu, Z.; Wu, C.; Zhong, D.; Yuan, Y.; Shan, L.; Zhang, J. Effects of Pipe Materials on Chlorine-Resistant Biofilm Formation Under Long-Term High Chlorine Level. Appl. Biochem. Biotechnol. 2014, 173, 1564–1578. [Google Scholar] [CrossRef]
- Liu, S.; Gunawan, C.; Barraud, N.; Rice, S.A.; Harry, E.J.; Amal, R. Understanding, Monitoring, and Controlling Biofilm Growth in Drinking Water Distribution Systems. Environ. Sci. Technol. 2016, 50, 8954–8976. [Google Scholar] [CrossRef]
- Wąsowski, J.; Kowalski, D.; Kowalska, B.; Kwietniewski, M.; Zawilska, M. Water Quality Changes in Cement-Lined Water Pipe Networks. Appl. Sci. 2019, 9, 1348. [Google Scholar] [CrossRef] [Green Version]
- Liu, J.; Luo, Z.; Liu, K.; Zhang, Y.; Peng, H.; Hu, B.; Ren, H.; Zhou, X.; Qiu, S.; He, X.; et al. Effect of Flushing on the Detachment of Biofilms Attached to the Walls of Metal Pipes in Water Distribution Systems. J. Zhejiang Univ. Sci. A 2017, 18, 313–328. [Google Scholar] [CrossRef]
- Tsagkari, E.; Sloan, W.T. Turbulence Accelerates the Growth of Drinking Water Biofilms. Bioprocess Biosyst. Eng. 2018, 41, 757–770. [Google Scholar] [CrossRef] [PubMed] [Green Version]
- Atekwana, E.A.; Atekwana, E.A.; Rowe, R.S.; Werkema, D.D.; Legall, F.D. The Relationship of Total Dissolved Solids Measurements to Bulk Electrical Conductivity in an Aquifer Contaminated with Hydrocarbon. Appl. Geophys. 2004, 56, 281–294. [Google Scholar] [CrossRef]
- Tchórzewska-Cieślak, B.; Papciak, D.; Pietrucha-Urbanik, K.; Pietrzyk, A. Safety Analysis of Tap Water Biostability. Archit. Civ. Eng. Environ. 2018, 11, 149–154. [Google Scholar] [CrossRef] [Green Version]
- Papciak, D.; Tchórzewska-Cieslak, B.; Pietrucha-Urbanik, K.; Pietrzyk, A. Analysis of the Biological Stability of Tap Water based on Risk Analysis and Parameters Limiting the Secondary Growth of Microorganisms in Water Distribution Systems. Desalination Water Treat. 2018, 117, 1–8. [Google Scholar] [CrossRef]
- Tchórzewska-Cieślak, B.; Papciak, D.; Pietrucha-Urbanik, K. Szacowanie Ryzyka Zmian Jakości Wody w Sieci Wodociągowej; Oficyna Wydawnicza Politechniki Rzeszowskiej: Rzeszów, Poland, 2017. (In Polish) [Google Scholar]
- Simpson, D.R. Biofilm Processes in Biologically Active Carbon Water Purification. Water Res. 2008, 42, 2839–2848. [Google Scholar] [CrossRef] [PubMed]
- Jin, P.; Jin, X.; Wang, X.; Feng, Y.; Wang, X.C. Biological Activated Carbon Treatment Process for Advanced Water and Wastewater Treatment. In Biomass Now—Cultivation and Utilization; Matovic, M.D., Ed.; InTech: London, UK, 2013; ISBN 978-953-51-1106-1. [Google Scholar]
- Papciak, D.; Domoń, A.; Zdeb, M.; Skwarczyńska-Wojsa, A.; Konkol, J. Optimization of Quantitative Analysis of Biofilm Cell from Pipe Materials. Coatings 2021, 11, 1286. [Google Scholar] [CrossRef]
- Goraj, W.; Pytlak, A.; Kowalska, B.; Kowalski, D.; Grządziel, J.; Szafranek-Nakonieczna, A.; Gałązka, A.; Stępniewska, Z.; Stępniewski, W. Influence of Pipe Material on Biofilm Microbial Communities Found in Drinking Water Supply System. Environ. Res. 2021, 196, 110433. [Google Scholar] [CrossRef]
- Kowalska, B.; Kowalski, D.; Hołota, E. Fractal-Heuristic Method of Water Quality Sensor Locations in Water Supply Network. Water 2020, 12, 832. [Google Scholar]
- Yao, J.; Ge, H.; Zhang, Y.; Wang, X.; Xie, S.; Sheng, K.; Meng, X.; Zhao, Y. Influence of PH on Corrosion Behavior of Carbon Steel in Simulated Cooling Water Containing Scale and Corrosion Inhibitors. Mater. Corros. 2020, 71, 1266–1275. [Google Scholar] [CrossRef]
- Jo, K.-H.; Kim, S.-I.; Woo, D.-S. Effects of PH, Alkalinity, Chloride Ion on the Copper Pipe Corrosion. Korean J. Environ. Health Sci. 2007, 33, 43–48. [Google Scholar] [CrossRef] [Green Version]
- Pan, R.; Zhang, K.; Cen, C.; Zhou, X.; Xu, J.; Wu, J.; Wu, X. Characteristics of Biostability of Drinking Water in Aged Pipes after Water Source Switching: ATP Evaluation, Biofilms Niches and Microbial Community Transition. Environ. Pollut. 2021, 271, 116293. [Google Scholar] [CrossRef] [PubMed]
- Gomez-Smith, C.K.; LaPara, T.M.; Hozalski, R.M. Sulfate Reducing Bacteria and Mycobacteria Dominate the Biofilm Communities in a Chloraminated Drinking Water Distribution System. Environ. Sci. Technol. 2015, 49, 8432–8440. [Google Scholar] [CrossRef]
- Pietrucha-Urbanik, K.; Tchórzewska-Cieślak, B.; Papciak, D.; Skrzypczak, I. Analysis of Chemical Stability of Tap Water in Terms of Required Level of Technological Safety. Arch. Environ. Prot. 2017, 43, 3–12. [Google Scholar] [CrossRef] [Green Version]
- Domoń, A.; Papciak, D.; Tchórzewska-Cieślak, B.; Pietrucha-Urbanik, K. Biostability of Tap Water—A Qualitative Analysis of Health Risk in the Example of Groundwater Treatment (Semi-Technical Scale). Water 2018, 10, 1764. [Google Scholar] [CrossRef] [Green Version]
- Chen, C.; Zhang, X.; He, W.; Lu, W.; Han, H. Comparison of Seven Kinds of Drinking Water Treatment Processes to Enhance Organic Material Removal: A Pilot Test. Sci. Total Environ. 2007, 382, 93–102. [Google Scholar] [CrossRef] [PubMed]
- Pons, W.; Young, I.; Truong, J.; Jones-Bitton, A.; McEwen, S.; Pintar, K.; Papadopoulos, A. A Systematic Review of Waterborne Disease Outbreaks Associated with Small Non-Community Drinking Water Systems in Canada and the United States. PLoS ONE 2015, 10, e0141646. [Google Scholar] [CrossRef] [PubMed]
- Rosińska, A. Zawartość Wybranych Mikrozanieczyszczeń Organicznych w Wodzie Przygotowywanej Do Spożycia. Technol. Wody 2018, 2, 10–15. (In Polisch) [Google Scholar]
- Terry, L.G.; Summers, R.S. Biodegradable Organic Matter and Rapid-Rate Biofilter Performance: A Review. Water Res. 2018, 128, 234–245. [Google Scholar] [CrossRef]
- Laurent, P.; Prévost, M.; Cigana, J.; Niquette, P.; Servais, P. Biodegradable Organic Matter Removal in Biological Filters: Evaluation of the CHABROL Model. Water Res. 1999, 33, 1387–1398. [Google Scholar] [CrossRef]
- Directive (EU) 2020/2184 of the European Parliament and of the Council of 16 December 2020 on the Quality of Water Intended for Human Consumption. Available online: https://eur-lex.europa.eu/eli/dir/2020/2184/oj (accessed on 5 January 2023).
- Tak, S.; Vellanki, B.P. Natural Organic Matter as Precursor to Disinfection Byproducts and Its Removal Using Conventional and Advanced Processes: State of the Art Review. J. Water Health 2018, 16, 681–703. [Google Scholar] [CrossRef]
- Li, X.-F.; Mitch, W.A. Drinking Water Disinfection Byproducts (DBPs) and Human Health Effects: Multidisciplinary Challenges and Opportunities. Environ. Sci. Technol. 2018, 52, 1681–1689. [Google Scholar] [CrossRef] [PubMed]
| Indicator | Unit | Values |
|---|---|---|
| Turbidity | NTU | 8.0–14.0 |
| Color | g Pt/m3 | 40–100 |
| Total organic carbon (TOC) | g C/m3 | 11.0–14.5 |
| Permanganate value | g O2/m3 | 11.0–18.1 |
| Ammonia nitrogen | g NH4+/m3 | 1.20–1.98 |
| pH | - | 6.4–7.0 |
| Temperature | °C | 10.8–12.1 |
| Alkalinity | val/m3 | 2.5–4.5 |
| Hardness | g CaCO3/m3 | 200–470 |
| Sulphate | g SO42−/m3 | 60–240 |
| Conductivity | µS/cm | 430–1016 |
| Langelier Saturation Index (IL) | ||
|---|---|---|
| Equation | Value | Water Feature |
| IL = pH − pHs pHs = (9.3 + A + B) − (C + D) pH = pH measured in situ. pHs = pH at saturation pHs A = (log10 [TDS *] − 1)/10, B = –13.12 × log10 (°C + 273) + 34.55, C = log10 [Ca+2 mg L−1 as CaCO3] − 0.4 D = log10 [Alcal. as CaCO3 ] TDS = E × ke, E—conductivity [µs/cm], ke = 0.55–0.8, assumed: 0.64 | IL > 0 IL = 0 (−0.5 to +0.5 is considered a “zero”) IL < 0 | Water can dissolve calcium compounds and its corrosion properties are enhanced Water is stable: it does not tend to precipitate or dissolve calcium carbonate, and the corrosion properties are weakened Water can precipitate lime and its corrosion properties are weakened |
| Ryznar Stability Index (IR) | ||
| IR = 2 pHs − pH pHs = pH at saturation pH = pH measured in situ. | IR ˂ 5.5 5.5 ˂ IR ˂ 6.2 6.2 ˂ IR ˂ 6.8 6.8 ˂ IR ˂ 8.5 IR ˃ 8.5 | Heavy scale likely to form Moderate scale-forming Is considered neutral Low corrosion High corrosion |
| Strohecker Index (Ist) | ||
| IST = pHn − pHo pHn= 11.39 − 2lgA pHn—pH value corresponding to carbonate-calcium equilibrium, pHo—pH of the examined water, A—the amount of bounded CO2, g/m3 CO2. | IST < 0.5, 0.5 < IST < 2.0 2.0 < IST < 4.0 | Nonaggressive water Water with average aggressiveness Aggressive water |
| Parameter | Norm | Method/Device |
|---|---|---|
| Dissolved organic carbon | PN-EN 1484:1999 | TOC analyzer Sievers 5310 C (SUEZ, Boulder, CO, USA) |
| Turbidity | PN-EN ISO 7027:2003 | 2100P ISO turbidimeter (Hach, Germany) |
| Ammonium nitrogen | PN-C-04576-4:1994P | Direct nesslerization method |
| Nitrite nitrogen | PN-EN ISO 10304-1 2009 | The colorimetric method by Nitrite Test Merck 114408 (Merck, Germany) |
| Nitrate nitrogen | PN-82/C-04576/08 | The spectrophotometric method with sodium salicylate and sulfuric acid, Hach–Lange DR 500 spectrophotometer (Hach, Germany) |
| Phosphates | PN-EN ISO 6878:2006 | Spectrometric method using ammonium molybdate, Hach–Lange DR 500 spectrophotometer (Hach, Germany) |
| Conductivity | PN-EN 27888:1999 | Hach-Lange oxygen probe (Hach, Germany) |
| pH | PN-EN ISO 10523:2012 | Pehametr Hach–Lange HQ40d Multi (Hach, Germany) |
| Alkalinity | PN-EN ISO 9963-2:2001 | Titration method with hydrochloric acid |
| Tolerable risk The parameters of tap water ensure the maintenance of the biological and physicochemical stability of water during its transport in the water supply network. | |
| Biological stability RTb1 (S1 = BDOC ≤ 0.25) ˄ (S2 = Ninorg. ≤ 0.2) ˄ (S3 = PO43− ≤ 0.03) ˅ RTb2 (S1 = BDOC ≤ 0.25) ˄ (S2 = Ninorg. ≤ 0.2) ˄ (S3 = PO43− > 0.03) ˅ RTb3 (S1 = BDOC ≤ 0.25) ˄ (S2 = Ninorg. > 0.2) ˄ (S3 = PO43− ≤ 0.03) ˅ RTb4 (S1 = BDOC > 0.25) ˄ (S2 = Ninorg. ≤ 0.2) ˄ (S3 = PO43− ≤ 0.03) | Physicochemical stability RTch (I1 = IL = −0.5 ÷ 0.5) ˅ (I2 = IR= 6.2÷6.8) ˅ (I3 = IST < 0.5) |
| Controlled risk The parameters of tap water requiring control and reduction—parameters of tap water indicate the possibility of changes in the stability of water in the distribution system and mild corrosion may occur (there are no protective CaCO3 layers). | |
| Biological stability RKb1 S1 = BDOC > 0.25) ˄ (S2 = Ninorg. > 0.2) ˄ (S3 = PO43− ≤ 0.03) ˅ RKb2 (S1 = BDOC > 0.25) ˄ (S2 = Ninorg. ≤ 0.2) ˄ (S3 = PO43− > 0.03) ˅ RKb3 (S1 = BDOC ≤ 0.25) ˄ (S2 = Ninorg. > 0.2) ˄ (S3 = PO43− > 0.03) | Physicochemical stability RKch (I1 = IL = −3 ÷ −0.5 ˅ 0.5 ÷3) ˅ (I2 = IR= 6.8÷8.5 ˅ 5.5÷6.2) ˅ (I3 = IST > 0.5÷2) |
| Unacceptable risk Water quality does not ensure the stability of water in the water supply network; high probability of secondary water pollution and rapid corrosion. | |
| Biological stability RNab (S1 = BDOC > 0.25) ˄ (S2 = Ninorg. > 0.2) ˄ (S3 = PO43− > 0.03) | Physicochemical stability RNach (I1 = IL = −5 ÷ −3 ˅ 3÷4) ˅ (I2 = IR= <5.5 ˅ > 8.5 ˅ (I3 = IST > 2÷4) |
| Parameter | Water Quality for the WTP(I) System | ||||||
|---|---|---|---|---|---|---|---|
| Unit | Min | Max | Mean | Median | SD * | V ** | |
| Turbidity | NTU | 0.190 | 0.750 | 0.432 | 0.450 | 0.14 | 0.33 |
| Ph | - | 7.620 | 8.290 | 7.897 | 7.830 | 0.16 | 0.02 |
| Conductive | µS/cm | 634.00 | 899.00 | 788.94 | 815.00 | 82.23 | 0.10 |
| Alkalinity | val/m3 | 3.100 | 5.400 | 4.714 | 4.750 | 0.56 | 0.12 |
| Total hardness | val/m3 | 6.840 | 9.600 | 7.694 | 7.620 | 0.64 | 0.08 |
| Calcium content | g Ca2+/m3 | 6.160 | 6.840 | 6.466 | 6.322 | 0.27 | 0.04 |
| Water quality for the WTP(II) system | |||||||
| Turbidity | NTU | 0.210 | 0.490 | 0.342 | 0.330 | 0.09 | 0.25 |
| pH | - | 7.770 | 8.350 | 8.028 | 8.010 | 0.16 | 0.02 |
| Conductive | µS/cm | 694.00 | 966.00 | 809.12 | 827.00 | 68.73 | 0.08 |
| Alkalinity | val/m3 | 4.500 | 5.100 | 4.736 | 4.700 | 0.16 | 0.03 |
| Total hardness | val/m3 | 6.880 | 7.920 | 7.425 | 7.440 | 0.30 | 0.04 |
| Calcium content | g Ca2+/m3 | 6.200 | 7.080 | 6.465 | 6.420 | 0.29 | 0.04 |
| Risk Area | Index | WTP(I) | WTP(II) |
|---|---|---|---|
| [%] | |||
| Tolerable risk RTch | 0.5 < IL < 0.5 | 25.00 | 12.50 |
| 6.2 < IR < 6.8 | 62.50 | 62.50 | |
| IST < 0.5 | 100.00 | 100.00 | |
| Controlled risk RKch | 0.5 > IL > 3 | 75.00 | 87.5 |
| 6.8 > IR > 8.5 | 37.50 | 37.50 | |
| 0.5 > IST > 2 | 0.00 | 0.00 | |
| Parameter | Water Quality for the WTP(I) System | ||||||
|---|---|---|---|---|---|---|---|
| Unit | Min | Max | Mean | Median | SD * | V ** | |
| DOC | g C/m3 | 6.15 | 11.50 | 8.59 | 7.91 | 1.37 | 0.16 |
| BDOC | g C/m3 | 0.656 | 0,761 | 0.714 | 0.711 | 0.03 | 0.04 |
| Ammonium nitrogen | g N-NH4+/m3 | 0.000 | 1.050 | 0.281 | 0.200 | 0.28 | 1.25 |
| Nitrite nitrogen | g N-NO2−/m3 | 0.000 | 0.015 | 0.002 | 0.002 | 0.00 | 1.98 |
| Nitrate nitrogen | g N-NO3−/m3 | 0.277 | 0.976 | 0.636 | 0.658 | 0.21 | 0.32 |
| Inorganic nitrogen | g Ninorg./m3 | 0.279 | 1.964 | 0.918 | 0.808 | 0.39 | 0.42 |
| Phosphates | g PO43−/m3 | 0.000 | 0.002 | 0.000 | 0.000 | 0.00 | 1.72 |
| Water quality for the WTP(II) system | |||||||
| DOC | g C/m3 | 0.64 | 5.22 | 2.78 | 2.87 | 1.53 | 0.55 |
| BDOC | g C/m3 | 0.051 | 0.372 | 0.218 | 0.232 | 0.11 | 0.51 |
| Ammonium nitrogen | g N-NH4+/m3 | 0.000 | 0.500 | 0.125 | 0.100 | 0.15 | 1.18 |
| Nitrite nitrogen | g N-NO2−/m3 | 0.000 | 0.120 | 0.009 | 0.002 | 0.03 | 3.11 |
| Nitrate nitrogen | g N-NO3−/m3 | 0.087 | 0.912 | 0.573 | 0.658 | 0.26 | 0.46 |
| Inorganic nitrogen | g Ninorg./m3 | 0.118 | 1.173 | 0.710 | 0.777 | 0.28 | 0.40 |
| Phosphates | g PO43−/m3 | 0.000 | 0.001 | 0.000 | 0.000 | 0.00 | 1.09 |
| Parameter | Index | WTP(I) | WTP(II) |
|---|---|---|---|
| [%] | |||
| BDOC | ≤0.25 g C/m3 | 0 | 70.6 |
| N | ≤0.2 g Ninorg./m3 | 0 | 11.8 |
| P | ≤0.03 g PO43−/m3 | 100 | 100 |
| WTP(I) | WTP(II) | |||||||||
|---|---|---|---|---|---|---|---|---|---|---|
| RTb1 | PSBDOC | PSNinorg. | PSPO43− | E(C) | n [%] | PSBDOC | PSNinorg. | PSPO43− | E(C) | n * [%] |
| 0.01 | 0.01 | 0.99 | 0.000099 | 0 | 0.706 | 0.118 | 0.99 | 0.082475 | 11.7 | |
| RTb2 | PSBDOC | PSNinorg. | PpPO43− | E(C) | n [%] | PSBDOC | PSNinorg. | PpPO43− | E(C) | n [%] |
| 0.01 | 0.01 | 0.01 | 0.000001 | 0 | 0.706 | 0.118 | 0.01 | 0.000833 | 0 | |
| RTb3 | PSBDOC | PPNinorg. | PsPO43− | E(C) | n [%] | PSBDOC | PPNinorg. | PsPO43− | E(C) | n [%] |
| 0.01 | 0.99 | 0.99 | 0.009801 | 0 | 0.706 | 0.882 | 0.99 | 0.616465 | 58.8 | |
| RTb4 | PPBDOC | PSNinorg. | PsPO43− | E(C) | n [%] | PPBDOC | PSNinorg. | PsPO43− | E(C) | n [%] |
| 0.01 | 0.009801 | 0 | 0.294 | 0.118 | 0.99 | 0.034345 | 0 | |||
| ∑ RTb1-4 | 0.019702 | - | ∑ RTb1-4 | 0.734118 | - | |||||
| RKb1 | PPBDOC | PPNinorg. | PsPO43− | E(C) | n [%] | PPBDOC | PPNinorg. | PsPO43− | E(C) | n [%] |
| 0.99 | 0.99 | 0.99 | 0.970299 | 100 | 0.294 | 0.882 | 0.99 | 0.256715 | 29.4 | |
| RKb2 | PPBDOC | PSNinorg. | PPPO43− | E(C) | n [%] | PPBDOC | PSNinorg. | PPPO43− | E(C) | n [%] |
| 0.99 | 0.01 | 0.01 | 0.000099 | 0 | 0.294 | 0.118 | 0.01 | 0.000347 | 0 | |
| RKb3 | PSBDOC | PPNinorg. | PPPO43− | E(C) | n [%] | PSBDOC | PPNinorg. | PPPO43− | E(C) | n [%] |
| 0.01 | 0.99 | 0.01 | 0.000099 | 0 | 0.706 | 0.882 | 0.01 | 0.006227 | 0 | |
| ∑ RKb1-3 | 0.970497 | - | ∑ RKb1-3 | 0.263289 | - | |||||
| RNAb | PPBDOC | PPNinorg. | PPPO43− | E(C) | n [%] | PPBDOC | PPNinorg. | PPPO43− | E(C) | n [%] |
| 0.99 | 0.99 | 0.01 | 0.009801 | 0 | 0.294 | 0.882 | 0.01 | 0.0025931 | 0 | |
Disclaimer/Publisher’s Note: The statements, opinions and data contained in all publications are solely those of the individual author(s) and contributor(s) and not of MDPI and/or the editor(s). MDPI and/or the editor(s) disclaim responsibility for any injury to people or property resulting from any ideas, methods, instructions or products referred to in the content. |
© 2023 by the authors. Licensee MDPI, Basel, Switzerland. This article is an open access article distributed under the terms and conditions of the Creative Commons Attribution (CC BY) license (https://creativecommons.org/licenses/by/4.0/).
Share and Cite
Domoń, A.; Papciak, D.; Tchórzewska-Cieślak, B. Influence of Water Treatment Technology on the Stability of Tap Water. Water 2023, 15, 911. https://doi.org/10.3390/w15050911
Domoń A, Papciak D, Tchórzewska-Cieślak B. Influence of Water Treatment Technology on the Stability of Tap Water. Water. 2023; 15(5):911. https://doi.org/10.3390/w15050911
Chicago/Turabian StyleDomoń, Andżelika, Dorota Papciak, and Barbara Tchórzewska-Cieślak. 2023. "Influence of Water Treatment Technology on the Stability of Tap Water" Water 15, no. 5: 911. https://doi.org/10.3390/w15050911
APA StyleDomoń, A., Papciak, D., & Tchórzewska-Cieślak, B. (2023). Influence of Water Treatment Technology on the Stability of Tap Water. Water, 15(5), 911. https://doi.org/10.3390/w15050911


