Article

Effects of Graphene on Soil Water-Retention Curve, van Genuchten Parameters, and Soil Pore Size Distribution—A Comparison with Traditional Soil Conditioners

by
Luigi Alessandrino
1,
Christos Pavlakis
2,
Nicolò Colombani
3,*,
Micòl Mastrocicco
1 and
Vassilis Aschonitis
2
1
Department of Environmental, Biological and Pharmaceutical Sciences and Technologies, Campania University “Luigi Vanvitelli”, Via Vivaldi 43, 81100 Caserta, Italy
2
Hellenic Agricultural Organization-DIMITRA, Soil and Water Resources Institute, 57001 Thermi-Thessaloniki, Greece
3
Department of Materials, Environmental Sciences and Urban Planning, Marche Polytechnic University, Via Brecce Bianche 12, 60131 Ancona, Italy
*
Author to whom correspondence should be addressed.
Water 2023, 15(7), 1297; https://doi.org/10.3390/w15071297
Submission received: 21 February 2023 / Revised: 16 March 2023 / Accepted: 23 March 2023 / Published: 25 March 2023
(This article belongs to the Section Soil and Water)

Abstract

:
Graphene waste has had enormous growth due to many industrial applications. Agriculture exploits waste through the circular economy, and graphene waste is thereby investigated in this study as a soil conditioner for improving the physical–hydraulic properties of soil. Experiments were performed on three differently textured soils amended with traditional soil conditioners (compost, biochar, and zeolites) and graphene. The conditioners were applied at two different doses of 10% and 5% dry weight (d.w.) for compost, biochar, and zeolites, and 1.0% and 0.5% d.w. for graphene. We compared (i) the major porosity classes related to water-retention characteristics (drainage, storage, and residual porosity), (ii) bulk density, and (iii) van Genuchten water-retention curve (WRC) characteristics. Graphene application caused the largest decrease in dry bulk density (ρb), lowering the soil bulk density by about 25%. In fact, graphene had ρb of 0.01 g/cm3. The effects of graphene were more intense in the finer soil. Compost and biochar showed similar effects, but of lower magnitude compared to those of graphene, with ρb of 0.7 and 0.28 g/cm3, respectively. Although zeolites had ρb of 0.62 g/cm3, they showed quite different behavior in increasing the mixtures’ ρb. Graphene and biochar showed the most pronounced effects in the clayey soil, where storage porosity showed a reduction of >30% compared to the control. For storage porosity, the graphene treatments did not show statistically significant differences compared to the control. The results show that, when the conditioner increased drainage porosity, there was a high probability of a concomitant reduction in storage porosity. This finding indicates that graphene use for improving soil aeration and drainage conditions is viable, especially in fine soils.

1. Introduction

Soil degradation is one of the world’s major problems [1]. Climate change in combination with the intensive use of agricultural soils may lead to the degradation of important physical soil characteristics [2,3,4]. Many studies showed that soil degradation leads to a significant decrease in agricultural yields, and considering the increase in the global population, this could become a serious food-supply problem [5,6]. Soil degradation can lead to the destruction of the soil structure, compaction, a decrease in water retention, and an increase in erosion [7], thereby decreasing soil quality. Soil quality affects fundamental soil processes such as filtration, buffering, immobilization, and the detoxification of organic and inorganic substances. It also promotes root growth, stores and recycles nutrients, regulates the movement of water and solutes, and redistributes and supplies them to plants [8].
Changes in physical soil properties are primarily studied by examining variations in soil dry bulk density (ρb), specific classes of pore size distribution (PSD), and changes in the water retention curve (WRC) by analyzing the parameters of the van Genuchten WRC model [9,10,11]. Indeed, ρb, pore size distribution, and the water-retention curve are some of the main indicators used to assess soil quality [12,13]. An increase in soil ρb could lead to aeration stress [14] and negatively influence biological processes [15]. In addition, pore size distribution is directly connected to the mobility of liquid and gas in soils, so changes in this indicator could lead to dramatic changes in soil processes [16]. Moreover, WRC characteristics such as its maximal slope were proposed by Dexter (2004) [17] and are used as an index of physical soil quality (also called the S index).
To limit soil degradation and to improve the soil physical characteristics, different soil conditioners, both organic and inorganic, may be used as soil amendments [18]. Soil conditioners can improve soil’s hydrophysical characteristics, quality, and fertility [19,20,21,22,23,24,25]
Biochar, compost, and zeolites are the most common soil conditioners used for altering physical, chemical, and biochemical soil properties [26,27,28,29,30,31,32,33,34,35]. Biochar presents various positive functions in agricultural applications and has gained much attention in recent years [36,37,38]. The use of biochar can modify the soil aeration and infiltration rates [39,40,41], and improve soil quality and crop performance [41]. Compost application can improve physical soil properties, especially for soils with poor structure and low levels of organic matter [42]. Indeed, the application of compost can improve soil’s hydrological and physical characteristics, especially when soil organic matter (SOM) is poor or nonlabile [28,43,44]. Zeolites are mineral soil conditioners that are largely used in improving hydrophysical soil properties such as infiltration rate, saturated hydraulic conductivity, water holding capacity, and nutrient retention [45].
Graphene is a type of engineered carbon-based material (ECM) that exhibits excellent electrical and thermal conductivity, resistance, elasticity, and adsorption capacity [46]. Although graphene production is still very challenging, and we are still far from a large-scale process, it has boomed exponentially since 2004, so it is very likely that graphene production scraps and graphene-based waste will increase in the coming years [47]. On this basis, and given that recent studies showed that the application of graphene to soils did not lead to an increase in nutrients or heavy-metal leaching [23,24,30,31], it is important to properly investigate its effects on various soil types to understand if graphene-based scraps could be eventually employed in agricultural systems, including graphene in an appropriate circular-economy scheme [48].
The aim of this study is to investigate the changes in physical–hydraulic soil properties in three different soils amended with traditional soil conditioners (compost, biochar, and natural zeolites) versus graphene. The analysis focused on comparing the performance of the four conditioners on the basis of changes in the major porosity classes related to water-retention characteristics (drainage, storage, and residual porosity), changes in ρb, and changes in the parameters of the van Genuchten WRC model. Moreover, our results on the different porosity classes and ρb changes give the opportunity to evaluate and discuss the capacity of Dexter’s S index as a generalized physical soil quality index.

2. Materials and Methods

2.1. Soils and Soil Conditioners’ Characteristics

Three different soils (A, B, and C) with different textures (Table 1) collected from three different farmlands located in the Thessaloniki region (Greece) were used in this study. The soils were collected from 0–10 cm depth with a hand core drill, sieved at 6 mm, and analyzed for soil texture [49], electrical conductivity (EC), pH on soil saturated paste [50], calcium carbonate (CaCO3) with an acid neutralization method [51], SOM via a wet oxidation method [52], and bulk density (ρb) after drying at 105 °C for 48 h.
Four different soil conditioners were purchased from commercial manufacturers and used in this study (Table 2). Biochar (<5 mm) was produced by BioDea, Civitella in Valdichiana Italy, through gasification from wood. The compost (<3 mm) was vermicompost from cow manure produced by La Terra Di Gaia, Magliano de’ Marsi Italy. The zeolites (<70 μm) were a mixture of 67.5% clinoptilolite and 32.5% mordenite produced by SBM Life Science, Milano Italy. Graphene particles were scraps of graphene production of the Directa Plus company. Their particle size was analyzed via dry sieving methods [53]. The pH was assessed at a liquid-to-solid ratio (L/S) of 2.5:1. Soil organic matter (SOM) was analyzed using the titration-based wet combustion method [54]. Total nitrogen was determined using a Kjeldahl apparatus [55], while the cation exchange capacity (CEC) was measured spectrophotometrically using the cobaltihexamine chloride method [56].

2.2. Experimental Setup

Soils were mixed with one of each improver used in this study and placed in 10 cm high pots with a rectangular base (40 × 10 cm). Apart from the control soils (0%), the percentages of the conditioners applied to the soils were 5% and 10% in dry weight for compost, biochar, and zeolites, and 0.5% and 1% in dry weight for graphene due to its extremely low ρb (~0.01 g cm−3). In fact, using 5% or 10% of graphene meant that there was volumetrically more graphene than soil in the pot. To ensure mixing uniformity, pots were then buried in the field, left undisturbed for 6 months, and subjected to natural alternating wetting–drying cycles under free atmospheric conditions from October 2021 to March 2022 (Figure 1). After this procedure, soil samples were collected by inserting metal cores (height, 4.8 cm; diameter, 5.1 cm) in the pots. For each treatment, three replicate samples were obtained. WRCs were determined on the soil samples using the ceramic pressure plate method [57,58,59] at 0.1, 0.33, 0.6, 1, 2, 3, 5, 10, and 15 bar; at the end of the measurements, ρb was also measured.

2.3. Methods of Data Analysis

One of the most popular procedures for soil porosity analysis is the quantification of porosity attributes based on the hydraulic concept, which divides pores into three major classes: (i) drainage or air-filled porosity with an equivalent diameter greater than 30 μm that drains at matric potentials below 100 cm H2O; (ii) storage porosity with equivalent diameter between 30 and 0.2 μm that drains at matric potentials between 100 and 15,000 cm H2O (also called available moisture); (iii) residual porosity with equivalent diameter < 0.2 μm [10,60,61]. The three porosity classes were directly measured from the measured water-retention data considering the aforementioned thresholds of matric potentials.
The conversion between matric potential and pore equivalent diameter assumed that pores were cylindrical according to the formula used in a similar study by Aschonitis et al. (2012) [11]:
D = 4 σ cos γ ρ w g h
where σ is the surface tension (N m−1), γ is the contact angle of the water curvature in soil pores, ρw is the density of water (kg m−3), g is the acceleration of gravity (m s−2), and h is the water pressure head (m). The simplified form of Equation (1) is D(μm) = 2980/h(cm). Considering the above, the comparison of the porosity classes between the control, and the mixtures of soils and conditioners can provide significant information about changes in drainage/aeration quality and the availability of soil moisture (i.e., storage porosity) due to the application of soil conditioners.
An additional way for analyzing porosity attributes is through the specific water capacity C(h) (cm−1), which is equal to the slope of the WRC at any given pressure head. Dexter (2004) [17] proposed the use of the maximal slope at the inflection point of the WRC estimated via gravimetric soil moisture W (WRC free from bulk density) at the ln–h axis as an index of physical soil quality (also called the S index). When the water-retention data are modelled using a WRC model, C(h) can also be modelled, providing continuous values along the range of water pressure head level. Aschonitis et al. (2015) [62] analyzed various expressions of the S index using dθ/dh, dW/dh, dθ/d(lnh), and dW/d(lnh) on the basis of the van Genuchten (1980) [63] WRC equation. From the comparison of the four expressions, dθ/dh and dW/dh showed better correlation performance with soil physical properties, where the former was recommended as the safest method for analyzing nondeformable soils because its theoretical basis is more relevant to porosity attributes, which are always expressed in terms of volume rather than mass, and the latter was suggested for analyzing deformable soils. In this study, water-retention data, denoted as θ(h), were modeled using the following equation [63]:
θ = θ r + θ s θ r 1 + a h n m
where θ is the water content (cm3 cm−3) at a given pressure head h (cm), θs is the saturated water content (cm3 cm−3), and θr is the residual water content (cm3 cm−3), a (cm−1). Parameters n and m are dimensionless and represent the shape of the curve. The relationship between n and m is expressed as m + 1/n = i (i = 1, 2, ...; in this study, I = 1 was used. Thus, m = 1 − 1/n). θs was not considered a fitting parameter and was set to be equal to the measured soil moisture at saturation (equivalent to total porosity). Thus, only a, n, and θr were fitted using the RETC code [64]. The specific water capacity based on the van Genuchten model parameters based on dθ/dh for nondeformable soils was estimated as follows [11,62]:
d θ d h = C ( h ) = m n θ s θ r 1 + ( a h ) n m 1 a n h n 1
At a specific pressure head where the curvature of Equation (2) is zero {d2θi/d(hi)2 = 0}, the θ(h) function presents an inflection point (θi,hi). At that point, slope Si = dθi/d(hi) corresponds to its maximal absolute value. Slope Si at the inflection point is given by the following equation [11,62]:
S i = C h i = m 1 + m n a θ s θ r 1 + m m 1
where “−” indicates a descending slope, which is why the magnitude change of S index was based on the absolute value |Si|.

2.4. Statistical Analysis

The effects of soil conditioners on the parameters of drainage, storage, residual, and total (measured θs) porosities, and the fitted van Genuchten parameters (a, n, θr), |Si| and ρb for the three soils were analyzed using two-way ANOVA followed by least-significant-difference (LSD) multiple-range tests for detecting statistically significant differences at the 0.05 level among the treatments on the basis of all soils and among soils on the basis of all treatments. One-way ANOVA was conducted, followed by LSD multiple-range tests to separately identify statistically significant differences among treatments for each soil. The significance level was set to 0.05. To discuss specific observations related to soil quality index |Si|, regression analysis and Spearman correlations were performed between |Si| and the three porosity classes (drainage, storage, residual) and ρb using all individual pairs of measurements from all soils and treatments. Statistical analyses were conducted using STATGRAPHICS Centurion 18 software developed by Statgraphics Technologies Inc.

3. Results

3.1. Water-Retention Curves

Figure 2 shows the measured values of (θ, h) pairs with the fitted van Genuchten curves for each soil amended by different treatments of compost, biochar, zeolite, and graphene. All the soil conditioners increased the WRC at near-saturation conditions in all the soils in comparison to the controls, but zeolites had the opposite effect. Graphene exerted a visible change in WRC in all soils compared to the other soil conditioners, especially keeping in mind that it was employed with one fewer orders of magnitude in weight with respect to the other soil conditioners.

3.2. Statistical Analysis

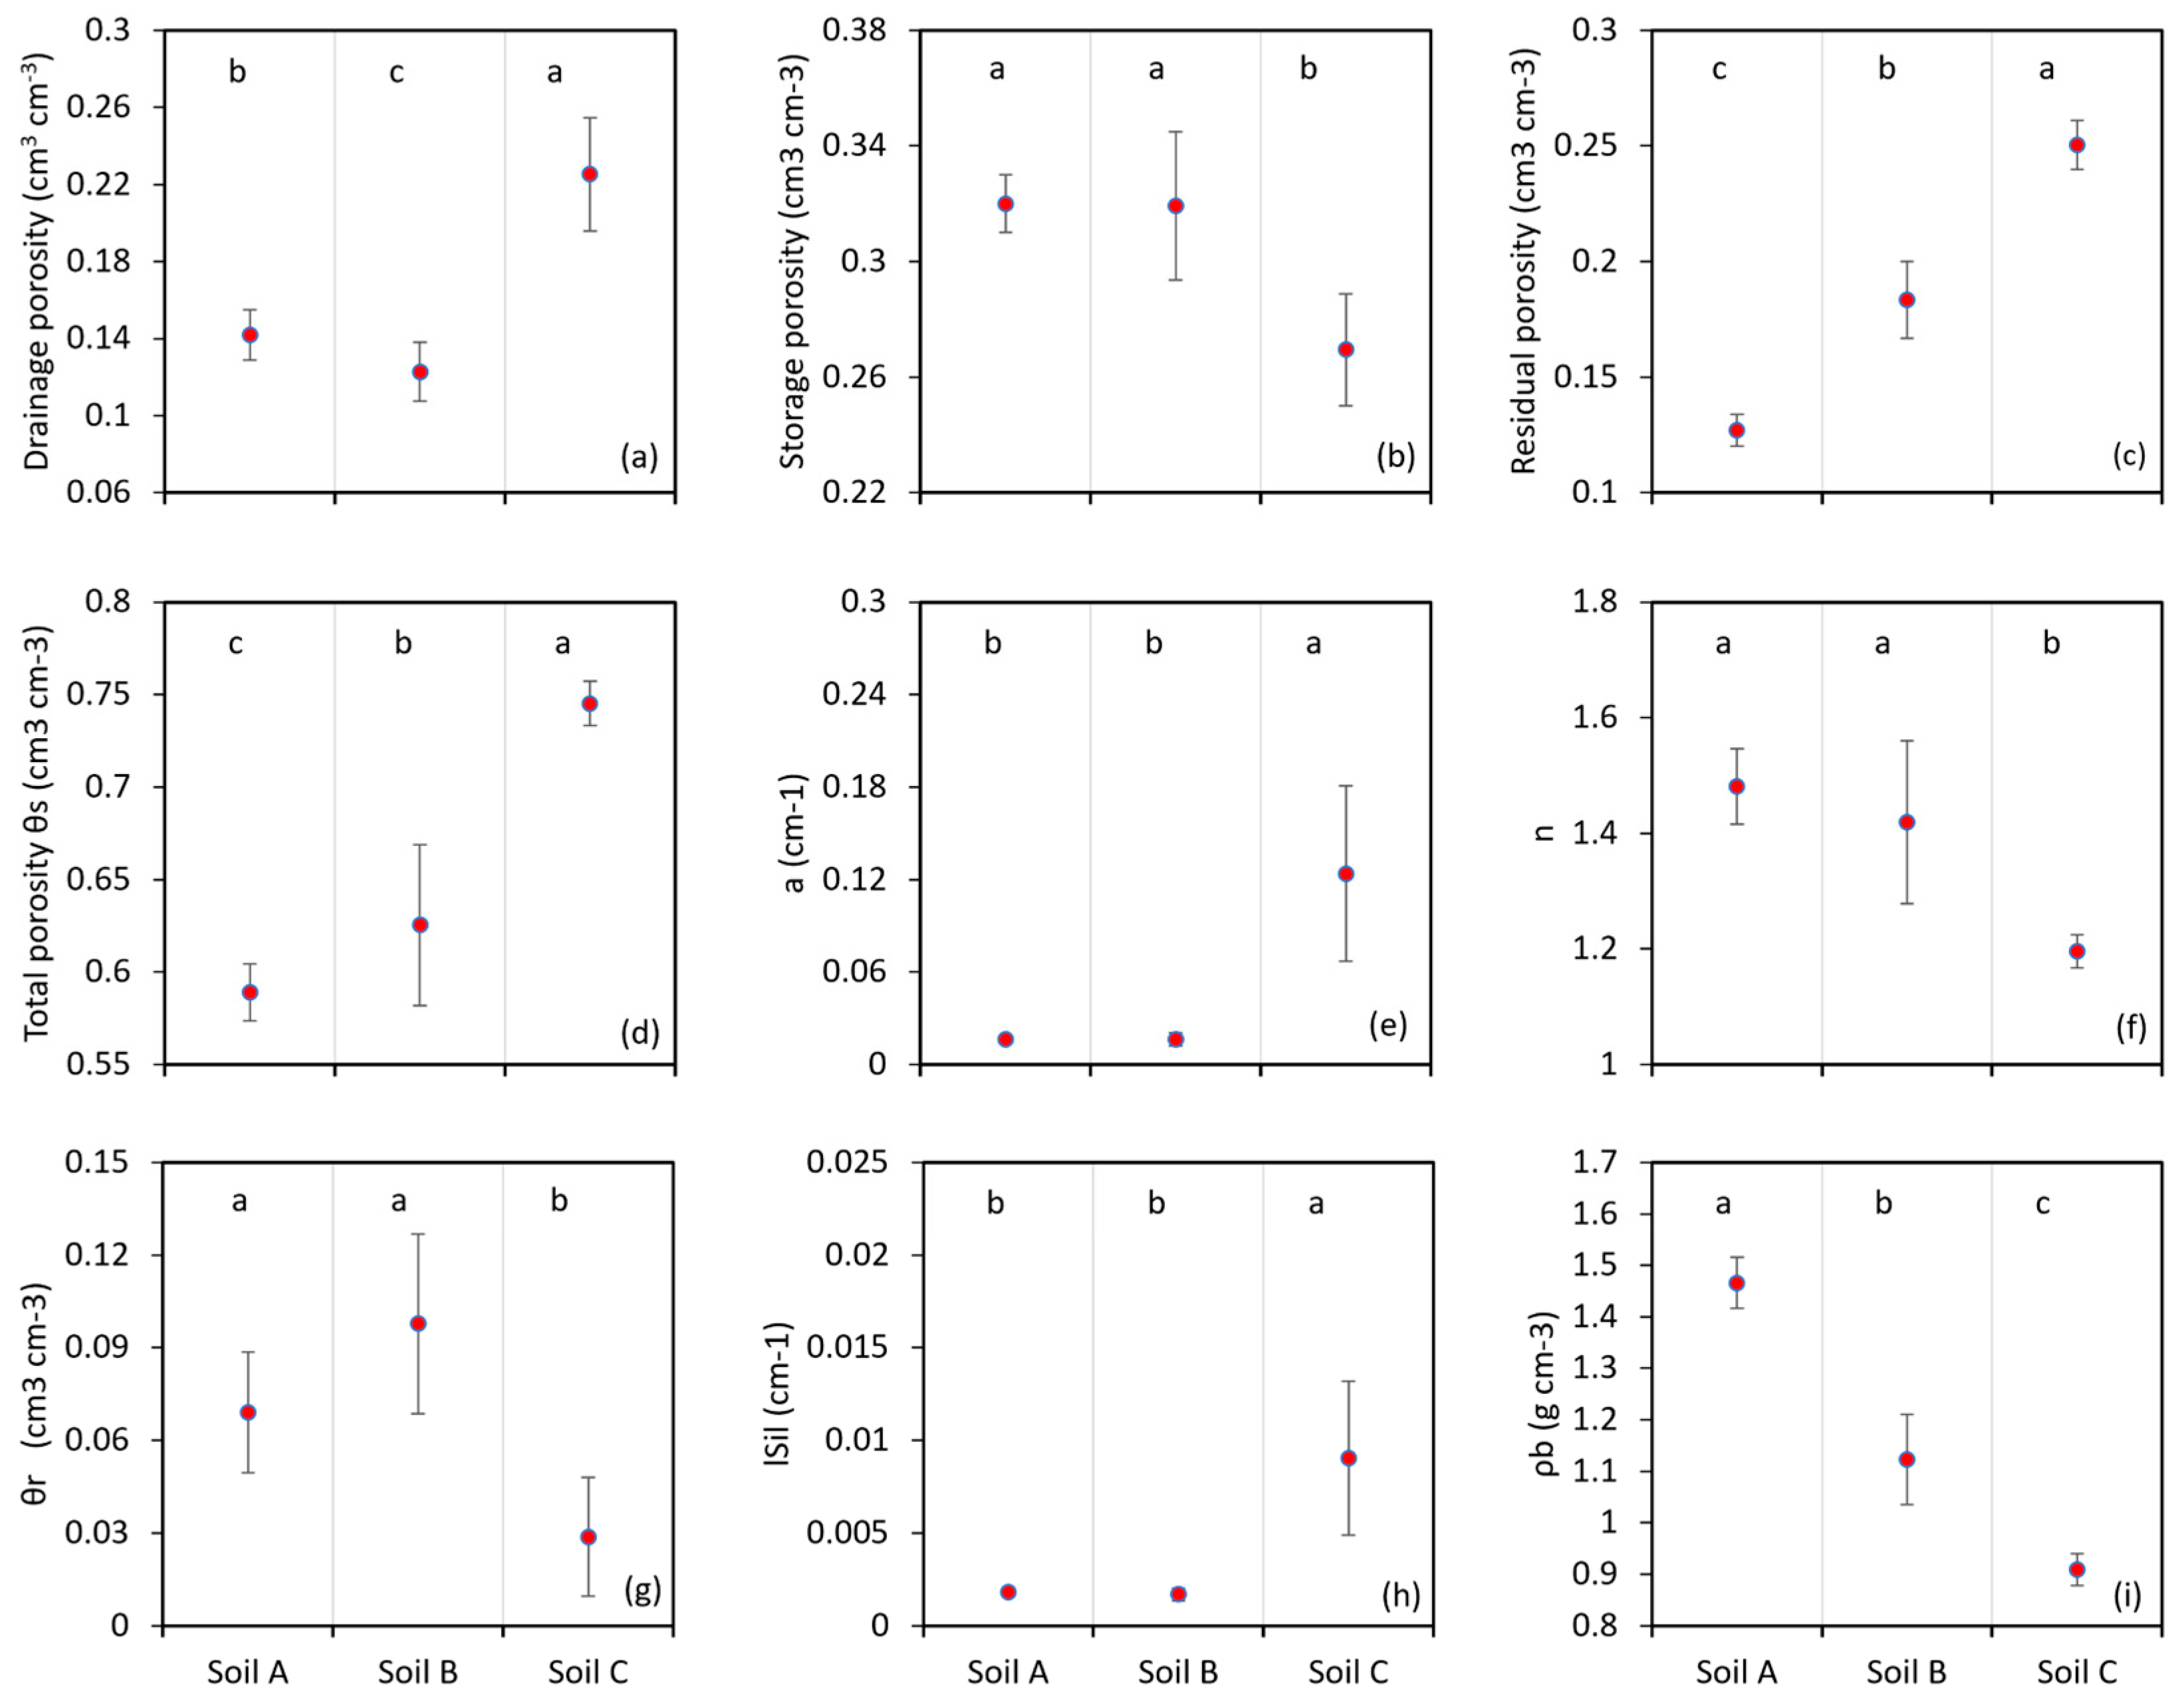
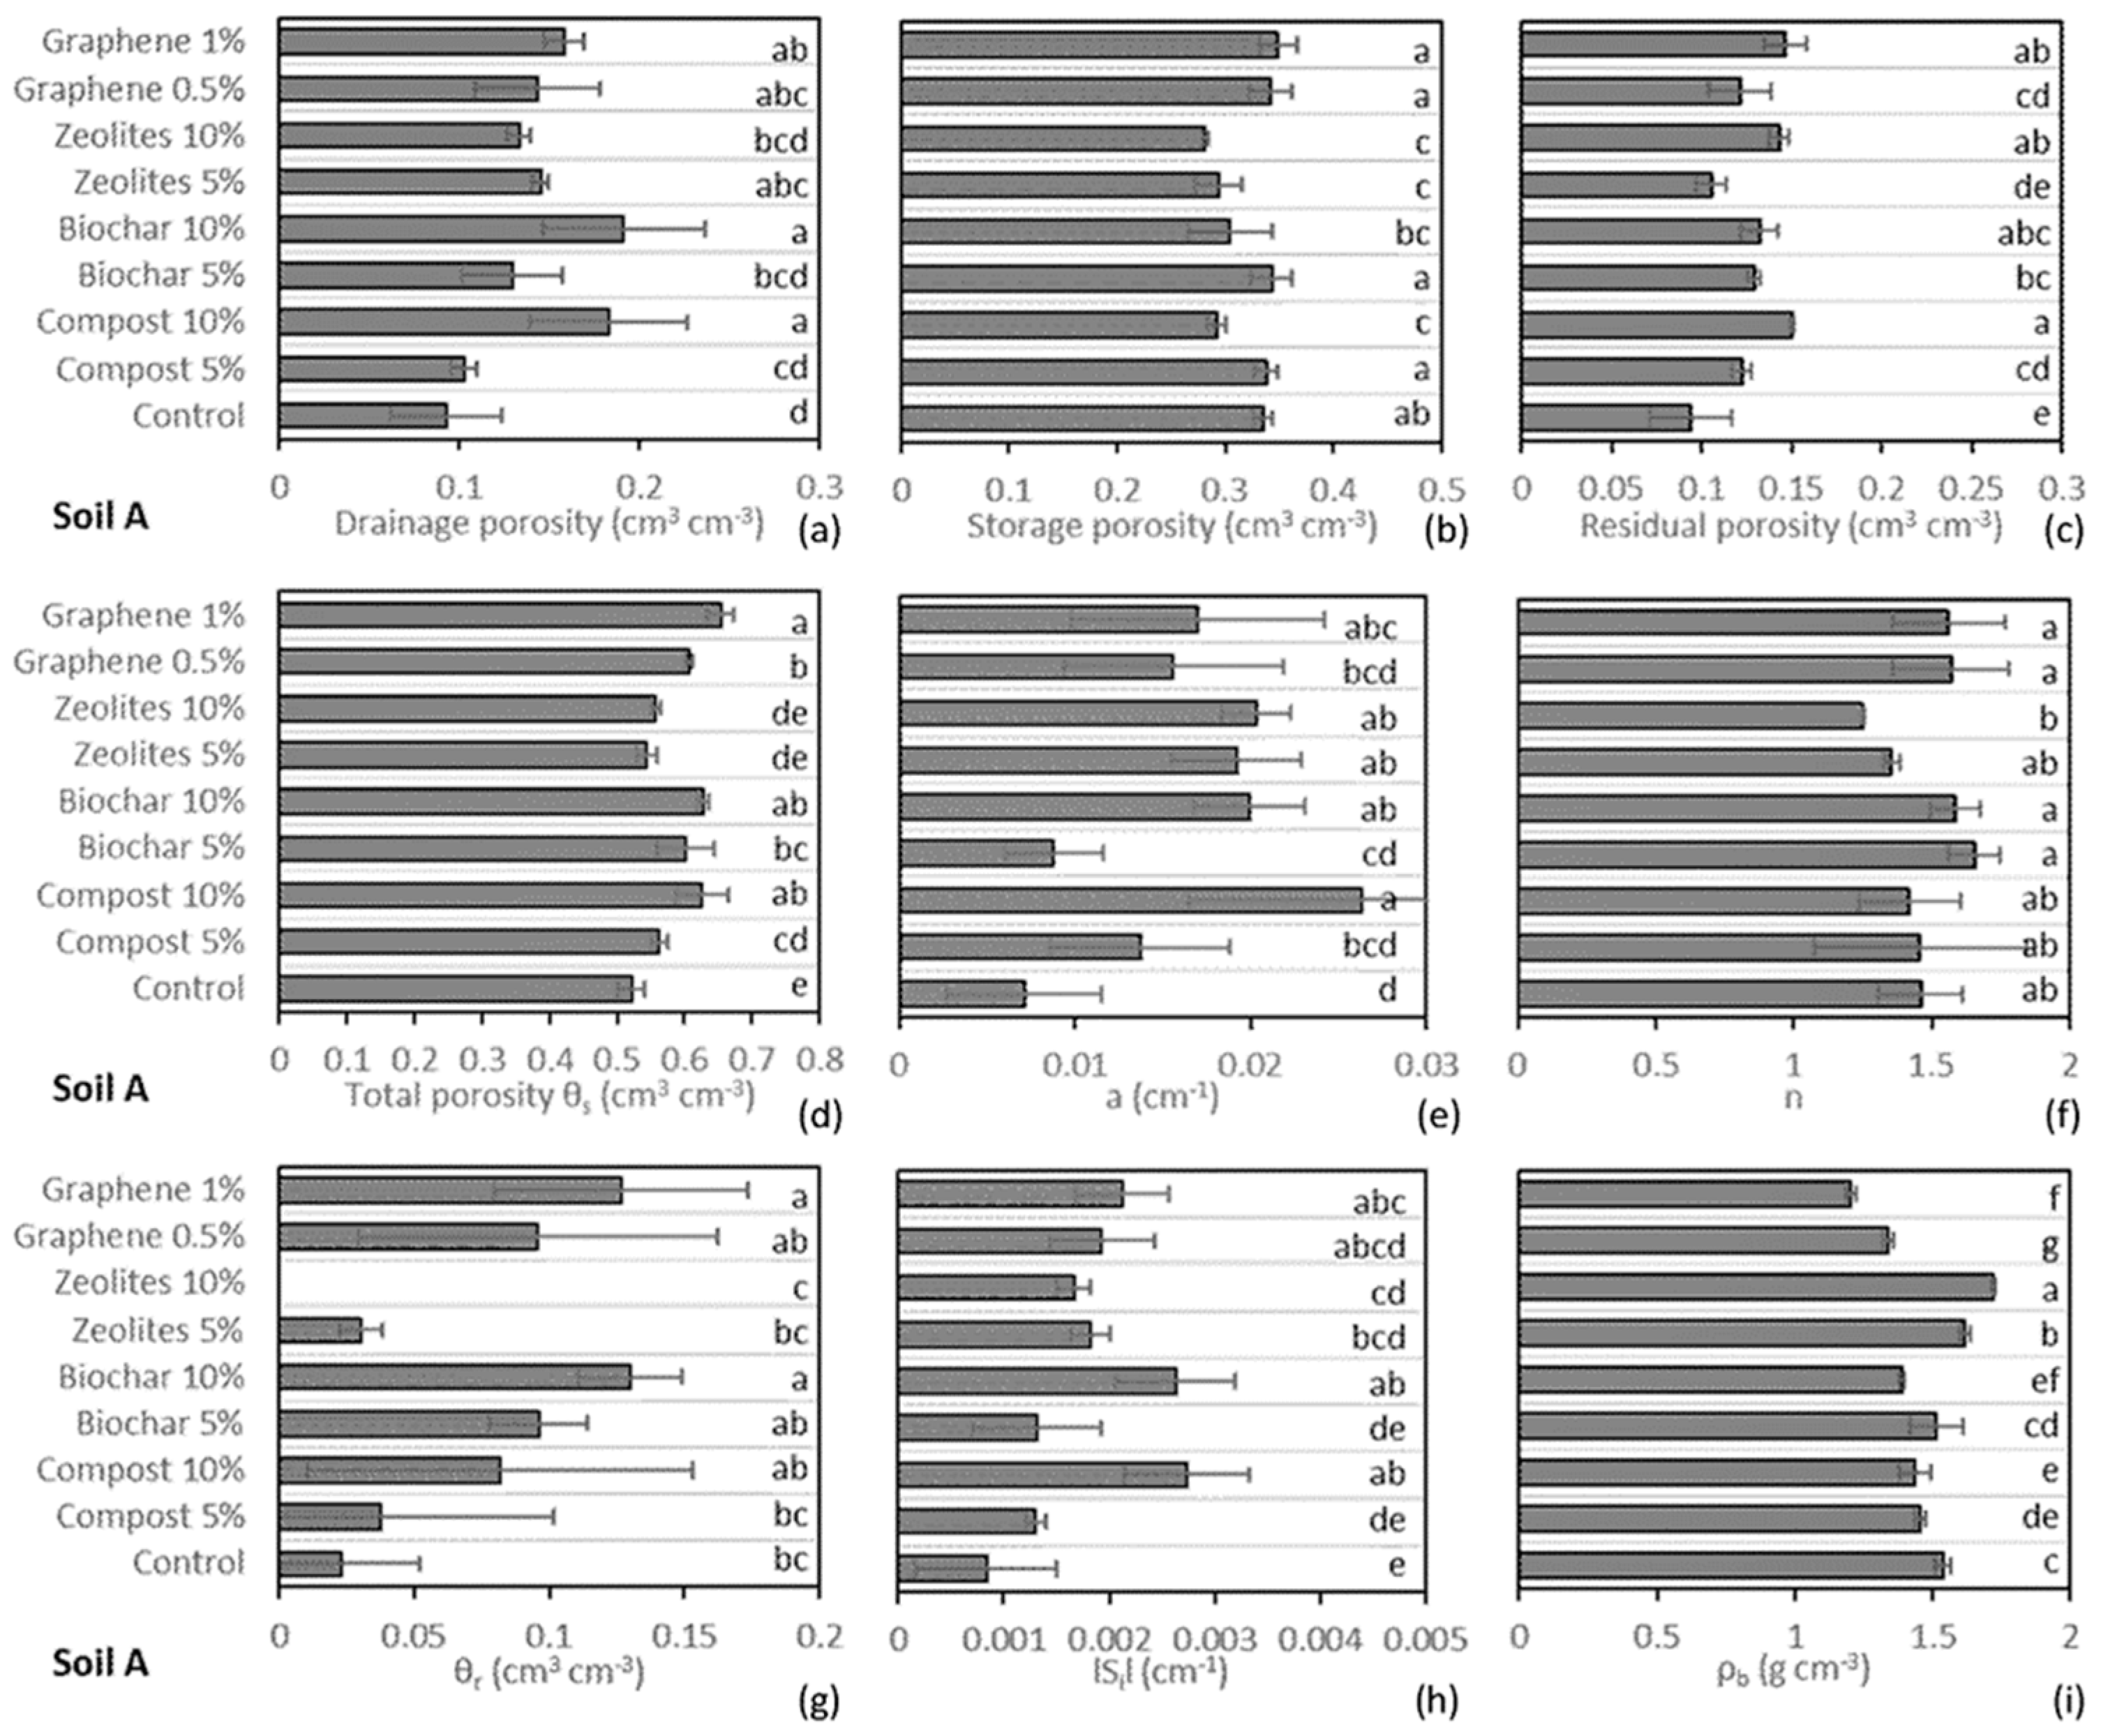
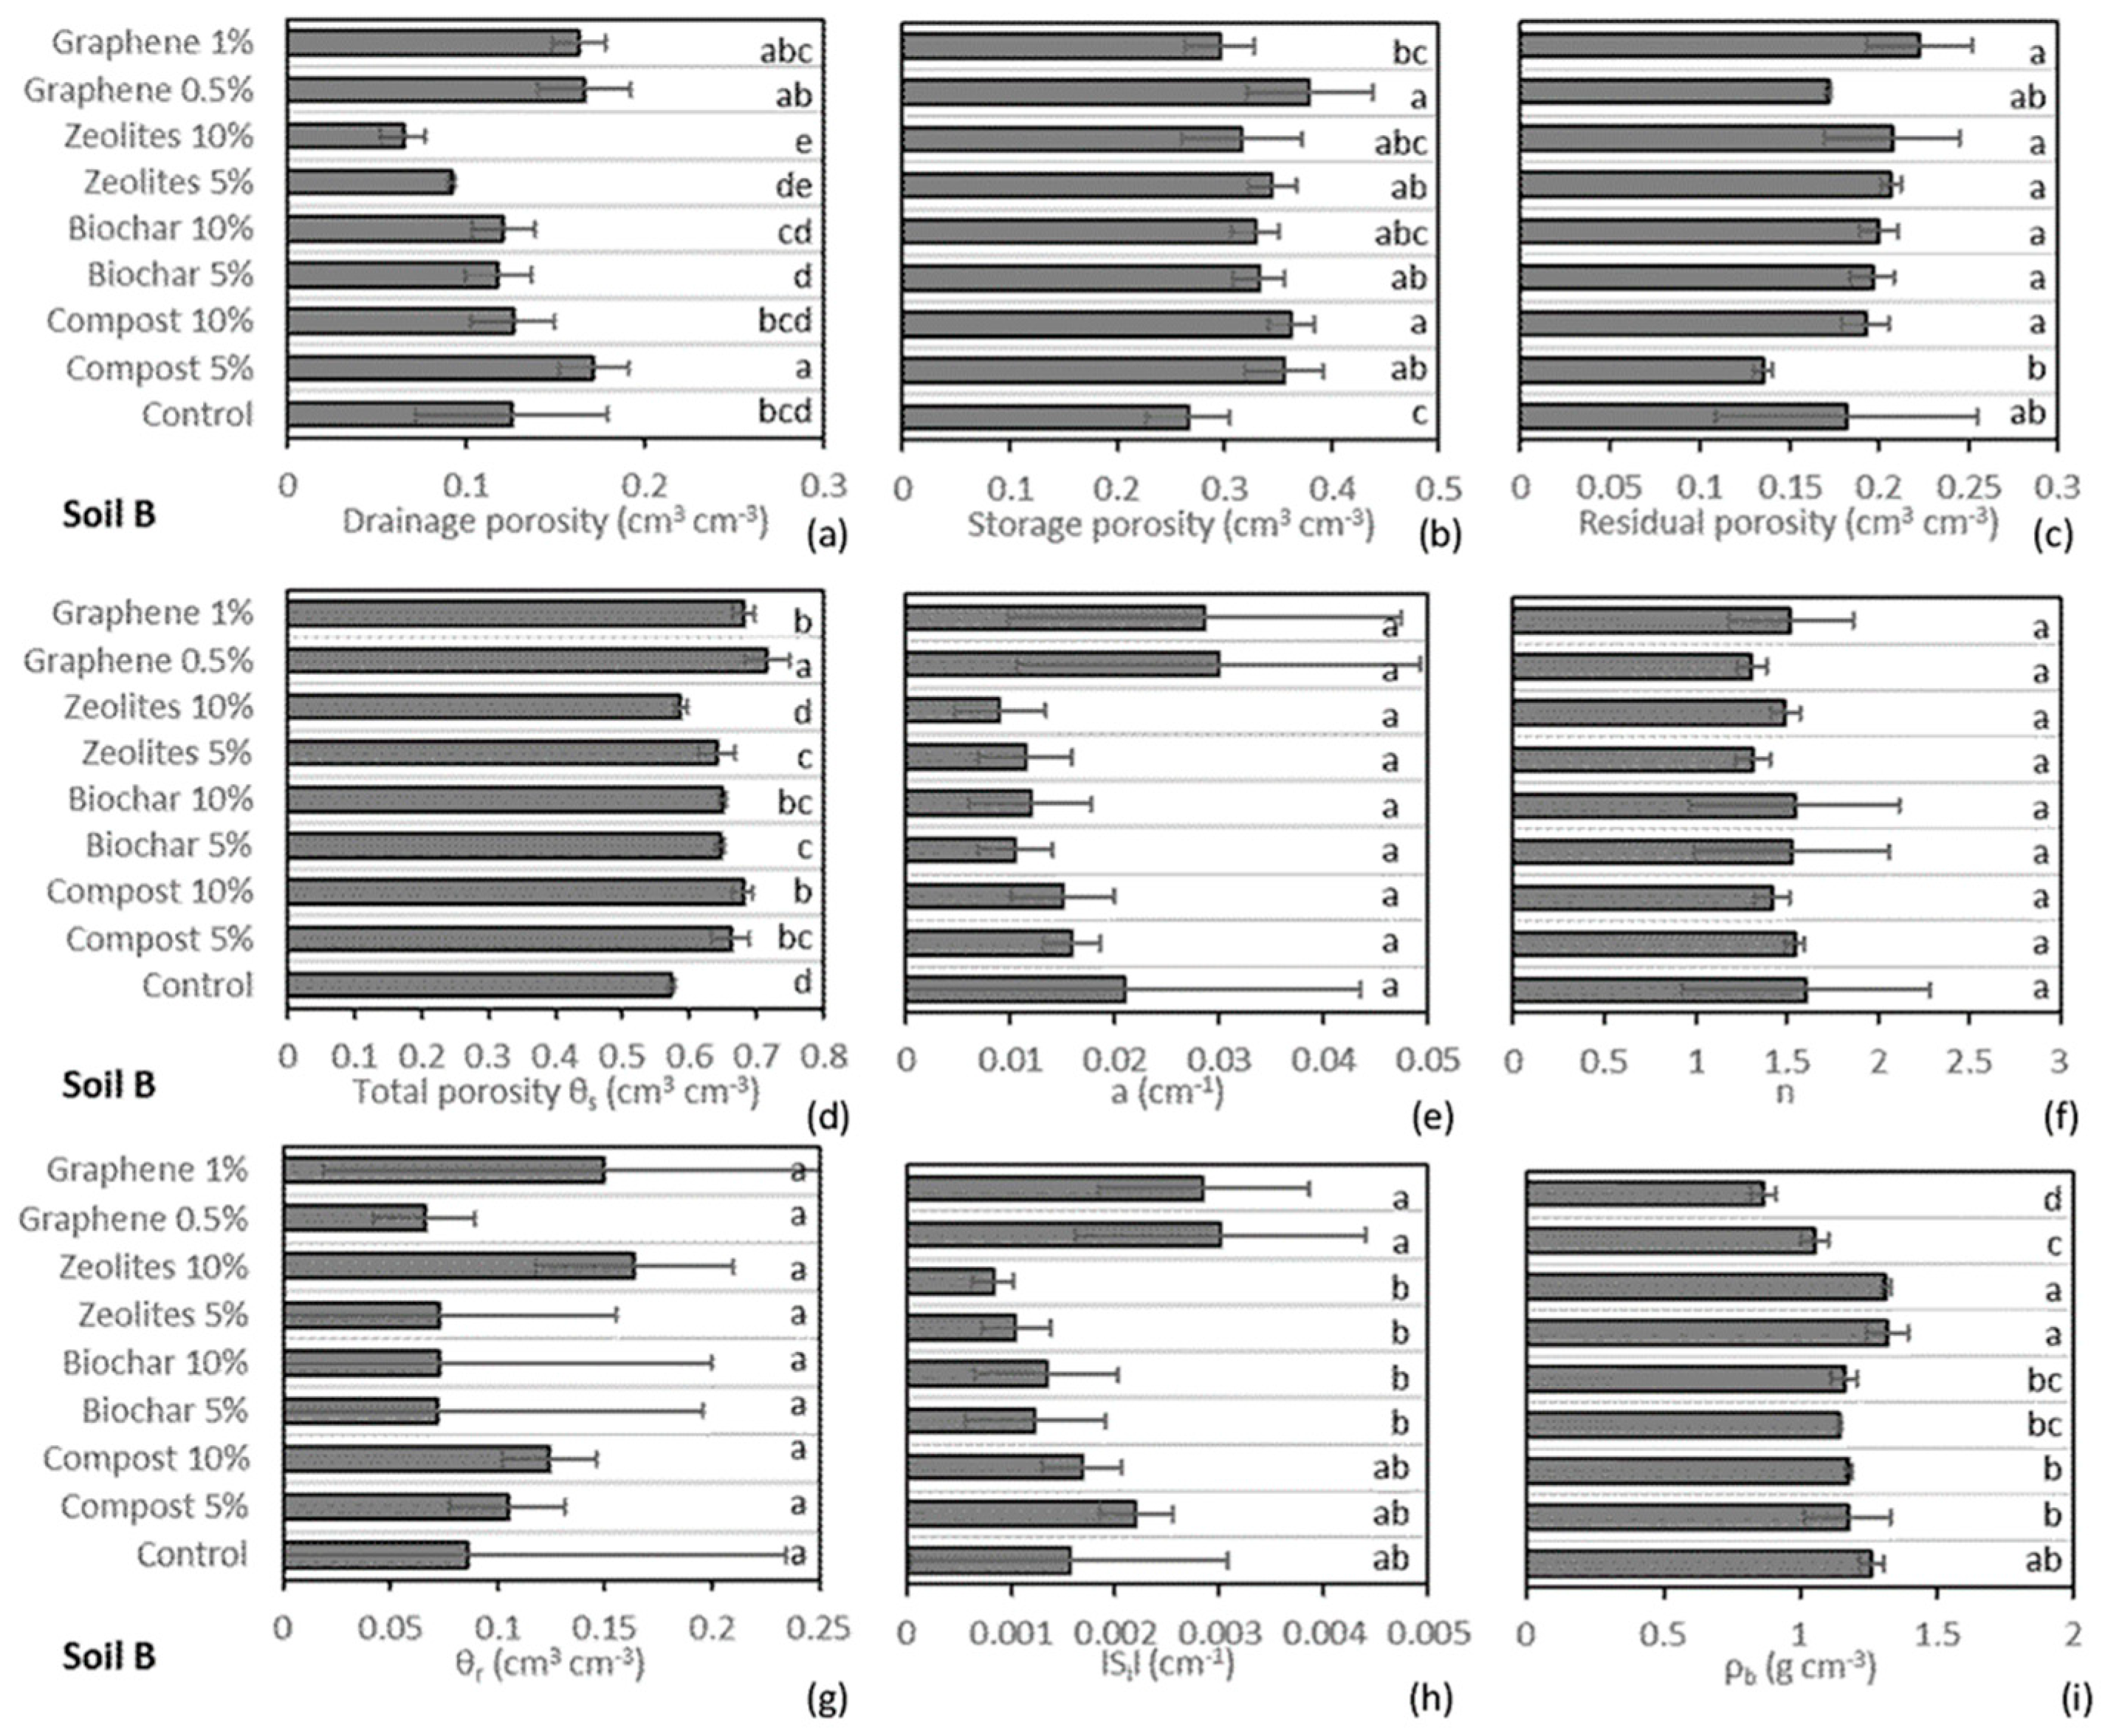
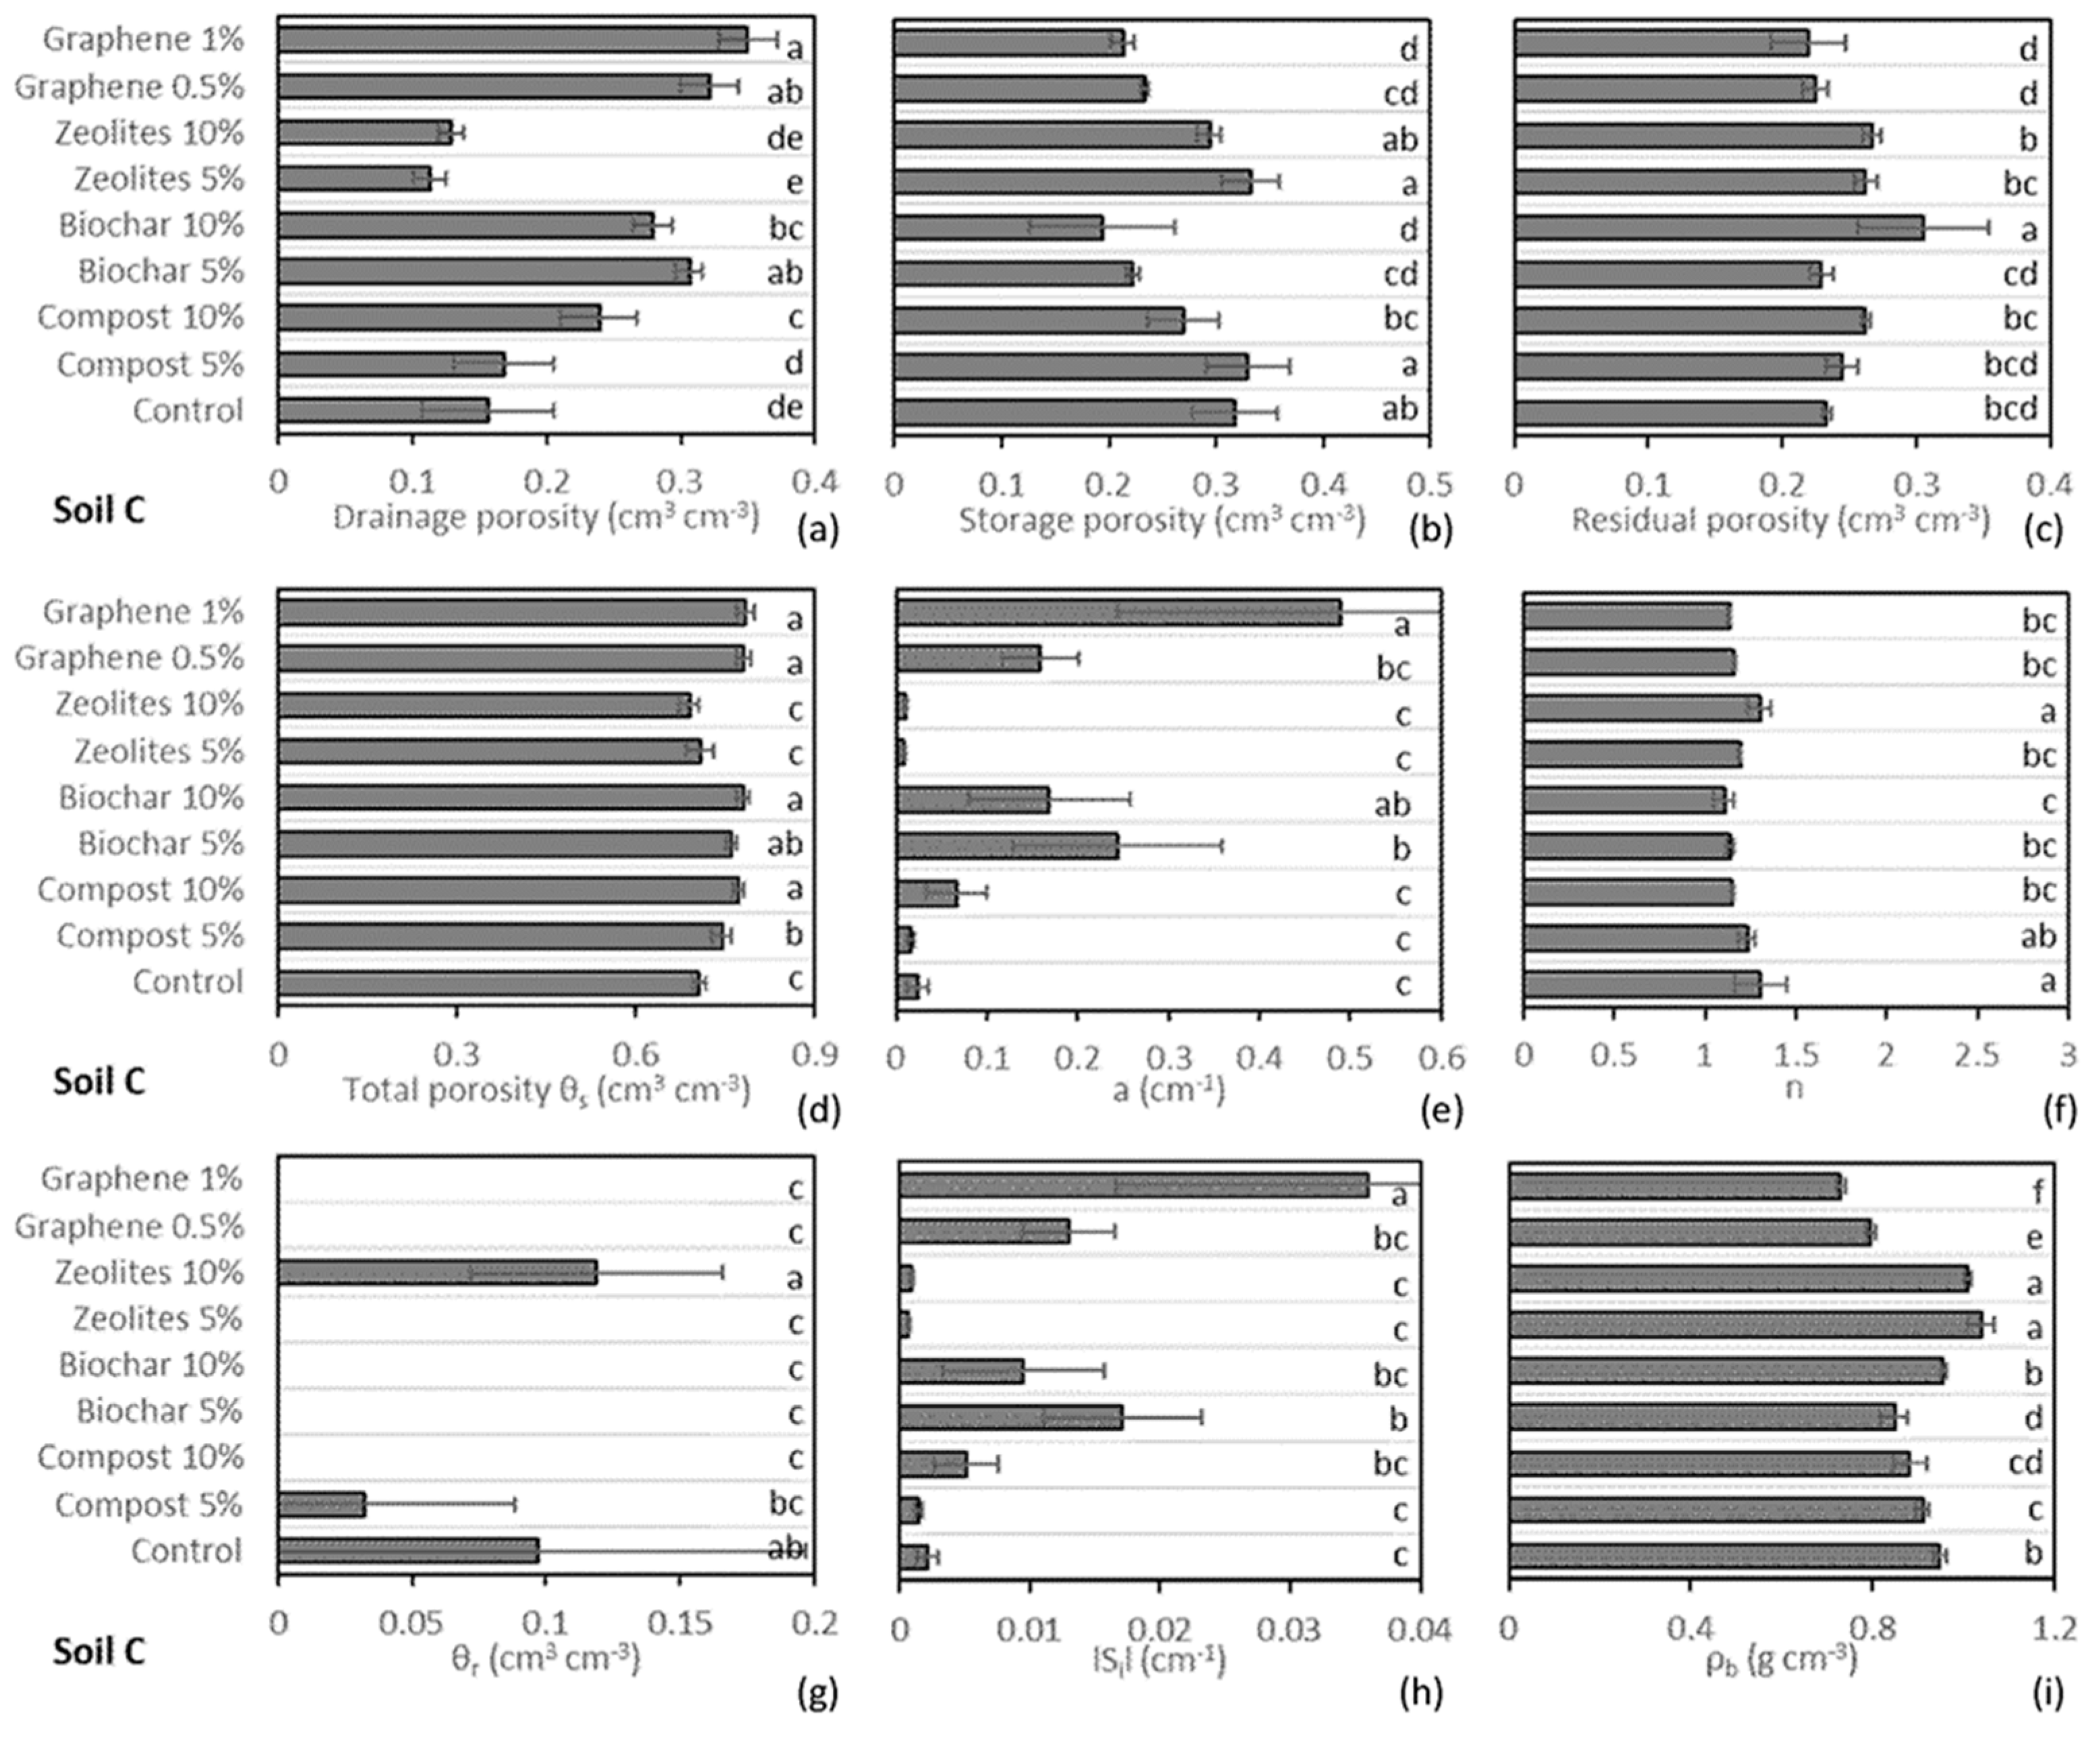
The statistics of two-way ANOVA (soil type, treatment, soil type × treatment) for the aforementioned parameters are given in Table 3, while the LSD comparisons between treatments based on all soils and between soils based on all treatments for each parameter are given in Figure 3 and Figure 4, respectively. The separate mean values of the studied parameters for Soils A, B and C, and the results of the LSD multiple-range tests are given in Figure 5, Figure 6 and Figure 7, respectively (the mean values and their standard deviations are provided in Supplementary Table S1). The results of the two-way ANOVA (Table 3) highlight that the individual soils and treatment effects, and their combinations were significant at the 0.05 level for all the studied parameters except the fitted n and θr van Genuchten parameters, where only the soil effect was statistically significant. For this reason, further discussion regarding the treatments’ effects on these two parameters is not provided.

3.3. Drainage Porosity

For drainage porosity (pores > 30 μm), on the basis of the values of all soils (Figure 3a), graphene treatments showed the largest increase compared to all the other treatments and control. Zeolites was the only soil conditioner that did not show an increase in drainage porosity in both treatments of 5% and 10%, with a slight indication that its use may reduce drainage porosity. The ranking of the remaining soil conditioners based on the drainage porosity enhancement showed the following order for all the soils: graphene > biochar > compost (Figure 3a). The individual effects of the 0.5% and 1% graphene treatments for each soil were more intense in the clayey soil (Soil C), where drainage porosity was more than double than that of the control (Figure 7a). In Soil A, both graphene treatments showed a significant increase in drainage porosity in comparison with the control (Figure 5a), but with lower intensity than that of Soil C. In Soil B, the increase in drainage porosity for both graphene treatments in comparison with the control (Figure 6a) was not statistically significant.

3.4. Storage Porosity

For storage porosity (pores between 30 and 0.2 μm), on the basis of the values of all soils (Figure 3b), graphene treatments did not show statistically significant differences compared to the control. The only treatment that showed a statistically significant increase in storage porosity compared to the control was 5% compost, but this finding was not repeated in the case of 10% compost (Figure 3b). The pair comparisons between the minimal and maximal conditioner doses shown in Figure 3b indicate that the maximal dose of the specific conditioners may lead to a reduction in storage porosity. Regarding their individual effects for each soil, both the zeolite treatments and 10% compost showed a larger decrease in storage porosity in comparison with the control (Figure 5b). The 1% graphene and 10% biochar treatments showed the most pronounced effects in clayey soil (Soil C), where storage porosity showed a reduction of >30% compared to the control (Figure 7b).

3.5. Residual Porosity

For the case of residual porosity (pores < 0.2 μm) on the basis of the values of all soils (Figure 3c), graphene treatments only showed significantly higher values than those of the control for the maximal dose of 1%. Pair comparisons between the small and the large doses of the conditioners shown in Figure 3c indicate that the larger % doses of organic amendments in the soil may lead to an increase in residual porosity. The individual effects of treatments on residual porosity for each soil (Figure 5c, Figure 6c and Figure 7c) tended to be similar to the general mean trends observed in Figure 4c in all soils.

3.6. Saturated Water Content

On the basis of the values of all soils (Figure 3d), graphene treatments showed the largest increase in θs values compared to all the other treatments and control. The 10% zeolite treatment was the only one that did not show an increase in θs, while 5% showed an increase. The ranking of the conditioners based on θs enhancement is as follows: graphene > biochar ~ compost > zeolites (Figure 3d). The individual effects of treatments on θr for each soil (Figure 5d, Figure 6d and Figure 7d) tended to be similar to the general mean trends observed in Figure 3d in all soils.

3.7. Parameter a

For the case of the fitted a parameter of van Genuchten, on the basis of the values of all soils (Figure 3e), graphene treatments showed the largest increase compared to all the other treatments and control. Zeolites were the only soil conditioner that did not show an increase in drainage porosity in either treatment, with a slight indication that its use may reduce the a parameter. The ranking of the conditioners based on the drainage porosity enhancement is as follows: graphene > biochar > compost (Figure 3e). The individual effects of graphene on the a parameter for each soil were intense in all soils (Figure 5e, Figure 6e and Figure 7e), but extremely intense in the clayey soil (Soil C), where the a parameter was more than 20 times larger than that of the control in the case of 1% graphene (Figure 7e). The a parameter is related to the air entry pressure, and its trends due to treatments effects were thereby similar to the changes in drainage porosity in all soils. However, in Soil A, 10% compost showed the largest increase in the a parameter in comparison with the control and the other treatments (Figure 5e), while none of the used treatments showed a significant effect on this parameter in Soil B (Figure 6e).

3.8. WRC Slope at Inflection Point

Graphene treatments showed the largest increase in |Si| compared to the other treatments and control on the basis of the values of all soils (Figure 3h). Zeolites were the only conditioner that did not show an increase in |Si| in either treatment, with a slight indication that its use may reduce Si. The ranking of the conditioners based on |Si| enhancement is as follows: graphene > biochar > compost (Figure 3h). The individual effects of graphene on |Si| were intense for each soil (Figure 5h, Figure 6h and Figure 7h), but extremely intense in the clayey soil (Soil C), where |Si| was more than 15 times larger compared to that of the control in the case of 1% graphene (Figure 7h). The effects of the treatments on |Si| followed similar trends to those of the a parameter and drainage porosity in all soils. Furthermore, in Soil A, 10% biochar and 10% compost showed the largest increase in |Si|, while there were not significant changes in Soil B compared to the control and other treatments.

3.9. Soil Bulk Density

Graphene treatments showed the largest decrease in ρb compared to all the other treatments and control in all soils (Figure 3i). Zeolites were the only soil conditioner that showed a statistically significant increase in ρb in the treatments of 5 and 10%. The ranking of the soil conditioners based on ρb decrease was as follows: graphene > biochar ≈ compost (Figure 3i). The ρb decrease induced by graphene compared to the control was always statistically relevant for all the tested soils (Figure 5i, Figure 6i and Figure 7i). This was clearly due to the extremely low ρb of graphene (Table 2).

4. Discussion

Although graphene was compared to traditional soil improvers in previous studies [23,24,25,31], in this study, for the first time, changes on soil physical characteristics were evaluated after graphene had been applied to the soil. The previous studies were more focused on nutrient leaching and solute transportation without considering the effects on soil porosity, water-retention curve, and soil bulk density.

4.1. WRCs Modeling Issues

One of the key issues raised during result analysis was the modelling of WRCs using the van Genuchten model. During preliminary modelling trials, fitting was performed using all parameters of the van Genuchten equation (θs, a, n, θr) as fitting parameters. This procedure led to a very high R2, and θs values that did not follow the trends of the measured θs due to treatment effects. For this reason, it is strongly recommended to perform the fitting of WRCs only on a, n, and θr when the process includes changes in total porosity.

4.2. Drainage Porosity Changes

The results of this study on graphene as soil improver show its capacity to significantly increase drainage porosity (Figure 3a), which also resulted in a significant increase in the total porosity in all the studied soils (Figure 3d), with the greatest changes found in the drainage porosity of clayey soil (Figure 7a). Graphene affected drainage porosity more than classical soil conditioners do, suggesting its potential use in improving soil aeration and drainage conditions. The latter is important to avoid the formation of dead pores [65], and to mitigate the effects of intensive tillage and wheel traffic that usually lead to the destruction of aggragates and soil compaction [66]. On the other hand, special attention should be paid to loamy agricultural soils since a further increase in their drainage porosity due to graphene incorporation may not be a desirable change because it may lead to greater losses of water and nutrients or even the transport of graphene particles towards groundwater bodies with unknown implications to human health. For this reason, its use for improving soil aeration and drainage conditions could be eventually appropriate only in fine soils when they face drainage problems. Compost and biochar could also be applied on the same type of soils since they showed similar effects on drainage porosity as those of graphene, but of lower magnitude, keeping in mind that the applied graphene dose was one order of magnitude less than those of the other soil conditioners.

4.3. Storage Porosity Changes

Storage porosity, which is also equivalent to the available moisture for plants, showed a general trend where the maximal dose of all conditioners had lower values of storage porosity compared to their respective minimal doses and to the control (Figure 3b; mainly in the clayey soil, Figure 7b). Graphene and biochar maximum doses treatments also showed the highest decrease in storage porosity (Figure 3b), and this may lead to undesirable reduction in storage porosity, consequently reducing the available water for plant growth. Their use could be valuable only in fine textured soils with inherently high storage porosity, which are poorly drained or compacted, where the reduction in storage porosity is counterbalanced with better drainage and aeration conditions. Their employment could be valuable in sandy soils, ordinarily dominated by much larger pores than those of the soil conditioner [67]. This could be the probable reason why graphene did not increase leaching of nutrients and heavy metals in recent studies where it was used as soil amendment in a sandy Calcisol [24,25,31].

4.4. Residual Porosity Changes

A general trend was observed in residual porosity where the maximal dose of all conditioners showed higher values compared to their respective minimal doses and to the control (Figure 3c). It may be desirable to increase the residual porosity in dry environments because the soil may be less susceptible to cracking [68], while it may be useful to microorganisms that have access to microporous water. Specific results about residual porosity may not correspond to a real increase in pores < 0.2 μm because the retention characteristics of organic materials do not follow general capillary theory (except in the case of zeolites, which are not an organic or carbon-based material), given that a significant amount of water is retained in organic constituents [61].

4.5. WRC Slope at Inflection-Point Changes

Figure 8 shows that, using the pooled individual pairs of measurements from all soils and treatments, |Si| had a statistically significant positive correlation with drainage porosity (Figure 8a), a statistically significant negative correlation with storage porosity and ρb (Figure 8b,d) and a nonstatistically significant correlation with residual porosity (Figure 8c). The results of Figure 8a–d show that the |Si| increase was mainly associated with the increase in drainage porosity at the expense of storage porosity, with a parallel reduction in ρb, which is a desirable change for fine soils with drainage or compaction problems, but not for other soils where storage porosity is more important since it is equivalent to the plants’ available soil moisture [69,70]. Moreover, such a change may lead to higher nutrient losses in medium-textured and coarse soils. This finding suggests that |Si| cannot be used as a generalized soil quality index for all soil types, while its high correlation with drainage porosity suggests its use as a drainage and storage capacity index.

4.6. Soil Bulk Density Changes

Graphene showed superior performance in reducing soil ρb. Combining its effect on reducing ρb with the increase in drainage porosity, it could significantly reduce the weight of moist soil, especially in fine soils. The latter is often referred to as a cause of root penetration resistance reduction [71], and used to reduce the energy consumption and efficacy increase in tillage operations [72,73]. The above-mentioned claims are significantly important and should be further assessed in future studies. A reduction in ρb could also be accomplished via compost and biochar incorporation, but with lower magnitude compared to that of graphene.

5. Conclusions

In this study, the effects of graphene incorporation on physical–hydraulic soil properties were evaluated in parallel with traditional soil conditioners (compost, biochar, and zeolites) under controlled laboratory experiments on three differently textured soils. The results showed the following:
  • Graphene promoted the largest increase in drainage porosity, total porosity, and the van Genuchten parameter, and the largest decrease in ρb compared to the other conditioners. The effects of graphene were the highest in the finer soil. Compost and biochar showed similar but lower-magnitude effects compared to those of graphene. Zeolites showed quite different behavior by increasing soil ρb with nonevidential effects on improving the physical–hydraulic soil properties of the specific soils.
  • When the conditioner increased drainage porosity, there was a high probability of a parallel reduction in storage porosity.
  • The S index had a high positive correlation with drainage porosity, and a high negative correlation with storage porosity and ρb.
  • Compost is more suited for soils with low fertility compared to graphene or biochar because the improvement in soil’s hydraulic properties is less significant without the parallel enhancement of soil nutritional status.
  • The overall performance of zeolites on improving hydraulic soil properties was questionable, and they should be used for improving hydraulic soil properties only after testing with the studied soil.
In general, the changes in physical–hydraulic soil properties due to the use of soil conditioners were strongly associated to the particle size and pore size distribution of the initial soil; due to this, prior testing before application is strongly recommended for all soil conditioners. The results of the study are promising for the application of graphene to agricultural soils, suggesting the need for further investigations at the field scale to mitigate drainage and compaction problems of fine soils.

Supplementary Materials

The following supporting information can be downloaded at: https://www.mdpi.com/article/10.3390/w15071297/s1. Table S1: mean ± st. dev. values of different porosity attributes, van Genuchten parameters, and studied Soils A–C under the effects of different doses of the four soil conditioners (compost, biochar, zeolites, and graphene) with multiple-range LSD tests at the 0.05 level and one-way ANOVA results (F-ratio, p-value).

Author Contributions

Conceptualization, methodology, investigation, data curation, writing—original draft preparation, and software, L.A. and V.A.; validation, V.A., M.M. and N.C.; formal analysis, L.A. and C.P.; writing—review and editing, M.M. and N.C.; resources, visualization, supervision, project administration, V.A.; funding acquisition, M.M. All authors have read and agreed to the published version of the manuscript.

Funding

The research activities of Luigi Alessandrino were part of the Environment, Design and Innovation Ph.D. program funded by the V:ALERE Program (VAnviteLli pEr la RicErca) of University of Campania Luigi Vanvitelli.

Institutional Review Board Statement

Not applicable.

Informed Consent Statement

Not applicable.

Data Availability Statement

Datasets are available upon request.

Conflicts of Interest

The authors declare no conflict of interest. The funders had no role in the design of the study; in the collection, analyses, or interpretation of data; in the writing of the manuscript; or in the decision to publish the results.

References

  1. Chen, J.; Chen, J.-Z.; Tan, M.-Z.; Gong, Z.-T. Soil degradation: A global problem endangering sustainable development. J. Geogr. Sci. 2002, 12, 243–252. [Google Scholar] [CrossRef]
  2. Blum, W.E.H. Physical Degradation of Soils, Risks and Threats. In Encyclopedia of Agrophysics; Gliński, J., Horabik, J., Lipiec, J., Eds.; Springer: Dordrecht, The Netherlands, 2011; pp. 562–563. [Google Scholar] [CrossRef]
  3. Brevik, E.C. The Potential Impact of Climate Change on Soil Properties and Processes and Corresponding Influence on Food Security. Agriculture 2013, 3, 398–417. [Google Scholar] [CrossRef] [Green Version]
  4. Foley, J.A.; Ramankutty, N.; Brauman, K.A.; Cassidy, E.S.; Gerber, J.S.; Johnston, M.; Mueller, N.D.; O’Connell, C.; Ray, D.K.; West, P.C.; et al. Solutions for a cultivated planet. Nature 2011, 478, 337–342. [Google Scholar] [CrossRef] [Green Version]
  5. Bindraban, P.S.; van der Velde, M.; Ye, L.; van den Berg, M.; Materechera, S.; Kiba, D.I.; Tamene, L.; Ragnarsdóttir, K.V.; Jongschaap, R.; Hoogmoed, M.; et al. Assessing the impact of soil degradation on food production. Curr. Opin. Environ. Sustain. 2012, 4, 478–488. [Google Scholar] [CrossRef]
  6. Ramazan, M.; Khan, G.D.; Hanif, M.; Ali, S. Impact of soil compaction on root length and yield of corn (Zea mays) under irrigated condition. Middle East J. Sci. Res. 2012, 11, 382–385. [Google Scholar]
  7. Osman, K.T. Physical Deterioration of Soil. In Soil Degradation, Conservation and Remediation; Springer: Dordrecht, The Netherlands, 2014; pp. 45–67. [Google Scholar] [CrossRef]
  8. Karlen, D.L.; Mausbach, M.J.; Doran, J.W.; Cline, R.G.; Harris, R.F.; Schuman, G.E. Soil Quality: A Concept, Definition, and Framework for Evaluation (A Guest Editorial). Soil Sci. Soc. Am. J. 1997, 61, 4–10. [Google Scholar] [CrossRef] [Green Version]
  9. Richard, G.; Cousin, I.; Sillon, J.F.; Bruand, A.; Guérif, J. Effect of compaction on the porosity of a silty soil: Influence on unsaturated hydraulic properties. Eur. J. Soil Sci. 2001, 52, 49–58. [Google Scholar] [CrossRef]
  10. Startsev, A.D.; McNabb, D.H. Skidder Traffic Effects on Water Retention, Pore-Size Distribution, and van Genuchten Parameters of Boreal Forest Soils. Soil Sci. Soc. Am. J. 2001, 65, 224–231. [Google Scholar] [CrossRef]
  11. Aschonitis, V.G.; Kostopoulou, S.K.; Antonopoulos, V.Z. Methodology to Assess the Effects of Rice Cultivation Under Flooded Conditions on van Genuchten’s Model Parameters and Pore Size Distribution. Transp. Porous Media 2012, 91, 861–876. [Google Scholar] [CrossRef]
  12. Shukla, M.K.; Lal, R.; Ebinger, M. Determining soil quality indicators by factor analysis. Soil Till. Res. 2006, 87, 194–204. [Google Scholar] [CrossRef]
  13. Muñoz-Rojas, M. Soil quality indicators: Critical tools in ecosystem restoration. Curr. Opin. Environ. Sci. Health 2018, 5, 47–52. [Google Scholar] [CrossRef]
  14. Stepniewski, W.; Glinski, J.; Ball, B.C. Effects of compaction on soil aeration properties. In Soil Compaction in Crop Production; Soane, B.D., Van Ouwerkerk, C., Eds.; Elsevier: New York, NY, USA, 1994; pp. 167–169. [Google Scholar]
  15. Brussaard, L.; Van Faassen, H.G. Effects of compaction on soil biota and soil biological processes. In Soil Compaction in Crop Production; Soane, B.D., Van Ouwerkerk, C., Eds.; Elsevier: New York, NY, USA, 1994; pp. 215–235. [Google Scholar]
  16. Azizsoltani, E.; Honarjoo, N.; Ayoubi, S. How Soil Pore Distribution Could Help in Soil Quality Studies as an Appropriate Indicator. Eurasian Soil Sci. 2009, 52, 654–660. [Google Scholar] [CrossRef]
  17. Dexter, A.R. Soil physical quality: Part I. Theory, effects of soil texture, density, and organic matter, and effects on root growth. Geoderma 2004, 120, 201–214. [Google Scholar] [CrossRef]
  18. Mukherjee, A.; Lal, R.; Zimmerman, A.R. Effects of biochar and other amendments on the physical properties and greenhouse gas emissions of an artificially degraded soil. Sci. Total Environ. 2014, 487, 26–36. [Google Scholar] [CrossRef]
  19. Atkinson, C.J.; Fitzgerald, J.D.; Hipps, N.A. Potential mechanisms for achieving agricultural benefits from biochar application to temperate soils: A review. Plant Soil 2010, 337, 1–18. [Google Scholar] [CrossRef]
  20. Fitch, B.C.; Chong, S.K.; Arosemena, J.; Theseira, G.W. Effects of a Conditioner on Soil Physical Properties. Soil Sci. Soc. Am. J. 1989, 53, 1536–1539. [Google Scholar] [CrossRef]
  21. Kavitha, B.; Reddy, P.V.L.; Kim, B.; Lee, S.S.; Pandey, S.K.; Kim, K.-H. Benefits and limitations of biochar amendment in agricultural soils: A review. J. Environ. Manag. 2018, 227, 146–154. [Google Scholar] [CrossRef]
  22. Sivapalan, S. Benefits of treating a sandy soil with a crosslinked-type polyacrylamide. Aust. J. Exp. Agric. 2006, 46, 579–584. [Google Scholar] [CrossRef] [Green Version]
  23. Alessandrino, L.; Colombani, N.; Aschonitis, V.G.; Mastrocicco, M. Nitrate and Dissolved Organic Carbon Release in Sandy Soils at Different Liquid/Solid Ratios Amended with Graphene and Classical Soil Improvers. Appl. Sci. 2022, 12, 6220. [Google Scholar] [CrossRef]
  24. Alessandrino, L.; Colombani, N.; Eusebi, A.L.; Aschonitis, V.; Mastrocicco, M. Testing graphene versus classical soil improvers in a sandy calcisol. Catena 2022, 208, 105754. [Google Scholar] [CrossRef]
  25. Alessandrino, L.; Eusebi, A.L.; Aschonitis, V.; Mastrocicco, M.; Colombani, N. Variation of the hydraulic properties in sandy soils induced by the addition of graphene and classical soil improvers. J. Hydrol. 2022, 612, 128256. [Google Scholar] [CrossRef]
  26. Aggelides, S.M.; Londra, P.A. Effects of compost produced from town wastes and sewage sludge on the physical properties of a loamy and a clay soil. Bioresour. Technol. 2000, 71, 253–259. [Google Scholar] [CrossRef]
  27. Colombani, N.; Mastrocicco, M.; Di Giuseppe, D.; Faccini, B.; Coltorti, M. Batch and column experiments on nutrient leaching in soils amended with Italian natural zeolitites. Catena 2015, 127, 64–71. [Google Scholar] [CrossRef]
  28. Colombani, N.; Gervasio, M.P.; Castaldelli, G.; Mastrocicco, M. Soil conditioners effects on hydraulic properties, leaching processes and denitrification on a silty-clay soil. Sci. Total Environ. 2020, 733, 139342. [Google Scholar] [CrossRef]
  29. Faccini, B.; Di Giuseppe, D.; Ferretti, G.; Coltorti, M.; Colombani, N.; Mastrocicco, M. Natural and NH4+-enriched zeolitite amendment effects on nitrate leaching from a reclaimed agricultural soil (Ferrara Province, Italy). Nutr. Cycling Agroecosyst. 2018, 110, 327–341. [Google Scholar] [CrossRef]
  30. Alessandrino, L.; Gervasio, M.P.; Vincenzi, F.; Colombani, N.; Castaldelli, G.; Mastrocicco, M. Nutrients and carbon fate in two lowland contrasting soils amended with compost. Catena 2021, 206, 105493. [Google Scholar] [CrossRef]
  31. Alessandrino, L.; Colombani, N.; Aschonitis, V.; Eusebi, A.L.; Mastrocicco, M. Performance of graphene and traditional soil improvers in limiting nutrients and heavy metals leaching from a sandy Calcisol. Sci. Total Environ. 2023, 858, 159806. [Google Scholar] [CrossRef] [PubMed]
  32. Ding, Y.; Zhu, S.; Pan, R.; Bu, J.; Liu, Y.; Ding, A. Effects of Rice Husk Biochar on Nitrogen Leaching from Vegetable Soils by 15N Tracing Approach. Water 2022, 14, 3563. [Google Scholar] [CrossRef]
  33. Wang, D.; Lin, J.Y.; Sayre, J.M.; Schmidt, R.; Fonte, S.J.; Rodrigues, J.L.M.; Scow, K.M. Compost amendment maintains soil structure and carbon storage by increasing available carbon and microbial biomass in agricultural soil—A six-year field study. Geoderma 2022, 427, 116117. [Google Scholar] [CrossRef]
  34. Ghorbani, M.; Amirahmadi, E.; Konvalina, P.; Moudrý, J.; Bárta, J.; Kopecký, M.; Teodorescu, R.I.; Bucur, R.D. Comparative Influence of Biochar and Zeolite on Soil Hydrological Indices and Growth Characteristics of Corn (Zea mays L.). Water 2022, 14, 3506. [Google Scholar] [CrossRef]
  35. Xie, J.; Wang, Z.; Wang, Y.; Xiang, S.; Xiong, Z.; Gao, M. Manure combined with biochar reduces rhizosphere nitrification potential and amoA gene abundance of ammonia-oxidizing microorganisms in acid purple soil. Appl. Soil Ecol. 2023, 181, 104660. [Google Scholar] [CrossRef]
  36. Godlewska, P.; Schmidt, H.P.; Ok, Y.S.; Oleszczuk, P. Biochar for composting improvement and contaminants reduction. A review. Bioresour. Technol. 2017, 246, 193–202. [Google Scholar] [CrossRef] [PubMed]
  37. Xiao, R.; Awasthi, M.K.; Li, R.; Park, J.; Pensky, S.M.; Wang, Q.; Wang, J.J.; Zhang, Z. Recent developments in biochar utilization as an additive in organic solid waste composting: A review. Bioresour. Technol. 2017, 246, 203–213. [Google Scholar] [CrossRef] [PubMed]
  38. Sanchez-Monedero, M.A.; Cayuela, M.L.; Roig, A.; Jindo, K.; Mondini, C.; Bolan, N. Role of biochar as an additive in organic waste composting. Bioresour. Technol. 2017, 247, 1155–1164. [Google Scholar] [CrossRef]
  39. Chan, K.Y.; Van Zwieten, L.; Meszaros, I.; Downie, A.; Joseph, S. Agronomic values of greenwaste biochar as a soil amendment. Soil Res. 2007, 45, 629–634. [Google Scholar] [CrossRef]
  40. Hardie, M.; Clothier, B.; Bound, S.; Oliver, G.; Close, D. Does biochar influence soil physical properties and soil water availability? Plant Soil 2014, 376, 347–361. [Google Scholar] [CrossRef]
  41. Agegnehu, G.; Srivastava, A.K.; Bird, M.I. The role of biochar and biochar-compost in improving soil quality and crop performance: A review. Appl. Soil Ecol. 2017, 119, 156–170. [Google Scholar] [CrossRef]
  42. Kranz, C.N.; McLaughlin, R.A.; Johnson, A.; Miller, G.; Heitman, J.L. The effects of compost incorporation on soil physical properties in urban soils—A concise review. J. Environ. Manag. 2020, 261, 110209. [Google Scholar] [CrossRef]
  43. Albiach, R.; Canet, R.; Pomares, F.; Ingelmo, F. Microbial biomass content and enzymatic activities after the application of organic amendments to a horticultural soil. Bioresour. Technol. 2000, 75, 43–48. [Google Scholar] [CrossRef]
  44. Bauduin, M.; Delcarte, E.; Impens, R. Agronomic valorization of municipal waste composts. Acta Hortic. 1985, 172, 117–124. [Google Scholar] [CrossRef]
  45. Nakhli, S.A.A.; Delkash, M.; Bakhshayesh, B.E.; Kazemian, H. Application of Zeolites for Sustainable Agriculture: A Review on Water and Nutrient Retention. Water Air Soil Pollut. 2017, 228, 464. [Google Scholar] [CrossRef]
  46. Geim, A.K.; Novoselov, K.S. The rise of graphene. Nat. Mater. 2007, 6, 183–191. [Google Scholar] [CrossRef]
  47. Randviir, E.P.; Brownson, D.A.C.; Banks, C.E. A decade of graphene research: Production, applications and outlook. Mater. Today 2014, 17, 426–432. [Google Scholar] [CrossRef]
  48. Korhonen, J.; Honkasalo, A.; Seppälä, J. Circular Economy: The Concept and its Limitations. Ecol. Econ. 2018, 143, 37–46. [Google Scholar] [CrossRef]
  49. Bouyoucos, G.J. Hydrometer Method Improved for Making Particle Size Analyses of Soils 1. Agron. J. 1962, 54, 464–465. [Google Scholar] [CrossRef]
  50. Rhoades, J.D. Salinity: Electrical Conductivity and Total Dissolved Solids. In Methods of Soil Analysis; John Wiley & Sons, Ltd.: New York, NY, USA, 1996; pp. 417–435. [Google Scholar] [CrossRef]
  51. Loeppert, R.H.; Suarez, D.L. Carbonate and Gypsum. In Methods of Soil Analysis; John Wiley & Sons, Ltd.: New York, NY, USA, 1996; pp. 437–474. [Google Scholar] [CrossRef]
  52. Bremner, J.M.; Jenkinson, D.S. Determination of organic carbon in soil. J. Soil Sci. 1960, 11, 394–402. [Google Scholar] [CrossRef]
  53. Loomis, G.A. Grain size of whiteware clays as determined by the andreasen pipette. J. Am. Ceram. Soc. 1938, 21, 393–399. [Google Scholar] [CrossRef]
  54. Allison, L.E. Organic Carbon. In Methods of Soil Analysis; John Wiley & Sons, Ltd.: New York, NY, USA, 1965; pp. 1367–1378. [Google Scholar] [CrossRef]
  55. Sikora, L.J.; Stott, D.E. Soil Organic Carbon and Nitrogen. In Methods for Assessing Soil Quality; John Wiley & Sons, Ltd.: New York, NY, USA, 1997; pp. 157–167. [Google Scholar] [CrossRef]
  56. Aran, D.; Maul, A.; Masfaraud, J.F. A spectrophotometric measurement of soil cation exchange capacity based on cobaltihexamine chloride absorbance. C. R. Geosci. 2008, 340, 865–871. [Google Scholar] [CrossRef]
  57. Klute, A. Water Retention: Laboratory Methods. In Methods of Soil Analysis; John Wiley & Sons, Ltd.: New York, NY, USA, 1986; pp. 635–662. [Google Scholar] [CrossRef]
  58. Schelle, H.; Heise, L.; Jänicke, K.; Durner, W. Water retention characteristics of soils over the whole moisture range: A comparison of laboratory methods. Eur. J. Soil Sci. 2013, 64, 814–821. [Google Scholar] [CrossRef]
  59. Braudeau, E.; Hovhannissian, G.; Assi, A.T.; Mohtar, R.H. Soil water thermodynamic to unify water retention curve by pressure plates and tensiometer. Front. Earth Sci. 2014, 2, 30. [Google Scholar] [CrossRef] [Green Version]
  60. Cameron, C.K.; Buchan, D.G. Porosity and pore size distribution. In Encyclopedia of Soil Science, 2nd ed.; Lal, R., Ed.; Taylor and Francis Group: Boca Raton, FL, USA, 2006; Volume 2, pp. 1350–1353. [Google Scholar]
  61. Aschonitis, V.G.; Antonopoulos, V.Z.; Lekakis, E.H.; Litskas, V.D.; Kotsopoulos, S.A.; Karamouzis, D.N. Estimation of field capacity for aggregated soils using changes of the water retention curve under the effects of compaction. Eur. J. Soil Sci. 2013, 64, 688–698. [Google Scholar] [CrossRef]
  62. Aschonitis, V.G.; Salemi, E.; Colombani, N.; Mastrocicco, M. Comparison of Different “S-index” Expressions to Evaluate the State of Physical Soil Properties. Geotech. Geol. Eng. 2015, 33, 1055–1066. [Google Scholar] [CrossRef]
  63. van Genuchten, M.T. A Closed-form Equation for Predicting the Hydraulic Conductivity of Unsaturated Soils. Soil Sci. Soc. Am. J. 1980, 44, 892–898. [Google Scholar] [CrossRef] [Green Version]
  64. van Genuchten, M.T.; Leij, F.J.; Yates, S.R. The RETC Code for Quantifying the Hydraulic Functions of Unsaturated Soils; U.S. Salinity Laboratory, U.S. Department of Agriculture, Agricultural Research Service: Riverside, CA, USA, 1991; p. 93, 9250 1, IAG-DW12933934.
  65. Bouma, J. Influence of soil macroporosity on environmental quality. Adv. Agron. 1991, 46, 1–37. [Google Scholar] [CrossRef]
  66. Cameira, M.R.; Fernando, R.M.; Pereira, L.S. Soil macropore dynamics affected by tillage and irrigation for a silty loam alluvial soil in southern Portugal. Soil Tillage Res. 2003, 70, 131–140. [Google Scholar] [CrossRef]
  67. Sohi, S.P.; Krull, E.; Lopez-Capel, E.; Bol, R. A review of biochar and its use and function in soil. Adv. Agron. 2010, 105, 47–82. [Google Scholar] [CrossRef]
  68. Rayhani, M.H.T.; Yanful, E.K.; Fakher, A. Physical modeling of desiccation cracking in plastic soils. Eng. Geol. 2008, 97, 25–31. [Google Scholar] [CrossRef]
  69. Hargreaves, G.H. Moisture Availability and Crop Production. Trans. ASAE 1975, 18, 980–0984. [Google Scholar] [CrossRef]
  70. Rossato, L.; Alvalá, R.C.S.; Marengo, J.A.; Zeri, M.; Cunha, A.P.M.A.; Pires, L.B.M.; Barbosa, H.A. Impact of Soil Moisture on Crop Yields over Brazilian Semiarid. Front. Environ. Sci. 2017, 5, 73. [Google Scholar] [CrossRef] [Green Version]
  71. McGrath, D.; Henry, J. Organic amendments decrease bulk density and improve tree establishment and growth in roadside plantings. Urban For. Urban Green. 2016, 20, 120–127. [Google Scholar] [CrossRef]
  72. Kladivko, E.J. Tillage systems and soil ecology. Soil Tillage Res. 2001, 61, 61–76. [Google Scholar] [CrossRef]
  73. Larson, W.E. Soil Parameters for Evaluating Tillage Needs and Operations. Soil Sci. Soc. Am. J. 1964, 28, 118–122. [Google Scholar] [CrossRef]
Figure 1. Experimental setup. (1) Soils were collected from three farmlands; (2) soil and improver were mixed in pots, buried in a field, left undisturbed for 6 months, and subjected to natural wet–dry cycles; (3) cylinder soil cores were collected from the pots; (4) cylinder soil cores were saturated; (5) cylinder soil cores were charged in the pressure-plate apparatus; (6) cylinder soil cores where weighed after each pressure level was applied.
Water 15 01297 g001
Figure 2. WRCs of all the treatments for (upper panel) Soil A, (middle panel) Soil B, and (lower panel) Soil C. Symbols refer to the observed median values (obs.), while lines refer to the fitted van Genuchten model (fit.). The min amount was 5% dry weight for compost, biochar, and zeolites, and 0.5% dry weight for graphene. The max amount was 10% dry weight for compost, biochar, and zeolites, and 1% dry weight for graphene.
Water 15 01297 g002
Figure 3. Mean ± S.E. of drainage (a), storage (b), residual (c), and total (measured θs) porosities (d), fitted van Genuchten parameters (eh), and ρb (i) with the statistical LSD comparison between treatments based on all soils for each parameter. Different scales of the y axis were used to clarify the graphs. The same letter indicates no statistical differences among treatments.
Water 15 01297 g003
Figure 4. Mean ± S.E. of drainage (a), storage (b), residual (c), and total (measured θs) porosities (d), fitted van Genuchten parameters (eh), and ρb (i) together with the statistical LSD comparison between soils based on all treatments for each parameter. Different scales of the y axis were used to clarify the graphs. The same letter indicates no statistical differences among treatments.
Water 15 01297 g004
Figure 5. Mean ± st. dev. of drainage (a), storage (b), residual (c), and total (measured θs) porosities (d), fitted van Genuchten parameters (eh), and ρb (i) with the statistical LSD comparison between treatments for each parameter of Soil A. The same letter indicates no statistical differences among treatments.
Water 15 01297 g005
Figure 6. Mean ± st. dev. of drainage (a), storage (b), residual (c), and total (measured θs) porosities (d), fitted van Genuchten parameters (eh), and ρb (i) with the statistical LSD comparison between treatments for each parameter of Soil B. The same letter indicates no statistical differences among treatments.
Water 15 01297 g006
Figure 7. Mean ± st. dev. of drainage (a), storage (b), residual (c), and total (measured θs) porosities (d), fitted van Genuchten parameters (eh), and ρb (i) with the statistical LSD comparison between treatments for each parameter of Soil C. The same letter indicates no statistical differences among treatments.
Water 15 01297 g007
Figure 8. Spearman correlations and regression analysis between |Si| and drainage, storage, residual porosity, and ρb using the pooled data from all soils and treatments.
Water 15 01297 g008
Table 1. Characteristics of the three soils used in this study.
ParameterSoil ASoil BSoil C
USDA ClassLoamy Sand (LS)Loam (L)Clay (C)
Sand%784832
Silt%163818
Clay%61450
ρbg/cm31.531.260.95
pH-7.87.777.72
ECms/cm1.1380.9911.334
CaCO3%85.89.5
SOM%3.221.512.34
Table 2. Characteristics of the four soil conditioners used in this study.
ParameterCompostBiocharZeolitesGraphene
>63 μm%908130
2–63 μm %9580
<2 μm%11489100
C%36.768.7<0.1>99.0
N%2.440.44<0.1<0.1
pH-7.4211.339.428.61
ρbg/cm30.70.280.620.01
CECcmol/kg1703822118.3
η%73897799
km/s2.53 × 10−54.13 × 10−43.23 × 10−84.58 × 10⁻¹⁰
Table 3. Two-way ANOVA of soil types and treatment effects on different porosity attributes, van Genuchten parameters, and ρb.
SourceSum of SquaresDfMean SquareF-Ratiop-Value
Drainage porosity
Factor A: soil0.16420.082119.71<0.0001
Factor B: treatment0.13280.01623.97<0.0001
Factor A × Factor B0.117160.00710.67<0.0001
Residual 0.037540.001
Total (corrected)0.45080
Storage porosity
Factor A: soil0.06220.03132.87<0.0001
Factor B: treatment0.02880.0043.750.0015
Factor A × Factor B0.086160.0055.68<0.0001
Residual 0.051540.001
Total (corrected)0.22780
Residual porosity
Factor A: soil0.20420.102211.49<0.0001
Factor B: treatment0.01980.0025.04<0.0001
Factor A × Factor B0.022160.0012.880.0019
Residual 0.026540.000
Total (corrected)0.27280
Total porosity (measured θs)
Factor A: soil0.34320.172492<0.0001
Factor B: treatment0.11080.01439.31<0.0001
Factor A × Factor B0.018160.0013.140.0008
Residual 0.019540.000
Total (corrected)0.49080
a
Factor A: soil0.23920.11937.43<0.0001
Factor B: treatment0.21280.0268.29<0.0001
Factor A × Factor B0.397160.0257.78<0.0001
Residual 0.172540.003
Total (corrected)1.02080
n
Factor A: soil1.44420.72212.4<0.0001
Factor B: treatment0.23080.0290.490.8549
Factor A × Factor B0.552160.0350.590.8758
Residual 3.146540.058
Total (corrected)5.37380
θr
Factor A: soil0.07420.0378.740.0005
Factor B: treatment0.02580.0030.750.6498
Factor A × Factor B0.114160.0071.70.0761
Residual 0.228540.004
Total (corrected)0.44180
|Si|
Factor A: soil1.10 × 10−325.50 × 10−431.15<0.0001
Factor B: treatment1.18 × 10−381.47 × 10−48.33<0.0001
Factor A × Factor B2.02 × 10−3161.26 × 10−47.16<0.0001
Residual 9.53 × 10−4541.76 × 10−5
Total (corrected)5.25 × 10−380
ρb
Factor A: soil4.28822.144964.12<0.0001
Factor B: treatment1.16280.14565.33<0.0001
Factor A × Factor B0.111160.0073.11<0.0001
Residual 0.120540.002
Total (corrected)5.68180
Disclaimer/Publisher’s Note: The statements, opinions and data contained in all publications are solely those of the individual author(s) and contributor(s) and not of MDPI and/or the editor(s). MDPI and/or the editor(s) disclaim responsibility for any injury to people or property resulting from any ideas, methods, instructions or products referred to in the content.