Article

Using Multi-Source Data to Assess the Hydrologic Alteration and Extremes under a Changing Environment in the Yalong River Basin

1
State Key Laboratory of Water Resources and Hydropower Engineering Science, Wuhan University, Wuhan 430072, China
2
Power China Chengdu Engineering Corporation Limited, Chengdu 611130, China
*
Author to whom correspondence should be addressed.
Water 2023, 15(7), 1357; https://doi.org/10.3390/w15071357
Submission received: 1 March 2023 / Revised: 21 March 2023 / Accepted: 23 March 2023 / Published: 1 April 2023
(This article belongs to the Section Water and Climate Change)

Abstract

:
Climate change and human activities are two important factors in the changing environment that affect the variability of the hydrological cycle and river regime in the Yalong River basin. This paper analyzed the hydrological alteration and extremes in the Yalong River basin based on multi-source satellite data, and projected the hydrological response under different future climate change scenarios using the CwatM hydrological model. The results show that: (1) The overall change in hydrological alteration at Tongzilin station was moderate during the period of 1998–2011 and severe during the period of 2012–2020. (2) Precipitation (average 781 mm/a) is the dominant factor of water cycle on a monthly scale, which can explain the temporal variability of runoff, evaporation, and terrestrial water storage, while terrestrial water storage is also simultaneously regulated by runoff and evaporation. (3) The GRACE data are comparable with regional water resource bulletins. The terrestrial water storage is mainly regulated by surface water (average 1062 × 108 m3), while the contribution of groundwater (average 298 × 108 m3) is relatively small. (4) The evaporation and runoff processes will intensify in the future due to climate warming and increasing precipitation (~10%), and terrestrial water storage will be depleted. The magnitude of change will increase with the enhancement of emission scenarios.

1. Introduction

In recent decades, the earth’s climate system has experienced significant changes combined with the influence of human activities dominated by industrialization and urbanization, profoundly changing the hydrological cycle process and the sustainable development of water resources [1]. Climate change and human activities are two important factors in the changing environment that affect the variability of the hydrological cycle and river regime. The hydrological response to climate change and human activities has attracted extensive attention from governments and scientists, who have explored the evolution mechanisms of the hydrological cycle and water resources in the changing environment on different temporal and spatial scales [2,3]. With the rapid advances in remote sensing technologies and climate system modeling in recent decades, space-borne sensors and state-of-the-art numerical weather models have produced vast precipitation datasets with near-global coverage and unprecedented spatiotemporal resolution [4].
A number of scientific studies have also been actively carried out to explore the impact mechanism of the changing environment and water cycle. These have systematically evaluated the relative effects and contributions of different aspects of climate change (such as temperature) and human activities (such as reservoir construction), as well as their impact on the ecological and socio-economic environment of the basin, food production, and water security. Recent studies have synthesized regional hydrological alterations and their socioeconomic and ecological implications [5]. Dam-induced changes in streamflow affect many aspects of riverine ecosystems, including hydraulics (e.g., depth, velocity), temperature, and nutrient and sediment transport. Many studies around the world have shown that flow alteration often impacts riverine species and ecosystems negatively. The Indicators of Hydrologic Alteration (IHA) method [6] contains 33 hydrologic parameters and divides the metrics into five groups: magnitude, time, frequency, duration, and rate of change. The IHA method has been widely used to evaluate ecological effects and hydrologic alterations since it is relatively simple and easy to apply. Based on the IHA method, the Range of Variability Approach (RVA) proposed by Richter et al. [7] is used to describe the degree of change in the flow regimes. The IHA-RVA method has been widely used in various countries to evaluate the changes in hydrologic regimes. For example, Olden and Poff [8] used long-term flow records from 420 locations across the continental USA and found that the IHAs adequately represented the entire ordination space occupied by the 171 hydrologic indices, including seasonal patterning of flows; timing of extreme flows; frequency, predictability, and duration of floods, droughts, and intermittent flows; daily, seasonal, and annual flow variability; and rates of change. Chen et al. [9] used the RVA to evaluate the hydrological alterations along the upper and middle portions of East River. They suggested that a sufficiently long hydrological record would improve the accuracy of IHA, and that updated flow data would be helpful for the evaluation of hydrological alterations and their possible implications. Zhang et al. [10] analyzed the hydrological alterations and environmental flow in the East River basin and found that the hydrological regimes had been severely affected by hydropower generation. Duan et al. [11] used the daily flow series at Yichang hydrological stations in the Yangtze River. The analysis results of the IHA-RVA methods show that the hydrologic regime changed moderately after 1999, and has been approaching severe change since 2008. Their study further demonstrated that the changes are mainly reflected in factors related to low flow, such as mean discharge from January to March, minimum discharge, frequency, duration of low pulse, etc. Li et al. [12] studied dam-induced hydrological alterations in the Mekong River after the completion of two large dams, namely, Xiaowan and Nuozhadu in 2010 and 2014, respectively.
As a traditional way to obtain water resource information in the hydrology community, the field monitoring method has provided long-term ground measurements, including various water cycle variables such as precipitation, runoff, and evaporation. It is also the main calibration and verification method for hydrological models and land surface models [13,14]. However, traditional hydrological stations have inherent limitations, such as insufficient numbers, uneven spatial distribution, and discontinuous records, which require significant manpower and capital maintenance costs and are vulnerable to harsh terrain and climatic conditions [15,16]. In this context, the means of remote sensing satellites have developed rapidly. Artificial satellites are necessary to detect changes in the state of the Earth’s surface in space in order to extract multi-source hydro-meteorological information (such as surface temperature and precipitation). With its extensive temporal and spatial coverage and continuity, it has become a powerful alternative and supplement to traditional ground stations, especially in areas where measured data are scarce [17,18]. At the same time, the performance of remote sensing methods combined with land surface models, hydrological models, and climate models in assessing near-real-time changes and predictions of water resources on multiple temporal and spatial scales also shows great application potential [19,20,21]. Mainstream approaches to water resource changes in global or regional basins are relying on new measurement methods, such as radar, ships, aircraft, video analysis, and artificial intelligence, to obtain hydrological information about the basin, and this has also been a research hotspot in the past two decades [22]. In this context, the Gravity Recovery and Climate Experiment (GRACE) twin satellites have enabled the detection of terrestrial water variations from space, robustly boosting the development of hydrological monitoring [23,24,25,26]. For instance, Mohamed et al. [23] used GRACE data over the past 20 years combined with different climate indexes to successfully examine the groundwater storage changes in Senegal. Othman et al. [24] also presented the applicability of GRACE data to measure groundwater in the Iraq region in the early 21st century.
Greater seasonal flow regulation from upstream hydropower reservoirs increases the feasibility of hydropower at downstream locations. Moreover, if increased annual and dry-season flows projected under many climate change scenarios exceed climate-driven increases in reservoir evaporation, both total and firm energy production could increase. Such potential basin-wide changes in the hydropower generation capacity of the basin have not been modeled [27]. Human activities have significantly interfered with the water resources in the basin, and these activities have gradually increased with the increasing human demand for water. In addition, the upper reaches of the Yalong River basin are located in the Qinghai-Tibetan Plateau, and are significantly affected by global climate change. In recent decades, precipitation and temperature have changed significantly. Therefore, systematic research is urgently needed on the variation characteristics of the water cycle in the Yalong River basin under the changing environmental conditions [28].
Therefore, the main objectives of this study are: (1) to assess the observed hydrological alterations caused by hydropower dams in the Yalong River mainstream; (2) to use multi-source precipitation, runoff, evaporation, and terrestrial water storage data to explore the variation in the hydrological cycle in the basin from 2002 to 2021; (3) to estimate the variation characteristics of water resources in the basin under various CMIP6 climate change scenarios.
The remainder of the paper is structured as follows: Section 2 provides an overview of the basin’s geography and a multi-source data set; Section 3 outlines hydropower dam development and assesses hydrological alteration; Section 4 analyzes hydrometeorological extremes under climate change conditions; and Section 5 ends the paper with our conclusions.

2. Study Basin and Data

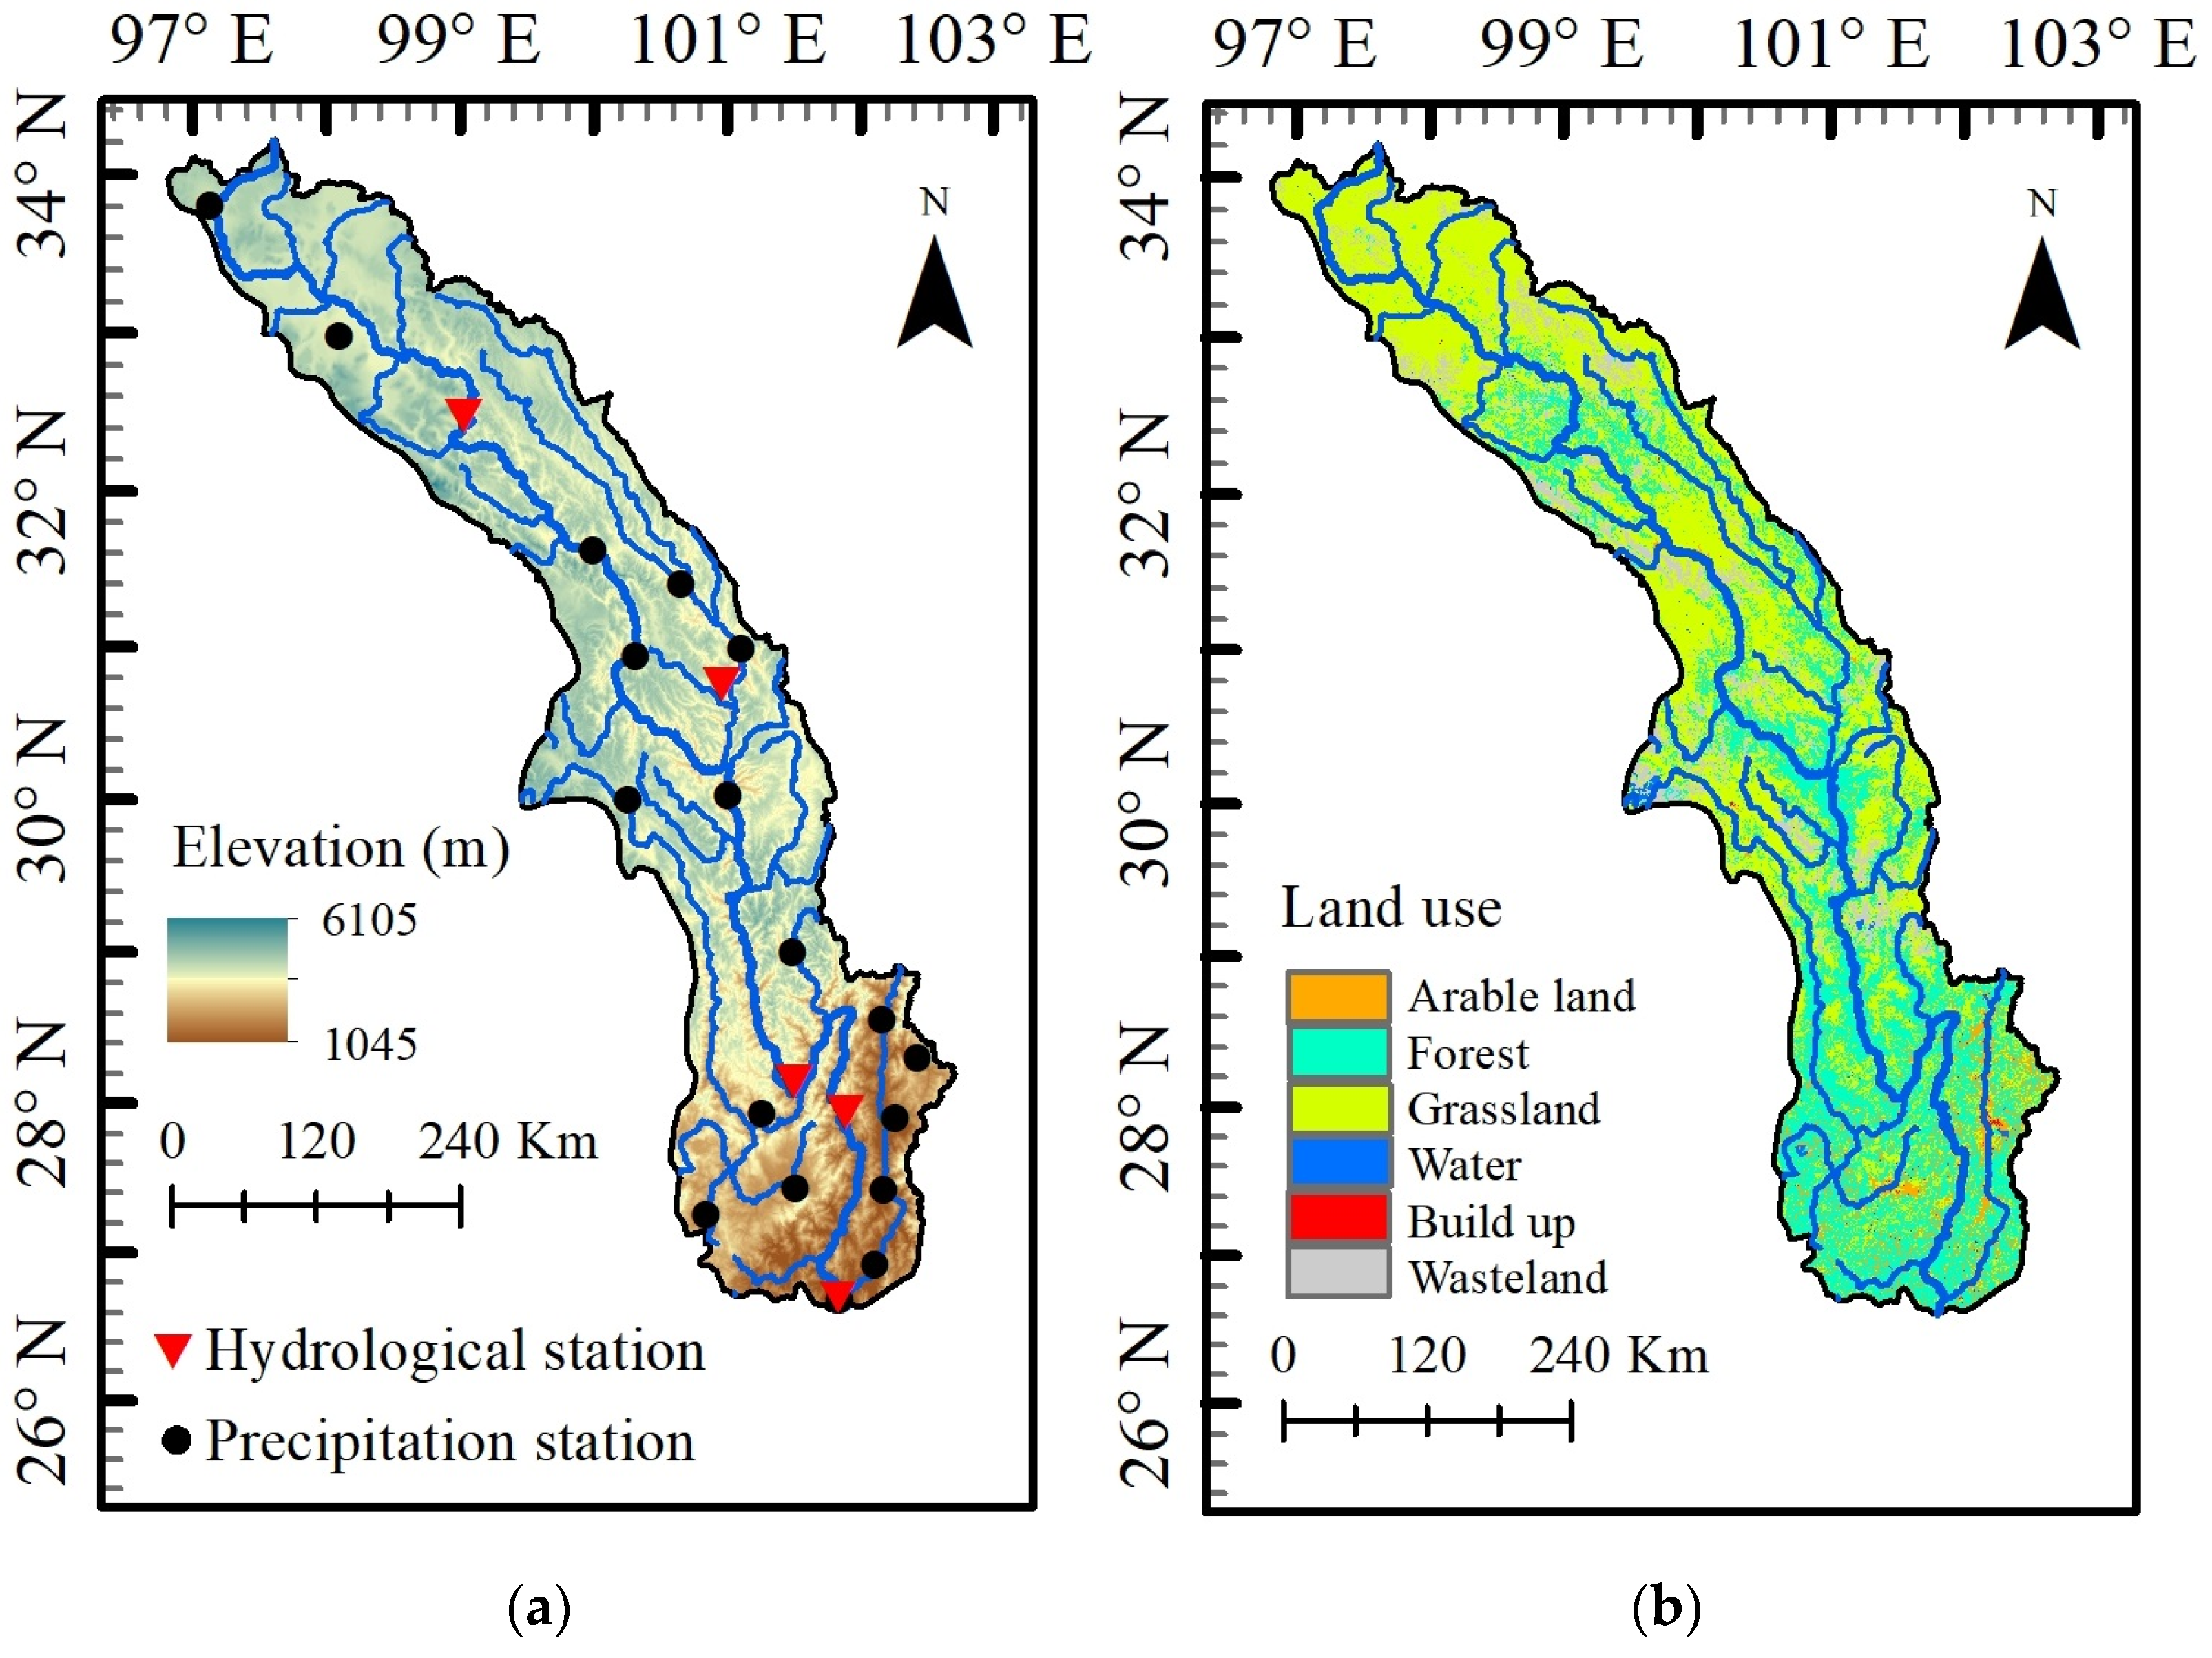
2.1. Geography and Climate

The Yalong River basin is located between (96°52′~102°48′ E and 26°32′~33°58′ N) in the southeast Tibetan Plateau, west of Sichuan, north of the Hengduan Mountains (Figure 1a). It is the largest tributary of the Jinsha River in the upper reaches of the Yangtze River, and its runoff accounts for 40% of the total runoff of the Jinsha River. The elevation difference between the source area and the basin outlet is about 3830 m, the total length of the mainstream is approximately 1570 km, and the area of the basin is 1.36 × 10⁵ km2. The north–south direction is long and narrow, most of the elevations are between 2000 and 4000 m, the terrain conditions are complex, and the landform mainly consists of woodland and grassland (Figure 1b). Geographically, the Yalong River basin belongs to the plateau climate region of Western Sichuan. The basin is affected by the westerly circulation and southwest monsoons. It has abundant precipitation from May to October, which is the wet season, accounting for 73% of the total annual rainfall, while the dry season is from November to April, with little precipitation. The spatial distribution of precipitation is uneven; in the upstream, it falls between 500–600 mm/a, while in the middle-lower, area it reaches 900–1300 mm/a. Figure 1 shows the geographical location and a land use map of the Yalong River basin [27]. The water vapor in Yalong River basin is mainly formed by the Southwest Monsoon. The rainfall depends on the intensity of the monsoons and the topographic conditions, resulting in an uneven spatiotemporal distribution of precipitation. The general trend of precipitation is decreasing from south to north and from east to west. The average annual temperature in the basin is 7.3 °C, close to 0 °C in the upper reach and 15 °C in the lower reach. The extreme minimum temperature is below −35 °C. The annual sunshine hours in the basin are 2400 h. The major land use and land cover (LULC) types are pasture and forest, accounting for 51.96% and 40.69% of the basin area. The dominant soil types are Gelic Leptosols and Haplic Luvisols, accounting for 33.15% and 23.74% of the basin area, respectively [29].
The upper to middle stream areas belong to the northwest–southeast-trending Ganzi-Aba fold belt of Triassic metamorphic rocks and sandstones. The shaft portion of the fold zones consists of Permian limestones with scattered Yanshan granite outcrops. In the middle to lower reaches, Mesozoic clastic sediments and carbonates dominated, but are intercalated with Precambrian basement rocks with metamorphic grade. Therefore, the Yalong River basin has historically experienced frequent geological hazards, including landslides, avalanches, and debris flow, because of extreme precipitation events, and the population has suffered from significant losses of lives and properties [29].

2.2. Multi-Source Hydrometeorological Data

Due to the complex terrain changes and lack of economic development, there are only five hydrologic stations and eighteen precipitation stations (Figure 1a) in this basin. Therefore, multi-source hydrometeorological data were collected to assess hydrologic alterations and extremes in the Yalong River basin [29,30,31].

2.2.1. Precipitation Data

Monthly precipitation data series are mainly derived from gauge observations, radar precipitation estimates and satellite precipitation retrievals. Gauge stations and radar are limited by the station network density and topography, especially in remote areas such as mountainous regions with high altitudes. Satellite precipitation estimation is the most promising hydrological model input with high spatial and temporal resolution at present. Several research institutions have developed various satellite precipitation estimation products with different data sources and algorithms, such as the monthly-scale precipitation product (IMERG Final Precipitation L3V06) released by the new generation of the global satellite precipitation program, GPM (Global Precipitation Measurement), which is used to invert the temporal and spatial distribution and variation characteristics of precipitation in the Yalong River Basin. This product integrates the measurement information from various satellite remote sensors for mutual calibration and interpolation, and the data source is the NASA Earth Observation Project (https://www.earthdata.nasa.gov/ (accessed on 27 March 2023)). GPM is a global precipitation observation program led by NASA and the Japan Aerospace Exploration Agency (JAXA). As a follow-up program to TRMM (Tropical Rainfall Measurement Mission), it has improved our ability to detect weak precipitation events. The multi-band micro-blog radiometer and dual-frequency radar combined with IMERG (Integrated Multi-Satellite Retrievals for GPM) can accurately retrieve the surface precipitation rate. Compared with other precipitation products, it has the advantage of high temporal and spatial resolution (0.1°, half an hour). Since the release of the GPM series of precipitation products, it has supported hydrological research in different regions of the world, and has good applicability in the Yalong River basin. The study found that its accuracy on the monthly scale is better than that of commonly used satellite precipitation products. Comparing the GPM with the measured precipitation data from 18 ground stations of the China Meteorological Administration (https://www.cma.gov.cn/ (accessed on 27 March 2023)), a good correlation was found, with a correlation coefficient of 0.99 and a Nash efficiency coefficient of 0.97 (Figure 2), and most points were concentrated within the range of 0 to 50 mm/m.

2.2.2. Runoff Data

The daily flow discharge data measured by the Tongzilin hydrological station (catchment area of about 128,000 km2) was collected to analyze the runoff changes in the Yalong River basin. The flow data come from the Hydrological Bureau of the Yangtze River Water Conservancy Commission (http://www.cjh.com.cn/ (accessed on 27 March 2023)), which has undergone strict quality control and has been restored to the natural runoff sequence. The Tongzilin hydrological station is located in Panzhihua City, Sichuan Province, 12 km away from the river’s mouth. It is the outlet control station of the Yalong River, as well as a nationally important and first-class precision hydrological station. The relevant monthly flow data are obtained from the daily average flow records, which are calculated by the temporary curve method combined with self-recorded water level data (the elevation system is the base level of the Yellow Sea), and the standard deviation of the main curve is about 2%.

2.2.3. Evaporation Data

The topography of the Yalong River Basin is complex, and surface flux sites are scarce. Therefore, GLEAM (global land-surface evaporation: the Amsterdam methodology) is used to quantitatively study changes in basin evaporation. GLEAM was originally developed and provided by the University of Bristol (https://www.gleam.eu/ (accessed on 27 March 2023)). It is a set of algorithm models for estimating different components of land evaporation and has five parts, including vegetation transpiration, plant canopy interception loss, and bare soil. Evaporation, snow sublimation, and water surface evaporation. The basic intention of GLEAM products is to restore the evaporation information contained in the current earth climate and environmental observation satellites to the maximum extent. The GLEAM calculated the potential evaporation based on the Priestley–Taylor formula, used vegetation optical thickness as the evaporation forcing factor, and deduced the different evaporation components from information such as soil moisture in the root zone. At present, GLEAM has released two sets of evaporation products (v3.6a and v3.6b). The former has a longer time span than the latter and fully integrates reanalysis and remote sensing data. Therefore, the v3.6a monthly scale product is used for research. The spatial resolution is 0.25°, which can better display the spatial distribution of basin evaporation.

2.2.4. Terrestrial Water Storage Data

The monthly terrestrial water storage anomaly (TWSA) was obtained from the Gravity Recovery and Climate Experiment (GRACE) satellite released by the Center for Space Research-The University of Texas at Austin (UT-CSR). The GRACE gravity satellite was jointly developed by NASA and the German Aeronautical Center (DLR). It consists of two identical “low-low” tracking satellite pairs with a distance of about 220 km. Inversion of land water storage variability signals by variable gravity field anomalies has attracted the attention of geodesists and hydrologists in recent years. The latest version (RL06) of the Mass concentration blocks (mascon) product was selected, which has a higher resolution and signal-to-noise ratio than the traditional spherical harmonic coefficient inversion product, and the product resolution reaches 0.25°. It should be noted that the GRACE satellite, which was launched in 2002, stopped operating in June 2017, and its follow-up satellite, GRACE Follow-On, began to replace the original satellite in June 2018 to provide scientific data. There was an eleven-month gap between the two generations of satellites. The data were blank, and there were also missing data for individual months during the satellite operation cycle. In addition, the total water resources of the Jinsha River basin (below Shigu) (defined as the amount of surface and sub-surface water resources and the sum of non-repeating quantities between groundwater resources) and GRACE land water storage were compared, and the bulletin data were compiled and disclosed by the Yangtze River Water Conservancy Commission (http://www.cjw.gov.cn/ (accessed on 27 March 2023)).

2.2.5. Climate Projections Data

Based on the Phase 3b dataset of the Inter-Sectoral Impact Model Inter-comparison Project (ISIMIP), the anticipated changes in hydrological and meteorological regimes under various CMIP6 climate scenarios in the basin were evaluated. The goal of ISIMIP is to comprehensively assess the impact of climate change on different sectors, while the CMIP6 project aims to simulate past, present, and future changes in the Earth’s multi-sphere climate system. Specifically, climate inputs such as air temperature and precipitation under climate change environments are provided by multiple CMIP6 climate models (respectively, GFDL-ESM4, IPSL-CM6A-LR, MPI-ESM1-2-HR, MRI-ESM2-0, and UKESM1-0-LL, selecting the multi-model average value for analysis). They have all undergone official ISIMIP downscaling (to 0.5°) and bias correction work, and are input into the Community Water Model hydrological model (CwatM) as driving data to simulate the future variation. The CWatM model, as the first step towards developing a next-generation global hydro-economic modeling framework, can explore the economic trade-offs among different water management options, encompassing both water supply infrastructure and demand management [19]. Therefore, it can serve as a link between various aspects of the water–energy–food nexus, and will be coupled with the existing IIASA (International Institute for Applied Systems Analysis), including the EPIC, MESSAGE, GLOBIOM, and Global Hydro-Economic models. The outperformance of CWatM over other global hydrological models has been validated in several regions of the world [19]. However, it should be noted that substantial differences may exist depending on various choices of models [32,33]. Caution should be kept in mind when is used to interpret the regional results, especially under future climate scenarios. For hydrological variables such as evaporation, terrestrial water storage, and runoff, the advantage of the CwatM model is that it can better consider the impact of human water use and water infrastructure on water resources when simulating the hydrological process of a basin. Three future climate scenarios, SSP1-2.6, SSP3-7.0, and SSP5-8.5, were selected to represent human emissions with moderate development, uneven development, and high fossil fuel development, respectively, and historical scenarios were used for comparative research. Accordingly, two research periods in the middle of this century (2041–2060) and the end of this century (2081–2100) were defined for comparison with the historical period (2002–2021).

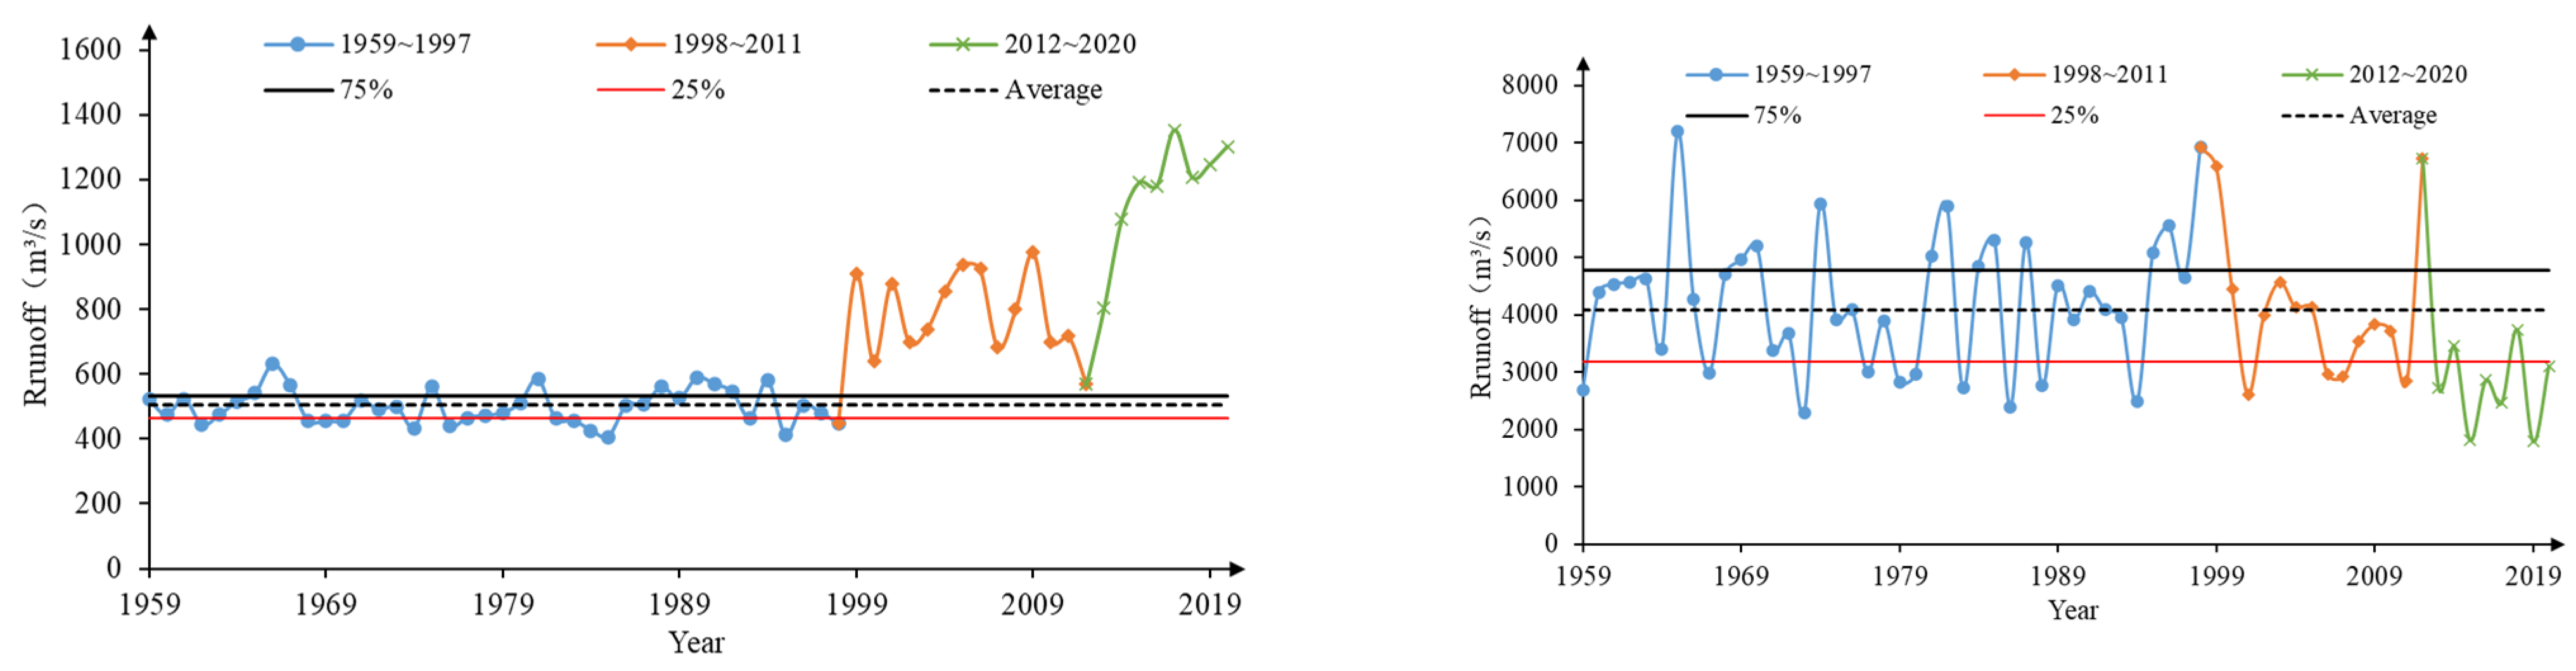
3. Hydrological Alteration in the Mainstream Flow

3.1. Hydropower Dam Development

Due to the abundance of water and the large river drop, the Yalong River basin is an important hydropower energy base in China. Currently, there are 21 levels of hydropower plants be planned in the main stream, with a total installed capacity of about 28.56 million kW and annual power generation of 151.6 billion kW·h. In 1998, the Yalong River was one of the least regulated large river basins in the world, as its total active reservoir storage capacity amounted to just 1% of its mean annual discharge. Until now, there are 7-level cascade hydropower dams be constructed in the middle and downstream Yalong River within the previous two decades. Table 1 lists the basic parameters of the 7-level cascade reservoirs in the Yalong River.
Human activities such as dam construction have significantly altered the flow regimes in the Yalong River, particularly after the construction of two large dams, namely, the Ertan Dam (active storage capacity of 3.37 km3) in 1998 and the Jinping-I Dam (active storage capacity of 4.911 km3) in 2012, respectively. Streamflow data from 1959 to 2020, obtained from Tongzhiling station at basin outlet, are divided into three periods, i.e., the pre-impact period (1959–1997), the transition period (1998–2011), and the post-impact period (2012–2020).

3.2. Hydrological Alteration Assessment Based on IHA-RVA Method

The IHA-RVA method was implemented to evaluate the degree of change at Tongziling hydrological station, which consists of following steps [7]:
(1)
The natural range of streamflow during period of 1959–1997 is calculated using the 33 parameters of the IHA method.
(2)
The RVA targets for each 33 IHA parameters are set. Since these hydropower dams in the middle and lower Yalong River reach were mostly built in the past 20 years, the data series is short after construction. If an indicator falls outside the RVA targets, it may have a great impact on the resulting analysis of variability. Therefore, 75% and 25% of the probability of occurrence before changing each indicator are selected as the RVA targets.
(3)
The RVA values of 33 IHA parameters are calculated according to the streamflow during the periods of 1998–2011 and 2012–2020, respectively.
(4)
Based on the frequency difference of the RVA target and the calculated values, i.e., steps (2) and (3), the measure of hydrologic alteration (Di) is defined as the frequency difference of the i-th index by:
D i = Y 0 i Y f / Y f × 100 %
where Y0i is the number of years that the i-th index falls within the RVA boundaries in a post-impact state. Yf represents the number of years that the i-th index is expected to fall within the RVA boundaries in a pre-impact state.
The RVA method is divided into three levels of hydrological variability. A Di value between 0~33% represents a low degree of change; the range of 33~67% indicates moderate change; and 67~100% denotes a high level of change.
The RVA method can only calculate changes in individual factors. Shiau et al. [34] put forward a new assessment method, in which the change degree is calculated by
D 0 = i = 1 33 D i 2 33 1 / 2
where D0 represents the overall change degree of the rivers and Di denotes the change degree of each factor. Taking into account the significant streamflow in the Yalong River basin, it is difficult to reflect the overall change in the river by observing the change in only a single factor. This study used Equation (2) to calculate the overall change degree of the hydrologic alteration.
Hydrological effects have been scrutinized ever since we assessed the actual hydrological impact of hydropower dams using observed flow records and compared the pre- and post-dam periods in the basin. Since the Ertan and Jinping-I Dams were commissioned in 1998 and 2011 and filled in 1999 and 2012, respectively, the IHA factors, as well as the variation in these factors, were calculated for different periods (i.e., 1959–1997, 1998–2011, and 2012–2020). Table 2 lists the IHA factors of five groups of hydrological indicators at Tongzilin hydrological station, in addition to the change degree before and after the Ertan and Jinping-I hydropower dams were constructed.

3.3. Comparison of Monthly Mean Flow

The comparison of and anomalies in the monthly mean flow during the periods of 1959–1997 and 1998–2011, as well as 2012–2020, at Tongzilin station are shown in Figure 3.
It can be observed from Table 2 and Figure 3 that during the period of 2012–2020, the mean flow in January, February, March, and April severely changed, and the change degree reached 100%. On the other hand, the mean flow in June, July, September, and December showed moderate changes, the mean flow from June to September decreased, while from October to the following next May, the mean flow was increased compared with the natural runoff in the period of 1959–1997.
As shown in Table 2, the change degree of monthly runoff at Tongzilin station shows a trend, being high in the dry season and low in the flood season. Under unnatural conditions, from 1998 to 2020, the average runoff process of Tongzilin station in dry season changed significantly. Not only did the fluctuation range become larger, but the runoff also increased significantly. The change degree of the flow in the flood season is relatively small; there was a certain decreasing trend and a slight change from July to September after the completion of Ertan Reservoir, and the flow in the flood season changed moderately in June, July, and September after the completion of Jinping-I Reservoir.

3.4. Comparison of Extreme Values

A comparison of the extreme discharges (in February and July) and the normal range of natural runoff during the periods of 1998–2011 and 2012–2020 are plotted in Figure 4, in which the 25% and 75% quantiles are also given.
As can be seen from Figure 4, the maximum flow at Tongzilin station during the period of 2012–2020 could have fallen into the normal range, but is located at the lower end of the normal range (i.e., the normal value is low for natural runoff). The maximum 1-day flow during the period of 2012–2020 was at the lower end of the normal range of natural runoff, indicating that the upstream hydropower dam plays an important role in flood retention. Five factors of minimum flow did not fall into the normal range, indicating that a significant change occurred to the minimum flow. The maximum flow factor fall into the normal range, but the minimum 1-day, 3-day, 7-day, and 30-day flow values do not fall within the normal range or at the edge of the normal range.
According to the occurrence time of extreme flows, the maximum flow at Tongzilin station generally occurs in late July. The factor is almost the same as the historical mean. This indicates that although the upstream reservoirs can regulate the flood peak, there are not great floods occurred in recent years. The reservoirs do not impound floods on a large scale, so the occurrence time of the maximum flow does not change significantly as compared with the natural runoff. The minimum flow at Tongzilin station often occurs in late March, but it has been delayed to late April and early May during 2012–2020.
Table 2 shows that the minimum flow at Tongzilin station gradually increased during the periods of 1998–2011 and 2012–2020, respectively. Their change degrees became more and more grave over the statistical duration, especially the 90-day minimal flow, which always showed a high level of change, even up to 100%. In addition, the construction of a reservoir intensifies the increase in the minimum flow. This can be seen in the data, as the indicators show mild to moderate changes in 1998–2011, but severe changes in 2012–2020, after the construction of Jinping-I Reservoir.
On the contrary, the maximum flow showed a downward trend, indicating that the upstream hydropower dam plays an important role in flood retention. In addition, the 1-day maximal flow, 3-day maximal flow, and 7-day maximal flow were moderately changed, while the 30-day and 90-day maximal flows were only slightly changed. According to the occurrence time of extreme flows, the maximum flow at Tongzilin station generally occurs in late July and August, which is just slightly later than the historical average values.

4. Hydrometeorological Extremes under Climate Change

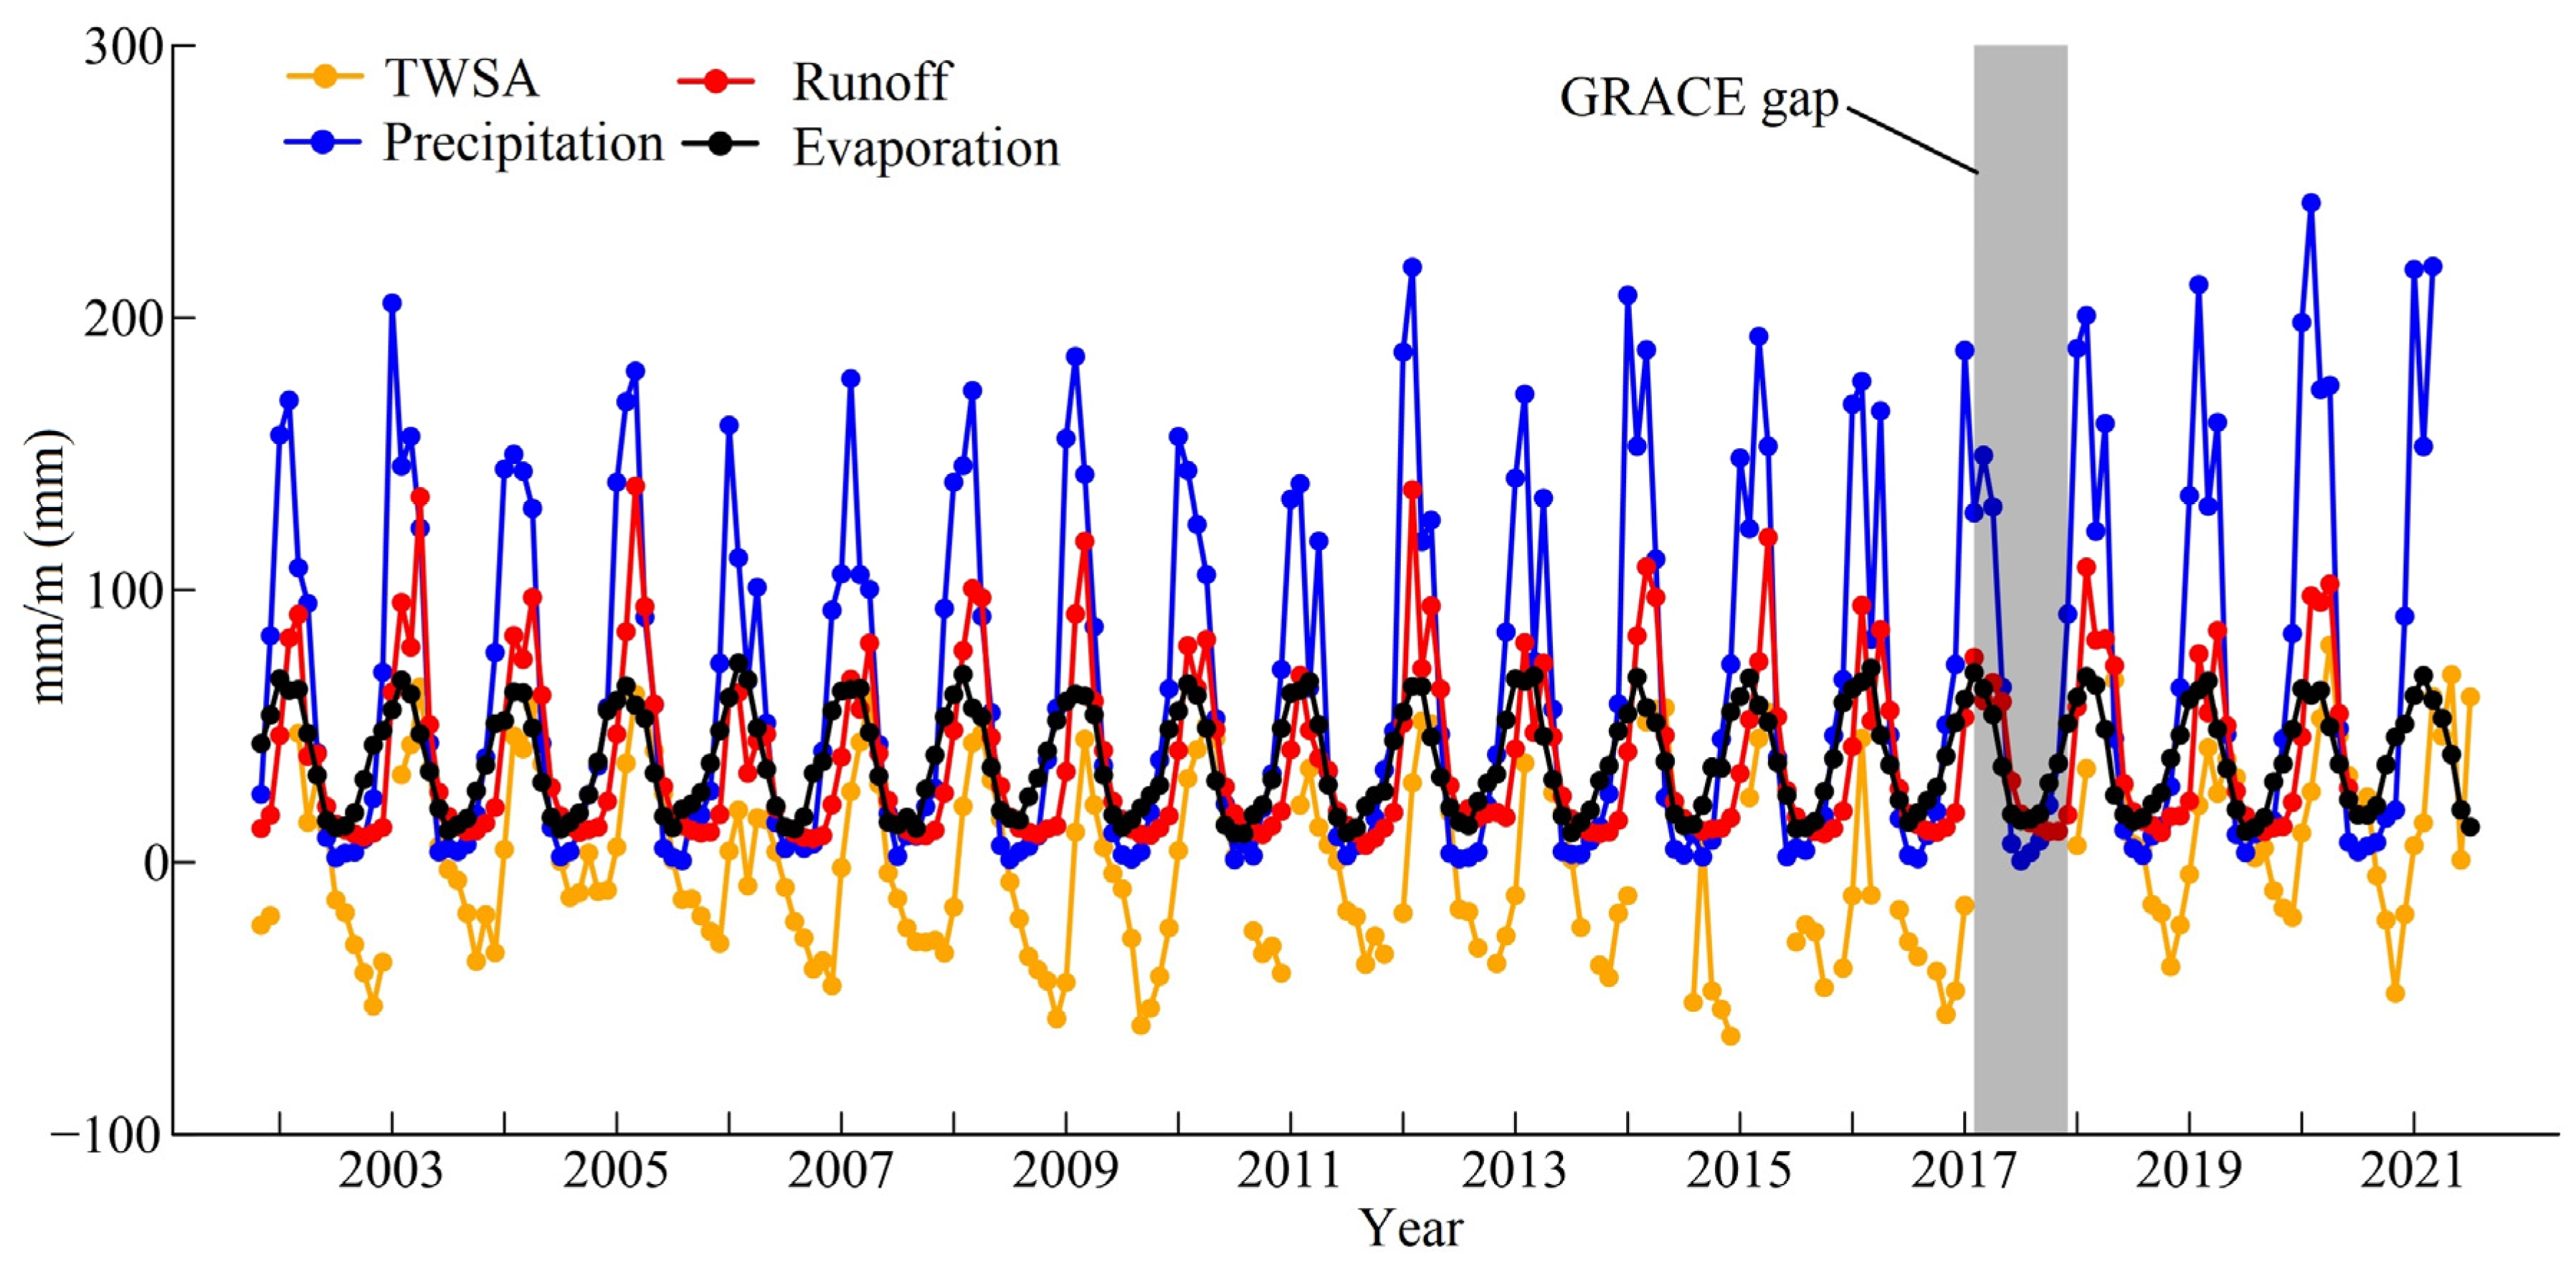
4.1. Variation Characteristics of Water Cycle Factors

Based on multi-source remote sensing satellite products, the monthly process of water cycle variables in the Yalong River basin is displayed, as shown in Figure 5. Precipitation and evaporation are calculated by the spatial average of grid products, and the runoff (depth) sequence is the measured outlet station flow and corresponding catchment area (mm/m). TWSA is derived from the long-term anomaly results of land water storage retrieved by the GRACE gravity satellite, and the unit is mm. Precipitation is the dominant factor in water cycle variables in the basin, with an annual average of 781 mm/a, significantly higher than runoff, evaporation, and TWSA. At the same time, the precipitation shows obvious seasonal characteristics, with distinct dry and wet seasons. In the wet season, precipitation varies between 150–250 mm/m, and in the dry season, it is often less than 50 mm/m; the precipitation difference between different years is also significant. For example, the total precipitation in the upper reaches of the Yangtze River in 2020 was 630 mm/a, especially during the flood season, where it reached a record high of 242 mm/m. Precipitation variability can explain most of the temporal variation in runoff series, such as the wetter years in 2012, 2018, and 2020 and the drier years in 2004, 2006, and 2011, all of which have good correspondences and do not reflect significant time on the monthly scale lag, which may be related to factors such as the small basin area and the short confluence time. This also shows that precipitation is still the main source of runoff formation in the Yalong River Basin, especially in periods of abundant precipitation. It is necessary to consider the local specific “precipitation-runoff” relationship to implement reasonable scheduling. On the contrary, the time fluctuation of evaporation is more stable and smaller than that of runoff, both below 100 mm/m, which indicates that the local evaporation process tends to be limited by energy conditions, such as sunshine hours and surface vegetation. The change in TWSA is affected by the combination of water input (such as precipitation) and output (such as runoff). Although there is an 11-month (2017.7~2018.5) data gap and occasional missing months, it still matches well with the precipitation data on the whole. Except for the impact of floods in 2020, the long-term level of TWSA remains around zero, with no clear upward or downward trend.
By further characterizing the seasonal characteristics of different water cycle elements (Figure 6), it can be found that precipitation still dominates the annual scale, gradually rising from December to July of the next year, reaching the peak (166 mm/m), and then gradually falling back to the lowest point (December: 3 mm/m); this model is mainly related to the southwest monsoon. Similarly, runoff was found to have a similar long-term average monthly distribution and also peaked in July at 84 mm/m, without a significant lag in precipitation, which is related to the smaller catchment area. A similar unimodal curve also occurs during evaporation, but the annual variability is more stable relative to runoff, varying between 13 (December) and 66 mm/m (July). Affected by precipitation, runoff, and evaporation, the TWSA decreases slowly from September to April because the incoming water is less than the sum of the runoff and evaporation. Then, with the arrival of the monsoon season, the precipitation rises rapidly, becoming higher than the sum of runoff and evaporation, resulting in a rapid increase in TWSA from April to September. Generally, there is good correspondence and accuracy among the various water cycle variables, which can better explain the hydrological process occurring in the basin.

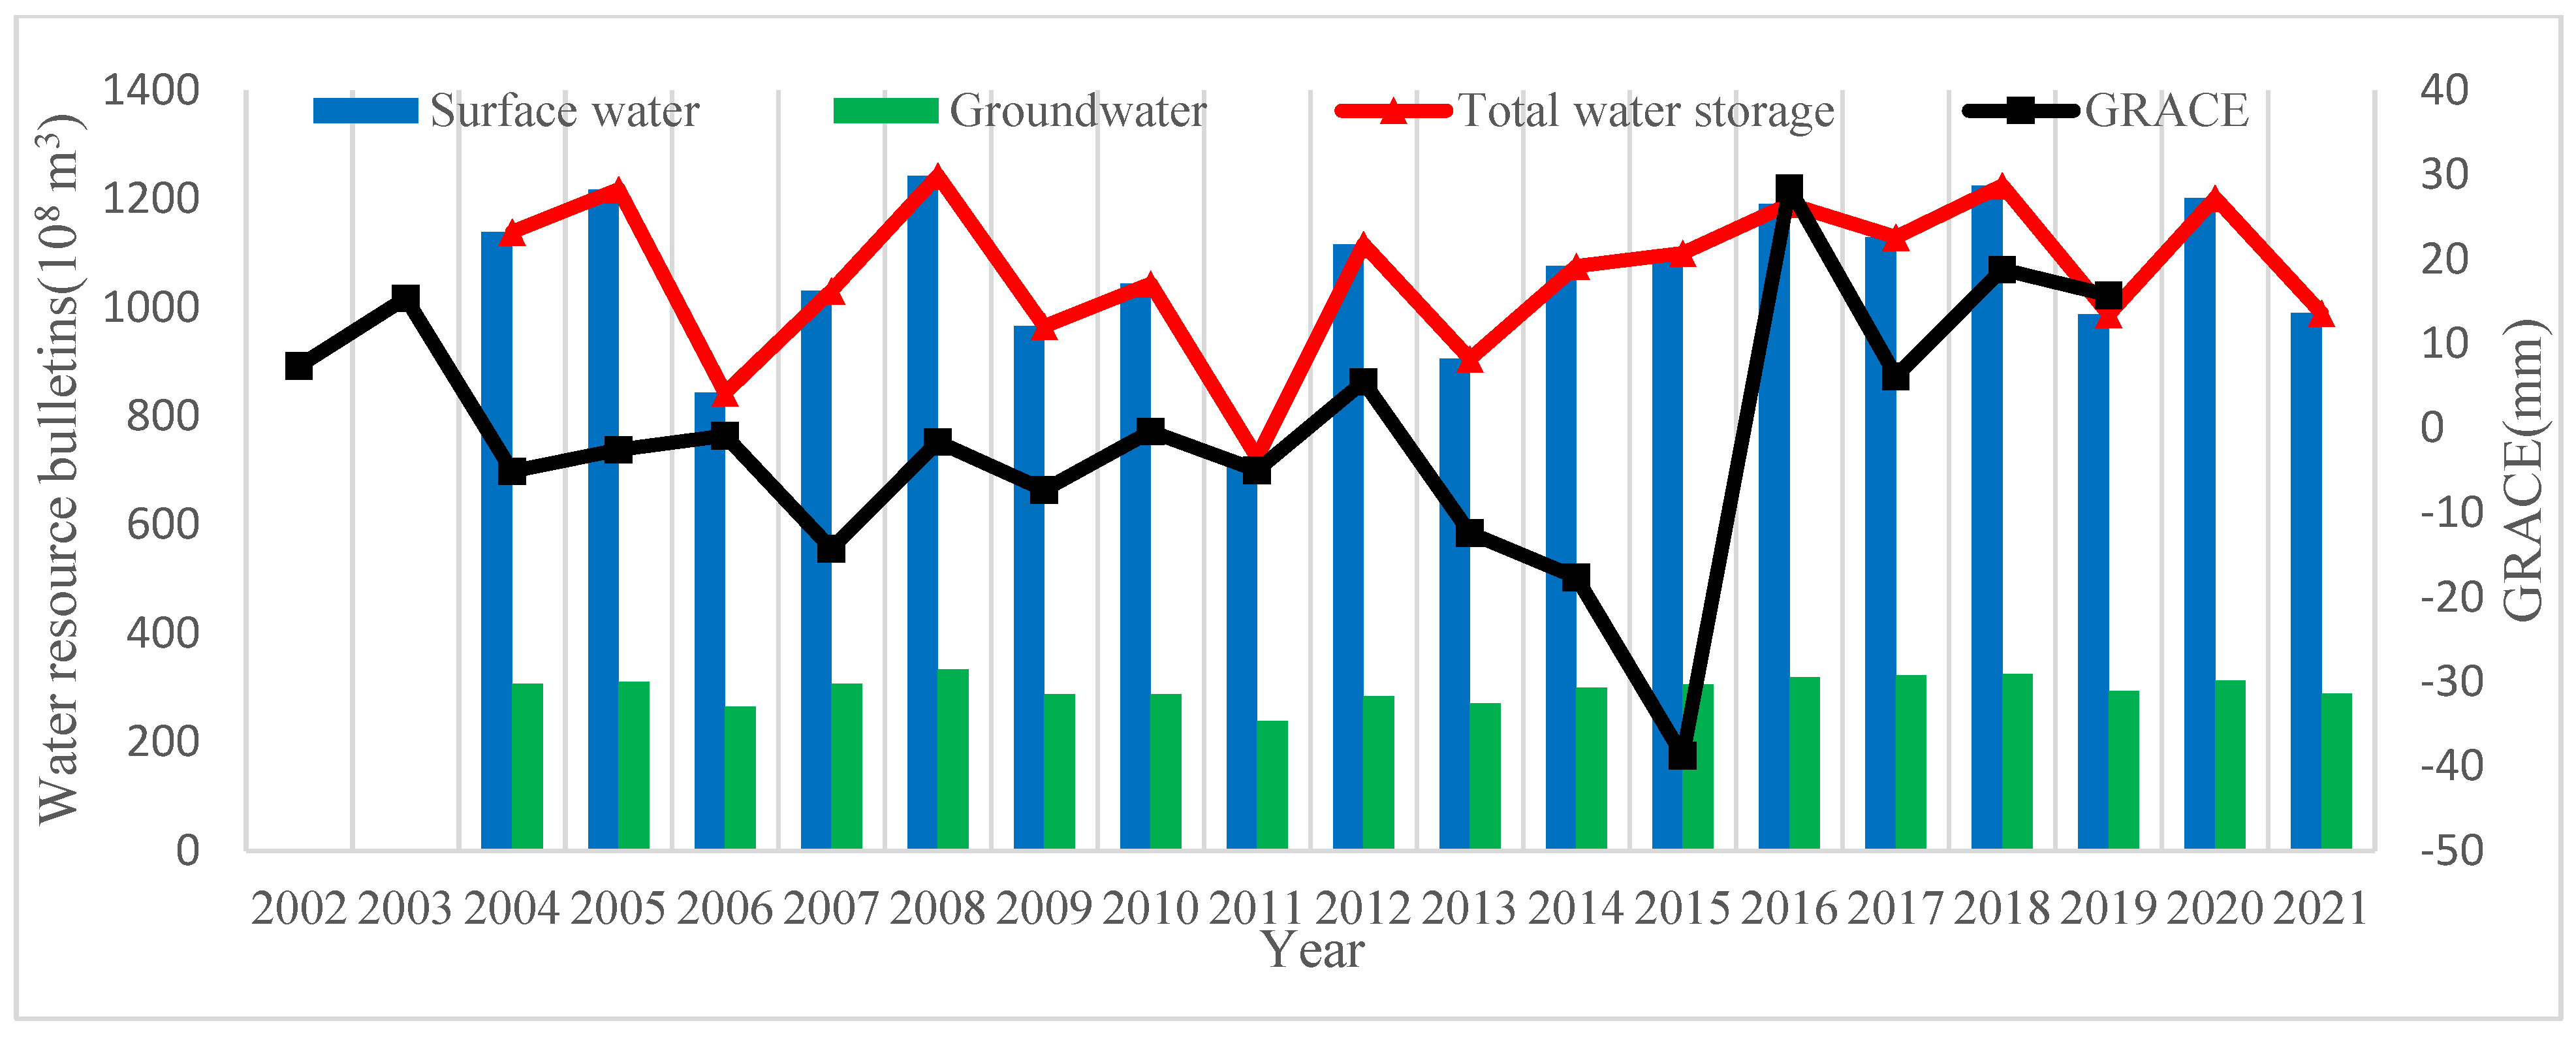
4.2. Validation and Partition of Terrestrial Water Storage

Terrestrial water storage, i.e., the sum of water stored on the surface in unsaturated soil zones and underground aquifers, not only reflects the overall dry and wet conditions of the basin, but also provides information on water resources for social development. Figure 7 shows the annual change of water storage in the Yalong River basin. The annual GRACE data are calculated from the monthly products by averaging, and the results from the Water Resources Bulletin are collected from the local water conservancy departments. It should be noted that the total water resources are calculated as the non-overlapping area between surface water and groundwater resources. It can be found that the overall correlation between the GRACE satellite and the Water Resources Bulletin on the annual scale is relatively high. Both captured a slight downward trend between 2004 and 2011 and an upward trend between 2012 and 2021, with changes between individual years detected as well. It has been verified by comparison that the sudden drop in 2006 and the rapid rise in 2020 were related to the large-scale drought and flood events that year. However, when the GRACE Follow-On mission began to operate, from 2014 to 2018, the satellite data and the results of the water resources bulletin were quite different, which might be related to the maintenance of the equipped instruments and battery management. Based on the change degree of surface water and groundwater resources from the Water Resources Bulletin, surface water resources, including rivers, lakes, and snow cover, occupy a dominant position in the water storage of the basin (annual average of 1062 × 108 m3). On the other hand, the groundwater contribution is relatively small (multi-year average of 298 × 108 m3), only accounting for about 1/3 of the former. The difference between changes in surface water and groundwater resources in the basin are small, indicating that the water exchange in the aquifer is relatively active in the vertical direction.

4.3. Hydrological Response under Climate Change

The CMIP6 climate models and an additional hydrological model are used to predict the climate change process and the hydrological feedback dominated by “warming” in the Yalong River basin under future emission scenarios. As shown in Figure 8, the average air temperature in the basin has maintained an increasing trend in the 21st century, and it intensified with the enhancement of emission scenarios, reaching 8.5 °C, much higher than the average level at the beginning of the century (around 5 °C). The variability between climate models also increased over time, but did not show significant differences between scenarios. Quantitative assessment of the relative changes of different hydrological elements found that the temperature in the middle of this century (2041–2060) will increase by 28% (SSP1-2.6), 31% (SSP3-7.0), and 50% (SSP5-8.5) compared to the historical period (2002–2021) (Figure 9). At the end of this century, the increase will have reached 24% (SSP1-2.6), 70% (SSP3-7.0), and an astonishing 97% (SSP5-8.5). In terms of precipitation, there was no significant change predicted for the middle of this century, but a relatively obvious increase will be found at the end of the century, with relative ranges of 6% (SSP1-2.6), 12% (SSP3-7.0), and 16% (SSP5-8.5). Using the CwatM hydrological model to predict the hydrological feedback effect of the basin, it can be found that the evaporation process will be enhanced with the increase in temperature, especially at the end of this century. With the increase in precipitation, the evaporation of the basin will be more obvious, with a change of 5% (SSP1-2.6), 6% (SSP3-7.0), and 10% (SSP5-8.5) compared with the historical period. The runoff showed change consistent with that of precipitation in the analysis, which is consistent with the conclusions drawn from the analysis of the historical data; thus, the precipitation is the dominant factor of the water cycle in the basin. Specifically, the change degrees of runoff at the end of this century are predicted to be 8% (SSP1-2.6), −3% (SSP3-7.0), and 10% (SSP5-8.5). It should be noted that the terrestrial water storage in the basin, as an important measure of the overall available water resources, has undergone a slight decline under the influence of various water cycle variables, such as precipitation, runoff, and evaporation, with a decrease of −2% (SSP1-2.6). The changes will reach −5% (SSP3-7.0) in the middle of this century, but there no significant change is predicted between the end of this century and the mid-term level, which still reflects the loss of land water storage. We found that a relatively consistent spatial pattern was maintained between different scenarios (Figure 10). The significant temperature rise mainly occurred in the upper reaches of the basin, and the range of change gradually decreased from the upper reaches to the lower reaches. The range of change was more than 100%. The increase in precipitation mainly came from the contribution of the upper and middle reaches of the basin, as the increase in the lower area was less significant (<10%). Evaporation and runoff have similar spatial patterns to precipitation, but the latter is more severe than the former. The runoff in the middle reaches of the basin increased by more than 20%, which may be related to the melting of ice and snow in the upper reaches and the increase in local precipitation. The terrestrial water storage of the basin declined throughout the region, especially in the upper reaches, corresponding to the local temperature rise and precipitation decline, but overall, the loss of water storage was not large (−10~10%).

4.4. Uncertainty and Outlook

Although this study systematically analyzed the variability characteristics of various water cycle elements in the Yalong River basin and predicted the disturbance of hydrological processes under climate change scenarios, it is still limited by various uncertainties, which may have a certain impact on the robustness of the research conclusions. The inherent uncertainty of multi-source remote sensing satellite products directly determines the reliability of the results. For example, previous studies have proven that the accuracy of GPM precipitation products on a daily scale and in dry seasons is poor, and its ability to capture rainstorm events is still lacking, which may affect the inversion performance of basin precipitation during extreme hydrological events [20]. In addition, due to the rough spatial resolution of GRACE satellite observations, it is affected by the narrow and long topography of the Yalong River basin. This results in local signal leakage and bias, which, in turn, affects the inversion of land water storage. In addition to the deviation of satellite products, the post-processing of products of different time and space scales also causes some differences, such as the spatial averaging of raster data sets and the conversion of different time scales. For hydrological prediction based on CMIP6 climate scenarios, the selection and optimization of hydrological model parameters may play a key role, and its impact will be further amplified under the background of multiple climate-driven uncertainties, which may have a significant negative impact on land water storage, runoff, and evaporation simulation results.
Based on the above limitations, follow-up research should further emphasize the potential impact of multi-source uncertainties on the estimation of various hydrological variables in the Yalong River basin. It should also incorporate different types of hydro-meteorological data into the comparison, such as aircraft, radar, and emerging video stream measurement, as well as artificial intelligence. Technology, while clarifying the potential range of variables, uses numerical methods (such as Bayesian weighted average) at the same time to calculate the optimal solution. In addition, new remote sensing satellite missions (such as surface water and ocean topography (SWOT) satellites) and hydrological modeling techniques should be used to further quantitatively study the contribution of human activities and climate change to the disturbance of water cycle processes in the basin, and to clarify their impact mechanisms and interactions for better use of local hydropower resources to provide scientific references.
Despite these unavoidable uncertainties, this study can still be a valuable resource for better understanding water resource regimes during both historical and future periods in the Yalong River basin. Our study highlights the role of remote sensing in regional hydrological monitoring as well as the great potential of early warning of hydrological extremes such as floods and droughts. The influences of human activities (e.g., dam operation) and climate change (e.g., global warming) have also been analyzed in depth. These valuable results can help policymakers and water managers to increase the regulation and abstraction of local water resources, especially in a changing climate background. Surface water storage plays a substantial role in TWS in the Yalong River basin, followed by groundwater storage. Hence, a continuous monitoring program utilizing the most recent GRACE satellite mission, imagery and altimetry, together with ground-based data, should be carried out to assess the water storage dynamics in the future [35].

5. Conclusions

This study used long-term daily streamflow observations in the Tongzhilin gauging station at the basin outlet to examine changes and trends in the IHA-RVA, and analyzed the variability of water cycle factors both in observed series and at future points under changing environmental conditions in the Yalong River basin. The main conclusions can be summarized as follows:
(1)
The flow regime at Yalong River outlet station changed severely in 2012–2020 after the construction of upstream the Ertan and Jinping-I hydropower dams. It is expected that a more significant impact on the hydrological regime will become evident when Lainghehou reservoir starts to impound water in 2022.
(2)
Precipitation is the dominant factor of the water cycle in the basin on a monthly scale, which can explain the temporal variability of runoff, evaporation, and TWSA, but the response of evaporation is gentler than that of runoff. In addition, TWSA is also jointly controlled by runoff and evaporation.
(3)
The results of GRACE products and the water resources bulletin have a good comparison on the annual scale. The terrestrial water storage in the basin is mainly regulated by surface water, and the contribution of groundwater is relatively small.
(4)
The warming process of the basin in the future is obvious, and the precipitation will increase (~10%), leading to the enhancement of evaporation and runoff processes and the loss of land water storage. The magnitude will increase with the strengthening of the discharge scenario.

Author Contributions

Conceptualization, S.G.; data curation, C.Y. and S.M.; formal analysis, J.X., S.Z. and S.M.; investigation, J.X. and S.Z.; methodology, Y.H. and S.G.; resources, S.G. and C.Y.; software, Y.H. and J.X.; validation, Y.H.; writing—original draft, Y.H.; writing—review and editing, S.G. All authors have read and agreed to the published version of the manuscript.

Funding

This research was funded by the National Key Research and Development Plan grant number 2022YFC3202801 and Power China Chengdu Engineering Corporation Limited grant number CD2C20220652.

Data Availability Statement

The data presented in this study are available on request from the corresponding author.

Acknowledgments

The authors would like to thank the editor and anonymous reviewers whose comments and suggestions helped to improve the manuscript.

Conflicts of Interest

The authors declare no conflict of interest.

References

  1. Rodell, M.; Famiglietti, J.S.; Wiese, D.N.; Reager, J.T.; Beaudoing, H.K.; Landerer, F.W.; Lo, M.-H. Emerging trends in global freshwater availability. Nature 2018, 557, 651–659. [Google Scholar] [CrossRef]
  2. Piao, S.L.; Ciais, P.; Huang, Y.; Shen, Z.H.; Peng, S.S.; Li, J.S.; Zhou, L.P.; Liu, H.Y.; Ma, Y.C.; Ding, Y.H.; et al. The impacts of climate change on water resources and agriculture in China. Nature 2010, 467, 43–51. [Google Scholar] [CrossRef]
  3. Galletti, A.; Avesani, D.; Bellin, A.; Majone, B. Detailed simulation of storage hydropower systems in large Alpine watersheds. J. Hydrol. 2021, 603, 127125. [Google Scholar] [CrossRef]
  4. Zorzetto, E.; Marani, M. Downscaling of rainfall extremes from satellite observations. Water Resour. Res. 2019, 55, 156–174. [Google Scholar] [CrossRef] [Green Version]
  5. Rodell, M.; Beaudoing, H.K.; L’Ecuyer, T.S.; Olson, W.S.; Famiglietti, J.S.; Houser, P.R.; Adler, R.; Bosilovich, M.G.; Clayson, C.A.; Chambers, D.; et al. The observed state of the water cycle in the early twenty-first century. J. Clim. 2015, 28, 8289–8318. [Google Scholar] [CrossRef] [Green Version]
  6. Richter, B.D.; Baumgartner, J.V.; Powell, J.; Braun, D.P. A method for assessing hydrologic alteration within ecosystems. Conserv. Biol. 1996, 10, 1163–1174. [Google Scholar] [CrossRef] [Green Version]
  7. Richter, B.D.; Baumgartner, J.; Wigington, R.; Braun, D. How much water does a river need? Freshw. Biol. 1997, 37, 231–249. [Google Scholar] [CrossRef] [Green Version]
  8. Olden, J.D.; Poff, N.L. Redundancy and the choice of hydrologic indices for characterizing streamflow regimes. River Res. Appl. 2003, 19, 101–121. [Google Scholar] [CrossRef]
  9. Chen, Y.D.; Yang, T.; Xu, C.-Y.; Zhang, Q.; Chen, X.; Hao, Z. Hydrological alteration along the middle and upper East River (Dongjiang) basin, South China: A visually enhanced mining on the results of RVA method. Stoch. Environ. Res. Risk Assess. 2010, 24, 9–18. [Google Scholar] [CrossRef]
  10. Zhang, Q.; Xiao, M.; Liu, C.L.; Singh, V.P. Reservoir-induced hydrological alterations and environmental flow variation in the East River, the Pearl River basin, China. Stoch. Environ. Res. Risk Assess. 2014, 28, 2119–2131. [Google Scholar] [CrossRef]
  11. Duan, W.; Guo, S.; Wang, J.; Liu, D. Impact of cascaded reservoirs group on flow regime in the middle and lower reaches of the Yangtze River. Water 2016, 8, 218. [Google Scholar] [CrossRef] [Green Version]
  12. Li, D.; Long, D.; Zhao, J.; Lu, H.; Hong, Y. Observed changes in flow regimes in the Mekong River basin. J. Hydrol. 2017, 551, 217–232. [Google Scholar] [CrossRef]
  13. Scanlon, B.R.; Zhang, Z.; Save, H.; Sun, A.Y.; Schmied, H.M.; van Beek, L.P.H.; Wiese, D.N.; Wada, Y.; Long, D.; Reedy, R.C.; et al. Global models underestimate large decadal declining and rising water storage trends relative to GRACE satellite data. Proc. Natl. Acad. Sci. USA 2018, 115, E1080–E1089. [Google Scholar] [CrossRef] [Green Version]
  14. Zhao, C.; Zhang, C.; Yang, S.; Liu, C.; Xiang, H.; Sun, Y.; Yang, Z.; Zhang, Y.; Yu, X.; Shao, N.; et al. Calculating e-flow using UAV and ground monitoring. J. Hydrol. 2017, 552, 351–365. [Google Scholar] [CrossRef]
  15. Skofronick-Jackson, G.; Petersen, W.A.; Berg, W.; Kidd, C.; Stocker, E.F.; Kirschbaum, D.B.; Kakar, R.; Braun, S.A.; Huffman, G.J.; Iguchi, T.; et al. The global precipitation measurement (GPM) mission for science and society. Bull. Am. Meteorol. Soc. 2017, 98, 1679–1695. [Google Scholar] [CrossRef] [PubMed]
  16. Miralles, D.G.; Holmes, T.R.H.; De Jeu, R.A.M.; Gash, J.H.; Meesters, A.G.C.A.; Dolman, A.J. Global land-surface evaporation estimated from satellite-based observations. Hydrol. Earth Syst. Sci. 2010, 7, 8479–8519. [Google Scholar] [CrossRef] [Green Version]
  17. Tapley, B.D.; Bettadpur, S.; Ries, J.C.; Thompson, P.F.; Watkins, M.M. GRACE measurements of mass variability in the earth system. Science 2004, 305, 503–505. [Google Scholar] [CrossRef] [Green Version]
  18. Warszawski, L.; Frieler, K.; Huber, V.; Piontek, F.; Serdeczny, O.; Schewe, J. The inter-sectoral impact model inter-comparison project (ISI-MIP): Project framework. Proc. Natl. Acad. Sci. USA 2014, 111, 3228–3232. [Google Scholar] [CrossRef] [Green Version]
  19. Burek, P.; Satoh, Y.; Kahil, T.; Tang, T.; Greve, P.; Smilovic, M.; Guillaumot, L.; Zhao, F.; Wada, Y. Development of the community water model (CWatM v1.04)–A high-resolution hydrological model for global and regional assessment of integrated water resources management. Geosci. Model Dev. 2020, 13, 3267–3298. [Google Scholar] [CrossRef]
  20. Huang, Q.; Ruimin, W.; Junyan, X.; Qin, G. Spatial and temporal applicability of three precipitation products in the Yalong River basin. J. China Hydrol. 2021, 601, 14–21. (In Chinese) [Google Scholar]
  21. Majone, B.; Avesani, D.; Zulian, P.; Fiori, A.; Bellin, A. Analysis of high streamflow extremes in climate change studies: How do we calibrate hydrological models? Hydrol. Earth Syst. Sci. 2021, 26, 3863–3883. [Google Scholar] [CrossRef]
  22. Eyring, V.; Bony, S.; Meehl, G.A.; Senior, C.A.; Stevens, B.; Stouffer, R.J.; Taylor, K.E. Overview of the coupled model inter-comparison project phase 6 (CMIP6) experimental design and organization. Geosci. Model Dev. 2016, 9, 1937–1958. [Google Scholar] [CrossRef] [Green Version]
  23. Mohamed, A.; Faye, C.; Othman, A.; Abdelrady, A. Hydro-geophysical evaluation of the regional variability of Senegal’s terrestrial water storage using time-variable gravity data. Remote Sens. 2022, 14, 4059. [Google Scholar] [CrossRef]
  24. Othman, A.; Abdelrady, A.; Mohamed, A. Monitoring mass variations in Iraq using time-variable gravity data. Remote Sens. 2022, 14, 3346. [Google Scholar] [CrossRef]
  25. Alshehri, F.; Mohamed, A. Analysis of groundwater storage fluctuations using GRACE and remote sensing data in Wadi As-Sirhan, Northern Saudi Arabia. Water 2023, 15, 282. [Google Scholar] [CrossRef]
  26. Becker, M.; Papa, F.; Frappart, F.; Alsdorf, D.; Calmant, S.; Santos da Silva, J.; Seyler, F. Satellite-based estimates of surface water dynamics in the Congo River basin. Int. J. Appl. Earth Obs. Geoinf. 2018, 66, 196–209. [Google Scholar] [CrossRef] [Green Version]
  27. Chen, C.; Yan, B.; Guo, J.; Jiang, H.; Li, Z. A framework for projecting future streamflow of the Yalong River basin to climate change. Stoch. Environ. Res. Risk Assess. 2021, 35, 1549–1562. [Google Scholar]
  28. Ye, A.; Deng, X.; Ma, F.; Duan, Q.; Zhou, Z.; Du, C. Integrating weather and climate predictions for seamless hydrologic ensemble forecasting: A case study in the Yalong River basin. J. Hydrol. 2017, 547, 196–207. [Google Scholar] [CrossRef]
  29. Liang, Y.; Cai, Y.; Sun, L.; Wang, X.; Li, C.; Liu, Q. Sensitivity and uncertainty analysis for streamflow prediction based on multiple optimization algorithms in Yalong River basin of southwestern China. J. Hydrol. 2021, 601, 126598. [Google Scholar] [CrossRef]
  30. Guirado, E.M.; Delgado-Baquerizo, M.; Martinez-Valderrama, J.; Tabik, S.; Alcaraz-Segura, D.; Maestre, F.T. Climate legacies drive the distribution and future restoration potential of dryland forests. Nat. Plants 2022, 8, 879–886. [Google Scholar] [CrossRef]
  31. Martens, B.; Miralles, D.G.; Lievens, H.; van der Schalie, R.; de Jeu, R.A.M.; Fernández-Prieto, D.; Beck, H.E.; Dorigo, W.A.; Verhoest, N.E.C. GLEAM v3: Satellite-based land evaporation and root-zone soil moisture. Geosci. Model Dev. 2017, 10, 1903–1925. [Google Scholar] [CrossRef] [Green Version]
  32. Kumari, N.; Srivastava, A.; Sahoo, B.; Raghuwanshi, N.S.; Bretreger, D. Identification of suitable hydrological models for streamflow assessment in the Kangsabati River basin, India, by using different model selection scores. Nat. Resour. Res. 2021, 30, 4187–4205. [Google Scholar] [CrossRef]
  33. Darbandsari, P.; Coulibaly, P. Inter-comparison of lumped hydrological models in data-scarce watersheds using different precipitation forcing data sets: Case study of Northern Ontario, Canada. J. Hydrol.-Reg. Stud. 2020, 31, 100730. [Google Scholar] [CrossRef]
  34. Shiau, J.T.; Wu, F.C. Pareto-optimal solutions for environmental flow schemes incorporating the intra-annual and inter-annual variability of the natural flow regime. Water Resour. Res. 2007, 43, W06433. [Google Scholar] [CrossRef]
  35. Mohamed, A.; Abdelrady, A.; Alarifi, S.S.; Othman, A. Geophysical and remote sensing assessment of Chad’s groundwater resources. Remote Sens. 2023, 15, 560. [Google Scholar] [CrossRef]
Figure 1. Geographical location (a) and land use map (b) of the Yalong River basin.
Water 15 01357 g001
Figure 2. Scatter plots between GPM and in situ precipitation data. The red (blue) color corresponds to high (low) kernel density of points.
Water 15 01357 g002
Figure 3. The monthly runoff at Tongzilin hydrological station during three different periods.
Water 15 01357 g003
Figure 4. February (left) and July (right) runoff at Tongzilin hydrological station during three different periods.
Water 15 01357 g004
Figure 5. Time series of various water cycle factors in the Yalong River basin.
Water 15 01357 g005
Figure 6. Seasonality of various water cycle factors in the Yalong River basin.
Water 15 01357 g006
Figure 7. Annual variation of TWSA and its components in the Yalong River basin.
Water 15 01357 g007
Figure 8. Annual mean temperature change under different climate change scenarios in the Yalong River basin.
Water 15 01357 g008
Figure 9. Average relative changes in different water cycle factors in the Yalong River basin in near (2041–2060) and far future (2081–2100) scenarios relative to the historical period (2002–2021) under different climate change scenarios. Note: the black points indicate outlier points that exceed the two-standard deviation from the mean level, horizontal lines denote the zero level, and vertical line indicate the change ranges of the samples, excluding the outlier points. The bar extension represents the upper (75%) and lower (25%) quartile of the samples.
Water 15 01357 g009
Figure 10. Spatial distribution of the ensemble mean relative changes in different water cycle factors in the Yalong River basin in the far future (2081–2100) relative to the historical period (2002–2021) under different climate change scenarios.
Water 15 01357 g010
Table 1. Basic parameters of seven-level cascade reservoirs in the Yalong River.
Reservoir/Hydropower DamLianghekouYangfanggouJingpin-IJingpin-IIGuandiErtanTongzhilin
Normal water level/m2865209418801646133012001015
Dead water level/m2785208818001640132111551012
Total storage/km310.7670.5137.9900.0190.7605.8000.091
Active storage/km36.560.05384.9110.0040.1233.3700.015
Installed capacity/MW300015003600480024003300600
Annual power/109 kW·h11.05.9716.6224.9911.8717.002.975
Regulation capacitymulti-yeardailyannualdailydailyseasonaldaily
First-impoundment year2000202020122012201119982015
Completion year2023202120152015201320002016
Table 2. Results of the change degree of IHA indicators under different periods.
GroupIHA Indicators1959~19971998~20112012~2020
Average25%75%AverageD0 (%)AverageD0 (%)
Group 1 (m3/s)January mean flow565518611870100%1173100%
February mean flow504464533779100%1104100%
March mean flow49144952076985.7%1216100%
April mean flow57954063971357.1%997100%
May mean flow988829109190228.6%98233.3%
June mean flow217118042854210342.9%154155.6%
July mean flow408431854777408414.3%318655.6%
August mean flow362130844566427814.3%310611.1%
September mean flow397130055059414514.3%413555.6%
October mean flow251920883099225828.6%271833.3%
November mean flow12561120143713050.0%134411.1%
December mean flow77769288586814.3%83155.6%
Group-2 (m3/s)1-day minimal flow47143949648216.7%55055.6%
3-day minimal flow141413151491152333.3%172155.6%
7-day minimal flow326130553481330457.1%395533.3%
30-day minimal flow14,50813,35415,20718,132100.0%21,20177.8%
90-day minimal flow45,59842,40448,39363,543100.0%90,903100.0%
1-day maximal flow803869319165798150.0%727033.3%
3-day maximal flow22,35819,37625,41221,84733.3%20,27833.3%
7-day maximal flow47,09140,19152,20346,90233.3%43,03333.3%
30-day maximal flow158,028136,716179,272157,5830.0%141,40611.1%
90-day maximal flow376,844308,059433,992358,11016.7%330,39611.1%
No. of base flow days1.771.602.051.780%2.1533.3%
No. of zero flow days00000%00%
Group-3 Julian date (d)Annual minimum67587897100%63100%
Annual maximum22319324622928.6%23911.1%
Group-4
(d)
No. of high pulses4.03.55.06.814.3%8.677.8%
High pulse duration 22.7518.0026.3814.8914.3%13.3577.8%
No. of low pulses3.02.04.016.8885.7%13.8100%
Low pulse duration 30.0022.7545.506.3885.7%7.63100%
Group-5Rise rate6.606.067.3412.63100%12.2777.8%
Fall rate−3.37−3.52−3.14−9.28100%−8.97100%
Number of reversals665973167100%195100%
Overall alteration 60.4 68.4
Disclaimer/Publisher’s Note: The statements, opinions and data contained in all publications are solely those of the individual author(s) and contributor(s) and not of MDPI and/or the editor(s). MDPI and/or the editor(s) disclaim responsibility for any injury to people or property resulting from any ideas, methods, instructions or products referred to in the content.

