
Synthesis and Characterization of Humic/Melanin-like Compounds by Oxidative Polymerization of Simple Aromatic Precursors

Abstract
:1. Introduction
2. Materials and Methods
2.1. Photochemical Oxidation in Ultraviolet (UV) Reactor
2.2. Ultraviolet (UV)-Visible Spectroscopy
2.3. Fluorescence Spectroscopy
2.4. Reduction Treatments
2.5. Mass Spectrometry
Mass Spectrometry Analyses and Formula Assignments:
3. Results
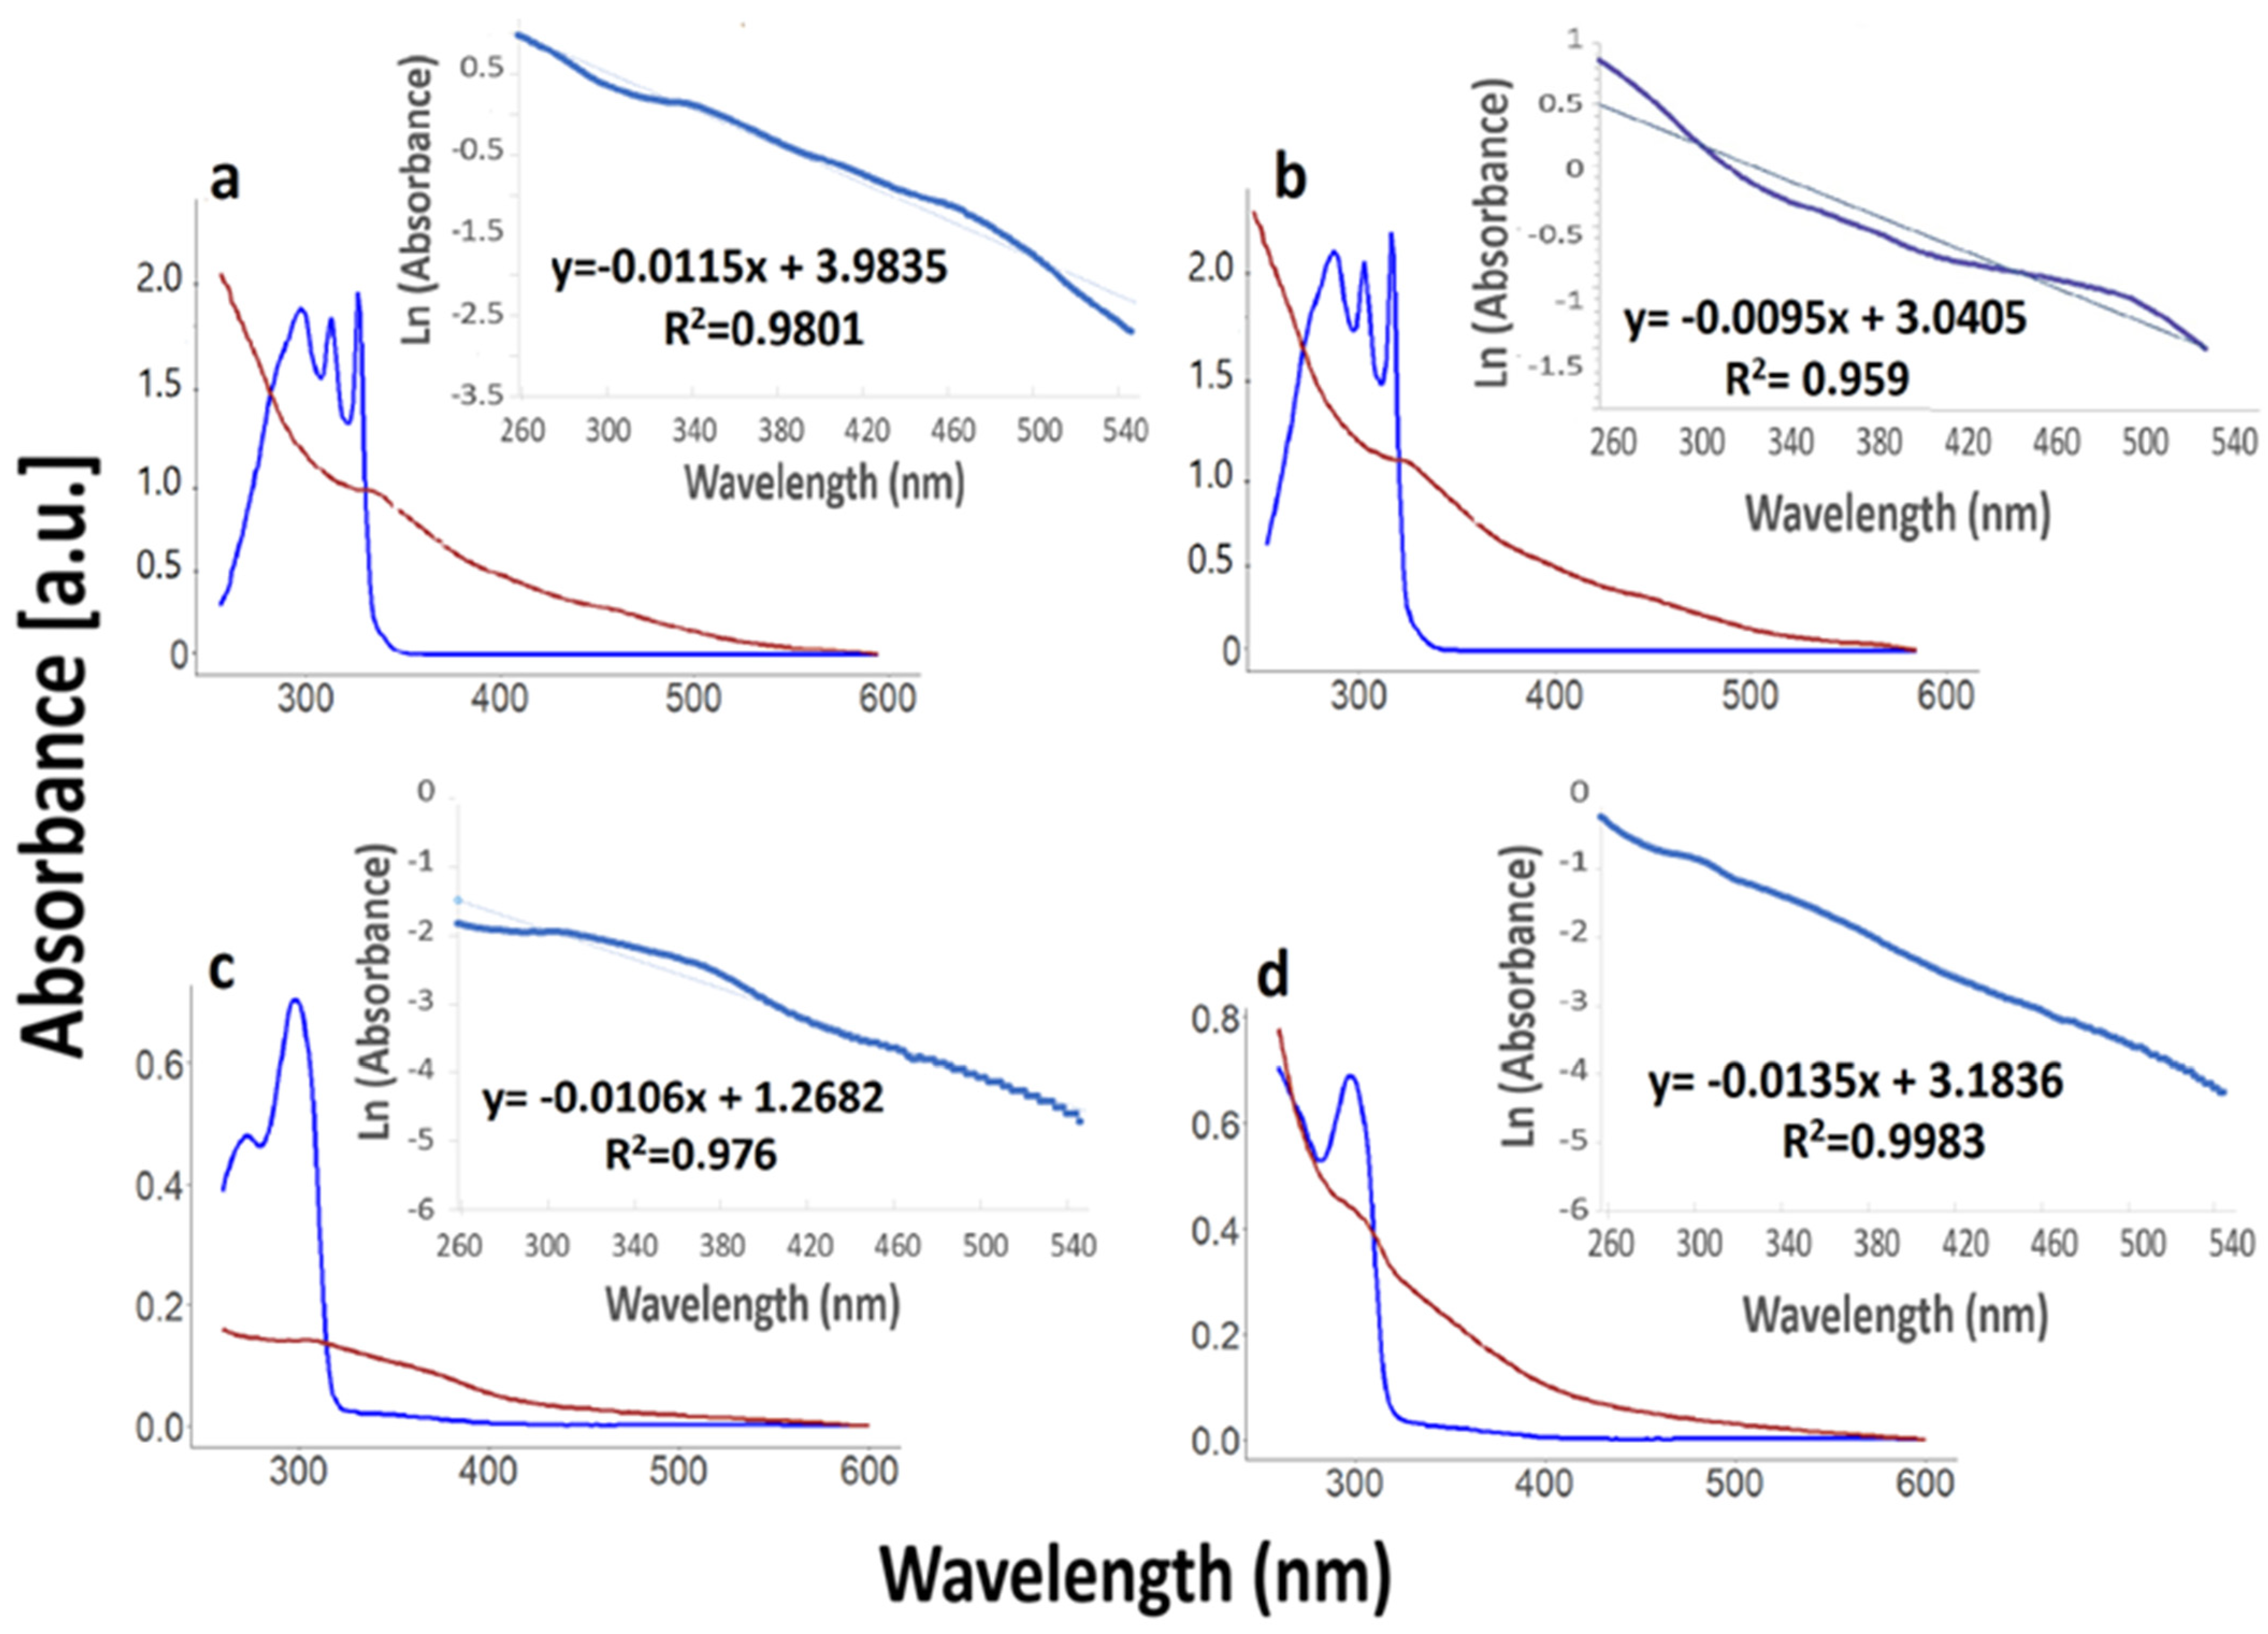
3.1. Optical Properties
3.1.1. Absorbance Spectra
3.1.2. Fluorescence Spectra
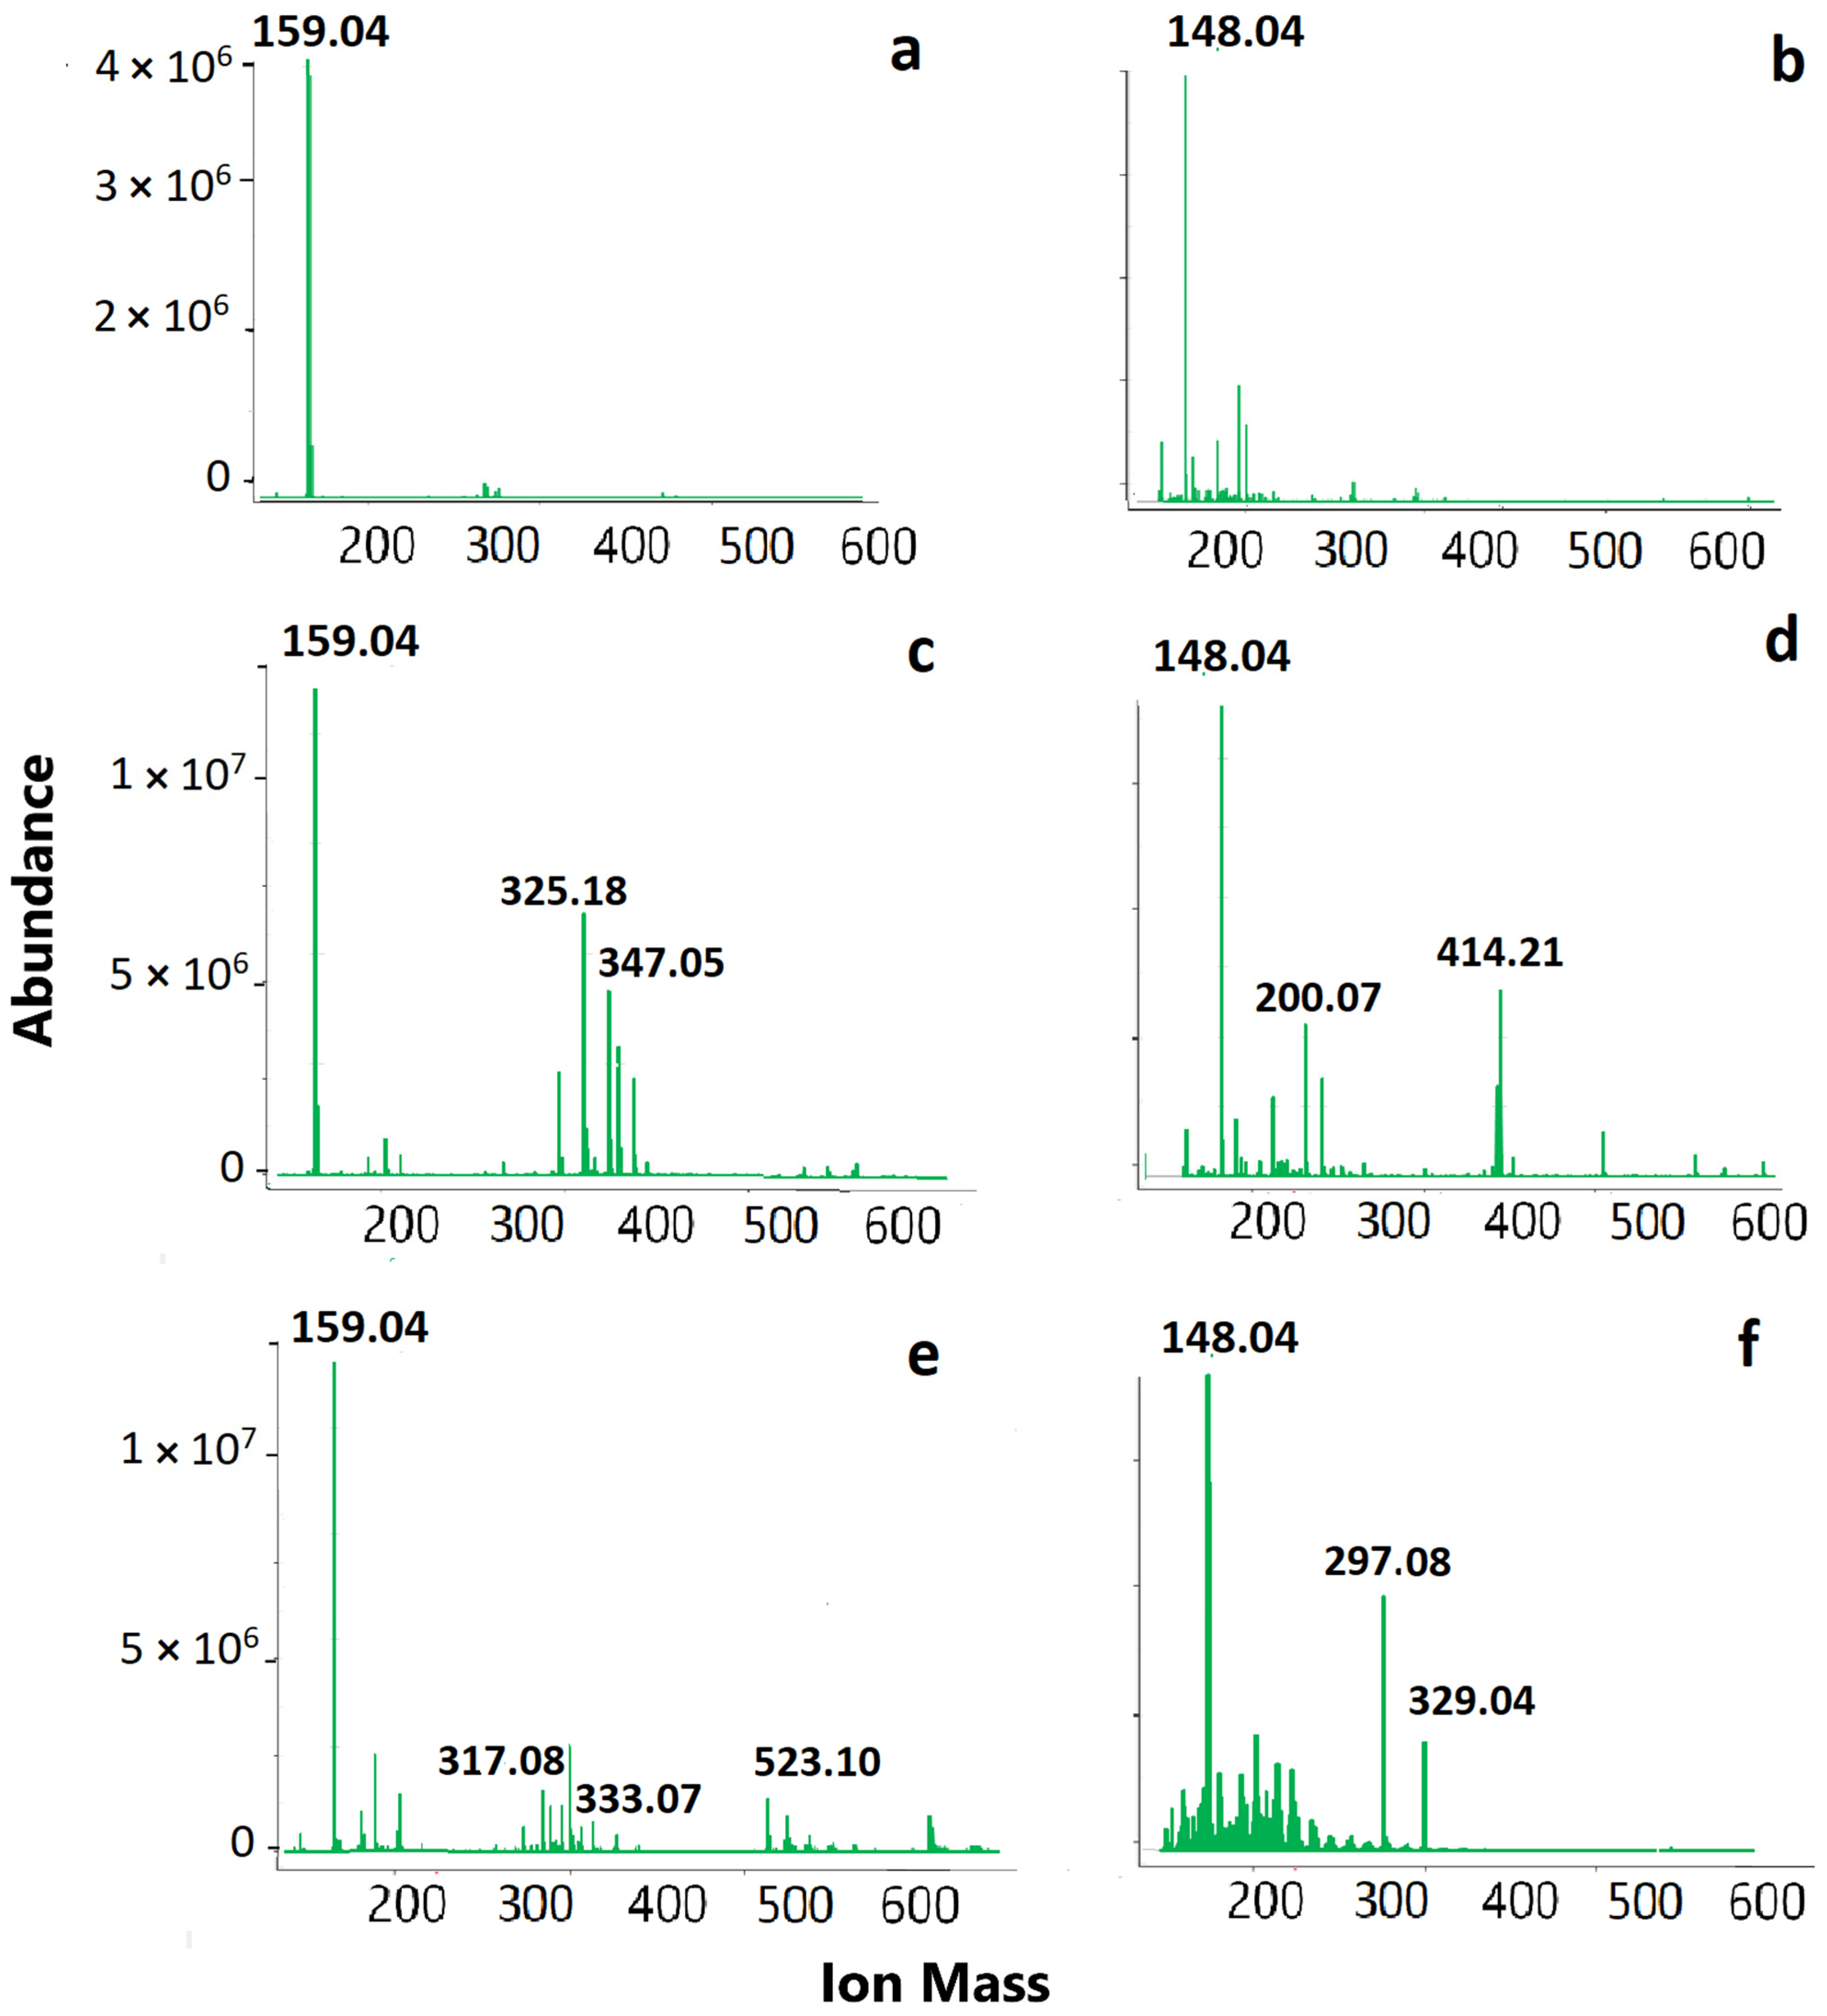
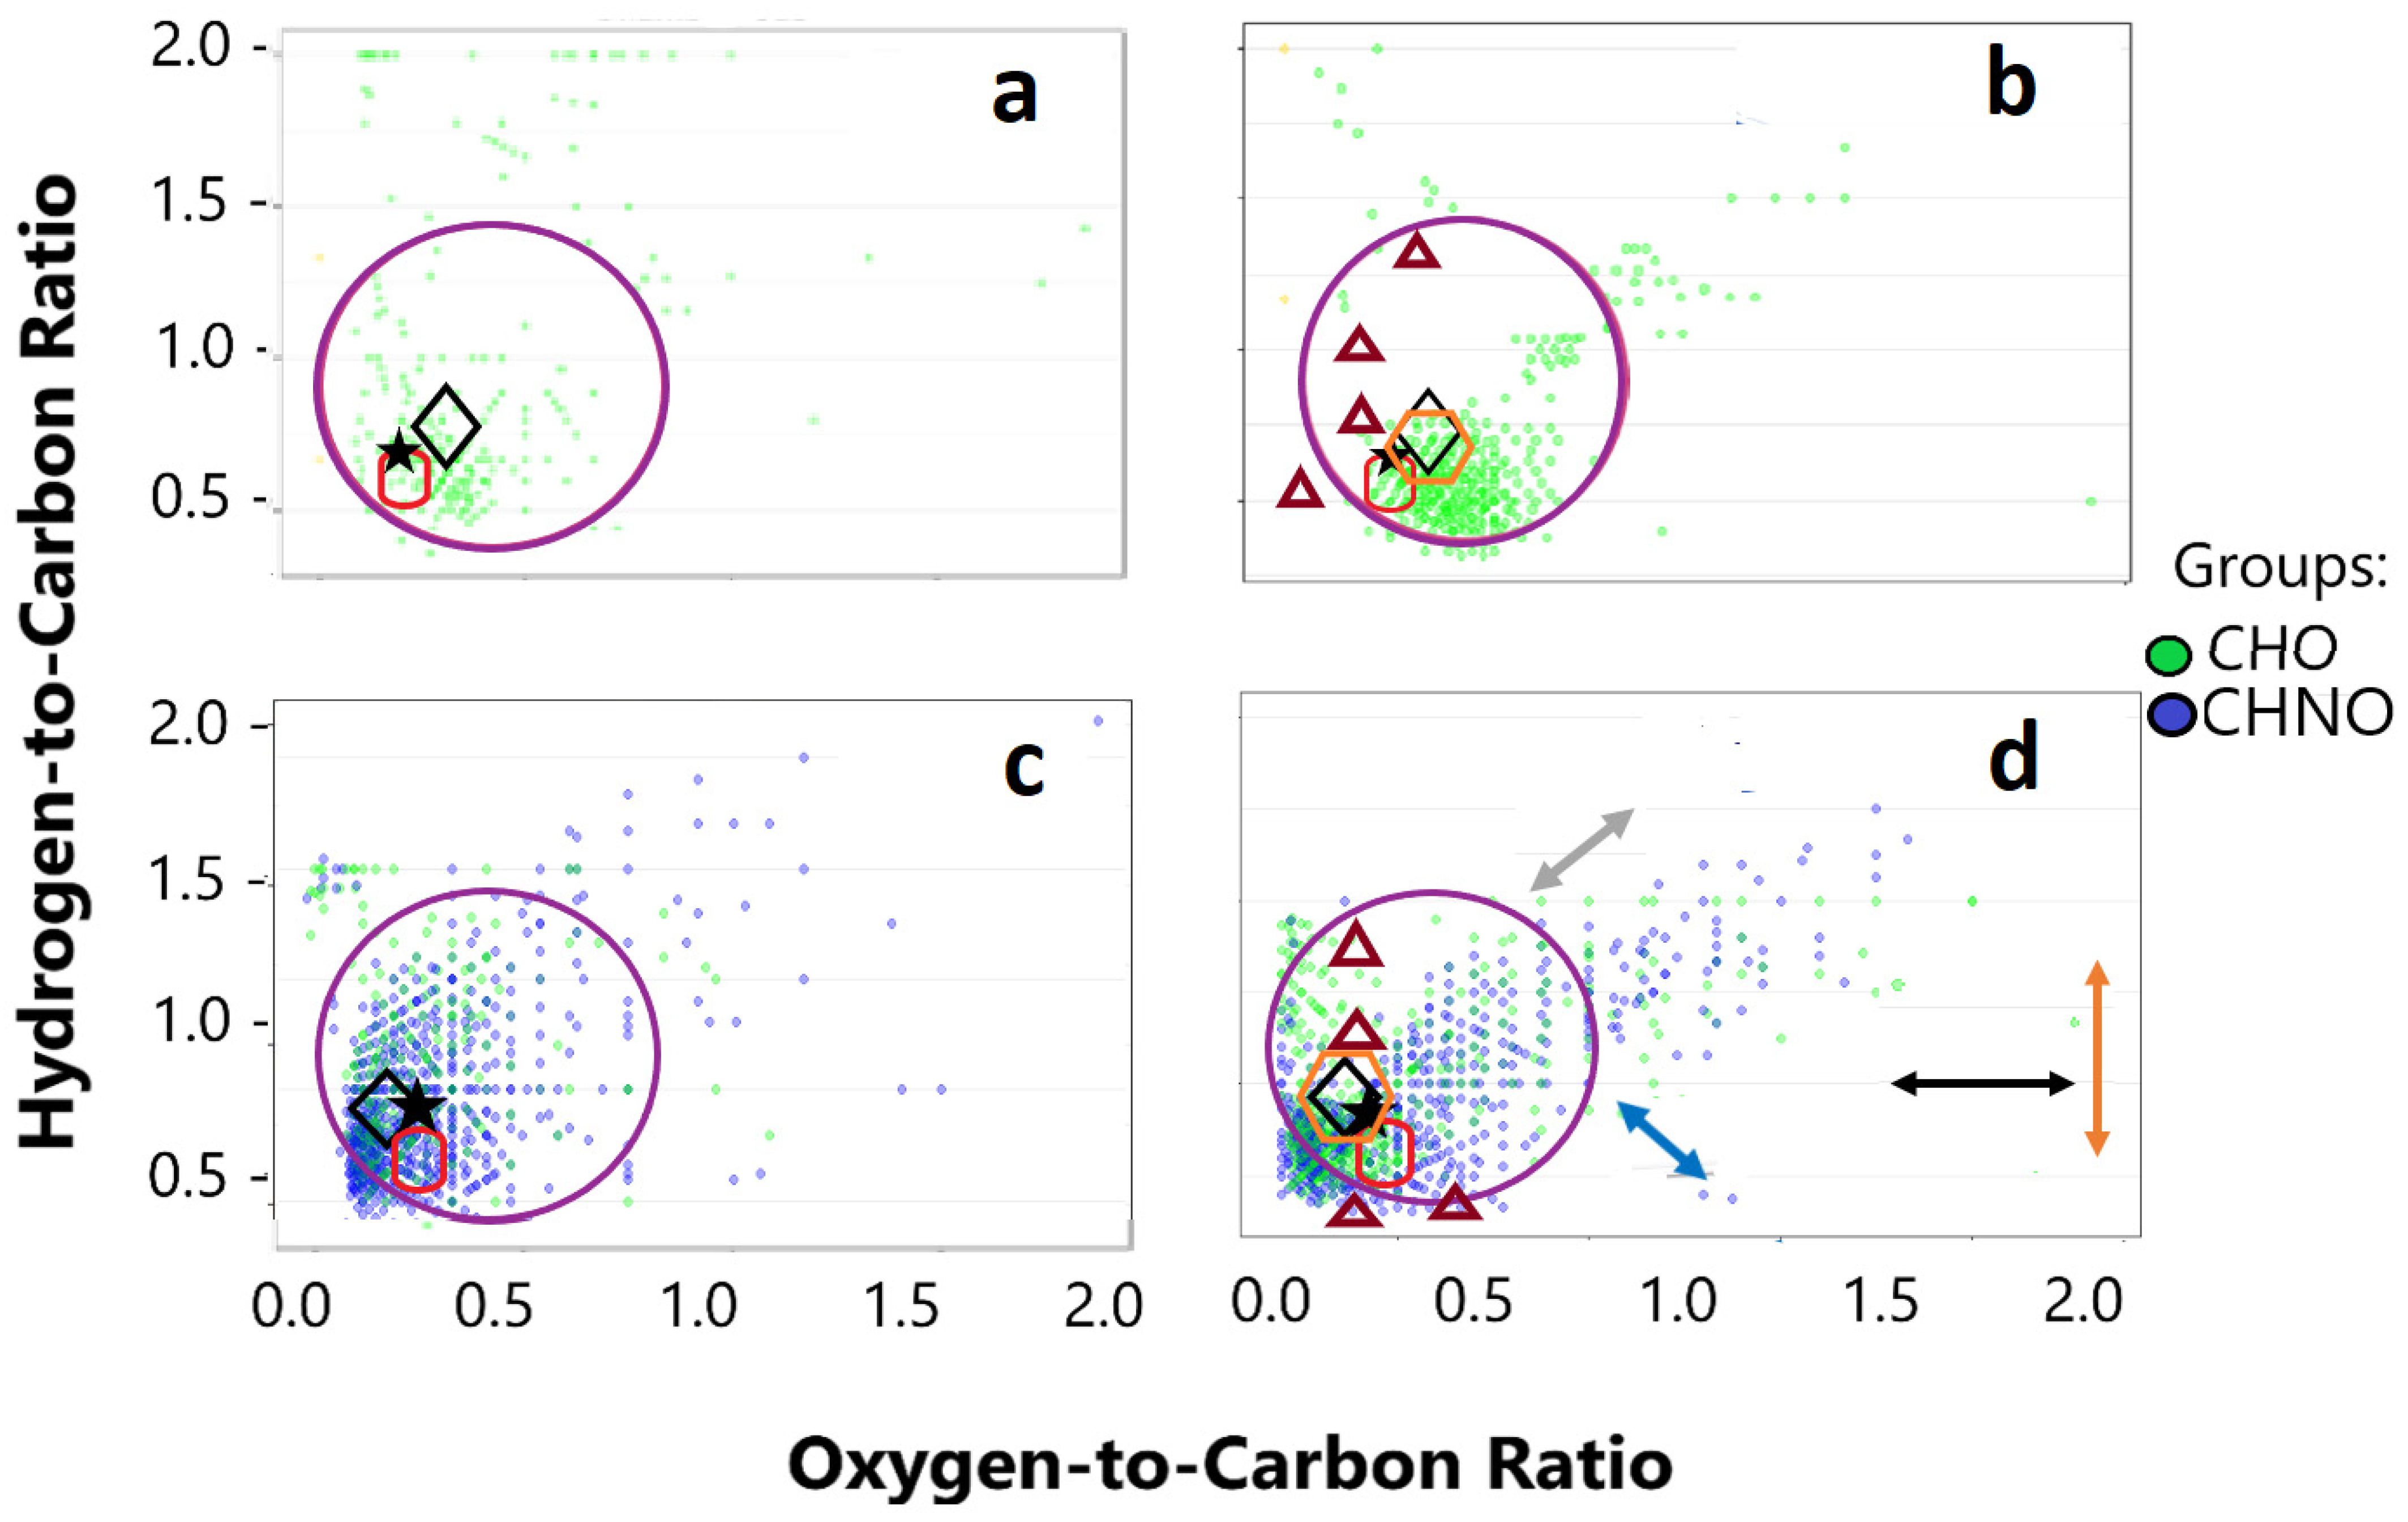
3.2. Mass Spectrometry Results
3.2.1. ESI-MS Results
3.2.2. MALDI-MS Results
3.3. Reduction Treatment Results
4. Discussion
5. Conclusions
Supplementary Materials
Author Contributions
Funding
Data Availability Statement
Acknowledgments
Conflicts of Interest
References
- Senesi, N.; Loffredo, E. The chemistry of soil organic matter. In Soil Physical Chemistry; CRC Press: Boca Raton, FL, USA, 2018; pp. 239–370. ISBN 9780203739280. [Google Scholar]
- Schnitzer, M. Soil organic matter—The next 75 years. Soil Sci. 1991, 151, 41–58. [Google Scholar] [CrossRef]
- Högberg, M.N.; Skyllberg, U.; Högberg, P.; Knicker, H. Does ectomycorrhiza have a universal key role the formation of soil organic matter in boreal forests? Soil Biol. Biochem. 2020, 140, 107635. [Google Scholar] [CrossRef]
- Poage, M.A.; Feng, X. A theoretical analysis of steady state δ13C profiles of soil organic matter. Glob. Biogeochem. Cycles 2004, 18. [Google Scholar] [CrossRef]
- Friedlingstein, P.; O’sullivan, M.; Jones, M.W.; Andrew, R.M.; Gregor, L.; Hauck, J.; Le Quéré, C.; Luijkx, I.T.; Olsen, A.; Peters, G.P. Global carbon budget 2022. Earth Syst. Sci. Data. 2022, 14, 4811–4900. [Google Scholar] [CrossRef]
- Fellman, J.B.; D’Amore, D.V.; Hood, E.; Boone, R.D. Fluorescence characteristics and biodegradability of dissolved organic matter in forest and wetland soils from coastal temperate watersheds in southeast Alaska. Biogeochemistry 2008, 88, 169–184. [Google Scholar] [CrossRef]
- Hansell, D.A.; Carlson, C.A. Biogeochemistry of Marine Dissolved Organic Matter; Academic Press: Cambridge, MA, USA, 2014; ISBN 978-0-12-405940-5. [Google Scholar]
- Welikala, D.; Hucker, C.; Hartland, A.; Robinson, B.H.; Lehto, N.J. Trace metal mobilization by organic soil amendments: Insights gained from analyses of solid and solution phase complexation of cadmium, nickel and zinc. Chemosphere 2018, 199, 684–693. [Google Scholar] [CrossRef]
- Jaffé, R.; McKnight, D.; Maie, N.; Cory, R.; McDowell, W.; Campbell, J. Spatial and temporal variations in DOM composition in ecosystems: The importance of long-term monitoring of optical properties. J. Geophys. Res. Biogeosci. 2008, 113. [Google Scholar] [CrossRef]
- Siletti, C.E.; Zeiner, C.A.; Bhatnagar, J.M. Distributions of fungal melanin across species and soils. Soil Biol. Biochem. 2017, 113, 285–293. [Google Scholar] [CrossRef]
- Kögel-Knabner, I. The macromolecular organic composition of plant and microbial residues as inputs to soil organic matter. Soil Biol. Biochem. 2002, 34, 139–162. [Google Scholar] [CrossRef]
- Leenheer, J.A.; Croué, J.-P. Peer reviewed: Characterizing aquatic dissolved organic matter. Environ. Sci. Technol. 2003, 37, 18A–26A. [Google Scholar] [CrossRef] [Green Version]
- Astoreca, R.; Rousseau, V.; Lancelot, C. Coloured dissolved organic matter (CDOM) in Southern North Sea waters: Optical characterization and possible origin. Estuar. Coast. Shelf Sci. 2009, 85, 633–640. [Google Scholar] [CrossRef]
- Stedmon, C.A.; Markager, S.; Bro, R. Tracing dissolved organic matter in aquatic environments using a new approach to fluorescence spectroscopy. Mar. Chem. 2003, 82, 239–254. [Google Scholar] [CrossRef]
- Zhang, Y.; Zhou, L.; Zhou, Y.; Zhang, L.; Yao, X.; Shi, K.; Jeppesen, E.; Yu, Q.; Zhu, W. Chromophoric dissolved organic matter in inland waters: Present knowledge and future challenges. Sci. Total Environ. 2021, 759, 143550. [Google Scholar] [CrossRef] [PubMed]
- Bell, A.A.; Wheeler, M.H. Biosynthesis and functions of fungal melanins. Annu. Rev. Phytopathol. 1986, 24, 411–451. [Google Scholar] [CrossRef]
- Skinner, C. The Occurrence in Soil of Bacteria, Actinomycetes, and Molds Capable of Transforming Tyrosine to Melanin or Other Pigments1. Soil Sci. Soc. Am. J. 1940, 4, 231. [Google Scholar] [CrossRef] [Green Version]
- Butler, M.; Day, A. Fungal melanins: A review. Can. J. Microbiol. 1998, 44, 1115–1136. [Google Scholar] [CrossRef]
- Frey, S.D. Mycorrhizal fungi as mediators of soil organic matter dynamics. Annu. Rev. Ecol. Evol. Syst. 2019, 50, 237–259. [Google Scholar] [CrossRef]
- Cao, W.; Zhou, X.; McCallum, N.C.; Hu, Z.; Ni, Q.Z.; Kapoor, U.; Heil, C.M.; Cay, K.S.; Zand, T.; Mantanona, A.J. Unraveling the structure and function of melanin through synthesis. J. Am. Chem. Soc. 2021, 143, 2622–2637. [Google Scholar] [CrossRef]
- Sun, S.; Zhang, X.; Sun, S.; Zhang, L.; Shan, S.; Zhu, H. Production of natural melanin by Auricularia auricula and study on its molecular structure. Food Chem. 2016, 190, 801–807. [Google Scholar] [CrossRef]
- Bianca, M.R.; Baluha, D.R.; Gonsior, M.; Schmitt-Kopplin, P.; Del Vecchio, R.; Blough, N.V. Contribution of ketone/aldehyde-containing compounds to the composition and optical properties of Suwannee River fulvic acid revealed by ultrahigh resolution mass spectrometry and deuterium labeling. Anal. Bioanal. Chem. 2020, 412, 1441–1451. [Google Scholar] [CrossRef]
- d’Ischia, M.; Napolitano, A.; Ball, V.; Chen, C.-T.; Buehler, M.J. Polydopamine and eumelanin: From structure–property relationships to a unified tailoring strategy. Acc. Chem. Res. 2014, 47, 3541–3550. [Google Scholar] [CrossRef] [PubMed]
- Dalzell, B.; Minor, E.; Mopper, K. Photodegradation of estuarine dissolved organic matter: A multi-method assessment of DOM transformation. Org. Geochem. 2009, 40, 243–257. [Google Scholar] [CrossRef]
- Dittmar, T.; Lennartz, S.T.; Buck-Wiese, H.; Hansell, D.A.; Santinelli, C.; Vanni, C.; Blasius, B.; Hehemann, J.-H. Enigmatic Persistence of Dissolved Organic Matter in the Ocean. Nat. Rev. Earth Environ. 2021, 2, 570–583. Available online: https://www.nature.com/natrevearthenviron (accessed on 1 February 2023). [CrossRef]
- Sharpless, C.M.; Blough, N.V. The importance of charge-transfer interactions in determining chromophoric dissolved organic matter (CDOM) optical and photochemical properties. Environ. Sci. Process. Impacts 2014, 16, 654–671. [Google Scholar] [CrossRef]
- Del Vecchio, R.; Blough, N.V. On the origin of the optical properties of humic substances. Environ. Sci. Technol. 2004, 38, 3885–3891. [Google Scholar] [CrossRef] [PubMed]
- Zonios, G.; Dimou, A. Melanin optical properties provide evidence for chemical and structural disorder in vivo. Opt. Express 2008, 16, 8263–8268. [Google Scholar] [CrossRef]
- Leresche, F.; Vialykh, E.A.; Rosario-Ortiz, F.L. Computational Calculation of Dissolved Organic Matter Absorption Spectra. Environ. Sci. Technol. 2021, 56, 491–500. [Google Scholar] [CrossRef] [PubMed]
- Wang, J.; Blancafort, L. Stability and optical absorption of a comprehensive virtual library of minimal eumelanin oligomer models. Angew. Chem. Int. Ed. 2021, 60, 18800–18809. [Google Scholar] [CrossRef]
- Perna, G.; Palazzo, G.; Mallardi, A.; Capozzi, V. Fluorescence properties of natural eumelanin biopolymer. J. Lumin. 2011, 131, 1584–1588. [Google Scholar] [CrossRef]
- Nighswander-Rempel, S.P.; Riesz, J.; Gilmore, J.; Meredith, P. A quantum yield map for synthetic eumelanin. J. Chem. Phys. 2005, 123, 194901. [Google Scholar] [CrossRef] [Green Version]
- Meredith, P.; Riesz, J. Radiative Relaxation Quantum Yields for Synthetic Eumelanin. Photochem. Photobiol. 2004, 79, 211–216. [Google Scholar] [CrossRef] [PubMed]
- Meredith, P.; Sarna, T. The physical and chemical properties of eumelanin. Pigment Cell Res. 2006, 19, 572–594. [Google Scholar] [CrossRef] [PubMed]
- McKay, G. Autoxidized hydroquinone mimics the optical properties of chromophoric dissolved organic matter. Environ. Sci. Technol. Lett. 2021, 8, 825–831. [Google Scholar] [CrossRef]
- Li, H.; McKay, G. Relationships between the physicochemical properties of dissolved organic matter and its reaction with sodium borohydride. Environ. Sci. Technol. 2021, 55, 10843–10851. [Google Scholar] [CrossRef]
- Del Vecchio, R.; Schendorf, T.M.; Blough, N.V. Contribution of quinones and ketones/aldehydes to the optical properties of humic substances (HS) and chromophoric dissolved organic matter (CDOM). Environ. Sci. Technol. 2017, 51, 13624–13632. [Google Scholar] [CrossRef]
- Yakimov, B.P. Oxidation of individual aromatic species gives rise to humic-like optical properties. Environ. Sci. Technol. Lett. 2022, 9, 452–458. [Google Scholar] [CrossRef]
- Hertkorn, N.; Frommberger, M.; Witt, M.; Koch, B.P.; Schmitt-Kopplin, P.; Perdue, E.M. Natural organic matter and the event horizon of mass spectrometry. Anal. Chem. 2008, 80, 8908–8919. [Google Scholar] [CrossRef]
- Hawkes, J.A.; d’Andrilli, J.; Agar, J.N.; Barrow, M.P.; Berg, S.M.; Catalán, N.; Chen, H.; Chu, R.K.; Cole, R.B.; Dittmar, T. An international laboratory comparison of dissolved organic matter composition by high resolution mass spectrometry: Are we getting the same answer? Limnol. Oceanogr. Meth. 2020, 18, 235–258. [Google Scholar] [CrossRef]
- Kim, S.; Kim, D.; Jung, M.J.; Kim, S. Analysis of environmental organic matters by Ultrahigh-Resolution mass spectrometry—A review on the development of analytical methods. Mass Spectrom. Rev. 2022, 41, 352–369. [Google Scholar] [CrossRef] [PubMed]
- Baluha, D.R.; Blough, N.V.; Del Vecchio, R. Selective mass labeling for linking the optical properties of chromophoric dissolved organic matter to structure and composition via ultrahigh resolution electrospray ionization mass spectrometry. Environ. Sci. Technol. 2013, 47, 9891–9897. [Google Scholar] [CrossRef]
- Cecchini, M.M.; Reale, S.; Manini, P.; d’Ischia, M.; De Angelis, F. Modeling Fungal Melanin Buildup: Biomimetic Polymerization of 1,8-Dihydroxynaphthalene Mapped by Mass Spectrometry. Chem. Eur. J. 2017, 23, 8092–8098. [Google Scholar] [CrossRef] [PubMed] [Green Version]
- Navalon, S.; Alvaro, M.; Alcaina, I.; Garcia, H. Multi-method characterization of DOM from the Turia river (Spain). Appl. Geochem. 2010, 25, 1632–1643. [Google Scholar] [CrossRef]
- Banerjee, A.; Supakar, S.; Banerjee, R. Melanin from the nitrogen-fixing bacterium Azotobacter chroococcum: A spectroscopic characterization. PLoS ONE 2014, 9, e84574. [Google Scholar] [CrossRef] [PubMed] [Green Version]
- Pralea, I.-E.; Moldovan, R.-C.; Petrache, A.-M.; Ilieș, M.; Hegheș, S.-C.; Ielciu, I.; Nicoară, R.; Moldovan, M.; Ene, M.; Radu, M. From extraction to advanced analytical methods: The challenges of melanin analysis. Int. J. Mol. Sci. 2019, 20, 3943. [Google Scholar] [CrossRef] [Green Version]
- Ye, M.; Guo, G.-Y.; Lu, Y.; Song, S.; Wang, H.-Y.; Yang, L. Purification, structure and anti-radiation activity of melanin from Lachnum YM404. Int. J. Biol. Macromol. 2014, 63, 170–176. [Google Scholar] [CrossRef]
- Babitskaya, V.; Shcherba, V.; Lkonnikova, N. Melanin complex of the fungusInonotus obliquus. Appl. Biochem. Microbiol. 2000, 36, 377–381. [Google Scholar] [CrossRef]
- Yoon, H.Y.; Jeong, H.J.; Cha, J.-Y.; Choi, M.; Jang, K.-S.; Kim, W.-Y.; Kim, M.G.; Jeon, J.-R. Structural variation of humic-like substances and its impact on plant stimulation: Implication for structure-function relationship of soil organic matters. Sci. Total Environ. 2020, 725, 138409. [Google Scholar] [CrossRef]
- Park, H.; Yang, I.; Choi, M.; Jang, K.-S.; Jung, J.C.; Choi, K.-Y. Engineering of melanin biopolymer by co-expression of MelC tyrosinase with CYP102G4 monooxygenase: Structural composition understanding by 15 tesla FT-ICR MS analysis. Biochem. Eng. J. 2020, 157, 107530. [Google Scholar] [CrossRef]
- Kim, S.; Simpson, A.J.; Kujawinski, E.B.; Freitas, M.A.; Hatcher, P.G. High resolution electrospray ionization mass spectrometry and 2D solution NMR for the analysis of DOM extracted by C18 solid phase disk. Org. Geochem. 2003, 34, 1325–1335. [Google Scholar] [CrossRef]
- Schendorf, T.M.; Del Vecchio, R.; Koech, K.; Blough, N.V. A standard protocol for NaBH4 reduction of CDOM and HS. Limnol. Oceanogr. Meth. 2016, 14, 414–423. [Google Scholar] [CrossRef] [Green Version]
- Schum, S.K.; Brown, L.E.; Mazzoleni, L.R. MFAssignR: Molecular formula assignment software for ultrahigh resolution mass spectrometry analysis of environmental complex mixtures. Environ. Res. 2020, 191, 110114. [Google Scholar] [CrossRef] [PubMed]
- Cory, R.M.; McKnight, D.M. Fluorescence spectroscopy reveals ubiquitous presence of oxidized and reduced quinones in dissolved organic matter. Environ. Sci. Technol. 2005, 39, 8142–8149. [Google Scholar] [CrossRef] [PubMed]
- Ma, J.; Del Vecchio, R.; Golanoski, K.S.; Boyle, E.S.; Blough, N.V. Optical properties of humic substances and CDOM: Effects of borohydride reduction. Environ. Sci. Technol. 2010, 44, 5395–5402. [Google Scholar] [CrossRef]
- Andrew, A.A.; Del Vecchio, R.; Subramaniam, A.; Blough, N.V. Chromophoric dissolved organic matter (CDOM) in the Equatorial Atlantic Ocean: Optical properties and their relation to CDOM structure and source. Mar. Chem. 2013, 148, 33–43. [Google Scholar] [CrossRef]
- Arzillo, M.; Mangiapia, G.; Pezzella, A.; Heenan, R.K.; Radulescu, A.; Paduano, L.; d’Ischia, M. Eumelanin buildup on the nanoscale: Aggregate growth/assembly and visible absorption development in biomimetic 5, 6-dihydroxyindole polymerization. Biomacromolecules 2012, 13, 2379–2390. [Google Scholar] [CrossRef]
- Chen, H.; Zheng, B.; Song, Y.; Qin, Y. Correlation between molecular absorption spectral slope ratios and fluorescence humification indices in characterizing CDOM. Aquat. Sci. 2011, 73, 103–112. [Google Scholar] [CrossRef]
- Rodríguez, F.J.; Schlenger, P.; García-Valverde, M. Monitoring changes in the structure and properties of humic substances following ozonation using UV–Vis, FTIR and 1H NMR techniques. Sci. Total Environ. 2016, 541, 623–637. [Google Scholar] [CrossRef]
- Yacobi, Y.Z.; Alberts, J.J.; Takacs, M.; McElvaine, M.L. Absorption spectroscopy of colored dissolved organic carbon in Georgia (USA) rivers: The impact of molecular size distribution. J. Limnol. 2003, 62, 41–46. [Google Scholar] [CrossRef]
- Helms, J.R.; Stubbins, A.; Ritchie, J.D.; Minor, E.C.; Kieber, D.J.; Mopper, K. Absorption spectral slopes and slope ratios as indicators of molecular weight, source, and photobleaching of chromophoric dissolved organic matter. Limnol. Oceanogr. 2008, 53, 955–969. [Google Scholar] [CrossRef] [Green Version]
- Weishaar, J.L.; Aiken, G.R.; Bergamaschi, B.A.; Fram, M.S.; Fujii, R.; Mopper, K. Evaluation of specific ultraviolet absorbance as an indicator of the chemical composition and reactivity of dissolved organic carbon. Environ. Sci. Technol. 2003, 37, 4702–4708. [Google Scholar] [CrossRef]
- Traina, S.J.; Novak, J.; Smeck, N.E. An ultraviolet absorbance method of estimating the percent aromatic carbon content of humic acids. J. Environ. Qual. 1990, 19, 151–153. [Google Scholar] [CrossRef]
- D’Andrilli, J.; Silverman, V.; Buckley, S.; Rosario-Ortiz, F.L. Inferring ecosystem function from dissolved organic matter optical properties: A critical review. Environ. Sci. Technol. 2022, 56, 11146–11161. [Google Scholar] [CrossRef] [PubMed]
- McDonald, S.; Bishop, A.G.; Prenzler, P.D.; Robards, K. Analytical chemistry of freshwater humic substances. Anal. Chim. Acta 2004, 527, 105–124. [Google Scholar] [CrossRef]
- Cozzolino, A.; Piccolo, A. Polymerization of dissolved humic substances catalyzed by peroxidase. Effects of pH and humic composition. Org. Geochem. 2002, 33, 281–294. [Google Scholar] [CrossRef]
- Olk, D.; Bloom, P.; Perdue, E.; McKnight, D.; Chen, Y.; Farenhorst, A.; Senesi, N.; Chin, Y.P.; Schmitt-Kopplin, P.; Hertkorn, N. Environmental and agricultural relevance of humic fractions extracted by alkali from soils and natural waters. J. Environ. Qual. 2019, 48, 217–232. [Google Scholar] [CrossRef]
- Piccolo, A.; Cozzolino, A.; Conte, P.; Spaccini, R. Polymerization of humic substances by an enzyme-catalyzed oxidative coupling. Naturwissenschaften 2000, 87, 391–394. [Google Scholar] [CrossRef]
- Haider, K.M.; Martin, J.P. Mineralization of 14C-labelled humic acids and of humic-acid bound 14C-xenobiotics by Phanerochaete chrysosporium. Soil Biol. Biochem. 1988, 20, 425–429. [Google Scholar] [CrossRef]
- Steffen, K.T.; Hatakka, A.; Hofrichter, M. Degradation of humic acids by the litter-decomposing basidiomycete Collybia dryophila. Appl. Environ. Microbiol. 2002, 68, 3442–3448. [Google Scholar] [CrossRef] [Green Version]
- Watt, A.A.; Bothma, J.P.; Meredith, P. The supramolecular structure of melanin. Soft Matter 2009, 5, 3754–3760. [Google Scholar] [CrossRef]
- Stenson, A.C.; Marshall, A.G.; Cooper, W.T. Exact masses and chemical formulas of individual Suwannee River fulvic acids from ultrahigh resolution electrospray ionization Fourier transform ion cyclotron resonance mass spectra. Anal. Chem. 2003, 75, 1275–1284. [Google Scholar] [CrossRef]
- Zhang, X.; Kang, J.; Chu, W.; Zhao, S.; Shen, J.; Chen, Z. Spectral and mass spectrometric characteristics of different molecular weight fractions of dissolved organic matter. Sep. Purif. Technol. 2020, 253, 117390. [Google Scholar] [CrossRef]
- Bridelli, M.G. Self-assembly of melanin studied by laser light scattering. Biophys. Chem. 1998, 73, 227–239. [Google Scholar] [CrossRef] [PubMed]


| Compound | Concentration in 1:10 ACN: Water Mixture | H2O2 | UV Irradiation Time | Storage in the Dark |
|---|---|---|---|---|
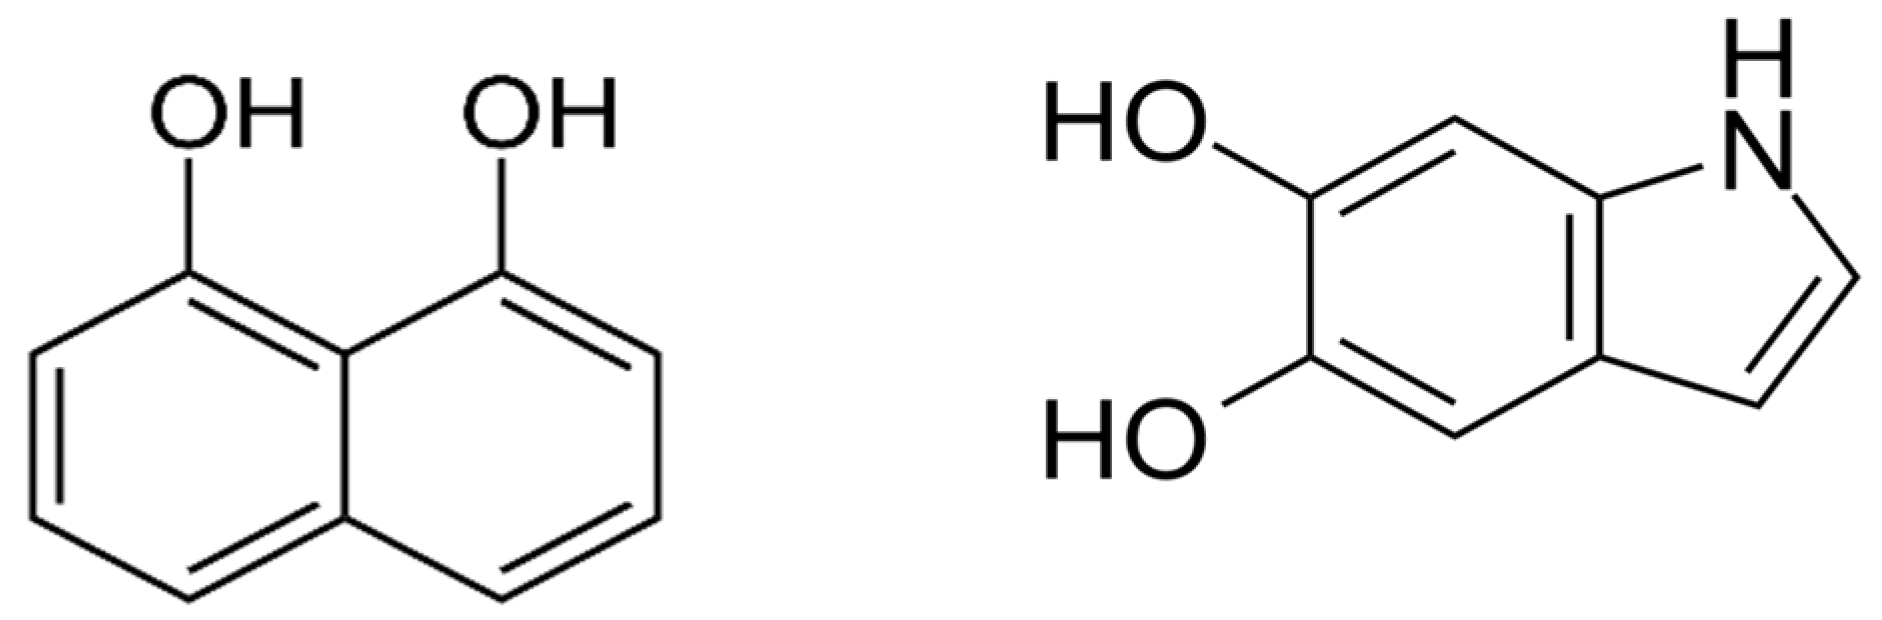
| 1,8-DHN | 0.0023 M | ___ | 3 h | 10 days |
| 5,6-DHI | 0.0008 M | ___ | 3 h | 4 days |
| 1,8-DHN | 0.0023 M | 5% v/v | 3 h | 10 days |
| 5,6-DHI | 0.0008 M | 5% v/v | 3 h | 4 days |
Disclaimer/Publisher’s Note: The statements, opinions and data contained in all publications are solely those of the individual author(s) and contributor(s) and not of MDPI and/or the editor(s). MDPI and/or the editor(s) disclaim responsibility for any injury to people or property resulting from any ideas, methods, instructions or products referred to in the content. |
© 2023 by the authors. Licensee MDPI, Basel, Switzerland. This article is an open access article distributed under the terms and conditions of the Creative Commons Attribution (CC BY) license (https://creativecommons.org/licenses/by/4.0/).
Share and Cite
Khademimoshgenani, N.; Green, S.A. Synthesis and Characterization of Humic/Melanin-like Compounds by Oxidative Polymerization of Simple Aromatic Precursors. Water 2023, 15, 1400. https://doi.org/10.3390/w15071400
Khademimoshgenani N, Green SA. Synthesis and Characterization of Humic/Melanin-like Compounds by Oxidative Polymerization of Simple Aromatic Precursors. Water. 2023; 15(7):1400. https://doi.org/10.3390/w15071400
Chicago/Turabian StyleKhademimoshgenani, Nastaran, and Sarah A. Green. 2023. "Synthesis and Characterization of Humic/Melanin-like Compounds by Oxidative Polymerization of Simple Aromatic Precursors" Water 15, no. 7: 1400. https://doi.org/10.3390/w15071400