Article

Projection of Future Meteorological Droughts in Lake Urmia Basin, Iran

1
Department of Meteorology and Climatology, Faculty of Earth Sciences and Spatial Management, Nicolaus Copernicus University in Toruń, Jurija Gagarina 11, 87-100 Toruń, Poland
2
Department of Geomatics and Cartography, Faculty of Earth Sciences and Spatial Management, Nicolaus Copernicus University in Toruń, Jurija Gagarina 11, 87-100 Toruń, Poland
3
Water, Energy, and Environmental Engineering Research Unit, University of Oulu, Pentti Kaiteran katu 1, P.O. Box 8000, 90014 Oulu, Finland
*
Author to whom correspondence should be addressed.
Water 2023, 15(8), 1558; https://doi.org/10.3390/w15081558
Submission received: 23 March 2023 / Revised: 12 April 2023 / Accepted: 14 April 2023 / Published: 16 April 2023
(This article belongs to the Special Issue Hydroclimatic Modeling and Monitoring under Climate Change)

Abstract

:
Future changes (2015–2100) in precipitation and meteorological droughts in Lake Urmia Basin were investigated using an average mean ensemble of eight general circulation models (GCMs) with high-resolution datasets in socioeconomic pathway scenarios (SSPs) from the Coupled Model Intercomparison Project (CMIP6). In order to project the drought, the standardized precipitation index (SPI) was calculated. Overall, the results revealed that precipitation in Lake Urmia Basin will decrease by 3.21% and 7.18% in the SSP1-2.6 and SSP5-8.5 scenarios, respectively. The results based on 6-month-timescale SPI indices projected more “Extremely dry” events in SSP5-8.5 scenarios. The frequency of “Extremely dry” months in SSP5-8.5 compared to SSP1-2.6 is expected to increase by 14, 7, 14, 10, 5, 14, and 7 months for the Mahabad, Maragheh, Saqez, Sarab, Tabriz, Takab, and Urmia stations, respectively. In contrast, the frequency of “Extremely wet” months will decline for all stations in Lake Urmia Basin. The results of this study provide useful insight for considering drought prevention measures to be implemented in advance for Lake Urmia Basin, which is currently experiencing various environmental issues.

1. Introduction

Drought is one of the most common and severe natural disasters and has serious economic and environmental effects on human communities. Severe and prolonged droughts can have disastrous consequences, including food shortages, loss of life, and large-scale migration, particularly in developing countries [1,2,3]. Climate change is expected to intensify meteorological and hydrological events and increase the frequency of droughts, particularly in arid and semi-arid regions [4,5]. In comparison with floods and landslides, droughts affect landscapes on a large scale, and their effects last for a long time [6]. Thus, the accurate estimation of drought in the context of climate change is crucial.
Droughts are categorized into four main categories based on the classification of Wilhite and Glantz [7]: meteorological, agricultural, hydrological, and socioeconomic. Several indices have been developed for monitoring droughts, such as the standardized precipitation index (SPI), Palmer drought severity index (PDSI), and standardized precipitation–evapotranspiration index (SPEI) [8,9]. Though the PDSI is most commonly used for drought analysis, it has certain drawbacks, such as its fixed temporal scale, high dependence on soil information, and autoregressive characteristics [10]. As an alternative, the SPEI is utilized to eliminate the downsides of the PDSI by normalizing the difference between monthly potential evapotranspiration (PET) and precipitation. However, different algorithms can be implemented for PET, resulting in a significant difference in drought monitoring [11]. In contrast, SPI stands out from PDSI and SPEI due to its simple calculation, flexibility in terms of timescales, and low data requirements (only precipitation) [12,13], which led to its recommendation by the World Meteorological Organization (WMO) as a preferred meteorological drought index [14]. The superiority of SPI indices in the evaluation of drought has been proved in different areas across the world, including South Africa, Finland, Turkey, Iran, and Italy [3,15,16,17,18].
This research focused on estimating meteorological droughts using the SPI in future climate change scenarios. Rather than being determined by the average precipitation of an area, meteorological droughts are characterized by variability in precipitation and can occur in any climate if there is a significant decrease in precipitation [19].
Iran is projected to experience a 35% decrease in annual precipitation and a 2.6 °C increase in temperature, making it one of the most vulnerable arid and semi-arid countries prone to drought in the Middle East [20]. In addition, in combination with environmental and management-related issues, Iran has been confronted with several environmental disasters, from the shrinking of rivers and lakes to the depletion of water resources, air pollution, drought, and floods [21,22,23,24,25]. Therefore, in Iran, the projection of future drought conditions in climate change scenarios is urgently needed to provide reliable information and reduce potential damage to ecosystems and water resources. Lake Urmia was once the second largest hypersaline lake in the world [26]. In the last few decades, anthropogenic activities such as river regulations, the expansion of irrigation, unsustainable management practices, and climate change have led to a significant decline in Lake Urmia’s water levels [21,27,28,29]. Due to its vulnerability to hydroclimatic events and occurrences such as drought, this region was chosen for a case study to assess how climate change affects meteorological droughts.
General circulation models (GCMs) are the most reliable tools for climate change modeling [30]. These models are from the Coupled Model Intercomparison Project (CMIP) project, provided by the Intergovernmental Panel on Climate Change (IPCC). Researchers use GCMs to project key meteorological parameters in order to address climate change issues. In Iran, these models have been widely used to project the development of climate variables in the future [24,31,32,33,34].
Numerous research has been conducted on drought prediction in Lake Urmia in the context of climate change [35,36,37]. However, these studies mainly used CMIP5 datasets to project droughts in the Lake Urmia Basin in representative concentration pathway (RCP) scenarios. Furthermore, most previous studies only evaluated droughts based on a few stations in the basin. In contrast, we projected precipitation and drought across all Lake Urmia Basin stations, using the latest climate dataset from CMIP6, in SSP scenarios.
The CMIP5 model has several notable shortcomings, including a lack of understanding of how the Earth’s system reacts to changes in forcing, the origins and effects of systematic model biases, and uncertainty surrounding scenarios. CMIP6 was developed and introduced to address these shortcomings as an improvement on CMIP5 [38]. CMIP6 offers significant advantages in climate projections through the integration of a new generation of scenarios known as Shared Socioeconomic Pathways (SSPs) with representative concentration pathways (RCPs) [39]. Therefore, the knowledge about future droughts should be updated based on this state-of-the-art dataset.
This study aimed to assess spatial and temporal changes in precipitation and calculate the frequency of meteorological droughts in the Lake Urmia Basin using the SPI indices based on different climate change scenarios from the latest report of the IPCC, CMIP6. The study aimed to provide insight into the likely effects of climate change on drought conditions in the basin and to support the development of effective mitigation strategies designed to cope with the adverse impacts of drought on the lake’s water storage and the surrounding region.

2. Materials and Methods

The Lake Urmia Basin, located between latitudes 35° and 38° N and longitudes 44° and 47° E, covers an area of 51,801 km2 (Figure 1). According to data from the Iran Meteorological Organization (IMO), the basin receives an average of 311 mm of precipitation annually (Table 1) and has an average annual temperature of 11.4 °C.

2.1. Datasets

We used the following datasets for this study:
(1)
The daily precipitation data taken from 7 synoptic stations from 1986–2014 were provided by the Iran Meteorological Organization (IRIMO) (Table 1, Figure 1). These datasets form the measured synoptic dataset for Iran (www.data.irimo.ir) (accessed on 10 May 2017).
(2)
The precipitation dataset of the GCMs from CMIP6 for the historical reference (1950–2014) and future (2015–2100) periods were obtained from the NASA Earth Exchange Global Daily Downscaled Projections (NEX-GDDP) (accessed on 22 November 2022, https://registry.opendata.aws/nex-gddp-cmip6/).

2.2. Methods

To assess future meteorological droughts, we applied three steps: (i) the projection of future precipitation for the study area stations in the SSP1-2.6 and SSP5-8.5 scenarios; (ii) the calculation of the SPI based on future precipitation; and (iii) the evaluation of future meteorological droughts in Lake Urmia Basin for a future period.
GCMs are the most popular and reliable tools for understanding future climatic parameter variations (i.e., temperature and precipitation). GCMs can produce different projections because of differences in their underlying representations of Earth system processes. Consequently, no single GCM shows a reliable future climate projection. As a result, climate projections are more reliable if they are based on an ensemble of models (e.g., averaging the results), since the ensemble considers the model uncertainty of model projections [40,41]. Hence, an average ensemble of several GCMs from CMIP6 (Table 2) were employed to project precipitation variations in the context of climate change in Lake Urmia Basin. In order to ensure that the employed average mean ensemble values for precipitation were reliable, these values were compared with the observation dataset. The detailed features of the GCMs employed in this research are illustrated in Table 2. The validity of these GCMs in the Lake Urmia Basin and northwest Iran has been approved in previous studies [36,42,43,44].
The employed models are based on two climate change scenarios from CMIP6, namely, the SSP1-2.6 and SSP5-8.5 scenarios. The SSP1-2.6 and SSP5-8.5 scenarios are considered to be the highest-mitigation and highest-emission scenarios, respectively [45]. The selected GCMs in the SSP scenarios are from the state-of-the-art, high-resolution NEX-GDDP datasets from CMIP6 [46,47]. These datasets were statistically downscaled to a finer resolution. In addition, the Bias Correction Spatial Disaggregation (BCSD) method was applied to reduce biases in regional studies [46,48]. The reliability of this dataset has been approved in the latest studies [49,50,51].
This study used the projected future precipitation values from SSP1-2.6 and SSP5-8.5 scenario from CMIP6 as input data for the projection of future droughts.

2.3. Drought Indices

Drought indices are the most common method for monitoring droughts [19]. The SPI is the most widely used drought index [12,52]. The SPI is a powerful and straightforward statistical indicator for analyzing droughts on various spatial and temporal scales based on the probability of precipitation. The SPI is calculated by converting the gamma distribution to a normal distribution. The SPI is calculated by fitting long-term precipitation data to a probability distribution and then transforming it into a standard distribution. Calculating the index involves taking the difference between the mean and standard deviation of precipitation over a specified period and dividing the result by the standard deviation. Nevertheless, precipitation data should be evaluated beforehand according to the gamma distribution. The drought severity calculated for the SPI can be classified as illustrated in Table 3. In order to calculate the SPI, the equation provided below was used. Detailed information about the calculation of drought SPI is provided in Equation S1 in the Supplementary Materials.
S P I = P i P ¯ σ
where Pi is the precipitation in the relevant period of i, P ¯ is the mean, and σ is the standard deviation.
SPI indices have been approved for the projection of future droughts in SSP scenarios in recent studies [53,54,55]. A variety of durations are available for the SPI, such as 1, 3, 6, and 12 months. According to the WMO [14], SPI6 can demonstrate seasonal precipitation trends and present a clear trend in precipitation throughout the entire season. Hence, SPI indices for 6-month periods were computed in this study to assess dryness or wetness in Lake Urmia Basin.

2.4. Evaluation of Model Performance

The performance of the selected GCM model, in comparison with the observation data, was evaluated. There are several evaluation criteria used to assess climate model performance [56]. In the evaluation of the model’s performance, the root mean square error (RMSE) and coefficient of determination (R-square) were used. The mathematical equations for calculating the RMSE and R-square are depicted in Equations (2) and (3). The best model performance between the predicted data and observed data provided values of R2  =  1 and RMSE  =  0:
R M S E = 1 t   i t ( H i O i ) 2
R 2 = [ i = 1 t ( O i H i ¯ ) ( O i H i ¯ ) ] 2 i = 1 t ( O i O i ¯ ) 2   × i = 1 t ( H i H i ¯ ) 2
where t is the time period, Oi and Hi are the observed precipitation and historical precipitation values at the i time, and O ¯ i and H ¯ i are the means of the observed and predicted values, respectively.

3. Results

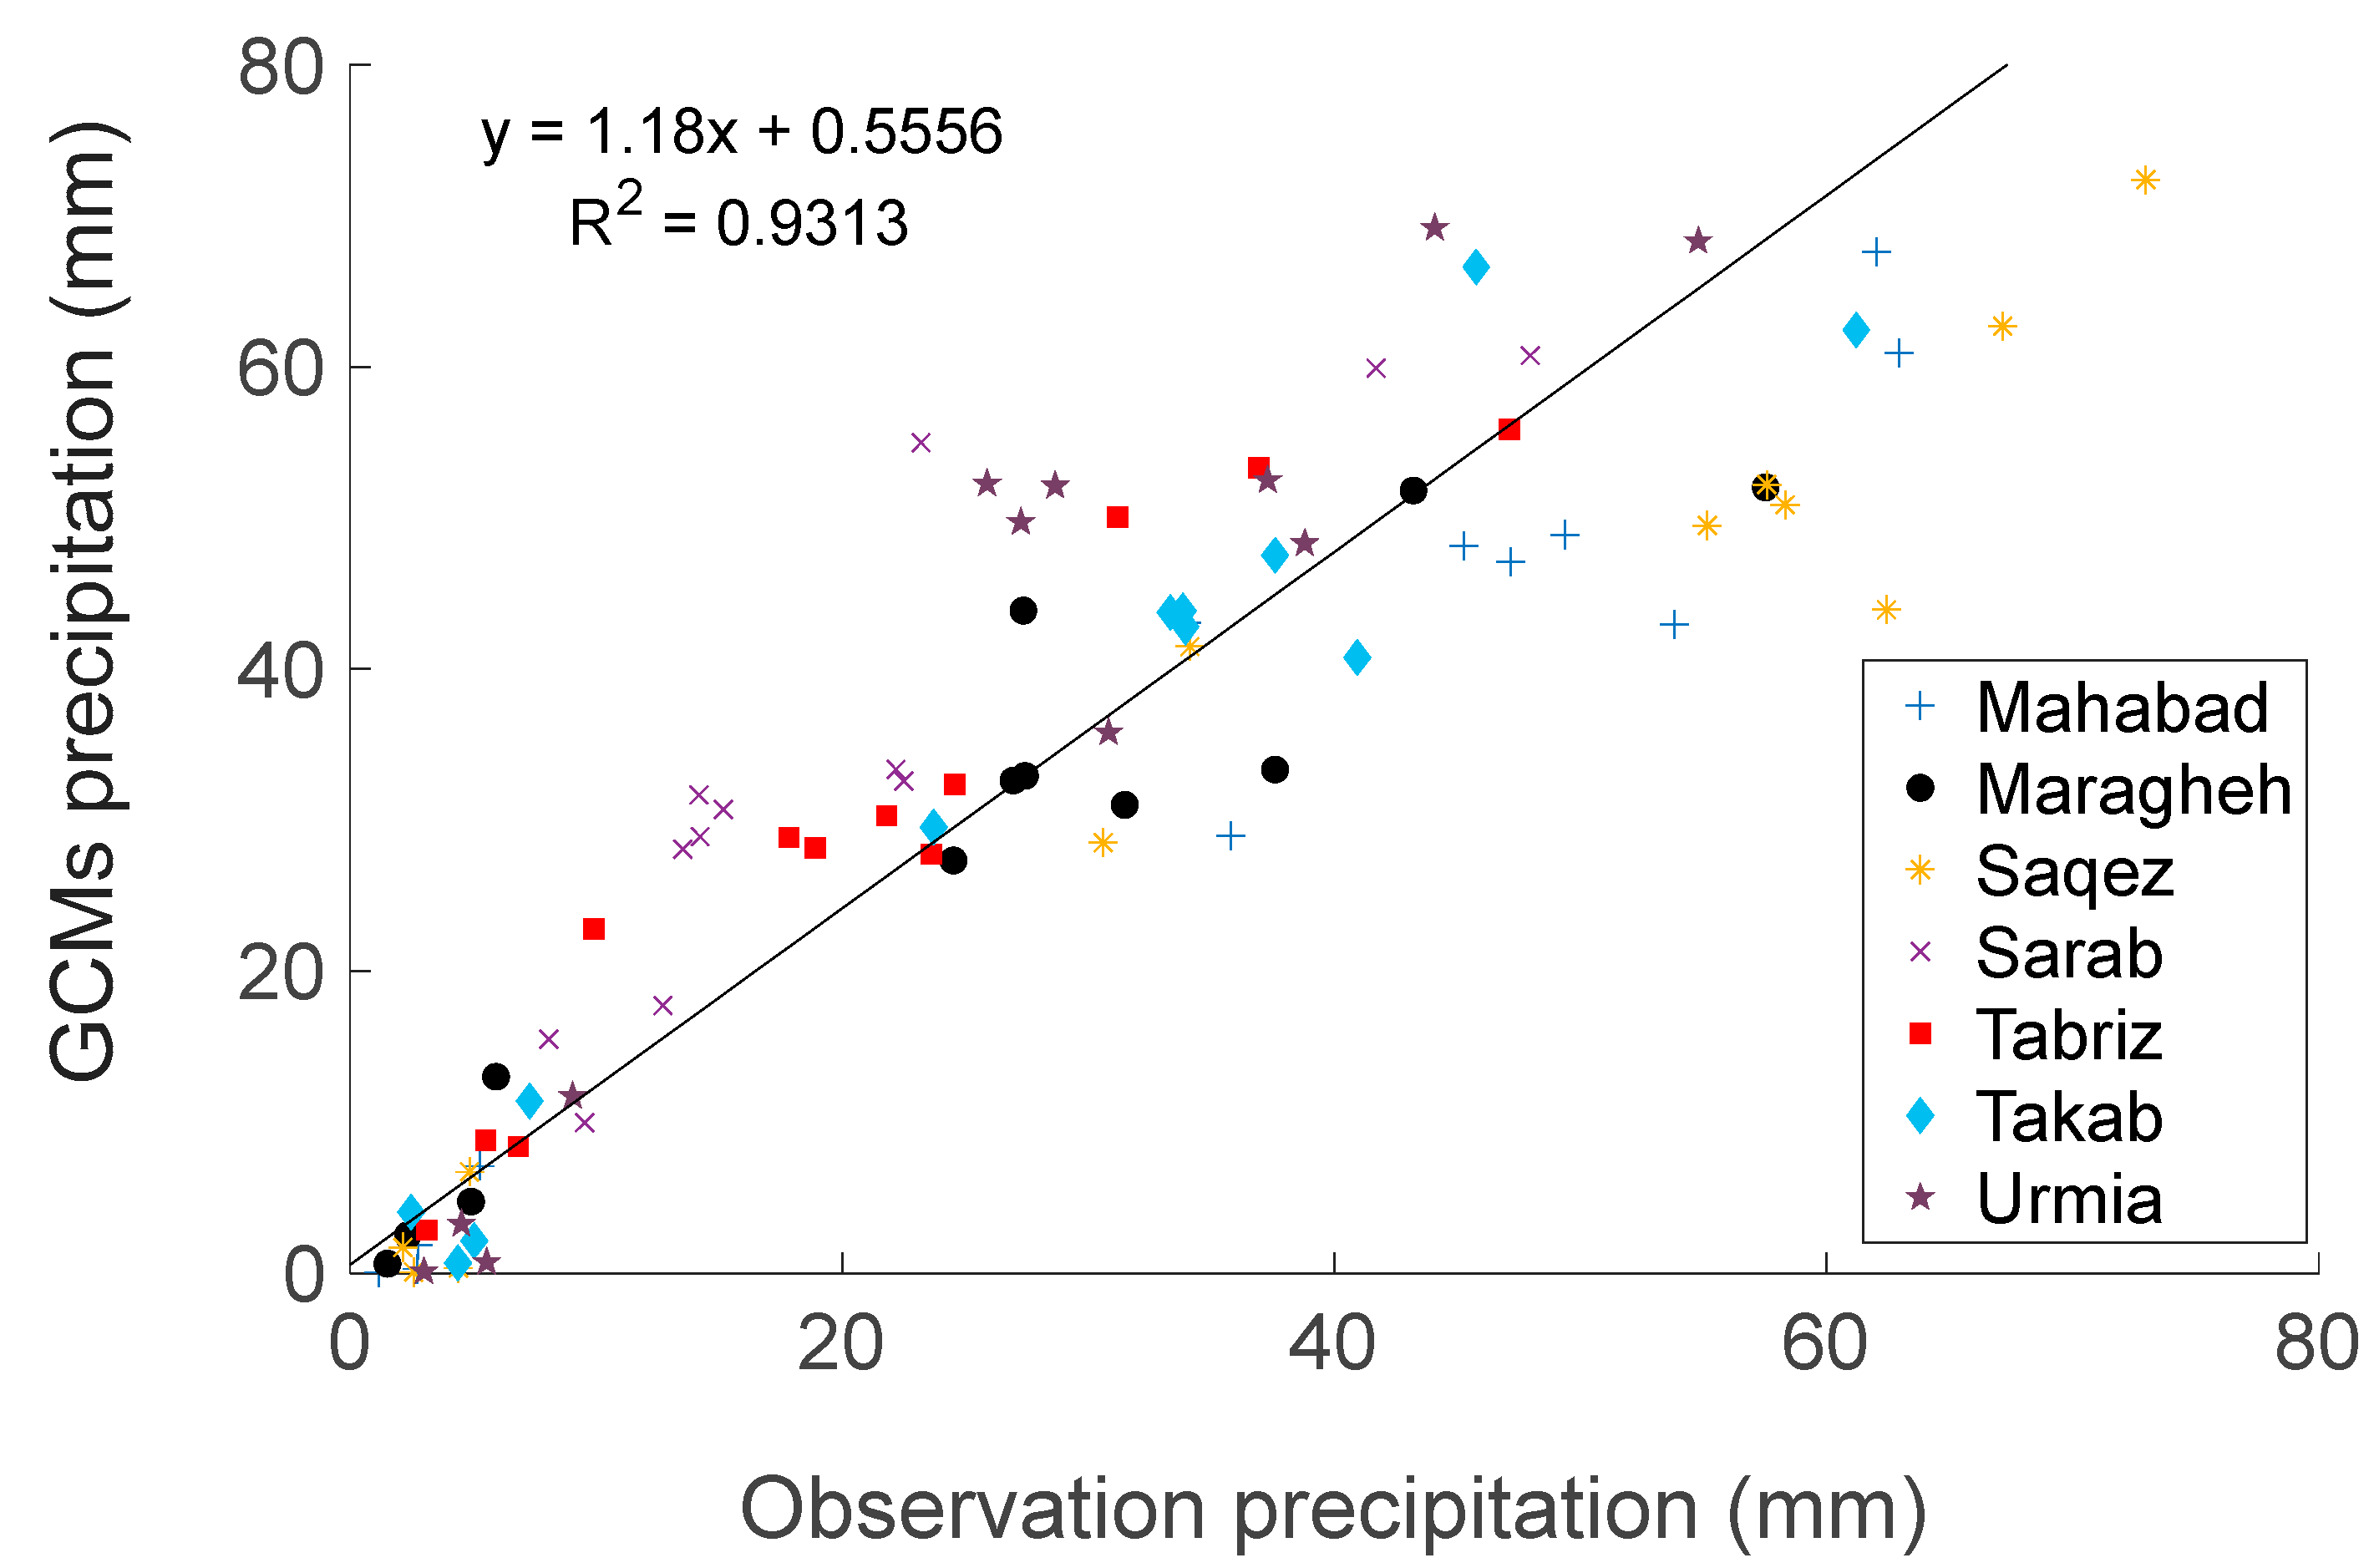
In the projection of future precipitation, an average ensemble of eight GCMs were selected. The comparison of the observed precipitation and the ensemble of historical GCMs is depicted in Figure 2 in scatterplot form. Additionally, Table 4 shows the RMSE values for all the stations in Lake Urmia Basin.
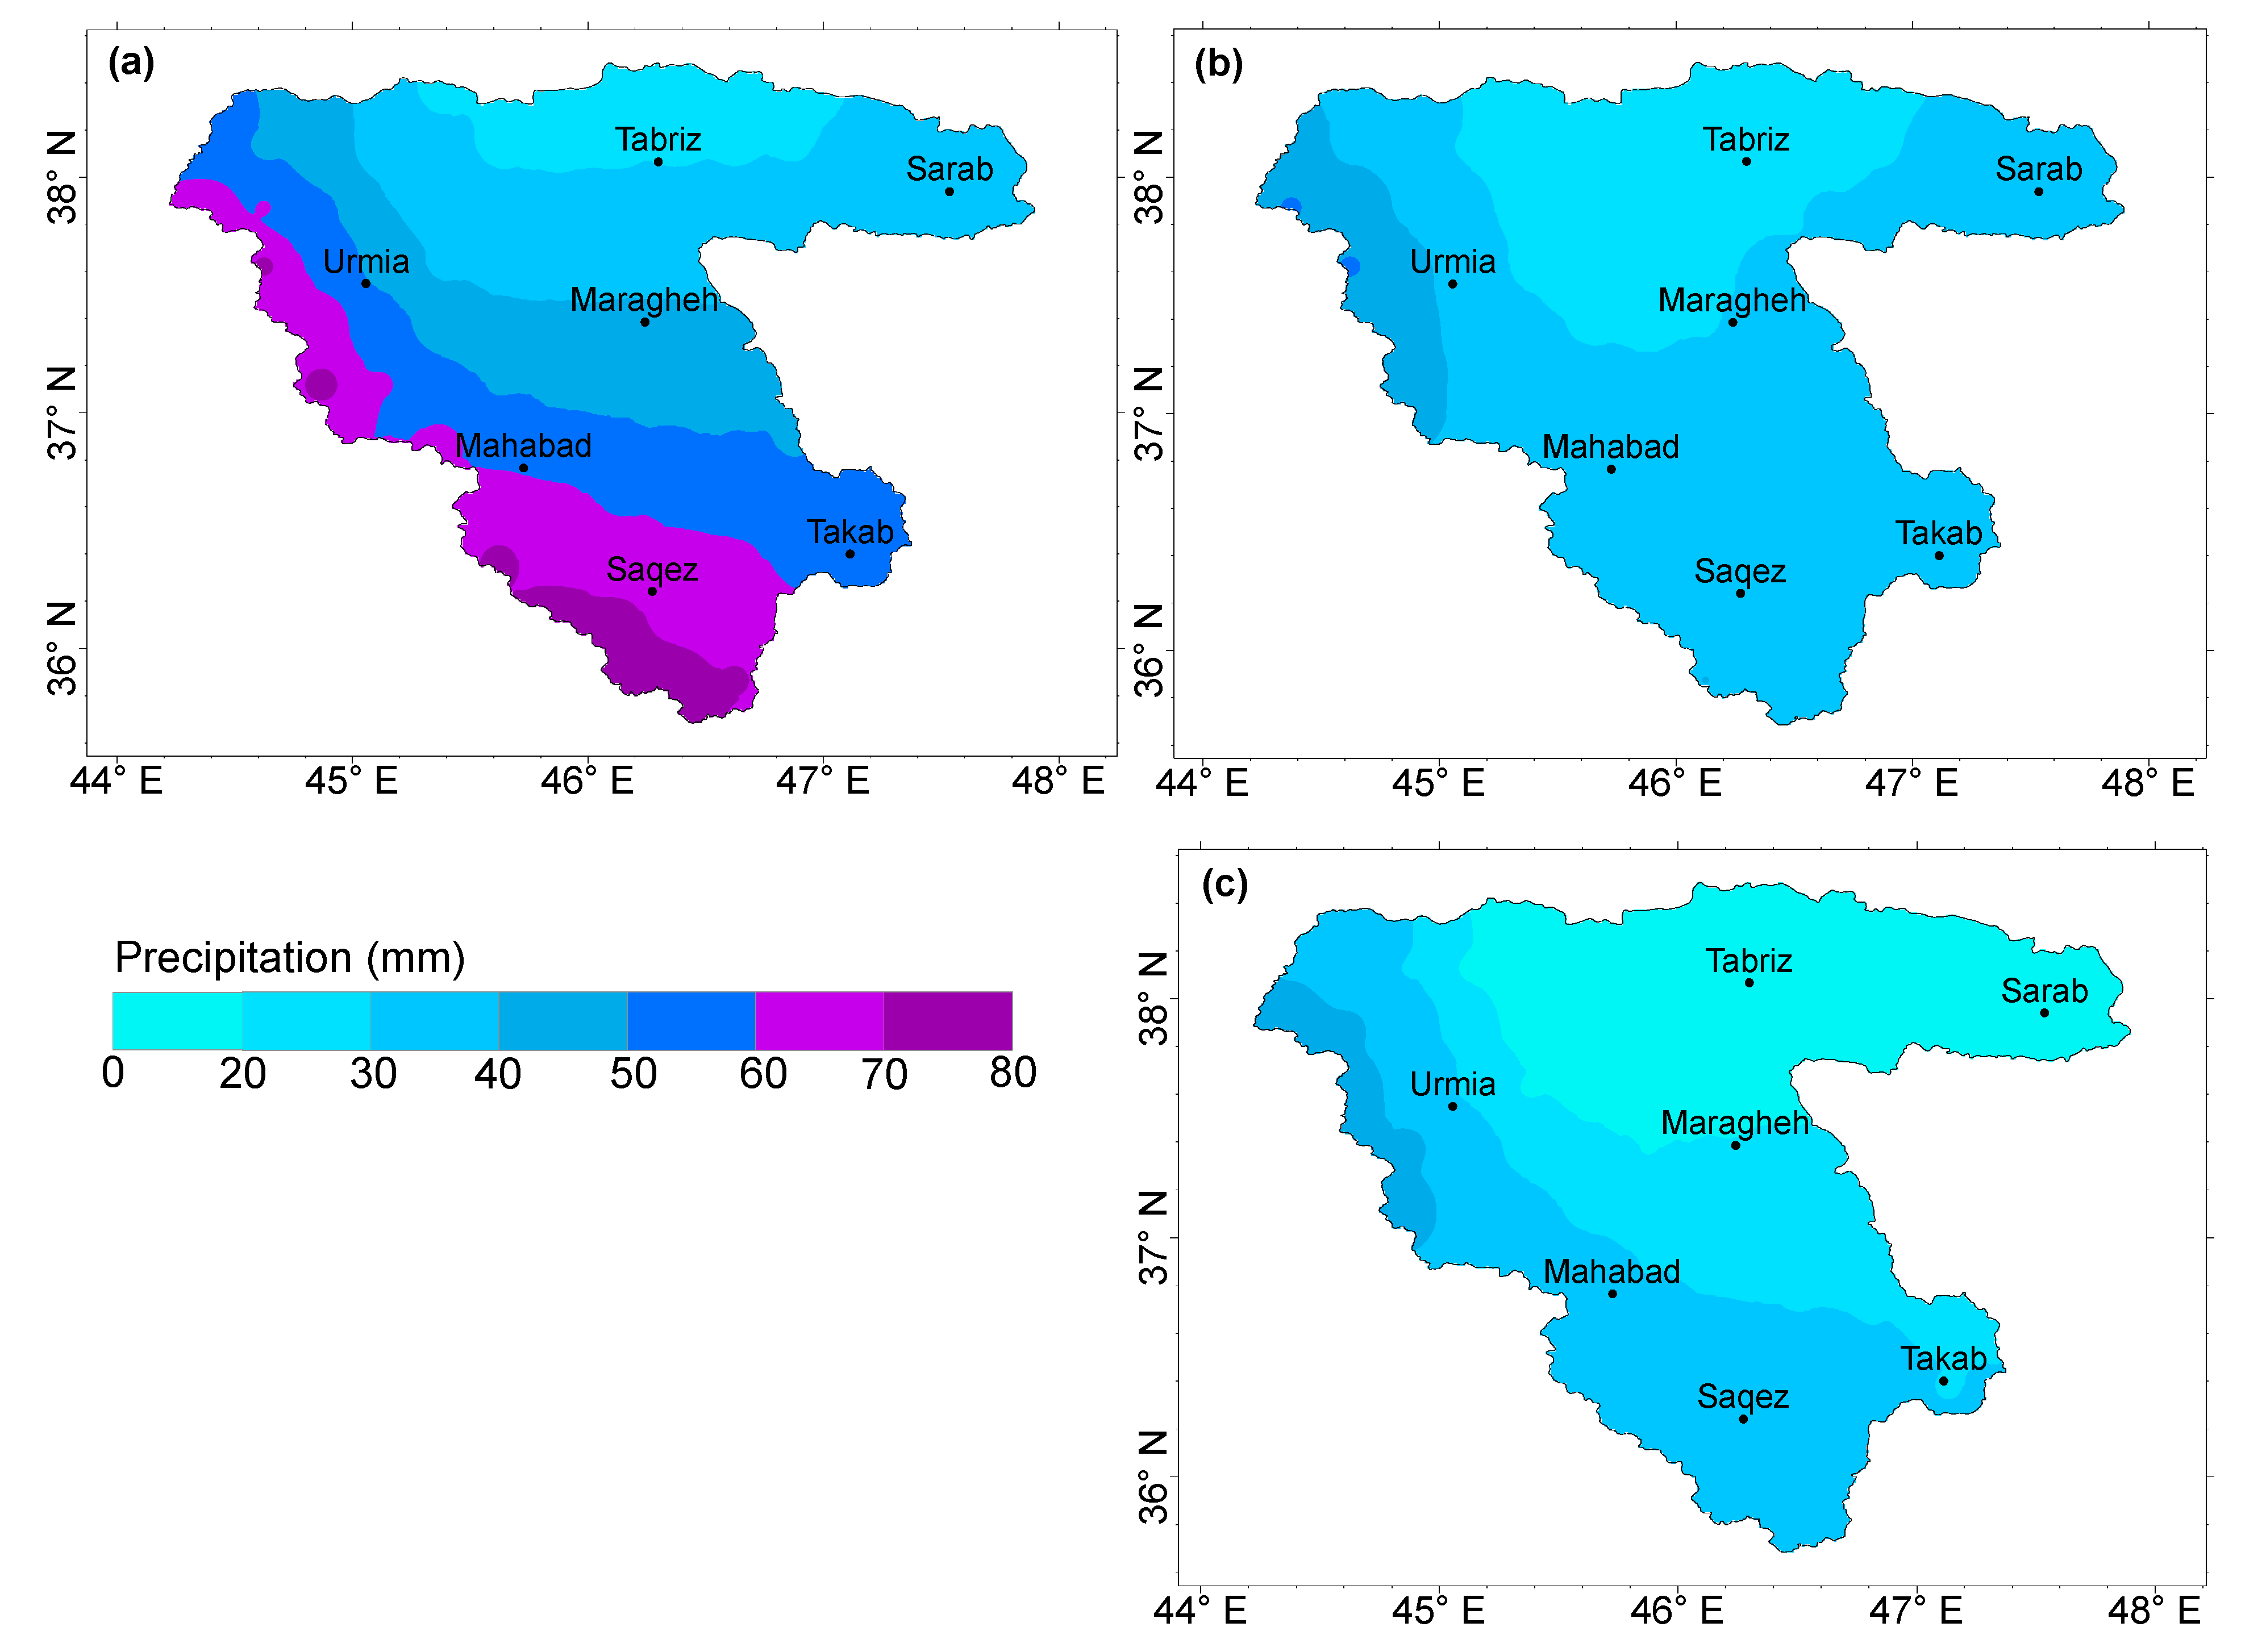
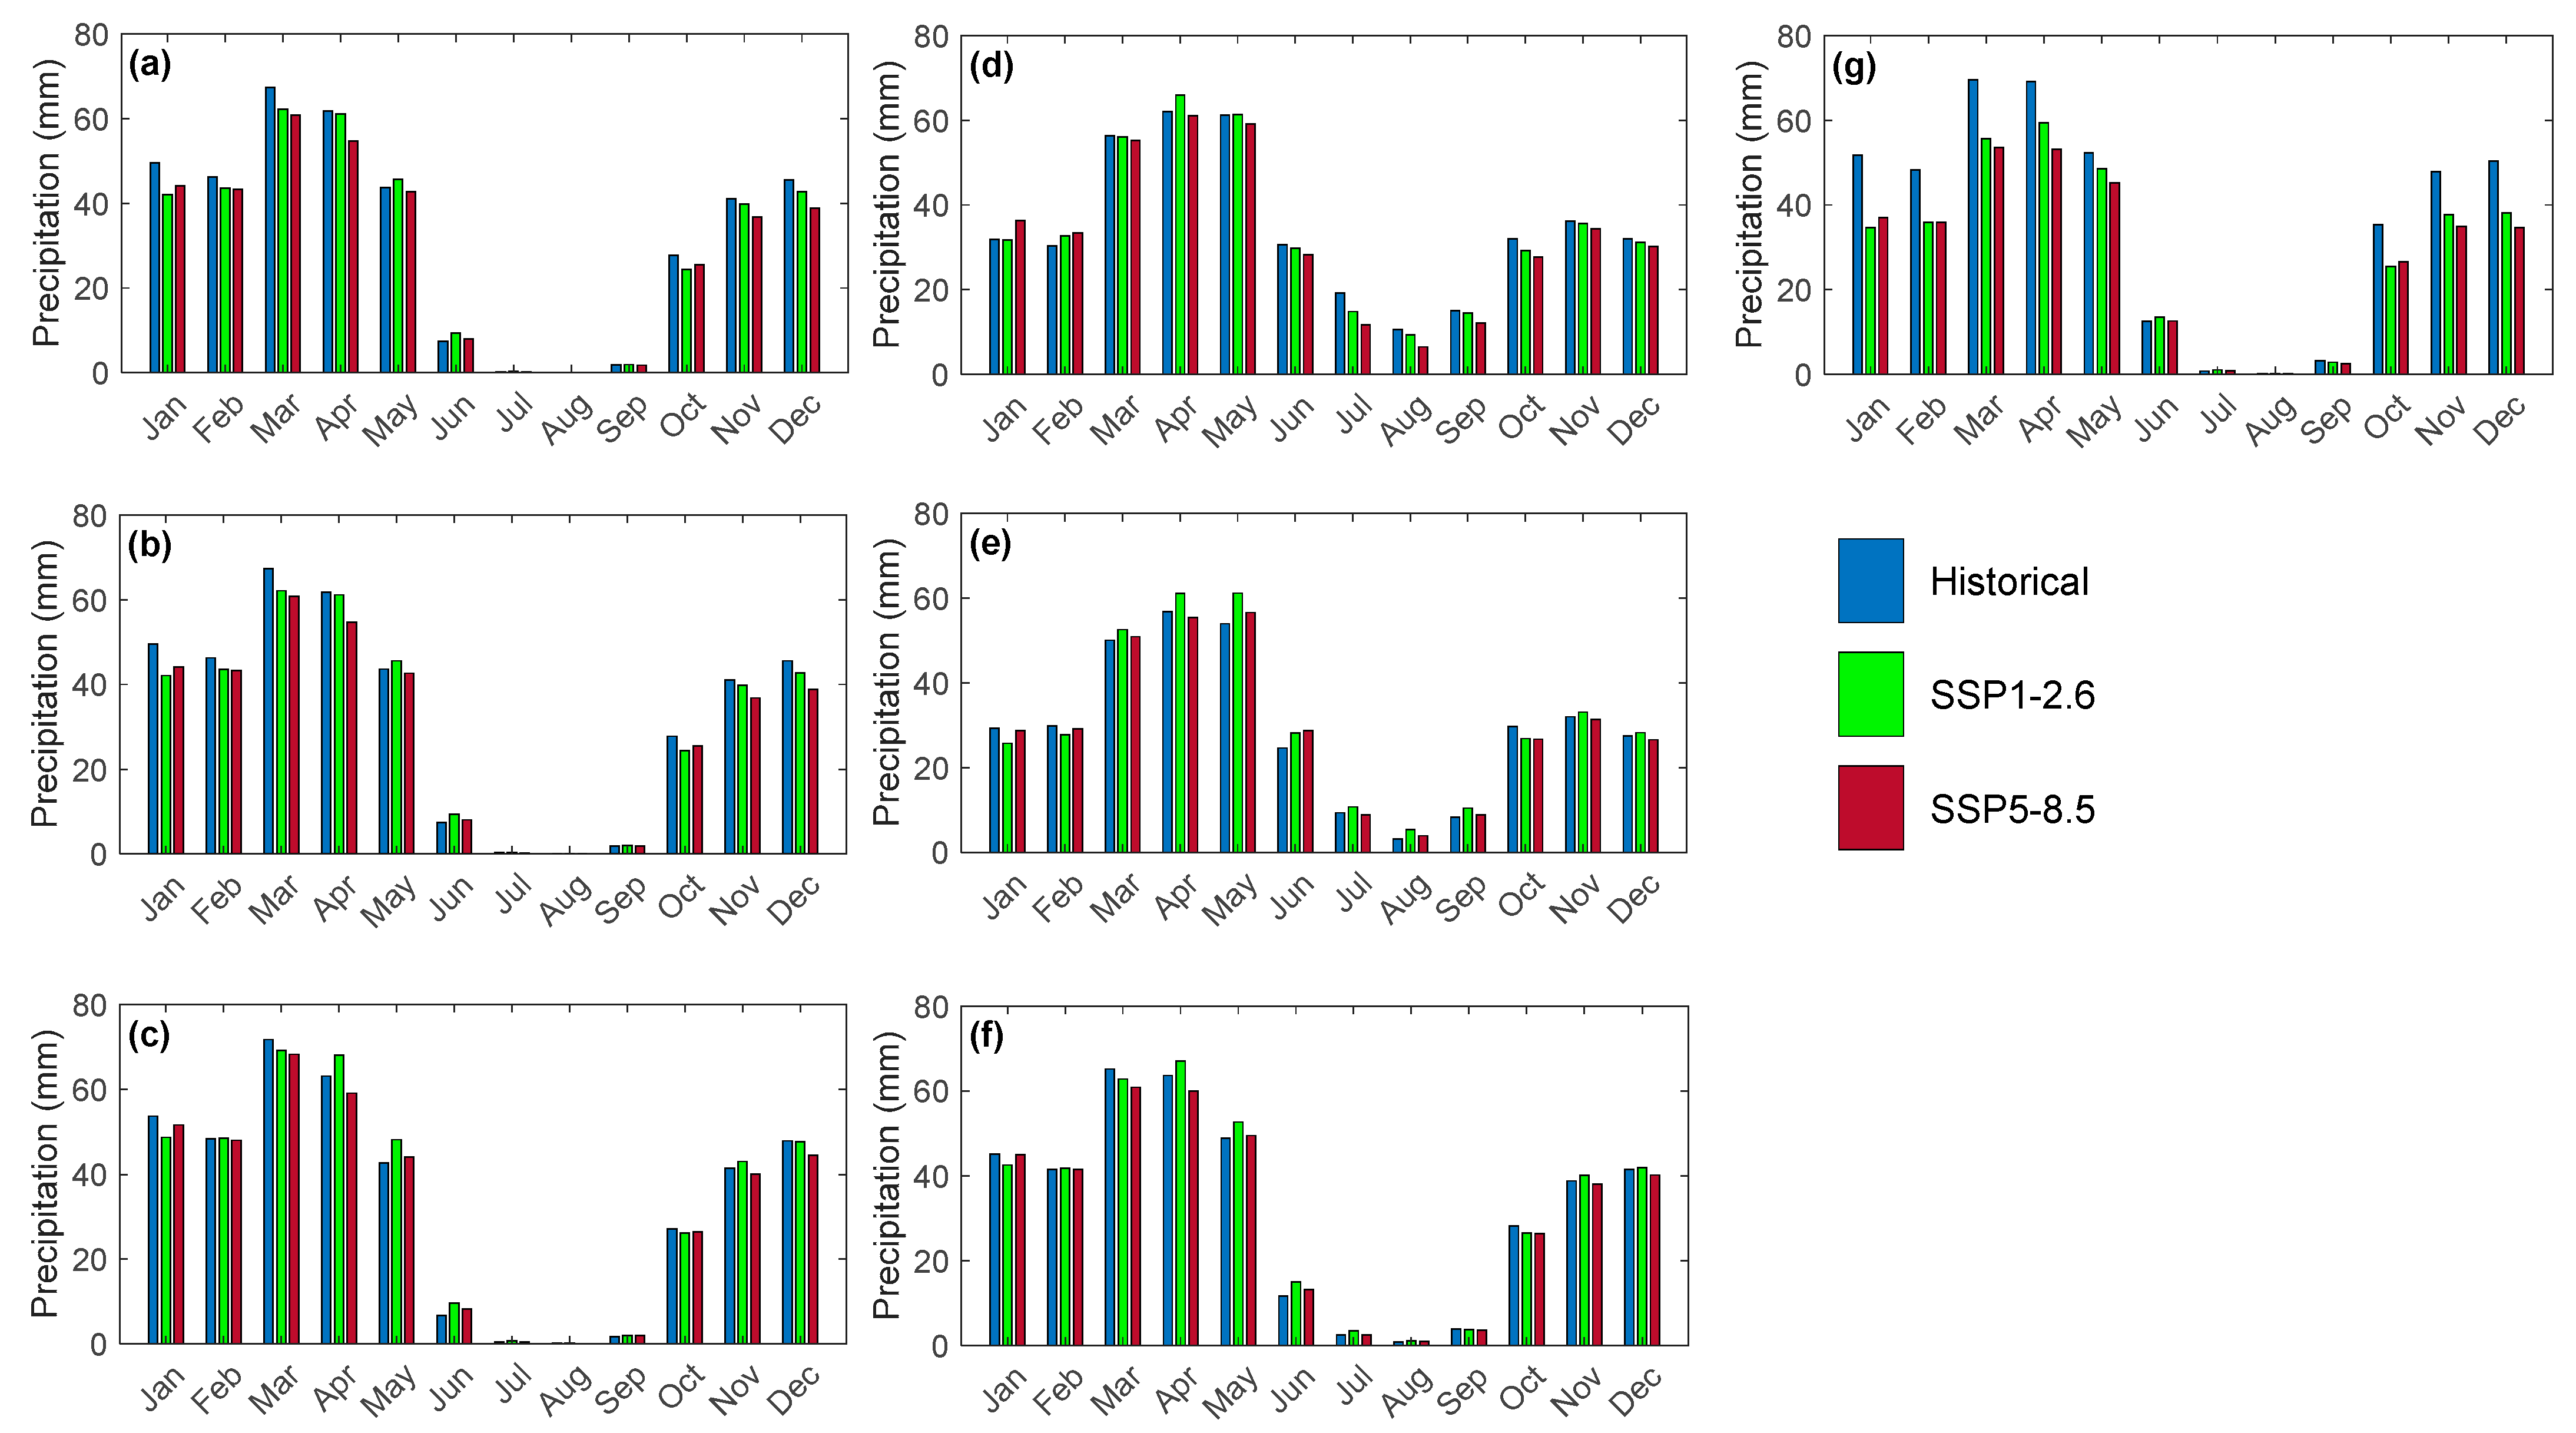
The comparisons of the observational data with the historical GCMs depicted in Figure 2 and Table 4 show that the RMSE and R-square values are in the ranges of 5.03–8.64 and 0.89–0.95. These results reveal that the chosen GCMs have a strong association with the data. Therefore, an average ensemble mean of the eight GCMs in the SSP1-2.6 and SSP5-8.5 scenarios was used to project the monthly precipitation for 2015–2100. The comparison of the projected precipitation results for SSP1-2.6 and SSP5-8.5, using historical reference data in the form of temporal changes, was conducted with the inverse distance weighting (IDW) interpolation method in ArcGIS software (10.8.1), as depicted in Figure 3. In addition, Figure 4 and Figure 5 represent the projections of annual and monthly precipitation across the study stations.
The projection of precipitation in the future period (2015–2100) in Lake Urmia Basin shows that in both scenarios (SSP1-2.6 and SSP5-8.5), precipitation will decline in comparison with the historical reference period (1950–2014).
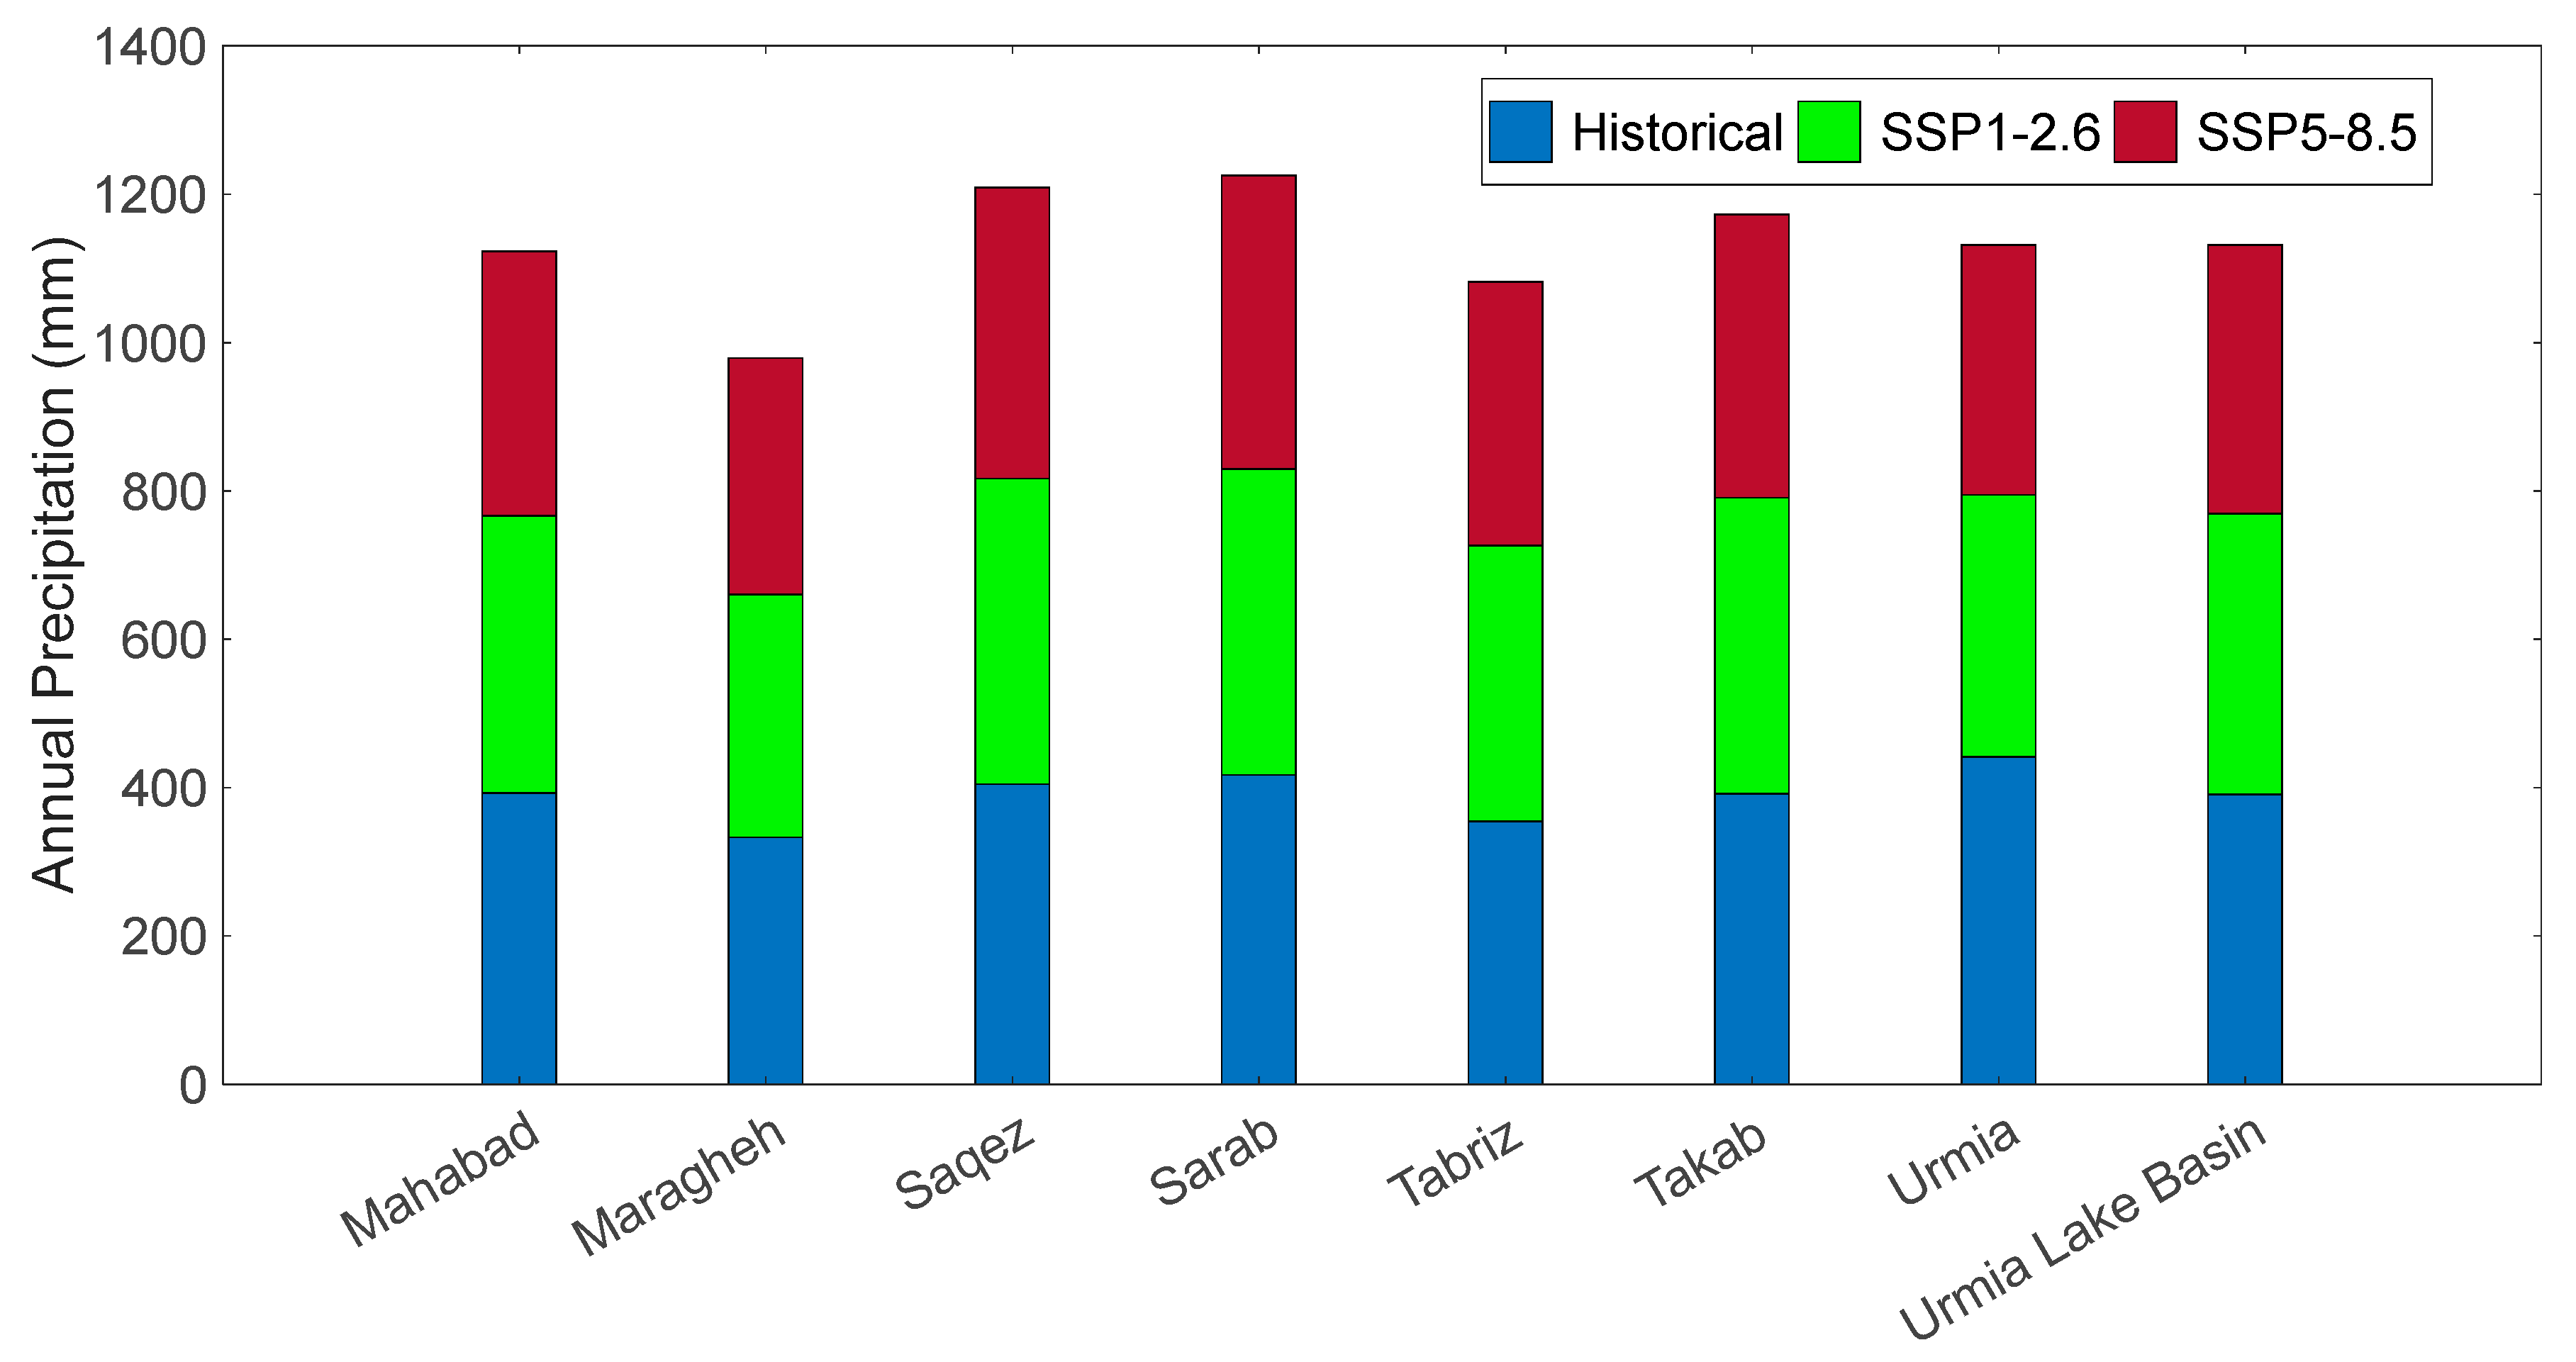
An average ensemble of eight GCMs from CMIP6 were used to carry out projections of future precipitation in the SSP1-2.6 and SSP5-8.5 scenarios. Lake Urmia Basin will experience a decline in precipitation during the projected period (2015–2100), excepting a few months in the highest-mitigation scenario (SSP1-2.6). The average annual precipitation is estimated to decrease from 390.83 mm during the reference period (1950–2014) to 378.29 mm and 362.75 mm in the SSP1-2.6 and SSP5-8.5 scenarios, respectively (Figure 4).
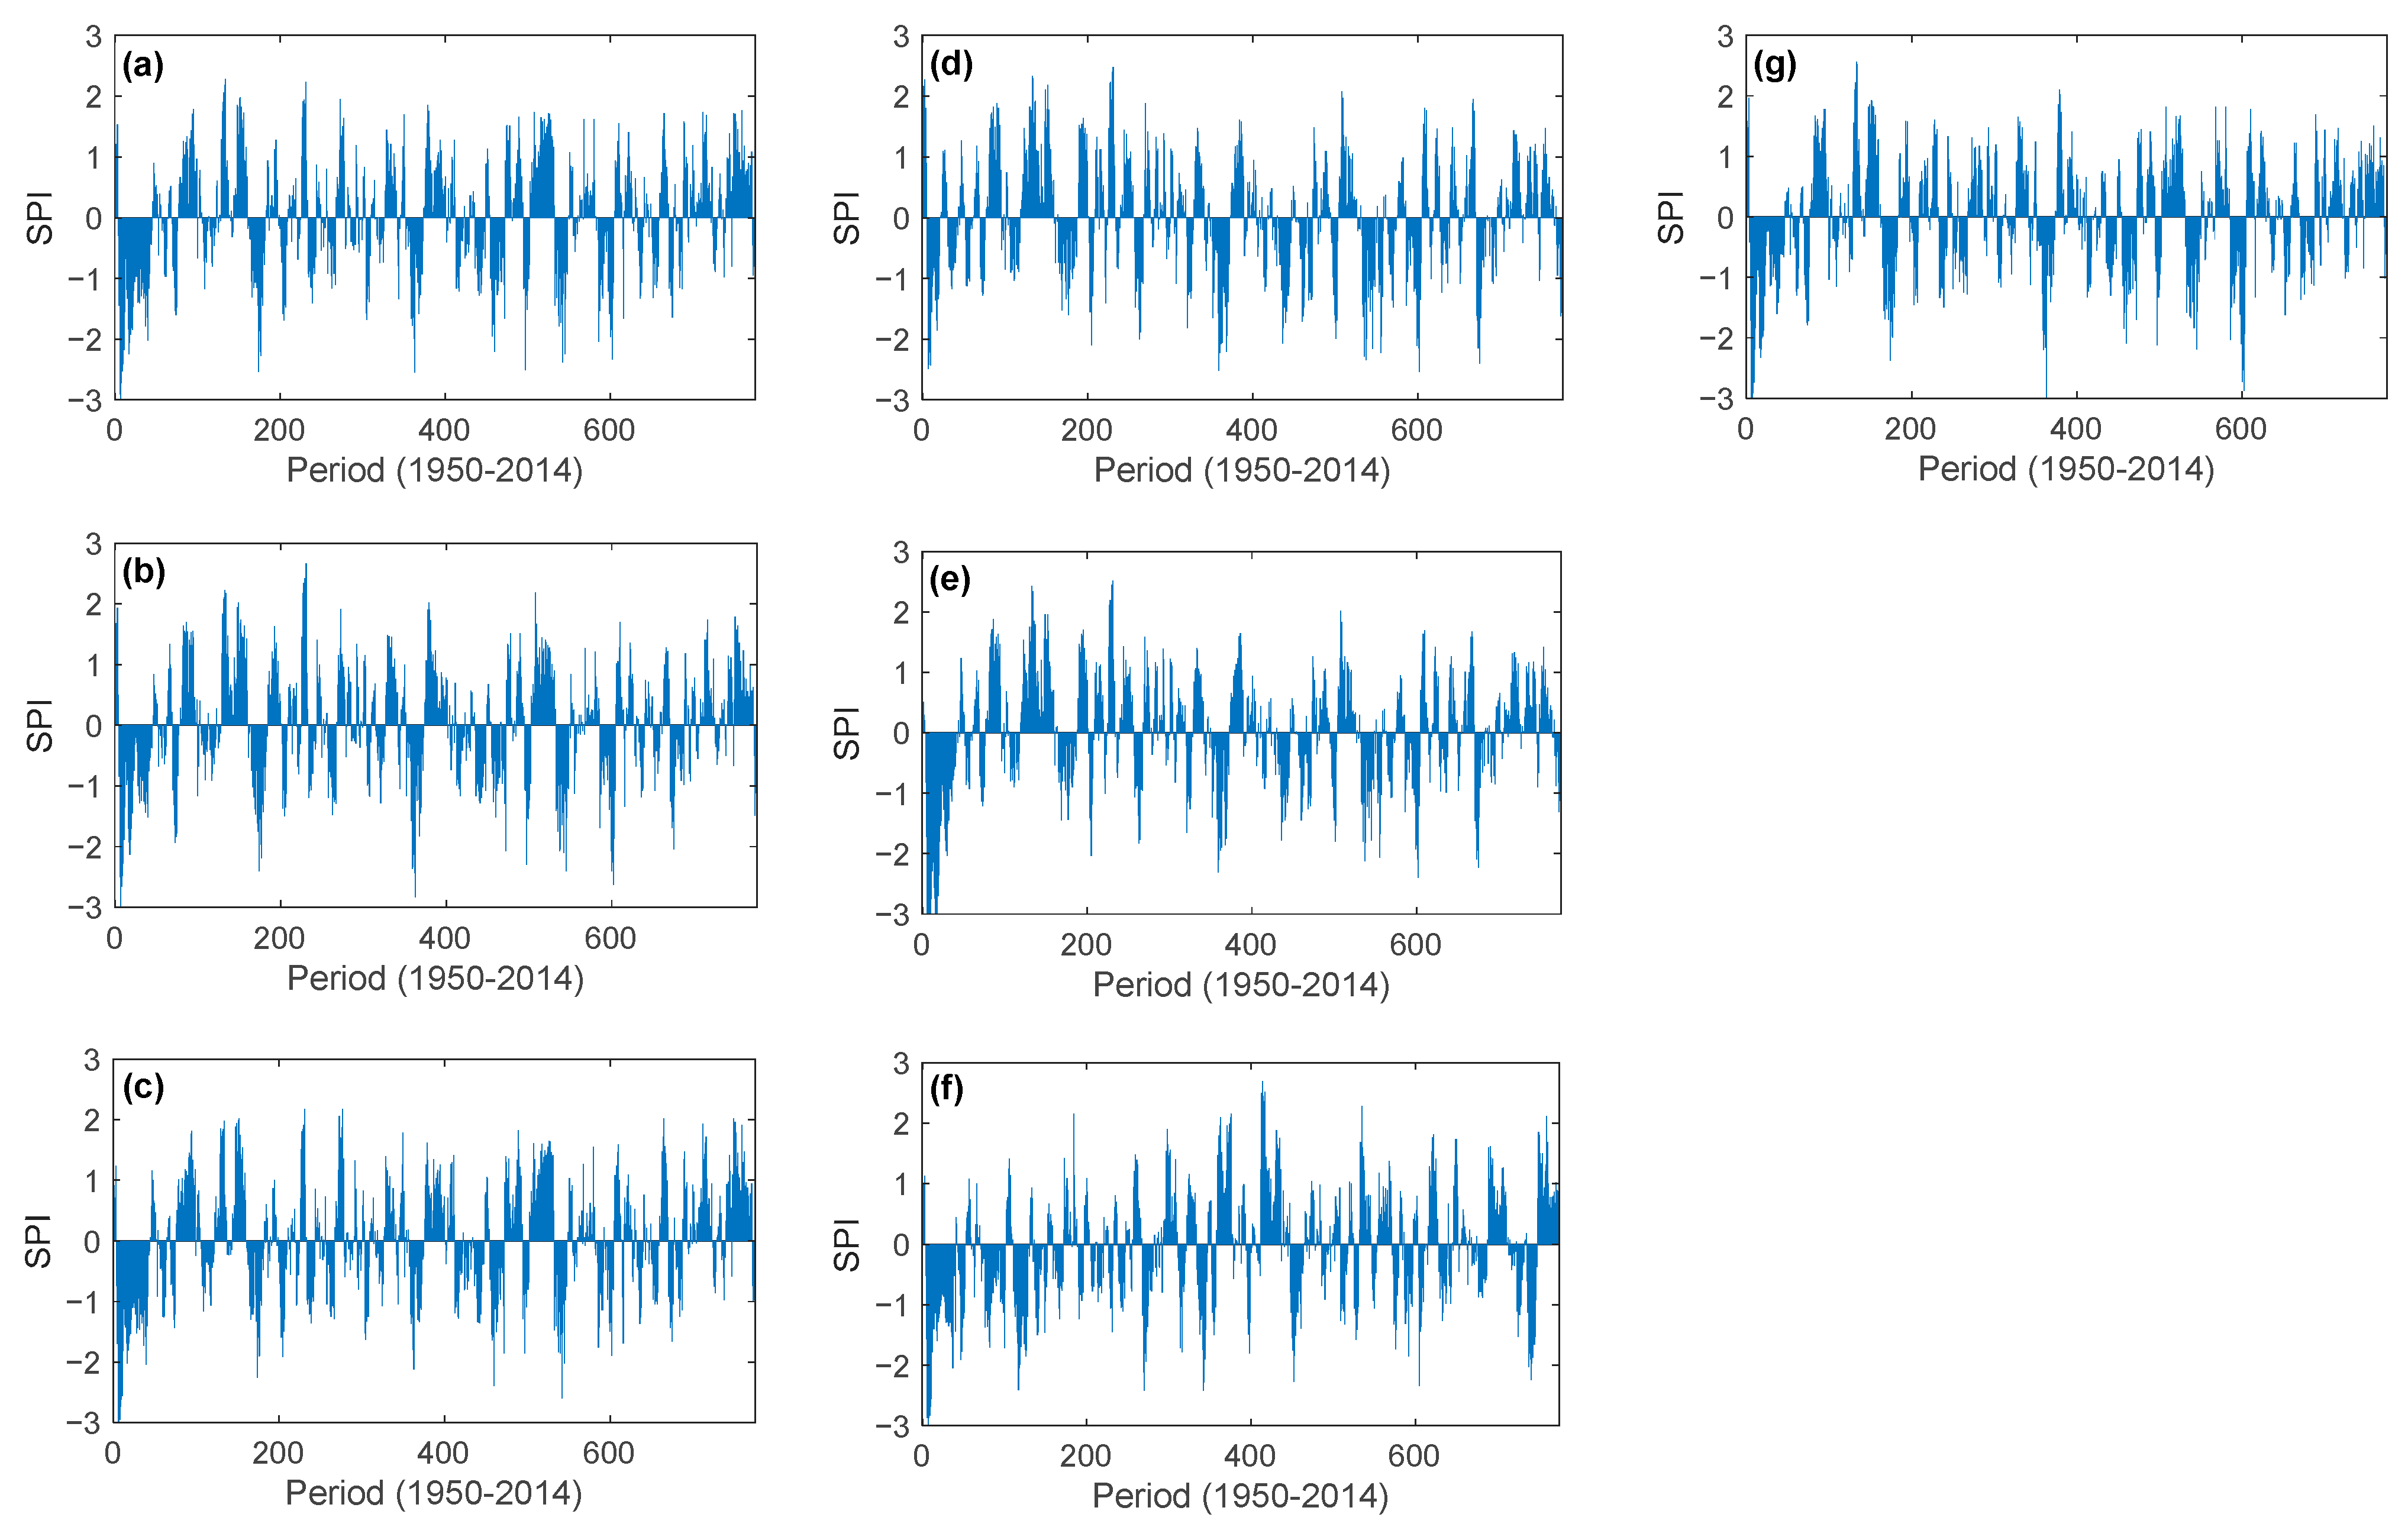
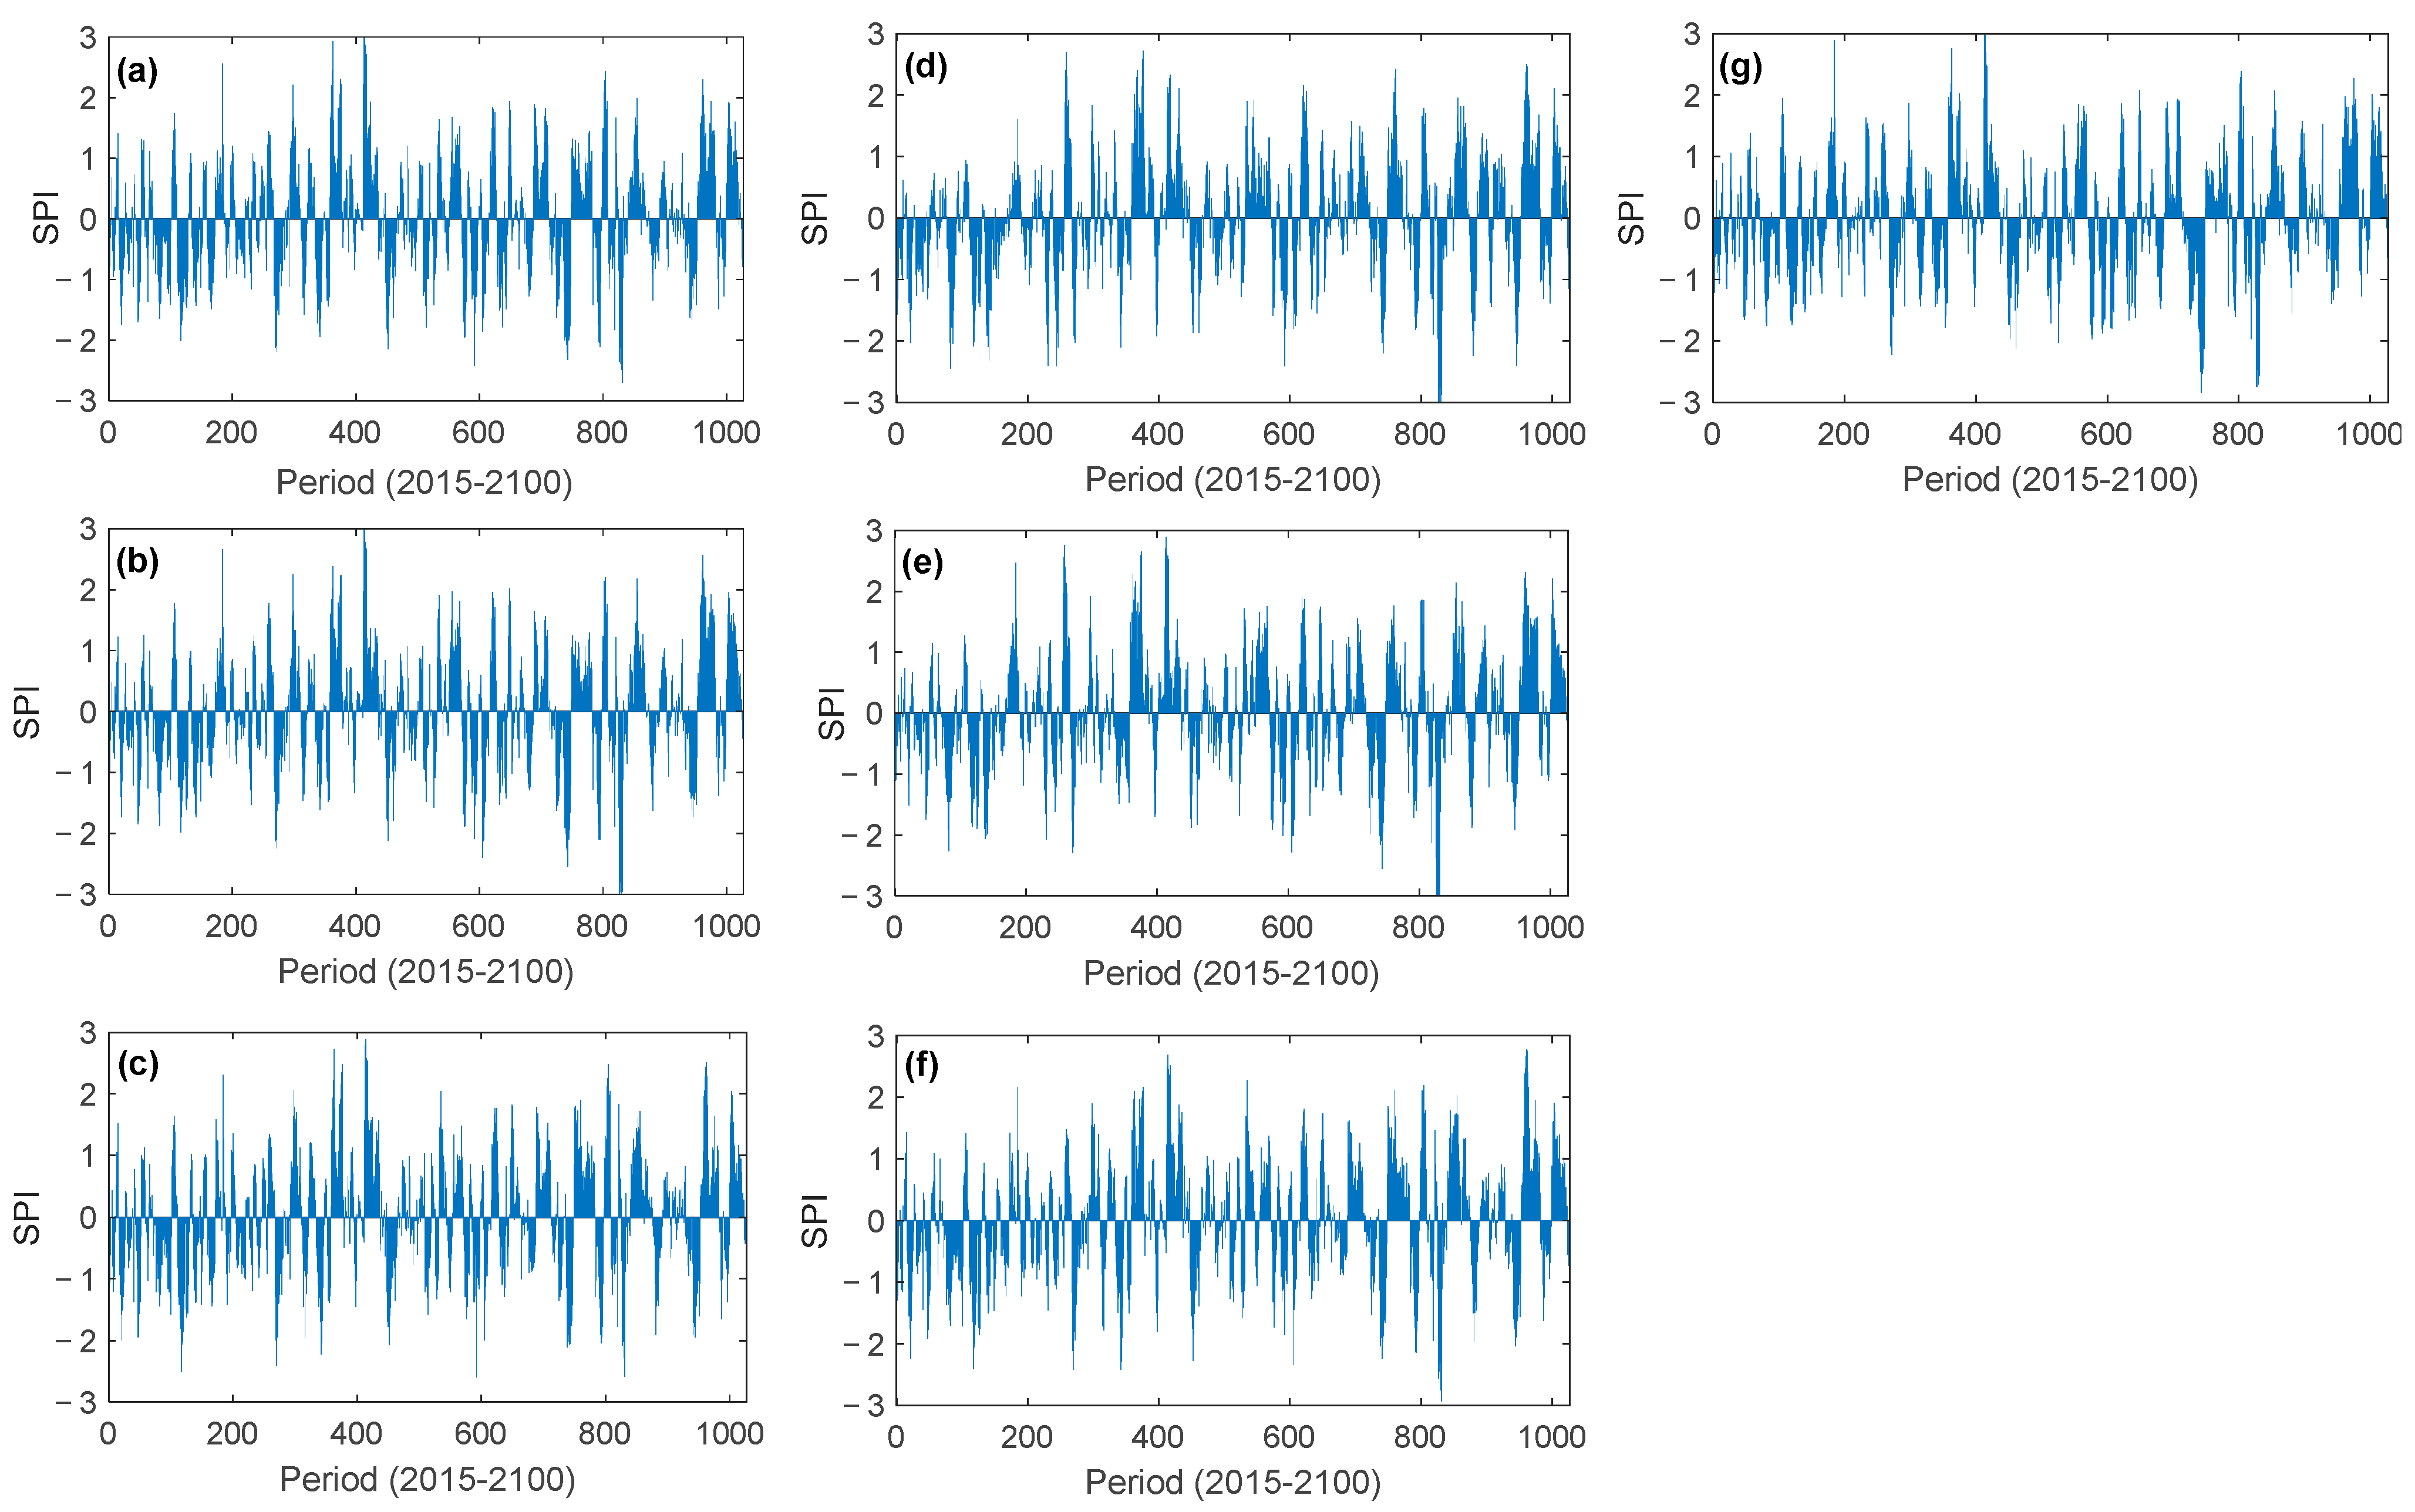
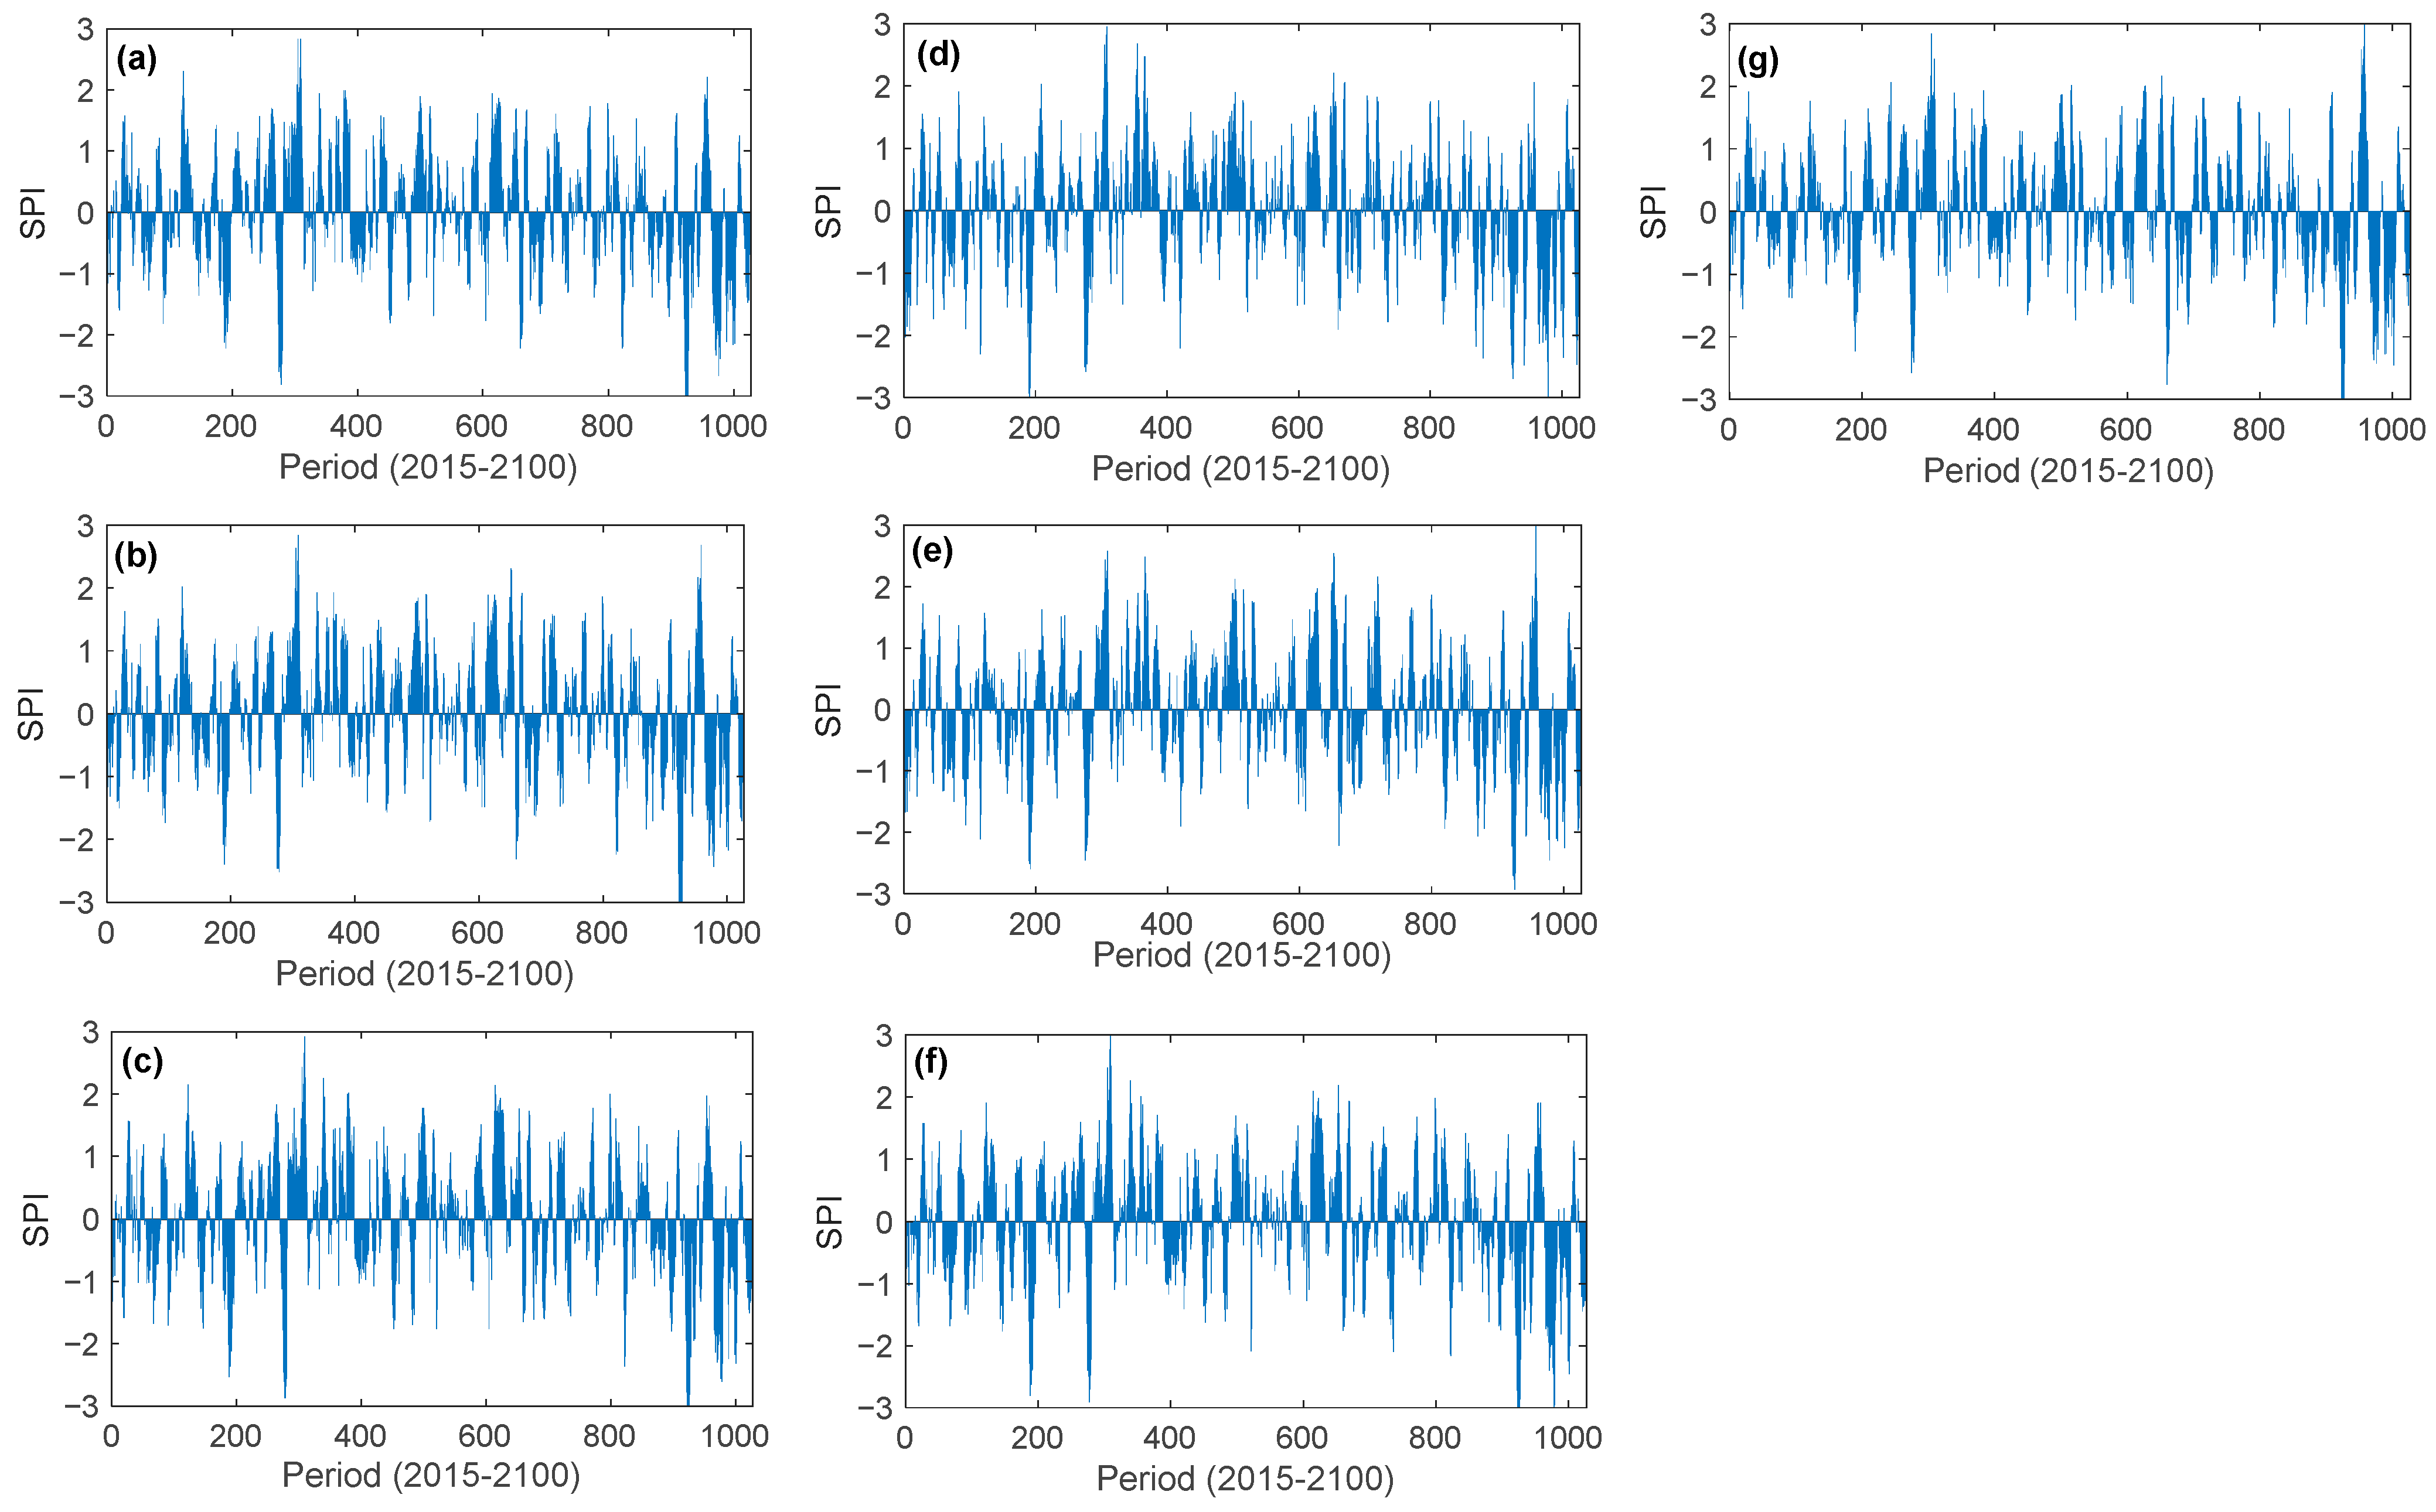
An evaluation of drought in Lake Urmia Basin during the reference period (1995–2014) is depicted in Figure 6. In addition, the future meteorological drought projections using the SPI indices were based on precipitation projections for SSP1-2.6 and SSP5-8.5. Figure 7 and Figure 8 depict the SPI values for Lake Urmia Basin in the future scenarios. Detailed information about the SPI6 values of Lake Urmia Basin for the historical period and SSP1-2.6 and SSP5-8.5 scenarios are provided in Table S1 (Supplementary Materials).
The detailed results for the changes in frequency of the SPI categories (Table 3) for all stations in the study area are illustrated in Figure 9. Additionally, a comparison of the changes in frequency of the SPI values for the SSP1-2.6 and SSP5-8.5 scenarios is illustrated in Table 5 and Figure S1 (Supplementary Materials).
The estimated future meteorological drought based on the SPI in the SSP1-2.6 and SSP5-8.5 scenarios for the future period revealed that the SSP5-8.5 scenario will have more “Extremely dry” months than the SSP1-2.6 scenario. In contrast, the “Extremely wet” months will be fewer in number in the SSP5-8.5 scenario compared to the SSP1-2.6 scenario. Mahabad, Saqez, and Takab have more significant declines in the number of “Extremely dry” months than the other stations in the SSP1-2.6 and SSP5-8.5 scenarios for a period of 14 months (from July 2015 to December 2100). For Maragheh, Sarab, Tabriz, and Urmia, the “Extremely dry” month frequency is increased by 7, 10, 5, and 7, respectively.
The frequency of drought based on the SPI showed that in both the reference period and projected future periods, the “Near-normal” category has the highest frequency. The number of “Near-normal” months will increase (excluding Maragheh and Tabriz) in the SSP5-8.5 scenario in comparison with the SSP1-2.6 scenario. For instance, the number of “Near-normal” months is expected to increase from 682 months to 698 months in the case of the Saqez station. Mahabad, Maragheh, Saqez, Takab, and Urmia will experience a decline in the number of “Moderately dry” months, whereas the Sarab and Tabriz stations will experience an increase. For all stations, the “Severely dry” months will be decremental.

4. Discussion

In this study, future changes in monthly and annual precipitation in Lake Urmia Basin were investigated using a state-of-the-art dataset from CMIP6. The impacts of climate change on precipitation and the frequency of meteorological drought were evaluated based on an average mean ensemble of GCMs in two climate change scenarios: the SSP1-2.6 and SSP5-8.5 scenarios. The assessment of the selected GCM model’s performance based on the R-square and RMSE showed that the average ensemble of models has an acceptable performance. The evaluation of the model’s performance, demonstrated in Table 4, showed that the R-square and RMSE values are in the range of 0.89–0.95 and 5.03–8.64, respectively. The performance of the model is higher in the case of the Mahabad station, with an R-square of 0.95 and RMSE of 5.03, while the lowest performance is observed for the Maragheh station, with 0.89 and 6.56 for the R-square and RMSE values, respectively. In general, the projection of precipitation in Lake Urmia Basin showed that precipitation will decrease in future periods (2015–2100) (see Figure 3, Figure 4 and Figure 5). The average annual precipitation in Lake Urmia Basin is expected to decrease by 3.21% and 7.18% for SSP1-2.6 and SSP5-8.5. It is expected that annual precipitation in Mahabad, Maragheh, Sarab, and Urmia will decrease in all scenarios. An increase in annual precipitation for Saqez (1.7%), Tabriz (4.7%), and Takab (1.7%) stations was only observed in the SSP1-2.6 scenario. This increase in annual precipitation for some stations in the SSP1-2.6 scenario is a result of the inherent nature of this scenario, which is known as the most optimistic and highest-mitigation climate change scenario. In addition, the complex structure of precipitation can cause uncertainties in the projection of future precipitation [57]. Since local authorities are currently working to gradually revive Lake Urmia, changes in precipitation patterns caused by climate change are of great importance.
In the literature review, to the best of the authors’ knowledge, there is no study that states an increase in precipitation for Lake Urmia Basin in future periods in the highest-emission scenario. Therefore, these results agree with previous studies projecting future precipitation in Lake Urmia Basin. For instance, Abbasian et al. (2021) projected that precipitation in Lake Urmia Basin will decline by 8% in the case of RCP8.5 (the highest-emission scenario) from CMIP5. Ebrahimpour et al. (2019) stated that the annual precipitation for the same study region will decline by 4.28% (2011–2040), 6.93% (2040, 2041), and 8.64% (2071–2100) in the RCP8.5 scenario. The differences between the changes in precipitation values estimated for future periods in this study and those of previous studies are partly related to the selection of GCM models, study periods, and climate change scenarios. As already mentioned in the Introduction, most previous studies used the CMIP5 dataset and RCP scenarios. Hence, there are still differences between the changes in precipitation estimated in this study and previous studies.
The estimation of future meteorological droughts in climate change scenarios is presented in Figure 6, Figure 7, Figure 8 and Figure 9 and Table 5 and Figure S1 (Supplementary Materials). In general, the results indicated that by the end of the 21st century, in Urmia Lake Basin, the frequency of the “Extremely dry” drought category will increase for all stations in the SSP5-8.5 scenario in comparison with the historical reference period. It is expected that the frequency of the “Extremely dry” category will increase from 19, 24, 13, 22, 25, 17, and 22 during the historical period to 33, 29, 31, 35, 26, 33, and 24 for the Mahabad, Maragheh, Saqez, Sarab, Tabriz, Takab, and Urmia stations, respectively. In addition, the frequency of the “Extremely dry” category will also increase in the SSP1-2.6 scenario, in comparison to the historical period, for all stations excluding the Maragheh, Tabriz, and Urmia stations. The frequency of the “Severely dry” and “Moderately dry” categories will experience an increase by the end of 21st century in both scenarios for all stations excluding the Saqez and Takab stations, which are expected to experience a decrease in the “Moderately dry” category in the SSP5-8.5 scenario. Without any exclusion, the “Near-normal” category will increase for all stations and scenarios. The estimation of the frequency of the other categories, including “Moderately wet”, “Very wet”, and “Extremely wet”, showed that the frequency of these categories will increase for both scenarios in comparison with the reference period, with the exclusion of a few stations (see Table S1). The frequency of the “Extremely wet” category will be lower in the SSP5-8.5 scenario in comparison with the SSP1-2.6 scenario.
Furthermore, this study’s estimation of future meteorological droughts in the context of climate change has reliable correlation with previous studies. Ebrahimpour et al. (2019) projected that, according to SPI and SPEI analyses, drought frequency will increase in the RCP8.5 scenario. The authors stated that the frequency of the longest drought event, based on SPI6 from 16 to 18 months in the RCP4.5 scenario over the time periods of 2041–2070 and 2071 to 2100, will increase to 23 and 22 for the same time periods in the RCP8.5 scenarios (See Table 4 in the abovementioned study). The differences between the estimations of the frequency of droughts in our study and those of Ebrahimpour et al. (2019) are partly a result of differences in the selected time periods. In addition, the GCM model selected in this study is different from that used in the abovementioned study, which could have affected the precipitation projections and led to differences in the SPI values. Davarpanah and Erfanian [58] assessed the future meteorological droughts in the same study region and concluded that there is an increased probability of meteorological droughts in most of Lake Urmia Basin in the RCP2.6, RCP4.5, and RCP8.5 scenarios. The results of SPI3 (please see Figure 6 in Davarpanah and Erfanian, 2021) are in strong agreement with our study’s results. For example, the authors concluded that for the Tabriz and Urmia stations, there will be an increase in the “Extremely dry” category in all the scenarios.
Overall, based on this study’s results and previous studies (that used different drought indices to calculate and monitor droughts), the frequency of meteorological droughts in Lake Urmia Basin will increase. The differences in the frequency of droughts and variations in precipitation are partly related to the selection of drought indices, time periods, and various methods and climate models used in the projection of future precipitation.

5. Conclusions

In the current context of climate change and the projected increase in the intensity of drought events, we projected future meteorological droughts in two future climate change scenarios, namely, SSP1-2.6 and SSP5-8.5 from CMIP6. The results indicated that precipitation will decrease in Lake Urmia Basin in both the future scenarios, while the decline in the SSP5-8.5 scenario will be greater than that in the SSP1-2.6 scenario. The results of the SPI projections of future meteorological droughts revealed that the SSP5-8.5 scenario will have a higher frequency of “Extremely dry” months than the SSP1-2.6 scenario. By comparing the SPI indices for SSP1-2.6 and SSP5-8.5, it was projected that the frequency of “Extremely dry”, “Near normal”, and “Moderate wet” weather, excluding some stations, was greater for SSP5-8.5, while the frequency of “Extremely wet”, “Moderately dry”, and “Severely dry” weather was greater in SSP1-2.6 than in the SSP5-8.5 scenario. Due to the limitation of the availability of the dataset for the SSP2-4.5 scenario, we only used the SSP1-2.6 (high-mitigation scenario) and SSP5-8.5 (high-emission scenario) scenarios. Therefore, the use of the SSP2-4.5 scenario from CMIP6 and other drought-calculating indices is recommended for future studies aiming to present the possibility of future droughts in Lake Urmia Basin. The results of this study could be used to present future drought trends and to consider drought prevention measures based on SSP scenarios.

Supplementary Materials

The following supporting information can be downloaded at: https://www.mdpi.com/article/10.3390/w15081558/s1, Equation S1. The detailed equation for calculation SPI values, Table S1. Comparison of SPI values frequency for Historical reference period, SSP1-2.6 and SSP5-8.5 scenarios in Lake Urmia Basin [12,59,60].

Author Contributions

Conceptualization, B.G. and A.T.H.; methodology, B.G. and A.T.H.; software, B.G.; validation, B.G. and A.T.H.; data curation, B.G.; writing—original draft, B.G. and S.D.; writing—review and editing, B.G., S.D. and A.T.H.; visualization, B.G. and S.D.; supervision, A.T.H. All authors have read and agreed to the published version of the manuscript.

Funding

There is no external funding for this research.

Data Availability Statement

The dataset for the GCMs from CMIP6 are available at https://doi.org/10.1038/s41597-022-01393-4 (accessed on 22 November 2022) and from the NEX-GDDP-CMIP6 NASA Center for Climate Simulation (https://doi.org/10.7917/OFSG3345). The additional data that support the findings of this study are available from the corresponding author upon reasonable request.

Acknowledgments

The authors are thankful to the editor(s) and four anonymous reviewers for their constructive comments. The climate scenarios used were from the NEX-GDDP-CMIP6 dataset, prepared by the Climate Analytics Group and NASA Ames Research Center using the NASA Earth Exchange and distributed by the NASA Center for Climate Simulation (NCCS).

Conflicts of Interest

The authors have no relevant financial or non-financial conflicts of interest to disclose.

References

  1. Yang, T.-H.; Liu, W.-C. A general overview of the risk-reduction strategies for floods and droughts. Sustainability 2020, 12, 2687. [Google Scholar] [CrossRef]
  2. Frischen, J.; Meza, I.; Rupp, D.; Wietler, K.; Hagenlocher, M. Drought risk to agricultural systems in Zimbabwe: A spatial analysis of hazard, exposure, and vulnerability. Sustainability 2020, 12, 752. [Google Scholar] [CrossRef]
  3. Haghighi, A.H.; Zaki, N.A.; Rossi, P.M.; Noori, R.; Hekmatzadeh, A.A.; Saremi, H.; Kløve, B. Unsustainability Syndrome—From Meteorological to Agricultural Drought in Arid and Semi-Arid Regions. Water 2020, 12, 838. [Google Scholar] [CrossRef]
  4. Trenberth, K.E.; Fasullo, J.T.; Shepherd, T.G. Attribution of climate extreme events. Nat. Clim. Chang. 2015, 5, 725–730. [Google Scholar] [CrossRef]
  5. Schwabe, K.; Albiac, J.; Connor, J.D.; Hassan, R.M.; González, L.M. Drought in Arid and Semi-Arid Regions: A Multi-Disciplinary and Cross-Country Perspective; Springer: Berlin/Heidelberg, Germany, 2013. [Google Scholar]
  6. Nafarzadegan, A.; Zadeh, M.R.; Kherad, M.; Ahani, H.; Gharehkhani, A.; Karampoor, M.; Kousari, M. Drought area monitoring during the past three decades in Fars province, Iran. Quat. Int. 2012, 250, 27–36. [Google Scholar] [CrossRef]
  7. Wilhite, D.A.; Glantz, M.H. Understanding: The drought phenomenon: The role of definitions. Water Int. 1985, 10, 111–120. [Google Scholar] [CrossRef]
  8. Heim, R.R., Jr. A review of twentieth-century drought indices used in the United States. Bull. Am. Meteorol. Soc. 2002, 83, 1149–1166. [Google Scholar] [CrossRef]
  9. Mishra, A.K.; Singh, V.P. A review of drought concepts. J. Hydrol. 2010, 391, 202–216. [Google Scholar]
  10. Guttman, N.B. Comparing the palmer drought index and the standardized precipitation index. JAWRA J. Am. Water Resour. Assoc. 1998, 34, 113–121. [Google Scholar] [CrossRef]
  11. Stagge, J.H.; Tallaksen, L.M.; Gudmundsson, L.; Van Loon, A.F.; Stahl, K. Candidate distributions for climatological drought indices (SPI and SPEI). Int. J. Climatol. 2015, 35, 4027–4040. [Google Scholar] [CrossRef]
  12. McKee, T.B.; Doesken, N.J.; Kleist, J. The relationship of drought frequency and duration to time scales. In Proceedings of the 8th Conference on Applied Climatology, Anaheim, CA, USA, 17–22 January 1993; pp. 179–183. [Google Scholar]
  13. Wu, J.; Liu, Z.; Yao, H.; Chen, X.; Chen, X.; Zheng, Y.; He, Y. Impacts of reservoir operations on multi-scale correlations between hydrological drought and meteorological drought. J. Hydrol. 2018, 563, 726–736. [Google Scholar] [CrossRef]
  14. Svoboda, M.; Hayes, M.; Wood, D. Standardized Precipitation Index: User Guide; World Meteworological Organization: Geneva, Switzerland, 2012. [Google Scholar]
  15. Rouault, M.; Richard, Y. Intensity and spatial extension of drought in South Africa at different time scales. Water Sa 2003, 29, 489–500. [Google Scholar] [CrossRef]
  16. Irannezhad, M.; Haghighi, A.T.; Chen, D.; Kløve, B. Variability in dryness and wetness in central Finland and the role of teleconnection patterns. Theor. Appl. Climatol. 2015, 122, 471–486. [Google Scholar] [CrossRef]
  17. Mehr, A.D.; Sorman, A.U.; Kahya, E.; Afshar, M.H. Climate change impacts on meteorological drought using SPI and SPEI: Case study of Ankara, Turkey. Hydrol. Sci. J. 2020, 65, 254–268. [Google Scholar] [CrossRef]
  18. Moccia, B.; Mineo, C.; Ridolfi, E.; Russo, F.; Napolitano, F. SPI-Based Drought Classification in Italy: Influence of Different Probability Distribution Functions. Water 2022, 14, 3668. [Google Scholar] [CrossRef]
  19. Keyantash, J.; Dracup, J.A. The quantification of drought: An evaluation of drought indices. Bull. Am. Meteorol. Soc. 2002, 83, 1167–1180. [Google Scholar] [CrossRef]
  20. Daneshvar, M.R.M.; Ebrahimi, M.; Nejadsoleymani, H. An overview of climate change in Iran: Facts and statistics. Environ. Syst. Res. 2019, 8, 7. [Google Scholar] [CrossRef]
  21. Haghighi, A.T.; Fazel, N.; Hekmatzadeh, A.A.; Klöve, B. Analysis of effective environmental flow release strategies for Lake Urmia restoration. Water Resour. Manag. 2018, 32, 3595–3609. [Google Scholar] [CrossRef]
  22. Ashraf, S.; AghaKouchak, A.; Nazemi, A.; Mirchi, A.; Sadegh, M.; Moftakhari, H.R.; Hassanzadeh, E.; Miao, C.-Y.; Madani, K.; Baygi, M.M.; et al. Compounding effects of human activities and climatic changes on surface water availability in Iran. Clim. Chang. 2019, 152, 379–391. [Google Scholar] [CrossRef]
  23. Ashraf, S.; Nazemi, A.; AghaKouchak, A. Anthropogenic drought dominates groundwater depletion in Iran. Sci. Rep. 2021, 11, 9135. [Google Scholar] [CrossRef]
  24. Vaghefi, S.A.; Keykhai, M.; Jahanbakhshi, F.; Sheikholeslami, J.; Ahmadi, A.; Yang, H.; Abbaspour, K.C. The future of extreme climate in Iran. Sci. Rep. 2019, 9, 1464. [Google Scholar] [CrossRef] [PubMed]
  25. Zeydalinejad, N.; Nassery, H.R. A review on the climate-induced depletion of Iran’s aquifers. Stoch. Environ. Res. Risk Assess. 2022, 37, 467–490. [Google Scholar] [CrossRef]
  26. Wurtsbaugh, W.A.; Miller, C.; Null, S.E.; DeRose, R.J.; Wilcock, P.; Hahnenberger, M.; Howe, F.; Moore, J. Decline of the world’s saline lakes. Nat. Geosci. 2017, 10, 816–821. [Google Scholar] [CrossRef]
  27. Hassanzadeh, E.; Zarghami, M.; Hassanzadeh, Y. Determining the main factors in declining the Urmia Lake level by using system dynamics modeling. Water Resour. Manag. 2012, 26, 129–145. [Google Scholar] [CrossRef]
  28. AghaKouchak, A.; Norouzi, H.; Madani, K.; Mirchi, A.; Azarderakhsh, M.; Nazemi, A.; Nasrollahi, N.; Farahmand, A.; Mehran, A.; Hasanzadeh, E. Aral Sea syndrome desiccates Lake Urmia: Call for action. J. Great Lakes Res. 2015, 41, 307–311. [Google Scholar] [CrossRef]
  29. Khazaei, B.; Khatami, S.; Alemohammad, S.H.; Rashidi, L.; Wu, C.; Madani, K.; Kalantari, Z.; Destouni, G.; Aghakouchak, A. Climatic or regionally induced by humans? Tracing hydro-climatic and land-use changes to better understand the Lake Urmia tragedy. J. Hydrol. 2019, 569, 203–217. [Google Scholar] [CrossRef]
  30. Taylor, K.E.; Stouffer, R.J.; Meehl, G.A. An overview of CMIP5 and the experiment design. Bull. Am. Meteorol. Soc. 2012, 93, 485–498. [Google Scholar] [CrossRef]
  31. Rahimi, M.; Mohammadian, N.; Vanashi, A.R.; Whan, K. Trends in indices of extreme temperature and precipitation in iran over the period 1960–2014. Open J. Ecol. 2018, 8, 396. [Google Scholar] [CrossRef]
  32. Ghazi, B.; Jeihouni, E.; Kouzehgar, K.; Haghighi, A.T. Assessment of probable groundwater changes under representative concentration pathway (RCP) scenarios through the wavelet–GEP model. Environ. Earth Sci. 2021, 80, 446. [Google Scholar] [CrossRef]
  33. Jeihouni, E.; Mohammadi, M.; Ghazi, B. Response of the Shabestar Plain aquifer to climate-change scenarios through statistical and hybrid soft computing techniques. Groundw. Sustain. Dev. 2021, 15, 100649. [Google Scholar] [CrossRef]
  34. Zeydalinejad, N.; Nassery, H.R.; Alijani, F.; Shakiba, A.; Ghazi, B. A Proposed Approach towards Quantifying the Resilience of Water Systems to the Potential Climate Change in the Lali Region, Southwest Iran. Climate 2022, 10, 182. [Google Scholar] [CrossRef]
  35. Abbasi, A.; Khalili, K.; Behmanesh, J.; Shirzad, A. Drought monitoring and prediction using SPEI index and gene expression programming model in the west of Urmia Lake. Theor. Appl. Climatol. 2019, 138, 553–567. [Google Scholar] [CrossRef]
  36. Ebrahimpour, E.; Aminnejad, B.; Khalili, K. Assessing future drought conditions under a changing climate: A case study of the Lake Urmia basin in Iran. Water Supply 2019, 19, 1851–1861. [Google Scholar] [CrossRef]
  37. Mirgol, B.; Nazari, M.; Etedali, H.R.; Zamanian, K. Past and future drought trends, duration, and frequency in the semi-arid Urmia Lake Basin under a changing climate. Meteorol. Appl. 2021, 28, e2009. [Google Scholar] [CrossRef]
  38. Mauritsen, T.; Bader, J.; Becker, T.; Behrens, J.; Bittner, M.; Brokopf, R.; Brovkin, V.; Claussen, M.; Crueger, T.; Esch, M.; et al. Developments in the MPI-M Earth System Model version 1.2 (MPI-ESM1. 2) and its response to increasing CO2. J. Adv. Model. Earth Syst. 2019, 11, 998–1038. [Google Scholar] [CrossRef] [PubMed]
  39. Eyring, V.; Bony, S.; Meehl, G.A.; Senior, C.A.; Stevens, B.; Stouffer, R.J.; Taylor, K.E. Overview of the Coupled Model Intercomparison Project Phase 6 (CMIP6) experimental design and organization. Geosci. Model Dev. 2016, 9, 1937–1958. [Google Scholar] [CrossRef]
  40. Hagedorn, R.; Doblas-Reyes, F.J.; Palmer, T.N. The rationale behind the success of multi-model ensembles in seasonal forecasting—I. Basic concept. Tellus A Dyn. Meteorol. Oceanogr. 2005, 57, 219–233. [Google Scholar]
  41. Parsons, L.A.; Amrhein, D.E.; Sanchez, S.C.; Tardif, R.; Brennan, M.K.; Hakim, G.J. Do Multi-Model Ensembles Improve Reconstruction Skill in Paleoclimate Data Assimilation? Earth Space Sci. 2021, 8, e2020EA001467. [Google Scholar] [CrossRef]
  42. Abbasian, M.S.; Abrishamchi, A.; Najafi, M.R.; Moghim, S. Multi-site statistical downscaling of precipitation using generalized hierarchical linear models: A case study of the imperilled Lake Urmia basin. Hydrol. Sci. J. 2020, 65, 2466–2481. [Google Scholar] [CrossRef]
  43. Ghazi, B.; Jeihouni, E. Projection of temperature and precipitation under climate change in Tabriz, Iran. Arab. J. Geosci. 2022, 15, 621. [Google Scholar] [CrossRef]
  44. Abbasian, M.S.; Najafi, M.R.; Abrishamchi, A. Increasing risk of meteorological drought in the Lake Urmia basin under climate change: Introducing the precipitation–temperature deciles index. J. Hydrol. 2021, 592, 125586. [Google Scholar] [CrossRef]
  45. Gurney, K.R.; Kılkış, Ş.; Seto, K.C.; Lwasa, S.; Moran, D.; Riahi, K.; Keller, M.; Rayner, P.; Luqman, M. Greenhouse gas emissions from global cities under SSP/RCP scenarios, 1990 to 2100. Glob. Environ. Chang. 2022, 73, 102478. [Google Scholar] [CrossRef]
  46. Thrasher, B.; Wang, W.; Michaelis, A.; Melton, F.; Lee, T.; Nemani, R. NASA Global Daily Downscaled Projections, CMIP6. Sci. Data 2022, 9, 262. [Google Scholar] [CrossRef]
  47. Thrasher, B.; Wang, W.; Michaelis, A.; Nemani, R. NEX-GDDP-CMIP6; NASA Center for Climate Simulation: Greenbelt, MD, USA, 2021. [CrossRef]
  48. Thrasher, B.; Maurer, E.P.; McKellar, C.; Duffy, P.B. Bias correcting climate model simulated daily temperature extremes with quantile mapping. Hydrol. Earth Syst. Sci. 2012, 16, 3309–3314. [Google Scholar] [CrossRef]
  49. Park, T.; Hashimoto, H.; Wang, W.; Thrasher, B.; Michaelis, A.R.; Lee, T.; Brosnan, I.G.; Nemani, R.R. What does global land climate look like at 2 degrees warming? Earth’s Future 2022, e2022EF003330. [Google Scholar] [CrossRef]
  50. Zheng, X.; Ma, Q.; Wang, Y.; Wang, X.; Zhang, X.; Luan, Q. Assessing Impact of Temperature Variability of Climate Change on Mortality Based on Multiple GCM Projections in China. Atmosphere 2022, 13, 1775. [Google Scholar] [CrossRef]
  51. Guga, S.; Ma, Y.; Riao, D.; Zhi, F.; Xu, J.; Zhang, J. Drought monitoring of sugarcane and dynamic variation characteristics under global warming: A case study of Guangxi, China. Agric. Water Manag. 2023, 275, 108035. [Google Scholar] [CrossRef]
  52. Vicente-Serrano, S.M.; Beguería, S.; López-Moreno, J.I. A multiscalar drought index sensitive to global warming: The standardized precipitation evapotranspiration index. J. Clim. 2010, 23, 1696–1718. [Google Scholar] [CrossRef]
  53. An, S.; Park, G.; Jung, H.; Jang, D. Assessment of future drought index using SSP scenario in Rep. of Korea. Sustainability 2022, 14, 4252. [Google Scholar] [CrossRef]
  54. Ayugi, B.; Shilenje, Z.W.; Babaousmail, H.; Sian, K.T.L.M.; Mumo, R.; Dike, V.N.; Iyakaremye, V.; Chehbouni, A.; Ongoma, V. Projected changes in meteorological drought over East Africa inferred from bias-adjusted CMIP6 models. Nat. Hazards 2022, 113, 1151–1176. [Google Scholar]
  55. Zeng, J.; Li, J.; Lu, X.; Wei, Z.; Shangguan, W.; Zhang, S.; Dai, Y.; Zhang, S. Assessment of global meteorological, hydrological and agricultural drought under future warming based on CMIP6. Atmos. Ocean. Sci. Lett. 2022, 15, 100143. [Google Scholar] [CrossRef]
  56. Gleckler, P.J.; Taylor, K.E.; Doutriaux, C. Performance metrics for climate models. J. Geophys. Res. Atmos. 2008, 113. [Google Scholar] [CrossRef]
  57. Schoof, J.T.; Pryor, S. Downscaling temperature and precipitation: A comparison of regression-based methods and artificial neural networks. Int. J. Climatol. A J. R. Meteorol. Soc. 2001, 21, 773–790. [Google Scholar] [CrossRef]
  58. Davarpanah, S.; Erfanian, M.; Javan, K. Assessment of climate change impacts on drought and wet spells in Lake Urmia Basin. Pure Appl. Geophys. 2021, 178, 545–563. [Google Scholar] [CrossRef]
  59. Lloyd-Hughes, B.; Saunders, M.A. A drought climatology for Europe. Int. J. Climatol. A J. R. Meteorol. Soc. 2002, 22, 1571–1592. [Google Scholar] [CrossRef]
  60. McKee, T.B. Drought monitoring with multiple time scales. Proceedings of 9th Conference on Applied Climatology, Boston; 1995. [Google Scholar]
Figure 1. The Lake Urmia Basin’s geographical position and synoptic stations (Figure is created by ArcGIS software, version 10.8.1).
Water 15 01558 g001
Figure 2. Comparison of observation and historical GCMs precipitation for all stations in Lake Urmia Basin.
Water 15 01558 g002
Figure 3. Comparison of precipitation in (a) historical periods, (b) SSP1–2.6 and (c) SSP5–8.5 scenarios in Lake Urmia Basin.
Water 15 01558 g003
Figure 4. Comparison of annual precipitation for Lake Urmia Basin stations in the historical reference period in the SSP1-2.6 and SSP5-8.5 scenarios.
Water 15 01558 g004
Figure 5. Comparison of monthly historical GCM precipitation and projected future precipitation in Lake Urmia Basin, (a) Mahabad, (b) Maragheh, (c) Saqez, (d) Sarab, (e) Tabriz, (f) Takab, (g) Urmia.
Water 15 01558 g005
Figure 6. SPI values for Lake Urmia Basin based on reference period (1995–2014) (a) Mahabad, (b) Maragheh, (c) Saqez, (d) Sarab, (e) Tabriz, (f) Takab, (g) Urmia.
Water 15 01558 g006
Figure 7. SPI values for Lake Urmia Basin based on SSP1-2.6, (a) Mahabad, (b) Maragheh, (c) Saqez, (d) Sarab, (e) Tabriz, (f) Takab, (g) Urmia.
Water 15 01558 g007
Figure 8. SPI values for Lake Urmia Basin based on SSP5-8.5, (a) Mahabad, (b) Maragheh, (c) Saqez, (d) Sarab, (e) Tabriz, (f) Takab, (g) Urmia.
Water 15 01558 g008
Figure 9. The frequency of drought SPI categories for historical GCMs and SSP1-2.6 and SSP5-8.5 scenarios, (a) Mahabad, (b) Maragheh, (c) Saqez, (d) Sarab, (e) Tabriz, (f) Takab, (g) Urmia.
Water 15 01558 g009
Table 1. Location and geographic characteristics of selected stations.
(No.) NameAltitude
(m)
Annual Precipitation
(mm)
Latitude
(N)
Longitude
(E)
(1) Mahabad135239036.7545.71
(2) Maragheh134429837.3846.23
(3) Saqez152340936.2246.27
(4) Sarab168224237.9447.52
(5) Tabriz136428538.0746.28
(6) Takab136430836.3947.10
(7) Urmia132832537.5445.07
Table 2. Selected GCMs from CMIP6 to project precipitation and meteorological droughts in Lake Urmia basin.
Model No.Model NameResearch Institute and CountryData Resolution
1ACCESS-ESM1-5Australian Community Climate and Earth System0.25 × 0.25
2BCC-CSM2-MRBeijing Climate Center China Meteorological Administration0.25 × 0.25
3CanESM5Canadian Centre for Climate Modelling and Analysis0.25 × 0.25
4EC-Earth3EC—EARTH consortium0.25 × 0.25
5GFDL-ESM4Geophysical Fluid Dynamics Laboratory0.25 × 0.25
6KACE-1-0-GNational Institute of Meteorological Sciences/Korea Meteorological Administration, Climate Research Division0.25 × 0.25
7KIOST-ESMKorea Institute of Ocean Science and Technology0.25 × 0.25
8MIROC6Japan Agency for Marine–Earth Science and Technology, Atmosphere and Ocean Research Institute0.25 × 0.25
Table 3. Details and definitions of SPI values (McKee et al., 1993).
ColorSPI ClassValues
Extremely wetextremely wetSPI ≥ 2.0
Very wetvery wet1.50 ≤ SPI < 1.99
Moderately wetmoderately wet1.00 ≤ SPI < 1.50
Near normalnear normal−0.99 ≤ SPI <1
Moderately drymoderately dry−1.0 ≤ SPI < −1.50
Severely dryseverely dry−1.50 ≤ SPI < −2.0
Extremely dryextremely drySPI ≤ −2.0
Table 4. Values of RMSE and R-square for Lake Urmia stations.
MahabadMaraghehSaqezSarabTabrizTakabUrmia
R-Square0.950.890.950.900.930.930.92
RMSE5.036.566.855.236.158.645.69
Table 5. Comparison of SPI values in terms of frequency for SSP1-2.6 and SSP5-8.5 scenarios in Lake Urmia Basin.
SPI CategoryStations (1: Mahabad, 2: Maragheh, 3: Saqez, 4: Sarab, 5: Tabriz, 6: Takab, 7: Urmia)
1234567
SSP1-2.6SSP5-8.5SSP1-2.6SSP5-8.5SSP1-2.6SSP5-8.5SSP1-2.6SSP5-8.5SSP1-2.6SSP5-8.5SSP1-2.6SSP5-8.5SSP1-2.6SSP5-8.5
Extremely wet20720102310251521152281714
Very wet4862524748514248495945436656
Moderately wet110106103125981049180101939411391111
Near Normal678690685680682698701713688688689699689694
Moderately dry10992102941149088891001031029010191
Severely dry4236424144425446464255404536
Extremely dry1933222917312535212619331724
Disclaimer/Publisher’s Note: The statements, opinions and data contained in all publications are solely those of the individual author(s) and contributor(s) and not of MDPI and/or the editor(s). MDPI and/or the editor(s) disclaim responsibility for any injury to people or property resulting from any ideas, methods, instructions or products referred to in the content.