Mapping Irrigated Areas in China Using a Synergy Approach
Abstract
1. Introduction
2. Materials and Methods
2.1. Synergy Approach to Creating Irrigation Maps
2.2. Data
2.3. Methodology
2.3.1. Harmonization of Input Data
2.3.2. Calibration with Land Use Map
2.3.3. Ranking of Grid Cells
- Products with a higher resolution were considered more accurate and were therefore preferred over lower-resolution maps [35];
- Regional maps were expected to better capture regional details and characteristics than global maps as their construction likely involved local experts [36];
- Products created with novel machine-learning approaches were expected to be more precise than maps produced using alternative approaches [14];
- Recent maps were considered more reliable than older maps since, in the last two decades, a substantial improvement in the resolution of Earth observations has taken place [14];
- Irrigation maps were preferred over cropland maps because the former focus on irrigation and therefore were expected to be more accurate than cropland maps.
2.3.4. Calibration with National Statistics
2.3.5. Validation
3. Results
3.1. Synergy Irrigated Area Maps
3.2. Agreement between Input Maps
3.3. Validation
4. Discussion
4.1. Policy Implementations
4.2. Strengths and Weaknesses
4.3. Future Research
5. Conclusions
Author Contributions
Funding
Data Availability Statement
Acknowledgments
Conflicts of Interest
Appendix A. Scoring Table According to the Priority Ranking
| Agreement | Score | IAM | ESA | GRIPC | CHN | NAGARAJ |
|---|---|---|---|---|---|---|
| 5 | 1 | 1 | 1 | 1 | 1 | 1 |
| 4 | 2 | 1 | 1 | 1 | 1 | 0 |
| 4 | 3 | 1 | 1 | 1 | 0 | 1 |
| 4 | 4 | 1 | 1 | 0 | 1 | 1 |
| 4 | 5 | 1 | 0 | 1 | 1 | 1 |
| 4 | 6 | 0 | 1 | 1 | 1 | 1 |
| 3 | 7 | 1 | 1 | 1 | 0 | 0 |
| 3 | 8 | 1 | 1 | 0 | 1 | 0 |
| 3 | 9 | 1 | 1 | 0 | 0 | 1 |
| 3 | 10 | 1 | 0 | 1 | 1 | 0 |
| 3 | 11 | 1 | 0 | 1 | 0 | 1 |
| 3 | 12 | 1 | 0 | 0 | 1 | 1 |
| 3 | 13 | 0 | 1 | 1 | 1 | 0 |
| 3 | 14 | 0 | 1 | 1 | 0 | 1 |
| 3 | 15 | 0 | 1 | 0 | 1 | 1 |
| 3 | 16 | 0 | 0 | 1 | 1 | 1 |
| 2 | 17 | 1 | 1 | 0 | 0 | 0 |
| 2 | 18 | 1 | 0 | 1 | 0 | 0 |
| 2 | 19 | 1 | 0 | 0 | 1 | 0 |
| 2 | 20 | 1 | 0 | 0 | 0 | 1 |
| 2 | 21 | 0 | 1 | 1 | 0 | 0 |
| 2 | 22 | 0 | 1 | 0 | 1 | 0 |
| 2 | 23 | 0 | 1 | 0 | 0 | 1 |
| 2 | 24 | 0 | 0 | 1 | 1 | 0 |
| 2 | 25 | 0 | 0 | 1 | 0 | 1 |
| 2 | 26 | 0 | 0 | 0 | 1 | 1 |
| 1 | 27 | 1 | 0 | 0 | 0 | 0 |
| 1 | 28 | 0 | 1 | 0 | 0 | 0 |
| 1 | 29 | 0 | 0 | 1 | 0 | 0 |
| 1 | 30 | 0 | 0 | 0 | 1 | 0 |
| 1 | 31 | 0 | 0 | 0 | 0 | 1 |
| 0 | 32 | 0 | 0 | 0 | 0 | 0 |
| Agreement | Score | IAM | ESA | GIA | NAGARAJ | ZOHAIB |
|---|---|---|---|---|---|---|
| 5 | 1 | 1 | 1 | 1 | 1 | 1 |
| 4 | 2 | 1 | 1 | 1 | 1 | 0 |
| 4 | 3 | 1 | 1 | 1 | 0 | 1 |
| 4 | 4 | 1 | 1 | 0 | 1 | 1 |
| 4 | 5 | 1 | 0 | 1 | 1 | 1 |
| 4 | 6 | 0 | 1 | 1 | 1 | 1 |
| 3 | 7 | 1 | 1 | 1 | 0 | 0 |
| 3 | 8 | 1 | 1 | 0 | 1 | 0 |
| 3 | 9 | 1 | 1 | 0 | 0 | 1 |
| 3 | 10 | 1 | 0 | 1 | 1 | 0 |
| 3 | 11 | 1 | 0 | 1 | 0 | 1 |
| 3 | 12 | 1 | 0 | 0 | 1 | 1 |
| 3 | 13 | 0 | 1 | 1 | 1 | 0 |
| 3 | 14 | 0 | 1 | 1 | 0 | 1 |
| 3 | 15 | 0 | 1 | 0 | 1 | 1 |
| 3 | 16 | 0 | 0 | 1 | 1 | 1 |
| 2 | 17 | 1 | 1 | 0 | 0 | 0 |
| 2 | 18 | 1 | 0 | 1 | 0 | 0 |
| 2 | 19 | 1 | 0 | 0 | 1 | 0 |
| 2 | 20 | 1 | 0 | 0 | 0 | 1 |
| 2 | 21 | 0 | 1 | 1 | 0 | 0 |
| 2 | 22 | 0 | 1 | 0 | 1 | 0 |
| 2 | 23 | 0 | 1 | 0 | 0 | 1 |
| 2 | 24 | 0 | 0 | 1 | 1 | 0 |
| 2 | 25 | 0 | 0 | 1 | 0 | 1 |
| 2 | 26 | 0 | 0 | 0 | 1 | 1 |
| 1 | 27 | 1 | 0 | 0 | 0 | 0 |
| 1 | 28 | 0 | 1 | 0 | 0 | 0 |
| 1 | 29 | 0 | 0 | 1 | 0 | 0 |
| 1 | 30 | 0 | 0 | 0 | 1 | 0 |
| 1 | 31 | 0 | 0 | 0 | 0 | 1 |
| 0 | 32 | 0 | 0 | 0 | 0 | 0 |
Appendix B
| adm2 ‘05 | adm1 ‘05 | adm2 ‘15 | adm1 ‘15 | adm2 ‘05/’15 | |
|---|---|---|---|---|---|
| Anhui | X | X | X | ||
| Beijing | X | X | |||
| Chongqing | X | X | |||
| Fujian | X | X | |||
| Gansu | X | X | X | ||
| Guangdong | X | X | X | ||
| Guangxi | X | X | |||
| Guizhou | X | X | |||
| Hainan | X | X | X | ||
| Hebei | X | X | X | ||
| Heilongjiang | X | X | |||
| Henan | X | X | |||
| Hubei | X | X | X | ||
| Hunan | X | X | X | ||
| Nei Mongol | X | X | X | ||
| Jiangsu | X | X | X | ||
| Jiangxi | X | X | X | ||
| Jilin | X | X | X | ||
| Liaoning | X | X | X | ||
| Ningxia Hui | X | X | |||
| Qinghai | X | X | |||
| Shaanxi | X | X | X | ||
| Shandong | X | X | X | ||
| Shanghai City | X | X | X | ||
| Shanxi | X | X | |||
| Sichuan | X | X | X | ||
| Tianjin City | X | X | X | ||
| Xizang | X | X | |||
| Xinjiang Uygur | X | X | |||
| Yunnan | X | X | X | ||
| Zhejiang | X | X | X |
References
- Prosekov, A.Y.; Ivanova, S.A. Food Security: The Challenge of the Present. Geoforum 2018, 91, 73–77. [Google Scholar] [CrossRef]
- Consumption|Details|The World Bank. Available online: https://datatopics.worldbank.org/consumption/detail#datastandardization (accessed on 12 October 2022).
- van Dijk, M.; Morley, T.; Rau, M.L.; Saghai, Y. A Meta-Analysis of Projected Global Food Demand and Population at Risk of Hunger for the Period 2010–2050. Nat. Food 2021, 2, 494–501. [Google Scholar] [CrossRef]
- Nagaraj, D.; Proust, E.; Todeschini, A.; Rulli, M.C.; D’Odorico, P. A New Dataset of Global Irrigation Areas from 2001 to 2015. Adv. Water Resour. 2021, 152, 103910. [Google Scholar] [CrossRef]
- Kadiresan, K.; Khanal, P.R. Rethinking Irrigation for Global Food Security. Irrig. Drain. 2018, 67, 8–11. [Google Scholar] [CrossRef]
- Salmon, J.M.; Friedl, M.A.; Frolking, S.; Wisser, D.; Douglas, E.M. Global Rain-Fed, Irrigated, and Paddy Croplands: A New High Resolution Map Derived from Remote Sensing, Crop Inventories and Climate Data. Int. J. Appl. Earth Obs. Geoinf. 2015, 38, 321–334. [Google Scholar] [CrossRef]
- Zou, X.; Li, Y.; Gao, Q.; Wan, Y. How Water Saving Irrigation Contributes to Climate Change Resilience-a Case Study of Practices in China. Mitig. Adapt. Strat. Glob. Change 2012, 17, 111–132. [Google Scholar] [CrossRef]
- Ehlers, M.H.; Huber, R.; Finger, R. Agricultural Policy in the Era of Digitalisation. Food Policy 2021, 100, 102019. [Google Scholar] [CrossRef]
- Meier, J.; Zabel, F.; Mauser, W. A Global Approach to Estimate Irrigated Areas—A Comparison between Different Data and Statistics. Hydrol. Earth Syst. Sci. 2018, 22, 1119–1133. [Google Scholar] [CrossRef]
- Portmann, F.T.; Siebert, S.; Döll, P. MIRCA2000—Global Monthly Irrigated and Rainfed Crop Areas around the Year 2000: A New High-Resolution Data Set for Agricultural and Hydrological Modeling. Glob. Biogeochem. Cycles 2010, 24, 3435. [Google Scholar] [CrossRef]
- Siebert, S.; Kummu, M.; Porkka, M.; Döll, P.; Ramankutty, N.; Scanlon, B.R. A Global Data Set of the Extent of Irrigated Land from 1900 to 2005. Hydrol. Earth Syst. Sci. 2015, 19, 1521–1545. [Google Scholar] [CrossRef]
- Siebert, S.; Henrich, V.; Frenken, K.; Burke, J. Update of the Digital Global Map of Irrigation Areas to Version 5; FAO: Rome, Italy, 2013. [Google Scholar]
- Zohaib, M.; Kim, H.; Choi, M. Detecting Global Irrigated Areas by Using Satellite and Reanalysis Products. Sci. Total Environ. 2019, 677, 679–691. [Google Scholar] [CrossRef] [PubMed]
- Massari, C.; Modanesi, S.; Dari, J.; Gruber, A.; de Lannoy, G.J.M.; Girotto, M.; Quintana-Seguí, P.; le Page, M.; Jarlan, L.; Zribi, M.; et al. A Review of Irrigation Information Retrievals from Space and Their Utility for Users. Remote Sens. 2021, 13, 4112. [Google Scholar] [CrossRef]
- Jung, M.; Henkel, K.; Herold, M.; Churkina, G. Exploiting Synergies of Global Land Cover Products for Carbon Cycle Modeling. Remote Sens. Environ. 2006, 101, 534–553. [Google Scholar] [CrossRef]
- Fritz, S.; You, L.; Bun, A.; See, L.; McCallum, I.; Schill, C.; Perger, C.; Liu, J.; Hansen, M.; Obersteiner, M. Cropland for Sub-Saharan Africa: A Synergistic Approach Using Five Land Cover Data Sets. Geophys. Res. Lett. 2011, 38, 3435. [Google Scholar] [CrossRef]
- Lu, M.; Wu, W.; You, L.; See, L.; Fritz, S.; Yu, Q.; Wei, Y.; Chen, D.; Yang, P.; Xue, B. A Cultivated Planet in 2010—Part 1: The Global Synergy Cropland Map. Earth Syst. Sci. Data 2020, 12, 1913–1928. [Google Scholar] [CrossRef]
- Cremades, R.; Wang, J.; Morris, J. Policies, Economic Incentives and the Adoption of Modern Irrigation Technology in China. Earth Syst. Dyn. 2015, 6, 399–410. [Google Scholar] [CrossRef]
- Du, L.; Xu, L.; Li, Y.; Liu, C.; Li, Z.; Wong, J.S.; Lei, B. China’s Agricultural Irrigation and Water Conservancy Projects: A Policy Synthesis and Discussion of Emerging Issues. Sustainability 2019, 11, 7027. [Google Scholar] [CrossRef]
- Water Conservation Project II. Available online: https://projects.worldbank.org/en/projects-operations/project-detail/P114138?lang=en (accessed on 31 March 2022).
- Wang, J.; Zhu, Y.; Sun, T.; Huang, J.; Zhang, L.; Guan, B.; Huang, Q. Forty Years of Irrigation Development and Reform in China. Aust. J. Agric. Resour. Econ. 2020, 64, 126–149. [Google Scholar] [CrossRef]
- Dubovyk, O.; Menz, G.; Conrad, C.; Kan, E.; Machwitz, M.; Khamzina, A. Spatio-Temporal Analyses of Cropland Degradation in the Irrigated Lowlands of Uzbekistan Using Remote-Sensing and Logistic Regression Modeling. Environ. Monit. Assess. 2013, 185, 4775–4790. [Google Scholar] [CrossRef]
- Biggs, T.W.; Thenkabail, P.S.; Gumma, M.K.; Scott, C.A.; Parthasaradhi, G.R.; Turral, H.N. Irrigated Area Mapping in Heterogeneous Landscapes with MODIS Time Series, Ground Truth and Census Data, Krishna Basin, India. Int. J. Remote Sens. 2007, 27, 4245–4266. [Google Scholar] [CrossRef]
- Chen, D.; Lu, M.; Zhou, Q.; Xiao, J.; Ru, Y.; Wei, Y.; Wu, W. Comparison of Two Synergy Approaches for Hybrid Cropland Mapping. Remote Sens. 2019, 11, 213. [Google Scholar] [CrossRef]
- Fang, X.S.; Sheng, Q.Z.; Wang, X.; Zhang, W.E.; Ngu, A.H.H.; Yang, J. From Appearance to Essence. ACM Trans. Intell. Syst. Technol. 2020, 11, 1–24. [Google Scholar] [CrossRef]
- Zhu, X.; Zhu, W.; Zhang, J.; Pan, Y. Mapping Irrigated Areas in China from Remote Sensing and Statistical Data. IEEE J. Sel. Top Appl. Earth Obs. Remote Sens. 2014, 7, 4490–4504. [Google Scholar] [CrossRef]
- IWMI Irrigated Area Map. Available online: http://waterdata.iwmi.org/applications/irri_area/ (accessed on 23 February 2022).
- ESA Land Cover CCI Product User Guide Version 2. Tech. Rep. Available online: http://maps.elie.ucl.ac.be/CCI/viewer/download/ESACCI-LC-Ph2-PUGv2_2.0.pdf (accessed on 23 February 2022).
- R Core Team R: A Language and Environment for Statistical Computing 2022; European Environment Agency: Copenhagen, Denmark, 2022.
- Wickham, H.; Averick, M.; Bryan, J.; Chang, W.; McGowan, L.; François, R.; Grolemund, G.; Hayes, A.; Henry, L.; Hester, J.; et al. Welcome to the Tidyverse. J. Open Source Softw. 2019, 4, 1686. [Google Scholar] [CrossRef]
- Pebesma, E. Simple Features for R: Standardized Support for Spatial Vector Data. R J. 2018, 10, 439. [Google Scholar] [CrossRef]
- Hijmans, R.J. Terra: Spatial Data Analysis, Version 1.6-47; CRAN: Windhoek, Namibia, 2022. [Google Scholar]
- Potapov, P.; Turubanova, S.; Hansen, M.C.; Tyukavina, A.; Zalles, V.; Khan, A.; Song, X.P.; Pickens, A.; Shen, Q.; Cortez, J. Global Maps of Cropland Extent and Change Show Accelerated Cropland Expansion in the Twenty-First Century. Nat. Food 2022, 3, 19–28. [Google Scholar] [CrossRef]
- Samasse, K.; Hanan, N.P.; Anchang, J.Y.; Diallo, Y. A High-Resolution Cropland Map for the West African Sahel Based on High-Density Training Data, Google Earth Engine, and Locally Optimized Machine Learning. Remote Sens. 2020, 12, 1436. [Google Scholar] [CrossRef]
- Zhang, D.; Pan, Y.; Zhang, J.; Hu, T.; Zhao, J.; Li, N.; Chen, Q. A Generalized Approach Based on Convolutional Neural Networks for Large Area Cropland Mapping at Very High Resolution. Remote Sens. Environ. 2020, 247, 111912. [Google Scholar] [CrossRef]
- Pérez-Hoyos, A.; Rembold, F.; Kerdiles, H.; Gallego, J. Comparison of Global Land Cover Datasets for Cropland Monitoring. Remote Sens. 2017, 9, 1118. [Google Scholar] [CrossRef]
- Radoux, J.; Bogaert, P. About the Pitfall of Erroneous Validation Data in the Estimation of Confusion Matrices. Remote Sens. 2020, 12, 4128. [Google Scholar] [CrossRef]
- Liu, W.; Ma, Z.; Lei, B. Spatiotemporal Distribution of Irrigation Water Use Efficiency from the Perspective of Water Footprints in Heilongjiang Province. Water 2022, 14, 1232. [Google Scholar] [CrossRef]
- Cao, X.; Wu, M.; Zheng, Y.; Guo, X.; Chen, D.; Wang, W. Can China Achieve Food Security through the Development of Irrigation? Reg. Environ. Change 2018, 18, 465–475. [Google Scholar] [CrossRef]
- Zhao, H.; Chang, J.; Havlík, P.; van Dijk, M.; Valin, H.; Janssens, C.; Ma, L.; Bai, Z.; Herrero, M.; Smith, P.; et al. China’s Future Food Demand and Its Implications for Trade and Environment. Nat. Sustain. 2021, 4, 1042–1051. [Google Scholar] [CrossRef]
- Liu, X.; Yu, L.; Li, W.; Peng, D.; Zhong, L.; Li, L.; Xin, Q.; Lu, H.; Yu, C.; Gong, P. Comparison of Country-Level Cropland Areas between ESA-CCI Land Cover Maps and FAOSTAT Data. Int. J. Remote Sens. 2018, 39, 6631–6645. [Google Scholar] [CrossRef]
- Tubiello, F.N.; Conchedda, G.; Casse, L.; Pengyu, H.; Zhongxin, C.; de Santis, G.; Fritz, S.; Muchoney, D. Measuring the World’s Cropland Area. Nat. Food 2023, 4, 30–32. [Google Scholar] [CrossRef]
- See, L.; Bayas, J.C.L.; Lesiv, M.; Schepaschenko, D.; Danylo, O.; McCallum, I.; Dürauer, M.; Georgieva, I.; Domian, D.; Fraisl, D.; et al. Lessons Learned in Developing Reference Data Sets with the Contribution of Citizens: The Geo-Wiki Experience. Environ. Res. Lett. 2022, 17, 065003. [Google Scholar] [CrossRef]
- Wang, Y.; Cao, M. The Decline of Canal Irrigation in China: Causes, Impacts and Implications. Water Altern. 2021, 14, 332–349. [Google Scholar]
- Ning, J.; Liu, J.; Kuang, W.; Xu, X.; Zhang, S.; Yan, C.; Li, R.; Wu, S.; Hu, Y.; Du, G.; et al. Spatiotemporal Patterns and Characteristics of Land-Use Change in China during 2010–2015. J. Geogr. Sci. 2018, 28, 547–562. [Google Scholar] [CrossRef]
- Ambika, A.K.; Wardlow, B.; Mishra, V. Remotely Sensed High Resolution Irrigated Area Mapping in India for 2000 to 2015. Sci. Data 2016, 3, 118. [Google Scholar] [CrossRef]
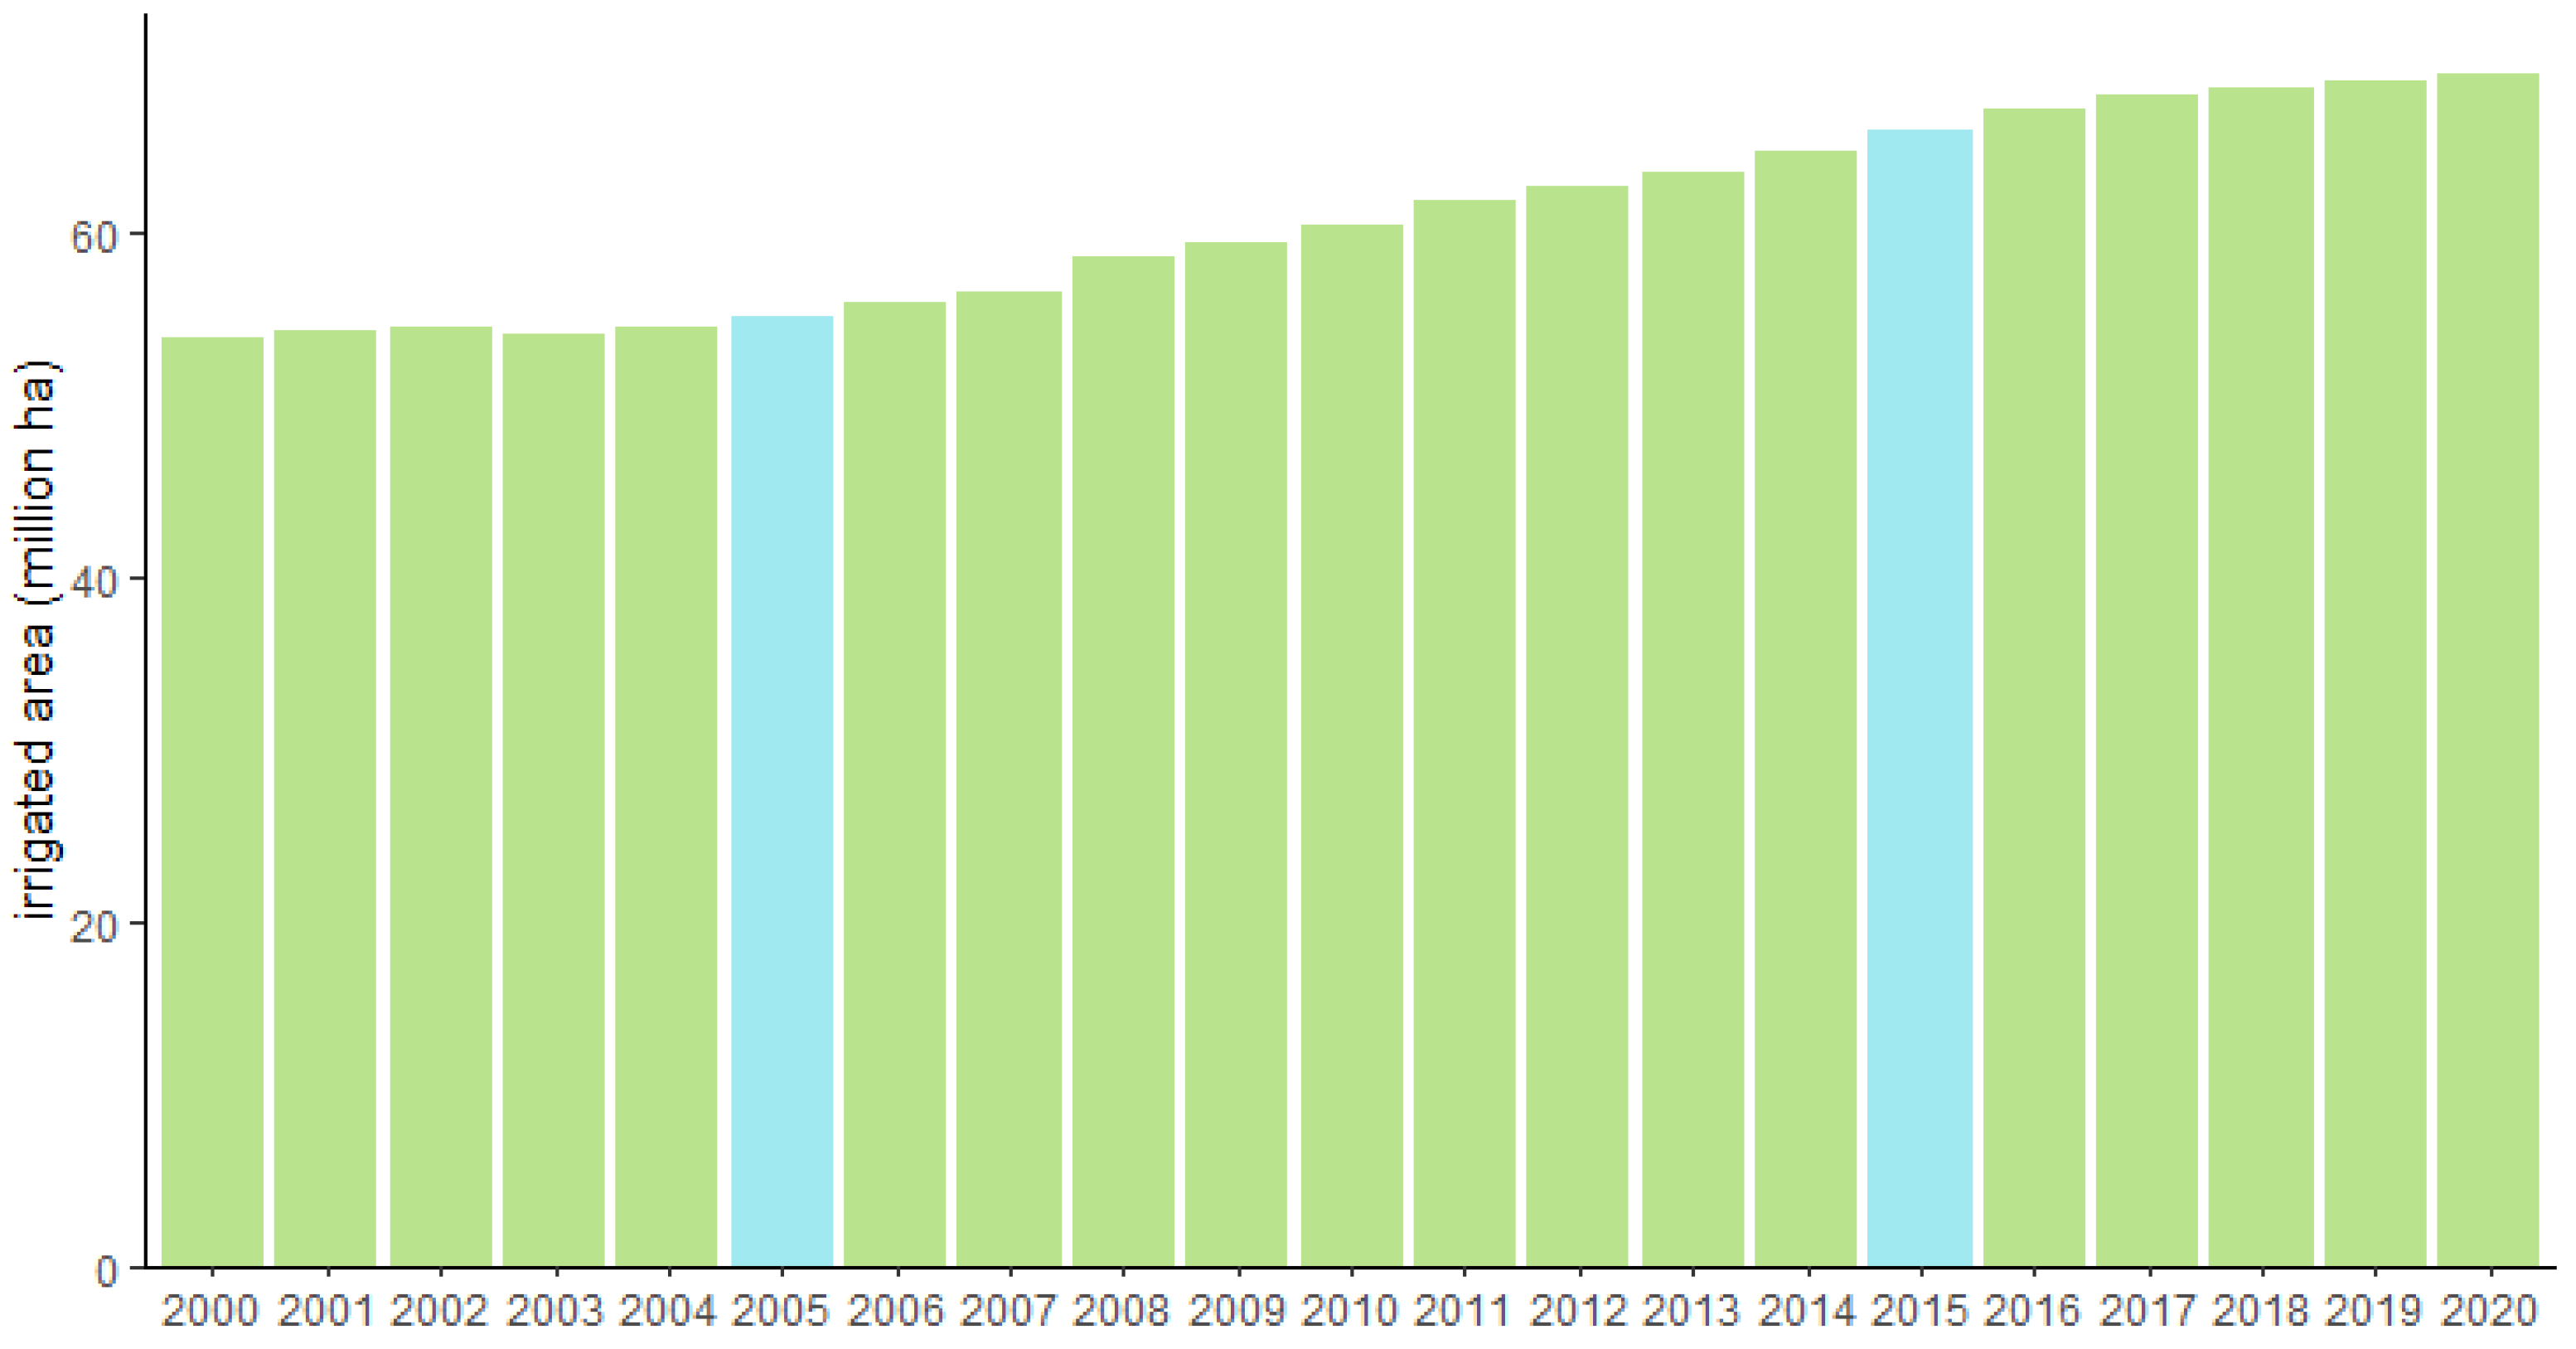
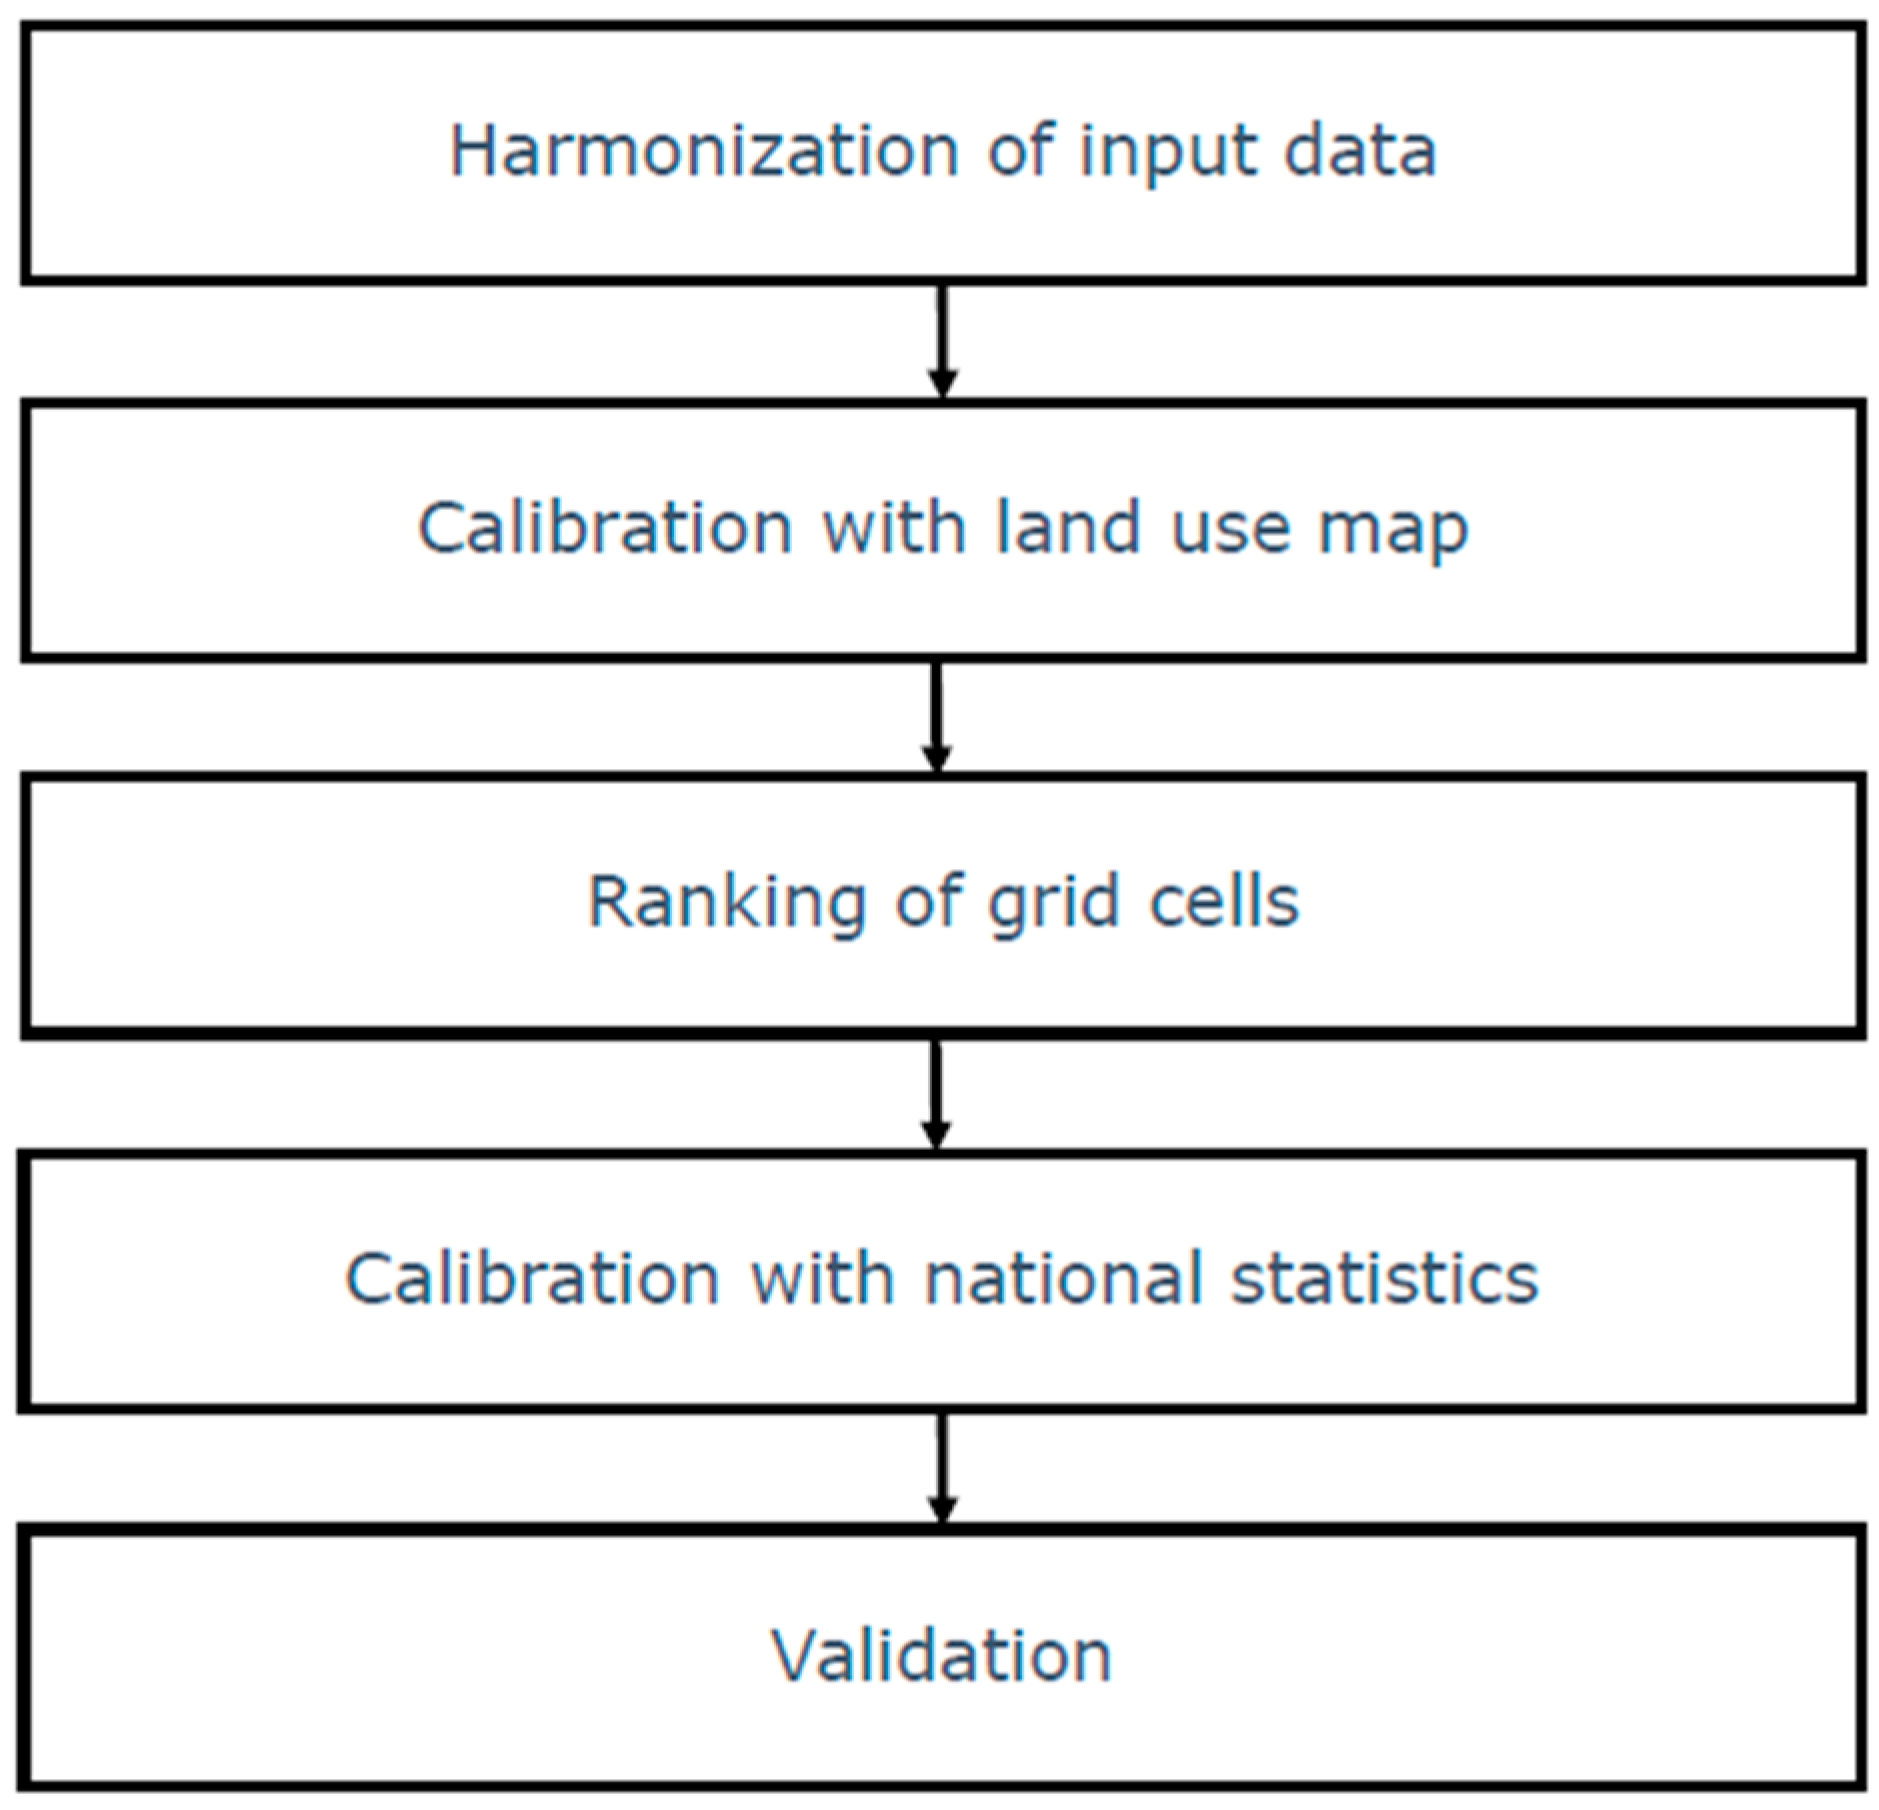
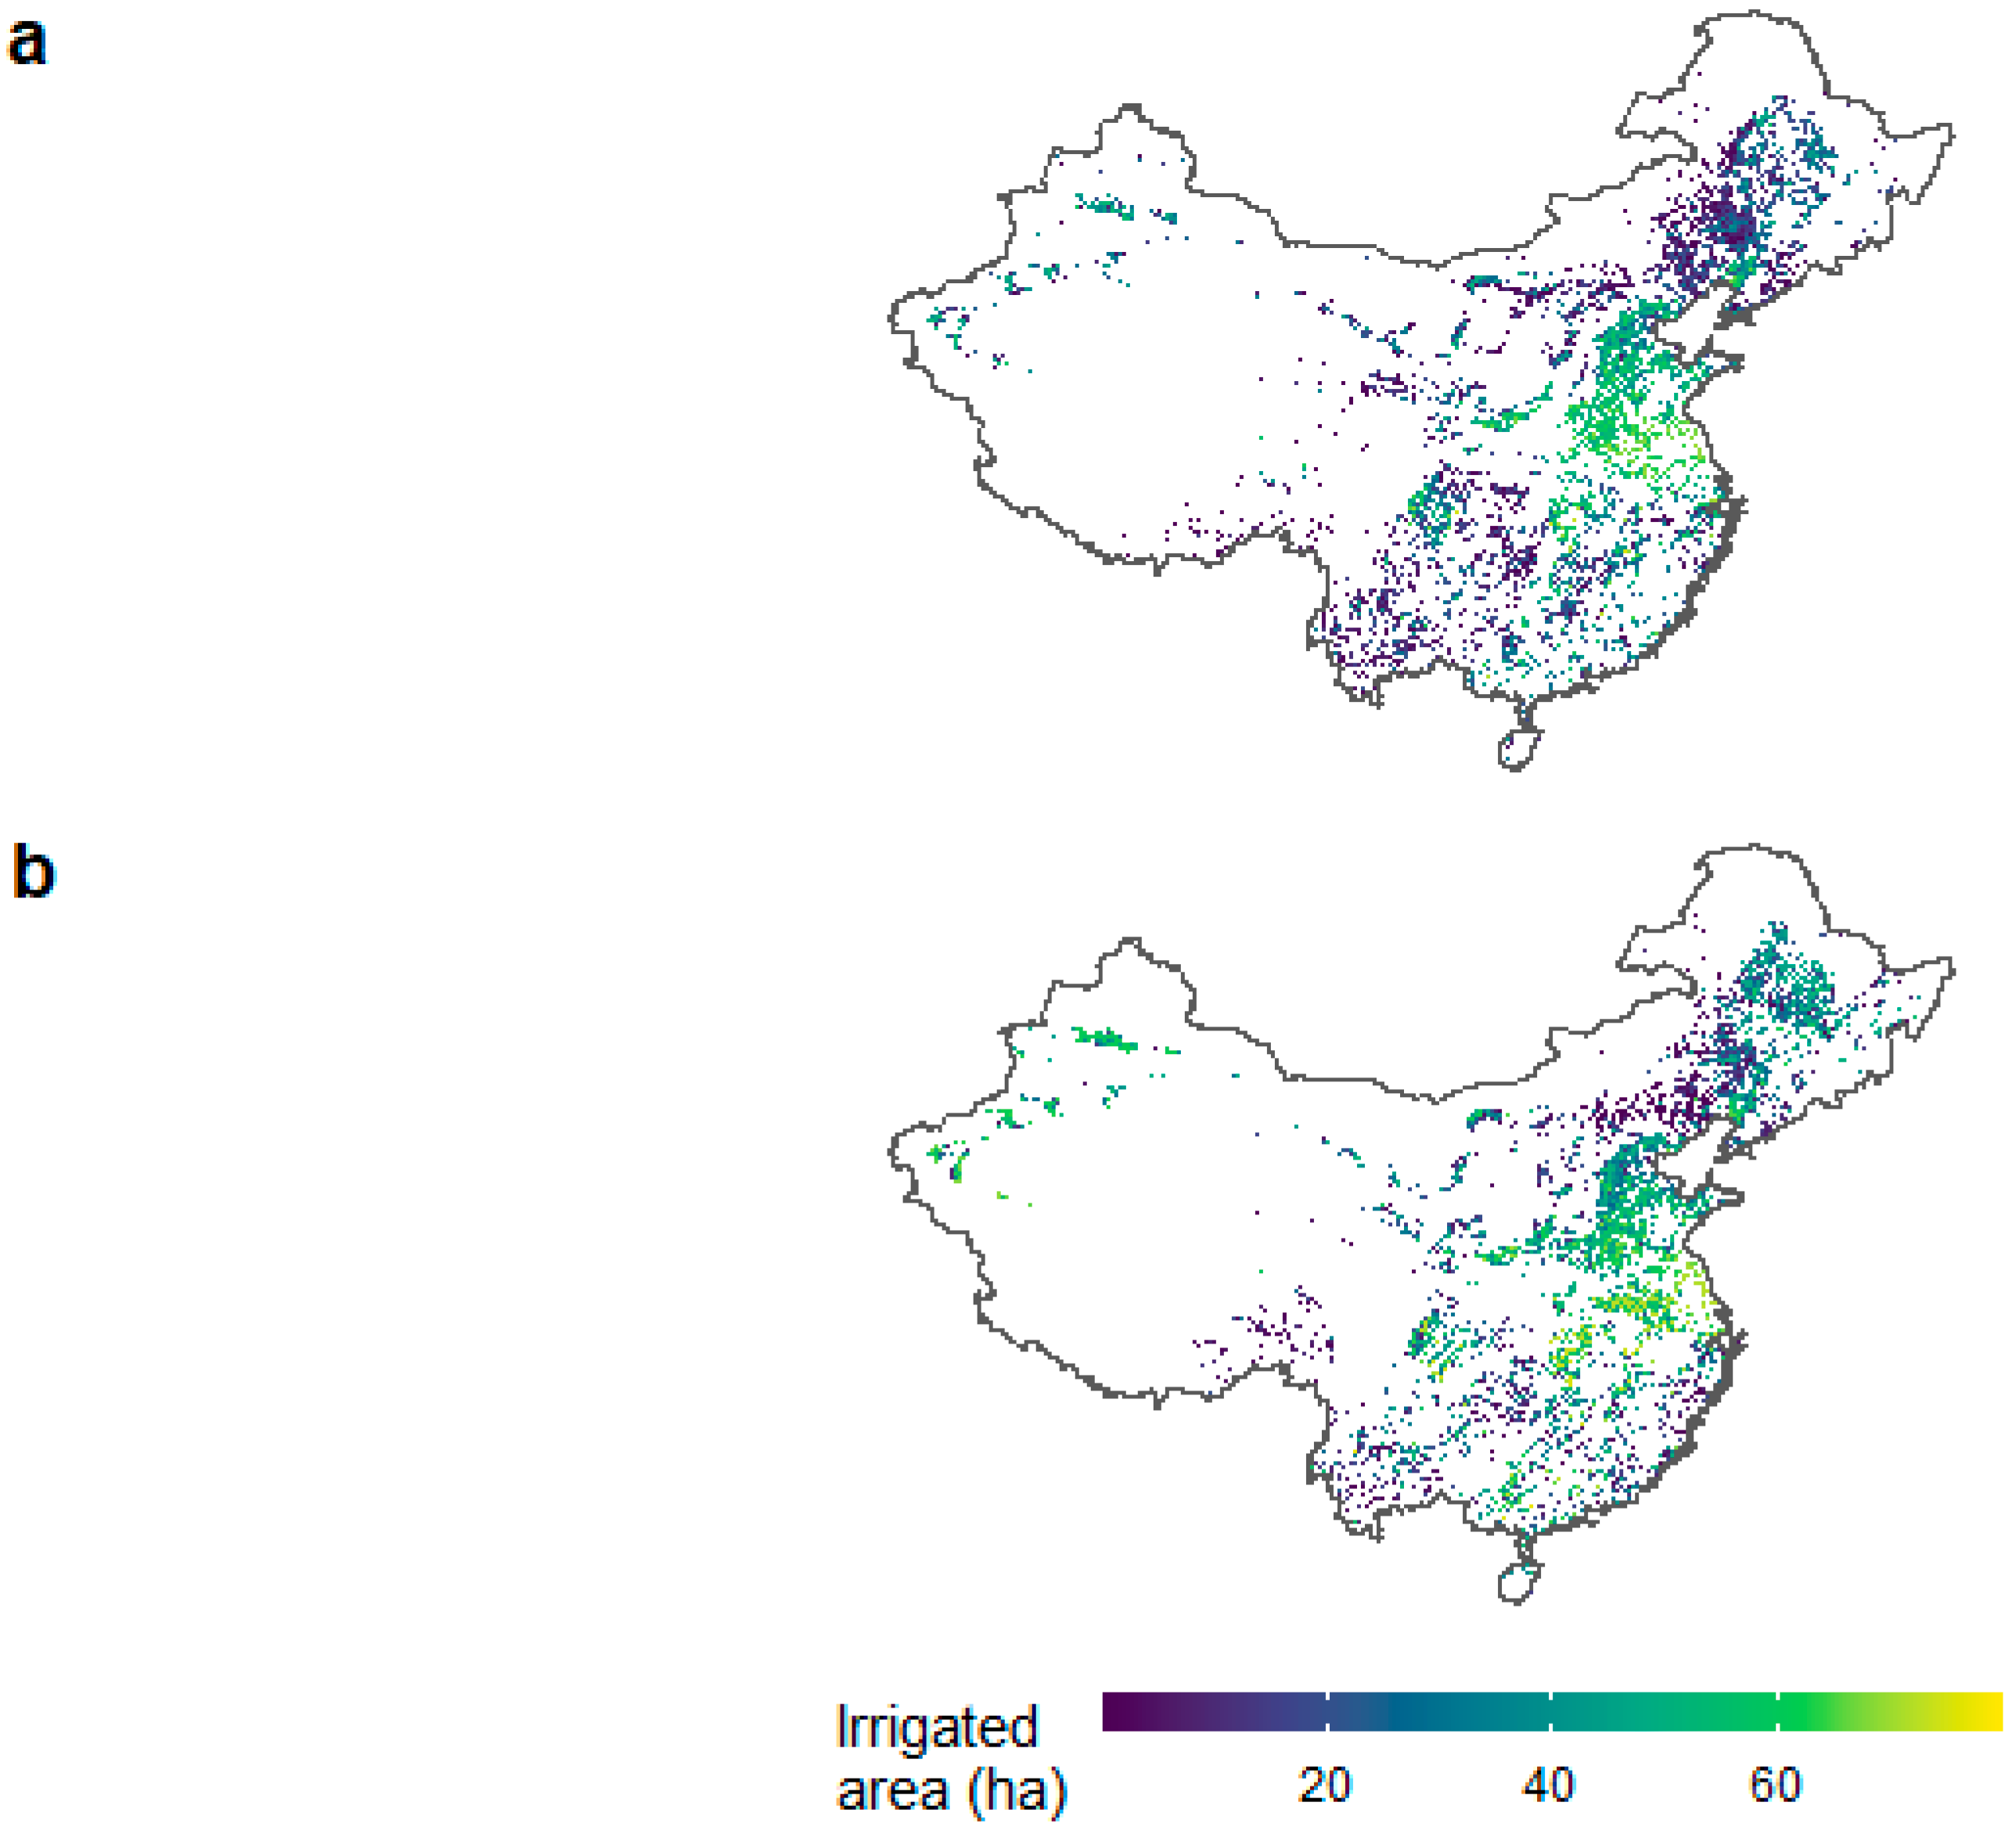

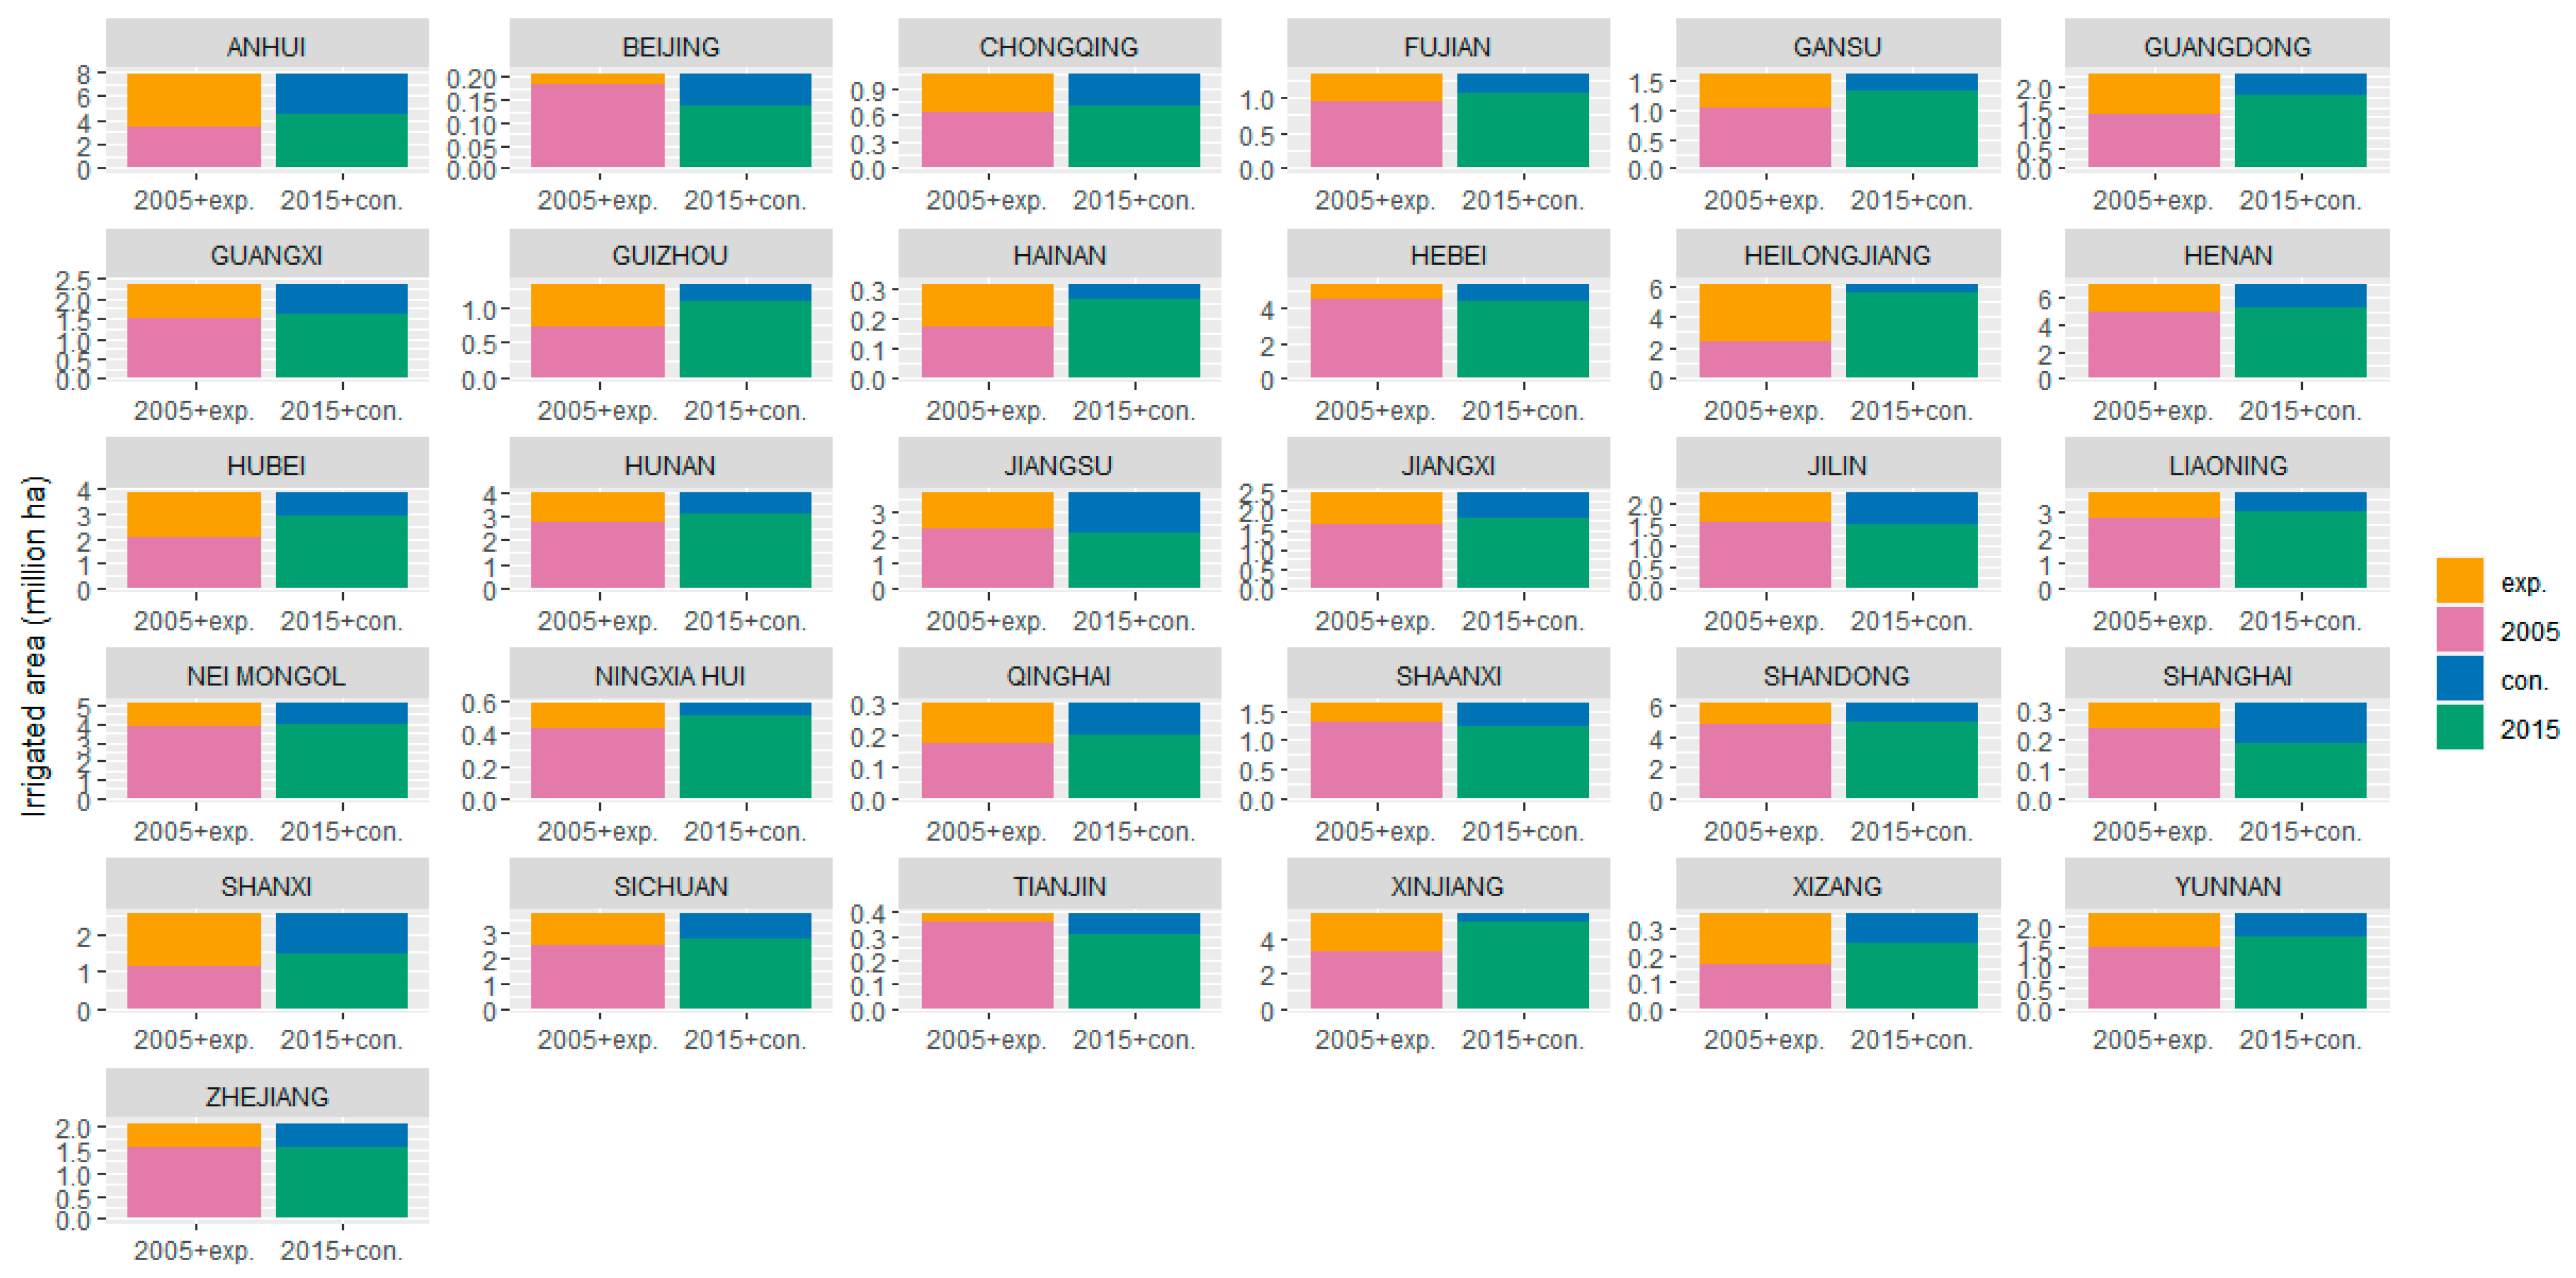

| Maps | Scale | Time | Resolution | Source | Type | Methodology | 2000–2009 | 2010–2019 |
|---|---|---|---|---|---|---|---|---|
| GRIPC | Global | 2005 | 500, spatial | [6] | Cropland | Remote sensing | X | |
| NAGARAJ | Global | 2001–2015 | 9 km | [4] | Irrigation | Machine learning | X | X |
| GIA | Global | 1999–2012 | 30 arc seconds | [9] | Irrigation | Remote sensing | X | |
| CHN | Regional: China | 2000 | 1 km | [26] | Irrigation | Downscaling | X | |
| ZOHAIB | Global | 2015 | 25 km spatial | [13] | Irrigation | Remote sensing | X | |
| IAM | Regional: Asia | 2000 & 2010 | 250 m spatial | [27] | Irrigation | Remote sensing | X | X |
| ESCACCI | Global | 1992–2015 | 300 m spatial | [28] | Cropland | Remote sensing | X | X |
| Priority Ranking 2005 | Priority Ranking 2015 |
|---|---|
| IAM | IAM |
| ESACCI | ESACCI |
| NAGARAJ | NAGARAJ |
| GRIPC | GIA |
| CHN | ZOHAIB |
Disclaimer/Publisher’s Note: The statements, opinions and data contained in all publications are solely those of the individual author(s) and contributor(s) and not of MDPI and/or the editor(s). MDPI and/or the editor(s) disclaim responsibility for any injury to people or property resulting from any ideas, methods, instructions or products referred to in the content. |
© 2023 by the authors. Licensee MDPI, Basel, Switzerland. This article is an open access article distributed under the terms and conditions of the Creative Commons Attribution (CC BY) license (https://creativecommons.org/licenses/by/4.0/).
Share and Cite
van Dijk, M.; Geurtsen, S. Mapping Irrigated Areas in China Using a Synergy Approach. Water 2023, 15, 1666. https://doi.org/10.3390/w15091666
van Dijk M, Geurtsen S. Mapping Irrigated Areas in China Using a Synergy Approach. Water. 2023; 15(9):1666. https://doi.org/10.3390/w15091666
Chicago/Turabian Stylevan Dijk, Michiel, and Susan Geurtsen. 2023. "Mapping Irrigated Areas in China Using a Synergy Approach" Water 15, no. 9: 1666. https://doi.org/10.3390/w15091666
APA Stylevan Dijk, M., & Geurtsen, S. (2023). Mapping Irrigated Areas in China Using a Synergy Approach. Water, 15(9), 1666. https://doi.org/10.3390/w15091666


