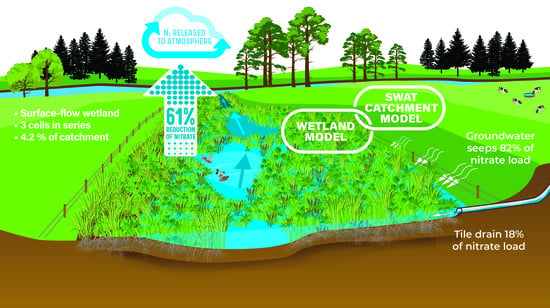
Quantifying the Nitrogen-Removal Performance of a Constructed Wetland Dominated by Diffuse Agricultural Groundwater Inflows Using a Linked Catchment–Wetland Model
Abstract
:1. Introduction
2. Methodology
2.1. Study Site and Constructed Wetland
2.2. Water Sampling and Analysis
2.2.1. Flow Measurement
2.2.2. Water-Quality Measurement
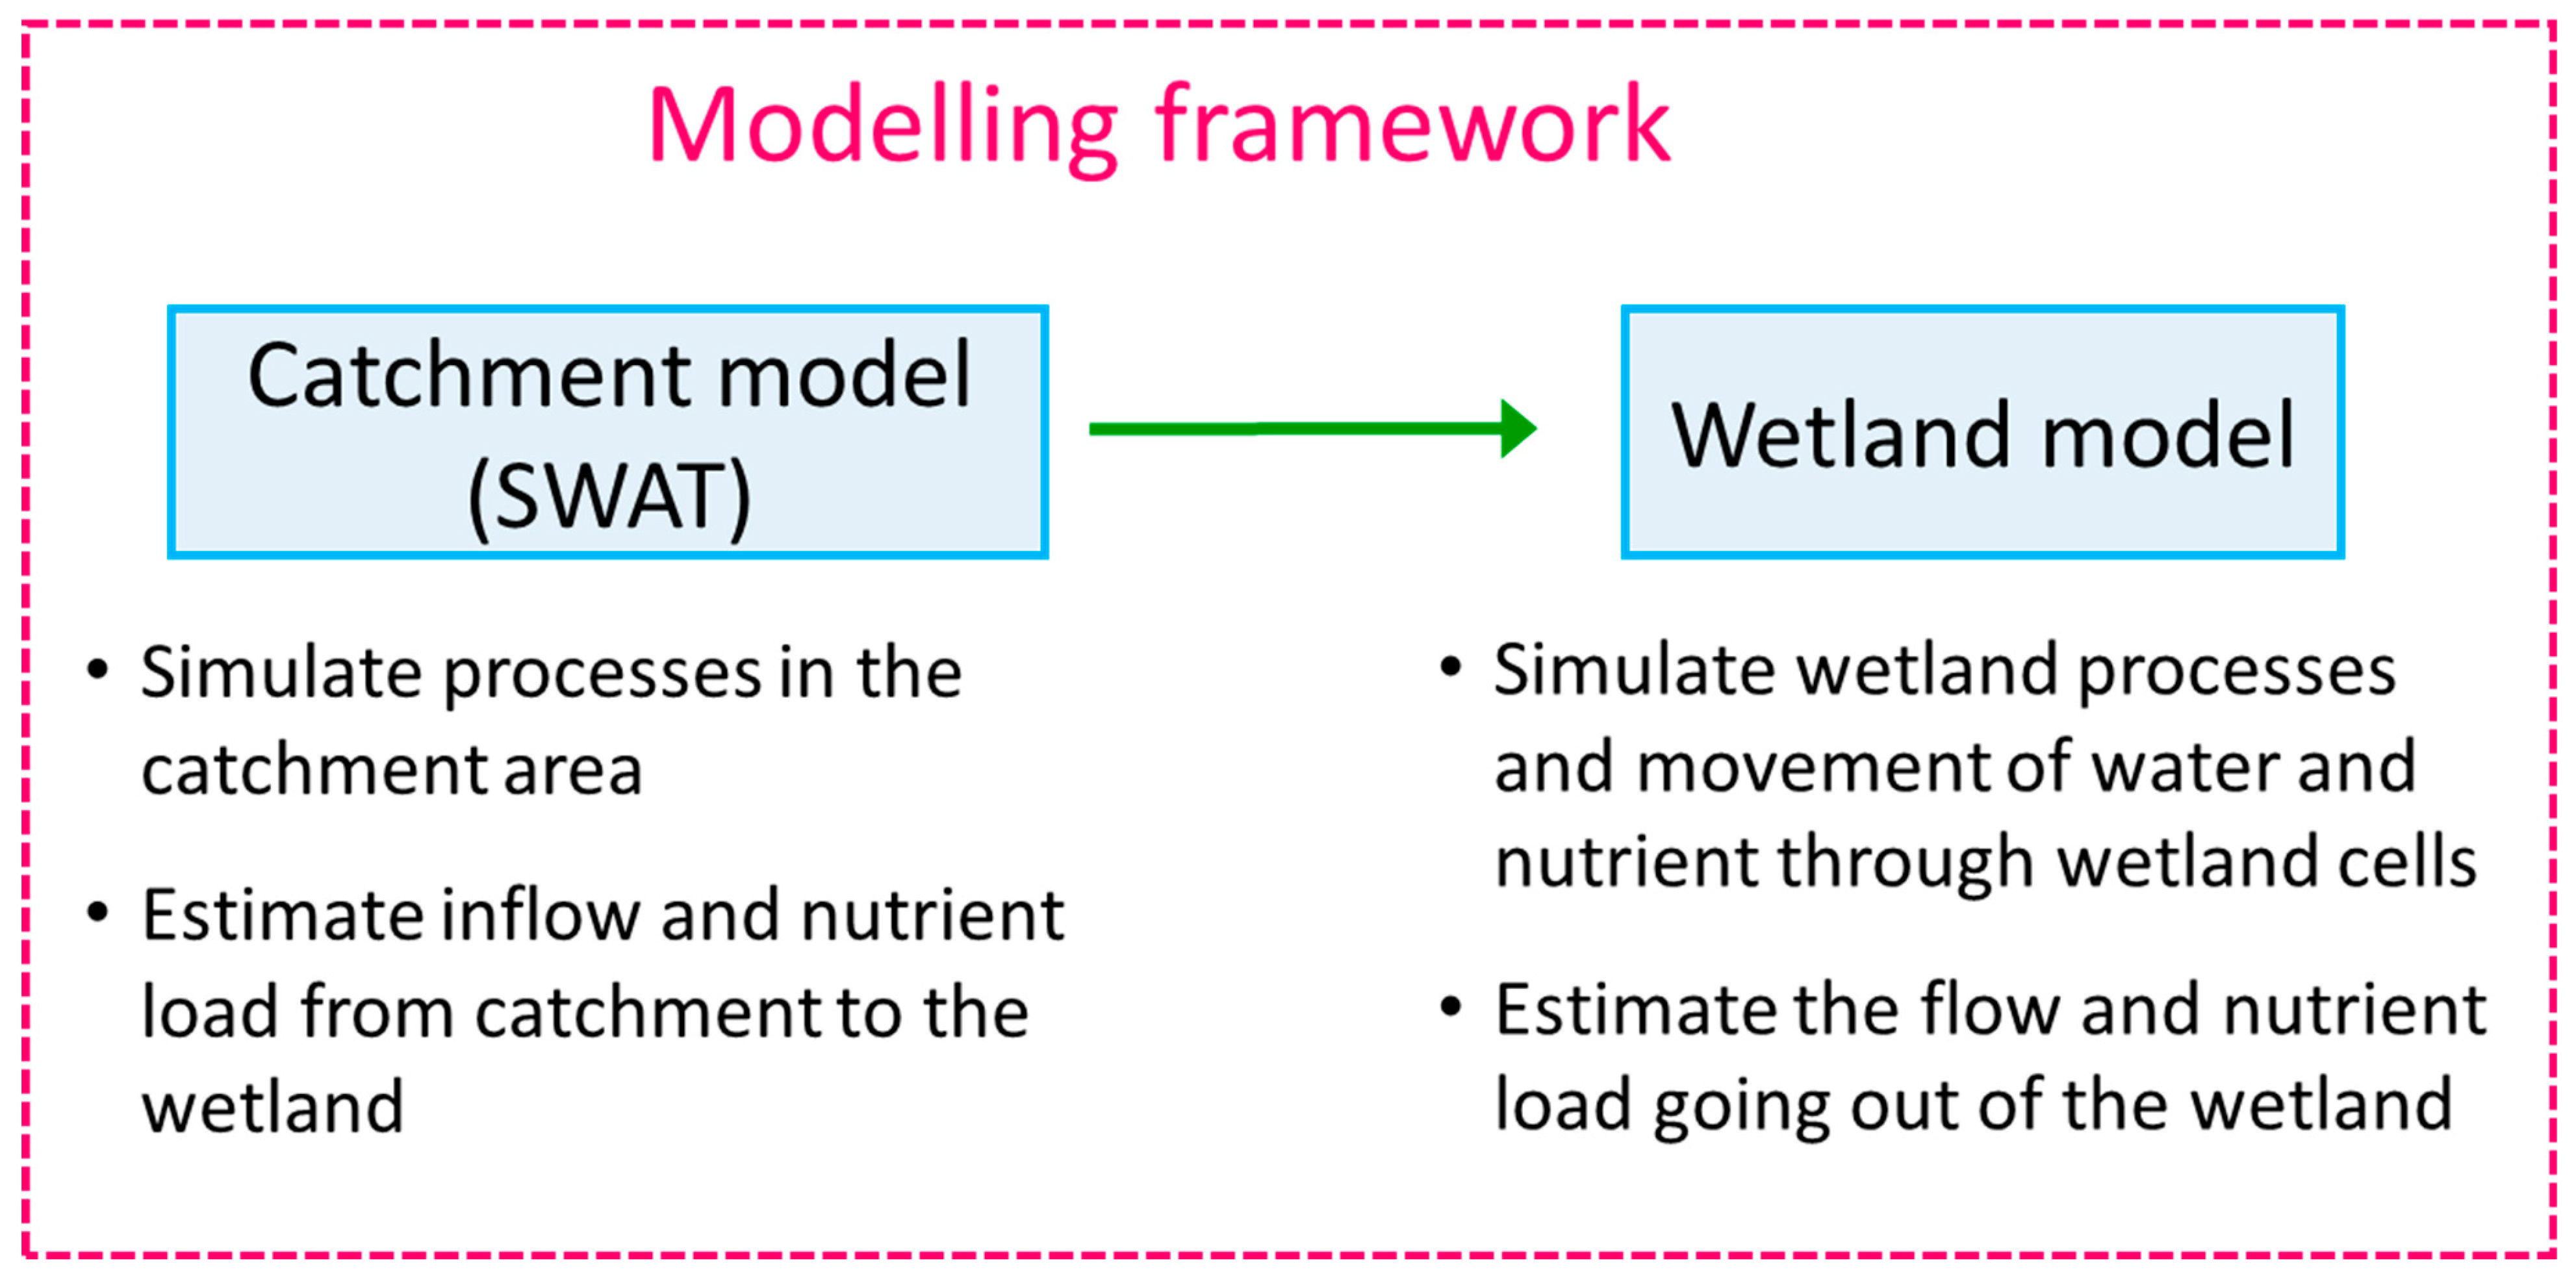
2.3. Modelling Approach
2.4. The SWAT Model
2.4.1. Brief Introduction to SWAT
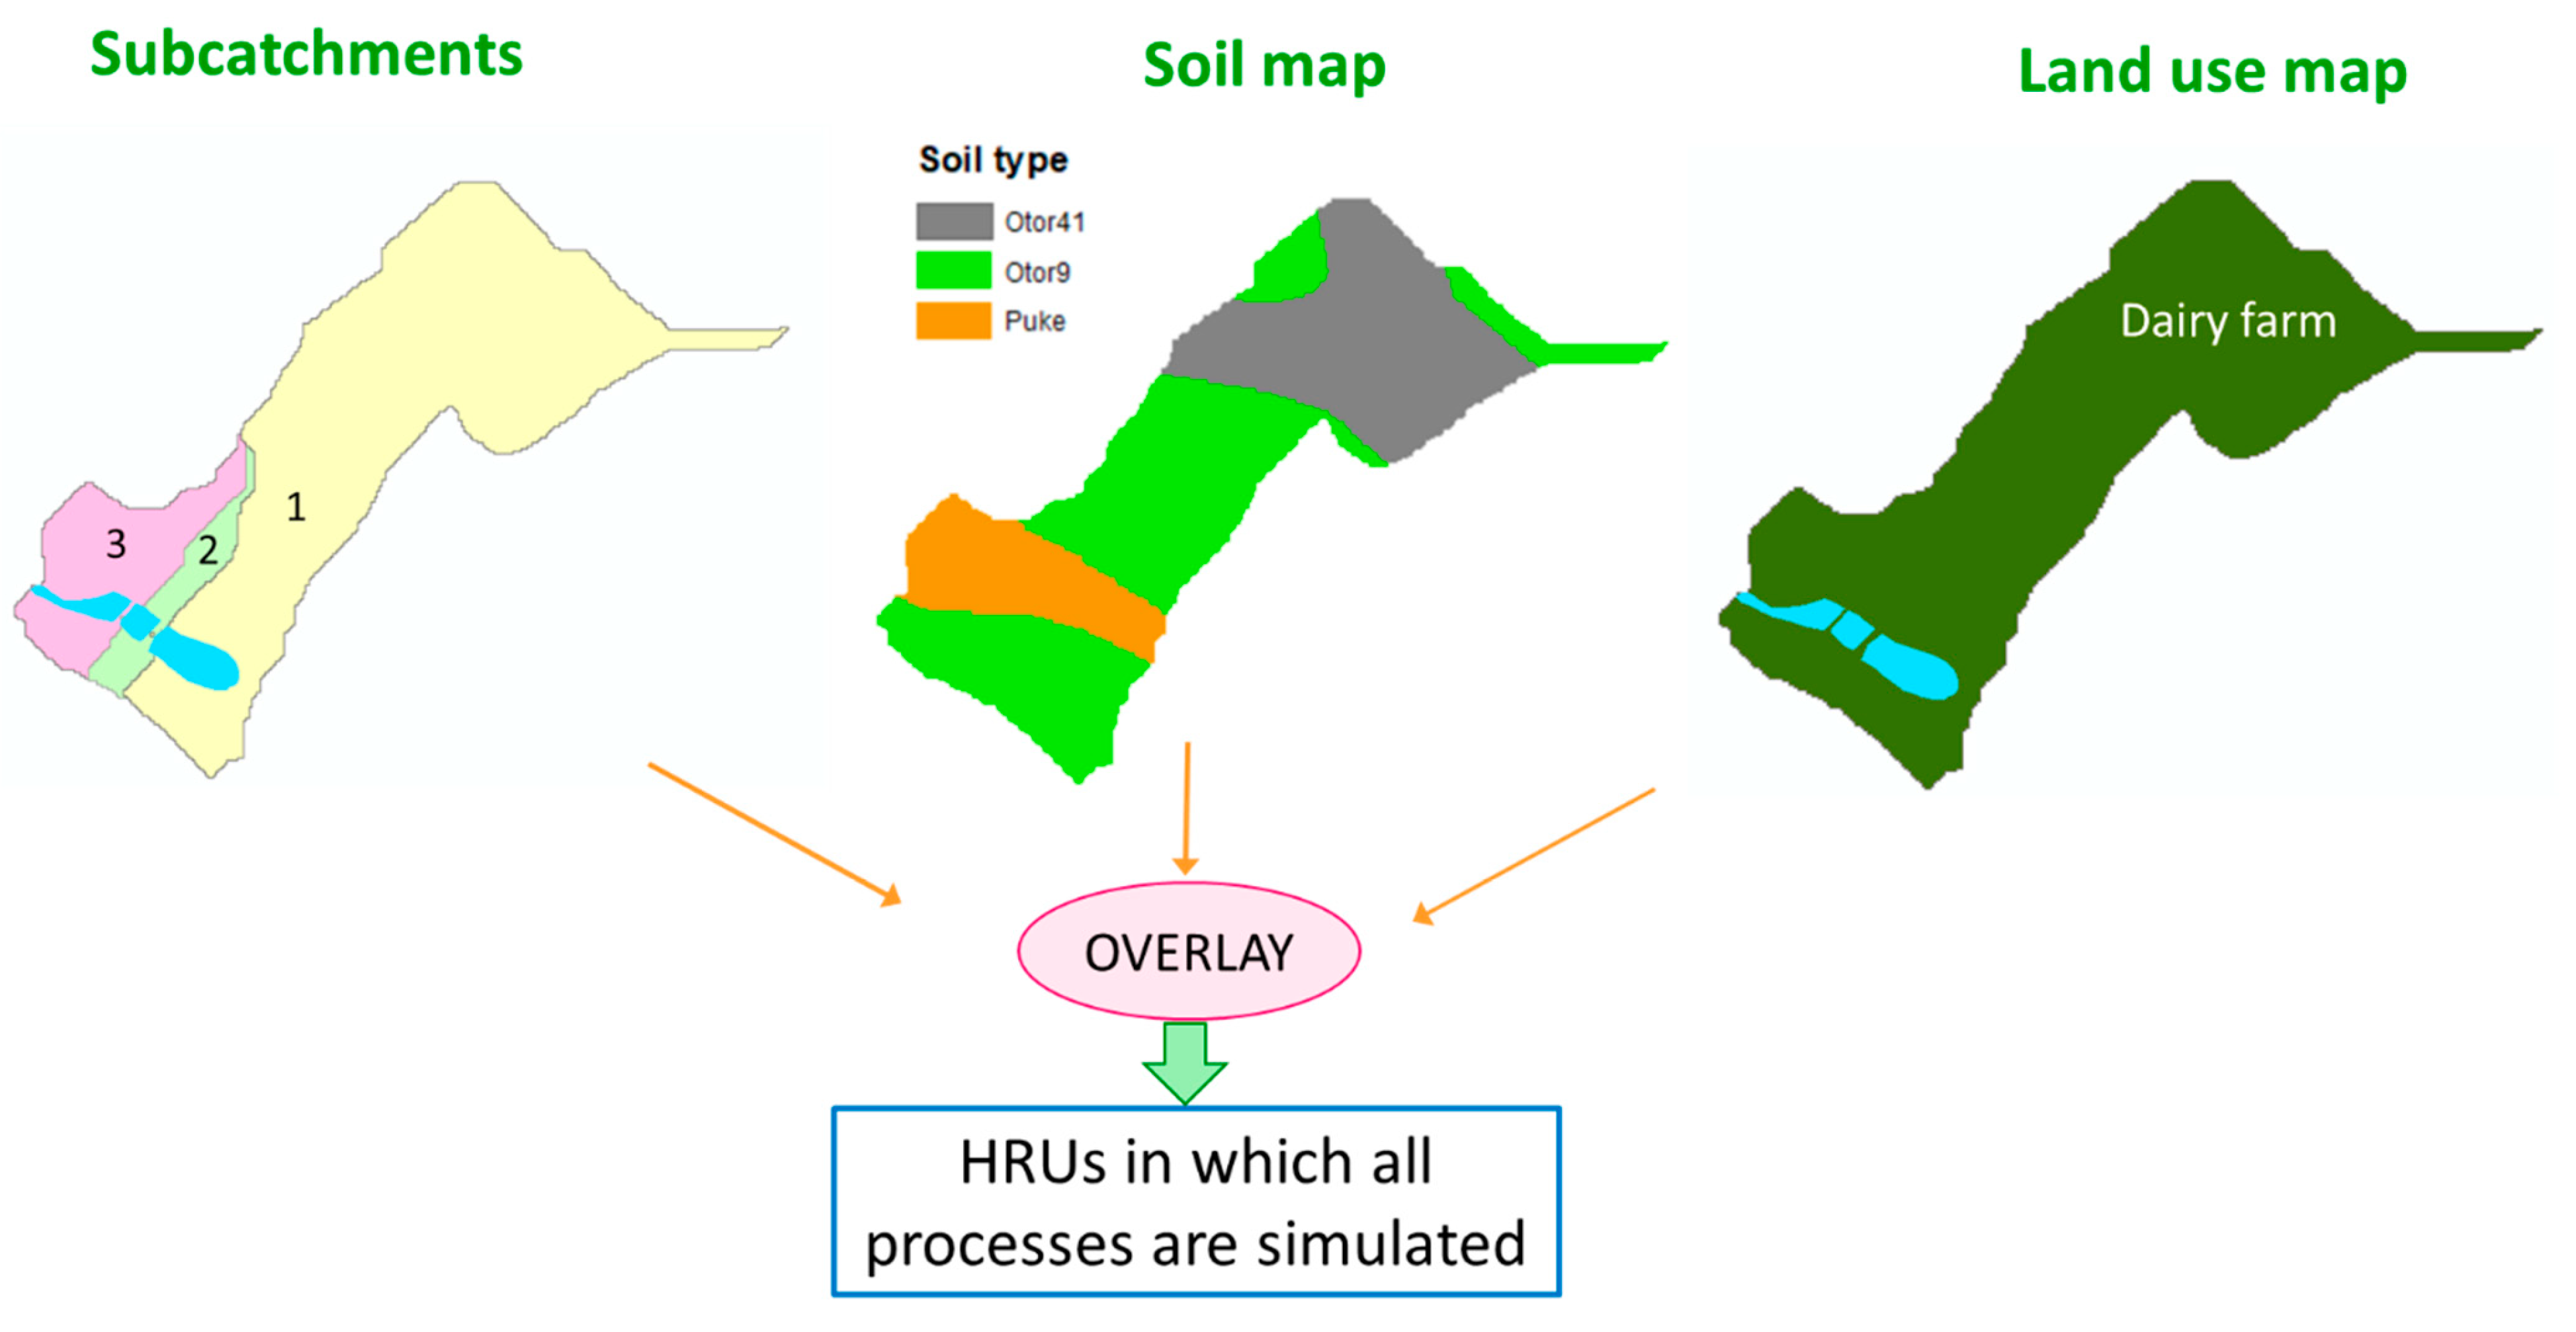
2.4.2. SWAT Model Setup for the Owl Farm Wetland Catchment
2.4.3. Estimates of Nitrogen Inputs
2.5. The Wetland Model
2.5.1. Water Balance in a Wetland Cell
2.5.2. Nutrient Mass Balance in a Wetland Cell
2.6. Model Calibration
2.6.1. Flow Calibration
2.6.2. Nitrogen Calibration
2.7. Evaluate Wetland Performance on Nitrogen Removal
- (i)
- Approach I: based on spot-measured water-quality concentrations and SWAT-simulated flow
- (ii)
- Approach II: based fully on calibrated SWAT and wetland model results
3. Results and Discussion
3.1. Model Calibration
3.1.1. Hydrological Simulation
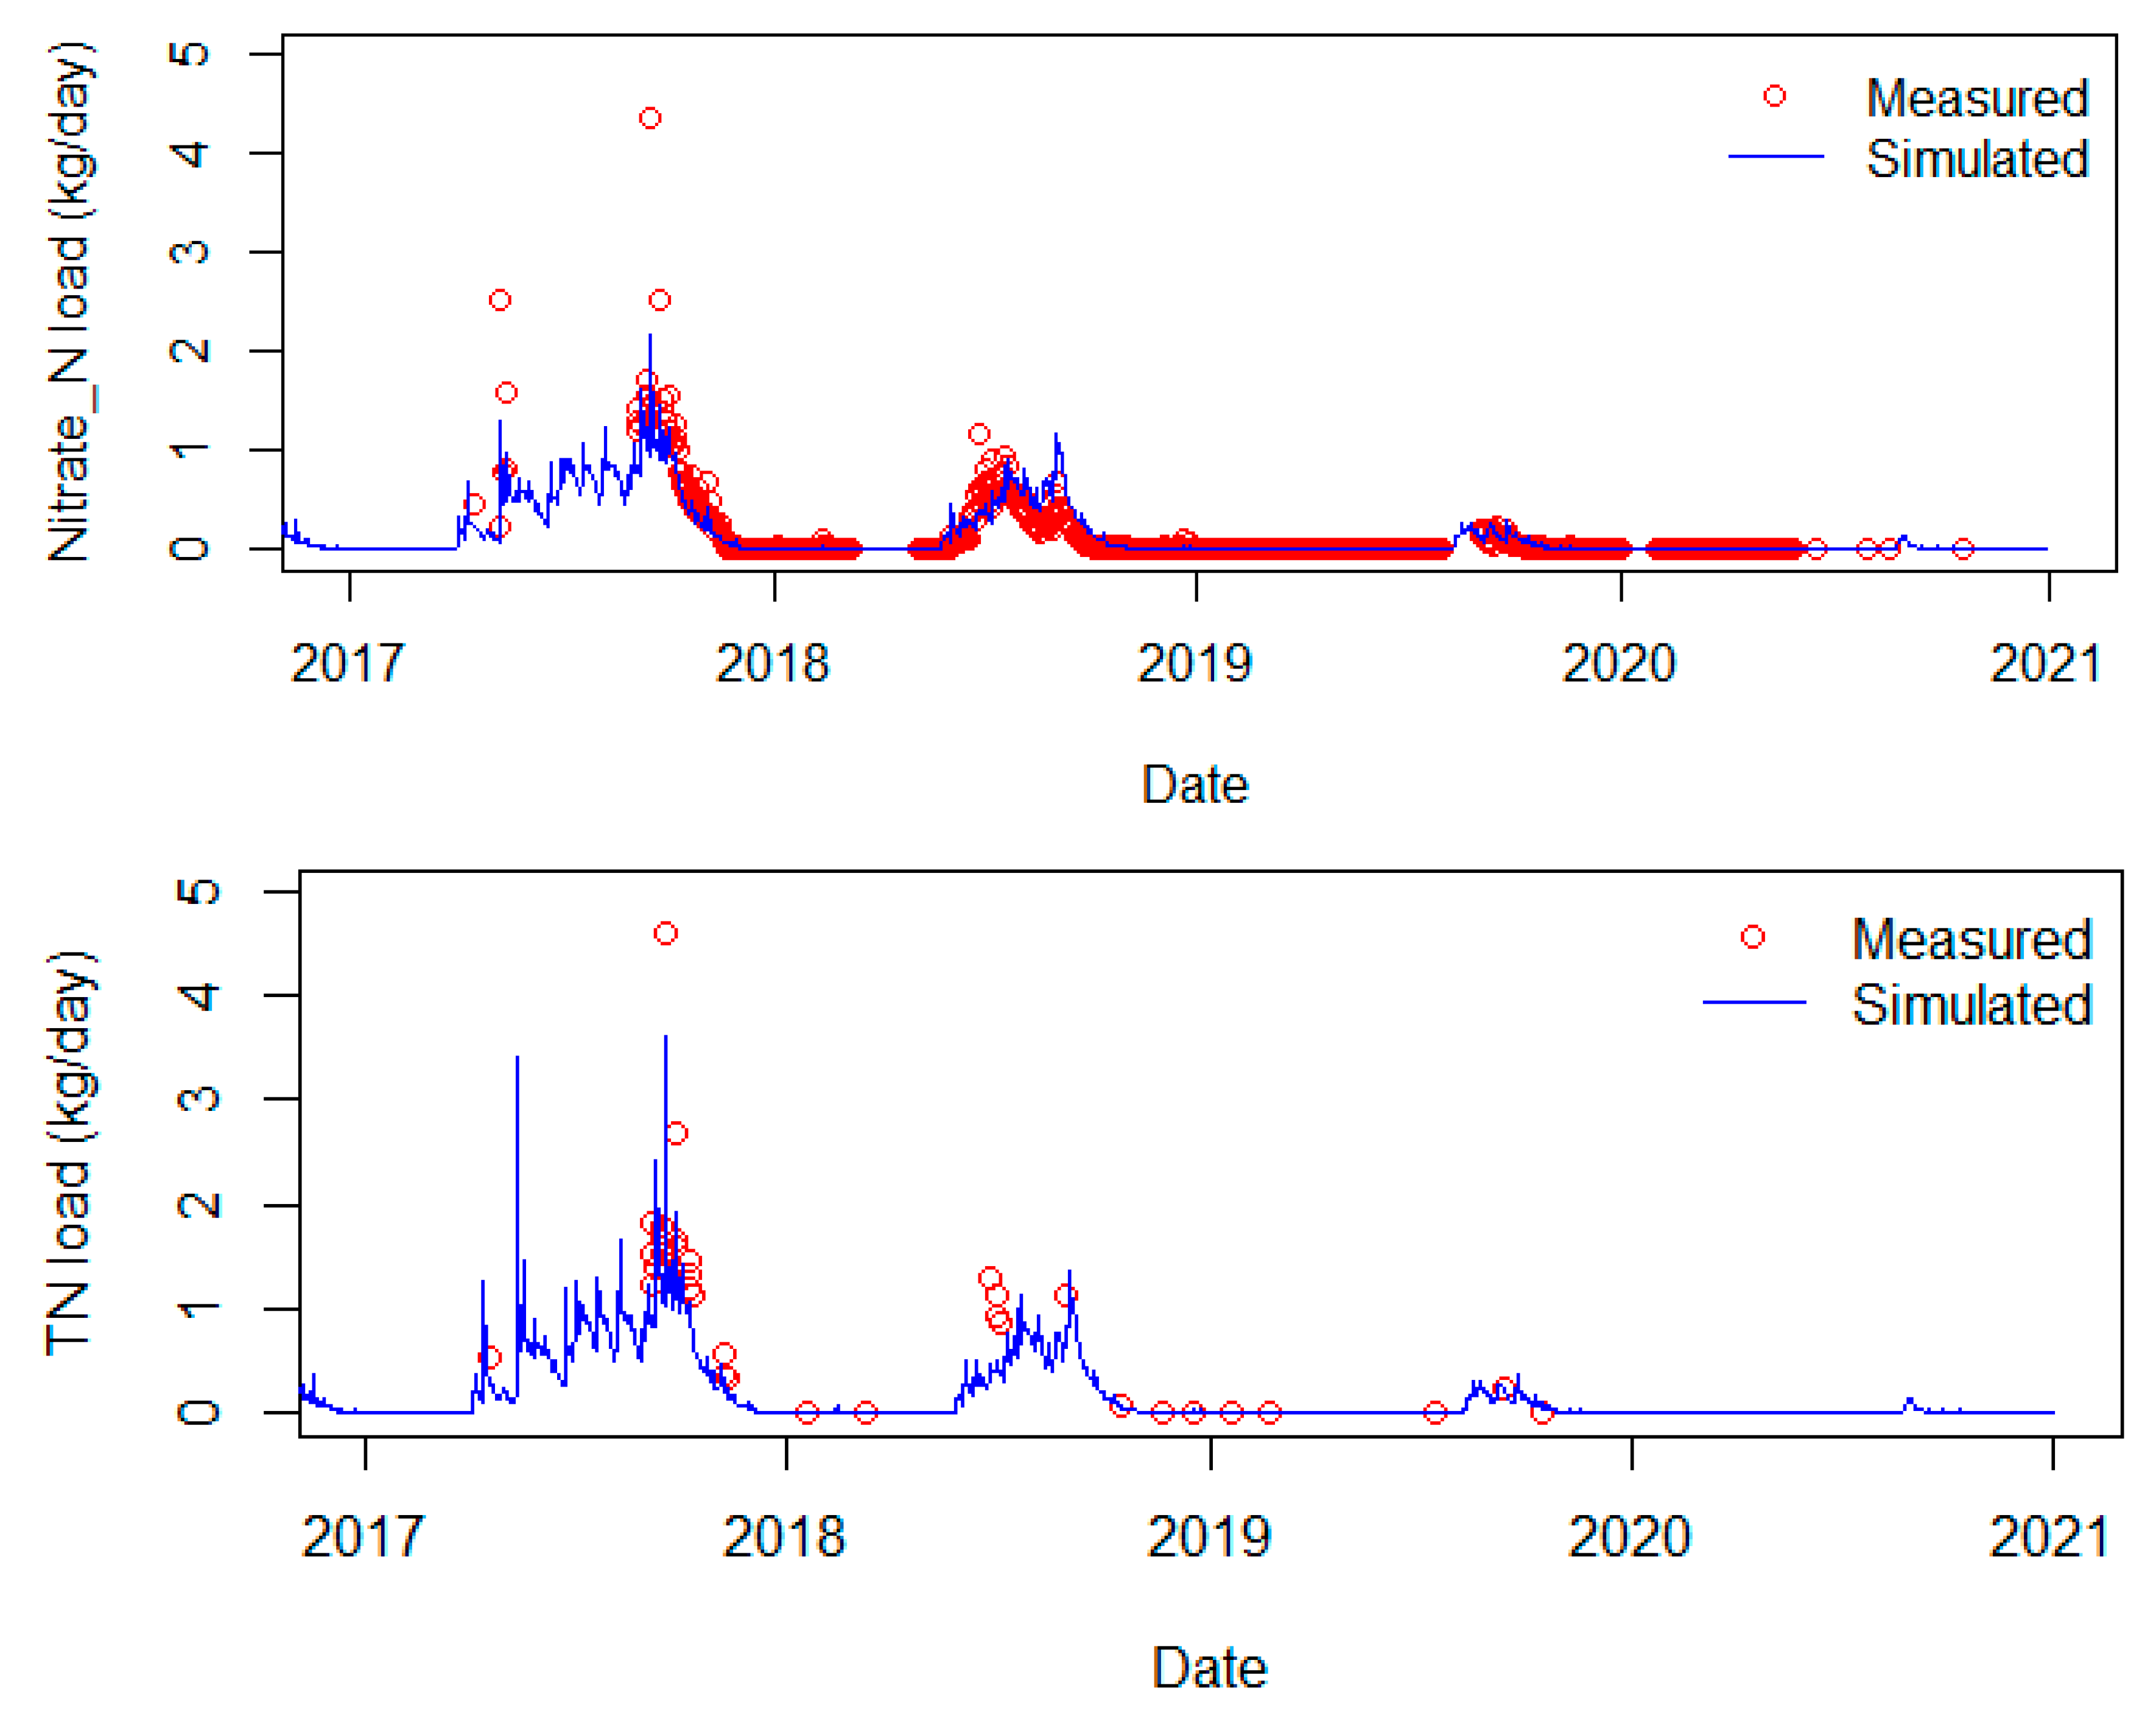
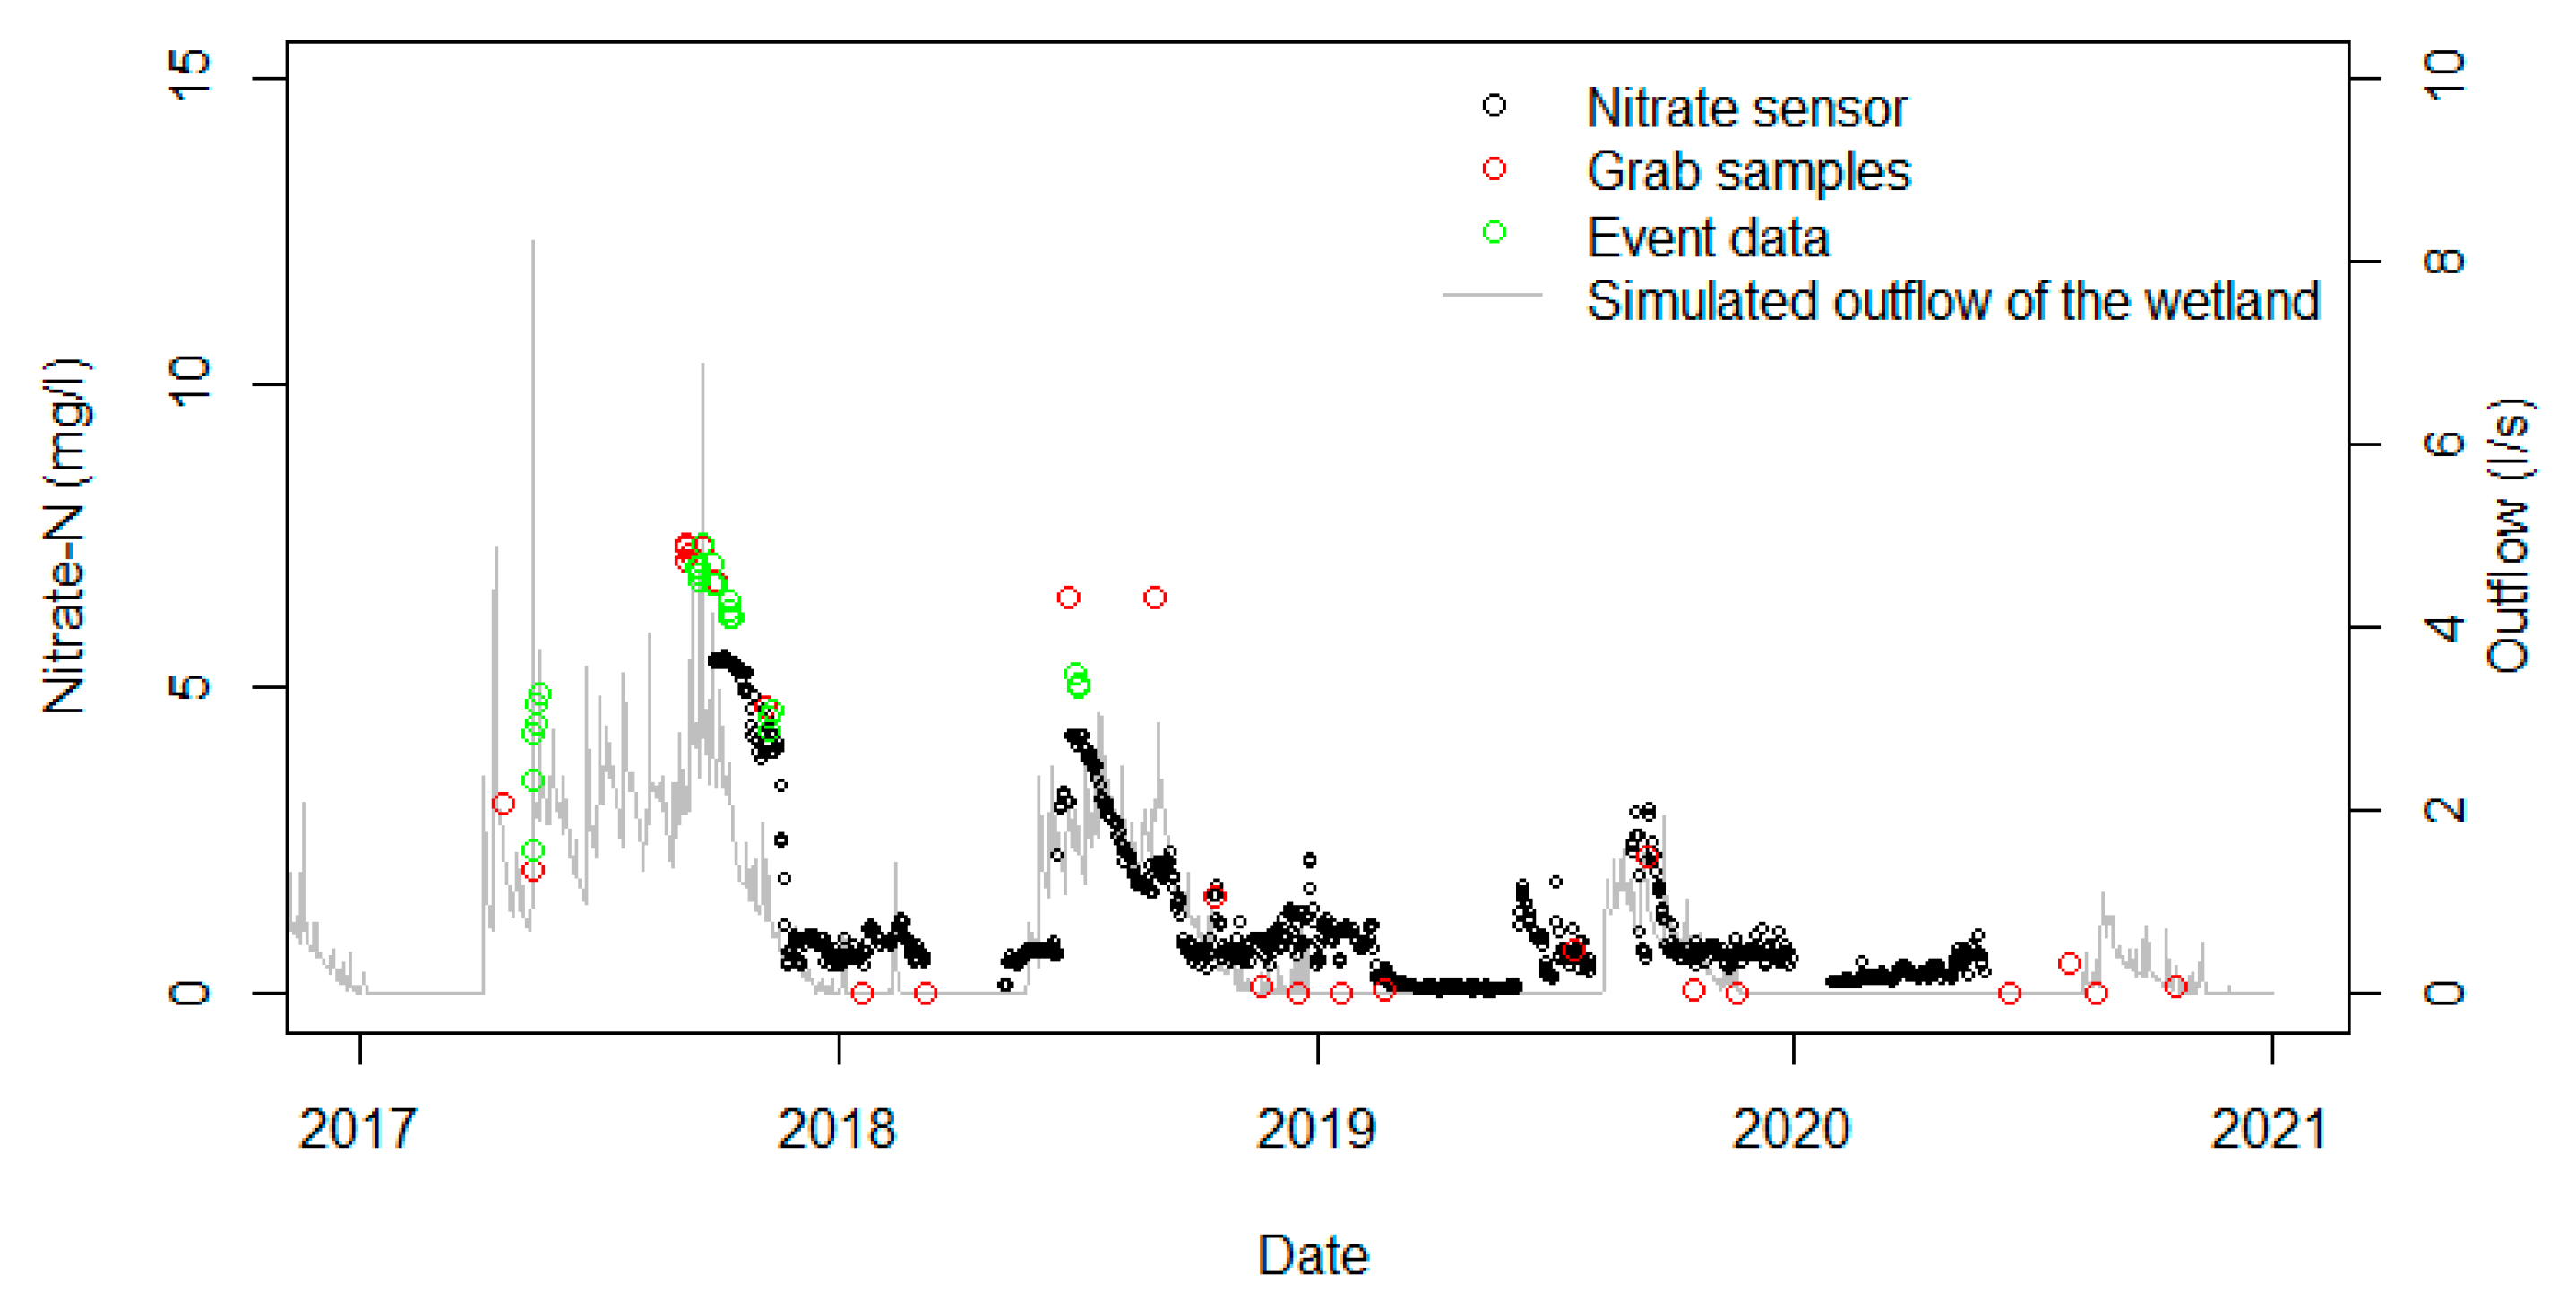
3.1.2. Nitrogen Simulation
3.2. Flow and Nitrogen Load from Catchment to Owl Farm Wetland
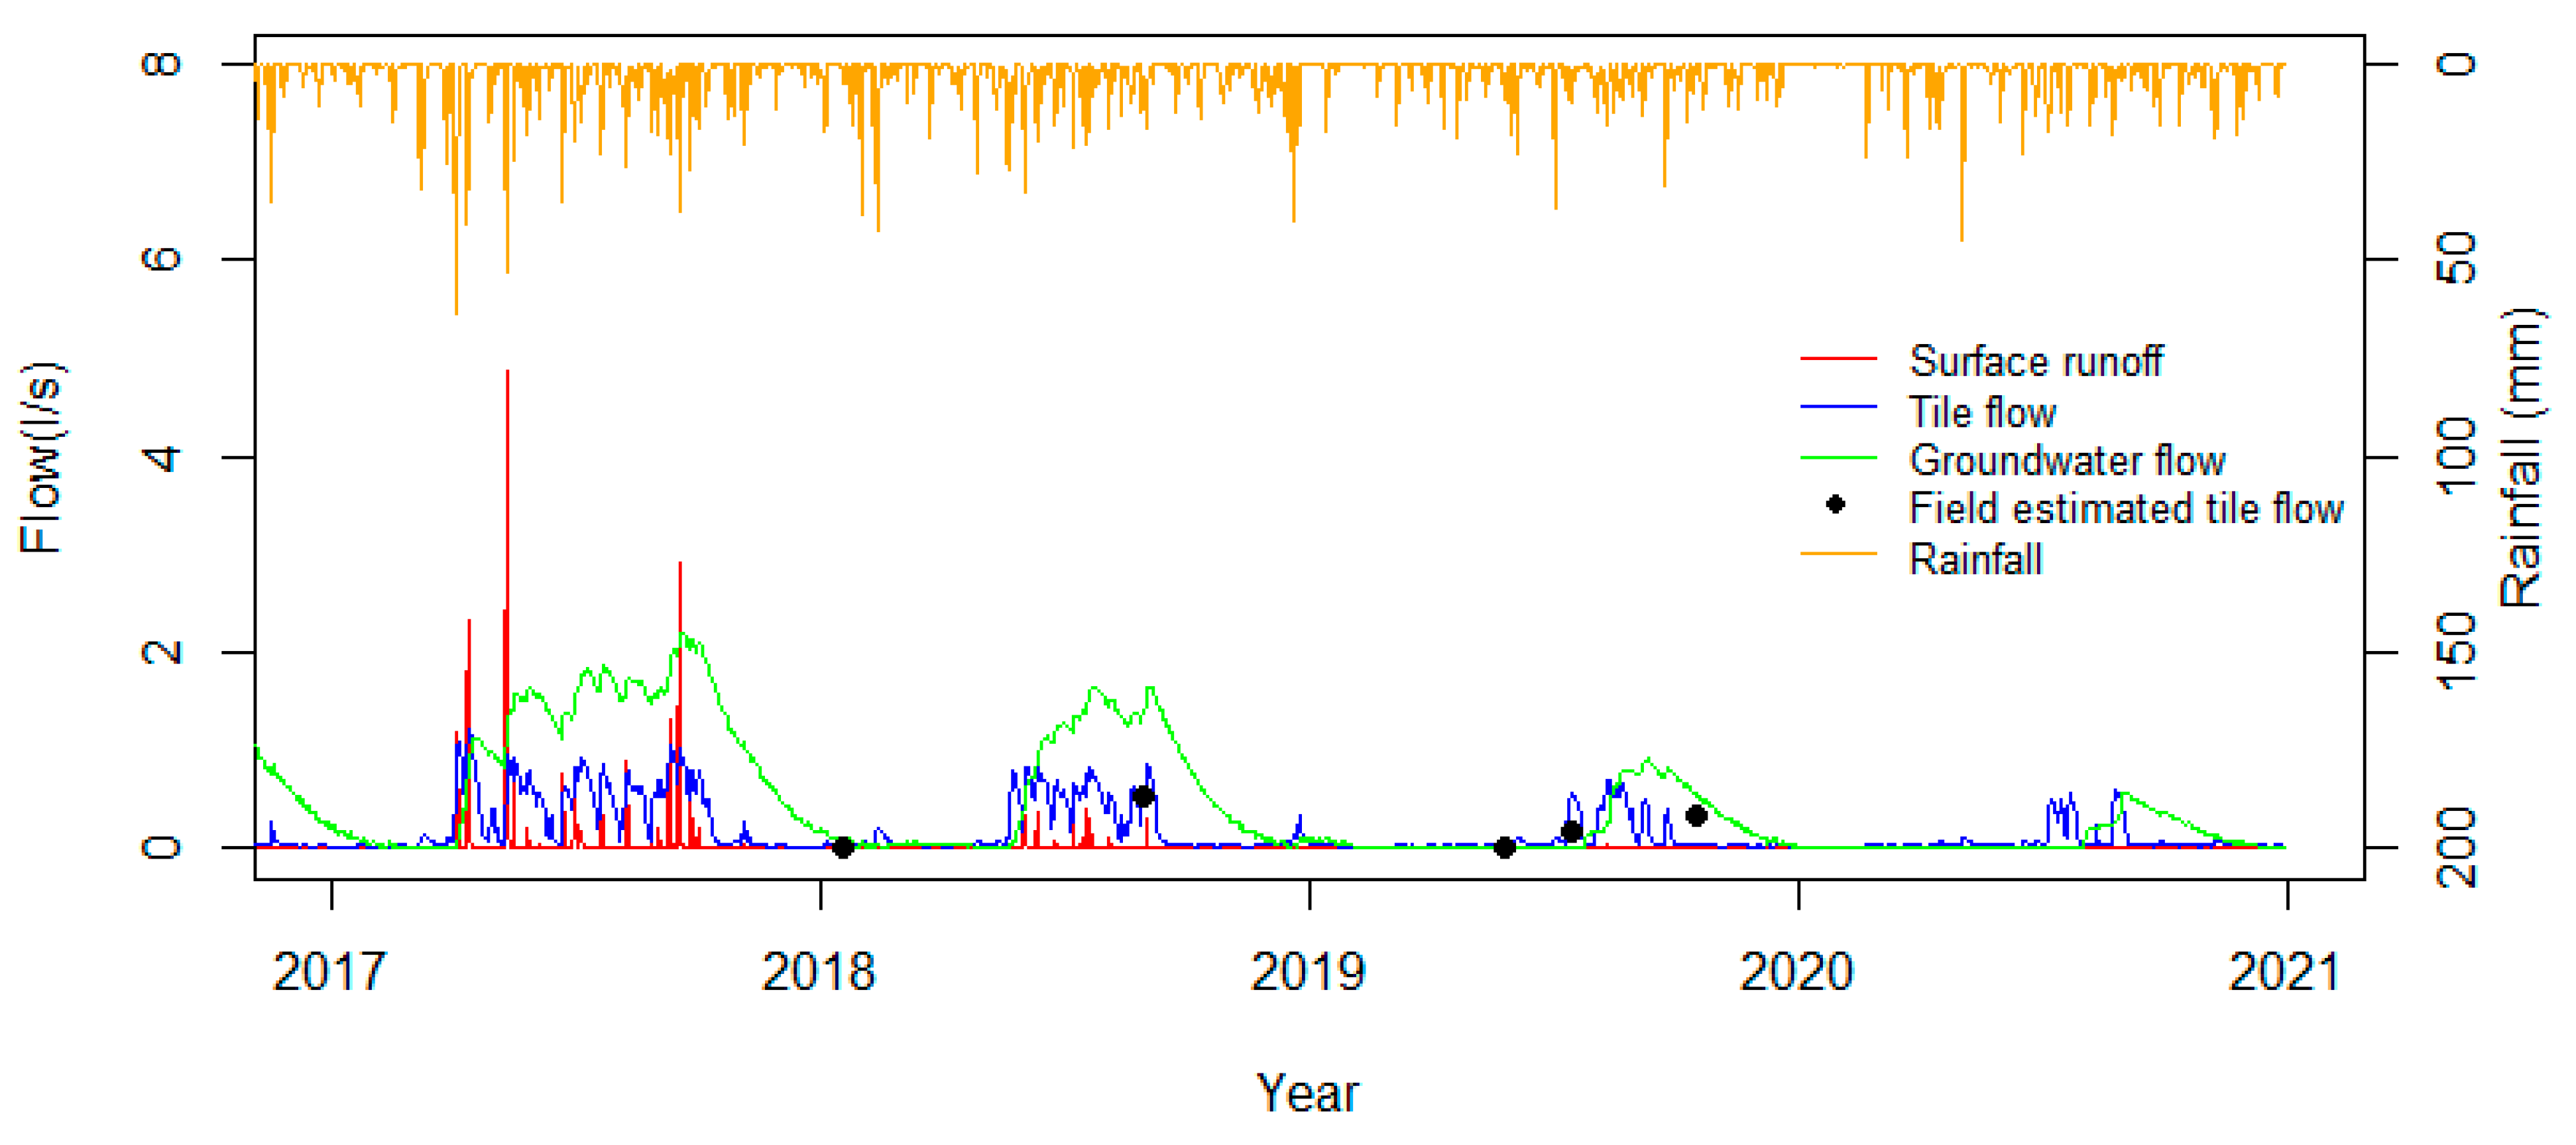
3.2.1. Flow
3.2.2. Nitrogen Load
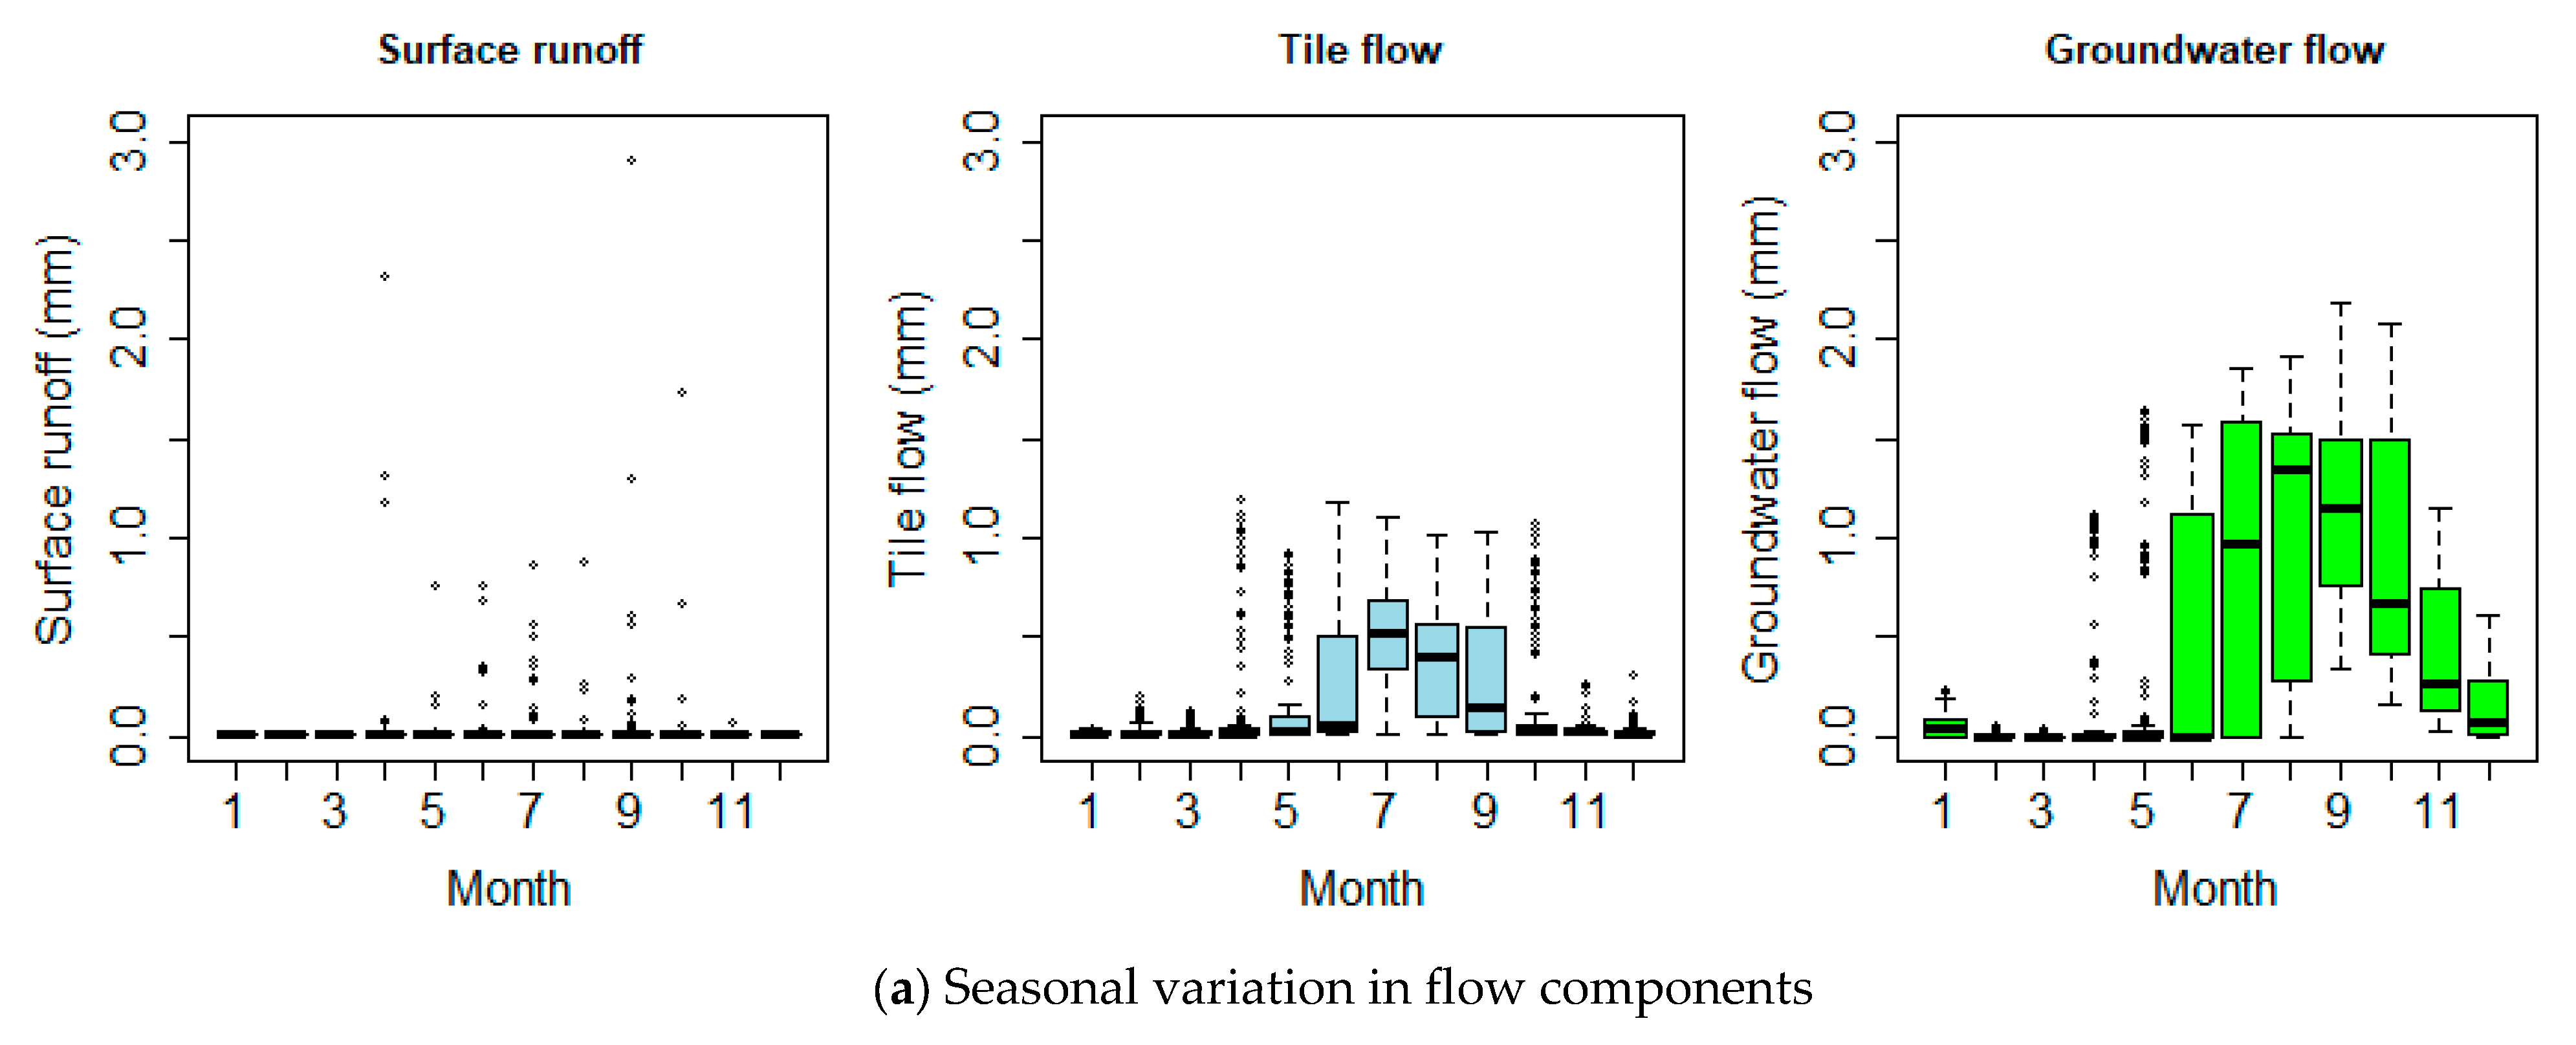
3.2.3. Seasonal Variation in Flow and Nitrate Yield
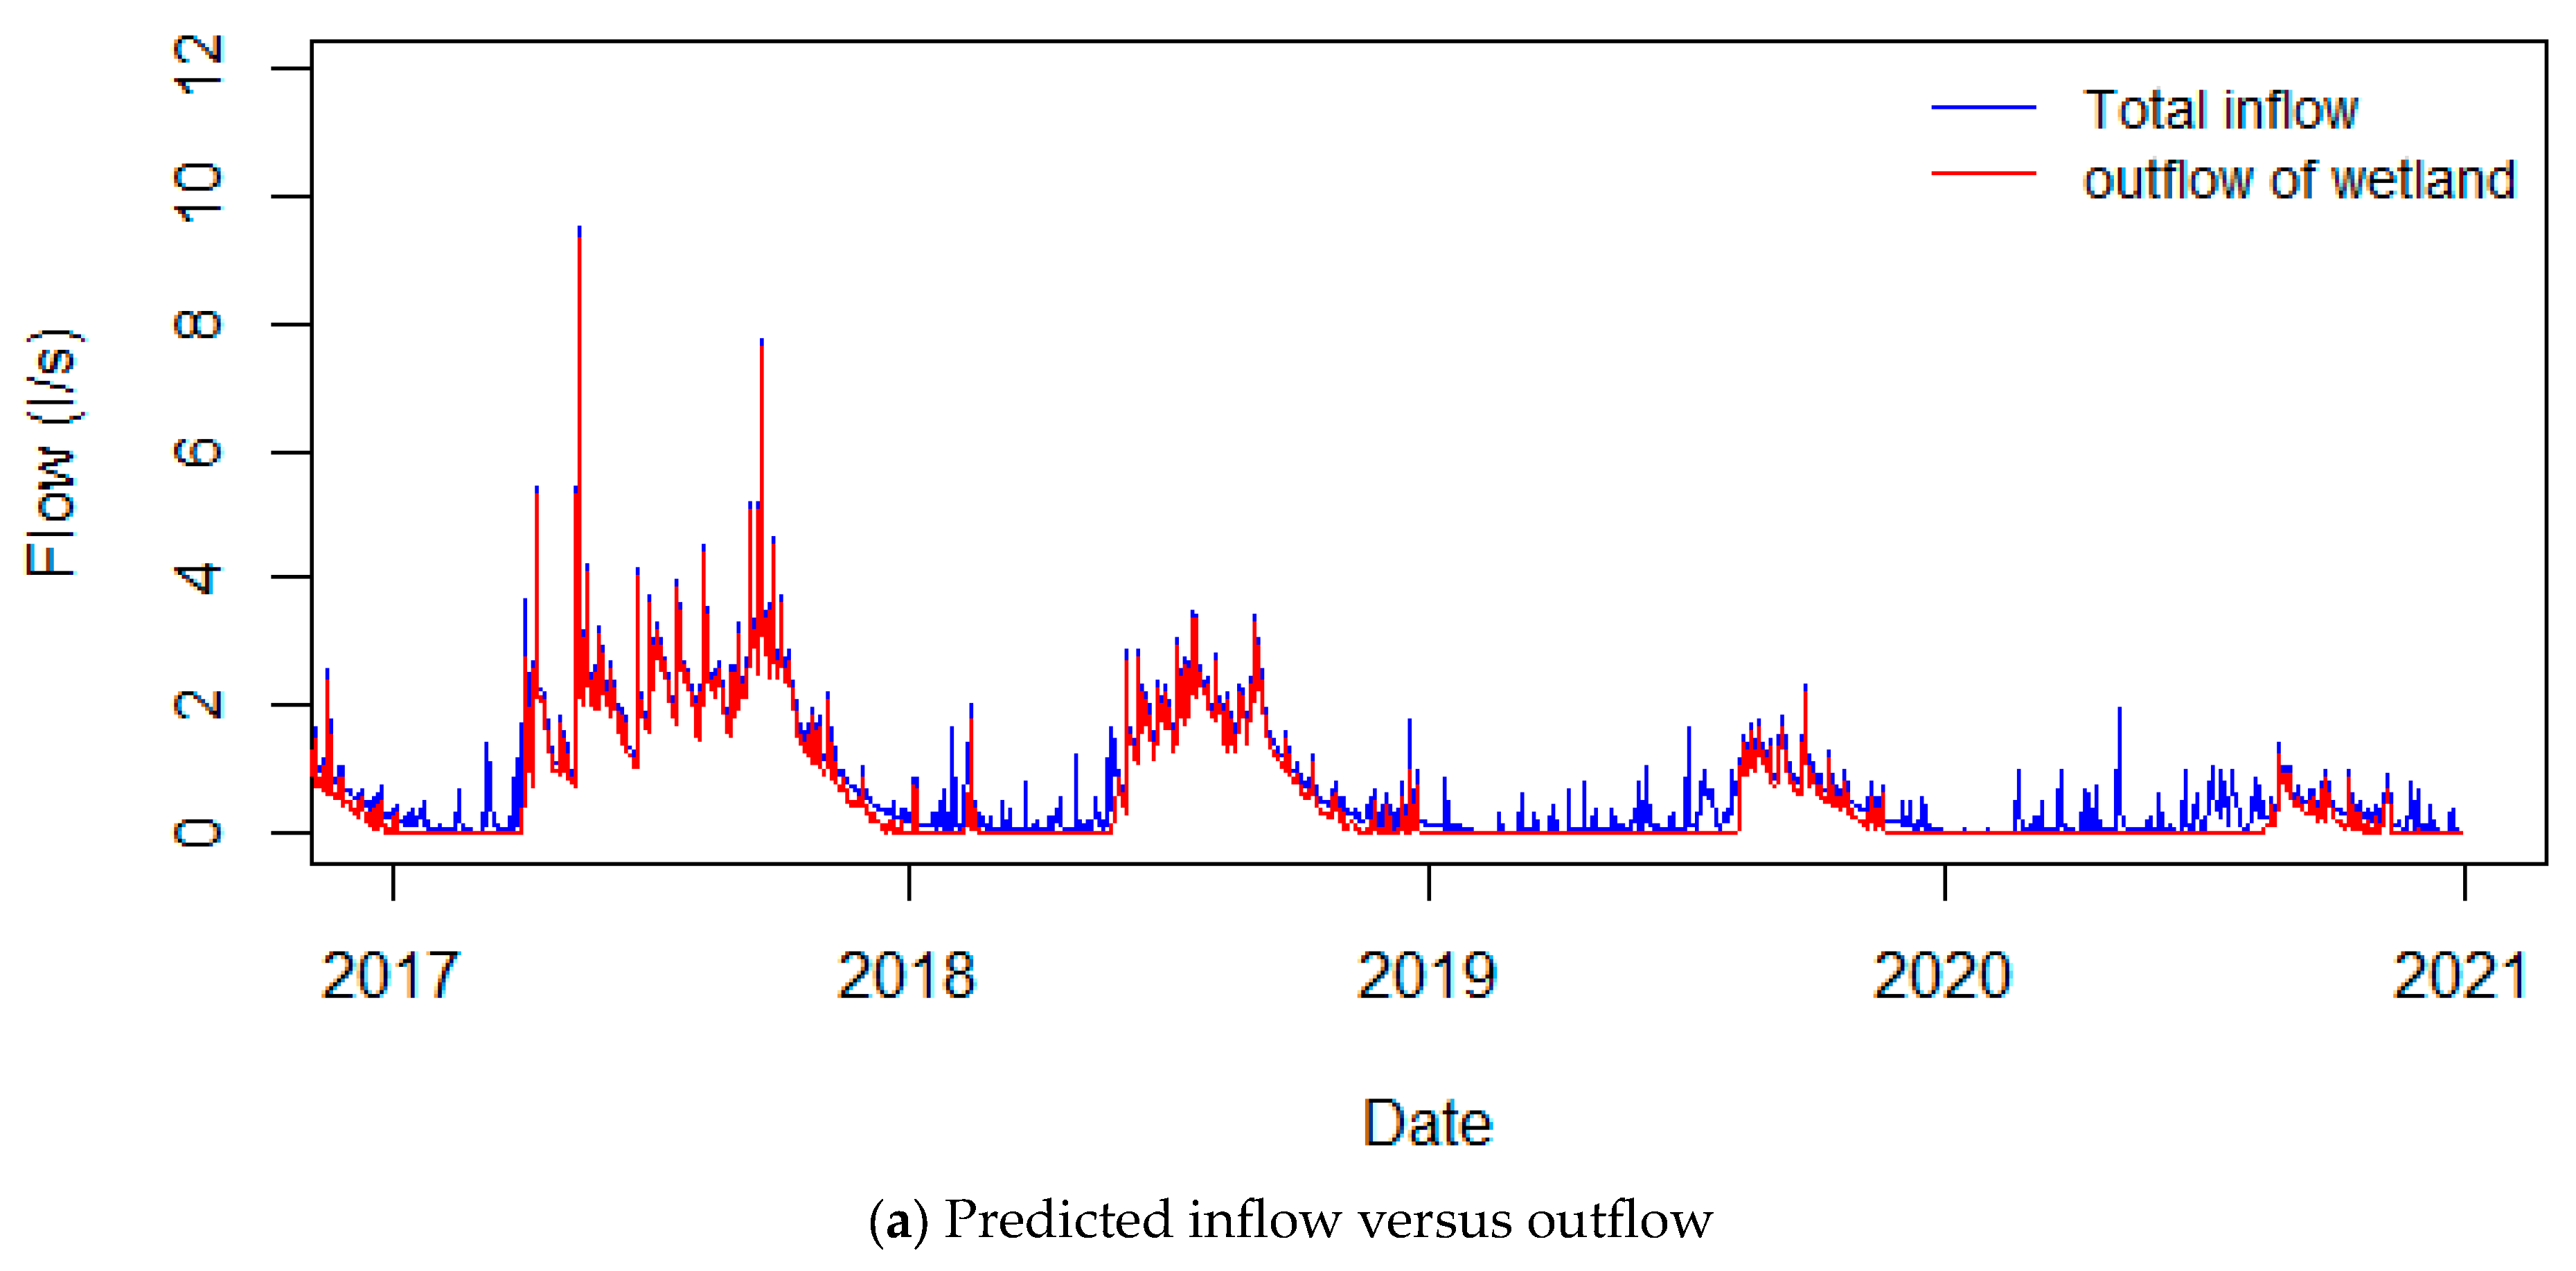
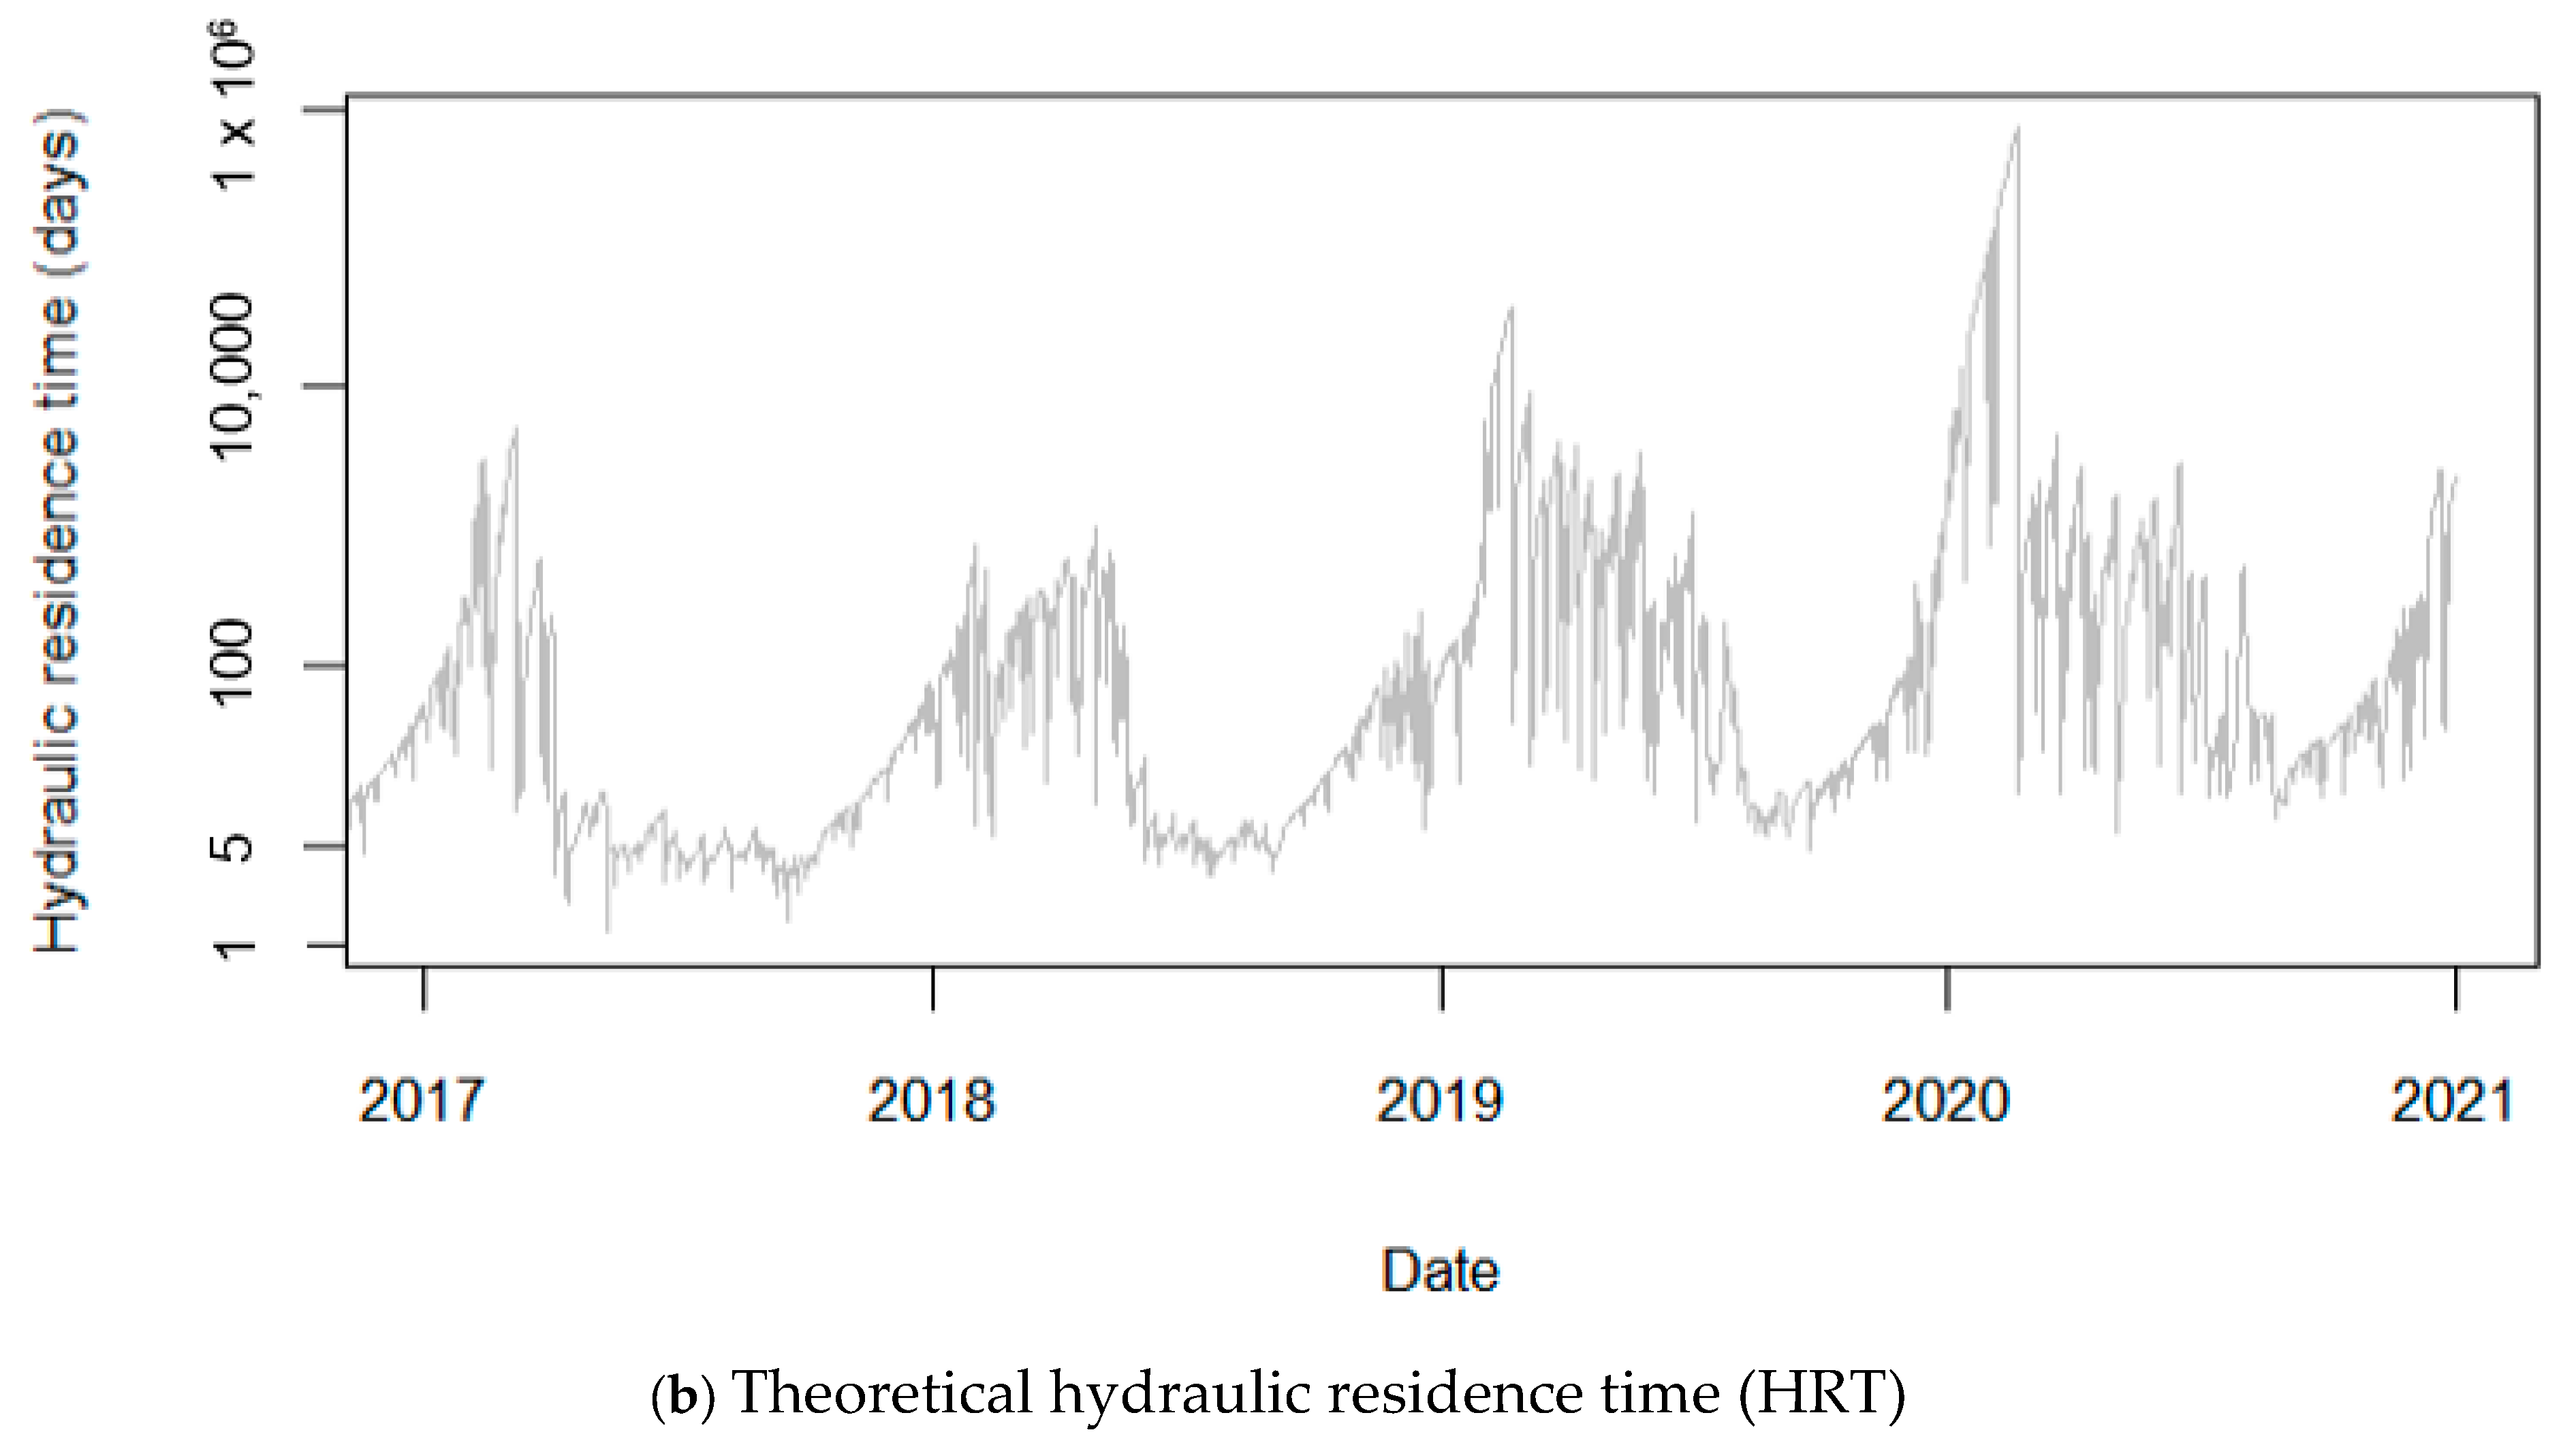
3.3. Residence Time
3.4. Nitrogen Concentration versus Flow
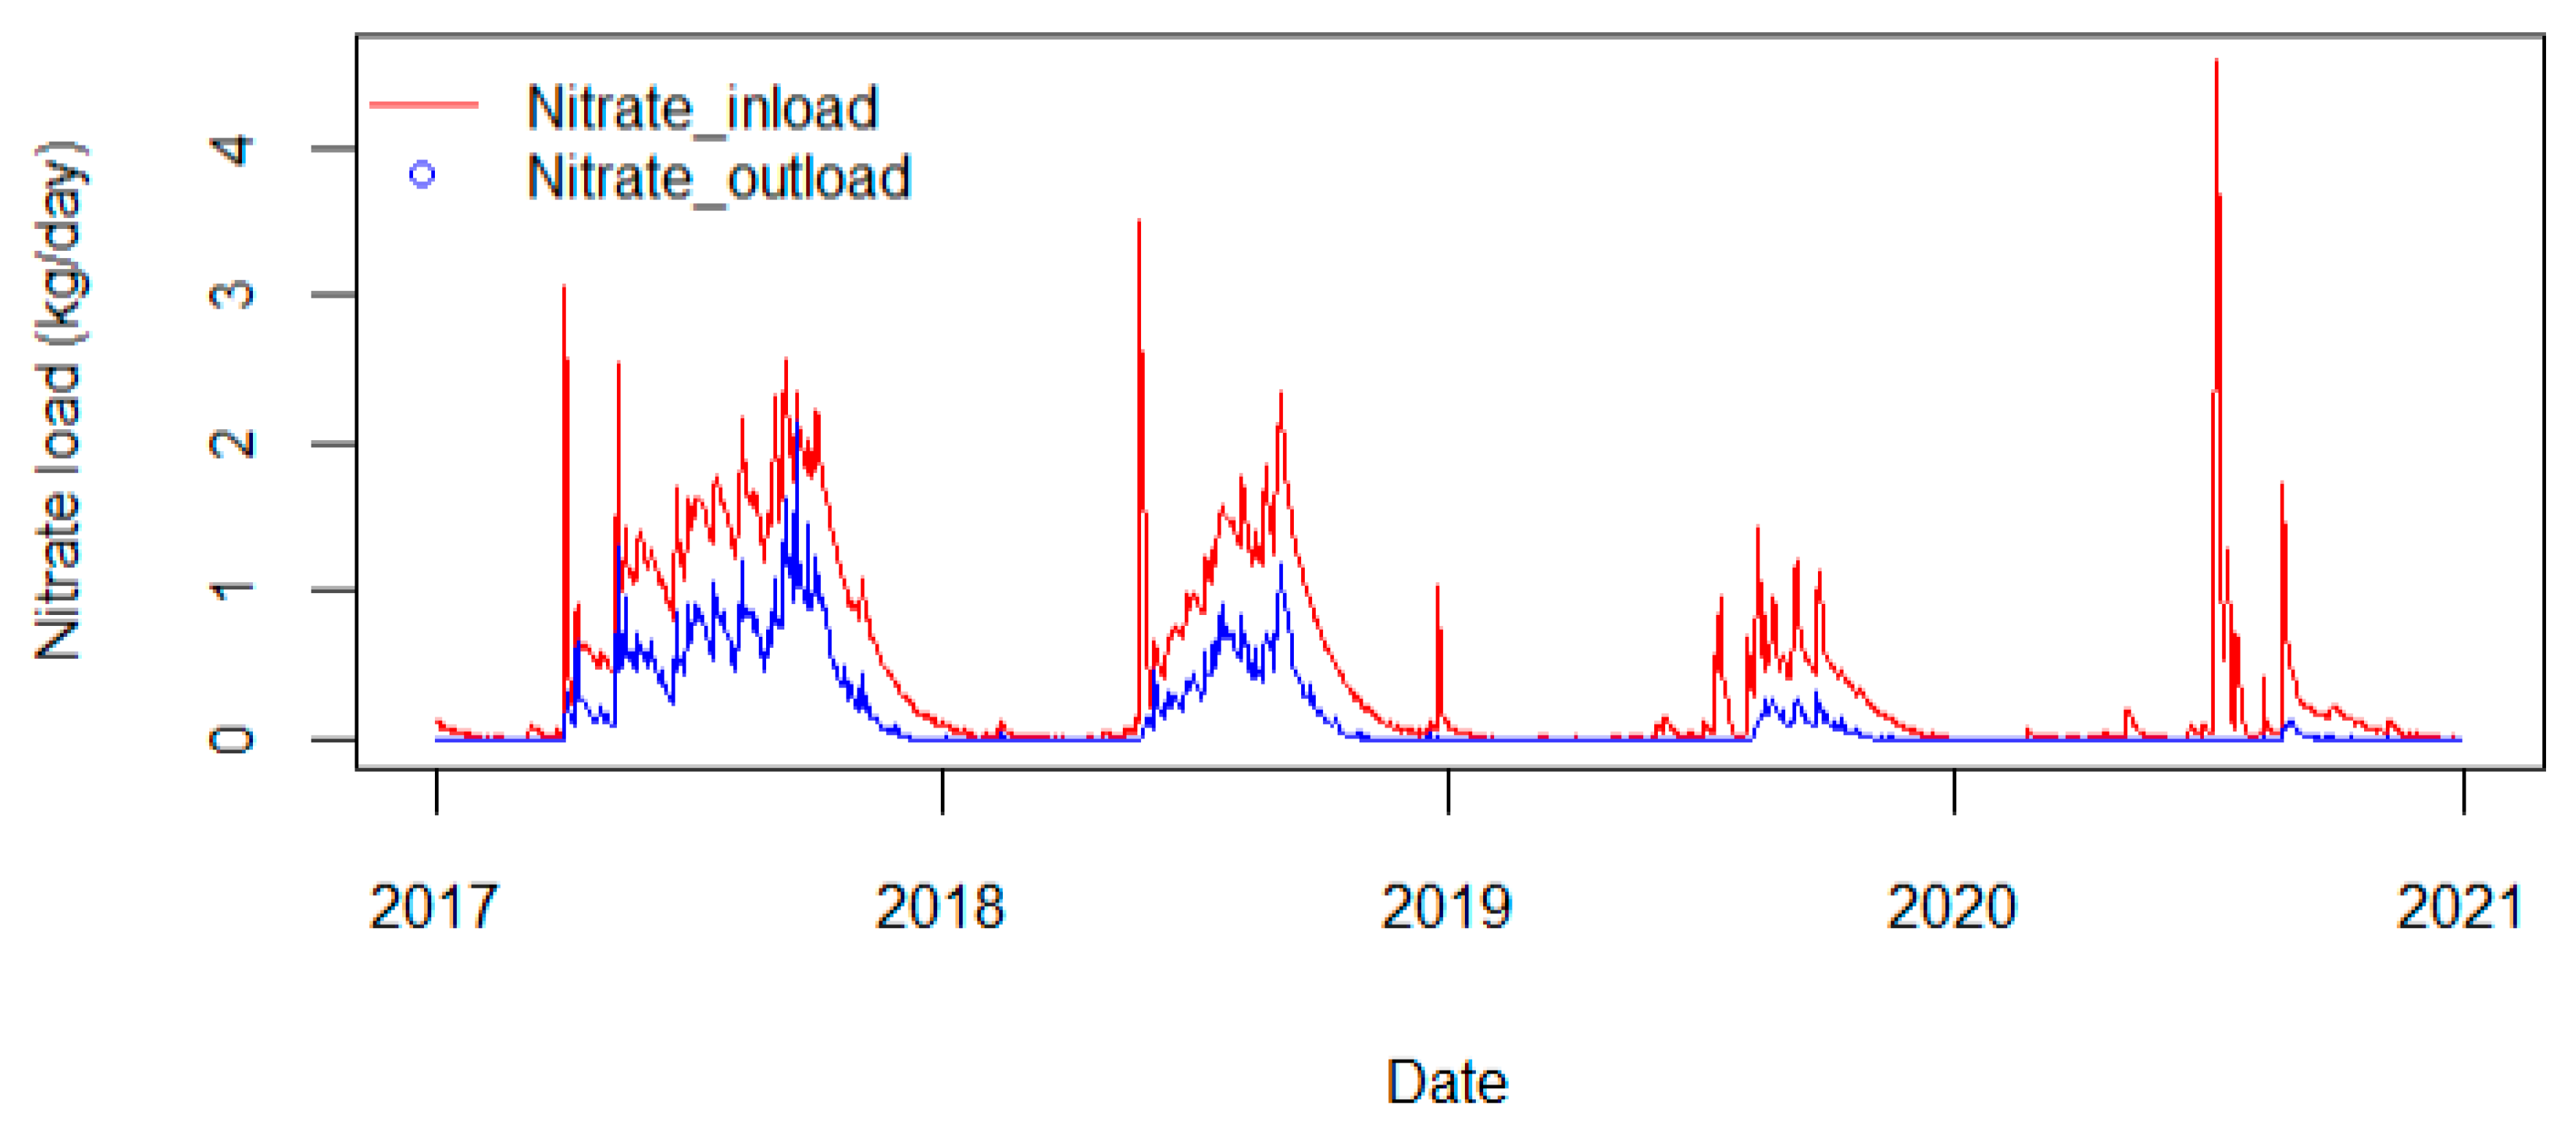
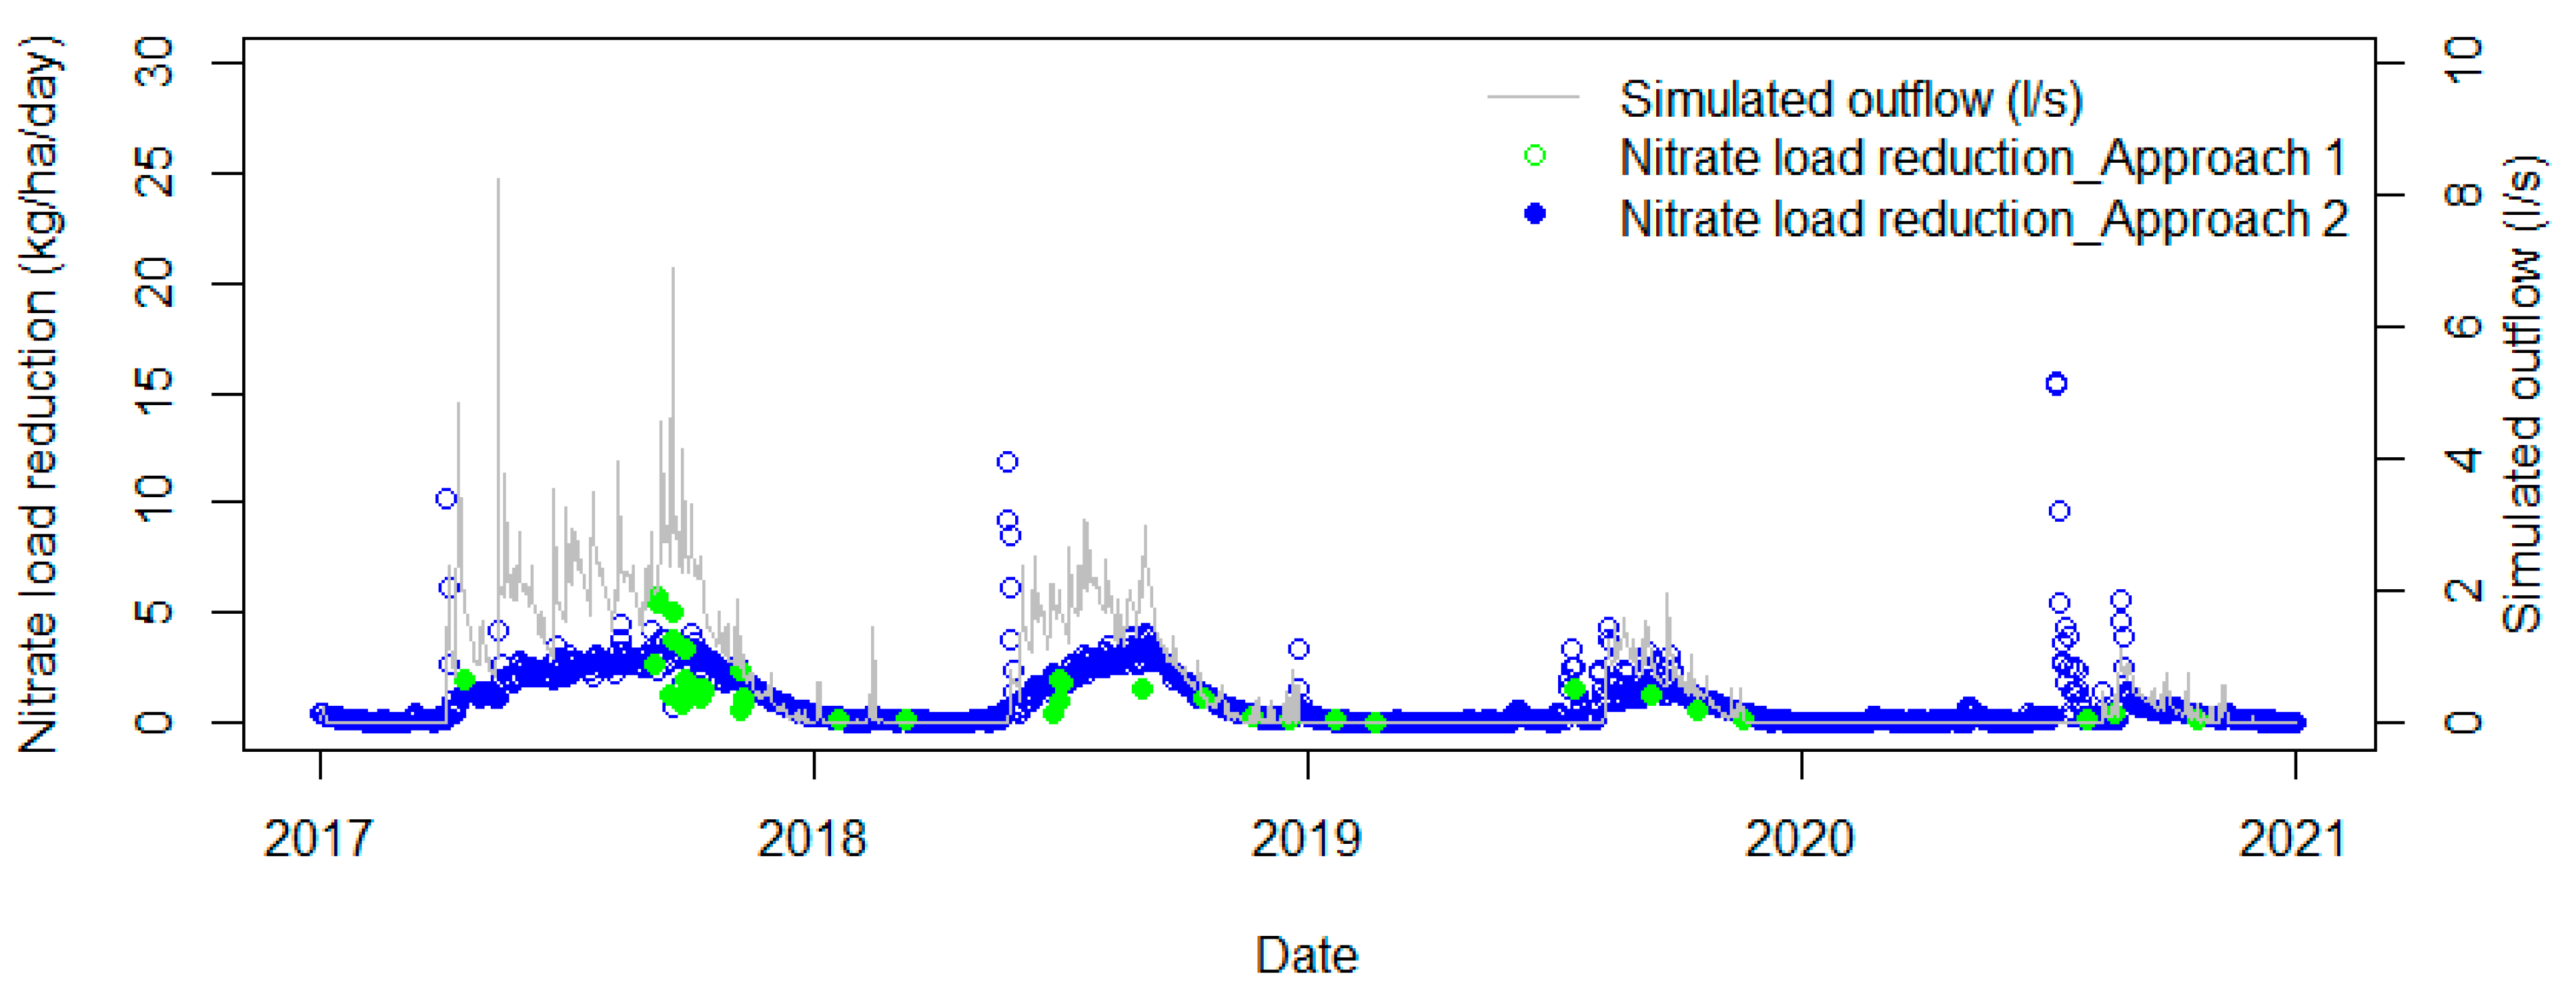
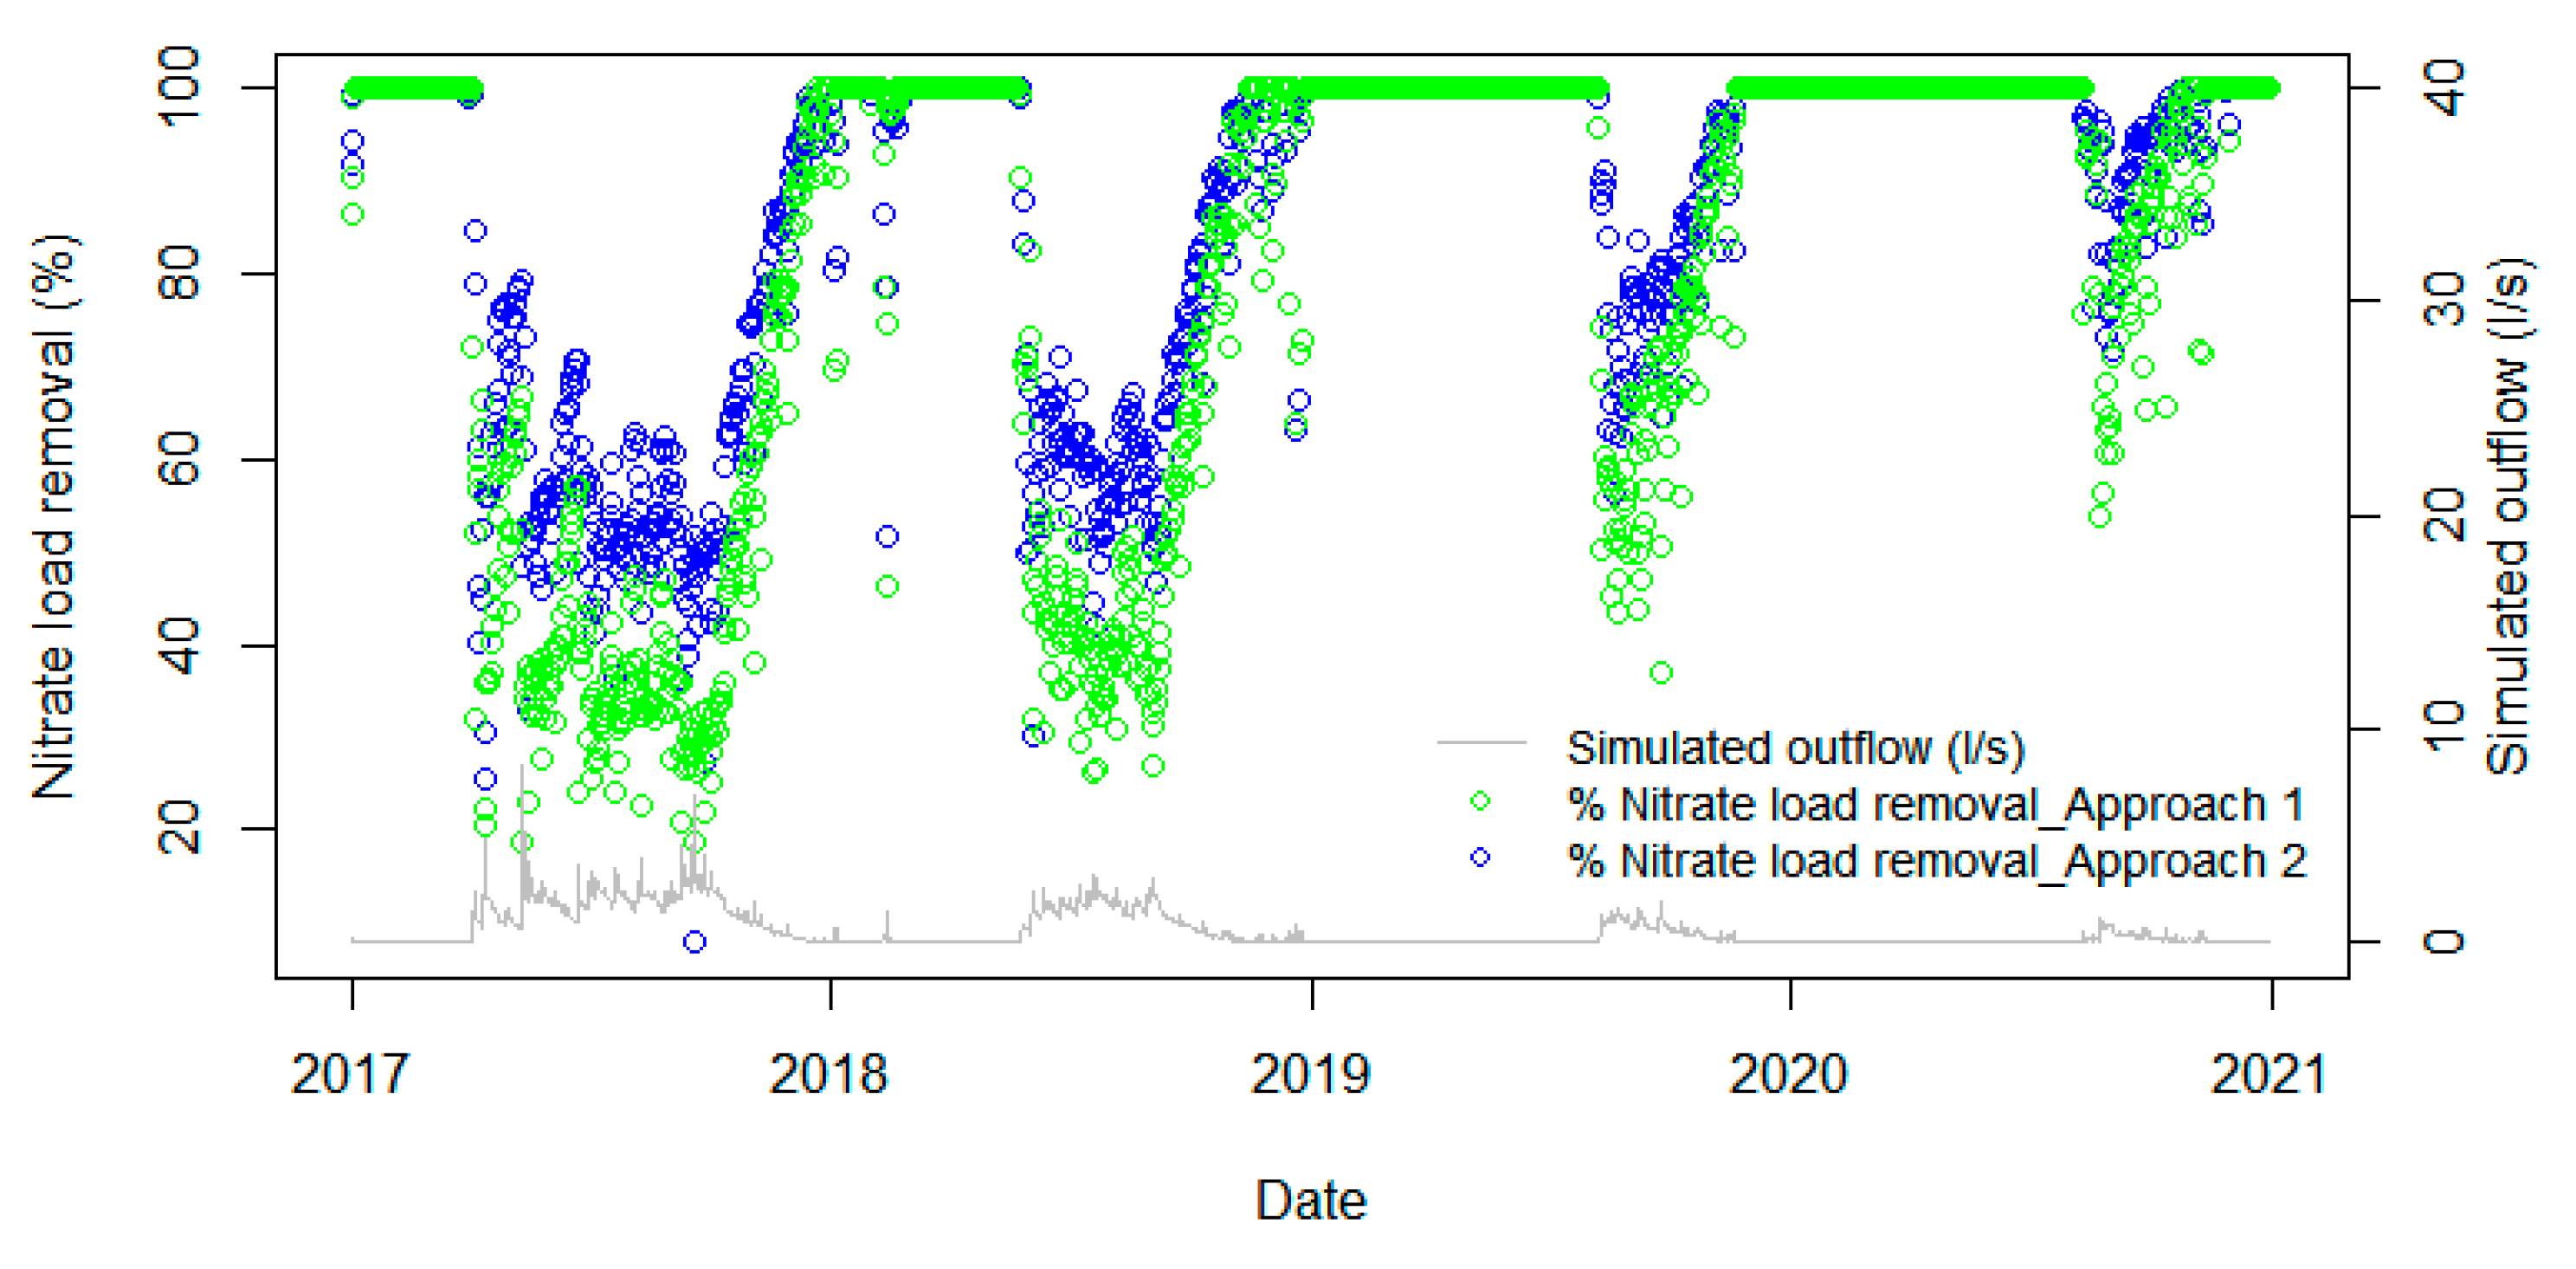
3.5. Performance of the Owl Farm Wetland on Nitrate-N Removal
4. Conclusions
Author Contributions
Funding
Data Availability Statement
Acknowledgments
Conflicts of Interest
References
- Mateo-Sagasta, J.; Zadeh, S.M.; Hugh, T. Water Pollution from Agriculture: A Global Review; Food and Agriculture Organization of the United Nations: Rome, Italy; International Water Management Institute: Colombo, Sri Lanka, 2017. [Google Scholar]
- Howarth, R.W. Coastal nitrogen pollution: A review of sources and trends globally and regionally. Harmful Algae 2008, 8, 14–20. [Google Scholar] [CrossRef]
- King, K.W.; Williams, M.R.; Macrae, M.L.; Fausey, N.R.; Frankenberger, J.; Smith, D.R.; Kleinman, P.J.A.; Brown, L.C. Phosphorus Transport in Agricultural Subsurface Drainage: A Review. J. Environ. Qual. 2015, 44, 467–485. [Google Scholar] [CrossRef] [PubMed]
- Smith, V.H. Eutrophication of freshwater and coastal marine ecosystems a global problem. Environ. Sci. Pollut. Res. 2003, 10, 126–139. [Google Scholar] [CrossRef] [PubMed]
- Withers, P.J.A.; Neal, C.; Jarvie, H.P.; Doody, D.G. Agriculture and Eutrophication: Where Do We Go from Here? Sustainability 2014, 6, 5853–5875. [Google Scholar] [CrossRef]
- Seidenfaden, I.K.; Sonnenborg, T.O.; Børgesen, C.D.; Trolle, D.; Olesen, J.E.; Refsgaard, J.C. Impacts of land use, climate change and hydrological model structure on nitrate fluxes: Magnitudes and uncertainties. Sci. Total Environ. 2022, 830, 154671. [Google Scholar] [CrossRef]
- Vymazal, J. Enhancing ecosystem services on the landscape with created, constructed and restored wetlands. Ecol. Eng. 2011, 37, 1–5. [Google Scholar] [CrossRef]
- Carstensen, M.V.; Hashemi, F.; Hoffmann, C.C.; Zak, D.; Audet, J.; Kronvang, B. Efficiency of mitigation measures targeting nutrient losses from agricultural drainage systems: A review. Ambio 2020, 49, 1820–1837. [Google Scholar] [CrossRef]
- Crumpton, W.G.; Stenback, G.A.; Fisher, S.W.; Stenback, J.Z.; Green, D.I.S. Water quality performance of wetlands receiving nonpoint-source nitrogen loads: Nitrate and total nitrogen removal efficiency and controlling factors. J. Environ. Qual. 2020, 49, 735–744. [Google Scholar] [CrossRef]
- Tanner, C.C.; Depree, C.V.; Sukias, J.P.S.; Wright-Stow, A.E.; Burger, D.F.; Goeller, B.C. Constructed Wetland Practitioners Guide: Design and Performance Estimates; DairyNZ/NIWA: Hamilton, New Zealand, 2022. [Google Scholar]
- Strand, J.A.; Weisner, S.E.B. Effects of wetland construction on nitrogen transport and species richness in the agricultural landscape—Experiences from Sweden. Ecol. Eng. 2013, 56, 14–25. [Google Scholar] [CrossRef]
- Tanner, C.C.; Sukias, J.P.S. Multiyear Nutrient Removal Performance of Three Constructed Wetlands Intercepting Tile Drain Flows from Grazed Pastures. J. Environ. Qual. 2011, 40, 620–633. [Google Scholar] [CrossRef]
- Tanner, C.C.; Kadlec, R.H. Influence of hydrological regime on wetland attenuation of diffuse agricultural nitrate losses. Ecol. Eng. 2013, 56, 79–88. [Google Scholar] [CrossRef]
- Kadlec, R.H.; Wallace, S.D. Treatment Wetlands, 2nd ed.; CRC Press: Boca Raton, FL, USA, 2009. [Google Scholar]
- Ranalli, A.J.; Macalady, D.L. The importance of the riparian zone and in-stream processes in nitrate attenuation in undisturbed and agricultural watersheds—A review of the scientific literature. J. Hydrol. 2010, 389, 406–415. [Google Scholar] [CrossRef]
- Restrepo, J.I.; Montoya, A.M.; Obeysekera, J. A Wetland Simulation Module for the MODFLOW Ground Water Model. Groundwater 1998, 36, 764–770. [Google Scholar] [CrossRef]
- Bradley, C. Simulation of the annual water table dynamics of a floodplain wetland, Narborough Bog, UK. J. Hydrol. 2002, 261, 150–172. [Google Scholar] [CrossRef]
- Lee, E.R.; Mostaghimi, S.; Wynn, T.M. A Model to Enhance Wetland Design and Optimise Nonpoint Source Pollution Control. JAWRA J. Am. Water Resour. Assoc. 2002, 38, 17–32. [Google Scholar] [CrossRef]
- Kazezyılmaz-Alhan, C.M.; Medina, M.A., Jr.; Richardson, C.J. A wetland hydrology and water quality model incorporating surface water/groundwater interactions. Water Resour. Res. 2007, 43. [Google Scholar] [CrossRef]
- Aragones, D.G.; Sanchez-Ramos, D.; Calvo, G.F. SURFWET: A biokinetic model for surface flow constructed wetlands. Sci. Total Environ. 2020, 723, 137650. [Google Scholar] [CrossRef]
- Arheimer, B.; Wittgren, H.B. Modelling nitrogen removal in potential wetlands at the catchment scale. Ecol. Eng. 2002, 19, 63–80. [Google Scholar] [CrossRef]
- Hattermann, F.F.; Krysanova, V.; Habeck, A.; Bronstert, A. Integrating wetlands and riparian zones in river basin modelling. Ecol. Model. 2006, 199, 379–392. [Google Scholar] [CrossRef]
- Arnold, J.G.; Srinivasan, R.; Muttiah, R.S.; Williams, J.R. Large area hydrologic modeling and assessment part 1: Model development. J. Am. Water Resour. Assoc. 1998, 34, 73–89. [Google Scholar] [CrossRef]
- Wu, K.; Johnston, C.A. Hydrologic comparison between a forested and a wetland/lake dominated watershed using SWAT. Hydrol. Process. 2008, 22, 1431–1442. [Google Scholar] [CrossRef]
- Wang, X.; Shang, S.; Qu, Z.; Liu, T.; Melesse, A.M.; Yang, W. Simulated wetland conservation-restoration effects on water quantity and quality at watershed scale. J. Environ. Manag. 2010, 91, 1511–1525. [Google Scholar] [CrossRef]
- Yang, W.; Wang, X.; Liu, Y.; Gabor, S.; Boychuk, L.; Badiou, P. Simulated environmental effects of wetland restoration scenarios in a typical Canadian prairie watershed. Wetl. Ecol. Manag. 2010, 18, 269–279. [Google Scholar] [CrossRef]
- Hoang, L.; van Griensven, A.; Mynett, A. Enhancing the SWAT model for simulating denitrification in riparian zones at the river basin scale. Environ. Model. Softw. 2017, 93, 163–179. [Google Scholar] [CrossRef]
- Lee, S.; Yeo, I.Y.; Lang, M.W.; McCarty, G.W.; Sadeghi, A.M.; Sharifi, A.; Jin, H.; Liu, Y. Improving the catchment scale wetland modeling using remotely sensed data. Environ. Model. Softw. 2019, 122, 104069. [Google Scholar] [CrossRef]
- Bauwe, A.; Eckhardt, K.-U.; Lennartz, B. Potential of constructed wetlands to reduce nitrate pollution in agricultural catchments. Ecol. Eng. 2022, 178, 106597. [Google Scholar] [CrossRef]
- Babbar-Sebens, M.; Barr, R.C.; Tedesco, L.P.; Anderson, M. Spatial identification and optimization of upland wetlands in agricultural watersheds. Ecol. Eng. 2013, 52, 130–142. [Google Scholar] [CrossRef]
- Comín, F.A.; Sorando, R.; Darwiche-Criado, N.; García, M.; Masip, A. A protocol to prioritize wetland restoration and creation for water quality improvement in agricultural watersheds. Ecol. Eng. 2014, 66, 10–18. [Google Scholar] [CrossRef]
- Neitsch, S.L.; Arnold, J.G.; Kiniry, J.R.; Williams, J.R. Soil and Water Assessment Tool Theoretical Documentation Version 2009; Texas Water Resources Institute: College Station, TX, USA, 2011.
- Ikenberry, C.D.; Crumpton, W.G.; Arnold, J.G.; Soupir, M.L.; Gassman, P.W. Evaluation of existing and modified wetland equations in the SWAT model. JAWRA J. Am. Water Resour. Assoc. 2017, 53, 1267–1280. [Google Scholar] [CrossRef]
- Kadlec, R.H. Constructed Marshes for Nitrate Removal. Crit. Rev. Environ. Sci. Technol. 2012, 42, 934–1005. [Google Scholar] [CrossRef]
- APHA. Standard Methods for the Examination of Water and Wastewater, 22nd ed.; American Public Health Association; American Water Works Association and Water Environment Federation: Washington, DC, USA, 2012. [Google Scholar]
- Uuemaa, E.; Palliser, C.C.; Hughes, A.O.; Tanner, C.C. Effectiveness of a natural headwater wetland for reducing agricultural nitrogen loads. Water 2018, 10, 287. [Google Scholar] [CrossRef]
- Gassman, P.W.; Arnold, J.G.; Srinivasan, R.; Reyes, M. The worldwide use of the SWAT model: Technological driver, networking impacts, and simulation trends. In Proceedings of the 21st Century Watershed Technology: Improving Water Quality and Environment 2010, Guacimo, Costa Rica, 21–24 February 2010. [Google Scholar]
- Gassman, P.W.; Reyes, M.R.; Green, C.H.; Arnold, J.G. The Soil and Water Assessment Tool: Historical development, applications, and future research directions. Trans. ASABE 2007, 50, 1211–1250. [Google Scholar] [CrossRef]
- Douglas-Mankin, K.R.; Srinivansan, R.; Arnold, J.G. Soil and Water Assessment Tool (SWAT) model: Current developments and applications. Trans. ASABE 2010, 53, 1423–1431. [Google Scholar] [CrossRef]
- Tuppad, P.; Douglas-Mankin, K.R.; Lee, T.; Srinivansan, R.; Arnold, J.G. Soil and Water Assessment Tool (SWAT) hydrologic/water quality model: Extended capability and wider adoption. Trans. ASABE 2011, 54, 1677–1684. [Google Scholar] [CrossRef]
- Lilburne, L.R.; Hewitt, A.E.; Webb, T.W. Soil and informatics science combine to develop S-map: A new generation soil information system for New Zealand. Geoderma 2012, 170, 232–238. [Google Scholar] [CrossRef]
- Parfitt, R.L.; Stevenson, B.A.; Dymond, J.R.; Schipper, L.A.; Baisden, W.T.; Ballantine, D.J. Nitrogen inputs and outputs for New Zealand from 1990 to 2010 at national and regional scales. New Zealand J. Agric. Res. 2012, 55, 241–262. [Google Scholar] [CrossRef]
- Vanderholm, D.H. Agricultural Waste Manual; NZAEI, Lincoln College: Cantebury, New Zealand, 1984. [Google Scholar]
- Brauer, N.; Maynard, J.J.; Dahlgren, R.A.; O’Geen, A.T. Fate of nitrate in seepage from a restored wetland receiving agricultural tailwater. Ecol. Eng. 2015, 81, 207–217. [Google Scholar] [CrossRef]
- Gordon, B.A.; Lenhart, C.; Peterson, H.; Gamble, J.; Nieber, J.; Current, D.; Brenke, A. Reduction of nutrient loads from agricultural subsurface drainage water in a small, edge-of-field constructed treatment wetland. Ecol. Eng. 2021, 160, 106128. [Google Scholar] [CrossRef]
- Larson, A.C.; Gentry, L.E.; David, M.B.; Cooke, R.A.; Kovacic, D.A. The role of seepage in constructed wetlands receiving agricultural tile drainage. Ecol. Eng. 2000, 15, 91–104. [Google Scholar] [CrossRef]
- Nash, J.E.; Sutcliffe, J.V. River flow forecasting through conceptual models part I—A discussion of principles. J. Hydrol. 1970, 10, 282–290. [Google Scholar] [CrossRef]
- Moriasi, D.N.; Gitau, M.W.; Pai, N.; Daggupati, P. Hydrologic and Water Quality Models: Performance Measures and Evaluation Criteria. Trans. ASABE 2015, 58, 1763–1785. [Google Scholar] [CrossRef]
- Waikato Regional Council. Drought in the Waikato. Available online: https://www.waikatoregion.govt.nz/services/regional-hazards-and-emergency-management/drought/ (accessed on 8 March 2023).
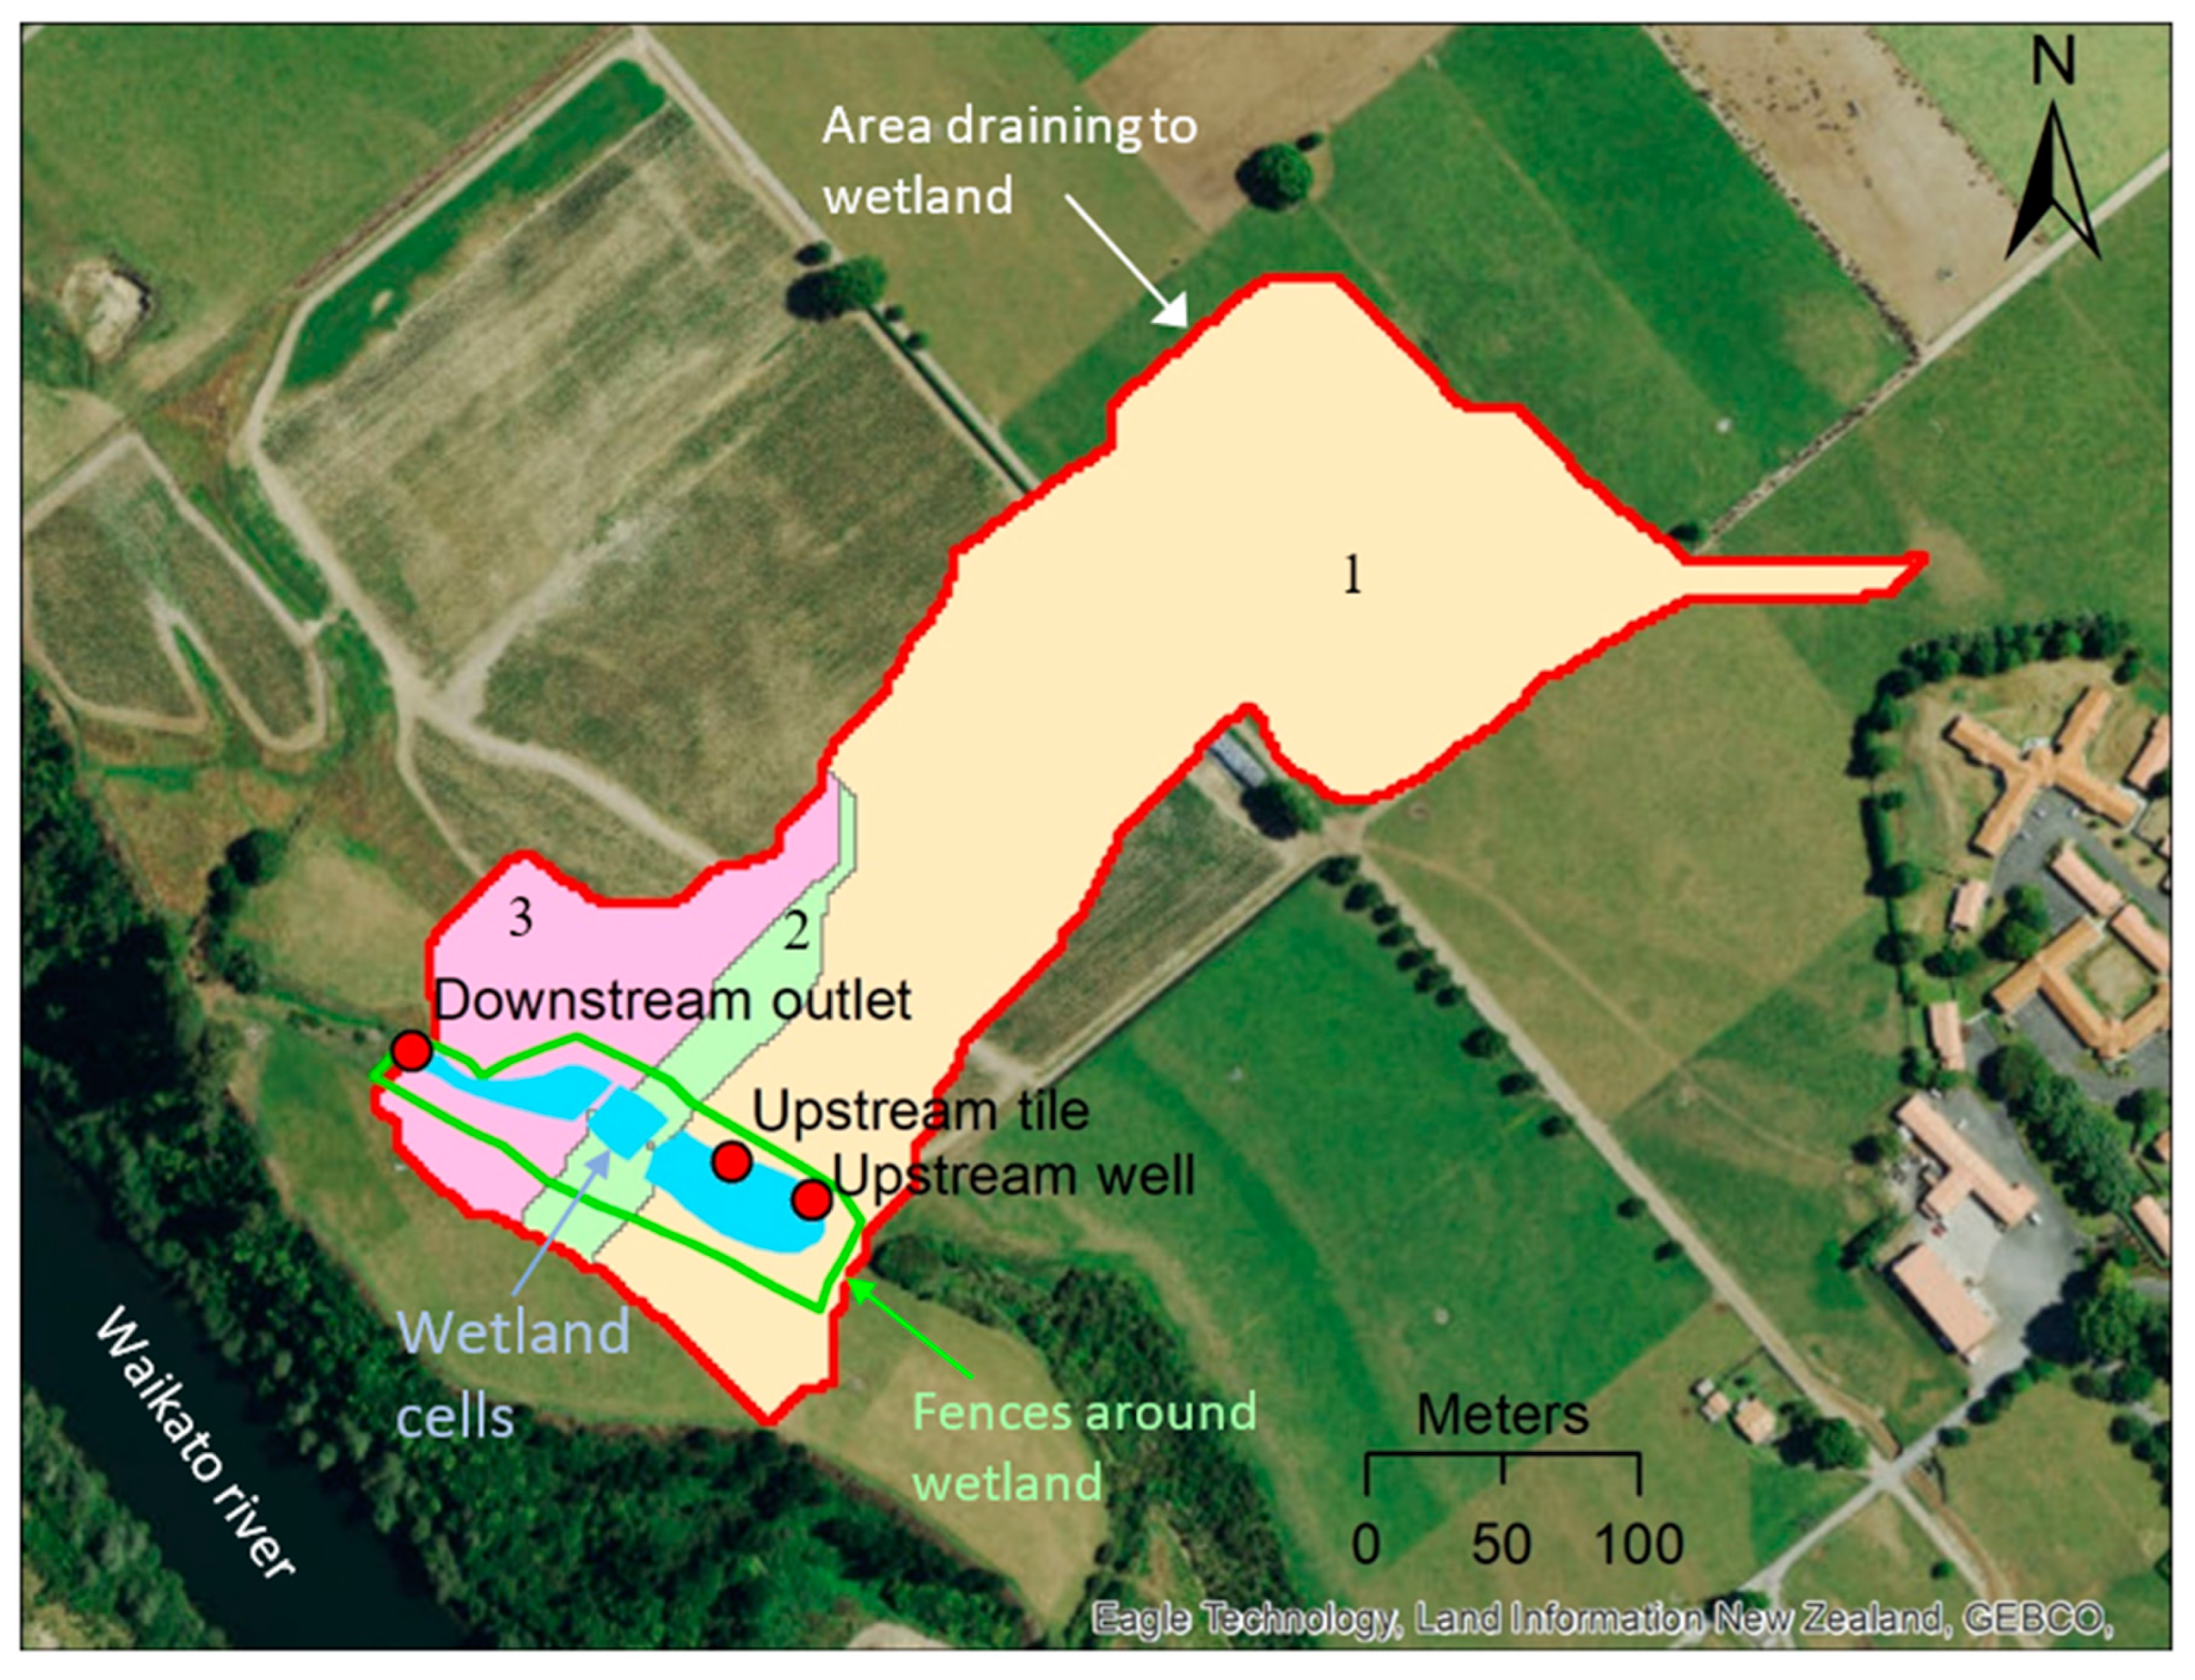







| Wetland Cell | Wetland Area (m2) | Average Depth (m) | Volume of Tanks (m3) | Catchment Area (ha) |
|---|---|---|---|---|
| Cell 1 | 1900 | 0.3 | 570 | 5.47 |
| Cell 2 | 450 | 0.3 | 135 | 0.44 |
| Cell 3 | 600 | 0.3 | 180 | 1.16 |
| Sum | 2950 | 885 | 7.07 |
| Type of Sampling | Number of Samples | Variables | ||
|---|---|---|---|---|
| Upstream Well | Upstream Tile | Downstream Outlet | ||
| Monthly grab sampling | 26 | 15 | 24 | NOx-N, NH4-N, TN |
| Event sampling | 3 events | 5 events | 6 events | NOx-N, NH4-N, TN |
| (65 samples) | (64 samples) | (126 samples) | ||
| High frequency | none | none | 2017–present, with some data gaps | Flow, NOx-N |
| Activity | Nutrient Sources | Estimating Method/Information Source | Nitrogen Input (kg N/ha/Year) |
|---|---|---|---|
| Grazing | Manure from dairy-cow grazing | Number of dairy cows/ha × amount of manure/cow × %N in manure Data from farm surveys and the agricultural waste manual [43] | 266 |
| Fertilizer application | Fertilizer application | Information from Owl Farm database | 133 |
| Application of dairy shed effluent to land | Information from Owl Farm database | 46 | |
| Atmospheric deposition | Dry deposition | Parfitt et al. [42] reported 5–10 kg N/ha | 7.5 (50% NH4-N, 50% NOx-N) |
| Wet deposition | Parfitt et al. [42] | 1.5 (50% NH4-N, 50% NOx-N) |
| Name | Unit | Definition | Range | Calibrated Value |
|---|---|---|---|---|
| Hydrology | ||||
| SWAT parameters | ||||
| CN2 | - | SCS runoff curve number for moisture condition II | −0.25–0.25 * | −0.24 |
| ALPHA_BF | day−1 | Base flow recession constant | 0–1 | 0.99 |
| ESCO | - | Soil evaporation compensation factor | 0–1 | 0.109 |
| EPCO | - | Plant water uptake compensation factor | 0–1 | 0.663 |
| SOL_AWC | mm/mm | Available water capacity of the soil layers | −0.25–0.25 * | 0.057 * |
| SOL_Z | mm | Depth from soil surface to bottom of the soil layer | −0.25–0.25 | 0.061 * |
| SOL_K | mm/h | Saturated hydraulic conductivity | −0.25–0.25 | 0.19 * |
| SURLAG | hours | Surface runoff lag time | 0–24 | 19.450 |
| TDRAIN | hours | Time to drain soil to field capacity | 12–48 | 31.273 |
| GDRAIN | hours | Drain tile lag time | 12–48 | 22.317 |
| Wetland model parameters | ||||
| ETcoeff | - | Evaporation coefficient | 0–1 | 0.832 |
| Nitrogen simulation | ||||
| SWAT parameters | ||||
| RSDCO | mm | Residue decomposition coefficient | 0.02–0.1 | 0.054 |
| NPERCO | - | Nitrate percolation coefficient | 0–1 | 0.382 |
| N_UPDIS | - | Nitrogen uptake distribution parameter | 0–100 | 45.915 |
| SDNCO | - | Denitrification threshold water content | 1–1.2 | 1.1 |
| CDN | - | Denitrification exponential rate coefficient | 1–2 | 1.723 |
| SHALLST_N | mgN/L | Initial concentration of nitrate in shallow aquifer | 6.5–15 | 13.658 |
| FIXCO | Nitrogen fixation coefficient | 0–1 | 0.097 | |
| Wetland model parameters | ||||
| kN,20 | m/day | Nitrogen removal rate at water temperature at 20 °C | 0.05–0.5 | 0.055 |
| Ɵ | - | Temperature coefficient | 1–2 | 1.012 |
| Water Balance Components | 2017–2018 | 2018–2019 | 2019–2020 | Annual Average | |
|---|---|---|---|---|---|
| mm/Year | mm/Year | mm/Year | Water Depth (mm/Year) | Percentage of Flow Components (%) | |
| Precipitation | 1295 | 979 | 718 | 997 | |
| Evapotranspiration | 709 | 704 | 576 | 663 | |
| Surface runoff | 24 | 3 | 0.1 | 9 | 2.7 |
| Tile flow | 136 | 78 | 35 | 83 | 24.9 |
| Groundwater | 426 | 220 | 80 | 242 | 72.4 |
| Nitrogen Loss to the Wetland (kg N/ha/Year) | 2017–2018 | 2018–2019 | 2019–2020 | Annual Average |
|---|---|---|---|---|
| Organic N loss by erosion | 6.5 | 2.6 | 0.9 | 3.3 |
| Nitrate-N loss to the wetland | 45.6 | 26.7 | 9.7 | 27.3 |
| 0.3 | 0.1 | 0.02 | 0.14 (0.3%) * |
| 5.2 | 5.0 | 4.3 | 4.8 (17.6%) * |
| 40.1 | 21.6 | 5.4 | 22.4 (82.1%) * |
| Variables | 2017–2018 | 2018–2019 | 2019–2020 | Annual Average |
|---|---|---|---|---|
| Nitrate load entering the wetland (kg/year) | 310.8 | 182.2 | 67.2 | 186.7 |
| 309.5 | 180.9 | 65.8 | 185.4 |
| 1.3 | 1.3 | 1.4 | 1.3 |
| Nitrate load at wetland outlet (kg/year) | 134.0 | 62.0 | 11.1 | 69.0 |
| Nitrate loss through infiltration to the bottom of the wetland (kg/year) | 6.9 | 4.7 | 1.9 | 4.5 |
| Nitrate removed in the wetland (kg/year) | 169.9 | 115.5 | 54.2 | 113.2 |
| Annually nitrate load removal rate (%) | 54.7 | 63.4 | 80.4 | 60.6 |
Disclaimer/Publisher’s Note: The statements, opinions and data contained in all publications are solely those of the individual author(s) and contributor(s) and not of MDPI and/or the editor(s). MDPI and/or the editor(s) disclaim responsibility for any injury to people or property resulting from any ideas, methods, instructions or products referred to in the content. |
© 2023 by the authors. Licensee MDPI, Basel, Switzerland. This article is an open access article distributed under the terms and conditions of the Creative Commons Attribution (CC BY) license (https://creativecommons.org/licenses/by/4.0/).
Share and Cite
Hoang, L.; Sukias, J.P.S.; Montemezzani, V.; Tanner, C.C. Quantifying the Nitrogen-Removal Performance of a Constructed Wetland Dominated by Diffuse Agricultural Groundwater Inflows Using a Linked Catchment–Wetland Model. Water 2023, 15, 1689. https://doi.org/10.3390/w15091689
Hoang L, Sukias JPS, Montemezzani V, Tanner CC. Quantifying the Nitrogen-Removal Performance of a Constructed Wetland Dominated by Diffuse Agricultural Groundwater Inflows Using a Linked Catchment–Wetland Model. Water. 2023; 15(9):1689. https://doi.org/10.3390/w15091689
Chicago/Turabian StyleHoang, Linh, James P. S. Sukias, Valerio Montemezzani, and Chris C. Tanner. 2023. "Quantifying the Nitrogen-Removal Performance of a Constructed Wetland Dominated by Diffuse Agricultural Groundwater Inflows Using a Linked Catchment–Wetland Model" Water 15, no. 9: 1689. https://doi.org/10.3390/w15091689
APA StyleHoang, L., Sukias, J. P. S., Montemezzani, V., & Tanner, C. C. (2023). Quantifying the Nitrogen-Removal Performance of a Constructed Wetland Dominated by Diffuse Agricultural Groundwater Inflows Using a Linked Catchment–Wetland Model. Water, 15(9), 1689. https://doi.org/10.3390/w15091689


