1. Introduction
The Italian Alps are historically regarded as Europe’s water tower, hosting in their glaciers, snowfields, and aquifers the majority of freshwater feeding major European water streams such as the Danube, Rhine, Po, and Rhone rivers [
1]. Despite not being traditionally threatened by persistent drought due to its continental climate and high altitude, the Alpine region has been declared at drought risk for more than a decade [
2] as a consequence of the current trends of changing climate and of the reduction of its water resources [
3,
4], as well as of the projected increases in competing water uses that are to be expected in the future [
5,
6,
7].
The projected trends in precipitation for the next century foresee a substantial decrease over the Alpine region, accompanied by a stronger reduction in the frequency and intensity of rainfall events during the summer season and a simultaneous increase in extreme events concentrated during cold seasons [
8]. The average temperature in the Alpine region increased by about 2 °C during the 20th century, at a rate which is about two times higher than the Northern Hemisphere average [
9]; moreover, an average warming of 0.25 °C per decade is expected over the Alps for the first half of the 21st century, a rate that is projected to increase to 0.36 °C per decade during the second half of the century [
10]. A possible explanation for this faster-increasing trend is to be found in the snow-albedo feedback as indicated by the recent works of Pepin and Lundquist [
11], Scherrer et al. [
12], Notarnicola [
13]. In this respect, the projected combination of meteorological changes toward a dryer, hotter, and more extreme climate threatens the onset of worsening drought conditions in the Alpine region [
14].
Droughts, which can be defined as extended periods of time characterized by below-average water availability, can be further broken down into consequential events that usually take place in a chronological order: First, decreased rainfall causes the so-called meteorological drought. In combination with high temperatures, this results in increased evapotranspiration and decreased soil moisture availability, known as agricultural drought. Finally, the effect of anthropogenic stressors (e.g., industrial and household water usage, seasonal water storage, irrigation, etc.) on water reserves such as lakes and aquifers might result in decreased streamflow, often referred to as hydrological drought [
15]. Notably, freshwater availability is crucial in several sectors related to the social–economical–ecological nexus of the Alpine communities and environment, such as agriculture [
16,
17], biodiversity [
18], winter tourism [
19], and hydropower generation [
20,
21,
22]; in turn, this has led to increasing scientific and institutional interest in drought monitoring and prediction, often leading to the development of a variety of indexes, predictive tools, and early warning systems (see, e.g., [
23,
24,
25], etc.).
Meteorological droughts over the Alps showed a shift towards prolonged events over the last two centuries [
26] and are predicted to increase during the 21st century due to climate change [
27], although it was suggested that the strength of a given drought signal strongly depends on the considered index [
28] and that the use of different indexes might even lead to conflicting results [
29]. Furthermore, droughts are complex phenomena, caused by a combination of events and pre-existing hydro-meteorological conditions, rendering the possibility to validate the use of any drought indexes or to set up warning systems based exclusively on observed data a very challenging task, especially in the case of large spatial domains [
30]. A first attempt at compiling a systematic inventory of recorded drought events and climate evolution was recently made by an international consortium (ADO, ref. [
31]).
Noticeably, the reliable identification of present and future drought conditions in the Alpine region carries several peculiarities that must be faced with adequate tools. First, Alpine catchments are characterized by complex orography: to adequately cope with this, the adopted climate models should be highly resolved in space and time and convective permitting (i.e., that explicitly accounts for variations in precipitation due to altitude) (see [
32]), involving high computational costs. To the same end, detailed precipitation and evapotranspiration observational datasets should be made available in order to reliably validate or bias-correct the chosen climate models.
Managers and policymakers are often interested in hydrological and agricultural drought modelling, which must include a thorough assessment of the potential stress on a catchment’s water resources exerted by different and often competing water uses. In this context, predictive drought modeling should explicitly consider the relevant processes and characteristics of the domain [
33] and should quantitatively assess the interactions occurring between the study area in its natural conditions and the main alteration due to anthropogenic water uses (see, e.g., [
34,
35]). Furthermore, it should be taken into account that different systems (e.g., agriculture, ecosystem, hydrology, etc.) respond to drought conditions at different timescales [
36], which are in turn influenced by case-specific land use and resource management [
37]. Considering the huge number of uncertainty factors revolving around drought prediction together with the related costs (e.g., computational demand, efforts for data collection, impact evaluation, etc.), it comes as no surprise that statistical indexes are the most widely used approach to investigate such complex phenomena. The Standardized Precipitation Index (ref. [
38], SPI) and Standardized Precipitation Evapotranspiration Index (ref. [
39], SPEI) are indeed the most widely used statistical indexes for large-scale drought assessment. Such indexes have been adopted in several regions to evaluate drought conditions during both historical (see, e.g., [
40,
41]) and future time periods (see, e.g., [
14,
27,
42,
43]). Notably, the mutual relationship between meteorological and hydrological drought indicators has catalyzed increasing attention in the last years (see, e.g., [
44,
45,
46,
47]), acknowledging the existence of multiple interplaying factors that should be considered in drought assessment.
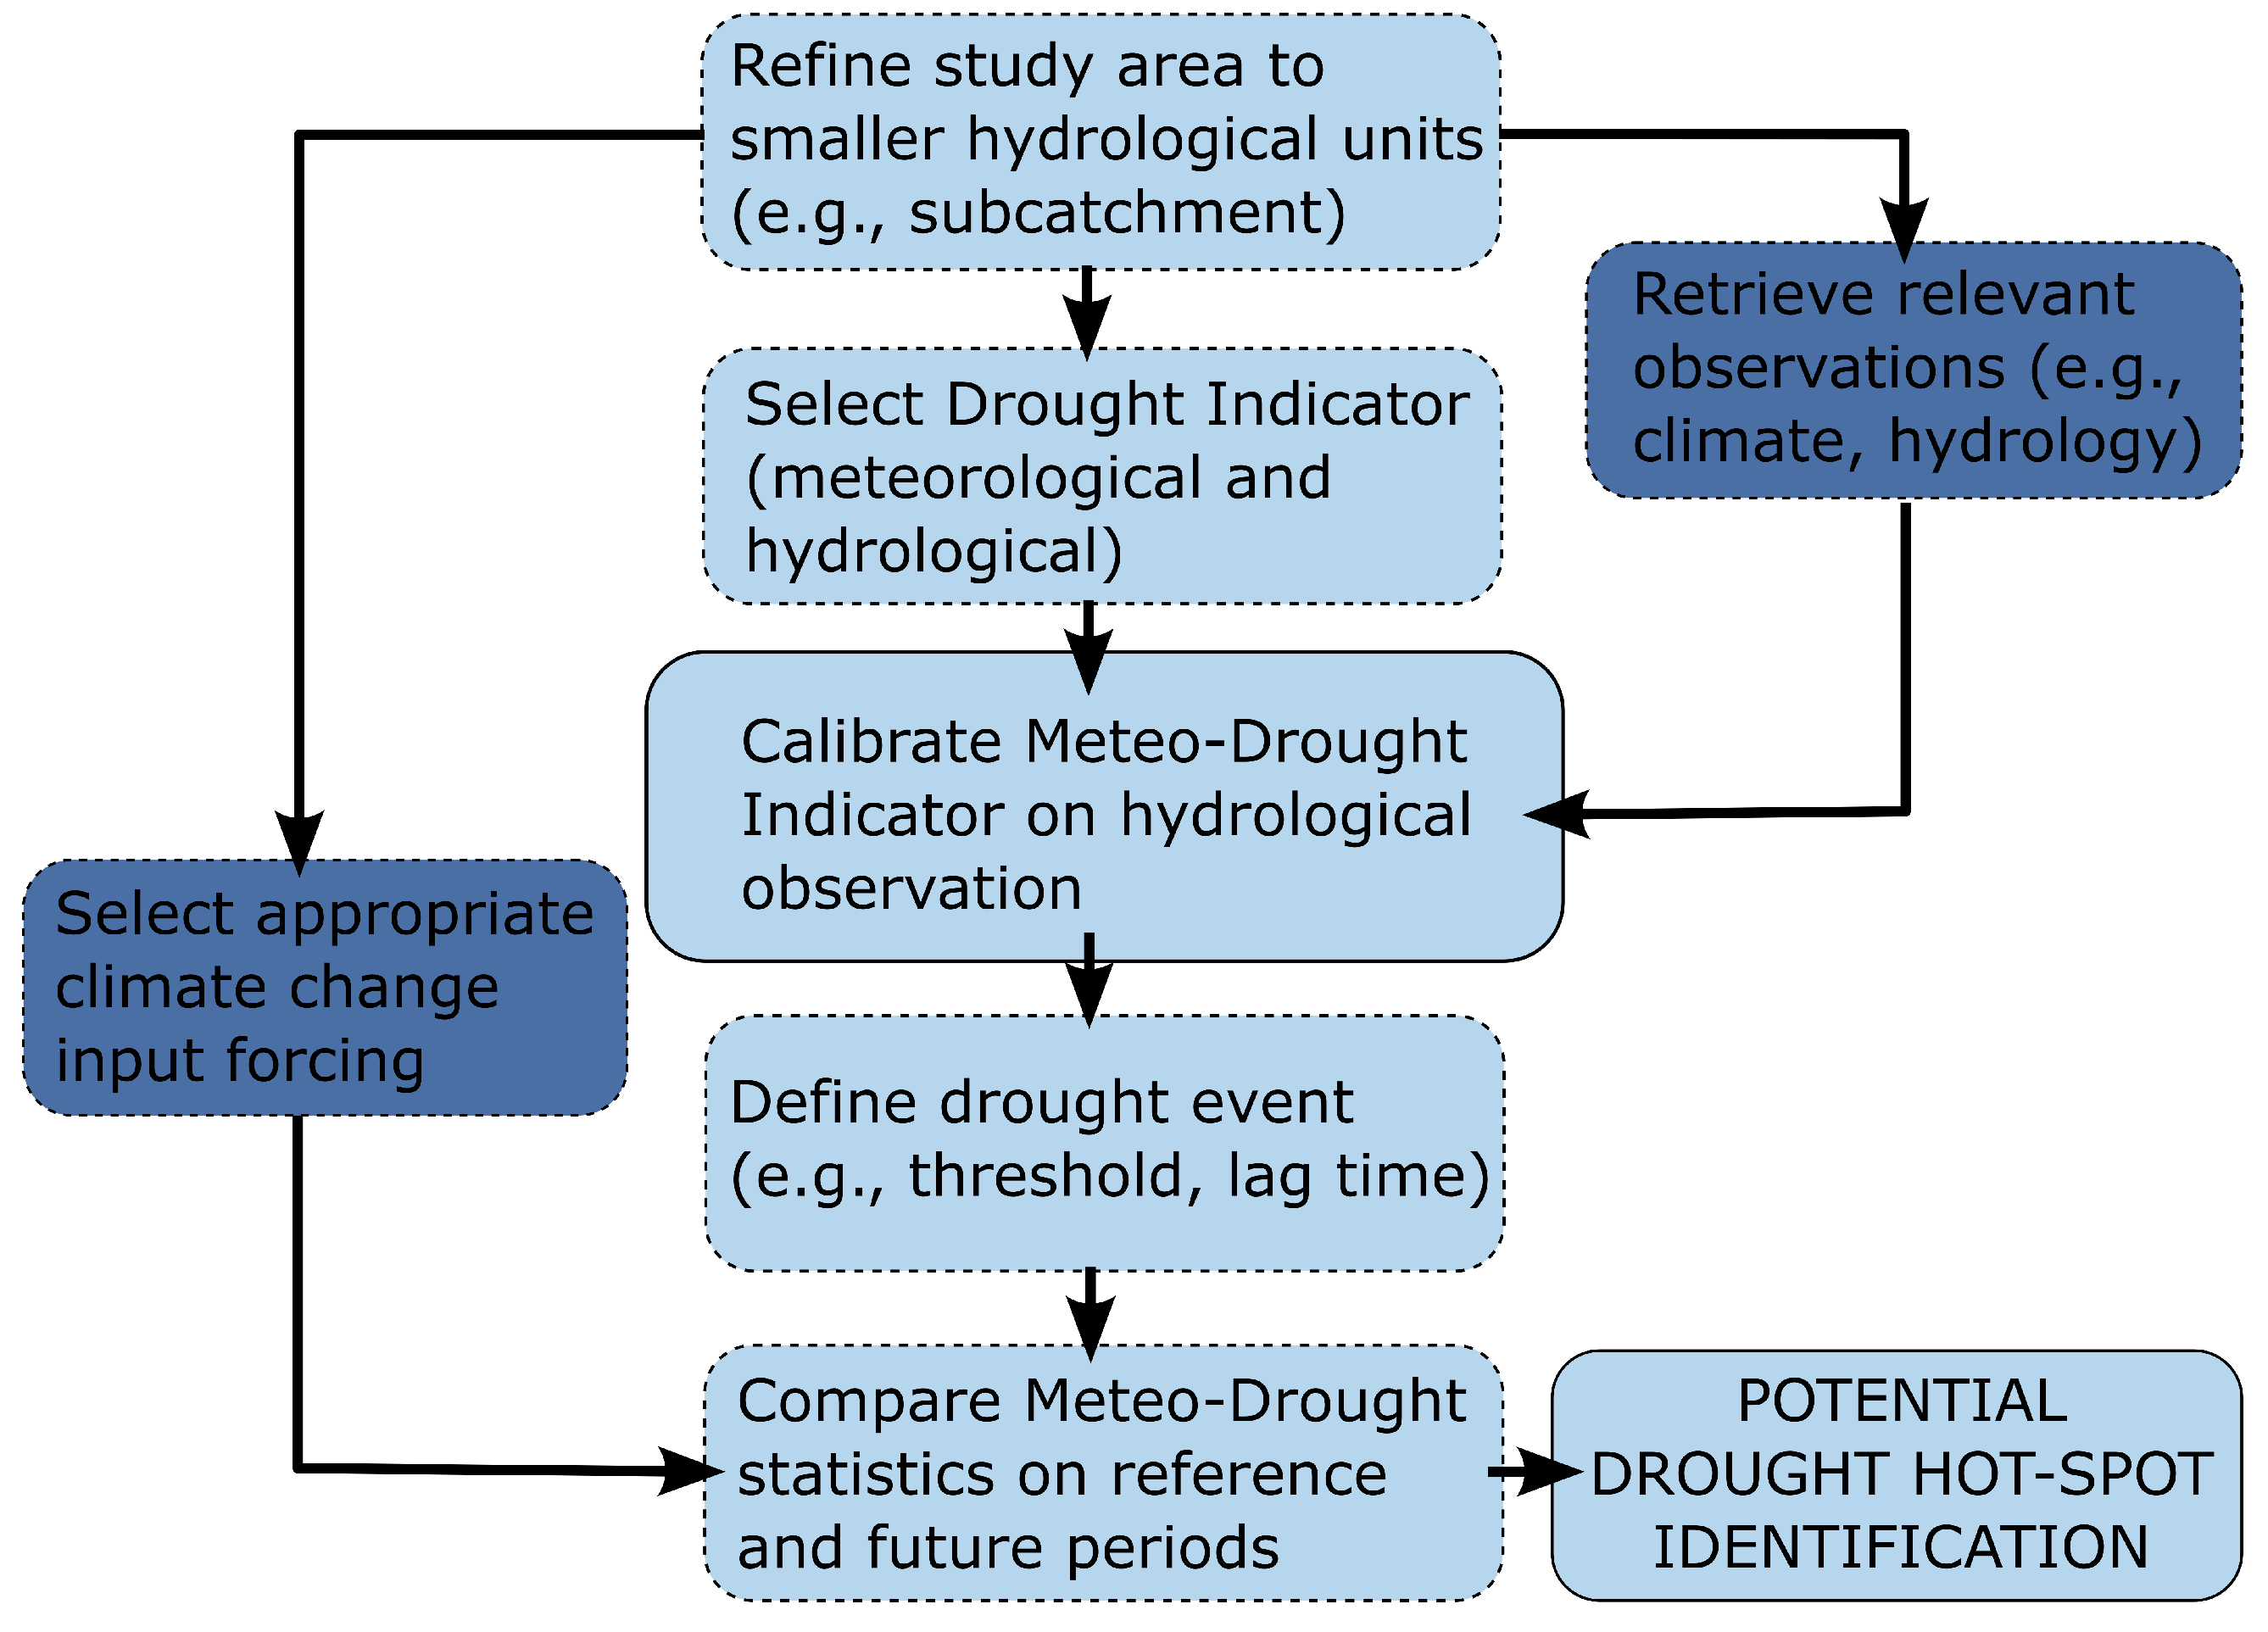
To partially overcome the aforementioned challenges associated with a thorough drought assessment, we propose a reliable, yet parsimonious approach that is suitable for identifying potential drought hot-spots in the context of climate change, leveraging rainfall and streamflow observations for a reference historical period and climatic projections for the future period. The identification of the areas at drought risk by means of this preliminary screening will allow for a more focused investigation and efficient allocation of the available resources. Being parsimonious, the methodology is ideal for screening large domains before resorting to more detailed procedures and tools for the climatological, hydrological, and data collection analysis. We show an application of the developed methodology to the Adige catchment, whose sub-catchments can be considered representative of the hydro-climatological conditions observed in several Alpine watersheds.
This paper is organized as follows: in
Section 2 and
Section 3 we present the study area and the data used in our approach, respectively;
Section 4 provides an overview of the adopted methodology.
Section 5 showcases the results of our investigation, while in
Section 6 we discuss our methodology and provide some considerations on its applicability in different contexts. Finally, in
Section 7 we draw the final conclusions.
2. Study Area
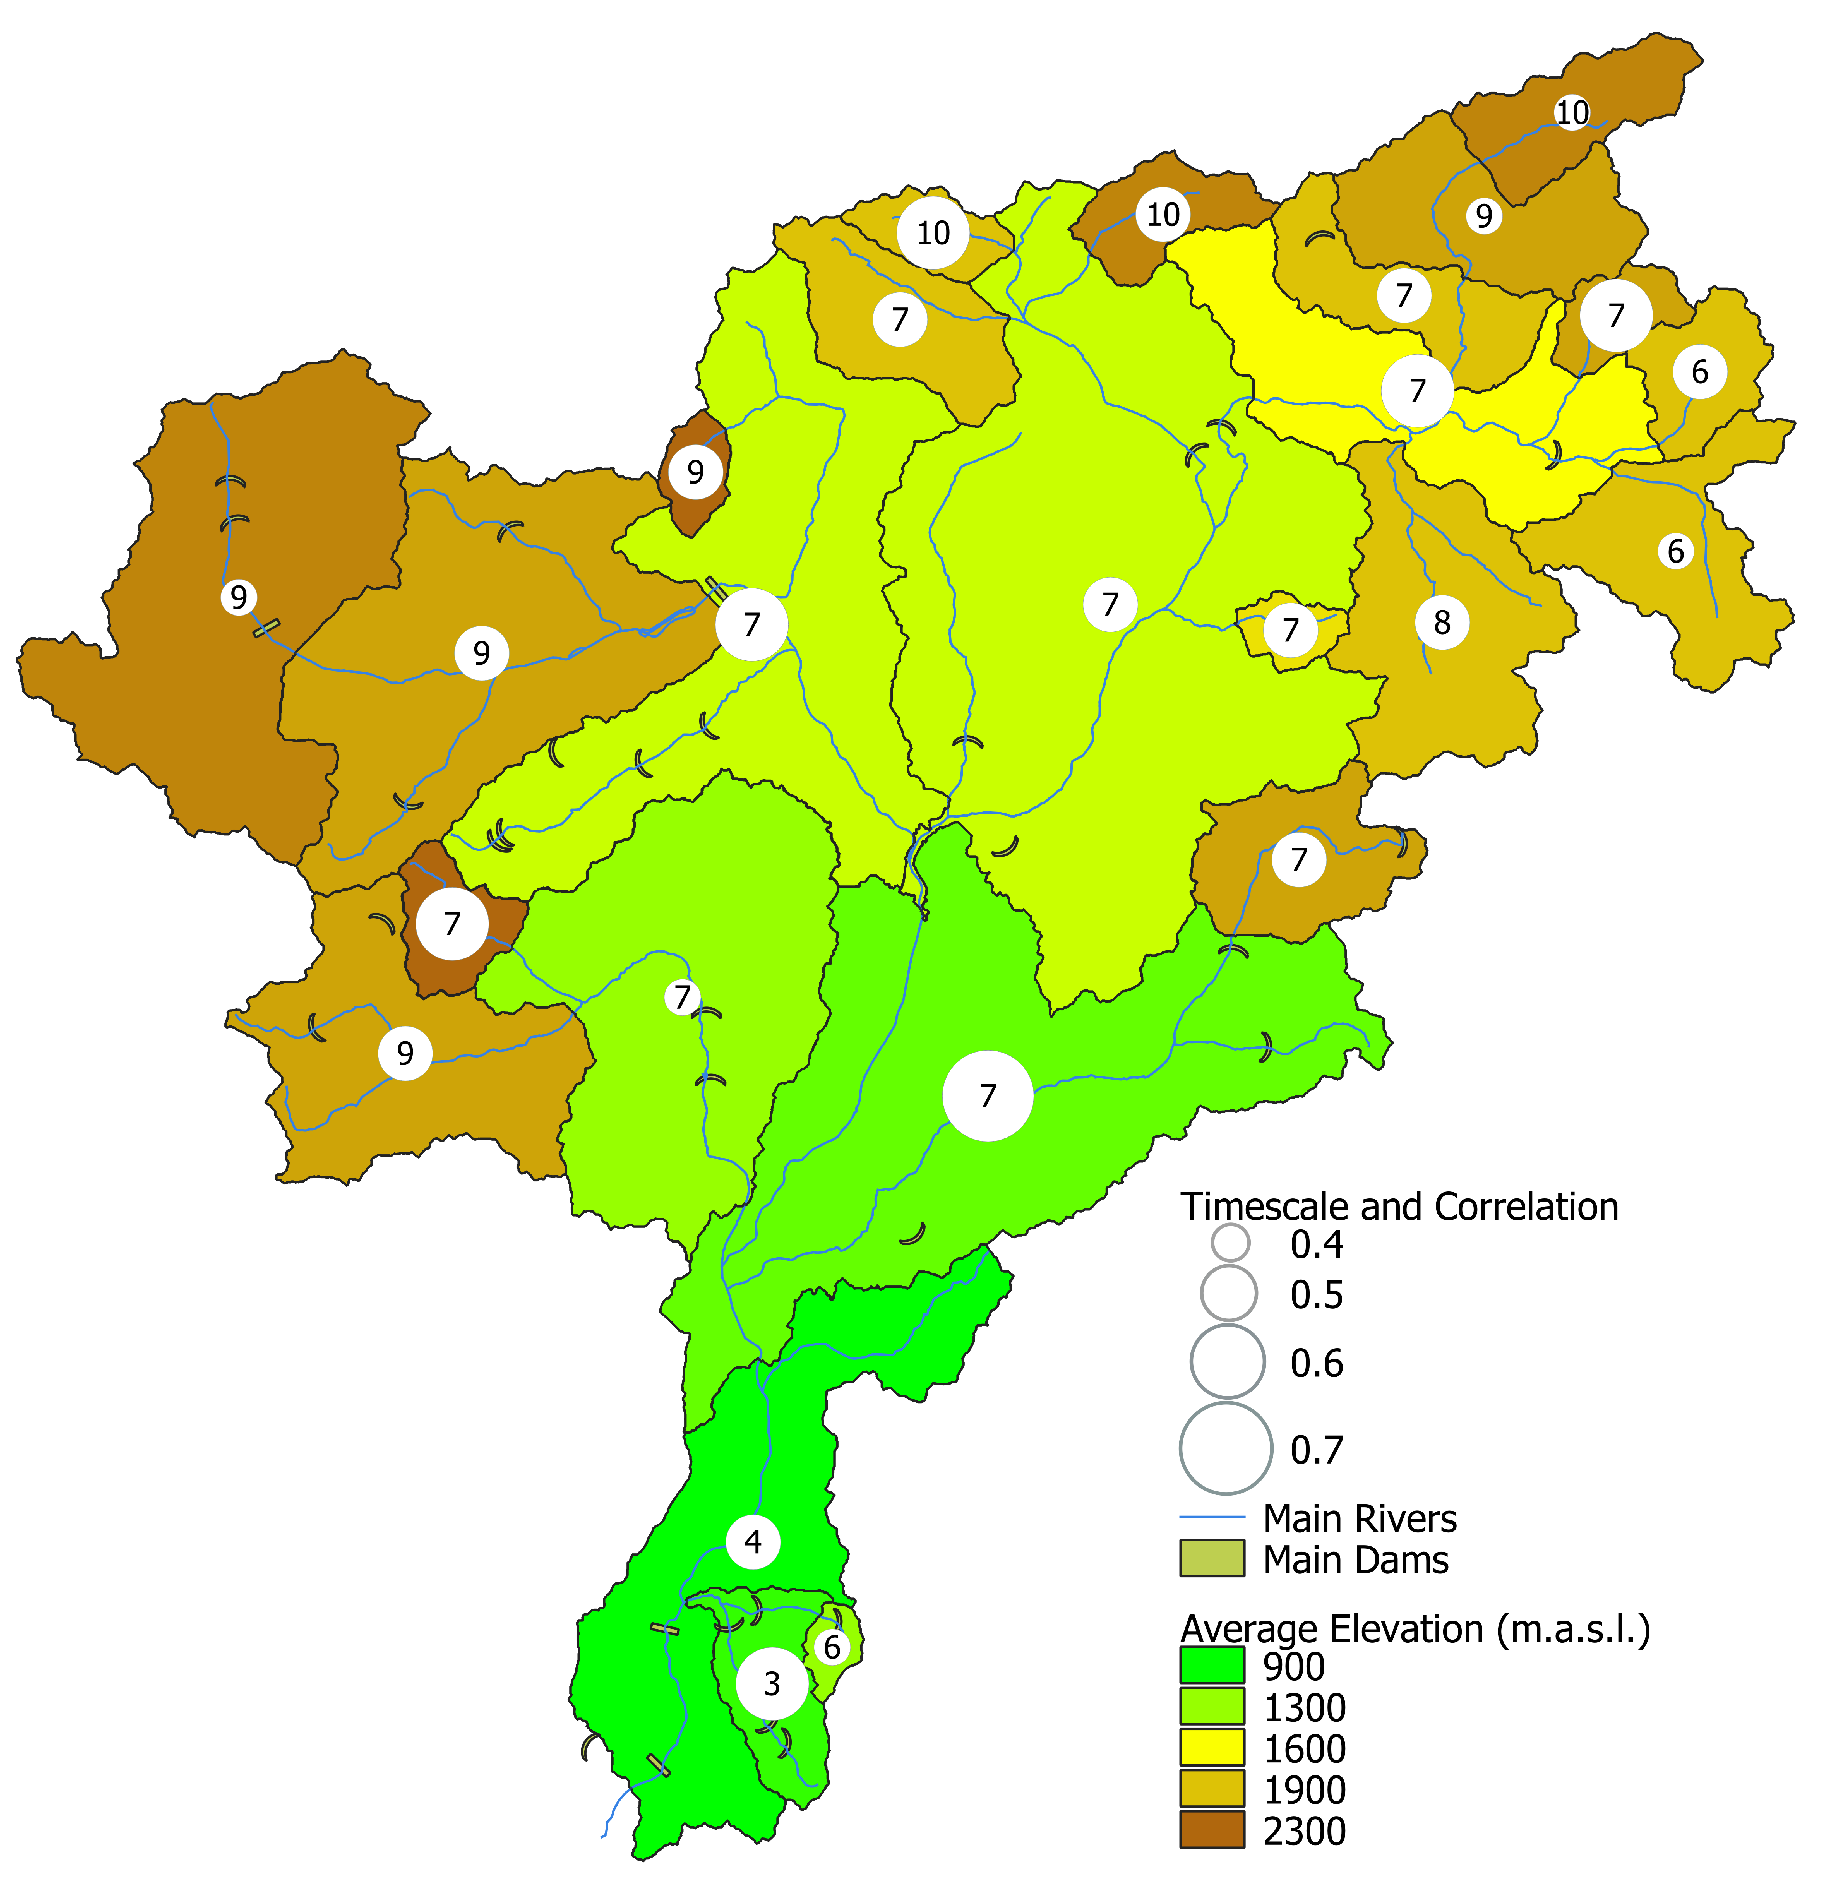
This work focuses on the Adige catchment closed at the Vó Destro gauging station (identified by code IDRTN27 in
Figure 1), with a total drainage area of 10,500 km
2. The catchment is located in the eastern portion of the Italian Alps (see
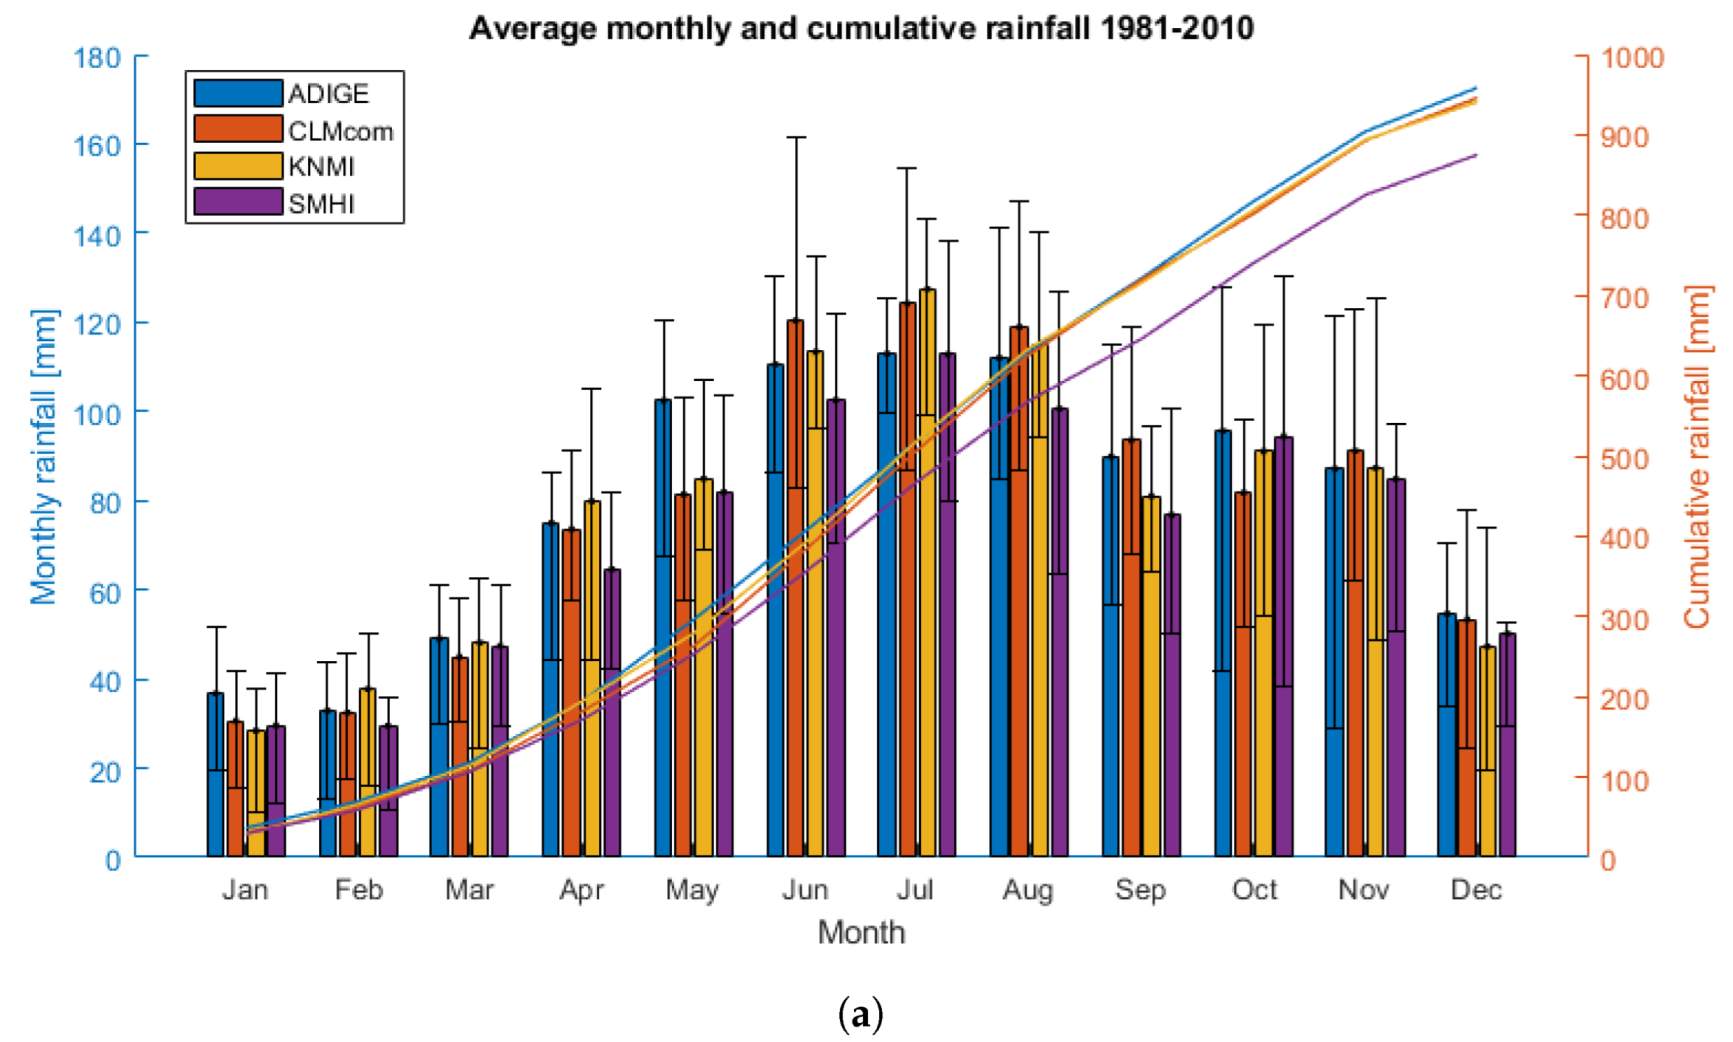
Figure 1) and is characterized by a complex topography, with mountainous areas reaching over 3800 m in altitude and downstream valleys around 200 m.a.s.l. Due to its morphology, precipitation is unevenly distributed within the catchment. Lower precipitation is typically observed in the highly elevated north-western part of the catchment (known as Val Venosta), averaging 600 mm/year, whereas an average precipitation of 1600 mm/year is observed at lower altitudes, especially in the southern part of the catchment; mean temperatures range from a minimum of −4 °C in January to a maximum of 14 °C in July, with a strong seasonal variability mainly related to the altitude [
48,
49]. Streamflows along the Adige’s main stem reach their minimum in winter when a large share of the precipitation is stored as snow; high flows are typically observed in early summer mainly due to snowmelt and then later in autumn due to cyclonic storms [
49]; tributaries located in the north-western part of the catchment (which has the highest average altitude) exhibit a typically glacio-nival streamflow regime, with low flows in winter and high flows in summer due to ice- and snowmelt. Finally, the north-eastern headwaters show an intermediate behavior, defined as nivo-pluvial, where earlier peak flows occur in late spring and relatively high flows are observed in autumn [
50]. The entire Adige catchment is strongly regulated by a number of reservoirs and diversion channels that exploit freshwaters for hydropower production [
51,
52,
53], exerting a strong control on downstream flow regimes.
Table 1 summarizes some properties of the sub-catchments analyzed in the present work: the cumulative effective storage (
) present within each sub-catchment, the average streamflow (
) for each sub-catchment, and the recharge coefficient
, computed as the ratio between the former and the latter [
51], which provides an estimate of the degree of regulation of each sub-catchment. Finally, the temporal coverage of monthly average streamflow time series is provided for each sub-catchment (
, which computation will be further detailed in the ensuing
Section 3.3). The heterogeneous hydrological response to precipitation of the streams that are present within the Adige catchment is expected to increase as a consequence of the projected effects of climate change, thus making the Adige catchment a very interesting case for showcasing the proposed drought hot-spot screening methodology.
7. Conclusions
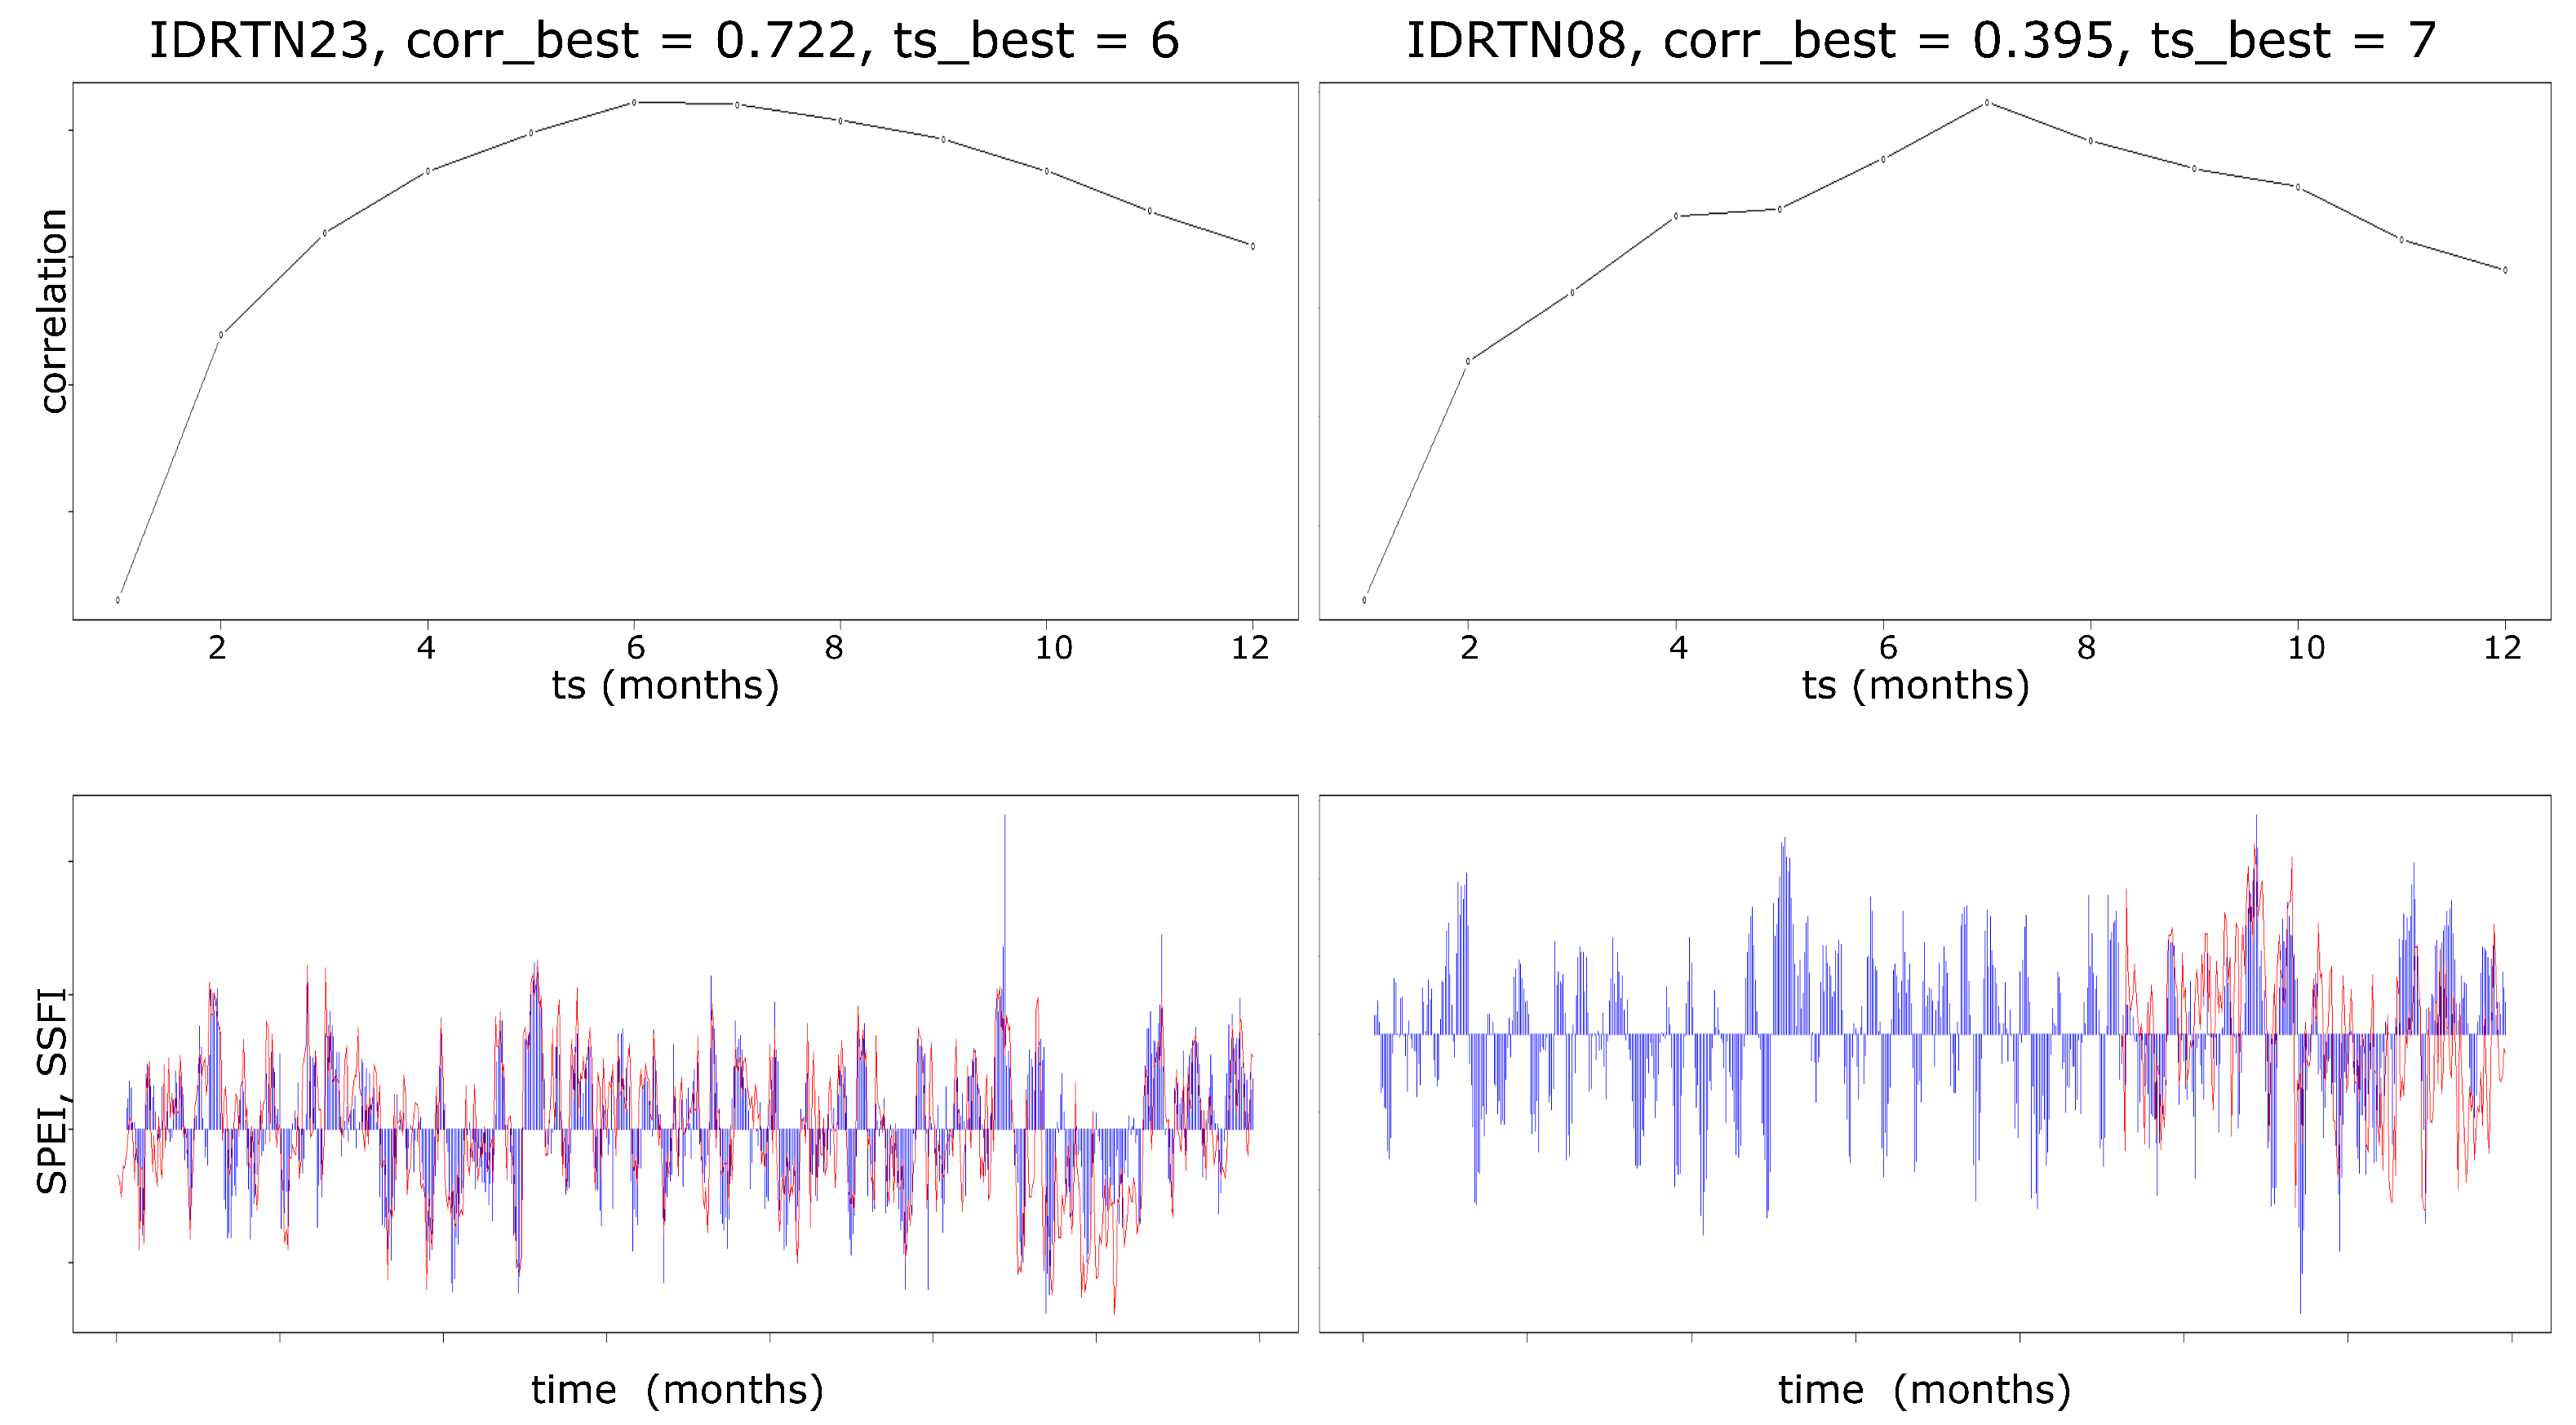
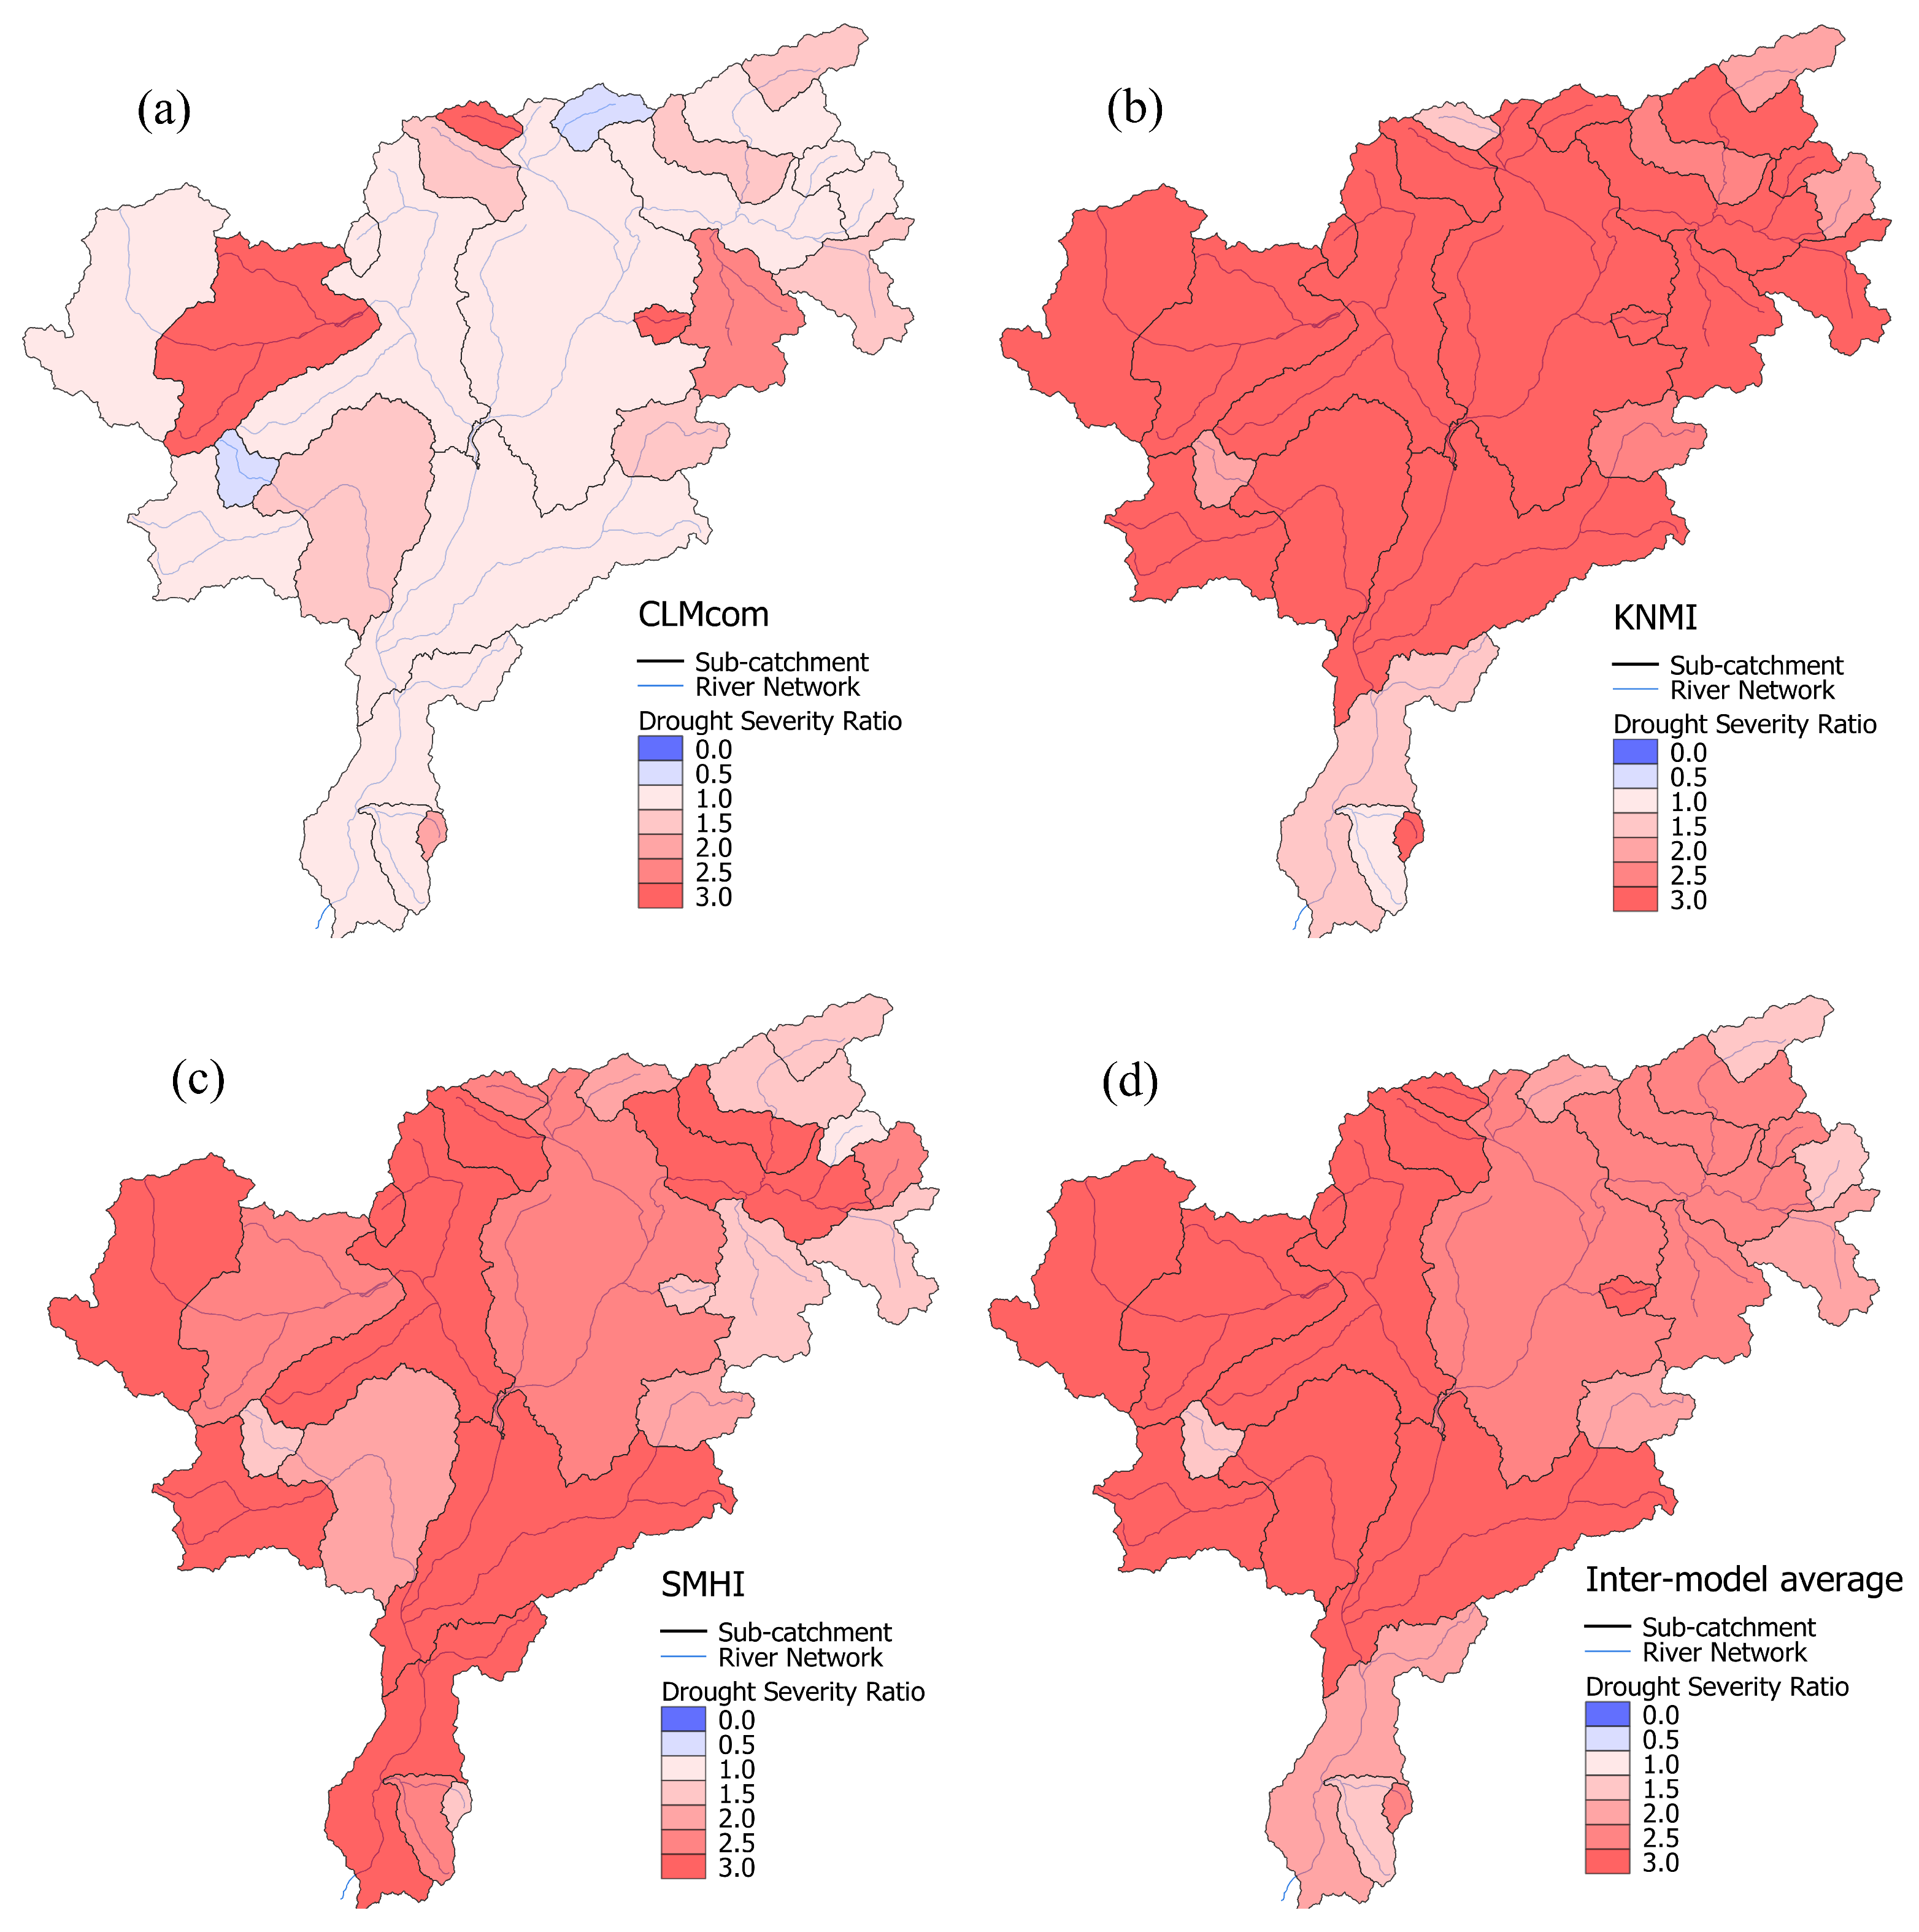
In this work we propose a framework to quickly and reliably determine potential future drought hot-spots. The methodology is based on a novel interpretation of the SPEI index that is linked to the hydrological response of a catchment. This is achieved by correlating SPEI computed at several timescales (1 to 12 months) with the hydrological drought index SSFI: the timescale producing the highest correlation between the SPEI and SSFI monthly series is herein defined as the characteristic timescale of the catchment. To exemplify our approach we selected a well-instrumented watershed in the Italian Alpine region, the Adige river basin. The study area was subdivided into 25 sub-catchments and characteristic timescales were computed for each of them based on available meteorological and streamflow observations in the 1956–2013 time window. The characteristic timescales were then used to compute SPEI time series over a reference (1981–2010) and future (2041–2070) time window for three different climate model simulations under the RCP 4.5 emission scenario. The drought event statistics in these two periods and their inter-model average were then compared, highlighting which sub-catchments are more likely to face worsening drought conditions in the context of climate change.
This study also provides interesting insights at the regional scale. The evolution of drought statistics in the study area predicts widespread drying trends with variable intensities, which is in accordance with the findings of similar investigations. The spatial distribution of the resulting characteristic timescales exhibits a complex, yet clear dependence on the catchments’ hydrological regimes and the degree of streamflow regulation (i.e., reservoir storage) of each catchment. The spatial variability of characteristic timescales is in line with the findings of previous hydrological regionalization studies: glacial and/or highly regulated catchments tend to have longer characteristic timescales, as water is stored either in the form of ice or in reservoirs, whereas when moving toward the valleys the characteristic timescales tend to decrease, as rainfall becomes the dominant driver of the hydrological response compared to seasonal storage capabilities. This result branches off from the canonical interpretation of SPEI, where certain hydrological processes are associated in a simplistic way to specific timescales. Here, the index is computed at a single timescale that is assumed to be the most representative of the aggregate response of a catchment, indirectly accounting for all the processes that link precipitation to streamflow, achieved by calibrating the SPEI against the observed data.
Provided that sufficient and reliable observations are available, the present framework can be adopted as a preliminary screening phase of every large-scale drought assessment in order to focus the computational effort of the analysis only where drought hot-spots are identified. It should be noted that the framework can (and should) be modified in order to better suit different study areas or to meet different modeling goals.


