Abstract
Large-scale particle image velocimetry (LSPIV) is a computer vision-based technique renowned for its precise and efficient measurement of river surface velocity. However, a crucial prerequisite for utilizing LSPIV involves camera calibration. Conventional techniques rely on ground control points, thus restricting their scope of application. This study introduced a near-field remote-sensing measurement system based on LSPIV, capable of accurately measuring river surface velocity sans reliance on ground control points. The system acquires gravity-acceleration data using a triaxial accelerometer and converts this data into a camera pose, thereby facilitating swift camera calibration. This study validates the system through method verification and field measurements. The method verification results indicate that the system’s method for retroactively deriving ground control-point coordinates achieves an accuracy exceeding 90%. Then, field measurements were performed five times to assess the surface velocity of the Datong River. These measured results were analyzed and compared with data collected from the radar wave velocity meter (RWCM) and the LS1206B velocity meter. Finally, a comprehensive sensitivity analysis of each parameter was conducted to identify those significantly impacting the river’s surface velocity. The findings revealed that this system achieved an accuracy exceeding 92% for all river surface velocities measured.
1. Introduction
Influences like population growth, climate change, and environmental degradation have considerably affected the sustainability and fair allocation of water resources [1,2]. As part of this evolution, precise measurement of rivers has become imperative. As of now, the majority of flow surface velocity measurements continue to depend on the utilization of mechanical instruments. Nevertheless, these instruments have constraints in specific scenarios. The objective of this paper is to introduce an innovative near-field remote-sensing measurement system to tackle these intricate challenges in flow surface velocity measurement.
Traditional methods of measuring river surface velocity typically involve the use of invasive instruments [3]. Instruments such as acoustic Doppler current profilers (ADCP) and acoustic Doppler velocity meters (ADV) can provide high-precision surface velocity [4]. However, these instruments necessitate researchers to operate within river environments, where the force of water flow can compromise their stability, thereby posing potential safety hazards [5]. Additionally, during periods of high flow, venturing into the water for measurements might be impractical, curtailing the availability and effectiveness of traditional invasive methods. Furthermore, adverse conditions can result in the destruction of conventional equipment [6]. In such scenarios, noninvasive methods become the sole viable option for flow-rate measurements. For instance, Liu, Tauro, and Pearce utilized drones for flow-rate measurements [7,8,9]. Melcher explored the use of helicopter-mounted radar to measure river surface velocity and conducted a series of experiments in the Tualatin River [10].
To surmount the constraints of traditional flow-velocity measurement methods and effectively address the demands of water resource management and planning, researchers have been continuously exploring novel nonintrusive techniques. Particle image velocimetry (PIV) is a prominent fluid-mechanics technique predominantly utilized in laboratory settings to measure water surface velocity. This system determines water surface velocity and direction by tracking particle movements within the field of view, employing advanced image-matching algorithms [11,12]. LSPIV is the practical application of PIV for river-flow measurements. LSPIV shows several advantages, including noncontact measurement [13,14,15], exceptional precision, high resolution, full-field measurements, and the ability to conduct remote measurements.
Being a computer vision-based velocity measurement technique, LSPIV demonstrates the substantial potential for enhancing river monitoring through enhanced safety, reliability, and cost effectiveness [16]. Consequently, these attributes have enabled the extensive utilization of LSPIV to visualize flow-velocity fields and rapidly estimate large-scale surface-flow directions [9,17,18].
LSPIV has gained acknowledgment as an effective and dependable method within the near-field remote-sensing measurement system for hydrological monitoring, disaster surveillance, and associated tasks [19,20,21]. In practical applications, several factors can influence the use of LSPIV, such as the impact of motion blur and lighting conditions on captured images. Of these factors, sunlight presents a significant challenge, obstructing the identification of tracer particles and rendering them difficult to distinguish. Zhang addressed this issue by employing a high-pass filtering approach for mitigation [22]. The Rüssmeier adoption of optical methods as an alternative solution to measuring sea surface velocity has also yielded excellent results [23]. The application of image-enhancement techniques has yielded encouraging outcomes in elevating image fidelity and diminishing noise levels. Implementation of these enhancement methods enables a clear depiction of the dynamic trajectories of tracer particles, significantly enhancing precision in particle tracking [24,25].
In practical applications of LSPIV, traditional methods necessitate a considerable amount of time and effort. This stems from the conventional approach for measuring river surface velocity, which requires placing numerous identifiable ground control points and measuring their coordinates for camera calibration [26,27,28]. However, establishing these control points during floods poses inherent safety risks to researchers [29], and they might become submerged, rendering them ineffective. Additionally, the accuracy of the traditional method heavily relies on the quantity and coverage range of control points, necessitating their widespread distribution around the river while maintaining a high density. Yet, in real-world scenarios, this process is exceedingly burdensome, and sometimes achieving the ideal control-point arrangement is unfeasible. To address these challenges, using a triaxial accelerometer as an acceleration data acquisition device offers an accurate means to determine camera-pose parameters, removing the need for deploying control points. This improvement significantly enhances the efficiency of LSPIV practical implementation.
This research introduces an innovative near-field remote-sensing measurement system relying on LSPIV to surmount the limitations of conventional camera calibration methods. At present, most camera calibration methods rely on ground control points, a need eliminated by the pioneering approach proposed in this study. By leveraging gravity acceleration acquired from a triaxial accelerometer for determining camera orientation, calibration becomes swift and precise. In practical use, placing the triaxial accelerometer sensor above the video sensor and gathering three-axis acceleration data during video recording allows for the rapid conversion of acceleration into the video sensor’s attitude, taking several tens of seconds to complete, with fewer environmental constraints. For instance, in challenging conditions like extreme environments or floods, constraints of traditional methods might complicate execution. However, this system retains substantial potential for computing river surface velocity in such circumstances, providing a fresh perspective and motivation for addressing these challenges.
The structure of this study is outlined as follows. In Section 2, we provide a comprehensive exploration of the methods employed, presenting detailed explanations of our experimental procedures and contextualizing them within existing related work. We compare and analyze the experimental results, showcasing their accuracy and reliability in Section 3. Section 4 is dedicated to a comprehensive sensitivity analysis of various parameters, accompanied by an in-depth discussion of the underlying factors. Lastly, in Section 5, we summarize the methodologies employed in this study and offer insights into future research directions.
2. Methods and Experiment
The methods employed in this study encompass utilizing a triaxial accelerometer for camera calibration instead of ground control points, performing image preprocessing via image enhancement, employing LSPIV for determining river surface velocity, and calculating river discharge using the velocity-area method. The technology roadmap is illustrated in Figure 1.
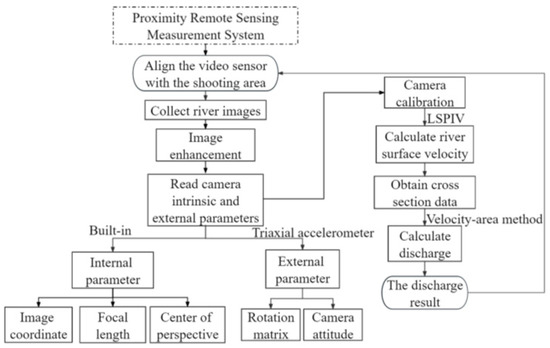
Figure 1.
The experimental process of the near-field remote-sensing measurement system mainly comprises several key steps, such as acquiring images of the river, enhancing the original images, obtaining camera poses via a triaxial accelerometer, and reading camera intrinsic parameters. Additionally, it encompasses computations for determining river surface velocity, gathering river cross-sectional data, establishing discharge, and rigorously verifying result accuracy.
The system comprises two segments, preprocessing and postprocessing. Preprocessing predominantly aims to ensure the effective operation of the LSPIV algorithm, encompassing acquiring the camera’s intrinsic and extrinsic parameters, delineating the river cross section, and employing image-enhancement techniques. Postprocessing aims to guarantee the precision of the flow-rate measurements. If the detection results’ accuracy falls short, recalibrating the camera and repeating the preceding steps can be undertaken until the desired outcomes are attained.
2.1. Methods Used to Calculate the River Velocity
2.1.1. Collinearity Equations
Existing camera calibration techniques are divided into two categories: display calibration and implicit calibration. Display-calibration methods estimate camera parameters in physical units of measurement. Many contemporary studies employ methods akin to the direct linear transformation (DLT) method proposed by Abdel-Aziz and Karara [30,31]. This paper utilizes collinear equations based on perspective theory to accomplish the transformation of ground control points between images and world coordinates. Collinear equations are renowned for their high accuracy in geometric correction, as demonstrated in Equation (1).
where (Xk, Yk, Zk) represents the coordinates of the perspective center in real space and (Mk, Nk) represents the coordinates of the perspective center in image space. The variable f denotes the equivalent focal length, which is measured in pixels. The coefficient Rij represents the rotation matrix calculated using the angles α (azimuth), θ (tilt), and η (roll). The coordinates of the measured object points in real space are represented by (Xa, Ya, Za), while (Ma, Na) represents the coordinates of the object points in the image space [32].
2.1.2. Triaxial Accelerometer
Traditional methods calculate the intrinsic and extrinsic parameters of the camera by inputting the image coordinates and world coordinates of ground control points [33]. A triaxial accelerometer sensor is used to measure spatial acceleration in acceleration sensors. In contrast, using the triaxial accelerometer method simply requires holding the triaxial accelerometer above the camera while shooting. By directing the camera toward the desired area and capturing the triaxial acceleration at that precise moment, in conjunction with the collinear equation, it becomes feasible to swiftly ascertain the camera’s external parameters for calibration purposes [34]. This approach is safer and more efficient than the GCP method.
It is essential to note that, when converting triaxial acceleration into camera attitude, the azimuth angle obtained is virtual, not the actual azimuth angle. However, this disparity does not affect the outcomes; the azimuth angle represents the camera’s direction relative to the river, and its actual orientation is not essential for computing the river velocity. It is this specific characteristic that enables triaxial accelerometers to substitute ground control points effectively. This will be analyzed and discussed in Section 4.
Acceleration is defined as the rate of change in the velocity of an object per unit of time. The unit of acceleration is m/s2, and acceleration can be decomposed into the components of acceleration along the X, Y, and Z axes. Figure 2 is a schematic diagram of the acceleration.
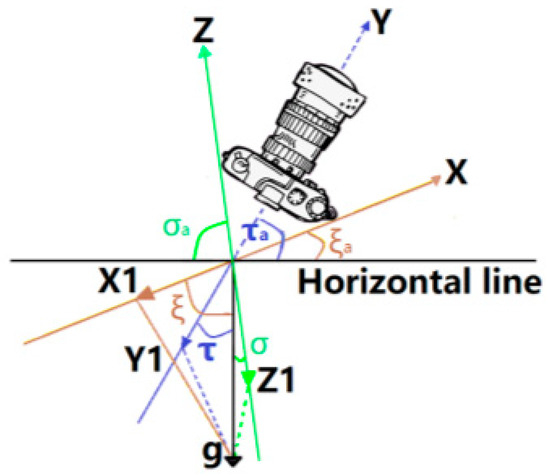
Figure 2.
Acceleration diagram.
The X-direction acceleration is represented by X1, which indicates the acceleration of the object in the horizontal direction. The angle between X1 and the acceleration due to gravity is ξ. The acceleration in the Y-direction is represented by Y1, which indicates the acceleration of the object in the vertical direction. The angle between Y1 and the force of gravity is τ. The acceleration in the Z-direction is represented by Z1, which indicates the acceleration of the object in the direction perpendicular to the horizontal plane. The angle between Z1 and the acceleration, due to gravity, is σ. The formulas for these components are Formulas (2)–(4).
Three attitude angles of the video sensor, α (azimuth), θ (tilt), and η (roll), can be calculated based on the triaxial acceleration values. The calculation formula is as follows: (5)–(7).
2.1.3. Orthorectification
In the realm of photogrammetry, the video sensor is perceived as the product of a central projection. This projection is inherently affected by both the observation angle and ground elevation. The objective of orthographic correction is to mitigate the parallax arising from fluctuations in ground elevation and the video sensor’s angle [35].
The fundamental concept behind orthophoto correction involves calibrating the camera’s internal and external parameters [36]. This calibration process encompasses computing the projection matrix and distortion parameters unique to the camera. Subsequently, these parameters are employed to project the pixels in the image onto a plane using the projection matrix. Orthorectification is categorized into two primary types: explicit and implicit. Explicit orthorectification directly converts the image into a format suitable for flow-velocity calculation, acting as fundamental data for subsequent processing. Conversely, implicit orthorectification, as utilized in this study, rectifies the velocity-vector field without altering the original image.
LSPIV computes river surface velocities via image processing, making it highly sensitive to image alterations. Explicit orthorectification entails image transformation, which might introduce discrete points that could potentially influence the outcomes. Research by Higham and Brevis indicates that, in most instances, the implicit orthorectification method is more adept at preserving the original image features [37], consequently mitigating information loss. Thus, outcomes achieved through implicit orthorectification are expected to possess higher accuracy compared to those attained through explicit orthorectification.
2.1.4. Image Enhancement
Prior to employing LSPIV for river surface-velocity calculation, an essential step involves image enhancement [38]. Typically, images captured by a video sensor are in color and contain values for the RGB channels. In instances where tracer particles in the river share a similar color with the river itself, notable errors may occur in the results. This discrepancy occurs because LSPIV utilizes grayscale values to track tracer particle displacement. When tracer particles and the river background possess similar grayscale values, the algorithm might produce false detections, potentially causing inaccuracies in the final results.
To mitigate this problem, image-enhancement techniques are employed to distinguish tracer particles from the river background. This process converts the color image into a grayscale image (GI), retaining only one channel from the RGB channels. The choice of channel selection depends on the specific scene captured, ensuring a clear differentiation between tracer particles and the river background. If converting the color image to grayscale alone is ungratified, additional methods can be employed for further image processing [39].
An example is histogram equalization (HE). As tracer particles usually have higher exposure compared to the river background, HE widens the gap between grayscale values or uniformly distributes the grayscale to amplify the image details. Consequently, regions with higher exposure become more prominent, enhancing the visibility of tracer particles. High-pass filtering (HPF) can be utilized. HPF selectively extracts crucial information from the image based on variations in the application environment. It aids in eliminating image noise, amplifying significant image features, and presenting object details with contours (e.g., tracer particles) in a more comprehensive manner, subsequently enhancing LSPIV accuracy.
Image sharpening (IS) is another technique that accentuates the contour portions of an image, refining image edges and grayscale variations for clarity. This method enhances edges, contours, and object features by heightening the contrast between object edges and adjacent pixels, often termed edge enhancement. Furthermore, image texturing (IT) is another noteworthy method. It delivers favorable outcomes when the shooting area is vast or distant from the target area. Yet, in cases where the shooting area is confined, it may generate more noise, thereby impacting the final result. Hence, the choice to employ this method relies on the image captured. Moreover, within the image-enhancement process, the sequence of grayscale processing can be adapted based on the specific context. In this article, terms like HPF-G, IT-G, G-HPF, and G-IT are utilized. The “-G” signifies that image enhancement occurs before converting the image to grayscale, while “G-” represents the conversion to a grayscale image as the first step.
2.1.5. Image Matching
Figure 3 illustrates the principle of LSPIV. Image matching involves choosing an inquiry area (IA) in the first image and a search area (SA) in the second image. Subsequently, the IA is sought within the SA to ascertain the displacement of the IA. It is essential to ensure that the IA image is smaller than the SA image and adequately sized. Typically, the SA is positioned along the flow direction of the IA to diminish search time and enhance efficiency. If the flow direction is ambiguous, the SA is set around the IA for a progressive search.
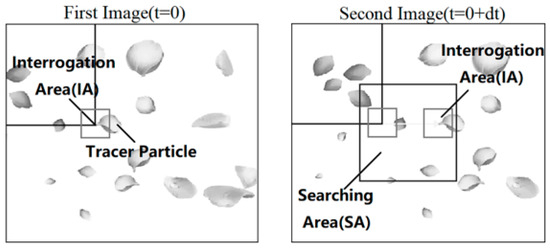
Figure 3.
Image-matching diagram.
The most critical technology in image matching is the cross-correlation function [40], such as Equation (8):
where C is the correlation coefficient, X and Y represent the dimensions of the image interrogation windows, and xij and yij represent the distributions of the gray values within the two image interrogation windows during specific time intervals. The upper bar signifies the average value of the query’s window strength, which serves to ascertain if the search area in the current SA is likely to be an IA area. When searching, it is recommended to set a cross-correlation threshold, such as 80%. If the cross-correlation between the IA and a specific window in the SA reaches 80%, it indicates that the IA area has been identified. Calculating the displacement of the IA area between the initial and subsequent frames while considering the time interval between captures enables the determination of the river’s flow velocity in the image. By incorporating the conversion relationship between the image and the real-world scenario, the actual flow velocity of the river can be computed.
2.2. The Method Used to Calculate River Discharge
2.2.1. Depth-Speed Conversion
In computing the velocity of a river segment, a crucial parameter that can substantially influence velocity computations is the river’s depth. Factors such as the riverbed structure, river profile, current aspect ratio, and Reynolds number [41] contribute to a loss in converting the average surface velocity to the average depth velocity. This loss is termed the correction coefficient or velocity index. The average velocity of depth is calculated as follows:
where Vd is the depth average velocity, K is the velocity index, and Vs is the surface average velocity.
2.2.2. Velocity-Area Method
The velocity-area method represents a widely employed technique for determining the flow of a river segment. Illustrated in Figure 4, this method involves partitioning the cross-section of the river into n subsections. Subsequently, the flow rate of each subsection is computed by multiplying the average depth velocity by the area of the subsection. Ultimately, summing the flows of all subsections yields the total flow of the entire cross section.
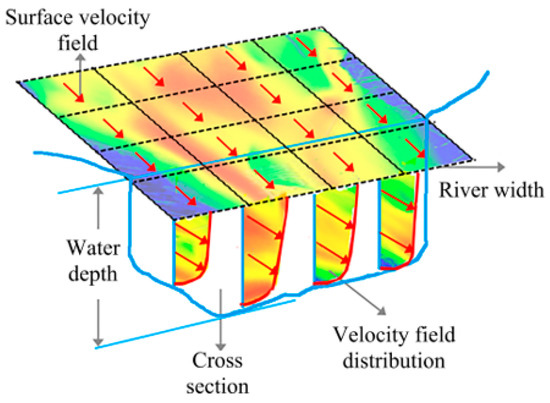
Figure 4.
Schematic diagram of the velocity-area method.
The expression for calculating the flow is as follows:
The total flow formula is Equation (11), where q represents the flow rate of section A, Vdepth-avg represents the calculated average depth velocity, and A represents the area of the subsection.
where Q is the total flow of the river cross section, and z is the number of subsections.
2.3. Validation of the Predictions
To assess the accuracy of the results, we employ root-mean-square error to evaluate the precision achieved in inferring ground control points between the traditional method and the approach proposed in this paper. The relative root-mean-square error (R-RMSE) is used to compare the obtained river velocity results with those obtained by RWCM and LS1206B. The formula for RMSE and R-RMSE is shown as Equations (12) and (13):
where r represents the number of control points, represents the real distance of the control point from the camera, and represents the inverse distance.
where m is the total number of measurements. represents the measurements obtained using a velocity meter, and represents the results obtained from the experiment of this research method.
To calculate the relative error (RE) of the results using Equation (13), this metric is often used to measure the magnitude of relative change. The smaller the PC value is, the better the result.
where Vins represents the surface velocity obtained using RWCM or LS300, and VLS represents the surface velocity calculated using LSPIV.
2.4. Experimental Setup
2.4.1. Experimental Area
The first experiment site is located in the lower reaches of the Datong River, which is a tributary of the Yellow River Basin. It has an altitude of 1840 m and is situated at coordinates 102°49′51.5″ E, 36°36′16.8″ N. The Datong River is a tributary of the Yellow River and the largest tributary of the Yellow River. On average, the annual runoff is approximately 2.84 billion cubic meters, with an average annual flow of 88.9 cubic meters per second. The annual sediment transport capacity is 1.37 million tons. The test section is approximately 300 m long and relatively straight. The left bank is covered with mortar masonry, while the right bank is covered with gravel sediments. The river section is well controlled, with a stable cross section and a riverbed composed of pebbles. Additionally, there is minimal erosion and settlement.
The experiment was conducted at the Liancheng Hydrology Station in Yongdeng County, Lanzhou City. This station is not only an important national hydrology station but also a national water-quality monitoring station. It is managed by the Lanzhou Hydrology Station in Gansu Province.
The second experiment is located 15 km downstream from the first experiment, both of which are on the Datong River, a tributary of the Yellow River. The riverbanks on both sides are covered with gravel deposits, and the riverbed conditions are similar to those at the first experimental site. The river is 30 m wide, with a maximum depth of 1.4 m. The experimental site is shown in Figure 5.
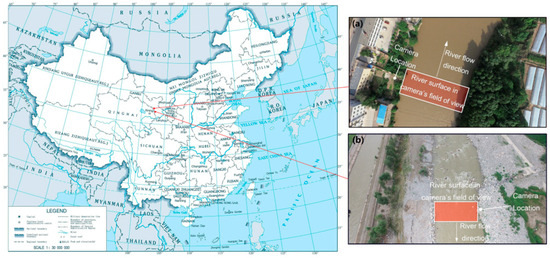
Figure 5.
Experimental area. (a) The location of the first experiment. (b) The location of the second experiment.
2.4.2. Experimental Materials
Figure 6a shows the complete hardware setup, with two cameras capturing far-field and near-field images. In order to provide a more comprehensive introduction to the hardware equipment utilized in this article, Figure 6b offers an enlarged view of the equipment, facilitating easier comprehension. The camera used in this study is the MV-CS0216-10GC color industrial camera produced by Hikvision in China (Figure 6c). This camera offers several advantages, including low power consumption, low noise, and excellent image quality. The specific parameters are shown in Table 1. Figure 6d shows the triaxial accelerometer used in this study, and the specific parameters are shown in Table 2. The lens is combined with the video sensor, and the triaxial accelerometer is fixed above the camera. All industrial cameras need to be equipped with lenses because the camera body is responsible for receiving light, sensing light, and capturing images, while the lens is responsible for focusing the light and creating the image. Without a lens, an industrial camera cannot function properly. The lens used in this study is a 16 mm low-distortion lens manufactured by Zhirui Vision Co., Ltd. in Yantai, China (Figure 6e). When connecting the industrial camera to the camera mount, a connecting plate manufactured by a 3D printer was utilized (Figure 6f).
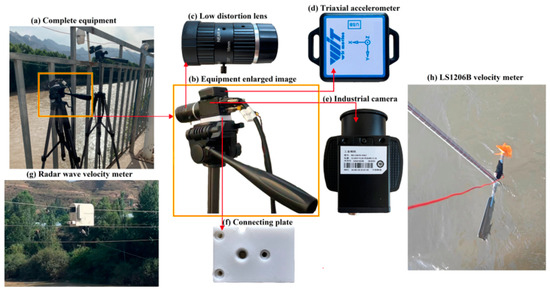
Figure 6.
Experimental hardware diagram.

Table 1.
Video sensor details.

Table 2.
Triaxial accelerometer details.
Figure 6g shows the RWCM used in the first experiment. The RWCM used is a customized model for hydrological stations. It can measure flow velocities in the range of 0.05 m/s to 20 m/s, with a measurement accuracy of 0.05 m. The RWCM measures the surface-flow velocity every 5 m and measures each point for 60 s to take the average value.
Figure 6h depicts the LS1206B velocity meter used in the second experiment. The LS1206B velocity meter used in this study is capable of measuring flow velocities ranging from 0.06 m/s to 8.00 m/s, with a measurement accuracy of 0.1 m/s. The LS1206B measures the flow velocity at a point located 2 cm above the river’s surface, and two measurements are taken at each location. If the discrepancy between the two measurements exceeds 0.2 m/s, an additional measurement is conducted, and the average of the readings is taken.
2.4.3. Experimental Settings
The first and second experiments were conducted on 21 June 2023 and 14 July 2023, respectively, downstream of the Datong River. In Equation (1), a total of 20 parameters is essential. The values for R11 to R33 can be obtained by using Equations (2)–(7) after acquiring the data from the triaxial accelerometer, as illustrated in Table 3. Since the camera approximates a parallel horizontal plane when capturing far-field images, the tilt angle of the near-field camera will be significantly greater than that of the far-field images. The values of (Mk, Nk) can be obtained by dividing the image resolution by 2. In this study, the image resolution used was 1440 × 1080 (pixels). The focal length (f) can be determined during image capture using the lens. The coordinates (Ma, Na) represent the image coordinates of the ground control points, which can be determined using software tools for drawing and image analysis.

Table 3.
Triaxial acceleration values used in the experiment.
As only the relative distance between the measurement point and the camera is essential, and precise real-world coordinates are unnecessary, the values of (Xk, Yk) do not affect the calculation of the river surface velocity and can be set to (0,0). The result of the subtraction of Za and Zk represents the height difference between the camera and the river surface. The final result is (Xa, Ya), and the distance from the ground control points to the camera can be calculated. Their velocities can be calculated by measuring the change in distance between the camera and the ground control points in the two images and dividing by the image time interval between the images.
3. Results
In this section, we will present the results of two experiments conducted on 21 June 2023 and 14 July 2023. In each experiment, the surface velocity of the river was measured using the triaxial accelerometer method combined with LSPIV. The images were preprocessed to observe the changes in the results. The results were compared with RWCM in the first experiment, while, in the second experiment, the results were compared with LS1206B.
3.1. Comparison of Feature-Point Matching Using Image-Enhancement Methods
LSPIV computes flow velocity by analyzing the displacements of specific feature points. The accuracy of the computed flow velocity significantly relies on the precise capture of these feature points. Table 4 describes the number of successfully matched feature points in six experiments. Here, 1-far represents the far-field area of the first experiment, and 1-near represents the near-field area of the first experiment. Where 2-first represents the first set of experiments in the second experiment, the others are similar as well. Throughout all six experiments, the HE method consistently attained the greatest count of successful feature-point matches. This indicates that, with image enhancement, the HE method can accurately detect and match feature points, resulting in more reliable flow-velocity calculations. Furthermore, regarding its accuracy in velocity estimation, utilizing the HE method in LSPIV exhibits a notable advantage. It provides more precise flow-velocity measurement data for fluid mechanics research and practical applications.

Table 4.
Performance table of feature-point matching.
3.2. Method Validation
Both the traditional method and the method employed in this study rely on computing the internal and external parameters of the camera, amalgamating them with colinear equations or other mathematical models to resolve the real coordinates of ground control points. Subsequently, LSPIV is employed to calculate the river’s surface velocity.
The methodology introduced in this study integrates the usage of triaxial accelerometers, highlighting their potential to supplant traditional ground control points. An inherent advantage of this method lies in its ability to precisely ascertain the authentic coordinates of ground control points via inversion techniques. Hence, before commencing the field experiments, meticulous method validation becomes essential. This validation process entails a thorough comparison and verification to evaluate the practicability of the proposed methodology. The experimental protocol involves the arrangement of ground control points and the accurate utilization of triaxial accelerometers, elucidated in Figure 7.
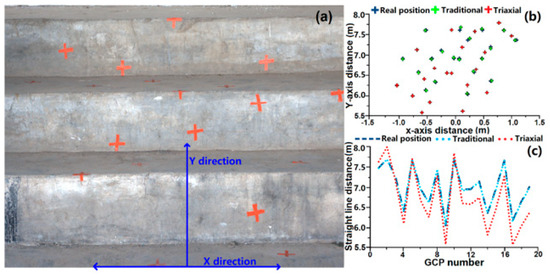
Figure 7.
Method validation setup and result diagram. (a) The layout of the control-points diagram, a total of 19; (b) comparison of the results of retroactively inferring ground control-point coordinates using traditional methods and the method proposed in this study; and (c) comparison of the distances from control points to the camera in a straight line calculated using traditional methods and the method presented in this study.
As a technique capable of substituting traditional ground control points, deriving the actual coordinates of control points from their image coordinates becomes essential. Subsequent calculation of the river surface velocity relies on the ability to determine the straight-line distance between the control point and the camera. Consequently, a comparison will be made between the results of coordinate inversion using the traditional control-point method and the proposed method in this study. The experimental findings are illustrated in Figure 8. The RMSE for the traditional method is 0.0283, contrasting with 0.3376 for the method utilized in this study. Although the accuracy decreased compared to the traditional method, the method suggested in this article successfully computes the straight-line distance of 19 control points. The accuracy levels varied from a minimum of 90% to a maximum, precisely determining the actual straight-line distance. Thus, the method introduced in this article has the potential to supplant traditional methods while maintaining a high level of accuracy.
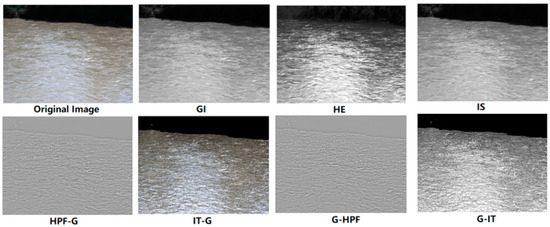
Figure 8.
Image preprocessing in the first experiment. where the original image represents the unaltered image captured by the camera, while GI corresponds to the grayscale image employed in traditional methods. In contrast to GI, HE intensifies the exposure area, thereby augmenting the identification of feature points. IS compensates for specific parts of the image’s contours, HPF eliminates noise and enhances the outlines of objects, and IT renders the contours of feature points more distinct.
3.3. Results of the First Experiment
3.3.1. Surface-Velocity Results
To assess the accuracy of different methods, this study utilized results from RWCM and LS1206B velocity meters as benchmarks for comparing against the triaxial accelerometer method. Initially, over twelve image-enhancement methods were tested on far-field and near-field images. Subsequently, six methods were chosen for preprocessing both far-field and near-field images. Every experimental set utilized eight images for computing the surface-flow velocity, subsequently converting it into average depth velocity. This process was supplemented by employing the velocity-area method for accurately calculating the river’s flow rate.
The outcomes of the experiments post-image-enhancement processing are displayed in Figure 8. Figure 9 showcases the surface velocity distribution from the left bank to the right bank, obtained using diverse image-enhancement methods. Due to the varying number of successfully matched feature points in each method, the size of the depicted area varies as well.

Figure 9.
Surface velocity was obtained by each image-enhancement method in the first experiment. (a) Heatmap corresponding to GI; (b) heatmap corresponding to HE; (c) heatmap corresponding to IS; (d) heatmap corresponding to HPF-G; (e) heatmap corresponding to IT-G; (f) heatmap corresponding to G-HPF; and (g) heatmap corresponding to G-IT.
In Figure 9, it is evident that the presence of shadows above the image hinders the accurate identification of certain areas, resulting in the absence of surface velocity measurements at the top. Especially in the riverbank area, the distribution of surface speed is more concentrated due to its slow speed. Moreover, the interference caused by noise substantially impacts the outcomes presented in Figure 9c, differentiating them significantly from the results obtained through alternative methodologies. It is worth noting that the surface velocity obtained by RWCM represents the average velocity over several seconds or minutes, while the velocity calculated by LSPIV represents the instantaneous velocity. This difference in calculation methods is the reason for some discrepancies between the two.
Table 5 exhibits the RE results for the initial experiment in both far-field and near-field scenarios. The initial experiment findings indicate that IT processing yields highly accurate results for far-field images. However, when applied to near-field images, IT processing diminishes the success rate of feature-point matching, resulting in substantial velocity errors. Initially, it was assumed that the high image contrast and brightness might be responsible. However, even after reducing these aspects, LSPIV was rendered inoperative. Thus, errors in near-field scenarios may be attributed to the limited size of the capture area, closely situated to the observation region. Consequently, this near-field situation might lead to image noise generation postenhancement.

Table 5.
The RE comparison with RWCM for the first experiment.
Analytical findings revealed that the RE for the traditional GI method reached +4.63%, whereas the HE method’s RE stood at +4.5%. The HE method apparently does not substantially improve accuracy compared to the GI method. Nevertheless, it is noteworthy that, in the majority of cases, the results obtained with the HE method surpass those from the GI method.
The results clearly indicate that both the HPF and IS methods outperform the GI method in far-field scenarios. However, in near-field situations, these two methods exhibit markedly inferior results compared to the GI method. Hence, these approaches could be considered for experimentation as alternatives.
Remarkably, the IT-G method demonstrates the lowest RE values for far-field outcomes, at −2.2%. However, its performance notably declines in near-field scenarios. Thus, employing the IT-G method in practical applications should be contingent upon specific on-site conditions.
Regarding successful feature-point matching, the outcomes illustrate a significant improvement in accuracy following the application of HE to the images. HE attains the highest count of successful feature-point matches in both far-field and near-field scenarios, notably excelling in the near-field where the number of successful matches exceeds twice that of other methods. The accuracy of the computed flow velocity is directly affected by the count of successful feature-point matches. Concerning image enhancement, HE demonstrates satisfactory outcomes in both scenarios.
3.3.2. Comparison of River-Section Discharge with RWCM
Figure 10 illustrates the schematic of the river cross section obtained from RWCM in the first experiment. Table 6 presents a comparison of the flow rate calculated using different methods with the flow rate obtained from RWCM. The conversion of surface-flow velocity to depth velocity is achieved through the empirical coefficient method, and the subsequent flow-rate computation employs the velocity-area method. Given the cobblestone-laden riverbed of the Datong River, with a high sediment content, a velocity index of 0.8 is set.
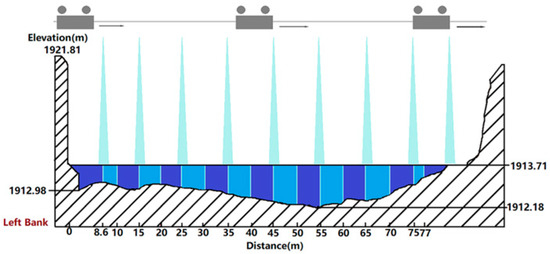
Figure 10.
Cross-section diagram of the first experiment, obtained by RWCM.

Table 6.
The comparison of discharge results from the first experiment with the flow rate obtained from RWCM.
The findings reveal significant variations in RE across different image-enhancement methodologies. When utilizing GI, the RE fluctuates within a range of −3.9% to 4.1%, whereas HE exhibits a narrower range of 0.4% to 3.4%. G-HPF displays alterations ranging from −0.2% to −3.2%, and HPF-G exhibits variations from 0.2% to 3.9%. IT-G demonstrates changes from 2.4% to 2.9%, and G-IT ranges from −2.7% to 4.1%. In our experiment, although GI-IT and IT-G yield considerable errors in near-field images, these instances occur in shallow areas of the river. Moreover, the velocities with significant errors are limited, thus having minimal impact on the overall flow-rate results. Lastly, IS yields changes spanning from 0.8% to 4.3%.
Upon comprehensive analysis, the various image-enhancement methods employed in this study consistently outperform grayscale images. However, it is imperative to emphasize that these results are preliminary, and further experiments are necessary to validate this conclusion. Moreover, it is crucial to acknowledge the inherent limitations of the velocity-index method. As an empirical formula, its application in flow-rate calculations may introduce errors in the measurements, which should be carefully considered in the interpretation of the results.
3.4. Results of the Second Experiment
3.4.1. Surface Stream Flow-Velocity Results
Figure 11 displays the image results after applying image enhancement to the third group of images in the second experiment. Figure 12 shows the surface velocity distribution from the left bank to the right bank captured using various image-enhancement methods. In the depicted river section, the flow velocity is relatively low at the shallow banks. The maximum flow velocity at the deepest part of the river is approximately 1.0 m/s. HE still demonstrates higher accuracy in this scenario. The R-RMSE of HE ranged from 1.3% to 2.5%, indicating an improvement in precision compared to the R-RMSE of 2.2% to 3.9% for conventional GI methods.
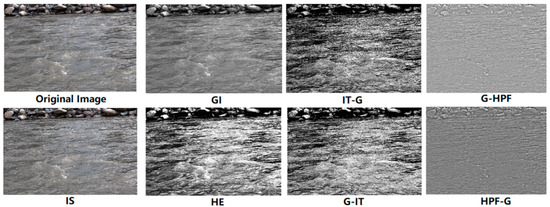
Figure 11.
Image preprocessing in the second experiment. The original image is the unaltered photo taken in the second experiment; GI is the grayscale version of the original image from the same experiment; HE results from histogram equalization on the original image; HPF is the product of high-pass filtering; IS is the outcome of image sharpening; and IT comes from image texturing. All these enhancements aim to improve the visibility of feature points in the river.
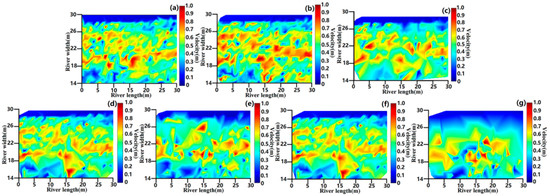
Figure 12.
Surface velocity was obtained by each image-enhancement method in the second experiment. (a) Heatmap corresponding to GI; (b) heatmap corresponding to HE; (c) heatmap corresponding to IS; (d) heatmap corresponding to HPF-G; (e) heatmap corresponding to IT-G; (f) heatmap corresponding to G-HPF; and (g) heatmap corresponding to G-IT.
Table 7 displays the results obtained by using LSPIV in combination with various image-enhancement techniques. As observed in the RE graph, the utilization of histogram-equalization (HE) processing consistently yields satisfactory outcomes, with an RE of −3.6%. Compared to GI, which shows an RE of 7.2%, HE yields more accurate results. In this experiment, the utilization of texture-based processing for the flow-rate calculation does not demonstrate the same significant errors as observed in the first experiment. However, the RE of IT-G reaches −9.1%, and the G-IT RE reaches −6.2%, indicating that their processing results have a lower accuracy compared to the original grayscale images.

Table 7.
The RE comparison with LS1206B velocity meter for the second experiment.
A notable revelation surfaces from image-sharpening (IS) processing in this experiment, unveiling unforeseen challenges. Despite enhancing the distinctiveness of image feature points, ostensibly improving accuracy, IS processing paradoxically results in an RE of −41.1%. This counterintuitive outcome might be attributed to amplified image noise post-IS processing, consequently magnifying errors.
Concerning G-HPF processing, aside from the third group displaying relatively large matching errors, the remaining matching outcomes were favorable. The RE for HPF-G stood at −13.6%, while G-HPF recorded an RE of 13.4%. Despite larger errors observed in some results, the majority of errors were minor. Hence, the utilization of HPF-enhanced images remains a viable and potentially effective avenue for enhancing accuracy in this particular context.
In the domain of successful feature-point matching, HE consistently exhibits exceptional efficacy. In all four experimental groups, the count of successful feature-point matches surpassed that of the GI group by more than 100 points, frequently doubling or tripling compared to other methods. Therefore, akin to the conclusion drawn from the initial experiment, HE continues to stand out as the most effective image-enhancement method.
3.4.2. Comparison of River-Section Discharge with an LS1206 Velocity Meter
Figure 13 illustrates the schematic cross section for the second experiment, precisely measured by LS1206B. Table 8 provides a meticulous comparison between the calculated flow rates derived from various methodologies and the flow rate acquired by LS1206B. Similar to the first experiment, the second experiment was conducted downstream of the Datong River, with a predetermined velocity index of 0.8. The discharge was meticulously calculated using the surface velocities obtained from the third group of methods.
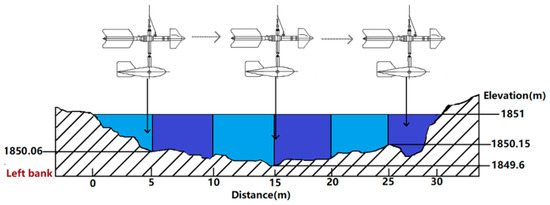
Figure 13.
Cross-section diagram of the second experiment, obtained by an LS1206B velocity meter.

Table 8.
The comparison of discharge results from the second experiment with the flow rate obtained from LS1206B.
The results demonstrate varying REs across different image-enhancement methods. When utilizing GI, the RE fluctuates between 1.6% to 6.5%. In contrast, employing HE results in a narrower range, from 0.2% to 3.6%. G-HPF displays a broader range of 5.0% to 5.9%, and HPF-G ranges from 0.7% to 3.6%. IT-G showcases a range of 0.6% to 1.6%, while G-IT exhibits a range of 0.3% to 3.9%. Conversely, IS yields a wider range, of 1.8% to 6.9%. One reason for the discrepancy between the RE values for discharge and surface velocity lies in how the RE values for higher velocities in actual discharge calculations might be situated in shallower areas, while lower RE velocities are in deeper regions. Therefore, the resulting accuracy of discharge calculations might exceed that of velocity measurements.
Despite IT-G and G-IT showcasing higher accuracy in this specific experiment, it is crucial to acknowledge that the other two groups in the second experiment encountered notable inaccuracies. Hence, in practical applications, the choice of appropriate image-enhancement methods should be contingent upon the specific characteristics of the river, ensuring effective preprocessing procedures.
4. Discussion
To explore the uncertain parameters affecting the accuracy of river surface velocity monitored by ground-based video sensors, we conducted a sensitivity analysis. A distinct parameter set was selected for the analysis, establishing 1.309 m/s as the initial calculated result, serving as the reference or baseline before any adjustments were made. Each parameter was systematically altered individually to gauge the extent of variations in the river’s surface-flow velocity. The change in buoyancy is represented by subtracting the initial velocity from the result after modifying the parameters and then dividing by the initial velocity. The parameters subjected to modification encompassed the camera pose obtained from the triaxial accelerometer, matching window size, camera height, image resolution, focal length, and correlation-coefficient threshold. The outcomes are presented in Figure 14 and Figure 15, where the blue dotted line aligns with the left Y-axis, and the purple dotted line aligns with the right Y-axis.
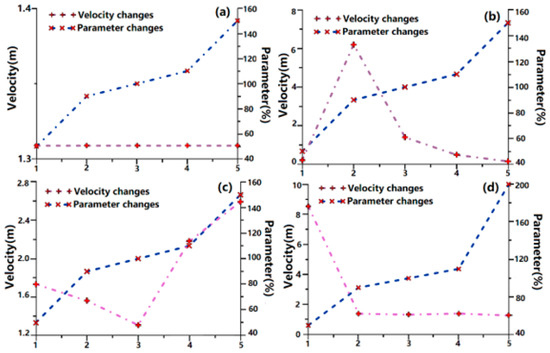
Figure 14.
Sensitivity analysis. (a) Effect of azimuth on river surface velocity; (b) effect of tilt on river surface velocity; (c) effect of roll on river surface velocity; and (d) sensitivity analysis plot of matching window size.
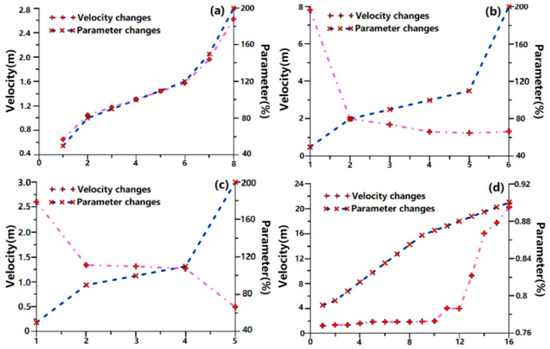
Figure 15.
Sensitivity analysis. (a) Sensitivity analysis plot of camera height; (b) sensitivity analysis plot of image resolution; (c) sensitivity analysis plot of focal length; and (d) sensitivity analysis plot of cross-correlation coefficient.
4.1. Effect of Camera Pose on Surface Velocity Measurements
The camera pose obtained from the triaxial accelerometer encompasses three essential angles: azimuth angle, tilt angle, and roll angle. To meticulously investigate their impact on river surface velocity, comprehensive experiments were conducted, systematically varying each angle by +10%, −10%, −50%, and +50%. The meticulously obtained results are meticulously illustrated in Figure 14a–c.
The outcomes reveal that the azimuth angle has no impact on the measurement of river surface velocity. This angle, utilized in LSPIV calculations, is virtual, thereby influencing solely the computer’s interpretation of the camera’s relative orientation to the river, with no tangible effect on the actual flow velocity.
In contrast, the tilt angle emerges as a critical parameter within the camera pose, significantly affecting the outcomes. A 10% decrease in tilt angle leads to a 373.4% increase in flow velocity, while a 10% increment results in a noteworthy 63.4% decrease in velocity. Additionally, among the changes we adjusted, the smallest change in flow velocity occurred when it decreased by 20%, resulting in a 30.7% reduction in velocity. Similarly, the roll angle also significantly impacts the outcomes. A 10% decrease in the roll angle results in a 19.3% increase in flow velocity, while a 10% increase enhances the velocity by 66.7%. The most substantial change occurs when the tilt angle increases by 20%, leading to a 177.8% increase in velocity.
Analyzing the camera pose reveals that the impact of the roll angle on flow velocity is notably higher than the other two angles. Furthermore, based on our analysis, to maintain the velocity error within 10%, the maximum acceptable range of change for the roll angle is approximately 5°, while the range of tilt angle is within 2°. Hence, precise measurement of the tilt angle is crucial during experimental recording and camera calibration to ensure the accuracy and reliability of the obtained data. Our method can precisely capture the acceleration of this angle during use, thereby avoiding result inaccuracies caused by the camera pose.
4.2. Effect of the Matching Window Size on Surface Velocity Measurements
To explore the influence of the matching window size on the river’s surface-flow velocity, we systematically altered the window size and rigorously examined its effects on the flow velocity. The initial matching window size employed was set at 50 × 50 pixels. Systematic variations of −50%, −10%, +10%, and +100%, relative to the original size, were investigated, and the meticulously obtained outcomes are depicted in Figure 14d.
The outcomes illustrate that variations within an acceptable range of the matching window size exert a relatively minor influence on river surface velocity. For instance, a 10% increase in window size results in a 5.7% rise in flow velocity, whereas a 10% reduction causes a 5.1% increase. Conversely, a 100% enlargement leads to a 6.5% reduction in flow velocity. However, excessively small window sizes render the image-matching process prone to errors, causing substantial disparities in results. For instance, a 50% reduction in size resulted in a substantial 549.8% increase in flow velocity. Our analysis results align with the findings of Yeh [3]. Special attention should be paid to maintaining an appropriate matching window size to ensure accurate and reliable flow-velocity measurements.
4.3. Effect of Camera Height on Surface Velocity Measurements
The impact of camera height on the velocity of river surface flow is a particularly noteworthy phenomenon. To investigate this effect, we conducted several iterations by varying the camera-height parameter. The original camera height used in this study was 1.8 m. We made modifications of −50%, −20%, −10%, +10%, +20%, +50%, and +100% to the original height and obtained the results shown in Figure 15a.
The results demonstrate a significant correlation between the camera height and the river’s surface-flow velocity. The impact on the velocity directly corresponds to the percentage error in the camera height. For instance, a 10% increase in camera height leads to a corresponding 10% increase in velocity, while a 50% increase in camera height results in a 50% increase in velocity, and so forth. This relationship elucidates the effect of height variation on velocity and emphasizes the direct connection between the two, demonstrating a linear growth trend in velocity with an increase in camera height. It underscores the significance and predictability of this correlation. Hence, to ensure that the velocity error is within 10% in practical applications, the height error should also be within 10%.
4.4. Effect of Image Resolution on Surface Velocity Measurements
The influence of image resolution on the river’s surface-flow velocity is commonly examined and described in the majority of the literature. Therefore, in this study, we focused on exploring several noteworthy variations: −50%, −20%, −10%, +10%, and +100% of the original image resolution. The initial image resolution used in this research was 1440 × 1080 pixels. The results obtained after modifying the parameters are shown in Figure 15b.
The results indicate that increasing the image resolution has a relatively minor impact on the river’s surface-flow velocity, within an acceptable range. Specifically, a 10% increase in resolution leads to a 5.5% decrease in flow velocity, while a 100% increase in resolution results in only a 0.4% increase in flow velocity. Conversely, decreasing the image resolution significantly affects the results. Reducing the resolution by 10% results in a 29.9% increase in flow velocity, while decreasing it by 50% causes a significant 497% increase in flow velocity.
The reason behind these effects lies in the relationship between image resolution and ground-sampling distance (GSD). When the image resolution decreases, the GSD increases. For instance, if each pixel originally represented a real-world distance of 10 cm, reducing the pixel count would result in each pixel representing a larger real-world distance, such as 30 cm or even more. Consequently, flow velocity appears significantly amplified under reduced image-resolution conditions. This emphasizes the critical necessity of maintaining suitable image-resolution levels to ensure precise measurements of river surface velocity.
4.5. Effect of the Focal Length on Surface Velocity Measurements
It is crucial to pay special attention to the impact of focal length, as this aspect is often overlooked. When capturing images of the monitoring area, the focal length specified on the lens refers to the focal length used for shooting at the farthest distance, which may not be the same as the focal length used during the actual shooting. Lenses usually have markings that allow users to record the focal length used when capturing images.
In this study, the focal length used during shooting was 8 mm. We conducted variations of −50% (4 mm), −10%, +10%, and +100% (16 mm) to the original focal length, and the results are shown in Figure 15c.
The results indicate that, if we record the focal length utilized during shooting, we can effectively manage the acceptable error introduced during the subsequent conversion to pixels. A 10% increase in focal length correlates with a 3.6% decrease in flow velocity, while a 10% decrease in focal length results in a 2% increase in flow velocity. Despite potential errors stemming from photosensitive chip variations during the conversion process, these errors typically remain within a limited range.
However, if the focal length used during shooting is not recorded and the lens focal length is assumed to be one of the common values (e.g., 4 mm, 8 mm, or 16 mm), it can have a significant impact on the results. For instance, reducing the focal length by 50% leads to a 98.6% increase in flow velocity, while increasing the focal length by 100% results in a 62% decrease in flow velocity. Therefore, accurately recording the focal length used during shooting is crucial for obtaining reliable results.
4.6. Effect of the Cross-Correlation Coefficient on Surface Velocity Measurements
The cross-correlation coefficient is a crucial factor in LSPIV implementation, representing the essential correlation level between successive image frames. In this study, a threshold of 0.65 was utilized and meticulously adjusted 30 times, focusing particularly on the ranges of 0.805 to 0.9 and 0.7 to 0.8. Within the 0.7 to 0.8 range, variations in the coefficient had a relatively minor impact on the river’s surface-flow velocity. The most significant impact was observed at a coefficient of 0.79, resulting in a 9% decrease in river surface velocity. Within the 0.7 to 0.8 range, the influence on river surface velocity remained under 1%. These results are graphically represented in Figure 15d.
The correlation-coefficient threshold denotes the degree of correlation between the new IA window within the SA and the previous IA window. Achieving this threshold indicates successful matching, enabling flow-velocity calculation. However, excessively high thresholds can result in erroneous matches, misgrouped feature points, or even prevent matches, leading to incomplete velocity vectors and inaccurate results. In practical applications, it is essential to assess different thresholds concerning image quality and flow-field characteristics. The sensitivity analysis carried out in this study highlights the importance of establishing the correlation coefficient threshold. For optimal accuracy and reliability in the flow-velocity calculation, it is advisable, based on specific scenarios, to opt for a threshold between 0.6 and 0.8. This selection aims to maximize the accuracy of matching and reliability in calculating flow velocity.
4.7. Triaxial Acceleration Meter
In addition to the aforementioned parameters affecting river surface velocity, the core of this study lies in using a triaxial accelerometer to replace ground control points for camera calibration. Therefore, when using the triaxial accelerometer, some considerations should be taken into account. First, due to its high sensitivity to object acceleration, it is crucial to securely fix the triaxial accelerometer above the video sensor during video recording to prevent external forces from affecting it. Any external force could cause fluctuations in the triaxial accelerometer, thus impacting the results. Secondly, the triaxial accelerometer corresponds to three different axes representing three distinct angles. It is essential to align the y-axis of the triaxial accelerometer with the direction of the video sensor’s capture during use; otherwise, the derived attitude from the transformation of the triaxial accelerometer data will be incorrect. In the end, looking ahead, there are exciting prospects for further enhancing this system’s capabilities. It can potentially be integrated with drones and the internet of things (IoT) for monitoring rivers in remote or nonnetworked areas [42,43]. Additionally, synergy with IoT technology can pave the way for establishing ecological monitoring systems tailored for edge regions [44]. An ambitious vision involves the integration of digital-twin technology with this system, which would enable high-precision real-time hydrological monitoring and global-scale monitoring [45].
5. Conclusions
We introduce an innovative near-field remote-sensing measurement system that eliminates the necessity for ground control points. This approach offers swifter, safer, more reliable, and cost-effective measurements than traditional methods. When applying LSPIV in extreme environments, conventional ground control-point methodologies become impractical due to difficulties in arranging or obtaining precise control-point data in such conditions. Conversely, the triaxial accelerometer method presents a ground control-point-free solution. Attaching the device securely to the video sensor and capturing triaxial acceleration precisely when the sensor records the image allows for straightforward camera calibration using this data.
We conducted five experiments across two locations in Yongdeng County, Gansu Province. Utilizing dual cameras, we captured images from both far-field and near-field perspectives. Our analysis, compared against RWCM and LS1206B velocity meter data, showcased that the river surface velocity calculated using our method in this study achieved an accuracy surpassing 92.8%. These findings highlight the triaxial accelerometer approach as an effective replacement for traditional methods. The remarkable accuracy observed in our experiments is notably influenced by the turbid water-flow conditions in the Datong River, significantly enhancing the capture of feature points. In addition, we extensively investigated twelve image-enhancement preprocessing methods and identified six effective techniques.
In summary, the accelerometer approach has proven to be an efficient and practical alternative to traditional methods, particularly in scenarios where the placement of control points poses inherent challenges.
Author Contributions
Conceptualization, M.Z. designed the study and contributed significantly to the manuscript, E.Z. and L.L. contributed to writing the manuscript including the literature search, figures, data collection, data analysis, and data interpretation. W.H., Y.J., F.K. and H.D. designed this research and contributed significantly to the discussion of experiment and manuscript refinement. All authors have read and agreed to the published version of the manuscript.
Funding
This work was supported by the National Key R&D Program of China under Grant 2023YFF1303502; the NSFC under Grant 42271492; the Science and Technology Commissioner Special Project of Gansu Province under Grant 23CXGA0069; the Youth Science and Technology Talent Innovation Project of Lanzhou City under Grant 2023-QN-116; and the Science and Technology Program of Gansu Province under Grant 21JR7RA248.
Data Availability Statement
The system code is not publicly available, but interested parties can contact the corresponding author (zhangmh@lut.edu.cn). Other data in the article can be obtained by contacting Liang Li (222085404046@lut.edu.cn).
Conflicts of Interest
The authors declare no conflicts of interest.
References
- Li, X.; Cheng, G.; Liu, S.; Xiao, Q.; Ma, M.; Jin, R.; Che, T.; Liu, Q.; Wang, W.; Qi, Y.; et al. Heihe Watershed Allied Telemetry Experimental Research (HiWATER): Scientific Objectives and Experimental Design. Bull. Am. Meteorol. Soc. 2013, 94, 1145–1160. [Google Scholar] [CrossRef]
- Li, X.; Cheng, G.; Fu, B.; Xia, J.; Zhang, L.; Yang, W.; Zheng, C.; Liu, S.; Li, X.; Song, C.; et al. Linking Critical Zone with Watershed Science: The Example of the Heihe River Basin. Earths Future 2022, 10, e2022EF002966. [Google Scholar] [CrossRef]
- Yeh, M.T.; Chung, Y.N.; Huang, Y.X.; Lai, C.W.; Juang, D.J. Applying adaptive LS-PIV with dynamically adjusting detection region approach on the surface velocity measurement of river flow. Comput. Electr. Eng. 2019, 74, 466–482. [Google Scholar] [CrossRef]
- Gordon, R.L. Acoustic measurement of river discharge. J. Hydraul. Eng. 1989, 115, 925–936. [Google Scholar] [CrossRef]
- Tazioli, A. Experimental methods for river discharge measurements: Comparison among tracers and current mete. Hydrol. Sci. J. 2011, 56, 1314–1324. [Google Scholar] [CrossRef]
- Nicolás, F.G.; Antoine, P.; Carlos, M.G.; Juan, C.B. Use of LSPIV in assessing urban flash flood vulnerabilit. Nat. Hazards 2017, 87, 383–394. [Google Scholar]
- Liu, W.; Lu, C.; Huang, W. Large-scale particle image velocimetry to measure streamflow from videos recorded from unmanned aerial vehicle and fixed imaging system. Remote Sens. 2021, 13, 2661. [Google Scholar] [CrossRef]
- Tauro, F.; Pagano, C.; Phamduy, P.; Grimaldi, S.; Porfiri, M. Large-scale particle image velocimetry from an unmanned aerial vehicle. IEEE ASME Trans. Mechatron. 2015, 20, 3269–3275. [Google Scholar] [CrossRef]
- Pearce, S.; Ljubicic, R.; Pena-Haro, S.; Maddock, I.; Paulus, G.; Plavsic, J.; Prodanovic, D.; Manfreda, S. An evaluation of image velocimetry techniques under low flow conditions and high seeding densities using unmanned aerial systems. Remote Sens. 2020, 12, 232. [Google Scholar] [CrossRef]
- Philipp, T.; Christian, H.; Jeffrey, A.T.; Juan Francisco, F.; Gert, T. RAPTOR-UAV: Real-time particle tracking in rivers using an unmanned aerial vehicle. Earth Surf. Process. Landf. 2017, 42, 2439–2446. [Google Scholar]
- Meinhart, C.D.; Wereley, S.T.; Santiago, J.G. PIV measurements of a microchannel flow. Exp. Fluids 1999, 27, 414–419. [Google Scholar] [CrossRef]
- Dinehart, R.L.; Burau, J.R. Averaged indicators of secondary flow in repeated acoustic Doppler current profiler crossings of bends. Water Resour. Res. 2005, 41, 1–18. [Google Scholar] [CrossRef]
- Detert, M.; Johnson, E.D.; Weitbrecht, V. Proof-of-concept for low-cost and non-contact synoptic airborne river flow measurements. Int. J. Remote Sens. 2017, 38, 2780–2807. [Google Scholar] [CrossRef]
- Dal Sasso, S.F.; Pizarro, A.; Samela, C.; Mita, L.; Manfreda, S. Exploring the optimal experimental setup for surface flow velocity measurements using PTV. Environ. Monit. Assess. 2018, 190, 460. [Google Scholar] [CrossRef] [PubMed]
- Gunawan, B.; Sun, X.; Sterling, M.; Shiono, K.; Tsubaki, R.; Rameshwaran, P.; Knight, D.; Chandler, J.; Tang, X.; Fujita, I. The application of LS-PIV to a small irregular river for inbank and overbank flows. Flow Meas. Instrum. 2012, 24, 1–12. [Google Scholar] [CrossRef]
- Jin, T.; Liao, Q. Application of large scale PIV in river surface turbulence measurements and water depth estimation. Flow Meas. Instrum. 2019, 67, 142–152. [Google Scholar] [CrossRef]
- Osorio-Cano, J.D.; Osorio, A.F.; Medina, R. A method for extracting surface flow velocities and discharge volumes from video images in laboratory. Flow Meas. Instrum. 2013, 33, 188–196. [Google Scholar] [CrossRef]
- Akbarpour, F.; Fathi-Moghadam, M.; Schneider, J. Application of LSPIV to measure supercritical flow in steep channels with low relative submergence. Flow Meas. Instrum. 2020, 72, 101718. [Google Scholar] [CrossRef]
- Naresh, A.; Naik, M.G. Experimental study on surface flow measurment using large scale particle image velocimetry technique. Environ. Sci. Technol. 2016, 2, 350. [Google Scholar]
- Mulassano, P.; Lo Presti, L. Object detection on the sea surface, based on texture analysis. In Proceedings of the ICECS’99. 6th IEEE International Conference on Electronics, Circuits and Systems, Paphos, Cyprus, 5–8 September 1999; Volume 2, pp. 855–858. [Google Scholar]
- Liu, X.; Wang, Y.; Peng, J. Design of online open channel flow monitoring system based on LSPIV. In Proceedings of the 2020 5th International Conference on Communication, Image and Signal Processing (CCISP), Chengdu, China, 13–15 November 2020; pp. 107–111. [Google Scholar]
- Zhang, Z.; Wang, X.; Fan, T.; Xu, L. River surface target enhancement and background suppression for unseeded LSPIV. Flow Meas. Instrum. 2013, 30, 99–111. [Google Scholar] [CrossRef]
- Rüssmeier, N.; Hahn, A.; Zielinski, O. Ocean surface water currents by large-scale particle image velocimetry technique. In Proceedings of the Oceans 2017—Aberdeen, Aberdeen, UK, 19–22 June 2017; pp. 1–10. [Google Scholar]
- Tauro, F.; Porfiri, M.; Grimaldi, S. Orienting the camera and firing lasers to enhance large scale particle image velocimetry for streamflow monitoring. Water Resour. Res. 2014, 50, 7470–7483. [Google Scholar] [CrossRef]
- Fujita, I.; Muste, M.; Kruger, A. Large-scale particle image velocimetry for flow analysis in hydraulic engineering applications. J. Hydraul. Res. 1998, 36, 397–414. [Google Scholar] [CrossRef]
- Creutin, J.D.; Muste, M.; Bradley, A.A.; Kim, S.C.; Kruger, A. River gauging using PIV techniques: A proof of concept experiment on the Iowa River. J. Hydrol. 2003, 277, 182–194. [Google Scholar] [CrossRef]
- Xia, R. Relation between mean and maximum velocities in a natural river. J. Hydraul. Eng. 1997, 123, 720–723. [Google Scholar] [CrossRef]
- Hauet, A.; Morlot, T.; Daubagnan, L. Velocity profile and depth-averaged to surface velocity in natural streams: A review over a large sample of rivers. E3S Web Conf. 2018, 40, 06015. [Google Scholar] [CrossRef]
- Genç, O.; Ardıçlıoğlu, M.; Ağıralioğlu, N. Calculation of mean velocity and discharge using water surface velocity in small streams. Flow Meas. Instrum. 2015, 41, 115–120. [Google Scholar] [CrossRef]
- Schweitzer, S.A.; Cowen, E.A. A method for analysis of spatial uncertainty in image based surface velocimetry. Front. Water 2022, 4, 744278. [Google Scholar] [CrossRef]
- Holland, K.T.; Holman, R.A.; Lippmann, T.C.; Stanley, J.; Plant, N. Practical use of video imagery in nearshore oceanographic field studies. IEEE J. Ocean. Eng. 1997, 22, 81–92. [Google Scholar] [CrossRef]
- Fujita, I. Discharge measurements of snowmelt flood by space-time image velocimetry during the night using far-infrared camera. Water 2017, 9, 269. [Google Scholar] [CrossRef]
- Le Coz, J.; Renard, B.; Vansuyt, V.; Jodeau, M.; Hauet, A. Estimating the uncertainty of video-based flow velocity and discharge measurements due to the conversion of field to image coordinates. Hydrol. Process. 2021, 35, e14169. [Google Scholar] [CrossRef]
- Liu, W.C.; Huang, W.C. Development of a triaxial accelerometer and large-scale particle image velocimetry (LSPIV) to enhance surface velocity measurements in rivers. Comput. Geosci. 2021, 155, 104866. [Google Scholar] [CrossRef]
- Le Coz, J.; Hauet, A.; Pierrefeu, G.; Dramais, B. Performance of image-based velocimetry (LSPIV) applied to flash-flood discharge measurements in Mediterranean rivers. J. Hydrol. 2010, 394, 42–52. [Google Scholar] [CrossRef]
- Tauro, F.; Olivieri, G.; Petroselli, A.; Profiri, M.; Grimaldi, S. Flow monitoring with a camera: A case study on a flood event in the Tiber river. Environ. Monit. Assess. 2016, 188, 118. [Google Scholar] [CrossRef] [PubMed]
- Higham, J.E.; Brevis, W. When, what and how image transformation techniques should be used to reduce error in Particle Image Velocimetry data? Flow Meas. Instrum. 2019, 66, 79–85. [Google Scholar] [CrossRef]
- Sharif, O. Measuring Surface Water Flow Velocities by a Drone and Large-Scale Particle Image Velocimetry (LSPIV); University of Twente: Enschede, The Netherlands, 2022. [Google Scholar]
- Huang, W.C.; Young, C.C.; Liu, W.C. Application of an automated discharge imaging system and LSPIV during typhoon events in Taiwan. Water 2018, 10, 280. [Google Scholar] [CrossRef]
- Muste, M.; Fujita, I.; Hauet, A. Large-scale particle image velocimetry for measurements in riverine environments. Water Resour. Res. 2008, 44, 1–14. [Google Scholar] [CrossRef]
- Bandini, F.; Lüthi, B.; Peña-Haro, S.; Borst, C.; Liu, J.; Karagkiolidou, S.; Hu, X.; Lemaire, G.G.; Bjerg, P.L.; Peter, B.G. A drone-borne method to jointly estimate discharge and Manning’s roughness of natural streams. Water Resour. Res. 2021, 57, e2020WR028266. [Google Scholar] [CrossRef]
- Zhang, M.; Zhang, L.; Zhao, C.; Jin, R.; Guo, J.; Li, X. Fetching Ecosystem Monitoring Data in Extreme Areas via a Drone-Enabled Internet of Remote Things. IEEE Internet Things J. 2022, 9, 25052–25067. [Google Scholar] [CrossRef]
- Zhang, M.; Li, X. Drone-enabled Internet-of-Things relay for environmental monitoring in remote areas without public networks. IEEE Internet Things J. 2020, 7, 7648–7662. [Google Scholar] [CrossRef]
- Li, X.; Zhao, N.; Jin, R.; Liu, S.; Sun, X.; Wen, X.; Wu, D.; Zhou, Y.; Guo, J.; Chen, S.; et al. Internet of Things to Network Smart Devices for Ecosystem Monitoring. Sci. Bull. 2019, 64, 1234–1245. [Google Scholar] [CrossRef]
- Li, X.; Feng, M.; Ran, Y.; Su, Y.; Liu, F.; Huang, C.; Shen, H.; Xiao, Q.; Su, J.; Yuan, S.; et al. Big Data in Earth System Science and Progress Towards a Digital Twin. Nat. Rev. Earth Environ. 2023, 4, 319–332. [Google Scholar] [CrossRef]
Disclaimer/Publisher’s Note: The statements, opinions and data contained in all publications are solely those of the individual author(s) and contributor(s) and not of MDPI and/or the editor(s). MDPI and/or the editor(s) disclaim responsibility for any injury to people or property resulting from any ideas, methods, instructions or products referred to in the content. |
© 2023 by the authors. Licensee MDPI, Basel, Switzerland. This article is an open access article distributed under the terms and conditions of the Creative Commons Attribution (CC BY) license (https://creativecommons.org/licenses/by/4.0/).