Article

Seasonal Variations of Modern Precipitation Stable Isotopes over the North Tibetan Plateau and Their Influencing Factors

1
State Key Laboratory of Tibetan Plateau Earth System, Environment and Resources (TPESER), Institute of Tibetan Plateau Research, Chinese Academy of Sciences, Beijing 100101, China
2
University of Chinese Academy of Sciences, Beijing 100049, China
3
Research Center of Applied Geology of China Geological Survey, Chengdu 610036, China
4
South-East Tibetan Plateau Station for Integrated Observation and Research of Alpine Environment, Linzhi 860119, China
5
College of Geographic Sciences, Shanxi Normal University, Taiyuan 030031, China
*
Author to whom correspondence should be addressed.
Water 2024, 16(1), 150; https://doi.org/10.3390/w16010150
Submission received: 22 November 2023 / Revised: 21 December 2023 / Accepted: 22 December 2023 / Published: 30 December 2023
(This article belongs to the Section Water and Climate Change)

Abstract

:
Based on 360 event-based precipitation samples collected at six stations on the North Tibetan Plateau (NTP) in 2019–2020, we analyzed the influence of meteorological parameters, sub-cloud evaporation, moisture sources, and moisture transmission pathways on precipitation and its seasonal variations. The results show that precipitation δ18O, δ2H, and d-excess values show obvious seasonal variations, being depleted in winter and enriched in summer. Although temperature is an important variable that affects the change in δ18O values of precipitation, the results of the sub-cloud evaporation effect and moisture tracing show that differences in moisture sources caused by seasonal changes in large-scale water moisture transport are an important cause of seasonal changes in δ18O and d-excess of precipitation at NTP. Depleted δ18O and enriched d-excess in winter represent the source of moisture transported by the westerlies from the Mediterranean area and Central Asia. Enriched δ18O and d-excess values in summer precipitation are related to the temperature effect. In addition, the meridional motion of the atmospheric flow has an effect on the precipitation isotope values in the NTP. When the meridional circulation is enhanced, the water vapour from low latitudes is easily transported northwards, enriching the summer precipitation isotope values in the central and eastern parts of the plateau. This provides a new insight into the explanation of stable oxygen isotopes in climate proxies across the westerlies-dominated Tibetan Plateau.

1. Introduction

Atmospheric precipitation is a crucial component of the hydrological cycle and a source of land surface water [1,2]. The changes of atmospheric precipitation is closely linked to the management and utilization of local water resources, extreme natural disasters and ecological and environmental problems in arid and semi-arid areas [3,4]. Due to the different atomic binding energies and diffusion rates of water molecules with different masses, the heavier (lighter) water molecules condense (evaporate) preferentially during the phase transition process, resulting in isotopic changes in precipitation that record the physical processes that can occur from the moisture source region to the raindrop region, such as evaporation of raindrops under clouds, mixing of moisture from different sources, and changes in local environmental conditions [5,6,7,8]. Understanding the dominant role of these factors in spatiotemporal variations in precipitation isotopes is crucial for correctly characterizing climate signals preserved in natural archives such as ice cores [9,10], tree rings [11,12,13], and lake sediments [11,14,15,16,17].
In recent decades, great strides have been made in investigating the environmental significance of stable isotope signals from water bodies on the Tibetan Plateau (TP) [18]. There is now a comprehensive understanding of the spatial and temporal distribution, as well as the primary controlling factors, of atmospheric precipitation stable isotopes over the TP, with the identification of three distinct models. The westerly mode predominates in the northern TP, influenced by the westerly circulation. This results in δ18O depletion in winter and enrichment in summer, indicating a significant temperature effect throughout the year [19,20]. The monsoon mode mainly occurs in the southern TP, governed by the monsoon circulation. The δ18O of precipitation is depleted in summer and is manifested as the amount effect, but subsequent studies have confirmed that the depleted δ18O is associated with the precipitation process and convective activity in both the local and source area during the water vapor transport process [21,22,23]. On an annual scale, the influence of the strength of upstream convective activity on precipitation isotopes in the TP is regulated by Walker Circulation and Monsoon Circulation. During La Niña events, intensified convective activities over the tropical Indo-Western Pacific Ocean led to a decrease in the condensation temperature of cloud tops, resulting in the transport of depleted water vapor to the plateau with the Indian Summer Monsoon (ISM) [24,25,26]. The transition mode mainly occurs in the central TP, which is characterized by the alternating control of the westerlies and the monsoon circulation, and, combined with sub-cloud evaporation and local water vapour recycling, precipitation isotope change is complicated [27,28].
Seasonal variations in precipitation-stable isotopes are explicable through moisture sources and regional environmental conditions [29,30,31]. Dansgaard introduced the concept of “deuterium surplus” (d-excess = δD-8δ18O) to signify ocean moisture source conditions, primarily influenced by sea surface temperature, relative humidity, and wind speed. The global mean d-excess value is 10‰ [32,33]. Generally, the high (low) d-excess value indicates continental (oceanic) sources of water vapor [34,35]. The d-excess value gradually increases from south to north in the TP, suggesting a decreasing influence of oceanic moisture sources. The ISM affects the spatial pattern of precipitation in the TP through two paths, with one entering directly from the southwest border and the other turning southeast from the southwest border and entering the plateau from the Brahmaputra Valley [24,36,37]. The spatial differences in precipitation isotope variation during pre-monsoon, monsoon outbreak, and monsoon retreat on the TP serve as indicators of the monsoon development. The ISM first arrives in the TP in the southeast (mid to late June) and progressively moves northwestward. Conversely, the time for monsoon retreat gradually becomes later from north to south of the TP [23,38,39,40]. Nevertheless, using the d-excess value to characterize moisture sources in precipitation relies on the assumption that d-excess remains constant during moisture transport, which contradicts the actual situation [41,42,43,44]. During the moisture transport process, the sub-cloud evaporation effect decreases the d-excess value, while the recirculated moisture increases the d-excess value [45,46,47]. Research on the influence of moisture sources on precipitation isotopes in the TP areas has predominantly concentrated on the southern TP [35,48,49] and the northeastern and western TP [19,50]. However, there is also interest in the far north, such as the Tianshan Mountains [2,51,52,53], with relatively few investigations on moisture sources in the north of the TP, where sub-cloud evaporation and continental recycling processes hold significance. Consequently, it is imperative to elucidate the impact of moisture sources, transport processes, and local environmental factors on precipitation to understand the mechanism governing regional precipitation isotopes.
The Northern Tibetan Plateau (NTP) (33° N~45° N, 75° E~100° E) is located in the central part of the Eurasian continent, with a general elevation exceeding 4000 m. It falls within the arid and semi-arid zone and is characterized by limited ocean moisture and reliance on westerly moisture transport, glacial meltwater, and local moisture recycling [54,55,56]. Several studies have established a positive correlation between stable isotopes of precipitation and temperature in this region [8,18,20,57]. With global warming, the NTP tends to be warmer and wetter, and evapotranspiration in the TP shows an upward trend during 1970–2015, particularly in the eastern and southern regions, as opposed to the northwestern region [58]. Furthermore, an evaluation of sub-cloud evaporation based on GNIP site data from 1960 to 2018 has revealed an escalating trend in the TP [7]. These changes, coupled with the expansion of lakes, reduction of the glacier area, permafrost degradation, extreme weather events, and growth of vegetation cover, will inevitably modify the water cycle pattern and impact the spatial and temporal variation characteristics of precipitation isotopes [28,59,60,61]. To comprehensively understand the seasonal variation of moisture sources and the relationship between stable isotopes and regional environmental conditions in the NTP, we collected one-year precipitation samples from six stations to investigate the seasonal variation of precipitation isotopes in diverse regions. Our study involved analyzing the controlling factors of the seasonal variation of precipitation stable isotopes, evaluating the impact of sub-cloud evaporation, employing the HYSPLIT model to trace the moisture source of precipitation, and elucidating the reasons for the seasonal variation of precipitation isotopes in different regions, as well as quantifying the contribution of the influencing factors.

2. Study Area

The study area spans the Northern Tibetan Plateau (NTP) and Tianshan mountains, covering 10 degrees in latitude and 25 degrees in longitude (Figure 1). Most sampling sites are situated in the alpine climate zone, which is characterized by elevations exceeding 3000 m above sea level, with alpine desert-steppe or alpine meadow terrain. The average annual temperature remains below 0 °C, while the precipitation amount range from 115 to 440 mm, primarily concentrated from May to October. The Tianshan (TS) region stands as a “wet island” within the arid and semi-arid northwest China, receiving an average annual rainfall of over 400 mm due to westerly winds transporting moisture along the east-west Oriental mountain range [52,62]. The Muztagh (MZTG) site in the Pamir region of the northwestern TP and Qilianshan station (QLS) in the northeastern TP endure westerly winds throughout the year, featuring a cold climate with average wind speeds surpassing 4.5 m/s, however, MZTG experiences lower precipitation and relative humidity compared to Qilianshan (refer to Supplementary Materials Table S1) [51,63,64]. Ngari (NL), Beiluhe (BLH), and Sanjiangyuan (SJY), which stretch from the western to the eastern plateau, lie approximately on the same latitudinal belt. NL is situated in the Maga grasslands, 10 km from Pangong Co, which is characterized by a cold and dry climate with an annual rainfall of 118.65 mm and a relative humidity of 29.88%, respectively. BLH is in the plateau’s hinterland and a permanent permafrost area [65,66], experiencing an annual wind speed of 4.23 m/s. SJY lies on the Indian monsoon margin, receiving an average annual rainfall exceeding 420 mm and is influenced by moisture from the Arabian Sea and Bay of Bengal during strong monsoon periods [67,68]. These six stations cover a wide geographical area, exhibiting diverse climatic and environmental conditions, leading to variations in the performance of precipitation isotopes across the region.

3. Data and Methods

3.1. Precipitation Sampling and Isotopes

A total of 360 precipitation samples were collected from six different stations (MZTG, NL, TS, BLH, QLS, and SJY) located at various coordinates in the years 2018–2020 (see Table S1 in Supplementary Materials). The precipitation samples were manually collected using a 30 cm diameter polyethylene funnel and stored in a 5 L polyethylene collection bottle. Following each precipitation event, rain or snow samples were drained through the funnel at the bottom of pre-cleaned polyethylene bottles. The polyethylene bottles and funnels were arranged at the onset of each rain event, and the collected water samples were subsequently transferred to 30 mL polyethylene bottles and stored at 4 °C in a refrigerator.
The hydrogen and oxygen stable isotope values of the 360 precipitation samples were analyzed using the Picarro-L2140i wavelength scanning optical cavity ring-down spectrometer at the State Key Laboratory of Tibet Plateau Earth System, Environment and Resources, Institute of Tibetan Plateau Research, Chinese Academy of Sciences. To ensure accuracy and reliability, two calibrated methods were employed. (1) Each sample and isotopic standard underwent seven sequential injections, discarding the first three injections due to memory effects. The arithmetic average of the last three injections constituted the final measured value. (2) Samples and standard isotopes were injected sequentially two and seven times, respectively. One standard sample was injected for every six samples, and at the end of the sample sequence, three standard samples were injected in descending order of their values. The average of the two values was selected as the final value, expressed as δ-values relative to V-SMOW (Equation (1)). The measurement accuracy for δ18O and δD was 0.05‰ and 0.5‰, respectively.
δ = R sample R standard R standard × 1000

3.2. Evaluation of Influence from Sub-Cloud Evaporation on δ18O Composition

Sub-cloud evaporation denotes the alteration in precipitation isotopes due to evaporation as raindrops descend from the cloud base to the ground through unsaturated air [69,70]. Over the past five decades, the sub-cloud evaporation effect of precipitation isotopes has garnered considerable attention in the cold and arid regions of China, particularly in the TP [7]. It is a multifaceted physical process influenced by various factors, including the distance from the cloud base to the ground, raindrop size, and air temperature and humidity [47,71]. In this study, the Stewart model is utilized to quantify the intensity of the sub-cloud evaporation effect, with the calculations detailed below [70,72]:
  d = d d c l o u d = 2 F 81 8 F
F = 1 γ α f n β 1
γ = α h 1 α ( D / D ) ( 1 h )
β = 1 α ( D / D ) ( 1 h ) α ( D / D ) ( 1 h )
where 2F and 18F in Equations (2) and (3) are the changes of 2H and 18O from the cloud base to the ground, respectively. 2γ, 18γ, 2β, and 18β are calculated using Equations (4) and (5). The parameters 2D/2D′, 18D/18D′, and n′ are 1.024, 1.029, and 0.58, respectively [69,73,74]. h represents the relative humidity, and nα represents the equilibrium fractionation factor under temperature control calculated using Equations (6) and (7), where T is the ambient temperature and the unit is K.
10 3 ln 2 α + = 1158.8 T 3 10 9 1620.1 T 2 10 6 + 794.84 T 10 3 161.04 + 2.9992 × 10 9 T 3
10 3 ln 1 8 α + = 7.685 + 6.7123 × 10 3 T 1.6664 × 10 6 T 2 + 0.35041 × 10 9 T 3
f in Equation (3) is expressed as the ratio between the mass of the raindrops falling on the ground (mg) and the sum of this variable with the mass of the evaporation loss below the cloud (mev) (Equation (8)). mev is equal to the product of the evaporation intensity (E) and the raindrop falling time (t) and is calculated using Equation (9). E is determined by two functions (A1, A2), where A1 is a function of temperature (°C) and raindrop diameter (cm) and A2 is a function of temperature (°C) and relative humidity (%). There are different A1 and A2 values under certain conditions, which can be obtained by bilinear interpolation [70].
f = m g m g + m e v
m e v = E t
E = A 1 T , R A 2 ( T , h )
The time taken for a raindrop to fall from the cloud base to the ground is determined by the height of the cloud base ( H c g (km)), which can be obtained from empirical Equation (12) and the final velocity of the raindrop (Vdrop(m/s)) [75].
Where Tave is the mean air temperature of the column of air between the lifting condensation height (LCL) and the ground, the unit is K. S0 and SLCL are the pressures of the ground and the LCL, respectively. SLCL is defined by Equation (13).
t = H c g / V d r o p
H c g = 18,400 1 + T a v e / 273 ln S 0 / S L C L
S L C L = S 0 ( T L C L / T 0 ) 3.5
T L C L = T d p ( 0.001296 T d p + 0.1963 ) ( T 0 T d p )
where T0 and TLCL are the air temperatures at the ground and LCL and Tdp is the dew point temperature of the ground. TLCL was calculated using the empirical Formula (14).
V d r o p = 9.58 e 0.0354 H c g 1 e R / 1.77 1.147 , 0.3 R < 6.0         1.88 e 0.0256 H c g 1 e R / 0.304 1.819 , 0.05 R < 0.3 28.40 R 2 e 0.0172 H c g , R < 0.05                                                                                  
Vdrop (m/s) is related to the falling height of the raindrops and the diameter of the raindrops (cm), which can be obtained from Equation (15).
D 50 = 0.69 1 / c A I q
c, A, and q are 2.25, 1.30, and 0.232, respectively, where D is the mean diameter of the raindrops calculated from Equation (16) and I is the rainfall intensity (mm·h−1).
m g = 4 3 π r e n d 3 ρ
Assuming that the raindrops falling on the ground are perfectly spherical, mg is calculated from Equation (17), where rend is the radius of the raindrop when it hits the ground and ρ is the density of water.

3.3. Back Trajectory Calculation

The Hybrid Single-Particle Lagrangian Integrated Trajectory (HYSPLIT) model, developed by the Air Resources Laboratory at the National Oceanic and Atmospheric Administration, is used to identify the moisture path and air parcel trajectories using NCEP/NCAR reanalysis data. Previous studies have shown that moisture absorption on the track occurs in a short period of time (less than 7 days) [76,77], whereas the average residence time of water moisture in the atmosphere is 10 days [78,79]. To accommodate the dry and high evaporation climatic conditions in the study area, the tracking time was set to 7 days. Given that the altitude of the study area ranges between 2000 and 4000 m, in order to capture the water vapor transport tracks at different altitudes as much as possible, operational heights in the model were defined as 100, 500, 1000, 1500, 2000, and 2500 m. Finally, cluster analysis was employed to clearly discern the direction and influence of moisture sources on precipitation isotopes, and the number of track clusters was determined based on the Total Spatial Variance (TSV) change diagram. The modifications enhanced the clarity, corrected the punctuation, and added more concise explanations to the paragraph while maintaining the academic style and improving the readability of the content.

3.4. Meteorological Data and Reanalysis Datasets

The meteorological data are predominantly sourced from automatic weather stations located near the sampling points, providing hourly readings of temperature, precipitation, relative humidity, wind speed, and air pressure. Reanalysis data driving the HYSPLIT model are obtained from the National Centers for Environmental Prediction (NCEP) and the National Center for Atmospheric Research (NCAR) in GDAS format, spanning from January 1948 to the present with a horizontal resolution of 2.5° × 2.5°. The data can be downloaded from https://www.esrl.noaa.gov/ (20 December 2022). Additionally, the daily values of dew point temperature (Tdp), air column mean temperature (Tmean), specific humidity (q), meridional wind speed (u), and zonal wind speed (v) are extracted from the ERA-Interim reanalysis results of the European Centre for Medium-Range Weather Forecasts (ECMWF), which are available at https://www.ecmwf.int/en/forecasts/datasets/browse-reanalysis-datasets (20 December 2022), with a horizontal resolution of 0.25° × 0.25°.

4. Results

4.1. Seasonal Variability of Precipitation Isotopes

The annual data were categorized into seasons including spring (MAM), summer (JJA), autumn (SON), and winter (DJF), as well as the winter half-year (October–April) and the summer half-year (May–September) (see Table S2 in Supplementary Materials). The study reported a range of precipitation δ18O values from −31.67‰ to 7.42‰, and precipitation δ2H values ranging from −253.34‰ to 80.25‰. The d-excess values varied between −40.77‰ and 32.07‰, with a mean of 11.49‰.
Figure 2 illustrates the seasonal variations of precipitation stable isotopes (δ18O, δD, and d-excess) at various sampling sites. The δ18O values in MZTG, NL, TS, BLH, QLS, and SJY range from −31.67‰ to 7.42‰, with mean values of −12.02‰, −9.25‰, −10.64‰, −8.58‰, −7.54‰, and −12.58‰, respectively. The lowest mean annual value is recorded at −12.58‰ in SJY, while the maximum is −7.54‰ in QLS. The precipitation isotope values observed in our study area fall within the global range of precipitation isotope variations, which typically span between −50‰ and 10‰. Additionally, the seasonal variation of precipitation isotopes at six stations exhibits a consistent pattern and is characterized by continuous depletion in winter and enrichment in summer. This observation aligns with previous studies on precipitation patterns within the predominant influence area of the westerlies [18,46,80,81,82].
The d-excess values at MZTG, NL, TS, BLH, QLS, and SJY stations range from −40.77‰ to 32.07‰, with mean values of 10.46‰, 10.5‰, 9.25‰, 9.29‰, 17.68‰, and 12.66‰, respectively. These results are comparable to those observed in adjacent areas, such as the Qinghai Lake Basin [19], the western Pamir Mountains [53], the Tianshan Mountains [74,83], the Qilian Mountains [27], and the northwestern TP [73]. The seasonal fluctuation of d-excess, though smaller than that of δ18O, still follows a pattern of being lower in the winter half and higher in the summer half, except at SJY and QLS stations. Despite this general trend, the d-excess value does not align with that of the ocean evaporation source [84,85,86] and remains highly sensitive to local evaporation [28,53,72]. The maximum d-excess at most stations (except for MZTG) occurs in SON, lagging behind the season of the maximum value of δ18O in JJA. This suggests that the increased air moisture from local surface water evaporation, soil, and plant transpiration in SON compared to the strong evaporation season of JJA, which correlates with the high temperature, may account for this phenomenon. Notably, the more consistent seasonal d-excess variation at SJY indicates that precipitation processes at this station are distinctively influenced by specific moisture source conditions and atmospheric properties compared to the other stations.

4.2. Spatial Variability of Precipitation Isotopes

The mean δ18O values of TS (−17.78‰), MZTG (−26.14‰), NL (−22.3‰), BLH (−16.51‰), and SJY (−16.4‰) in the winter half show a decreasing variation from north to south and an increasing variation from west to east, which is attributed to the gradual precipitation process resulting from moisture transported over long distances by the westerly wind. The lower mean δ18O values in DJF at MZTG (−28.8‰) and BLH (−22.09‰) compared to other stations may be associated with lower condensation temperatures at higher altitudes. In contrast, the δ18O values at both stations show higher values in JJA (MZTG: −3.48‰; BLH: −7.33‰) due to a more localized moisture cycle with rising temperatures, and the strong evaporation leads to the depletion of moisture in surface water, entering the atmosphere and participating in precipitation. Gui et al. suggest that recirculating vapor contributes more to the atmosphere at higher altitudes due to the weak sub-cloud evaporative effect [27]. Additionally, the δ18O value of JJA in SJY (−10.9‰) located at the edge of the monsoon with the most depleted moisture of the six stations may be influenced by the monsoon carrying the marine air mass. Sun and Wang used the FLEXPART model to trace the source of moisture in the headwaters of the three rivers and found that moisture from the Bay of Bengal and Arabia, carried by the southwest monsoon, and from the Pacific, carried by the East Asian monsoon, can reach this region during JJA [68].
The d-excess values of TS (9.98‰), MZTG (13.78‰), NL (13.2‰), BLH (9.43‰), and SJY (12.5‰) in the summer half-year decrease in fluctuation from south to north and from west to east. MZTG exhibits the highest annual mean d-excess (10.46‰), while QLS (17.68‰) and MZTG (3.5‰) record the maximal values in the summer and winter half-years, respectively. These trends suggest a gradual increase in recycled moisture in the NTP from south to north and from west to east during the summer. In the Qilian Mountains, the local moisture circulation is enhanced in summer with increasing altitude [87], and the altitude effect on the d-excess is more pronounced in the summer (0.8‰/m) than in the winter (0.3‰/m) [27]. The lower d-excess value observed at MZTG in the winter half-year may be due to two factors: (1) the smaller number of samples collected in winter results in low d-excess values that represent individual precipitation events; (2) the moisture trajectory at MZTG indicates that 19% of the moisture in DJF originates from the Arctic Ocean (see Section 5.2). An available study in the western part of the Pamirs confirms that the d-excess value of polar moisture varies between 4‰ and 10‰ and fluctuates around 4‰ in DJF [83].

4.3. Local Meteoric Water Line

The linear relationship for δ18O and δD in precipitation is represented by the Global Meteoric Water Line (GMWL), which originally was expressed as δD = 8δ18O + 10 [88]. This was revised in 1993 to δD = 8.17δ18O + 10.35 [89]. The slope of the line reflects the degree of O and H fractionation and is highly sensitive to evaporation from moisture sources [33], sub-cloud evaporation of droplets falling through unsaturated air columns [90,91,92], and the mixing of multiple moisture sources [22]. Furthermore, the local meteoric water line (LMWL) is tailored to indicate the variation of environmental elements in distinct geographical areas.
Figure 3 shows the atmospheric precipitation line at different locations using regression analysis. There is a significant linear relationship between δD and δ18O.
  • TS: δD = 7.97δ18O + 8.91 (R2 = 0.98, N = 56)
  • MZTG: δD = 8.41δ18O + 15.41 (R2 = 0.99, N = 31)
  • NL: δD = 8.59δ18O + 12.31 (R2 = 0.93, N = 41)
  • BLH:δD = 8.05δ18O + 9.74 (R2 = 0.97, N = 94)
  • QLS: δD = 8.51δ18O + 21.52 (R2 = 0.98, N = 49)
  • SJY: δD = 8.15δ18O + 14.52 (R2 = 0.99, N = 87)
Compared with GMWL, the slope and intercept of LMWL in TS are slightly lower than those of GMWL, while the slope of LMWL in BLH and SJY are close to that of the GMWL, but the intercepts are significantly different (BLH: 9.74, SJY: 14.52). The TS exhibits a lower slope and intercept, while the MZTG, NL, and SJY demonstrate greater values than the GMWL. The decreased slope suggests that precipitation in TS may have undergone more sub-cloud evaporation of raindrops. In contrast, the higher altitude and lower temperatures at the other stations promote a weaker effect of sub-cloud evaporation, potentially contributing to their higher slope and intercept values, which could be attributed to moisture sources and local recycling. Nevertheless, the LMWL obtained from annual data does not capture the variation across different seasons due to seasonal changes in moisture sources, transport patterns, and local meteorological conditions. Therefore, we analyzed the seasonal variability of the precipitation line equation at different stations.
Changes in the slope and intercept at the six sites can be categorized into three types on a seasonal scale, as detailed in Table S3 in the Supplementary Materials: (1) the slope and intercept are less than eight and ten, respectively; (2) both the slope and intercept are greater than eight and ten, respectively; and (3) the slope is less than eight while the intercept is greater than ten. The first type is only observed in JJA and SON at TS and MZTG, suggesting the presence of a sub-cloud evaporation effect. The second type is predominantly found in DJF and JJA at SJY, QLS, and BLH, which is potentially attributed to minimal sub-cloud evaporation and heightened ambient humidity, and in MAM at MZTG due to amplified local continental recycling. The third type is observed in SON at SJY and QLS and in JJA at MZTG and QLS. When the temperature exceeds 0 °C, the intercept of the LMWL rises as a result of plant growth, transpiration, and evaporation from water bodies, suggesting an intensified local moisture cycle [93]. The slope of the LMWL may be lower in JJA and SON within arid and semi-arid regions.

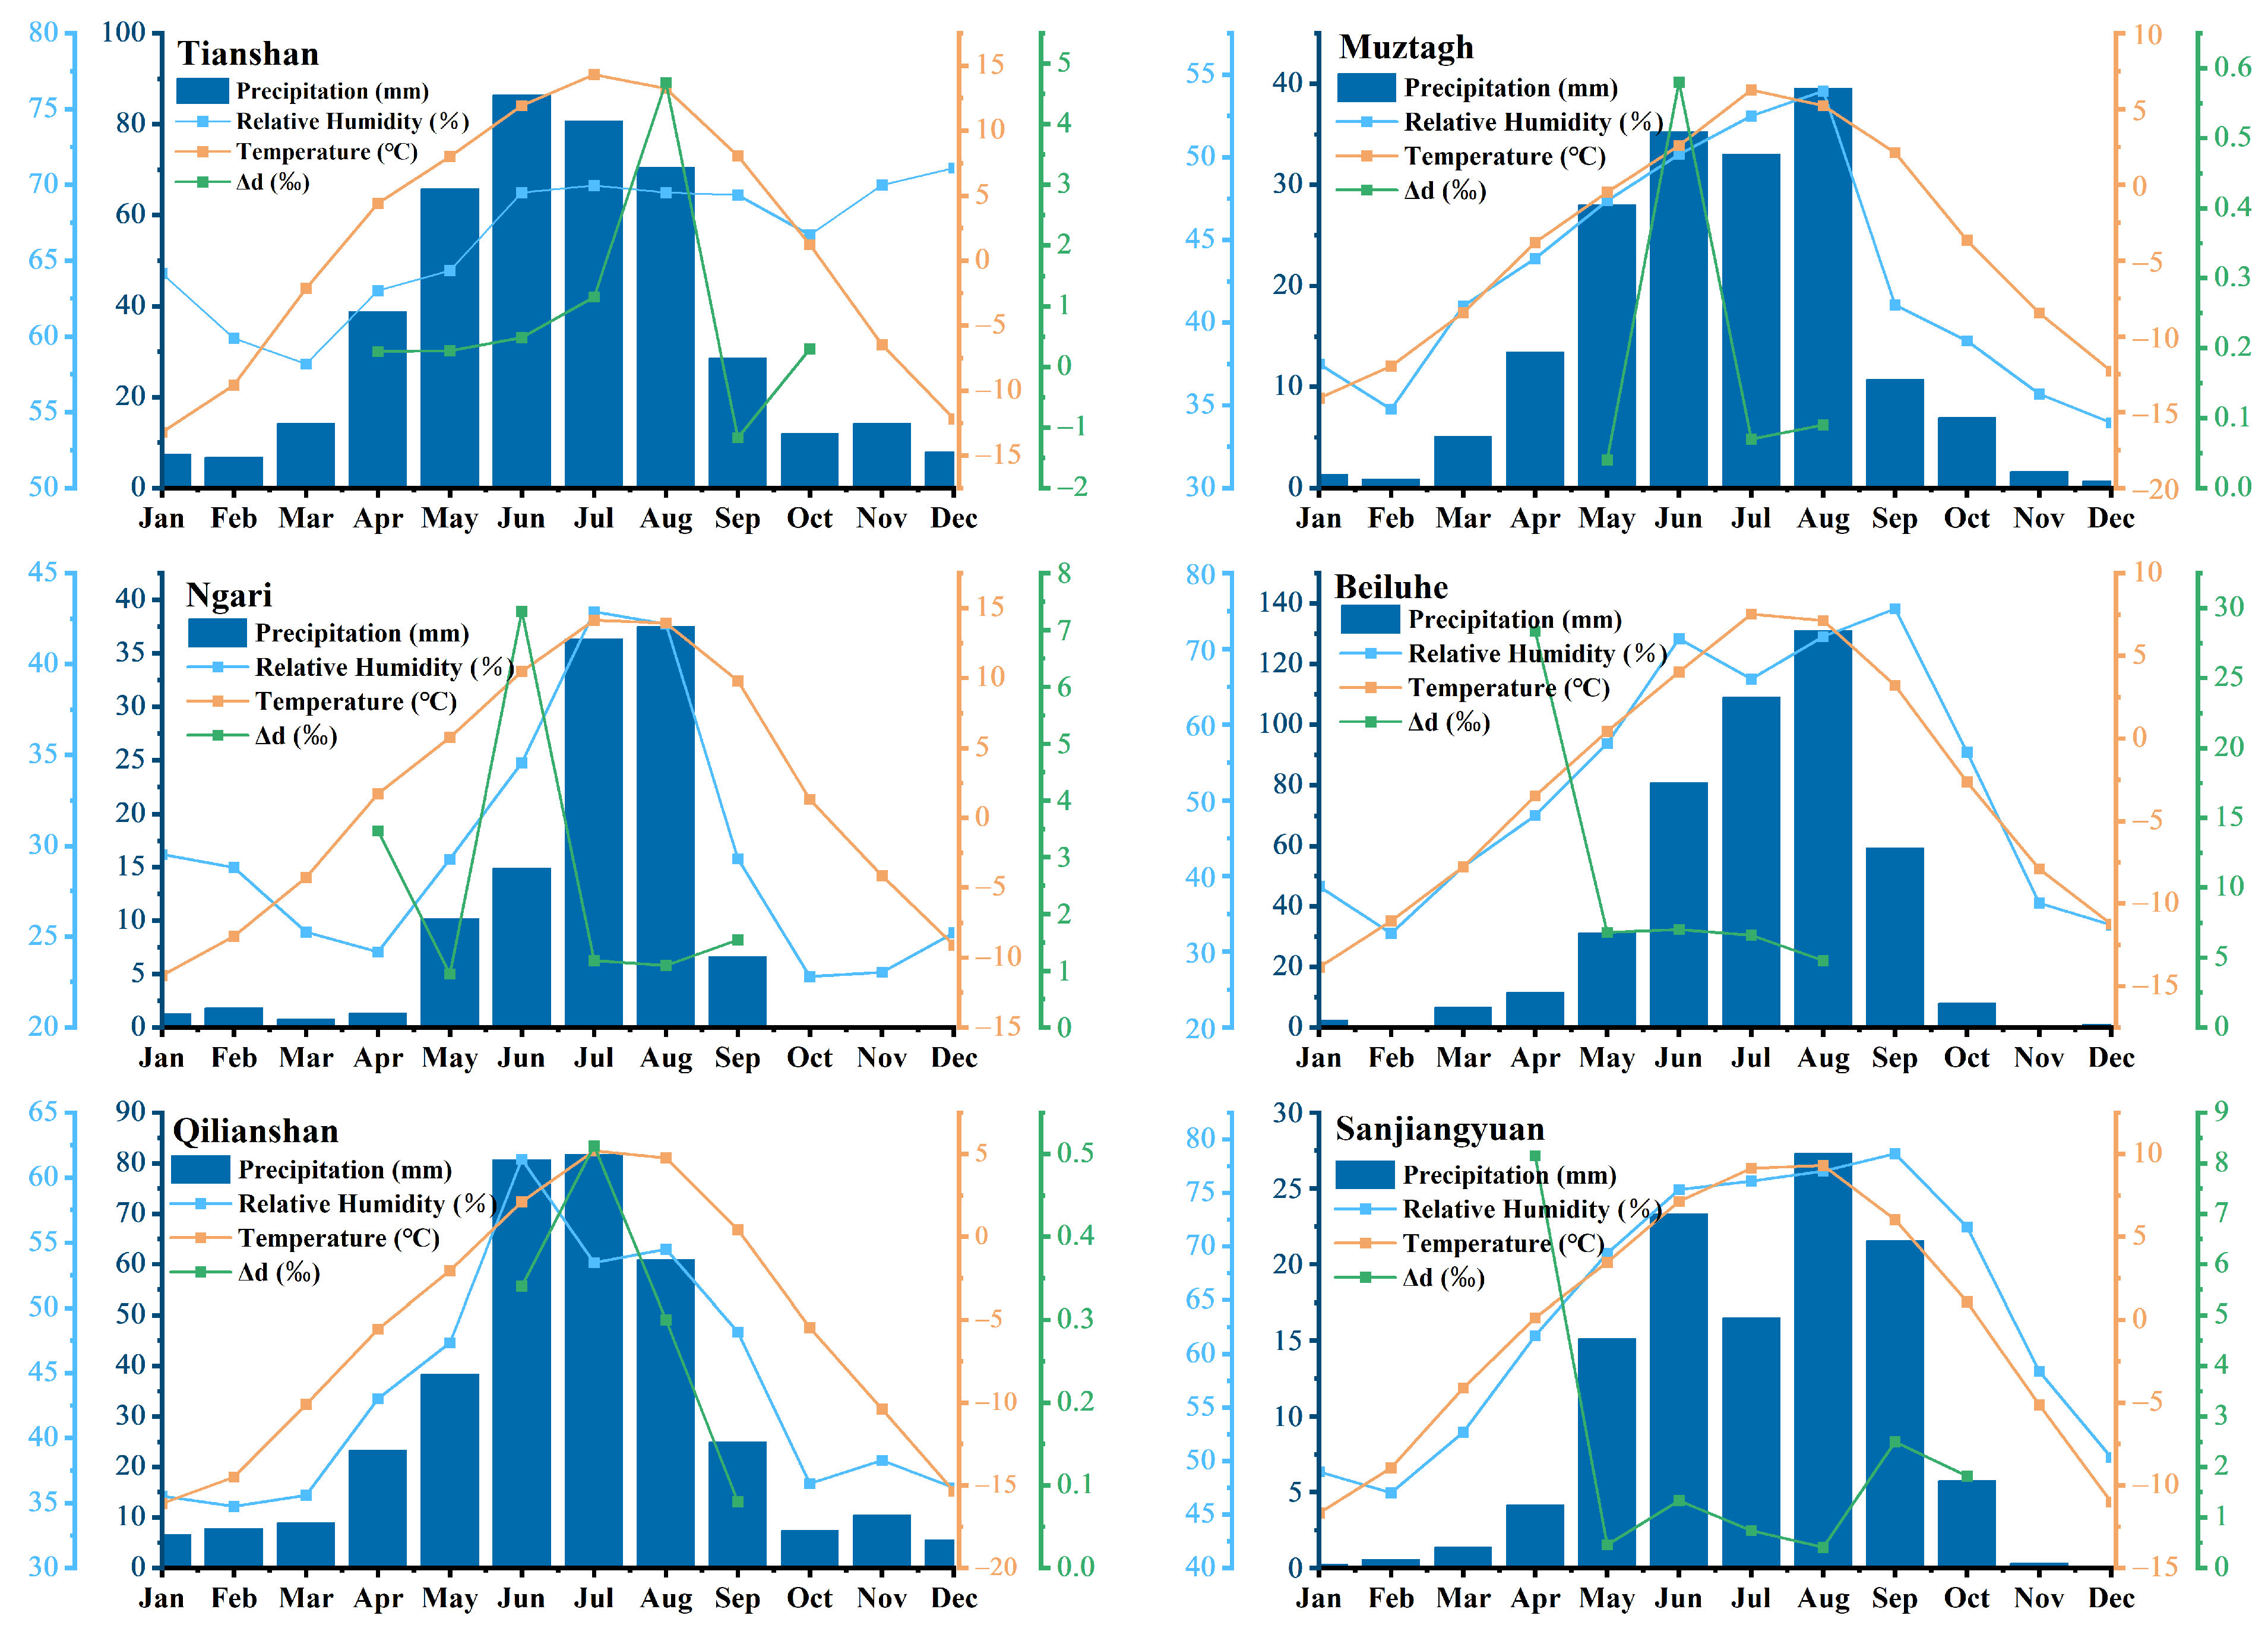
4.4. Seasonal Variation of d-excess from the Cloud Base to the Ground (Δd)

The variability in d-excess between the cloud base and the ground (Δd) reflects the strength of sub-cloud evaporation. A lower Δd value indicates more intense sub-cloud evaporation. According to the Stewart model, the monthly averages of the d-excess between the cloud base and the ground from April to October at different sites are calculated in Table 1.
Annually, the d-excess values of cloud base precipitation at TS, MZTG, NL, BLH, QLS, and SJY stations are 10.47‰, 18.63‰, 15.34‰, 19.24‰, 15.43‰, and 15.72‰, while the corresponding values for ground precipitation are 9.62‰, 18.43‰, 12.75‰, 8.53‰, 15.12‰, and 13.52‰, respectively. The monthly mean △d values at TS, MZTG, NL, BLH, QLS, and SJY are 0.85‰, 0.195‰, 2.59‰, 10.71‰, 0.31‰, and 2.20‰, suggesting weaker sub-cloud evaporation at BLH, NL, and SJY compared to TS, MZTG, and QLS. Throughout April to October, the Δd values at the TS station are 0.25‰, 0.26‰, 0.48‰, 1.15‰, 4.69‰, −1.17‰, and 0.29‰ for each month. The results indicated that the sub-cloud evaporation effect was stronger in April, May, June, September, and October at TS situated in the canyon area of the upper reaches of the Urumqi River, compared to July and August.
Precipitation events with temperatures below 0 °C from October to March may exhibit negligible sub-cloud evaporation. The stations included in this paper experienced precipitation events with temperatures above 0 °C concentrated from May to October, resulting in varying monthly trends in Δd, precipitation amount, relative humidity, and temperature (Figure 4). The Δd values at MZTG from May to August are 0.04‰, 0.58‰, 0.07‰, and 0.09‰, whereas those at QLS from June to September are 0.34‰, 0.51‰, 0.3‰, and 0.08‰. In comparison to MZTG and QLS, NL exhibited a more positive seasonal variation in Δd, ranging from 0.94‰ in May to 7.33‰ in July. BLH showed Δd values of 28.36‰, 6.8‰, 7.01‰, 6.59‰, 4.79‰, and −1.17‰ in April, May, June, July, August, and September, consecutively. According to Figure 4, the intensified sub-cloud evaporation effect in late spring is linked to a temperature increase, whereas in summer, it is influenced by the combination of high temperature and low humidity.
Hence, the sub-cloud evaporation effect in late spring and early summer at the NTP sites is stronger than that in late summer and early autumn, differing significantly from the northwestern region of China [70,94] and the Loess Plateau [95], where the most pronounced sub-evaporation effect occurs in spring. Meanwhile, the spatial variation of the d-excess at the cloud base exceeds that of the d-excess at the ground. This suggests that the cloud bases of these stations may have varying moisture sources, highlighting that precipitation isotopes are influenced not only by the sub-evaporation of raindrops but also by the mixing of diverse moisture sources.

4.5. Correlation between the Remaining Fraction of Raindrops (f) and Change in Δd

The relationship between Δd and the remaining fraction of raindrops (f) has been utilized to estimate the raindrop evaporation rate based on the d-excess value in precipitation. Sub-cloud evaporation is a complex physical process influenced by temperature, humidity, and raindrop size. For instance, a 5 °C rise in temperature can decrease Δd by 0.3 to 4.0‰, while a 10% increase in relative humidity can raise Δd by 1.1 to 10.3‰ [70]. Previous studies have indicated that this relationship exhibits variation across different regions, particularly in arid and semi-arid regions with low precipitation events [95], resulting in an underestimation of precipitation isotope values [96,97].
The relationships between f and Δd at six stations in the NTP are depicted in Figure 5, demonstrating a notable correlation. The correlation coefficients between f and Δd from May to September at NL and MZTG, which are relatively dry, are less than 1, indicating that a 1% increase in f results in Δd increases by 0.48‰ and 0.31‰, respectively. QLS and BLH are situated at an altitude exceeding 4000 m, and the average temperature from May to September does not exceed 8 °C. The correlation coefficients between f and Δd are also less than 1, with a 1% increase in f leading to Δd increasing by 0.33‰ and 0.63‰, respectively. Under the most humid environmental conditions in TS and SJY, the correlation coefficients between f and Δd are close to 1‰/1%, which is consistent with the European Alps [72], the TS Mountains, and the Hexi Corridor [98]. Our study indicates that the linear relationship between f and Δd is stronger under environmental conditions of relatively high humidity, high precipitation, and low temperature. However, the linear relationship of 1‰/1% between f and Δd is not universally applicable in cold and dry regions, potentially being significantly lower than this empirical relationship value in reality.

5. Discussion

5.1. Local Meteorological Variables and Precipitation Isotopes

The temporal and spatial variations of isotopes in precipitation are generally influenced by meteorological parameters, including local temperature, precipitation, relative humidity, atmospheric pressure, and wind speed. Table 2 illustrates the correlation between daily measurements of stable isotopes in precipitation and the meteorological parameters of temperature, precipitation, relative humidity, and wind speed at the six stations. On an annual scale, all six sites in our study demonstrate temperature effects, with slight variations in seasonal changes, which is consistent with previous findings. However, the correlation with relative humidity and precipitation did not achieve statistical significance. The δ18O of summer precipitation is negatively correlated with relative humidity only at QLS and SJY.

5.1.1. The Temperature Effect

Previous studies have confirmed that the temperature effect on precipitation isotopes is significant in the midlatitudes of the Northern Hemisphere [32,83,99,100,101]. In the western and northeastern areas of the Tibetan Plateau (TP) situated north of 30° N, the gradient in the relationship between temperature and precipitation oxygen isotope values exceeds 0.4‰/°C [102].
Except for NL, the other five stations exhibit a strong positive correlation between precipitation δ18O and temperature. Among them, the annual gradient of daily precipitation isotope and temperature at TS reaches 0.92‰/°C, surpassing the finding of Pang et al. (0.45‰/°C) [103], but resembling the results of Yao et al. (0.87‰/°C) [104]. The temperature gradient of the MZTG reaches 2.01‰/°C, exceeding that of global mid and high latitudes (0.55‰/°C) [89]. Precipitation isotopes in BLH and NL show a positive correlation with temperature on an annual scale, but they lack significance on a seasonal scale. SJY exhibits a temperature effect during the winter half-year and shows a negative correlation with relative humidity in JJA. QLS lacks winter samples, but δ18O in precipitation is positively correlated with summer temperature (0.59‰/°C), which is consistent with previous research [27].
To better quantify the impact of temperature effects on precipitation isotopes at each station, all precipitation samples are categorized into three groups based on temperature: (Ⅰ) T < 0 °C; (Ⅱ) 0 °C <T< 10 °C; and (Ⅲ) T >10 °C, and the findings are depicted in Figure 6. In range I, the precipitation isotopes of these stations display a significant positive correlation with temperature, except for NL, with the temperature effect being most notable at MZTG and TS. In range II, precipitation isotope values are unlikely to change with increasing temperature because the enriched isotope caused by the temperature effect is offset by the depleted isotope caused by the recirculated moisture from evaporation and transpiration. A striking feature of range III is that the δ18O increases and the d-excess decreases with increasing temperature, indicating the existence of a sub-cloud evaporation effect. This is supported by the negative correlation between the gradient of d-excess/T in this range (see Table S4 in Supplementary Materials).

5.1.2. The Precipitation Amount Effect

Most of the NTP stations receive relatively low precipitation, leading to a weak impact of precipitation amount on the precipitation isotope fraction. In our study, the correlations between precipitation isotopes and precipitation amount at the six stations do not yield statistically significant results at either the annual or seasonal scale. Previous studies have indicated that the influence of the precipitation amount is primarily evident in the monsoon region (south of 30° N) and the transition region (30~35° N) during the summer period [24,28,36,48]. Of the six stations included in this study, NL, BLH, and SJY are in the transition zone near the ISM boundary. They are affected by the winter westerlies, which tend to show a ‘temperature effect’ but demonstrate an ‘amount effect’ when there is an increase in rainfall under the enhanced conditions of the summer monsoon. Table 2 illustrates a negative correlation between precipitation isotopes and relative humidity during summer at SJY (r = −0.25, p < 0.05) and QLS (r = −0.15, p < 0.05), indicating that the moisture carried by the monsoon contributes to a more humid regional environment.

5.2. Backward Trajectory and Precipitation Isotopes

The Indian Summer Monsoon (ISM) and the westerlies are the two major atmospheric currents that influence the TP, resulting in precipitation-stable isotopes showing three domains (e.g., the westerlies domain, the monsoon domain, and the transition domain) [18]. In general, δ18O in precipitation associated with the westerlies show depleted characteristics due to long-distance precipitation processes and low temperatures, while d-excess is more enriched compared to monsoon-derived moisture. Nevertheless, multiple evaporation–condensation processes and local meteorological conditions during the transfer process may obscure the characteristic signal of the moisture source, causing regional precipitation isotopes to exhibit unique characteristics.
The HYSPLY model is employed to reconstruct the movement paths of moisture during precipitation events at six stations in NTP. The trajectories were clustered at various altitudes based on the seasons. In the case of NL, MZTG, and QLS, there are few samples in DJF, and these trajectories are clustered in MAM, JJA, and SON. The corresponding results are presented in Figure 7 and Figure 8.

5.2.1. Stations Mainly Dominated by the Westerlies

The primary moisture sources of TS and MZTG are transported by the westerlies from northern Europe (NE), the Mediterranean Sea (MS), and the Arabian Peninsula (AP), as well as from the Arctic Ocean (AO) and neighboring central Asia (CA). During the DJF at TS, moisture originated from the westerlies, with contributions from NE (31%), MS (12%), and the Arabian Sea (AS) (19%), while moisture from AO and CA accounted for 13% and 26%, respectively. The average δ18O and d-excess in precipitation were −25.44‰ and 0.01‰, respectively. During MAM, the moisture transported from NE, MS, and AS gradually decreased from 62% to 46%, while the moisture from CA increased to 45%. Consequently, the δ18O and d-excess values gradually enriched to −14.39‰ and 10.86‰, respectively. During JJA, 16% of the moisture originated from the AO, 34% from the westerly pathway, and 50% from CA, leading to an enrichment of δ18O in precipitation to −4.72‰, while the d-excess decreased to 8.65‰. In SON, 8% of the moisture originated from the MS, 15% from the North Atlantic (NA), and 77% from CA, resulting in a decrease in precipitation δ18O to −10.95‰, while the d-excess was 12.01‰ due to increased moisture from the surrounding area.
The moisture source of MZTG is similar to that of TS, with distinct seasonal variations. During MAM, moisture was transported from NE (8%), the NA (10%), MS (16%), CA (45%), and the polar area (19%). Nearly half of the westerly path’s moisture originated from CA. The precipitation values were −21.1‰ for δ18O and 6.76‰ for d-excess. During JJA and SON, the composition of moisture sources remained largely similar to MAM, with an increased proportion of moisture from CA. In DJF, the NA exhibits high surface relative humidity and low temperature, resulting in a low d-excess value of the transported moisture due to the weak dynamic fractionation effect.
At the local scale, the precipitation d-excess value at TS decreased in JJA due to rising temperatures and the sub-cloud evaporation effect. The seasonal variation of precipitation isotopes and moisture source at MZTG was consistent with that at TS, and the mean annual d-excess closely resembled that of Wuqia (12.9‰) in the western Tianshan Mountains. However, during the winter half-year, the d-excess value was only 3.5‰ at MZTG, in contrast to 8.02‰ at TS. This discrepancy was attributed to 19% of the precipitation at MZTG originating from polar moisture (PM) in MAM, indicated by trajectory clustering analysis, with the d-excess value of PM ranging from 4‰ to 5‰ [105]. During the summer half-year, the d-excess value was 9.98‰ at TS, contrasting with the 13.78‰ at MZTG. During JJA at MZTG, 49% of the moisture came from CA, and 19% was from the Xinjiang region, resulting in a high d-excess value attributed to local recirculation.

5.2.2. Stations in the Transition Zone between the Westerlies and India Summer Monsoon

NL and BLH are situated in a transition zone influenced by both the ISM and the westerlies. In MAM, the westerlies brought moisture to NL from the NA, MS, AP, and the adjacent continental areas, accounting for 17%, 28%, 14%, and 41%, respectively, with mean δ18O and d-excess values in precipitation of −18.6‰ and 12.7‰, respectively. During JJA, the proportions of moisture from the Indian Ocean (IO), North Indian Peninsula (NIP), and Northwest China (NWCA) were 5%, 46%, and 31%, respectively, resulting in enriched mean δ18O values of −7.09‰, while d-excess remained stable at 12.4‰. In SON, moisture proportions from the Bay of Bengal (BOB), CA, and the westerly path were 10%, 61%, and 29%, respectively. The precipitation moisture from the IO exhibited depleted isotopic characteristics, exemplified by the δ18O values of 19 August and 30 September, which were significantly lower than the monthly JJA (−7.09‰) and SON (−9.58‰) averages.
In DJF at BLH, westerlies transported 37% of the total precipitation from NA, MS, and AS, with moisture from neighboring continents and the south of TP constituting 16% and 47%, respectively. The mean values of δ18O and d-excess in precipitation were −22.09‰ and 6.29‰, respectively. During MAM, the moisture transport path at BLH remained mostly stable, with the proportion from the neighboring mainland increasing to 53%, including 12% of the moisture from the NIP. The mean values of δ18O and d-excess in precipitation were −11.94‰ and 4.62‰, respectively. The increase in the mean δ18O of precipitation from −22.0 ‰ in DJF to −11.94 ‰ in MAM could not be solely attributed to the temperature effect. Therefore, the higher δ18O in precipitation might be linked to continental moisture. In addition to seasonal variation in moisture sources, the higher mean δ18O values at NL and BLH in JJA and SON compared to DJF and MAM could be attributed to enhanced local recycling and the sub-cloud evaporation effect.
The primary sources of moisture for SJY and QLS include the NA, MS, AP, and CA transported by the westerlies, and moisture from NIP and the BOB carried by ISM. Moisture from the MS and AP is linked to higher d-excess values in precipitation, while moisture from NIP and BOB is associated with lower d-excess values. Conversely, the d-excess value in CA is typically lower than that from MS due to multiple evaporation and condensation processes during transportation. During DJF, the primary moisture sources at SJY included NA (18%), MS (18%), AP (28%), and NWCA (36%). The mean values of δ18O and d-excess in precipitation were −18.2‰ and 13.8‰, respectively. During MAM, a reduced amount of moisture is transported by the westerlies, principally from MS and AP. The remaining 43% of precipitation moisture originates from NWCA, with mean δ18O and d-excess values of −11.9‰ and 13.4‰, respectively. During JJA, under the influence of monsoon activity, 4% and 8% of the SJY precipitation’s moisture originated from NIP and BOB, respectively. The proportion of moisture from NWCA decreased to 27%, with 48% of the moisture coming from Inner Mongolia (IM) in northern China, likely due to the influence of the East Asian monsoon. The mean values of δ18O and d-excess in precipitation were −9.89‰ and 11.6‰, respectively. During SON, the westerlies’ intensity increased and the monsoon influence gradually weakened; however, moisture from NWCA remained dominant. The mean values of δ18O and d-excess in precipitation were −16.4‰ and 14‰, respectively, during this period.
During MAM, the MS, CA, and PM contributed 6%, 61%, and 33% of the moisture at QLS, respectively. The average values of δ18O and d-excess in precipitation were −11.36‰ and 11.78‰, respectively. During JJA, the proportion of moisture transported by PM decreased, while the contribution from NWCA increased, resulting in a mean δ18O and d-excess in precipitation of −6.9‰ and 18.08‰, respectively. During SON, the proportion of moisture from NA increased from 9% to 25%, with the majority of the remaining moisture originating from CA, NWCA, and IM, resulting in a mean δ18O and d-excess in precipitation of −9.89‰ and 17.99‰, respectively. The trend of d-excess variation in precipitation in SJY during MAM (13.4‰), JJA (11.6‰), and SON (14‰) was at odds with that of QLS during MAM (11.78‰), JJA (18.08‰), and SON (17.99‰), suggesting differing mechanisms at play in different seasons. In September, the enriched δ18O and d-excess values were primarily influenced by a greater contribution of local recirculated moisture, while the depleted δ18O and d-excess in SON resulted from mixed moisture originating from IM. The fluctuation trend of d-excess at the cloud base in SJY gradually decreased from April to July but increased from July to October. This pattern aligns with the seasonal variation of the moisture source, transitioning from westerlies in DJF to enhanced local continental recycling from MAM to JJA.

5.3. Moisture Flux and Wind Field with Precipitation Isotopes

The moisture flux represents the intensity of moisture transport, which is defined as the mass of moisture flowing through a unit area per unit of time. Typically, it is combined with the wind field to pinpoint the moisture source. The trajectory of the air mass gives a broad indication of the water source direction rather than an exact determination. Utilizing ERA5 reanalysis data, specific humidity, meridional, and zonal wind speeds were used to calculate the moisture flux at 850 hPa for October, January, April, and July of 2018 to 2020.
Figure 9 and Figure 10 illustrate that the westerlies and the ISM predominantly governed the moisture transport, displaying varying spatial patterns across seasons. From October to April, a high-pressure ridge at 80–90°E over the TP predominated, causing the westerlies to carry cold and dry air, leading to decreased moisture content during DJF. The prevailing Indian low-pressure systems from July to October led to the ISM bringing warm moisture from the southeastern edge of the TP into the plateau’s interior. The blocking effect of the Tanggula Mountains restricted the influx of moisture into the plateau’s interior, resulting in amplified rainfall across the entire plateau. Additionally, a small amount of rainfall was brought by the East Asian monsoon in October, extending to the eastern part of the plateau.
Seasonal variations in moisture flux demonstrate the impact of westerly intensity and the ISM on the isotopic composition of precipitation at NTP. This study conducts a correlation analysis between the isotopic data of precipitation from May to September at NL, BLH, and SJY, and the meridional and zonal wind speeds at 850 hPa, 500 hPa, and 300 hPa over the study area from 1948 to 2020, to investigate the influence of the meridional position and the strength of the westerlies on the precipitation isotopes. This analysis is depicted in Figure 11. The isotopic composition of summer precipitation at NL and BLH exhibits a negative correlation with the meridional wind speed, with this correlation gradually weakening with increasing distance and altitude. Notably, it weakly shows a positive correlation with the meridional wind speed at the 300 hPa level in BLH. Strengthening of the meridional circulation leads to a depletion of precipitation isotopes at NL and BLH. Moving from west to east, the correlation between summer precipitation isotopes and meridional wind speed at NL, BLH, and SJY transitions from negative to positive, with this positive correlation being particularly significant in the southeastern and eastern regions of the TP. Enhanced meridional circulation facilitates the northward transportation of moisture from the low-latitude Indian Ocean, consequently influencing the isotopic composition of precipitation in the SJY.
We conducted a correlation analysis between precipitation isotopes and zonal wind speeds at the three stations during the summer season, as shown in Figure 12. The findings reveal that precipitation isotopes at NL exhibit a weak negative correlation with zonal wind speed, whereas those at BLH and SJY demonstrate a distinct positive correlation with zonal wind speed. The notable positive correlation between precipitation isotopes and zonal wind within the 25–30° N range suggests that the strengthening westerlies drive the eastward movement of the southerly wind, consequently leading to a higher enrichment of precipitation isotopes in summer compared to DJF at BLH and SJY.

6. Conclusions

In this study, we analyzed the seasonal variations of the precipitation isotope values at six stations in the NTP and highlighted the impact of the sub-cloud evaporation effect and moisture source on the δ18O values in precipitation. The main local meteorological factor affecting the isotopic signature of precipitation is air temperature, which is consistent with previous findings about temperature effects in this region, but the negative correlation between precipitation δ18O and relative humidity at SJY and QLS indicates that moisture brought by the summer monsoon is the reason for the depletion of δ18O compared to other stations. In addition, the sub-cloud evaporation effect is widespread in the NTP, and the effect is more obvious in late spring and early summer, but the linear correlation coefficient between f and Δd is found to be close to 1‰/% only at SJY and TS, which is not consistently observed at other cold and arid stations. Therefore, simply applying the slope of 1‰/% to describe the evaporation process under the cloud may result in significant errors, which should be approached with caution in practical applications.
Local meteorological factors can only explain part of the seasonal variation of precipitation isotopes; the moisture source tracing indicates that variations in large-scale moisture transport significantly contribute to seasonal fluctuations in δ18O and d-excess levels in NTP’s precipitation. During winter, the depletion of δ18O and the enrichment of d-excess signify the long-distance transportation of moisture by the westerly winds, and the depletion of d-excess is linked to Arctic moisture. Continental water sources, including those from central Asia and Northwest China, contribute significantly to annual precipitation events and bring more enriched moisture compared to oceanic sources from the Atlantic and Arctic Oceans. Moisture sources at various stations during JJA are intricate; the enrichment of δ18O and d-excess values in precipitation is linked to the temperature effect and the reinforcement of local continental recycling.
Interestingly, we found that the precipitation isotopes exhibit a negative correlation with meridional wind speed, which gradually weakens with greater distance and altitude at NL and BLH. Moving from west to east, the correlation between summer precipitation isotopes and meridional wind speed shifts from negative to positive at NL, BLH, and SJY. This suggests that the meridional shift of the westerly winds impacts the precipitation isotope values in the NTP. With the strengthening of meridional circulation, enriched moisture from low latitudes is readily transported northwards, thereby enriching the isotopic values of summer precipitation in the central and eastern plateau areas. This provides an up-to-date reference for the explanation of stable oxygen isotopes in climate proxies across the westerlies-dominated Tibetan Plateau.

Supplementary Materials

The following supporting information can be downloaded at: https://www.mdpi.com/article/10.3390/w16010150/s1; Table S1: The locations, meteorological conditions from 2014 to 2020 and sampling periods of atmospheric precipitation samples; Table S2: Isotopic composition of precipitation δ18O and d-excess at the sampling sites; Table S3: Seasonal variation of slopes and intercepts of LWMLs at different sites over the north Tibetan Plateau; Table S4: The isotopic temperature effect of different temperature ranges at the northern Tibetan Plateau (Range I: below 0 °C, Range II: from 0 to 10 °C, Range III: above 10 °C).

Author Contributions

All authors listed have contributed substantially to the manuscript. Conceptualization, L.Z.; methodology and data analyses, H.Z.; sampling organization and design, L.L. and J.L.; resources, L.Z.; writing—original draft preparation, H.Z.; writing—review and improving, L.Z. All authors have read and agreed to the published version of the manuscript.

Funding

The research is supported by National Natural Science Foundation of China (NSFC) (41831177), the Second Tibetan Plateau Scientific Expedition and Research (STEP) (2019QZKK0202), and the Chinese Academy of Sciences (CAS) (XDA20020100).

Data Availability Statement

The data presented in this study are available on request from the corresponding author. The data are not publicly available because the data has not yet been published.

Acknowledgments

The authors thank the staff in the mentioned stations for helping with the collection of precipitation samples and providing meteorologic data.

Conflicts of Interest

There are no conflicts of interest to declare.

References

  1. Aeschbach-Hertig, W.; Gleeson, T. Regional strategies for the accelerating global problem of groundwater depletion. Nat. Geosci. 2012, 5, 853–861. [Google Scholar] [CrossRef]
  2. Wang, Y.; Chen, Y.; Li, W. Temporal and spatial variation of water stable isotopes (18O and 2H) in the Kaidu River basin, Northwestern China. Hydrol. Process. 2014, 28, 653–661. [Google Scholar] [CrossRef]
  3. Chen, J.; Tang, C.; Sakura, Y.; Kondoh, A.; Shen, Y. Groundwater flow and geochemistry in the lower reaches of the Yellow River: A case study in Shandang Province, China. Hydrogeol. J. 2002, 10, 587–599. [Google Scholar] [CrossRef]
  4. Banda, L.C.; Rivett, M.O.; Kalin, R.M.; Zavison, A.S.K.; Phiri, P.; Chavula, G.; Kapachika, C.; Kamtukule, S.; Fraser, C.; Nhlema, M. Seasonally Variant Stable Isotope Baseline Characterisation of Malawi’s Shire River Basin to Support Integrated Water Resources Management. Water 2020, 12, 1410. [Google Scholar] [CrossRef]
  5. Crawford, J.; Hughes, C.E.; Parkes, S.D. Is the isotopic composition of event based precipitation driven by moisture source or synoptic scale weather in the Sydney Basin, Australia? J. Hydrol. 2013, 507, 213–226. [Google Scholar] [CrossRef]
  6. Pu, T.; Kong, Y.; Wang, S.; Shi, X.; Wang, K.; Niu, H.; Chen, P. Modification of stable isotopes in snow and related post-depositional processes on a temperate glacier of Mt. Yulong, southeast Tibetan Plateau. J. Hydrol. 2020, 584, 124675. [Google Scholar] [CrossRef]
  7. Wang, S.; Jiao, R.; Zhang, M.; Crawford, J.; Hughes, C.E.; Chen, F. Changes in Below-Cloud Evaporation Affect Precipitation Isotopes During Five Decades of Warming Across China. J. Geophys. Res. Atmos. 2021, 126, e2020JD033075. [Google Scholar] [CrossRef]
  8. Yu, W.; Yao, T.; Tian, L.; Ma, Y.; Ichiyanagi, K.; Wang, Y.; Sun, W. Relationships between δ18O in precipitation and air temperature and moisture origin on a south–north transect of the Tibetan Plateau. Atmos. Res. 2008, 87, 158–169. [Google Scholar] [CrossRef]
  9. Wang, N.; Jiang, X.; Thompson, L.; Davis, M. Accumulation Rates over the Past 500 Years Recorded in Ice Cores from the Northern and Southern Tibetan Plateau, China. Arct. Antarct. Alp. Res. 2007, 39, 671–677. [Google Scholar] [CrossRef]
  10. Thompson, L.G.; Mosley-Thompson, E.; Davis, M.E.; Bolzan, J.F.; Dai, J.; Yao, T.; Gundestrup, N.; Wu, X.; Klein, L.; Xie, Z. Holocene—Late Pleistocene Climatic Ice Core Records from Qinghai-Tibetan Plateau. Science 1989, 246, 474. [Google Scholar] [CrossRef]
  11. Wernicke, J.; Hochreuther, P.; Grießinger, J.; Zhu, H.; Wang, L.; Bräuning, A. Multi-century humidity reconstructions from the southeastern Tibetan Plateau inferred from tree-ring δ18O. Glob. Planet. Change 2017, 149, 26–35. [Google Scholar] [CrossRef]
  12. Liu, Y.; Ren, M.; Li, Q.; Song, H.; Liu, R. Tree-ring δ18O-based July–August relative humidity reconstruction on Mt. Shimen, China, for the last 400 years. Atmos. Res. 2020, 243, 105024. [Google Scholar] [CrossRef]
  13. Wang, L.; Liu, Y.; Li, Q.; Song, H.; Cai, Q. Tree-ring oxygen isotope recorded precipitation variations over the past two centuries in the northeast Chinese Loess Plateau. Int. J. Climatol. 2022, 42, 5796–5806. [Google Scholar] [CrossRef]
  14. Aggarwal, P.K.; Fröhlich, K.; Kulkarni, K.M.; Gourcy, L.L. Stable isotope evidence for moisture sources in the asian summer monsoon under present and past climate regimes. Geophys. Res. Lett. 2004, 31. [Google Scholar] [CrossRef]
  15. Gimeno, L.; Stohl, A.; Trigo, R.M.; Dominguez, F.; Yoshimura, K.; Yu, L.; Drumond, A.; Durán-Quesada, A.M.; Nieto, R. Oceanic and terrestrial sources of continental precipitation. Rev. Geophys. 2012, 50. [Google Scholar] [CrossRef]
  16. Karim, A.; Veizer, J. Water balance of the Indus River Basin and moisture source in the Karakoram and western Himalayas: Implications from hydrogen and oxygen isotopes in river water. J. Geophys. Res. Atmos. 2002, 107, ACH 9-1–ACH 9-12. [Google Scholar] [CrossRef]
  17. Li, X.; Zhou, X.; Liu, W.; Fan, G.; Cheng, P.; Xu, L. Oxygen isotopic composition of bulk carbonates in recent sediments from Lake Kuhai (NW China) and implications for hydroclimatic changes in headwater areas of the Yellow River on the northeastern Tibetan Plateau. J. Asian Earth Sci. 2017, 134, 150–159. [Google Scholar] [CrossRef]
  18. Yao, T.; Masson-Delmotte, V.; Gao, J.; Yu, W.; Yang, X.; Risi, C.; Sturm, C.; Werner, M.; Zhao, H.; He, Y.; et al. A review of climatic controls on δ18O in precipitation over the Tibetan Plateau: Observations and simulations. Rev. Geophys. 2013, 51, 525–548. [Google Scholar] [CrossRef]
  19. Cui, B.; Li, X. Stable isotopes reveal sources of precipitation in the Qinghai Lake Basin of the northeastern Tibetan Plateau. Sci. Total Environ. 2015, 527–528, 26–37. [Google Scholar] [CrossRef]
  20. Yao, J.; Liu, X.; Hu, W. Stable isotope compositions of precipitation over Central Asia. PeerJ 2021, 9, e11312. [Google Scholar] [CrossRef]
  21. Duan, K.Q.; Wang, N.L.; Pu, J.C. Events of abrupt change of Indian monsoon recorded in Dasuopu ice core from Himalayas. Chin. Sci. Bull. 2002, 47, 691–696. [Google Scholar] [CrossRef]
  22. Kurita, N.; Yamada, H. The Role of Local Moisture Recycling Evaluated Using Stable Isotope Data from over the Middle of the Tibetan Plateau during the Monsoon Season. J. Hydrometeorol. 2008, 9, 760–775. [Google Scholar] [CrossRef]
  23. Ren, W.; Tian, L.; Shao, L. Regional moisture sources and Indian summer monsoon (ISM) moisture transport from simultaneous monitoring of precipitation isotopes on the southeastern and northeastern Tibetan Plateau. J. Hydrol. 2021, 601, 126836. [Google Scholar] [CrossRef]
  24. Gao, J.; He, Y.; Masson-Delmotte, V.; Yao, T. ENSO Effects on Annual Variations of Summer Precipitation Stable Isotopes in Lhasa, Southern Tibetan Plateau. J. Clim. 2018, 31, 1173–1182. [Google Scholar] [CrossRef]
  25. Cai, Z.Y.; Tian, L.D.; Bowen, G.J. ENSO variability reflected in precipitation oxygen isotopes across the Asian Summer Monsoon region. Earth Planet. Sci. Lett. 2017, 475, 25–33. [Google Scholar] [CrossRef]
  26. Cai, Z.Y.; Tian, L.D.; Bowen, G.J. Influence of Recent Climate Shifts on the Relationship Between ENSO and Asian Monsoon Precipitation Oxygen Isotope Ratios. J. Geophys. Res.-Atmos. 2019, 124, 7825–7835. [Google Scholar] [CrossRef]
  27. Gui, J.; Li, Z.; Feng, Q.; Yuan, R.; Ning, T.; Zhang, B.; Xue, J.; Gao, W.; Nan, F.; Ding, W.; et al. Environmental effect and spatiotemporal pattern of stable isotopes in precipitation on the transition zone between the Tibetan Plateau and arid region. Sci. Total Environ. 2020, 749, 141559. [Google Scholar] [CrossRef]
  28. Zhang, T.; Zhang, Y.; Gun, Y.; Ma, N.; Dai, D.; Song, H.; Qu, D.; Gao, H. Controls of stable isotopes in precipitation on the central Tibetan Plateau: A seasonal perspective. Quat. Int. 2019, 513, 66–79. [Google Scholar] [CrossRef]
  29. Aemisegger, F.; Pfahl, S.; Sodemann, H.; Lehner, I.; Seneviratne, S.I.; Wernli, H. Deuterium excess as a proxy for continental moisture recycling and plant transpiration. Atmos. Chem. Phys. 2014, 14, 4029–4054. [Google Scholar] [CrossRef]
  30. Balagizi, C.M.; Kasereka, M.M.; Cuoco, E.; Liotta, M. Influence of moisture source dynamics and weather patterns on stable isotopes ratios of precipitation in Central-Eastern Africa. Sci. Total Environ. 2018, 628–629, 1058–1078. [Google Scholar] [CrossRef]
  31. Bedaso, Z.; Wu, S. Daily precipitation isotope variation in Midwestern United States: Implication for hydroclimate and moisture source. Sci. Total Environ. 2020, 713, 136631. [Google Scholar] [CrossRef]
  32. Dansgaard, W. Stable isotopes in precipitation. Tellus 1964, 16, 436–468. [Google Scholar] [CrossRef]
  33. Merlivat, L.; Jouzel, J. Global climatic interpretation of the deuterium-oxygen 16 relationship for precipitation. J. Geophys. Res. 1979, 84, 5029–5033. [Google Scholar] [CrossRef]
  34. Xia, Z.; Welker, J.M.; Winnick, M.J. The Seasonality of Deuterium Excess in Non-Polar Precipitation. Glob. Biogeochem. Cycles 2022, 36, e2021GB007245. [Google Scholar] [CrossRef]
  35. Ansari, A.; Noble, J.; Deodhar, A.; Kumar, U. Atmospheric factors controlling the stable isotopes (δ18O and δ2H) of the Indian Summer Monsoon precipitation in a drying region of Eastern India. J. Hydrol. 2020, 584, 124636. [Google Scholar] [CrossRef]
  36. Ren, W.; Yao, T.; Xie, S.; He, Y. Controls on the stable isotopes in precipitation and surface waters across the southeastern Tibetan Plateau. J. Hydrol. 2017, 545, 276–287. [Google Scholar] [CrossRef]
  37. Guo, X.; Tian, L.; Wang, L.; Zhang, L. Spatiotemporal Variabilities of the Recent Indian Summer Monsoon Activities in the Tibetan Plateau: A Reanalysis of Outgoing Longwave Radiation Datasets. J. Clim. 2023, 36, 3955–3970. [Google Scholar] [CrossRef]
  38. Yu, W.; Tian, L.; Yao, T.; Xu, B.; Wei, F.; Ma, Y.; Zhu, H.; Luo, L.; Qu, D. Precipitation stable isotope records from the northern Hengduan Mountains in China capture signals of the winter India-Burma Trough and the Indian Summer Monsoon. Earth Planet. Sci. Lett. 2017, 477, 123–133. [Google Scholar] [CrossRef]
  39. Li, Y.; Yu, W.S.; Tian, L.D.; Lewis, S.; Yoshimura, K.; Wang, C.; Cui, J.; Ma, Y.; Guo, R.; Zhang, J.; et al. Diagnosis of atmospheric circulation shifts in the central Tibetan Plateau: Evidence from stable isotopes. Atmos. Res. 2023, 282, 106536. [Google Scholar] [CrossRef]
  40. Li, Y.; Liu, X.; Xie, X.; Cauquoin, A.; Werner, M. Interannual modulation of the East and South Asian summer precipitation δ18O by the Indian and western North Pacific summer monsoon strength. Glob. Planet. Change 2023, 227, 104187. [Google Scholar] [CrossRef]
  41. Ciais, P.; Jouzel, J. Deuterium and oxygen-18 in precipitation-isotopic model, including mixed cloud processes. J. Geophys. Res.-Atmos. 1994, 99, 16793–16803. [Google Scholar] [CrossRef]
  42. Gat, J.R.; Matsui, E. Atmospheric water-balance in the amazon basin—An isotopic evapotranspiration model. J. Geophys. Res. -Atmos. 1991, 96, 13179–13188. [Google Scholar] [CrossRef]
  43. Graf, P.; Wernli, H.; Pfahl, S.; Sodemann, H. A new interpretative framework for below-cloud effects on stable water isotopes in vapour and rain. Atmos. Chem. Phys. 2019, 19, 747–765. [Google Scholar] [CrossRef]
  44. Landais, A.; Risi, C.; Bony, S.; Vimeux, F.; Descroix, L.; Falourd, S.; Bouygues, A. Combined measurements of O-17(excess) and d-excess in African monsoon precipitation: Implications for evaluating convective parameterizations. Earth Planet. Sci. Lett. 2010, 298, 104–112. [Google Scholar] [CrossRef]
  45. Adhikary, K.B.; Pang, S.; Staiger, M.P. Long-term moisture absorption and thickness swelling behaviour of recycled thermoplastics reinforced with Pinus radiata sawdust. Chem. Eng. J. 2008, 142, 190–198. [Google Scholar] [CrossRef]
  46. Dar, S.S.; Ghosh, P.; Hillaire-Marcel, C. Convection, Terrestrial Recycling and Oceanic Moisture Regulate the Isotopic Composition of Precipitation at Srinagar, Kashmir. J. Geophys. Res. Atmos. 2021, 126, e2020JD032853. [Google Scholar] [CrossRef]
  47. Salamalikis, V.; Argiriou, A.A.; Dotsika, E. Isotopic modeling of the sub-cloud evaporation effect in precipitation. Sci. Total Environ. 2016, 544, 1059–1072. [Google Scholar] [CrossRef] [PubMed]
  48. Chhetri, T.B.; Yao, T.; Yu, W.; Ding, L.; Joswiak, D.; Tian, L.; Devkota, L.P.; Qu, D. Stable isotopic compositions of precipitation events from Kathmandu, southern slope of the Himalayas. Chin. Sci. Bull. 2014, 59, 4838–4846. [Google Scholar] [CrossRef]
  49. Tian, L.; Yu, W.; Schuster, P.F.; Wen, R.; Cai, Z.; Wang, D.; Shao, L.; Cui, J.; Guo, X. Control of seasonal water vapor isotope variations at Lhasa, southern Tibetan Plateau. J. Hydrol. 2020, 580, 124237. [Google Scholar] [CrossRef]
  50. Peng, P.; Zhang, X.J.; Chen, J. Bias correcting isotope-equipped GCMs outputs to build precipitation oxygen isoscape for eastern China. J. Hydrol. 2020, 589, 125153. [Google Scholar] [CrossRef]
  51. Li, Z.; Li, Z.; Song, L.; Ma, J. Characteristic and factors of stable isotope in precipitation in the source region of the Yangtze River. Agric. For. Meteorol. 2020, 281, 107825. [Google Scholar] [CrossRef]
  52. Wang, S.; Du, M.; Zhang, M.; Shi, M.; Jiao, R.; Wang, L. Precipitation Isotopes Associated with the Duration and Distance of Moisture Trajectory in a Westerly-Dominant Setting. Water 2019, 11, 2434. [Google Scholar] [CrossRef]
  53. Wang, X.; Li, Z.; Tayier, R.; Wang, S. Characteristics of atmospheric precipitation isotopes and isotopic evidence for the moisture origin in Yushugou River basin, Eastern Tianshan Mountains, China. Quat. Int. 2015, 380, 106–115. [Google Scholar] [CrossRef]
  54. Acharya, S.; Yang, X.; Yao, T.; Shrestha, D. Stable isotopes of precipitation in Nepal Himalaya highlight the topographic influence on moisture transport. Quat. Int. 2020, 565, 22–30. [Google Scholar] [CrossRef]
  55. Li, X.; Long, D.; Scanlon, B.R.; Mann, M.; Li, X.; Tian, F.; Sun, Z.; Wang, G. Climate change threatens terrestrial water storage over the Tibetan Plateau. Nat. Clim. Change 2022, 12, 801–807. [Google Scholar] [CrossRef]
  56. Li, Z.; Gui, J.; Wang, X.; Feng, Q.; Zhao, T.; Ouyang, C.J.; Guo, X.; Zhang, B.; Shi, Y. Water resources in inland regions of central Asia: Evidence from stable isotope tracing. J. Hydrol. 2019, 570, 1–16. [Google Scholar] [CrossRef]
  57. Guo, X.; Feng, Q.; Wei, Y.; Li, Z.; Liu, W. An overview of precipitation isotopes over the Extensive Hexi Region in NW China. Arab. J. Geosci. 2015, 8, 4365–4378. [Google Scholar] [CrossRef]
  58. An, W.; Hou, S.; Zhang, Q.; Zhang, W.; Wu, S.; Xu, H.; Pang, H.; Wang, Y.; Liu, Y. Enhanced Recent Local Moisture Recycling on the Northwestern Tibetan Plateau Deduced From Ice Core Deuterium Excess Records. J. Geophys. Res.-Atmos. 2017, 122, 12541–12556. [Google Scholar] [CrossRef]
  59. Qiao, B.; Zhu, L. Differences and cause analysis of changes in lakes of different supply types in the northwestern Tibetan Plateau: Difference and cause analysis of lakes change. Hydrol. Process. 2017, 31, 2752–2763. [Google Scholar] [CrossRef]
  60. Ran, Y.; Cheng, G.; Dong, Y.; Hjort, J.; Lovecraft, A.L.; Kang, S.; Tan, M.; Li, X. Permafrost degradation increases risk and large future costs of infrastructure on the Third Pole. Commun. Earth Environ. 2022, 3, 238. [Google Scholar] [CrossRef]
  61. Zhu, Y.; Liu, Y.; Wang, H.; Sun, J. Changes in the Interannual Summer Drought Variation Along With the Regime Shift Over Northwest China in the Late 1980s. J. Geophys. Res.-Atmos. 2019, 124, 2868–2881. [Google Scholar] [CrossRef]
  62. Kong, Y.; Pang, Z. A positive altitude gradient of isotopes in the precipitation over the Tianshan Mountains: Effects of moisture recycling and sub-cloud evaporation. J. Hydrol. 2016, 542, 222–230. [Google Scholar] [CrossRef]
  63. Tian, L.; Yao, T.; Li, Z.; Macclune, K.; Wu, G.; Xu, B.; Li, Y.; Lu, A.; Shen, Y. Recent rapid warming trend revealed from the isotopic record in Muztagata ice core, eastern Pamirs. J. Geophys. Res. -Atmos. 2006, 111. [Google Scholar] [CrossRef]
  64. Zhang, Z.; Zhao, Q.; Zhang, S. Abundant Precipitation in Qilian Mountains Generated from the Recycled Moisture over the Adjacent Arid Hexi Corridor, Northwest China. Water 2021, 13, 3354. [Google Scholar] [CrossRef]
  65. Luo, J.; Niu, F.; Lin, Z.; Liu, M.; Yin, G. Recent acceleration of thaw slumping in permafrost terrain of Qinghai-Tibet Plateau: An example from the Beiluhe Region. Geomorphology 2019, 341, 79–85. [Google Scholar] [CrossRef]
  66. Lin, Z.; Gao, Z.; Fan, X.; Niu, F.; Luo, J.; Yin, G.; Liu, M. Factors controlling near surface ground-ice characteristics in a region of warm permafrost, Beiluhe Basin, Qinghai-Tibet Plateau. Geoderma 2020, 376, 114540. [Google Scholar] [CrossRef]
  67. Li, F.; Wang, W.; Yin, Y.; Zhang, S. Climate control on summer precipitation in the Source Region of Three Rivers, China: East or South Asian summer monsoon? Hydrol. Sci. J. 2020, 65, 242–253. [Google Scholar] [CrossRef]
  68. Sun, B.; Wang, H. Moisture Sources of Semiarid Grassland in China Using the Lagrangian Particle Model FLEXPART. J. Clim. 2014, 27, 2457–2474. [Google Scholar] [CrossRef]
  69. Stewart, M.K. Stable isotope fractionation due to evaporation and isotopic exchange of falling waterdrops: Applications to atmospheric processes and evaporation of lakes. J. Geophys. Res. 1975, 80, 1133–1146. [Google Scholar] [CrossRef]
  70. Wang, S.; Zhang, M.; Che, Y.; Chen, F.; Qiang, F. Contribution of recycled moisture to precipitation in oases of arid central Asia: A stable isotope approach. Water Resour. Res. 2016, 52, 3246–3257. [Google Scholar] [CrossRef]
  71. Cappa, C.D.; Hendricks, M.B.; Depaolo, D.J.; Cohen, R.C. Isotopic fractionation of water during evaporation. J. Geophys. Res. Atmos. 2003, 108. [Google Scholar] [CrossRef]
  72. Froehlich, K.; Kralik, M.; Papesch, W.; Rank, D.; Scheifinger, H.; Stichler, W. Deuterium excess in precipitation of Alpine regions–moisture recycling. Isot. Environ. Health Stud. 2008, 44, 61–70. [Google Scholar] [CrossRef] [PubMed]
  73. Sun, C.; Chen, Y.; Li, J.; Chen, W.; Li, X. Stable isotope variations in precipitation in the northwesternmost Tibetan Plateau related to various meteorological controlling factors. Atmos. Res. 2019, 227, 66–78. [Google Scholar] [CrossRef]
  74. Wang, S.; Zhang, M.; Crawford, J.; Hughes, C.E.; Du, M.; Liu, X. The effect of moisture source and synoptic conditions on precipitation isotopes in arid central Asia. J. Geophys. Res.-Atmos. 2017, 122, 2667–2682. [Google Scholar] [CrossRef]
  75. Von Herrmann, C.F. Problems in meteorology. Mon. Weather. Rev. 1906, 34, 574–579. [Google Scholar] [CrossRef]
  76. Laederach, A.; Sodemann, H. A revised picture of the atmospheric moisture residence time. Geophys. Res. Lett. 2016, 43, 924–933. [Google Scholar] [CrossRef]
  77. Tuinenburg, O.A.; Hutjes, R.W.A.; Kabat, P. The fate of evaporated water from the Ganges basin. J. Geophys. Res.-Atmos. 2012, 117, D01107. [Google Scholar] [CrossRef]
  78. Stein, A.F.; Draxler, R.R.; Rolph, G.D.; Stunder, B.J.B.; Cohen, M.D.; Ngan, F. NOAA’s HYSPLIT Atmospheric Transport and Dispersion Modeling System. Bull. Am. Meteorol. Soc. 2015, 96, 2059–2077. [Google Scholar] [CrossRef]
  79. Van Der Ent, R.J.; Tuinenburg, O.A. The residence time of water in the atmosphere revisited. Hydrol. Earth Syst. Sci. 2017, 21, 779–790. [Google Scholar] [CrossRef]
  80. Araguás-Araguás, L.; Froehlich, K.; Rozanski, K. Deuterium and oxygen-18 isotope composition of precipitation and atmospheric moisture. Hydrol. Process. 2000, 14, 1341–1355. [Google Scholar] [CrossRef]
  81. Tian, L.; Yao, T.; Macclune, K.; White, J.W.C.; Schilla, A.; Vaughn, B.; Vachon, R.; Ichiyanagi, K. Stable isotopic variations in west China: A consideration of moisture sources. J. Geophys. Res. Atmos. 2007, 112. [Google Scholar] [CrossRef]
  82. Yang, X.; Yao, T. Seasonality of moisture supplies to precipitation over the Third Pole: A stable water isotopic perspective. Sci. Rep. 2020, 10, 15020. [Google Scholar] [CrossRef] [PubMed]
  83. Juhlke, T.R.; Meier, C.; Van Geldern, R.; Vanselow, K.A.; Wernicke, J.; Baidulloeva, J.; Barth, J.a.C.; Weise, S.M. Assessing moisture sources of precipitation in the Western Pamir Mountains (Tajikistan, Central Asia) using deuterium excess. Tellus Ser. b-Chem. Phys. Meteorol. 2019, 71, 1445379. [Google Scholar] [CrossRef]
  84. Zhang, F.; Huang, T.; Man, W.; Hu, H.; Long, Y.; Li, Z.; Pang, Z. Contribution of Recycled Moisture to Precipitation: A Modified D-Excess-Based Model. Geophys. Res. Lett. 2021, 48, e2021GL095909. [Google Scholar] [CrossRef]
  85. Pang, H.; Hou, S.; Kaspari, S.; Mayewski, P.A. Influence of regional precipitation patterns on stable isotopes in ice cores from the central Himalayas. Cryosphere 2014, 8, 289–301. [Google Scholar] [CrossRef]
  86. Rindsberger, M.; Magaritz, M.; Carmi, I.; Gilad, D. The relation between air mass trajectories and the water isotope composition of rain in the Mediterranean Sea area. Geophys. Res. Lett. 1983, 10, 43–46. [Google Scholar] [CrossRef]
  87. Li, Z.; Li, Z.; Yu, H.; Song, L.; Ma, J. Environmental significance and zonal characteristics of stable isotope of atmospheric precipitation in arid Central Asia. Atmos. Res. 2019, 227, 24–40. [Google Scholar] [CrossRef]
  88. Craig, H. Isotopic variations in meteoric waters. Science 1961, 133, 1702. [Google Scholar] [CrossRef]
  89. Rozanski, K.; Araguas-Araguas, L.; Gonfiantini, R. Isotopic patterns in modern global precipitation. Isot. Patterns Mod. Glob. Precip. 1993, 78, 1–36. [Google Scholar]
  90. Jia, W.; Xiong, H.; Zhu, G.; Shi, Y.; Zhang, Z.; Yang, L.; Zhang, M.; Zhang, F. Influence of Sub-Cloud Secondary Evaporation and Moisture Sources on Stable Isotopes of Precipitation in Shiyang River Basin, Northwest China. Water 2022, 14, 2700. [Google Scholar] [CrossRef]
  91. Wang, L.; Wang, S.; Zhang, M.; Duan, L.; Xia, Y. An hourly-scale assessment of sub-cloud evaporation effect on precipitation isotopes in a rainshadow oasis of northwest China. Atmos. Res. 2022, 274, 106202. [Google Scholar] [CrossRef]
  92. Xiao, H.; Zhang, M.; Wang, S.; Che, C.-W.; Du, Q.-Q.; Zhang, Y.; Han, T.-T.; Su, P.-Y. Sub-cloud secondary evaporation effect of precipitation isotope in Shaanxi-Gansu-Ningxia region, China. J. Appl. Ecol. 2020, 31, 3814–3822. [Google Scholar] [CrossRef]
  93. Gui, J.; Li, Z.; Feng, Q.; Zhang, B.; Xue, J.; Gao, W.; Li, Y.; Liang, P.; Nan, F. Water resources significance of moisture recycling in the transition zone between Tibetan Plateau and arid region by stable isotope tracing. J. Hydrol. 2022, 605, 127350. [Google Scholar] [CrossRef]
  94. Zhou, S.; Nakawo, M.; Sakai, A.; Matsuda, Y.; Duan, K.; Pu, J. Water isotope variations in the snow pack and summer precipitation at July 1 Glacier, Qilian Mountains in northwest China. Chin. Sci. Bull. 2007, 52, 2963–2972. [Google Scholar] [CrossRef]
  95. Sun, C.; Chen, W.; Chen, Y.; Cai, Z. Stable isotopes of atmospheric precipitation and its environmental drivers in the Eastern Chinese Loess Plateau, China. J. Hydrol. 2020, 581, 124404. [Google Scholar] [CrossRef]
  96. Peng, T.; Liu, K.; Wang, C.; Chuang, K. A water isotope approach to assessing moisture recycling in the island-based precipitation of Taiwan: A case study in the western Pacific. Water Resour. Res. 2011, 47, 8. [Google Scholar] [CrossRef]
  97. Zhu, G.; Li, J.; Shi, P.; He, Y.; Cai, A.; Tong, H.; Liu, Y.; Yang, L. Relationship between sub-cloud secondary evaporation and stable isotope in precipitation in different regions of China. Environ. Earth Sci. 2016, 75, 876. [Google Scholar] [CrossRef]
  98. Chen, F.; Zhang, M.; Wang, S.; Ma, Q.; Zhu, X.; Dong, L. Relationship between sub-cloud secondary evaporation and stable isotopes in precipitation of Lanzhou and surrounding area. Quat. Int. 2015, 380–381, 68–74. [Google Scholar] [CrossRef]
  99. Cai, Z.; Tian, L. Atmospheric Controls on Seasonal and Interannual Variations in the Precipitation Isotope in the East Asian Monsoon Region. J. Clim. 2016, 29, 1339–1352. [Google Scholar] [CrossRef]
  100. Cai, Z.; Tian, L.; Bowen, G.J. Spatial-seasonal patterns reveal large-scale atmospheric controls on Asian Monsoon precipitation water isotope ratios. Earth Planet. Sci. Lett. 2018, 503, 158–169. [Google Scholar] [CrossRef]
  101. Risi, C.; Bony, S.; Vimeux, F.; Chong, M.; Descroix, L. Evolution of the stable water isotopic composition of the rain sampled along Sahelian squall lines. Q. J. R. Meteorol. Soc. 2010, 136, 227–242. [Google Scholar] [CrossRef]
  102. Zhang, M.; Wang, S. A review of precipitation isotope studies in China: Basic pattern and hydrological process. J. Geogr. Sci. 2016, 26, 921–938. [Google Scholar] [CrossRef]
  103. Pang, Z.H.; Kong, Y.L.; Froehlich, K.; Huang, T.; Yuan, L.; Li, Z.; Wang, F. Processes affecting isotopes in precipitation of an arid region. Tellus Ser. B-Chem. Phys. Meteorol. 2011, 63, 352–359. [Google Scholar] [CrossRef]
  104. Yao, T.D.; Masson-Delmotte, V.; Jouzel, J.; Stievenard, M.; Sun, W.; Jiao, K. Relationships between δ18O in precipitation and surface air temperature in the Urumqi River Basin, East Tianshan Mountains, China. Geophys. Res. Lett. 1999, 26, 3473–3476. [Google Scholar] [CrossRef]
  105. Bershaw, J. Controls on Deuterium Excess across Asia. Geosciences 2018, 8, 257. [Google Scholar] [CrossRef]
Figure 1. Map showing locations of the sampling station in central Asia and the Tibetan Plateau (a,b). Monthly variations of precipitation amount, air temperature, and relative humidity at TS, MZTG, Nagri, BLH, and QLS stations during 2014–2020 (c).
Water 16 00150 g001
Figure 2. Variations of precipitation δ18O (a); δD (b); d-excess (c); surface air temperature (d); relative humidity (e); precipitation amount (f) in each precipitation event during the sampling period (August 2018 to September 2020) for 6 sampling sites over the north Tibetan Plateau. The colors mark the different sampling sites.
Water 16 00150 g002
Figure 3. The atmospheric meteoric water lines at different sites and different seasons over the north Tibetan Plateau.
Water 16 00150 g003
Figure 4. Monthly variations of precipitation Δd (‰), surface air temperature (°C), relative humidity (%), and precipitation amount (mm) for 6 sampling sites over the north Tibetan Plateau.
Water 16 00150 g004
Figure 5. The relationship between the remaining fraction of raindrops (f:%) and the change of d-excess (Δd:‰) from the cloud base to the ground during precipitation events above 0 °C at the northern Tibetan Plateau.
Water 16 00150 g005
Figure 6. Plot of temperature versus δ18O and d-excess at sampling sites over the north Tibetan Plateau in different temperature ranges (below 0 °C, from 0 to 10 °C, and above 10 °C).
Water 16 00150 g006
Figure 7. Clustering of backward trajectories in different seasons (DJF, MAM, JJA, and SON) at TS, BLH, and SJY stations (The asterisk represents the location of the station, and color is used to distinguish the clustering results of different trajectories).
Water 16 00150 g007
Figure 8. Clustering of backward trajectories in different seasons (MAM, JJA, and SON) at MZTG, NL, and QLS stations (The asterisk represents the location of the station, and color is used to distinguish the clustering results of different trajectories).
Water 16 00150 g008
Figure 9. Monthly mean moisture flux (kg·m−2·s−1) and wind filed (m/s) at 850 pha in central Asia in October 2018, January, April, and July 2019 based on ERA-Interim reanalysis results from the European Centre for Medium-Range Weather Forecasts (ECMWF) (Note: The black arrow indicates the wind speed, and the green dotted sqaure indicates the area studied in this paper).
Water 16 00150 g009
Figure 10. Monthly mean moisture flux (kg·m−2·s−1) and wind filed (m/s) at 850 pha in central Asia in October 2019, January, April, and July 2020 based on ERA-Interim reanalysis results from the European Centre for Medium-Range Weather Forecasts (ECMWF) (Note: The black arrow indicates the wind speed, and the green dotted sqaure indicates the area studied in this paper).
Water 16 00150 g010
Figure 11. The correlation coefficients between the precipitation δ18O value from May to September at the NL, BLH, and SJY station and the meridional (southern) wind speed field from 1948 to 2020 (Note: Subfigures (ac), (df), (gi) respectively indicate the correlation coefficients between the precipitation δ18O value at the NL, BLH, and SJY and the meridional wind speed at the vertical heights of 850 hpa, 500 hpa and 300 hpa).
Water 16 00150 g011
Figure 12. The correlation coefficients between the precipitation δ18O value from May to September at the NL, BLH, and SJY station and the zonal wind (westerly) speed field from 1948 to 2020 (Note: Subfigures (ac), (df), (gi) respectively indicate the correlation coefficients between the precipitation δ18O value at the NL, BLH, and SJY and the zonal wind speed at the vertical heights of 850 hpa, 500 hpa and 300 hpa.).
Water 16 00150 g012
Table 1. d-excess composition of precipitation at the level of the ground sampling site and the cloud base for 6 sampling sites over the north Tibetan Plateau (Δd represents the d-excess variability between the cloud base and the ground).
Locationd-excessAprMayJunJulAugSepOctMonthly Mean
TSGround (‰)9.0514.797.493.4211.1210.8810.599.62
Cloud base (‰)9.3015.057.974.5715.819.7110.8810.47
Δd (‰)0.250.260.481.154.69−1.170.290.85
MZTGGround (‰)-16.7322.4813.7420.78--18.43
Cloud base (‰)-16.7723.0613.8120.87--18.63
Δd (‰)-0.040.580.070.09--0.20
NLGround (‰)2.5122.9210.7614.3011.3514.66-12.75
Cloud base (‰)5.9823.8618.0915.4812.4416.20-15.34
Δd (‰)3.470.947.331.181.091.54 2.59
BLHGround (‰)-3.1311.708.217.9511.67-8.53
Cloud base (‰)-31.4918.5015.2214.5416.46-19.24
Δd (‰)-28.366.87.016.594.79-10.71
QLSGround (‰)--19.1018.1817.285.92-15.12
Cloud base (‰)--19.4418.6917.586.00-15.43
Δd (‰)--0.340.510.30.08-0.31
SJYGround (‰)13.4519.1513.609.2611.3914.0113.7913.52
Cloud base (‰)21.6019.6114.9310.0011.8016.5115.6115.72
Δd (‰)8.150.461.330.740.412.51.822.20
Table 2. Statistical correlation between precipitation δ18O and local meteorological parameters at sampling sites over the north Tibetan Plateau during different seasons.
Linear Correlation Coefficient
SitesTimeδ18O-T(R2)δ18O-RH(R2)δ18O-Pre(R2)d-excess-T(R2)d-excess-RH(R2)d-excess-Pre(R2)d-excess18O(R2)
TSAnnal0.92 *(0.80)0.08(0.01)−0.06(0.14)0.13(0.01)−0.20(0.04)0.06(0.11)−0.03(0.001)
Summer0.99 *(0.59)0.13(0.12)−0.08 *(0.40)−0.77(0.19)−0.19(0.06)0.10(0.28)−0.43 *(0.34)
Winter0.71 *(0.66)−0.08(0.02)0.08 *(0.34)0.57(0.17)−0.25(0.03)−0.01(0.01)0.17(0.07)
MZTGAnnal2.21 *(0.87)−0.22(0.07)0.53(0.55)0.65(0.11)0.04(0.003)0.64(0.13)0.39(0.12)
Summer2.02 *(0.70)−0.05(0.05)−0.79(0.26)0.32(0.01)0.10(0.02)0.54(0.10)0.10(0.02)
Winter1.64 *(0.66)−0.01(0.21)−0.33(0.07)−0.60(0.11)0.12 *(0.4)0.85 *(0.61)−0.91(0.66)
NLAnnal0.34(0.10)−0.13(0.03)0.09(0.001)1.72 *(0.42)−0.07(0.003)0.93(0.05)0.10(0.06)
Summer0.02(0.0001)−0.17(0.08)−0.25(0.01)−0.51(0.05)−0.11(0.02)0.16(0.005)0.53 *(0.34)
Winter−0.64(0.15)−0.01(0.001)0.12(0.0001)1.73(0.1)−0.86(0.04)−2.12(0.42)−0.24 *(0.64)
BLHAnnal0.38 *(0.13)0.01(0.002)-−0.04(0.0008)−0.008(0.0004)-0.03(0.001)
Summer−0.12(0.01)−0.07(0.07)-−0.39(0.04)−0.06(0.02)-−0.01(0.00001)
Winter0.35(0.07)0.03(0.02)-1.03(0.19)0.18(0.15)-0.09(0.024)
QLSAnnal0.59(0.10)−0.18 *(0.24)−0.02(0.002)0.52(0.04)−0.08(0.02)−0.14(0.07)0.26(0.15)
Summer0.59(0.10)−0.18 *(0.24)−0.02(0.002)0.52(0.04)−0.08(0.02)−0.14(0.07)0.26(0.15)
Winter-------
SJYAnnal0.43 *(0.25)0.03(0.003)0.05(0.0002)−0.10(0.01)−0.17(0.09)−0.62(0.02)0.15(0.02)
Summer0.12(0.002)−0.25 *(0.12)−0.35(0.01)−0.57(0.05)−0.27 *(0.11)−0.38(0.01)0.17(0.04)
Winter0.56 *(0.30)0.03(0.003)−1.88(0.01)−0.04(0.001)−0.15(0.08)−5.47(0.03)0.15(0.03)
Note: T: temperature (°C); Pre: precipitation amount (mm); RH: relative humidity (%); numbers with * means the correlations are significant at the 0.05 level; numbers without an * do not pass the significant test.
Disclaimer/Publisher’s Note: The statements, opinions and data contained in all publications are solely those of the individual author(s) and contributor(s) and not of MDPI and/or the editor(s). MDPI and/or the editor(s) disclaim responsibility for any injury to people or property resulting from any ideas, methods, instructions or products referred to in the content.

