Hydrochemical and Isotopic Characteristics and the Spatiotemporal Differences of Surface Water and Groundwater in the Qaidam Basin, China
Abstract
:1. Introduction
2. Materials and Methods
2.1. Regional Overview
2.2. Research Methods
2.3. Sampling and Testing
3. Results
3.1. Summer Indicators
3.2. Winter Indicators
4. Discussion
4.1. Analysis of Spatial Differences
4.1.1. Differences in Hydrochemical Types and Their Causes
4.1.2. Differences in H-O Isotopes and Their Causes
4.2. Analysis of Seasonal Differences
4.2.1. Differences in Hydrochemical Types and Their Causes
4.2.2. Differences in H-O Isotopes and Their Causes
4.3. Surface Water–Groundwater Interactions and Salt Sources for Terminal Lake
4.3.1. Surface Water–Groundwater Interaction from Mountainous Areas to Terminal Lakes
4.3.2. Salt Sources for Terminal Lake
5. Conclusions
- (1)
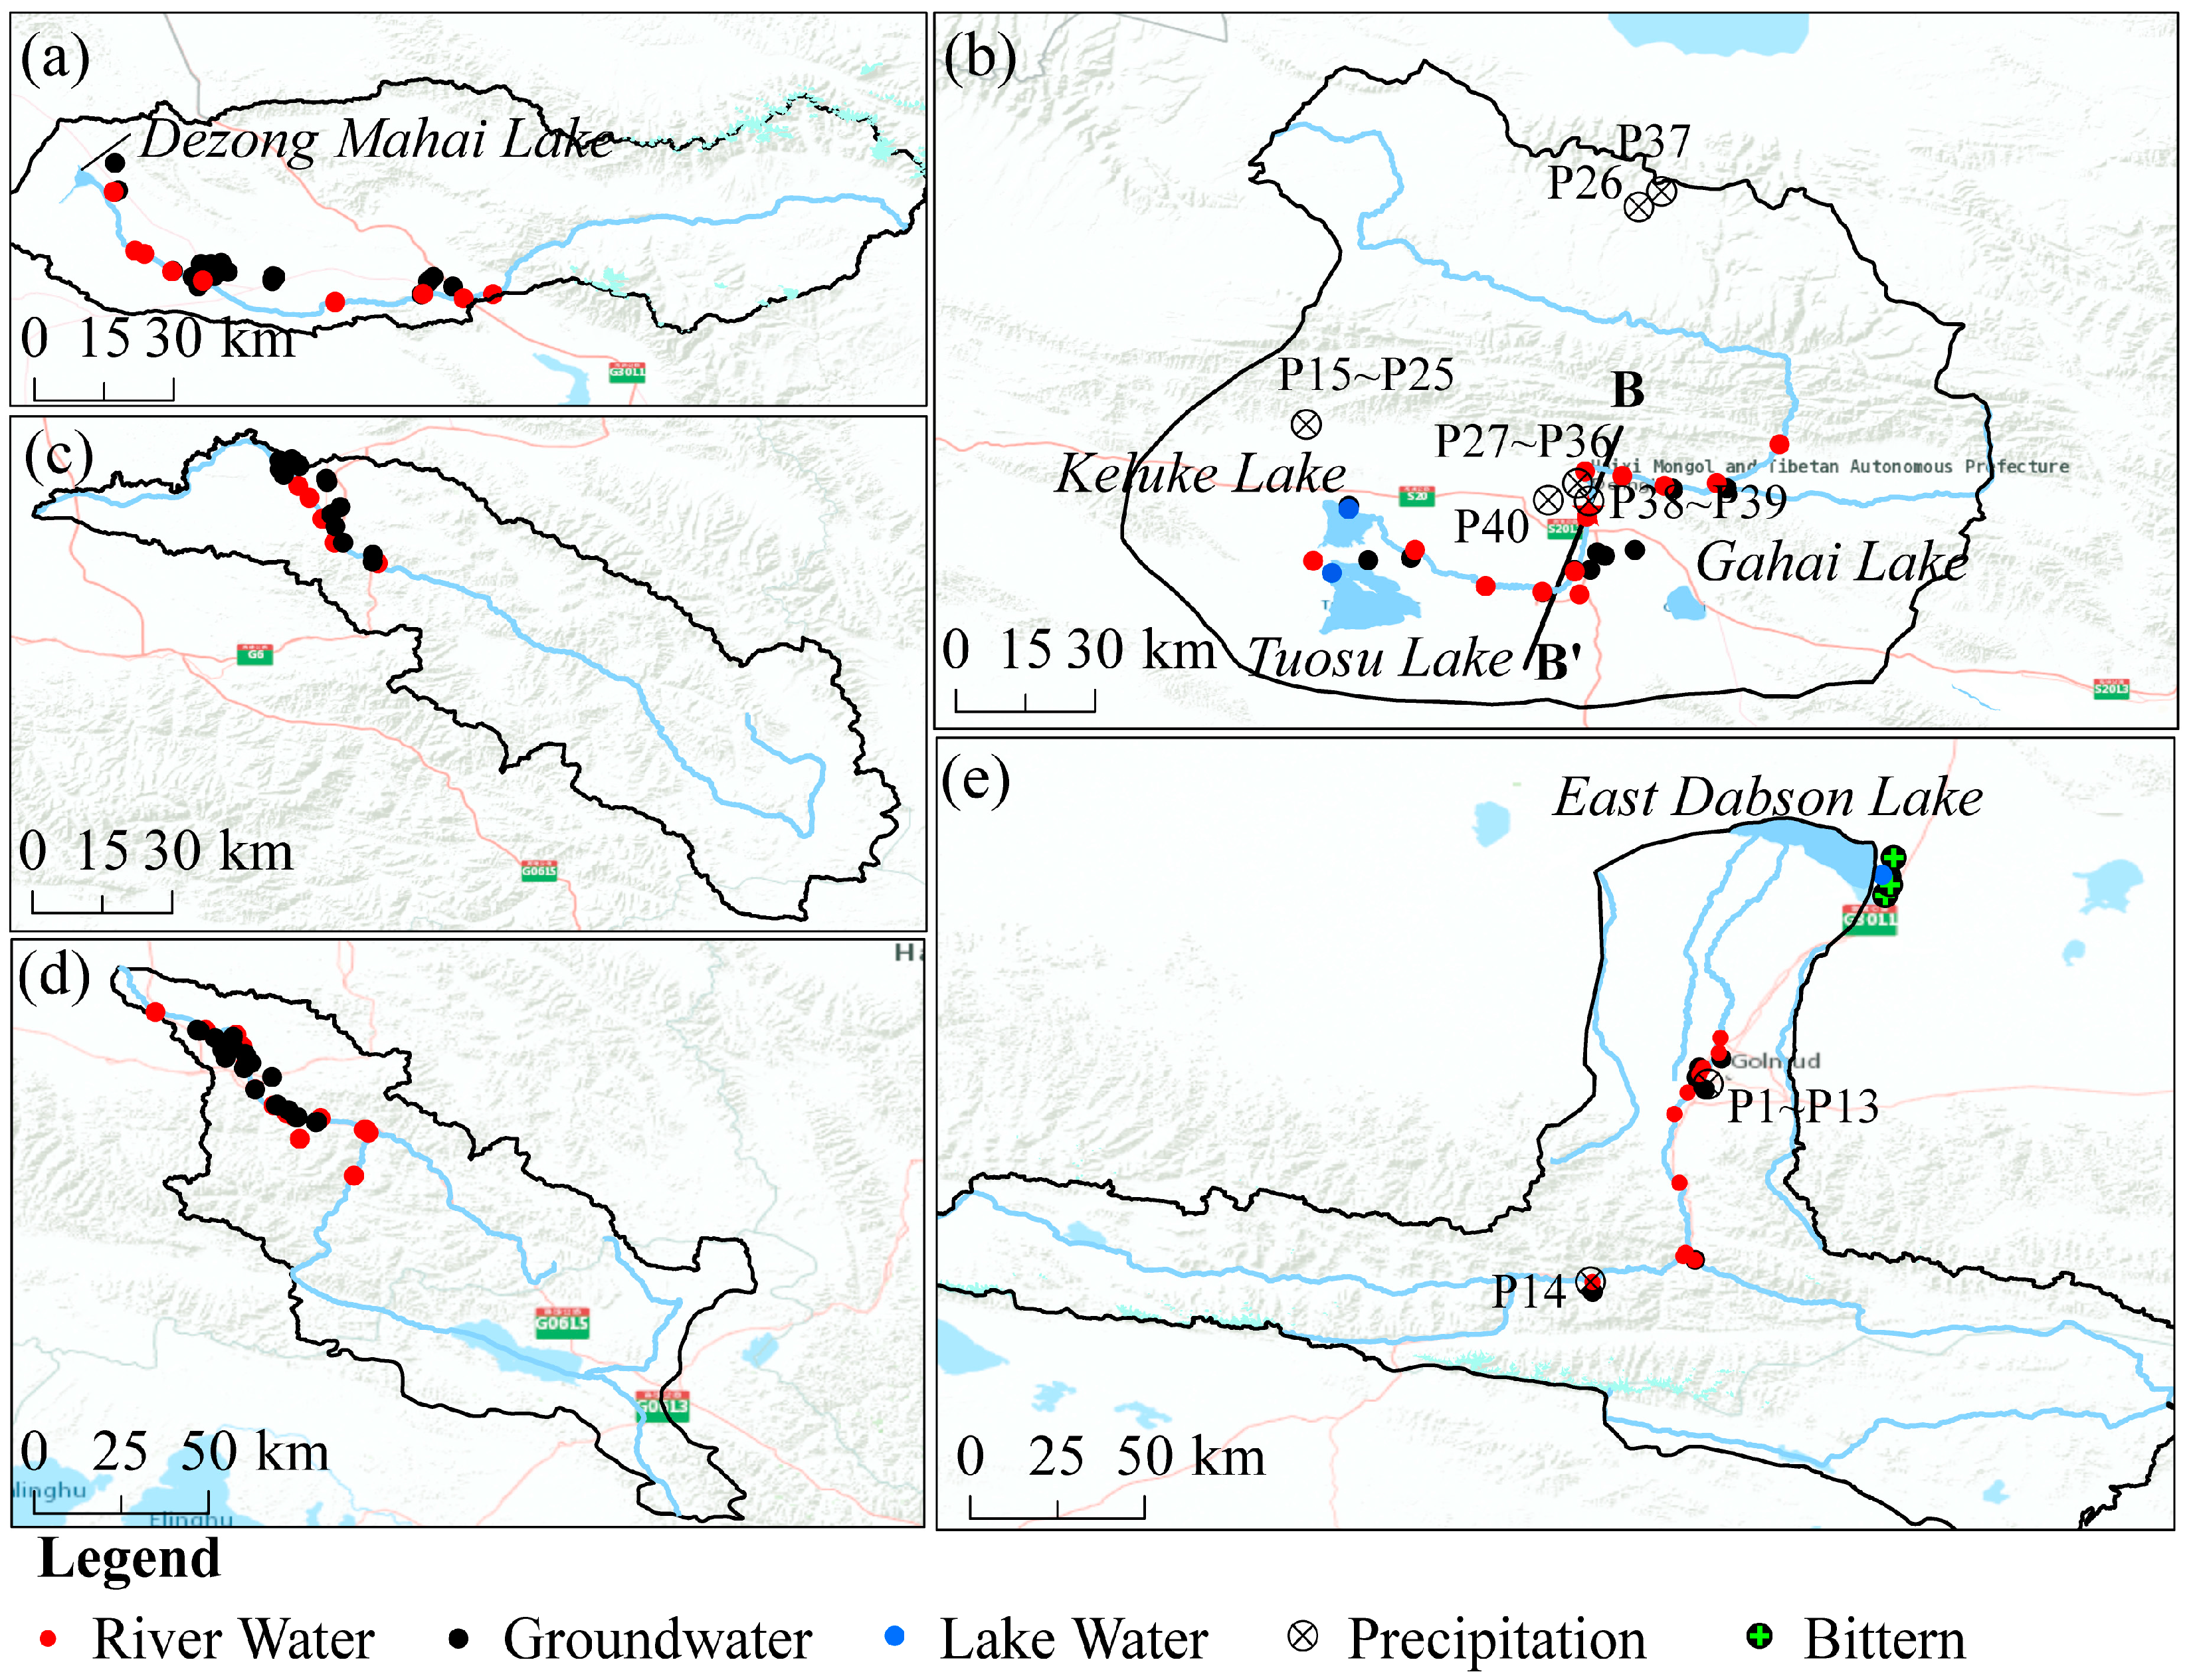
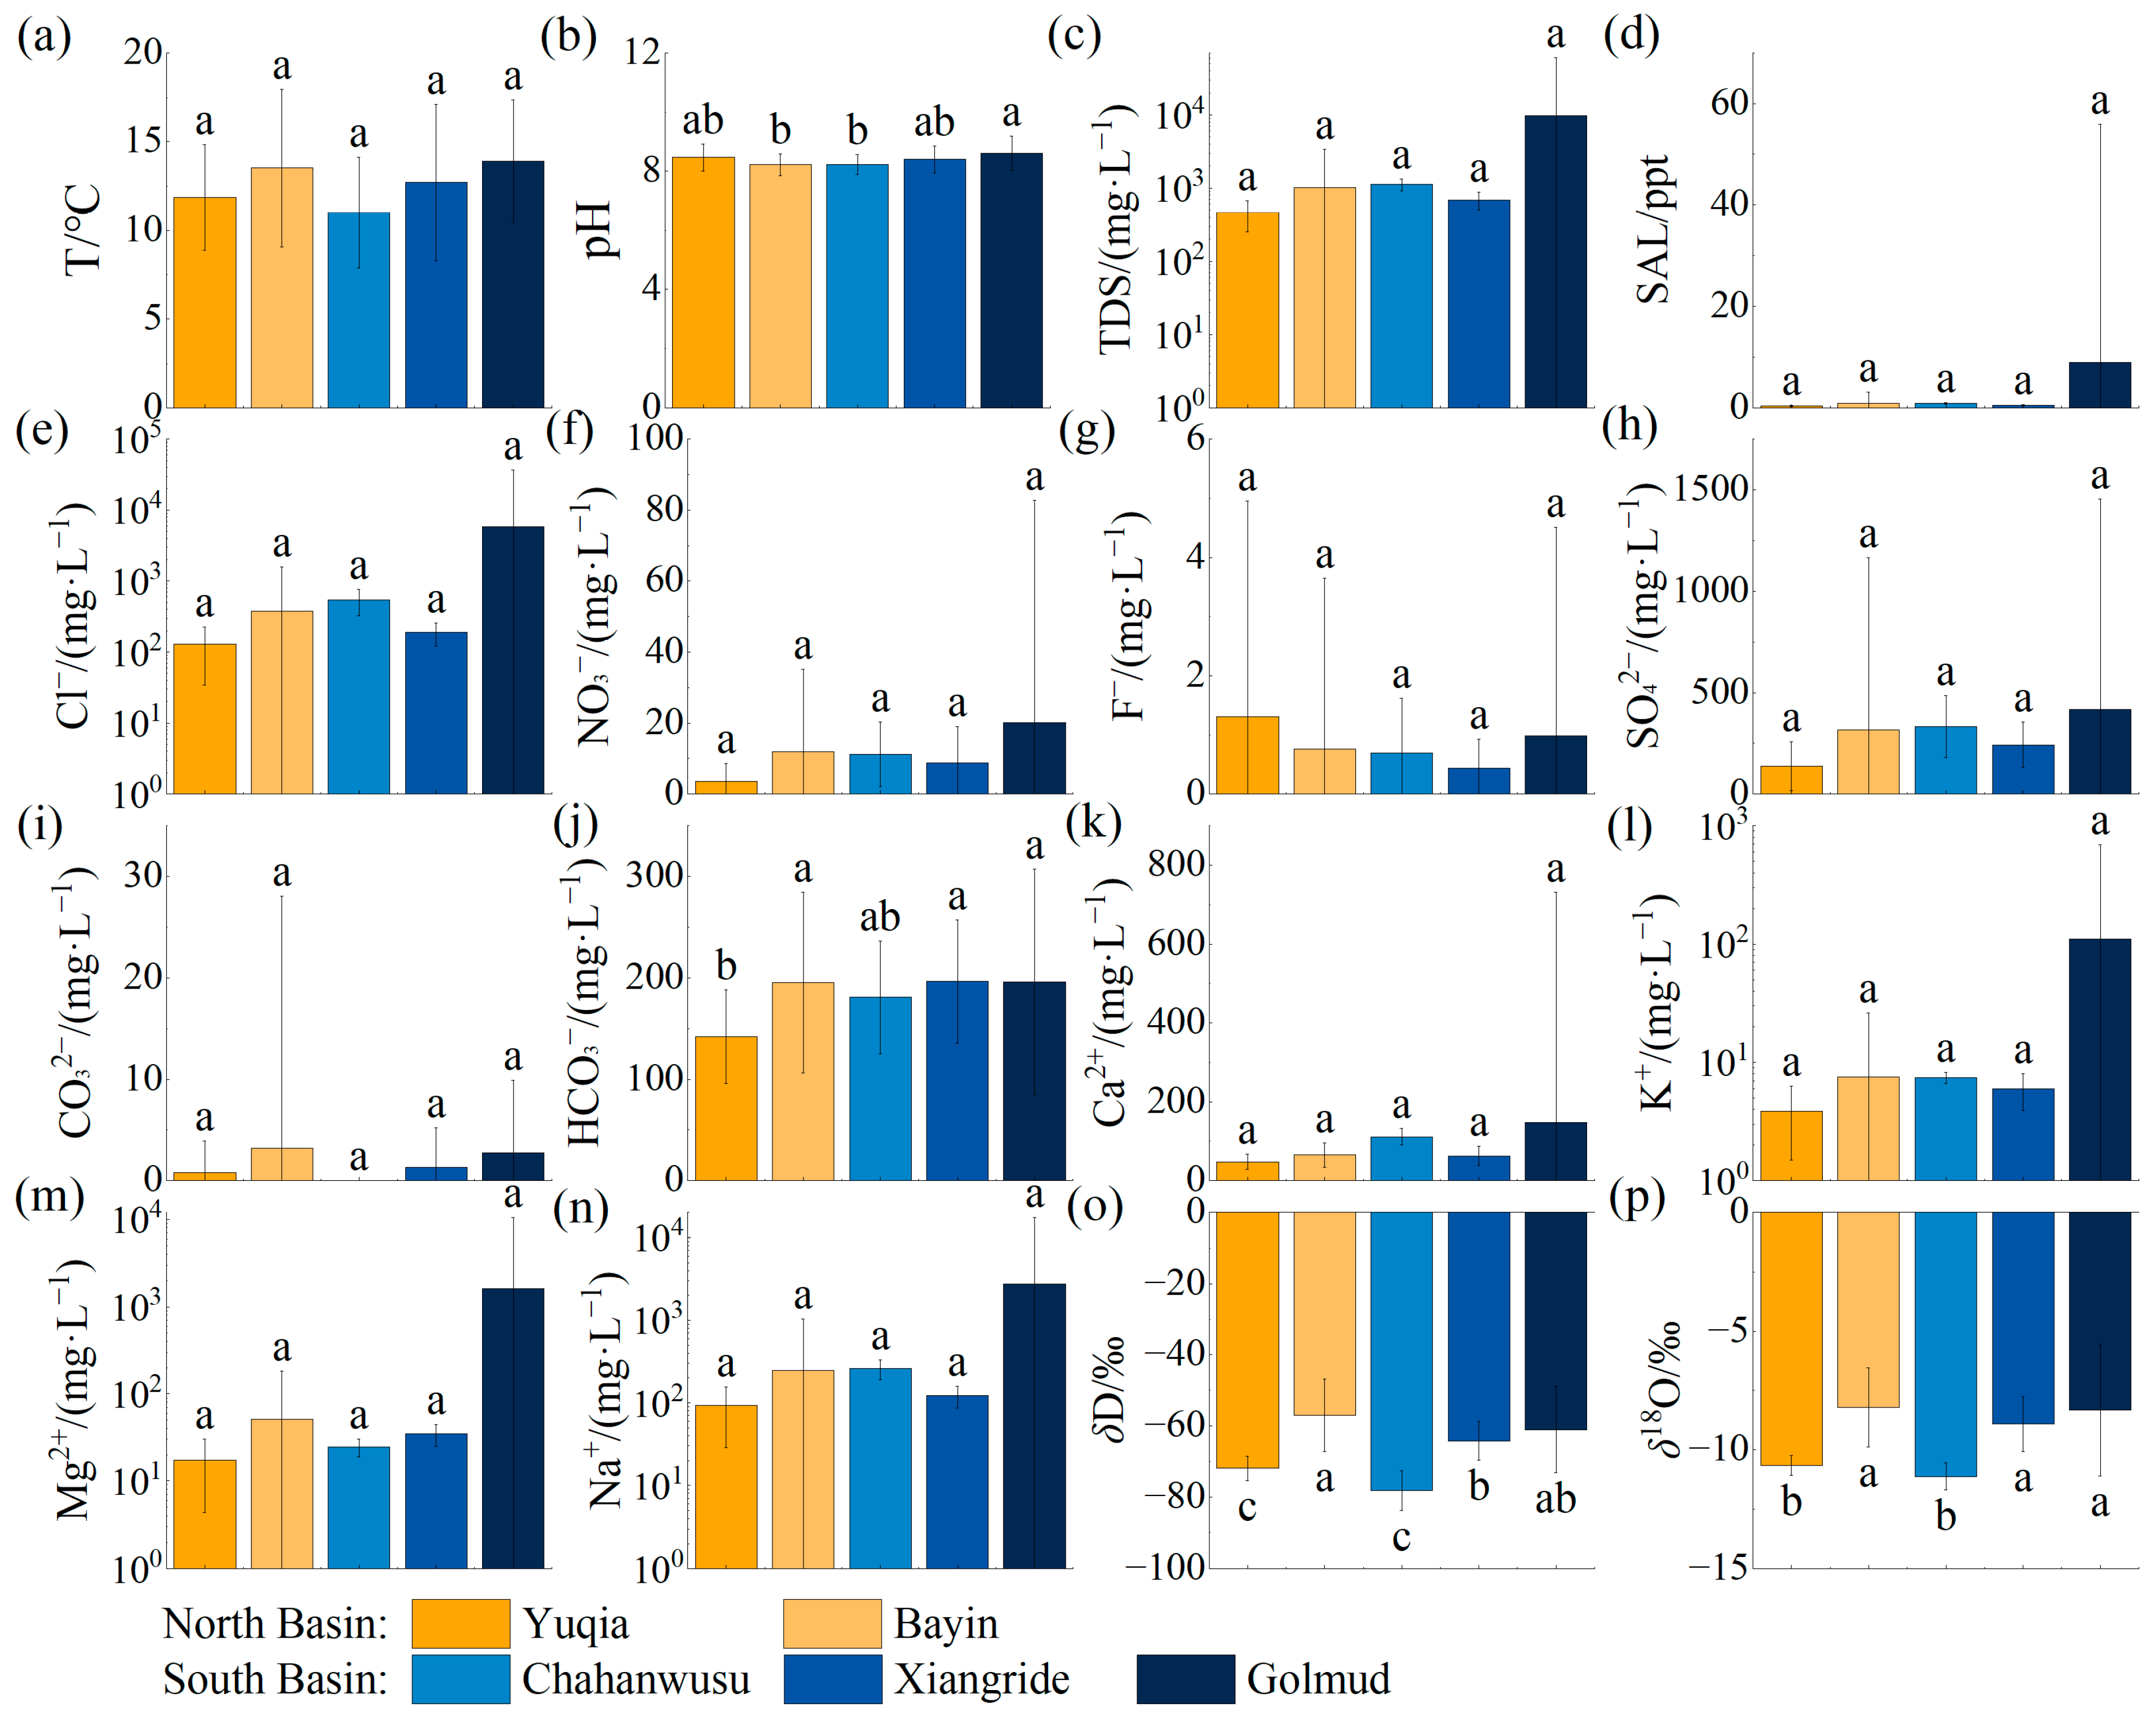
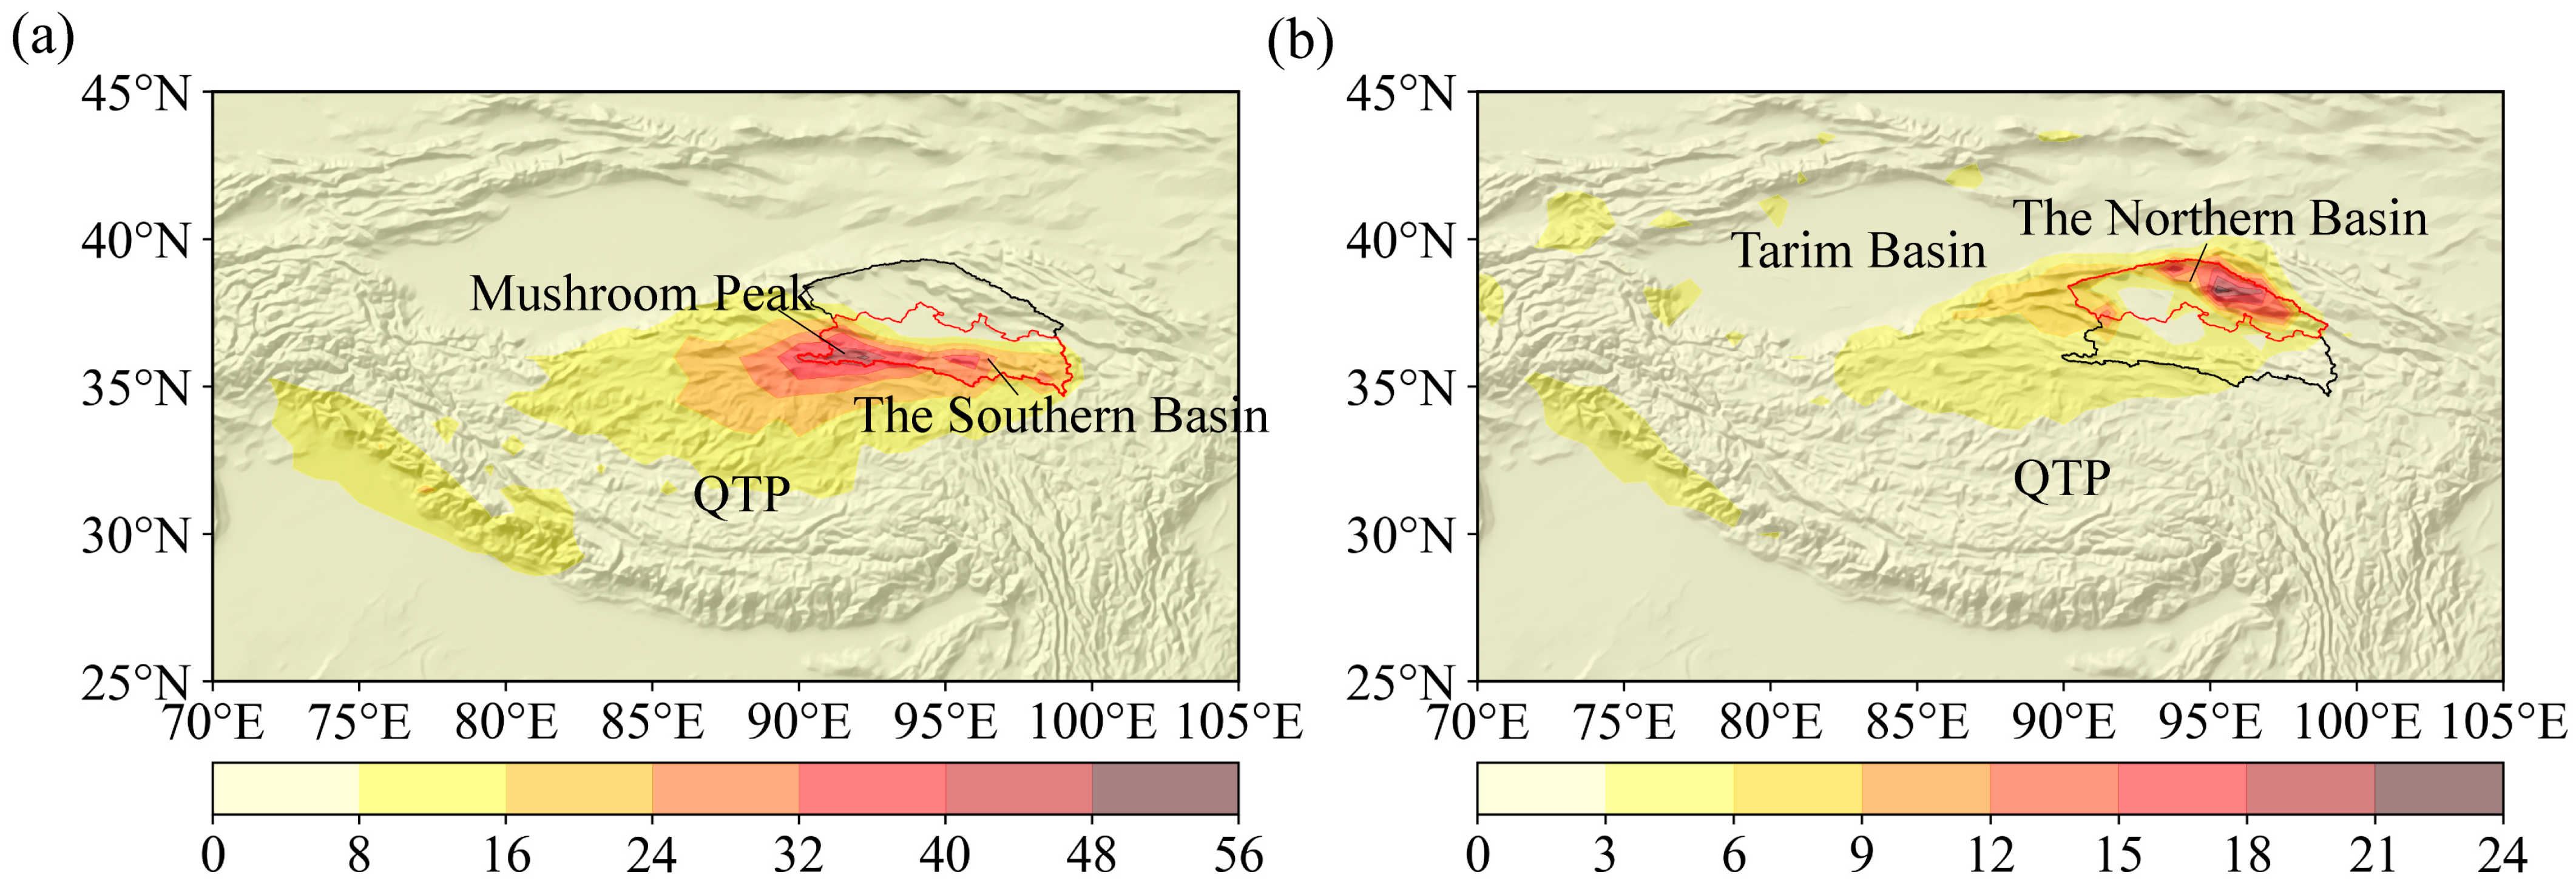
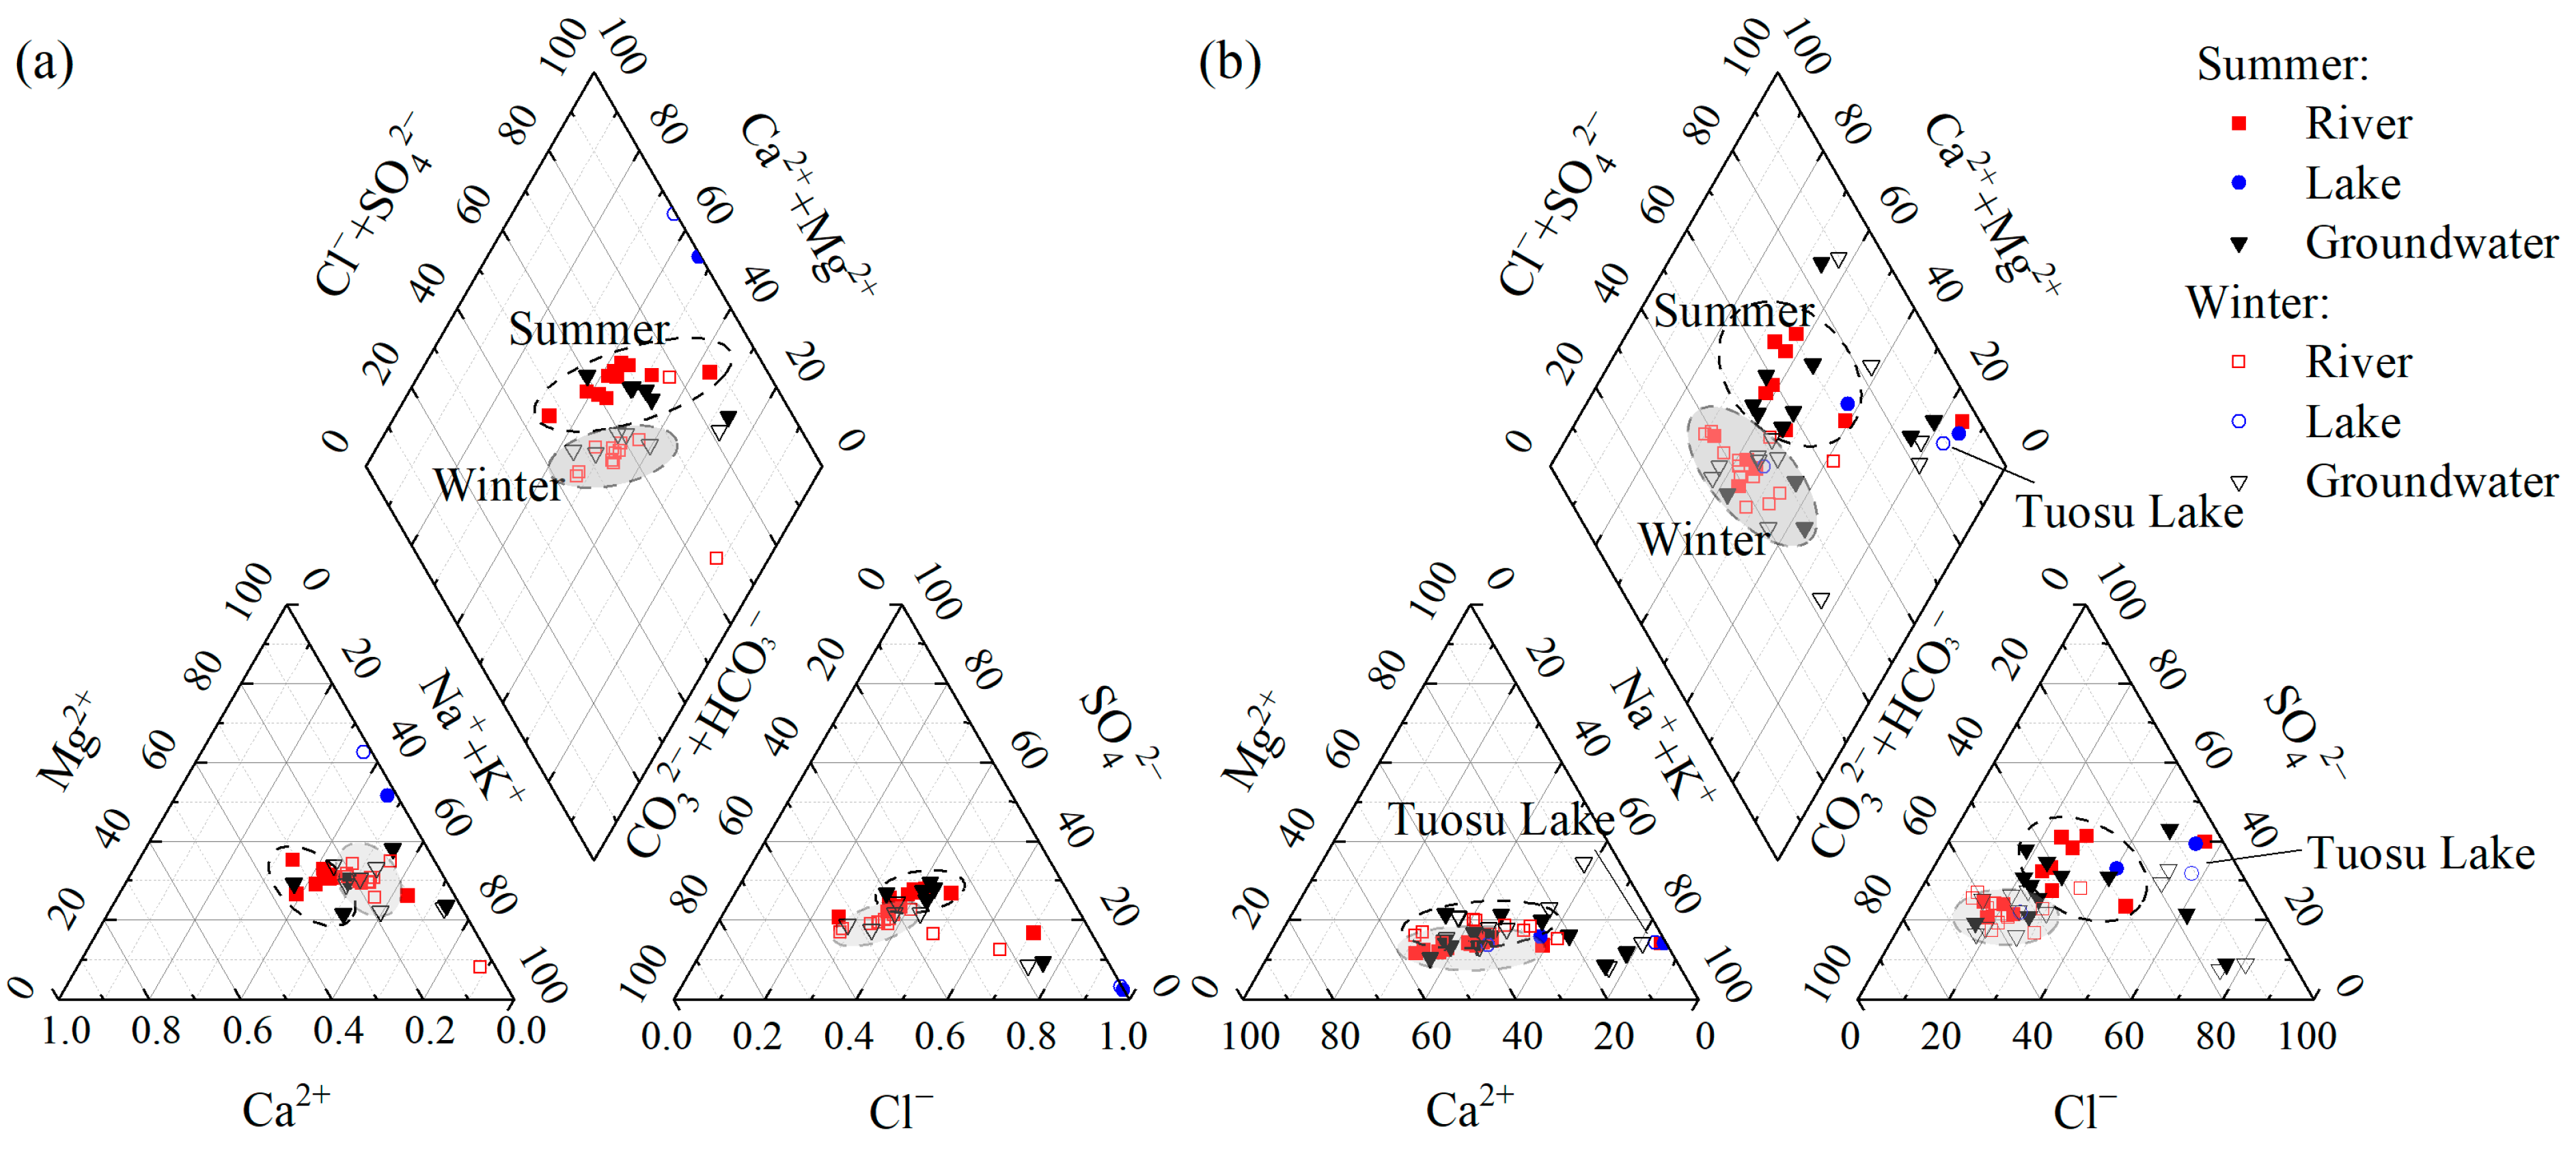
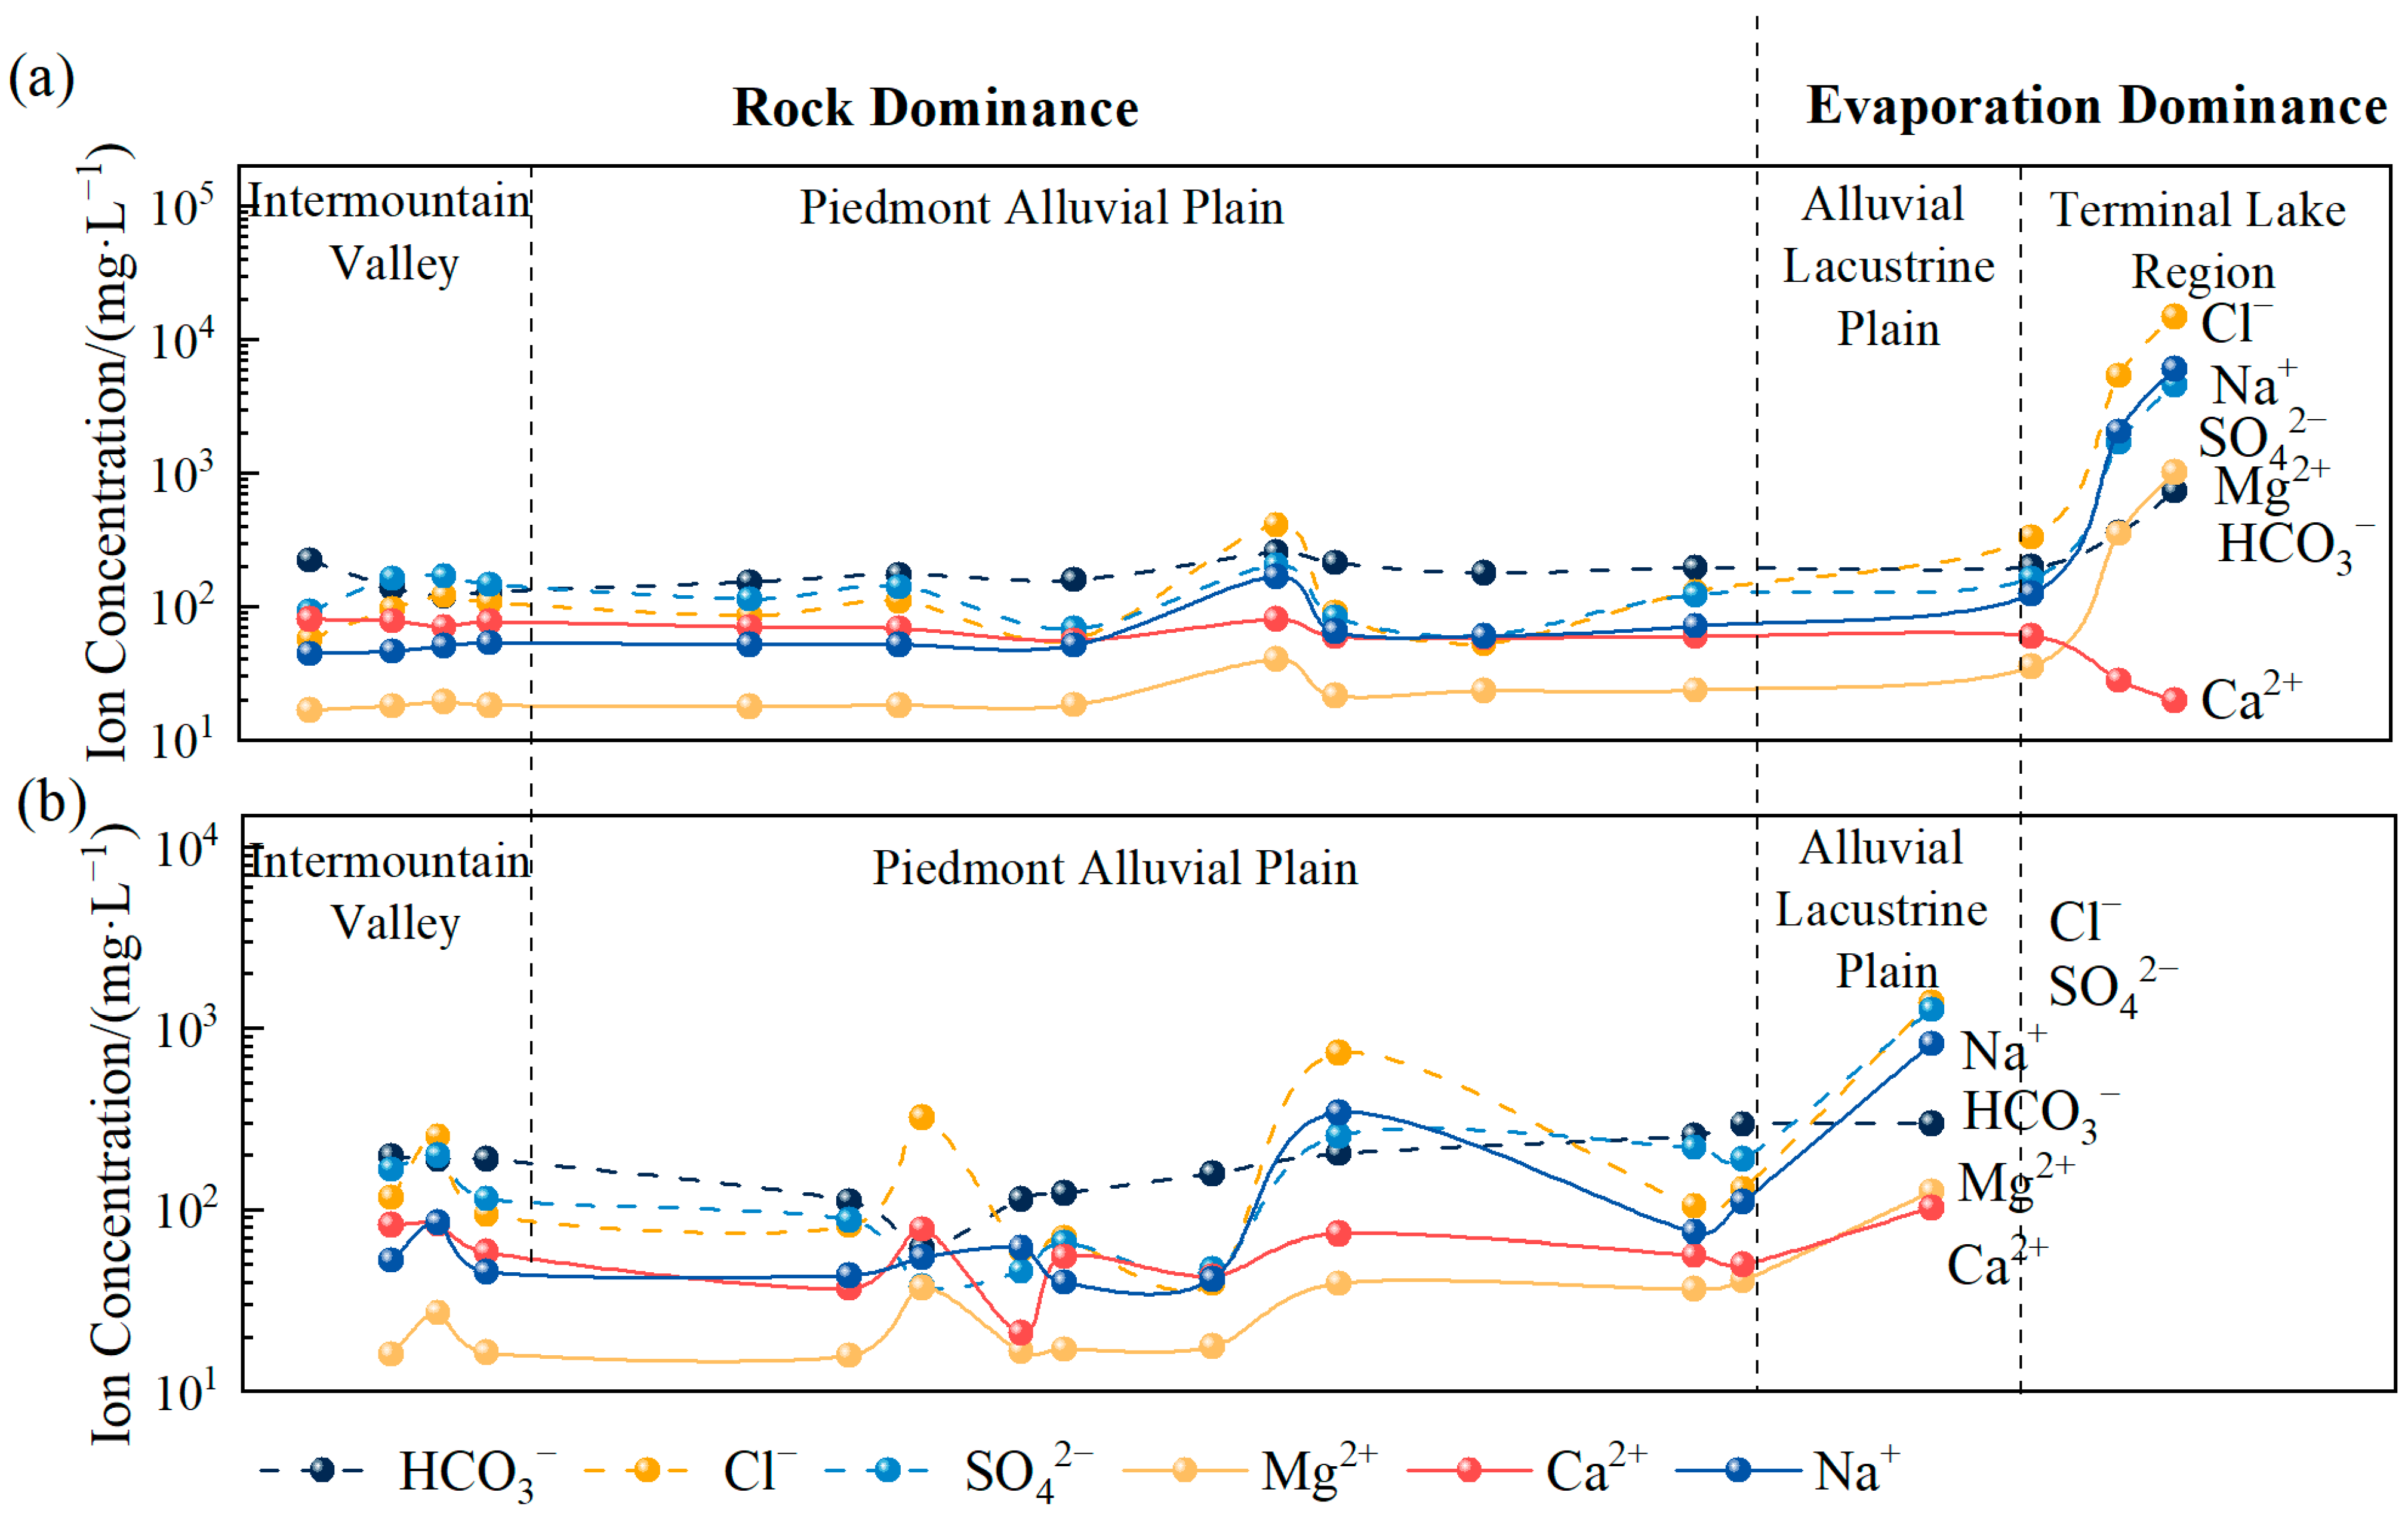
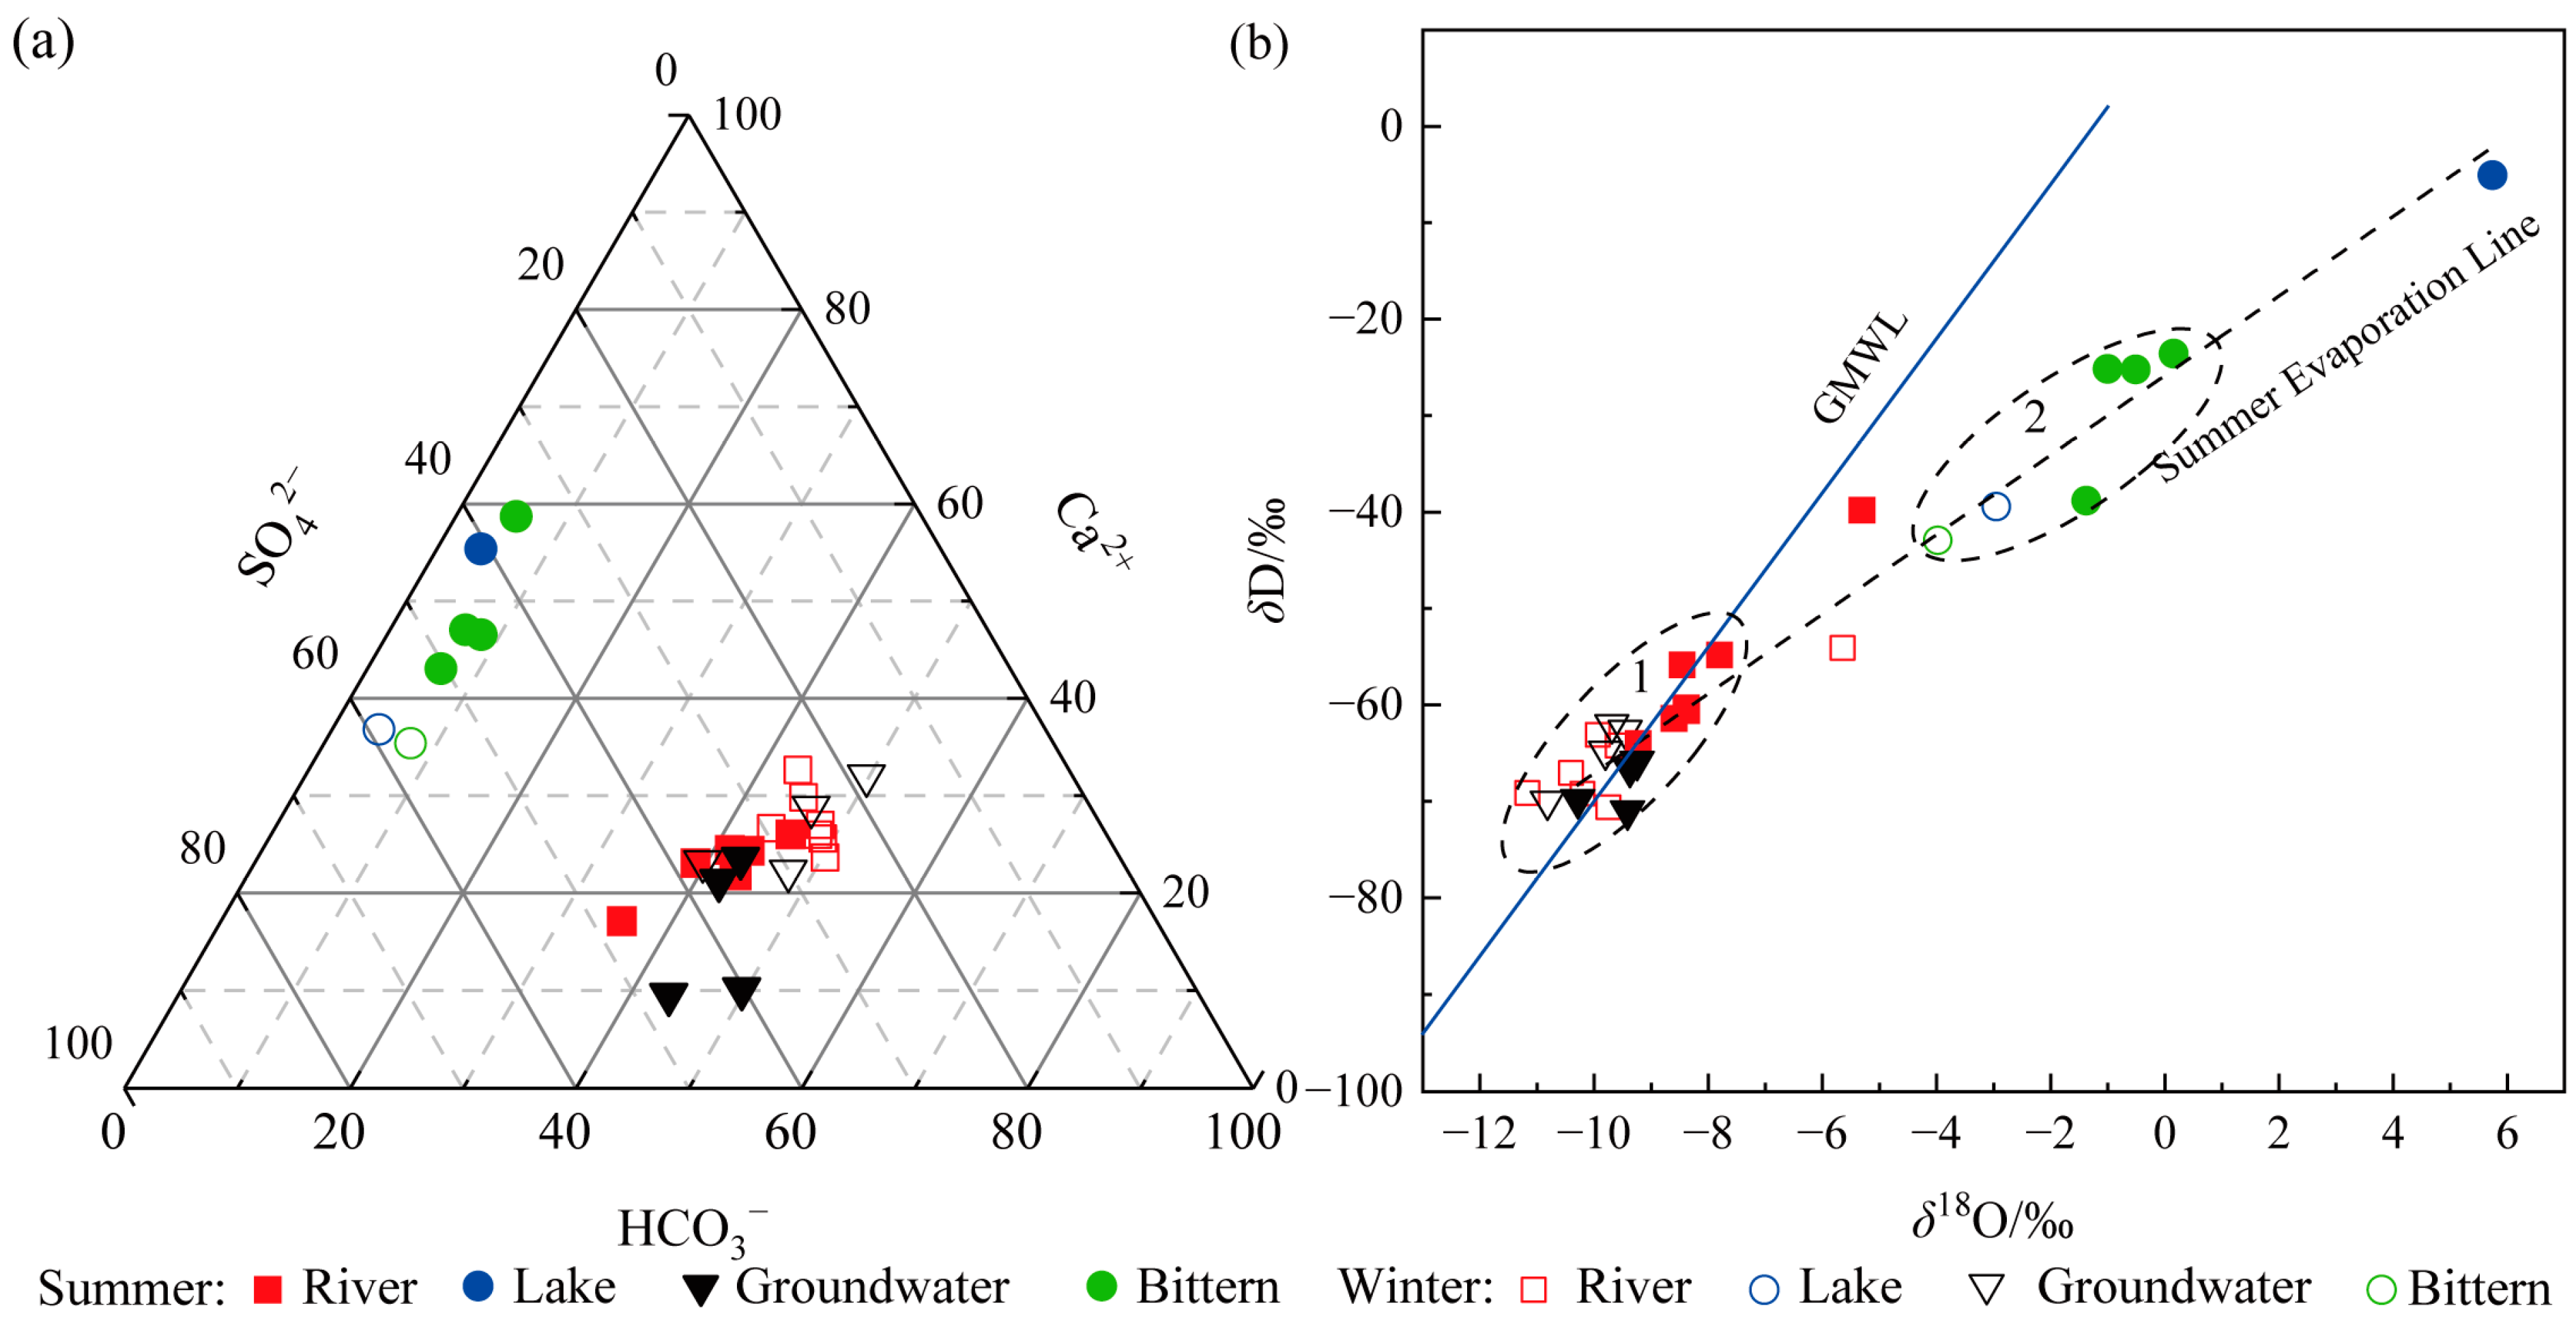
- Spatially, there are significant differences in pH and HCO3− across various watersheds. The hydrochemical types of river water and groundwater in the northern region are HCO3·Cl·SO4-Na·Ca, while those in the southern region are of the Cl·SO4-Na·Ca type. The terminal lake of Bayin River is of the Cl·SO4-Na type, and Golmud River is of the Cl-Na·Mg type. These differences arise primarily due to significant variations in the lithology of the aquifers. The southern basin is more strongly influenced by the dissolution and evaporation of saline rocks, while the northern basin is influenced by carbonate weathering. There are significant differences in H-O isotopes, as the water vapor sources in the southern and northern basins are different. The southern basin receives a greater contribution of water vapor transported by the mid-latitude westerlies, while water vapor in the northern basin mainly results from local evaporation;
- (2)
- Temporally, there are distinct seasonal differences in water temperatures and δ18O in the two watersheds, as well as TDS, HCO3−, and δD in the Golmud River watershed. River water, groundwater, and water from Keluke Lake exhibit significant seasonal differences with respect to hydrochemical types. During the winter, there is a depletion of Ca2+, Cl−, and SO42− and an enrichment of HCO3−, Mg2+, and Na+ compared to the summer. These variations arise from different hydrochemical influences in the summer and winter seasons, with the water body being more affected by water–rock interactions in the summer. There are significant seasonal differences in H-O isotopes in Golmud River due to the substantial seasonal differences in the effective evaporation rate and the water vapor recycling rate in the southern basin;
- (3)
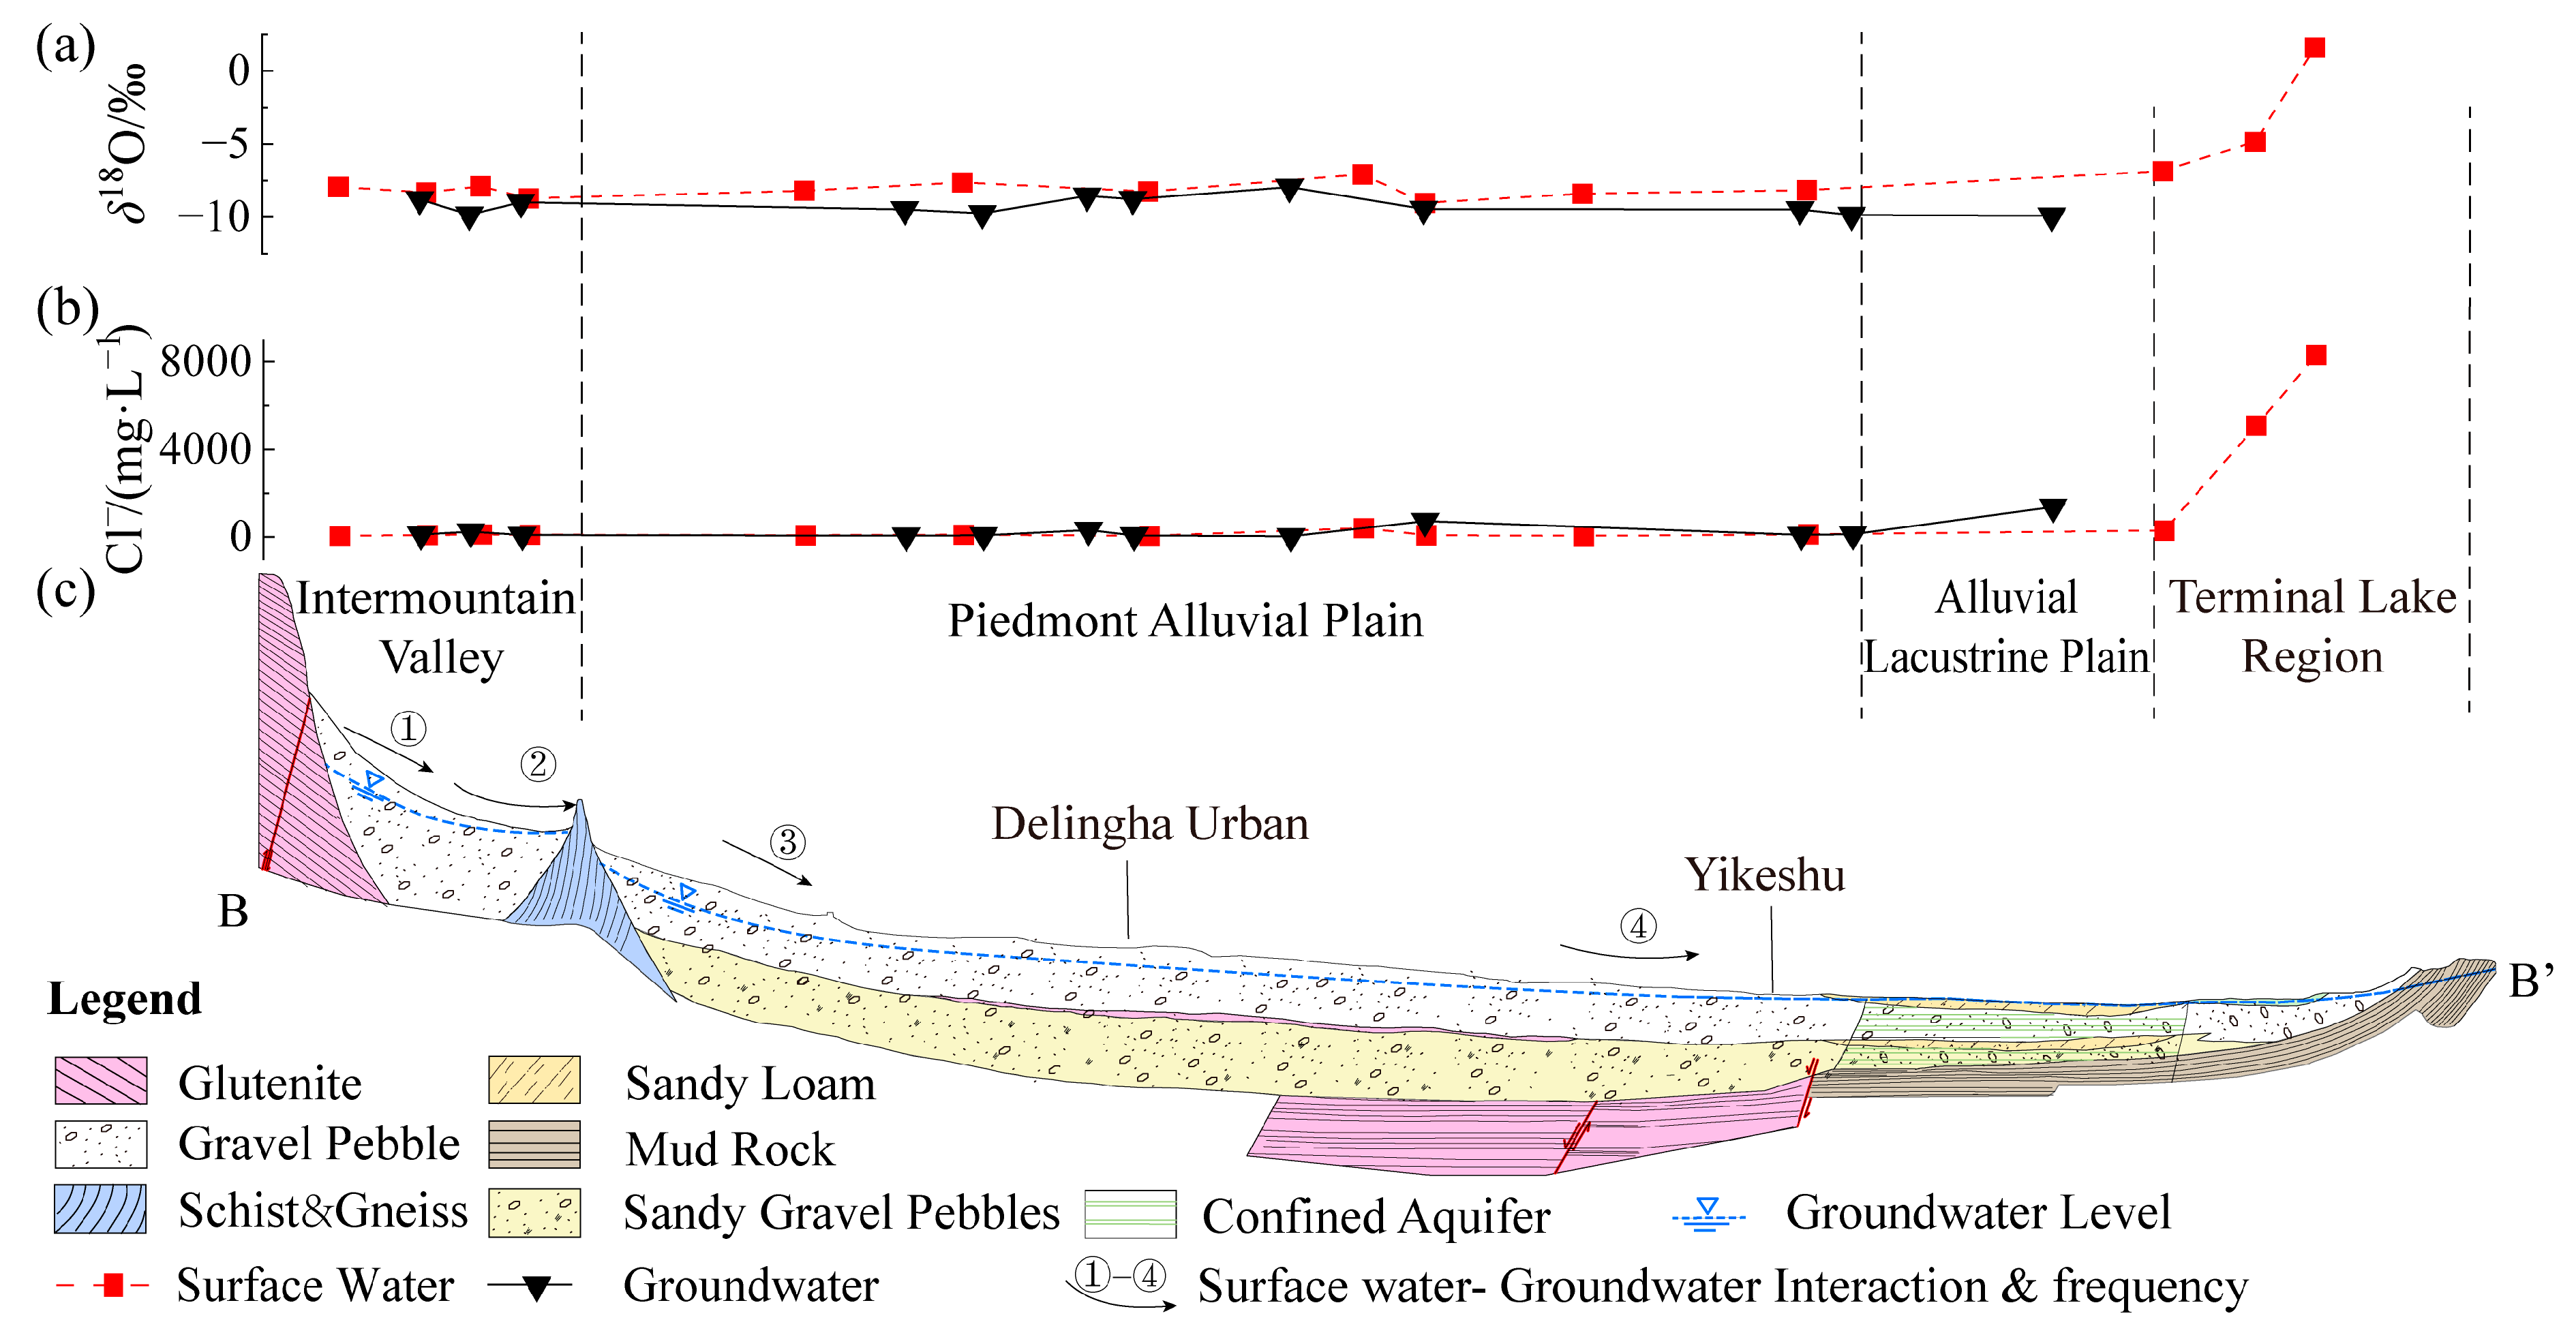
- Similar characteristics of river water and groundwater are attributed to frequent transformations between surface water and groundwater from the river mouth to the terminal lake. Geological structures, strata, and topography are controlling factors, and seasonal hydro-meteorological conditions influence localized transformation relationships. The minimal seasonal impact on the salt content of terminal lakes is mainly due to the effects of salt accumulation, and this is supplemented via other sources of groundwater. The leaching action of upstream river water and groundwater and intense downstream evaporation contribute to a portion of the salt content in the terminal lake. However, East Dabson Lake is also influenced by deep-seated fissure water from the northern oil fields, while the salt source of Tuosu Lake may be related to the surrounding volcanoes present during the formation of the lake.
Author Contributions
Funding
Data Availability Statement
Acknowledgments
Conflicts of Interest
Appendix A
| Sample Number | Location | Longitude | Latitude | Sampling Date | δ18O/‰ | δD/‰ | Attribution |
|---|---|---|---|---|---|---|---|
| P1 | Golmud | 95.091 | 36.346 | 1 July 2010 | 1.89 | 21.06 | [45] |
| P2 | Golmud | 95.091 | 36.346 | 5 July 2010 | −1.92 | −4.60 | |
| P3 | Golmud | 95.091 | 36.346 | 5 July 2010 | −1.94 | −6.28 | |
| P4 | Golmud | 95.091 | 36.346 | 8 July 2010 | −7.79 | −56.96 | |
| P5 | Golmud | 95.091 | 36.346 | 28 July 2010 | −10.48 | −95.39 | |
| P6 | Golmud | 95.091 | 36.346 | 2 August 2010 | −5.95 | −48.53 | |
| P7 | Golmud | 95.091 | 36.346 | 10 August 2010 | −0.24 | −28.08 | |
| P8 | Golmud | 95.091 | 36.346 | 16 August 2010 | −6.93 | −67.51 | |
| P9 | Golmud | 95.091 | 36.346 | 15 September 2010 | −0.32 | −19.69 | |
| P10 | Golmud | 95.091 | 36.346 | 18 September 2010 | −14.88 | −110.38 | |
| P11 | Golmud | 95.091 | 36.346 | 20 September 2010 | −12.02 | −124.00 | |
| P12 | Golmud | 95.091 | 36.346 | 24 September 2010 | −16.23 | −125.42 | |
| P13 | Golmud | 95.091 | 36.346 | 27 September 2010 | −9.01 | −66.43 | |
| P14 | Golmud | 94.563 | 35.874 | June to September 2019 | −10.77 | −67.21 | [43] |
| P15 | Delingha | 96.82 | 37.48 | 26 July 2019 | −3.28 | −17.54 | This article |
| P16 | Delingha | 96.82 | 37.48 | 27 July 2019 | −2.39 | −13.19 | |
| P17 | Delingha | 96.82 | 37.48 | 29 July 2019 | 1.09 | 11.74 | |
| P18 | Delingha | 96.82 | 37.48 | 3 August 2019 | −0.08 | −4.19 | |
| P19 | Delingha | 96.82 | 37.48 | 4 August 2019 | −2.00 | −6.62 | |
| P20 | Delingha | 96.82 | 37.48 | 5 August 2019 | −2.25 | −22.85 | |
| P21 | Delingha | 96.82 | 37.48 | 6 August 2019 | −5.42 | −37.98 | |
| P22 | Delingha | 96.82 | 37.48 | 11 August 2019 | −4.12 | −18.06 | |
| P23 | Delingha | 96.82 | 37.48 | 12 August 2019 | −2.22 | 2.62 | |
| P24 | Delingha | 96.82 | 37.48 | 27 August 2019 | −2.28 | −21.45 | |
| P25 | Delingha | 96.82 | 37.48 | 29 August 2019 | −6.55 | −37.88 | |
| P26 | Delingha | 97.464 | 37.902 | 1 July 2018 | −1.81 | −16.24 | |
| P27 | Delingha | 97.345 | 37.366 | 1 July 2018 | 6.43 | −45.32 | |
| P28 | Delingha | 97.345 | 37.366 | 3 June 2022 | 0.00 | 10.45 | |
| P29 | Delingha | 97.345 | 37.366 | 7 September 2022 | −2.26 | 7.31 | |
| P30 | Delingha | 97.345 | 37.366 | 24 August 2022 | −14.10 | −93.61 | |
| P31 | Delingha | 97.345 | 37.366 | 22 August 2022 | −15.55 | −113.32 | |
| P32 | Delingha | 97.345 | 37.366 | 20 June 2022 | −5.15 | −19.22 | |
| P33 | Delingha | 97.345 | 37.366 | 7 July 2022 | −5.23 | −23.33 | |
| P34 | Delingha | 97.345 | 37.366 | 25 June 2022 | 0.31 | 15.60 | |
| P35 | Delingha | 97.345 | 37.366 | 16 July 2022 | −4.51 | −14.92 | |
| P36 | Delingha | 97.345 | 37.366 | 18 July 2022 | −9.32 | −48.90 | |
| P37 | Delingha | 97.506 | 37.933 | 26 May 20222022/5/26 | −7.26 | −40.40 | |
| P38 | Delingha | 97.370 | 37.319 | 1 December, 2018 | −34.14 | −241.71 | |
| P39 | Delingha | 97.370 | 37.319 | 1 December, 2018 | −23.43 | −177.03 | |
| P40 | Delingha | 97.284 | 37.349 | June to September 2010 | −7.85 | −51.00 | [45] |
| Watershed | Value | T/°C | pH | TDS | SAL | F− | Cl− | NO3− | SO42− | CO32− | HCO3− | Ca2+ | K+ | Mg2+ | Na+ | δD | δ18O |
|---|---|---|---|---|---|---|---|---|---|---|---|---|---|---|---|---|---|
| Yuqia River | Min. | 7.9 | 7.7 | 162.2 | 0.1 | 0.2 | 39.5 | 0.0 | 12.6 | 0.0 | 42.0 | 10.3 | 1.0 | 3.1 | 33.1 | −78.7 | −11.4 |
| Max. | 20.1 | 9.9 | 978.6 | 0.8 | 22.2 | 415.9 | 26.5 | 450.2 | 13.9 | 309.8 | 107.2 | 11.8 | 69.5 | 261.6 | −66.8 | −9.9 | |
| Mean | 11.9 | 8.5 | 462.1 | 0.4 | 1.3 | 129.8 | 3.6 | 137.9 | 0.8 | 142.0 | 47.9 | 3.9 | 17.4 | 92.6 | −71.9 | −10.7 | |
| SD | 3.0 | 0.4 | 210.1 | 0.2 | 3.6 | 95.6 | 5.0 | 119.9 | 3.2 | 45.9 | 19.5 | 2.4 | 13.0 | 63.9 | 3.4 | 0.4 | |
| Bayin River | Min. | 8.1 | 7.6 | 190.0 | 0.0 | 0.0 | 22.7 | 0.0 | 37.6 | 0.0 | 61.2 | 19.6 | 1.8 | 14.0 | 38.8 | −76.5 | −10.4 |
| Max. | 25.6 | 9.7 | 18,152.7 | 17.2 | 21.1 | 8306.0 | 162.4 | 5956.5 | 200.0 | 731.6 | 251.4 | 136.0 | 1019.0 | 6008.0 | 0.0 | 1.6 | |
| Mean | 13.5 | 8.2 | 1020.9 | 0.8 | 0.8 | 378.3 | 11.9 | 315.6 | 3.2 | 195.4 | 64.8 | 7.5 | 51.2 | 246.6 | −56.9 | −8.2 | |
| SD | 4.5 | 0.4 | 2366.9 | 2.2 | 2.9 | 1189.4 | 23.3 | 848.2 | 24.8 | 89.0 | 30.5 | 18.8 | 130.5 | 783.5 | 10.2 | 1.7 | |
| Chanhanwusu River | Min. | 7.1 | 7.8 | 849.0 | 0.7 | 0.3 | 263.4 | 0.1 | 10.2 | 0.0 | 32.9 | 83.3 | 6.4 | 14.8 | 189.9 | −90.3 | −12.4 |
| Max. | 19.6 | 8.9 | 1556.8 | 1.2 | 4.7 | 1077.6 | 34.6 | 604.4 | 0.0 | 258.2 | 175.0 | 9.4 | 36.7 | 474.1 | −64.2 | −9.7 | |
| Mean | 11.0 | 8.2 | 1123.0 | 0.9 | 0.7 | 547.7 | 11.2 | 332.5 | 0.0 | 180.8 | 111.4 | 7.4 | 24.6 | 260.2 | −78.2 | −11.1 | |
| SD | 3.1 | 0.3 | 201.3 | 0.2 | 0.9 | 220.8 | 9.1 | 152.3 | 0.0 | 55.6 | 21.1 | 0.8 | 5.6 | 71.1 | 5.6 | 0.6 | |
| Xiangride River | Min. | 4.0 | 7.6 | 163.5 | 0.1 | 0.1 | 6.3 | 0.0 | 8.8 | 0.0 | 43.0 | 15.6 | 4.2 | 13.7 | 88.2 | −73.2 | −10.5 |
| Max. | 23.3 | 9.3 | 1202.5 | 0.9 | 2.9 | 356.9 | 50.9 | 606.3 | 13.9 | 330.4 | 113.0 | 13.9 | 63.4 | 241.4 | −51.6 | −5.6 | |
| Mean | 12.7 | 8.4 | 689.9 | 0.5 | 0.4 | 189.6 | 8.8 | 241.9 | 1.3 | 196.4 | 62.9 | 6.0 | 34.9 | 122.6 | −64.2 | −8.9 | |
| SD | 4.4 | 0.5 | 189.6 | 0.2 | 0.5 | 68.9 | 10.2 | 112.1 | 3.9 | 61.0 | 23.7 | 2.1 | 9.9 | 35.9 | 5.5 | 1.2 | |
| Golmud River | Min. | 7.8 | 7.2 | 378.8 | 0.3 | 0.1 | 56.2 | 0.0 | 61.1 | 0.0 | 39.8 | 6.6 | 2.8 | 20.3 | 50.3 | −71.2 | −10.3 |
| Max. | 20.7 | 9.8 | 282,277.1 | 261.8 | 19.7 | 173,154.0 | 256.2 | 5813.7 | 31.0 | 707.8 | 3290.0 | 3248.0 | 48,900.0 | 81,780.0 | −5.1 | 5.7 | |
| Mean | 13.9 | 8.6 | 9829.8 | 9.0 | 1.0 | 5839.5 | 20.2 | 415.7 | 2.7 | 196.0 | 147.8 | 110.9 | 1617.2 | 2775.7 | −61.0 | −8.3 | |
| SD | 3.5 | 0.6 | 50,565.6 | 46.9 | 3.5 | 31,053.0 | 62.6 | 1039.7 | 7.2 | 111.4 | 583.7 | 582.2 | 8775.4 | 14,662.9 | 12.2 | 2.8 | |
| Qaidam Basin (5 watersheds) | Min. | 4.0 | 7.2 | 162.2 | 0.0 | 0.0 | 6.3 | 0.0 | 8.8 | 0.0 | 32.9 | 6.6 | 1.0 | 3.1 | 33.1 | −90.3 | −12.4 |
| Max. | 25.6 | 9.9 | 282,277.1 | 261.8 | 22.2 | 173,154.0 | 256.2 | 5956.5 | 200.0 | 731.6 | 3290.0 | 3248.0 | 48,900.0 | 81,780.0 | 0.0 | 5.7 | |
| Mean | 12.8 | 8.4 | 2324.4 | 2.0 | 0.8 | 1215.3 | 11.1 | 286.8 | 2.0 | 184.1 | 80.2 | 23.6 | 297.0 | 612.7 | −64.2 | −9.2 | |
| SD | 4.0 | 0.5 | 20,630.6 | 19.1 | 2.7 | 12,627.4 | 29.5 | 659.5 | 15.0 | 80.9 | 237.5 | 236.7 | 3564.5 | 5969.7 | 11.1 | 2.0 | |
| Brine | Min. | 17.6 | 6.7 | 281,468.7 | 253.2 | 12.2 | 180,546.5 | 22.3 | 2994.7 | 0.0 | 704.6 | 1289.4 | 3790.0 | 32,520.0 | 46,280.0 | −38.8 | −1.4 |
| Max. | 20.3 | 7.8 | 417,249.5 | 375.4 | 17.4 | 211,549.5 | 32.6 | 4409.0 | 0.0 | 795.6 | 2862.0 | 12,604.0 | 57,340.0 | 74,300.0 | −23.6 | 0.2 | |
| Mean | 19.0 | 7.1 | 369,910.7 | 332.8 | 14.3 | 198,443.8 | 28.1 | 3907.2 | 0.0 | 741.4 | 1857.8 | 7497.5 | 48,160.0 | 64,035.0 | −28.2 | −0.7 | |
| SD | 1.2 | 0.5 | 62,814.4 | 56.5 | 2.4 | 13,318.2 | 4.5 | 628.2 | 0.0 | 39.1 | 691.8 | 3694.2 | 11,434.6 | 12,441.1 | 7.1 | 0.7 |
| Watershed | Value | T | pH | TDS | SAL | F− | Cl− | NO3− | SO42− | CO32− | HCO3− | Ca2+ | K+ | Mg2+ | Na+ | δD | δ18O |
|---|---|---|---|---|---|---|---|---|---|---|---|---|---|---|---|---|---|
| Bayin River | Min. | −0.2 | 6.9 | 344.1 | 0.0 | 0.7 | 43.5 | 0.3 | 32.0 | 0.0 | 36.4 | 27.1 | 3.0 | 18.4 | 42.5 | −94.2 | −13.1 |
| Max. | 8.1 | 9.7 | 5508.9 | 4.6 | 3.1 | 1848.3 | 11.1 | 1027.3 | 68.4 | 335.4 | 120.6 | 41.2 | 298.9 | 1709.0 | −40.3 | −5.4 | |
| Mean | 3.1 | 8.4 | 888.2 | 0.6 | 1.2 | 232.9 | 5.7 | 151.6 | 4.0 | 206.7 | 66.7 | 6.5 | 51.6 | 204.1 | −59.5 | −9.5 | |
| SD | 3.0 | 0.5 | 1087.8 | 1.0 | 0.6 | 396.5 | 2.7 | 216.8 | 14.1 | 65.4 | 26.7 | 7.5 | 60.4 | 370.0 | 9.6 | 1.4 | |
| Golmud River | Min. | −5.5 | 7.9 | 479.2 | 0.4 | 0.8 | 68.3 | 0.5 | 45.3 | 0.0 | 61.4 | 11.8 | 4.7 | 32.5 | 84.6 | −72.5 | −11.5 |
| Max. | 9.1 | 9.4 | 195,635.7 | 175.8 | 4.9 | 103,499.3 | 22.8 | 4820.8 | 111.0 | 432.5 | 1255.0 | 2562.0 | 25,500.0 | 26,990.0 | −39.5 | −3.0 | |
| Mean | 2.1 | 8.7 | 10,966.5 | 9.8 | 1.4 | 5598.3 | 6.5 | 342.0 | 17.2 | 236.6 | 106.6 | 192.8 | 1388.6 | 1571.8 | −64.9 | −9.6 | |
| SD | 3.6 | 0.4 | 44,720.2 | 40.2 | 0.9 | 23,708.0 | 5.4 | 1085.0 | 25.0 | 66.6 | 278.3 | 617.1 | 5838.9 | 6155.6 | 7.5 | 2.0 | |
| Brine | Value | 2.2 | 7.3 | 274,318.1 | 253.8 | 172,651.2 | 349.5 | 44.3 | 3924.9 | 0.0 | 671.4 | 1018.0 | 3744.0 | 30,620.0 | 64,840.0 | −43.0 | −4.0 |
References
- Yin, J.; Wei, J.; Li, Q.; Ayantobo, O.O. Regional Characteristics and Impact Factors of Change in Terrestrial Water Storage in Northwestern China from 2002 to 2020. IEEE J. Sel. Top. Appl. Earth Obs. Remote Sens. 2023, 16, 386–398. [Google Scholar] [CrossRef]
- Chen, Y.; Li, Z.; Xu, J.; Shen, Y.; Xing, X.; Xie, T.; Li, Z.; Yang, L.; Xi, H.; Zhu, C.; et al. Changes and Protection Suggestions in Water Resources and Ecological Environment in Arid Region of Northwest China. Bull. Chin. Acad. Sci. 2023, 38, 385–393. [Google Scholar] [CrossRef]
- Abbas, M.; Zhao, L.; Wang, Y. Perspective Impact on Water Environment and Hydrological Regime Owing to Climate Change: A Review. Hydrology 2022, 9, 203. [Google Scholar] [CrossRef]
- Zhang, X.; Chen, J.; Chen, J.; Ma, F.; Wang, T. Lake Expansion under the Groundwater Contribution in Qaidam Basin, China. Remote Sens. 2022, 14, 1756. [Google Scholar] [CrossRef]
- Wei, L.; Jiang, S.; Ren, L.; Tan, H.; Ta, W.; Liu, Y.; Yang, X.; Zhang, L.; Duan, Z. Spatiotemporal changes of terrestrial water storage and possible causes in the closed Qaidam Basin, China using GRACE and GRACE Follow-On data. J. Hydrol. 2021, 598, 126274. [Google Scholar] [CrossRef]
- Fan, Q.; Cheng, Y.; Chen, T.; Xu, N. Influence of Water Replenishment of Lakes in the Northern Qaidam Basin on Salt Lake Resources and Ecological Environment. J. Salt Lake Res. 2022, 30, 11–18. [Google Scholar]
- Zhao, D.; Wang, G.; Liao, F.; Yang, N.; Jiang, W.; Guo, L.; Liu, C.; Shi, Z. Groundwater-surface water interactions derived by hydrochemical and isotopic (222Rn, deuterium, oxygen-18) tracers in the Nomhon area, Qaidam Basin, NW China. J. Hydrol. 2018, 565, 650–661. [Google Scholar] [CrossRef]
- Lv, A.; Zhang, C. Analysis of the Characteristics and Driving Forces of Changes in Lake Water Volume in Inland Arid Basins in China. Water 2022, 14, 3141. [Google Scholar] [CrossRef]
- Yang, N.; Wang, G.; Shi, Z.; Zhao, D.; Jiang, W.; Guo, L.; Liao, F.; Zhou, P. Application of Multiple Approaches to Investigate the Hydrochemistry Evolution of Groundwater in an Arid Region: Nomhon, Northwestern China. Water 2018, 10, 1667. [Google Scholar] [CrossRef]
- Wang, Y.; Guo, H.; Li, J. Investigation and evaluation of groundwater resources and environmental problems in Qaidam Basin. In Investigation and Evaluation of Groundwater Resources and Environmental Problems in Qaidam Basin; Geological Publishing House: Beijing, China, 2008; pp. 49–211. [Google Scholar]
- Yang, N.; Zhou, P.; Wang, G.; Zhang, B.; Shi, Z.; Liao, F.; Li, B.; Chen, X.; Guo, L.; Dang, X.; et al. Hydrochemical and isotopic interpretation of interactions between surface water and groundwater in Delingha, Northwest China. J. Hydrol. 2021, 598, 126243. [Google Scholar] [CrossRef]
- Xiao, Y.; Shao, J.; Cui, Y.; Zhang, G.; Zhang, Q. Groundwater circulation and hydrogeochemical evolution in Nomhon of Qaidam Basin, northwest China. J. Earth Syst. Sci. 2017, 126, 26. [Google Scholar] [CrossRef]
- Han, J.; Xu, J.; Yi, L.; Chang, Z.; Wang, J.; Ma, H.; Zhang, B.; Jiang, H. Seasonal Interaction of River Water-Groundwater-Salt Lake Brine and Its Influence on Water-Salt Balance in the Nalenggele River Catchment in Qaidam Basin, NW China. J. Earth Sci. 2022, 33, 1298–1308. [Google Scholar] [CrossRef]
- Zhang, C.; Lv, A.; Jia, S.; Qi, S. Longterm multisource satellite data fusion reveals dynamic expansion of lake water area and storage in a hyperarid basin of China. J. Hydrol. 2022, 610, 127888. [Google Scholar] [CrossRef]
- Li, W.; He, Q. Discussion on the Origins of the Materials in Qarhan Salt Lake. J. Hebei Coll. Geol. 1993, 16, 254–263. [Google Scholar]
- Zhang, X.; Fan, Q.; Li, Q.; Du, Y.; Qin, Z.; Wei, H.; Shan, F. The Source, Distribution, and Sedimentary Pattern of K-Rich Brines in the Qaidam Basin, Western China. Minerals 2019, 9, 655. [Google Scholar] [CrossRef]
- Yi, J.; Fan, Q.; Wei, H.; Wang, M.; Qin, Z.; Yuan, Q.; Shan, F. The Characteristics of the Mineral Assemblage and the Forming Clue in Qarhan Salt Lake. J. Salt Lake Res. 2017, 25, 47–54. [Google Scholar]
- Li, J.; Chen, F.; Ling, Z.; Li, T. Lithium sources in oilfield waters from the Qaidam Basin, Tibetan Plateau: Geochemical and Li isotopic evidence. Ore Geol. Rev. 2021, 139, 104481. [Google Scholar] [CrossRef]
- Chen, L.; Ma, T.; Ma, J.; Du, Y.; Xiao, C. Identification of material source for the salt lakes in the Qaidam Basin. Hydrogeol. Eng. Geol. 2015, 42, 101–107. [Google Scholar] [CrossRef]
- Zhang, X.; Li, Q.; Qin, Z.; Fan, Q.; Du, Y.; Wei, H.; Gao, D.; Shan, F. Boron isotope geochemistry of a brine-carbonate system in the Qaidam Basin, western China. Sediment. Geol. 2019, 383, 293–302. [Google Scholar] [CrossRef]
- Li, Q.; Fan, Q.; Wang, J.; Qin, Z.; Zhang, X.; Wei, H.; Du, Y.; Shan, F. Hydrochemistry, Distribution and Formation of Lithium-Rich Brines in Salt Lakes on the Qinghai-Tibetan Plateau. Minerals 2019, 9, 528. [Google Scholar] [CrossRef]
- Zhu, Y.; Zhong, J.; Li, W. The Neotectonic Movement and the Evolution of Saline Lakes of Qaidam Basin in Northwestern China. In The Neotectonic Movement and the Evolution of Saline Lakes of Qaidam Basin in Northwestern China; Geological Publishing House: Beijing, China, 1994; pp. 90–99. [Google Scholar]
- Hussainzadeh, J.; Samani, S.; Mahaqi, A. Investigation of the geochemical evolution of groundwater resources in the Zanjan plain, NW Iran. Environ. Earth Sci 2023, 82, 123. [Google Scholar] [CrossRef]
- Kileshye Onema, J.-M.; Taigbenu, A.E.; Ndiritu, J. Classification and flow prediction in a data-scarce watershed of the equatorial Nile region. Hydrol. Earth Syst. Sci. 2012, 16, 1435–1443. [Google Scholar] [CrossRef]
- Yang, H.; Wei, J.; Ren, Q. Interaction between surface water and groundwater and hydrochemical characteristics in the typical watersheds of the Qaidam Basin. Arid Zone Res. 2022, 39, 1543–1554. [Google Scholar] [CrossRef]
- Alomari, A.H.; Carvalho, F.P.; Saleh, M.A.; Al-Malkawi, G.; Hashim, S.; Bilbiesy, E.; Banikhalaf, R.; Al-Sayaheen, A.; Abosalim, F.; Sharat, D.; et al. Seasonal Variation In Major Ions Chemistry and Radionuclide Concentrations In Groundwater: A Case Study In The Amman-Zarqa Basin (Jordan). Water Air Soil Pollut. 2023, 234, 256. [Google Scholar] [CrossRef]
- Caporaso, J.G.; Kuczynski, J.; Stombaugh, J.; Bittinger, K.; Bushman, F.D.; Costello, E.K.; Fierer, N.; Peña, A.G.; Goodrich, J.K.; Gordon, J.I.; et al. QIIME allows analysis of high-throughput community sequencing data. Nat. Methods 2010, 7, 335–336. [Google Scholar] [CrossRef] [PubMed]
- Piper, A.M. A graphic procedure in the geochemical interpretation of water-analyses. Trans. AGU 1944, 25, 914. [Google Scholar] [CrossRef]
- Shi, K.; Li, T.; Zhao, J.; Su, Y.; Gao, J.; Li, J. Atmospheric recycling of agricultural evapotranspiration in the Tarim Basin. Front. Earth Sci. 2022, 10, 950299. [Google Scholar] [CrossRef]
- Zhang, Y.; Xu, J.; Yan, Y.; Su, W.; Luo, P.; Yu, H. Characteristics and Moisture Sources of the StableIsotopes in Precipitation at the Monsoon MarginalRegion of North-Central China. Pol. J. Environ. Stud. 2022, 31, 1963–1974. [Google Scholar] [CrossRef]
- Gibbs, R.J. Mechanisms Controlling World Water Chemistry. Sci. New Ser. 1970, 170, 1088–1090. [Google Scholar] [CrossRef]
- Van Der Ent, R.J.; Savenije, H.H.G.; Schaefli, B.; Steele-Dunne, S.C. Origin and fate of atmospheric moisture over continents. Water Resour. Res. 2010, 46, 2010WR009127. [Google Scholar] [CrossRef]
- Van Der Ent, R.J.; Tuinenburg, O.A.; Knoche, H.-R.; Kunstmann, H.; Savenije, H.H.G. Should we use a simple or complex model for moisture recycling and atmospheric moisture tracking? Hydrol. Earth Syst. Sci. 2013, 17, 4869–4884. [Google Scholar] [CrossRef]
- Shi, K.; Lang, Q.; Huang, Y.; Zhao, J.; Wang, H.; Chen, G.; Zhang, Q.; Yin, H.; Su, Y.; Wang, P. Analysis of the water-vapor sources in rainstorm processes in Tianjin city based on the trajectory method. Atmos. Sci. Lett. 2023, e1196. [Google Scholar] [CrossRef]
- Yang, K.; Tang, Q.; Lu, H. Analysis of precipitation recirculation rate and water vapor sources in Tibetan Plateau. Sci. Sin. Terrae 2022, 52, 574–578. [Google Scholar]
- Miao, Q.; Li, X.; Xu, Y.; Liu, C.; Xie, R.; Lv, Z. Chemical characteristics of groundwater and source identification in a coastal city. PLoS ONE 2021, 16, e0256360. [Google Scholar] [CrossRef] [PubMed]
- Yang, N.; Wang, G. Spatial variation of water stable isotopes of multiple rivers in southeastern Qaidam Basin, northeast Qinghai-Tibetan Plateau: Insights into hydrologic cycle. J. Hydrol. 2024, 628, 130464. [Google Scholar] [CrossRef]
- Zhang, Y.; Tan, H.; Cong, P.; Shi, D.; Rao, W.; Zhang, X. Isotopic variations in surface waters and groundwaters of an extremely arid basin and their responses to climate change. Hydrol. Earth Syst. Sci. 2023, 27, 4019–4038. [Google Scholar] [CrossRef]
- Dansgaard, W. Stable isotopes in precipitation. Tellus 1964, 16, 436–468. [Google Scholar] [CrossRef]
- Gu, W. Isotope Hydrology. In Isotope Hydrology; Science Press: Beijing, China, 2011; pp. 150–173. [Google Scholar]
- Froehlich, K.; Gibson, J.J. Deuterium excess in precipitation and its climatological significance. In Study of Environmentalchange Using Isotope Techniques; C&S Papers Series 13; International Atomic Energy Agency: Vienna, Austria, 2002; pp. 54–65. [Google Scholar]
- Yang, M.; Yao, T.; Tian, L.; Lu, A. Analysis of Precipitation From Different Water Vapor Sources in Tibetan Plateau. Sci. Geogr. Sin. 2004, 24, 426–431. [Google Scholar]
- Rao, W.; Li, Y.; Tan, H.; Li, Y.; Wen, C.; Zhang, X. Stable hydrogen-oxygen isotope composition and atmospheric moisture sources of precipitation in an arid-alpine region: A case study of the Golmud River Watershed on the north slope of the Kunlun Mountains. JHE 2021, 52, 1116–1125. [Google Scholar] [CrossRef]
- Yang, N.; Wang, G. Moisture sources and climate evolution during the last 30 kyr in northeastern Tibetan Plateau: Insights from groundwater isotopes (2H, 18O, 3H and 14C) and water vapour trajectories modeling. Quat. Sci. Rev. 2020, 242, 106426. [Google Scholar] [CrossRef]
- Zhu, J.; Chen, H.; Gong, G. Hydrogen and Oxygen Isotopic ompositions of Precipitation and Its Water Vapor Sources in Eastern Qaidam Basin. Environ. Sci. 2015, 36, 2784–2790. [Google Scholar] [CrossRef]
- Kiyani, V.; Esmaili, A.; Alijani, F.; Samani, S.; Vasić, L. Investigation of drainage structures in the karst aquifer system through turbidity anomaly, hydrological, geochemical and stable isotope analysis (Kiyan springs, western Iran). Environ. Earth Sci. 2022, 81, 517. [Google Scholar] [CrossRef]
- Zhao, Z.; Liu, Z.; Xu, W. Hydrogeological Survey of Alluvial Fan Water Supply in Bayin River, Delingha City, Qinghai Province; Qinghai Environmental Geology Exploration Bureau: Xining, China, 2017; pp. 35–42. [Google Scholar]
- Zhang, B.; Zhao, D.; Zhou, P.; Qu, S.; Liao, F.; Wang, G. Hydrochemical Characteristics of Groundwater and Dominant Water–Rock Interactions in the Delingha Area, Qaidam Basin, Northwest China. Water 2020, 12, 836. [Google Scholar] [CrossRef]
- Fan, Q.; Ma, H.; Tan, H.; Li, T. Geochemistry Characteristics of Sulfur Isotope in Oilfield Brine of the Western Qaidam Basin. Bull. Mineral. Petrol. Geochem. 2009, 28, 137–142. [Google Scholar]
- Duan, Z.; Yuan, J. The Origin of Saline Materials of Qarhan Salt Lake in Qaidam Basin, China. Geoscience 1988, 2, 420–428. [Google Scholar]
- Davis, S.N.; Whittemore, D.O.; Fabryka-Martin, J. Use of ChlorideBromide Ratios in Studies of Potable Water. Groundwater 1988, 36, 338–350. [Google Scholar] [CrossRef]
- Alcalá, F.J.; Custodio, E. Using the Cl/Br ratio as a tracer to identify the origin of salinity in aquifers in Spain and Portugal. J. Hydrol. 2008, 359, 189–207. [Google Scholar] [CrossRef]
- Li, Q.; Fan, Q.; Wei, H.; Qin, Z.; Zhang, X.; Du, Y.; Shan, F. Sulfur isotope constraints on the formation of MgSO4−deficient evaporites in the Qarhan salt Lake, western China. J. Asian Earth Sci. 2020, 189, 104160. [Google Scholar] [CrossRef]
- Yao, S.; Zhang, J.; Li, W.; Li, H. Preliminary Investigation and Study on the Characteristics of Mud Volcanoes and the Cause of Tuosuo and Keluke Lakes in Lian Lake Area, Delingha. Northwest. Geol. 2016, 49, 155–163. [Google Scholar]





| Number | Watershed | River and Groundwater | Lake |
|---|---|---|---|
| (a) | Yuqia River | HCO3·Cl·SO4-Na·Ca | / |
| (b) | Bayin River | HCO3·Cl·SO4-Na·Ca | Cl·SO4-Na |
| (c) | Chahanwusu River | Cl·SO4-Na·Ca | / |
| (d) | Xiangride River | Cl·HCO3·SO4-Na·Ca | / |
| (e) | Golmud River | Cl·HCO3-Na·Ca | ClNa·Mg |
| Sampling Location | Type | δ18O/‰ | d-Excess/‰ | ||||||
|---|---|---|---|---|---|---|---|---|---|
| Min | Median | Max | Mean | Min | Median | Max | Mean | ||
| Golmud | Rain | −23.44 | −8.67 | 1.89 | −8.80 | −27.86 | 11.68 | 38.70 | 10.61 |
| River | −9.65 | −8.49 | −5.31 | −8.36 | 2.65 | 7.80 | 16.17 | 8.39 | |
| Delingha | Rain | −34.14 | −5.16 | 1.09 | −6.96 | −4.82 | 11.66 | 31.45 | 12.01 |
| River | −9.03 | −8.18 | −4.83 | −7.87 | 1.70 | 9.15 | 14.38 | 9.11 | |
| Area | Season | Total Evaporation | Regional Total Precipitation | Regional Total Evaporation | Regional Actual Total Evaporation | Effective Evaporation Rate | Water Vapor Loss Rate | Regional Water Vapor Circulation Rate |
|---|---|---|---|---|---|---|---|---|
| mm/a | mm/a | mm/a | mm/a | % | % | % | ||
| Southern basin | Summer | 289.26 | 296.35 | 21.98 | 219.83 | 10.02 | 2.39 | 7.42 |
| Winter | 33.86 | 30.75 | 1.16 | 21.86 | 5.23 | −9.61 | 3.79 | |
| Northern basin | Summer | 113.65 | 112.35 | 7.55 | 126.09 | 5.90 | 7.06 | 6.05 |
| Winter | 16.09 | 16.06 | 0.45 | 11.88 | 3.53 | 2.41 | 2.56 |
| Sample Name/Type | Season | F− | CO32− | Ca2+ | Mg2+ | Na+ | Al3+ | Fe2+ |
|---|---|---|---|---|---|---|---|---|
| Tuosu Lake | Summer | 0.65 | 200.02 | 19.60 | 1019.00 | 6008 | 7.32 | 4 × 10⁻³ |
| Winter | 1.25 | 68.44 | 47.34 | 435.30 | 1709 | 0 | 0 | |
| Connected stream | Summer | 0.31 | 0 | 27.73 | 465.60 | 2048 | 0 | 7 × 10⁻⁴ |
| Winter | 0.85 | 20.96 | 69.06 | 73.20 | 177.30 | 0 | 0 | |
| Keluke Lake | Summer | 0.37 | 0 | 59.81 | 51.57 | 123.50 | 0 | 0 |
| Winter | 0.79 | 0 | 88.11 | 50.64 | 100.30 | 0 | 0 | |
| River water (mean) | Summer | 0.23 | 0 | 68.40 | 33.59 | 64.48 | 0 | 7.05 × 10⁻³ |
| Winter | 1.01 | 0 | 72.57 | 45.28 | 70.14 | 0 | 4.55 × 10⁻⁵ | |
| Groundwater (mean) | Summer | 0.28 | 0 | 61.42 | 52.34 | 147.29 | 0 | 6.98 × 10⁻² |
| Winter | 1.46 | 1.28 | 60.16 | 78.32 | 211.51 | 0 | 3.67 × 10⁻⁴ |
Disclaimer/Publisher’s Note: The statements, opinions and data contained in all publications are solely those of the individual author(s) and contributor(s) and not of MDPI and/or the editor(s). MDPI and/or the editor(s) disclaim responsibility for any injury to people or property resulting from any ideas, methods, instructions or products referred to in the content. |
© 2023 by the authors. Licensee MDPI, Basel, Switzerland. This article is an open access article distributed under the terms and conditions of the Creative Commons Attribution (CC BY) license (https://creativecommons.org/licenses/by/4.0/).
Share and Cite
Yang, H.; Wei, J.; Shi, K. Hydrochemical and Isotopic Characteristics and the Spatiotemporal Differences of Surface Water and Groundwater in the Qaidam Basin, China. Water 2024, 16, 169. https://doi.org/10.3390/w16010169
Yang H, Wei J, Shi K. Hydrochemical and Isotopic Characteristics and the Spatiotemporal Differences of Surface Water and Groundwater in the Qaidam Basin, China. Water. 2024; 16(1):169. https://doi.org/10.3390/w16010169
Chicago/Turabian StyleYang, Haijiao, Jiahua Wei, and Kaifang Shi. 2024. "Hydrochemical and Isotopic Characteristics and the Spatiotemporal Differences of Surface Water and Groundwater in the Qaidam Basin, China" Water 16, no. 1: 169. https://doi.org/10.3390/w16010169
APA StyleYang, H., Wei, J., & Shi, K. (2024). Hydrochemical and Isotopic Characteristics and the Spatiotemporal Differences of Surface Water and Groundwater in the Qaidam Basin, China. Water, 16(1), 169. https://doi.org/10.3390/w16010169


