Article

Responses of Different Plant Taxonomic Groups to Complex Environmental Factors in Peri-Urban Wetlands

1
China Construction Eco-Environmental Group Co., Ltd., Beijing 100875, China
2
Command Center for Comprehensive Survey of Natural Resources, China Geological Survey Bureau, Beijing 100055, China
3
Institute of Ecology, Chinese Research Academy of Environmental Sciences, Beijing 100012, China
4
State Key Laboratory of Herbage Improvement and Grassland Agro-Ecosystems, College of Ecology, Lanzhou University, Lanzhou 730020, China
*
Authors to whom correspondence should be addressed.
Water 2024, 16(1), 46; https://doi.org/10.3390/w16010046
Submission received: 29 November 2023 / Revised: 19 December 2023 / Accepted: 19 December 2023 / Published: 21 December 2023

Abstract

:
Wetland plants are essential for ecosystem functions. However, wetland plants in peri-urban areas have been affected by increased human interference. Hence, analyzing the drivers of plant diversity could be extremely useful for biodiversity conservation. The main objective was to investigate the response of plant diversity in wetlands (e.g., plant richness, plant abundance, and taxonomic distinctness) to the environment in peri-urban areas. The results show that the wetland area is the most important factor influencing plant diversity in peri-urban areas. Plant richness and abundance decreased significantly with a decreasing wetland area. The cultivated land decreased the abundance of native plants and indirectly promoted native plant growth and spread by increasing the total organic carbon content of the water. Forest encroachment on wetlands significantly reduced native plant abundance. The effects of soil pH, water body pH, soil organic matter, and slope on introduced species showed opposite trends to those on native plants. Introduced plants were significantly more adapted to the land use around the wetland than native plants. The green land and forest areas promoted the spread of introduced plants. Introduced plants were significantly less adapted to the physicochemical properties of the soil and water than native species. Humans, through agricultural cultivation, have caused introduced plants in cultivated lands to escape to wetlands, resulting in an increase in introduced species. The riparian zone length showed opposite effects for aquatic and terrestrial plants. Pollution from urbanization and agriculture both positively and negatively affects aquatic plants. The response of aquatic plants to nutrients in the water was better than their response to soil nutrients and the response of terrestrial plants to soil nutrients. Terrestrial plants can better withstand pollution from urbanization and agricultural activities, as well as the erosion of wetlands from forested and cultivated lands.

1. Introduction

Wetlands are known as the “kidneys of the Earth” [1] and are essential in ecosystem services, such as water purification, groundwater recharge, flood control, and shoreline stabilization [2]. However, since 1700, the global area of natural wetlands has declined by 3.4 million square kilometers [3]. The loss and degradation of wetlands undermine the ability to provide ecosystem services to humans [4]. Most wetland areas have been reduced due to strong anthropogenic disturbances, such as deforestation, agricultural expansion, and urbanization [5]. Plant diversity plays key roles in maintaining wetland functions. Therefore, understanding the disturbance to plants in urban wetlands is crucial [6].
Urban wetlands are highly anthropogenically influenced ecosystems in urban landscapes [7,8,9,10], which can lead to an increase in water pollutants and exotic species [11]. Larson et al. [12] sampled vegetation and soils from eight urban wetlands and compared them to six forested wetlands, five shrubby wetlands, and seven newly constructed wetlands. The results show significantly lower species richness and a higher cover of invasive species in urban wetlands. Van Wyk et al. [13] demonstrated that stormwater discharges along urban streams can provide hydrologic conditions for vegetated habitats without other types of intervention or management. Asongwe et al. [14] sampled urban wetlands and found that the expansion of urbanization has contaminated wetland soils in the city of Bamenda, resulting in progressively less wetland plant diversity. King and Hovick [6] investigated wetland plants along an urban to rural gradient and found that exotic plant richness and relative abundance were highest in urban sites. Magee et al. [15] surveyed wetlands in Portland and found that wetlands surrounded by agriculture and commercial, industrial, and transportation corridors had more introduced species than wetlands surrounded by undeveloped land. Du Toit et al. [16] investigated 14 wetlands and found that the native plant richness in urban wetlands increased with the wetland area.
The wetland plant diversity along urban to rural gradients has been assessed previously. Plant diversity in peri-urban areas is an important component of urban diversity [17]. Peri-urban spaces are transitional spaces where urban and rural uses are partially mixed [18]. According to the intermediate disturbance hypothesis [19], plant richness is greater in peri-urban areas than in urban or rural areas [20,21,22,23,24]. However, studies on plant diversity in peri-urban wetlands are relatively infrequent compared to those in terrestrial systems [18].
Wetlands, while providing services in the expansion of population and urbanization, are also being destroyed by urbanization. Urbanization has become one of the main factors contributing to the shrinking wetland area in China. From 1993 to 2003, the wetland area in Beijing decreased by 110 square kilometers. A total of 56 square kilometers of wetlands have been converted into arable land, and 35 square kilometers of wetlands have been converted into construction land, which has been strongly affected by urbanization. Therefore, it is urgent to investigate the situation of large-scale wetland damage caused by urbanization [25].
The Chaobai River is one of Beijing’s main water sources. With the rapid development of Beijing, the agricultural area has decreased, and the construction area has rapidly increased [26]. The Chaobai River has been affected by human interference, resulting in poor water quality and a significant increase in the total nitrogen and total phosphorus content in the water [27].
The purpose of this study was, therefore, to answer the following two questions:
(1) What are the major factors that affect wetland plants in heavily disturbed peri-urban areas? (2) How do different plants (terrestrial plants, aquatic plants, introduced plants, and native plants) in the wetland respond to multiple gradients of impact factors?

2. Materials and Methods

The Chaobai River begins in Yanshan, north of the river, and meets with the Yongding River in the east, with a total length of 458 km. The northern climate type of the Chaobai River is a temperate continental monsoon climate with a large temperature difference between winter and summer and an average temperature of −5 °C in January and 25 °C in July. The Chaobai River is an important ecological corridor connecting the mountains in the north and the plains in the south, with green land, forests, cultivated land, and towns mostly located nearby. During the flood season, the vegetation and soil in wetlands have the function of slowing down flow rates and preserving floods, reducing the harm of floods. The vegetation of wetlands can also absorb phosphorus elements in water, reduce the chemical content of water, and improve water quality. In recent years, the water resources of the Chaobai River have been continuously developed for urban construction. The agricultural and industrial activities in the Chaobai River Basin have significantly increased, resulting in significant pollution of the river and a significant increase in water eutrophication.
Surveys were conducted in July–August 2020 and July–August 2022. Sixty-eight sites were established (Figure 1), with six small plots (1 m × 1 m) at each site. Three plots were laid out on the river bank and river per site. Survey indicators included plant species, number of individuals, height, and cover, as well as natural habitat conditions such as riparian zone length (the distance from the water to the bank), slope, soil pH, and water pH. The species richness, Shannon–Wiener diversity index, and Simpson’s diversity index were calculated for the plant diversity of each site. At each site, three sample plots were randomly established to collect soil samples (0–20 cm) that were taken to the laboratory for analysis. Water samples were collected in each sample plot and were also taken to the laboratory for analysis.
Concentrated sulfuric acid was added to the water samples after collection in the field, and the samples were stored in a vehicle refrigerator at a low temperature and were taken to the laboratory for testing. The total organic carbon was measured by the combustion catalytic hydroxide method at 680 °C; total phosphorus was measured by inductively coupled plasma emission spectrometry; and total nitrogen was measured by the flow injection–naphthalene diamine hydrochloride spectrophotometric method. The sealed soil samples were taken to the laboratory for testing. Soil organic matter was measured by the potassium dichromate oxidation–dilution heat method; total nitrogen was measured by the mixed accelerator ablation–Kaeschner method; and total phosphorus was measured by the alkali fusion–molybdenum antimony anti-spectrophotometric method (Table 1).
Based on the Beijing land use data with an accuracy of 2.5 m from the 2013 Beijing Biodiversity Survey (data types were classified as forest, cultivated land, water, green land, and construction land) and visually corrected by the 2020 Beijing Remote Sensing Image Map, the land use data near the site locations of 0–50 m, 0–100 m, 0–200 m, 0–300 m, and 0–500 m were extracted (Table 1).
The environmental data were normalized by adding one followed by log-transformation. Pearson’s R test for statistical correlations between environmental variables was performed using the vegan package in R [28]. Plant diversity index matrices of the Shannon–Wiener diversity index and Simpson’s diversity index were constructed. The plant diversity matrix was subjected to a Mantel test with the matrix of environmental variables [29]. According to the results of Pearson’s correlation test, to avoid multicollinearity among the factors, the factors with high correlation effects were excluded.
For plant diversity and environmental variables, generalized linear models (GLMs) with Poisson distributions were fitted [30,31]. We performed generalized linear multiple regressions of plant diversity, native plant diversity, introduced plant diversity, terrestrial plant diversity, and aquatic plant diversity with environmental variables using ordinary least squares (OLSs). All variables were standardized to a mean of 0 and an SD of 1. A term addition was performed if significant reductions in Akaike’s information criterion (AIC) were found. Furthermore, the relative contributions of the environmental variables were compared using standardized regression coefficients [32]. All data can be found in the Supplementary Materials.

3. Results

Plant species in the Chaobai River were mainly herbaceous. A total of 338 plants species distributed in 70 families were identified in the wetlands. Gramineae and Compositae were the most represented family, followed by Leguminosae and Polygonaceae. The dominant species in abundance were Bidens frondose, Polygonum lapathifolium, and Setaria viridis. Urban wetland flora included invasive species, such as Polygonum lapathifolium, Galinsoga parviflora, and Erigeron canadensis.
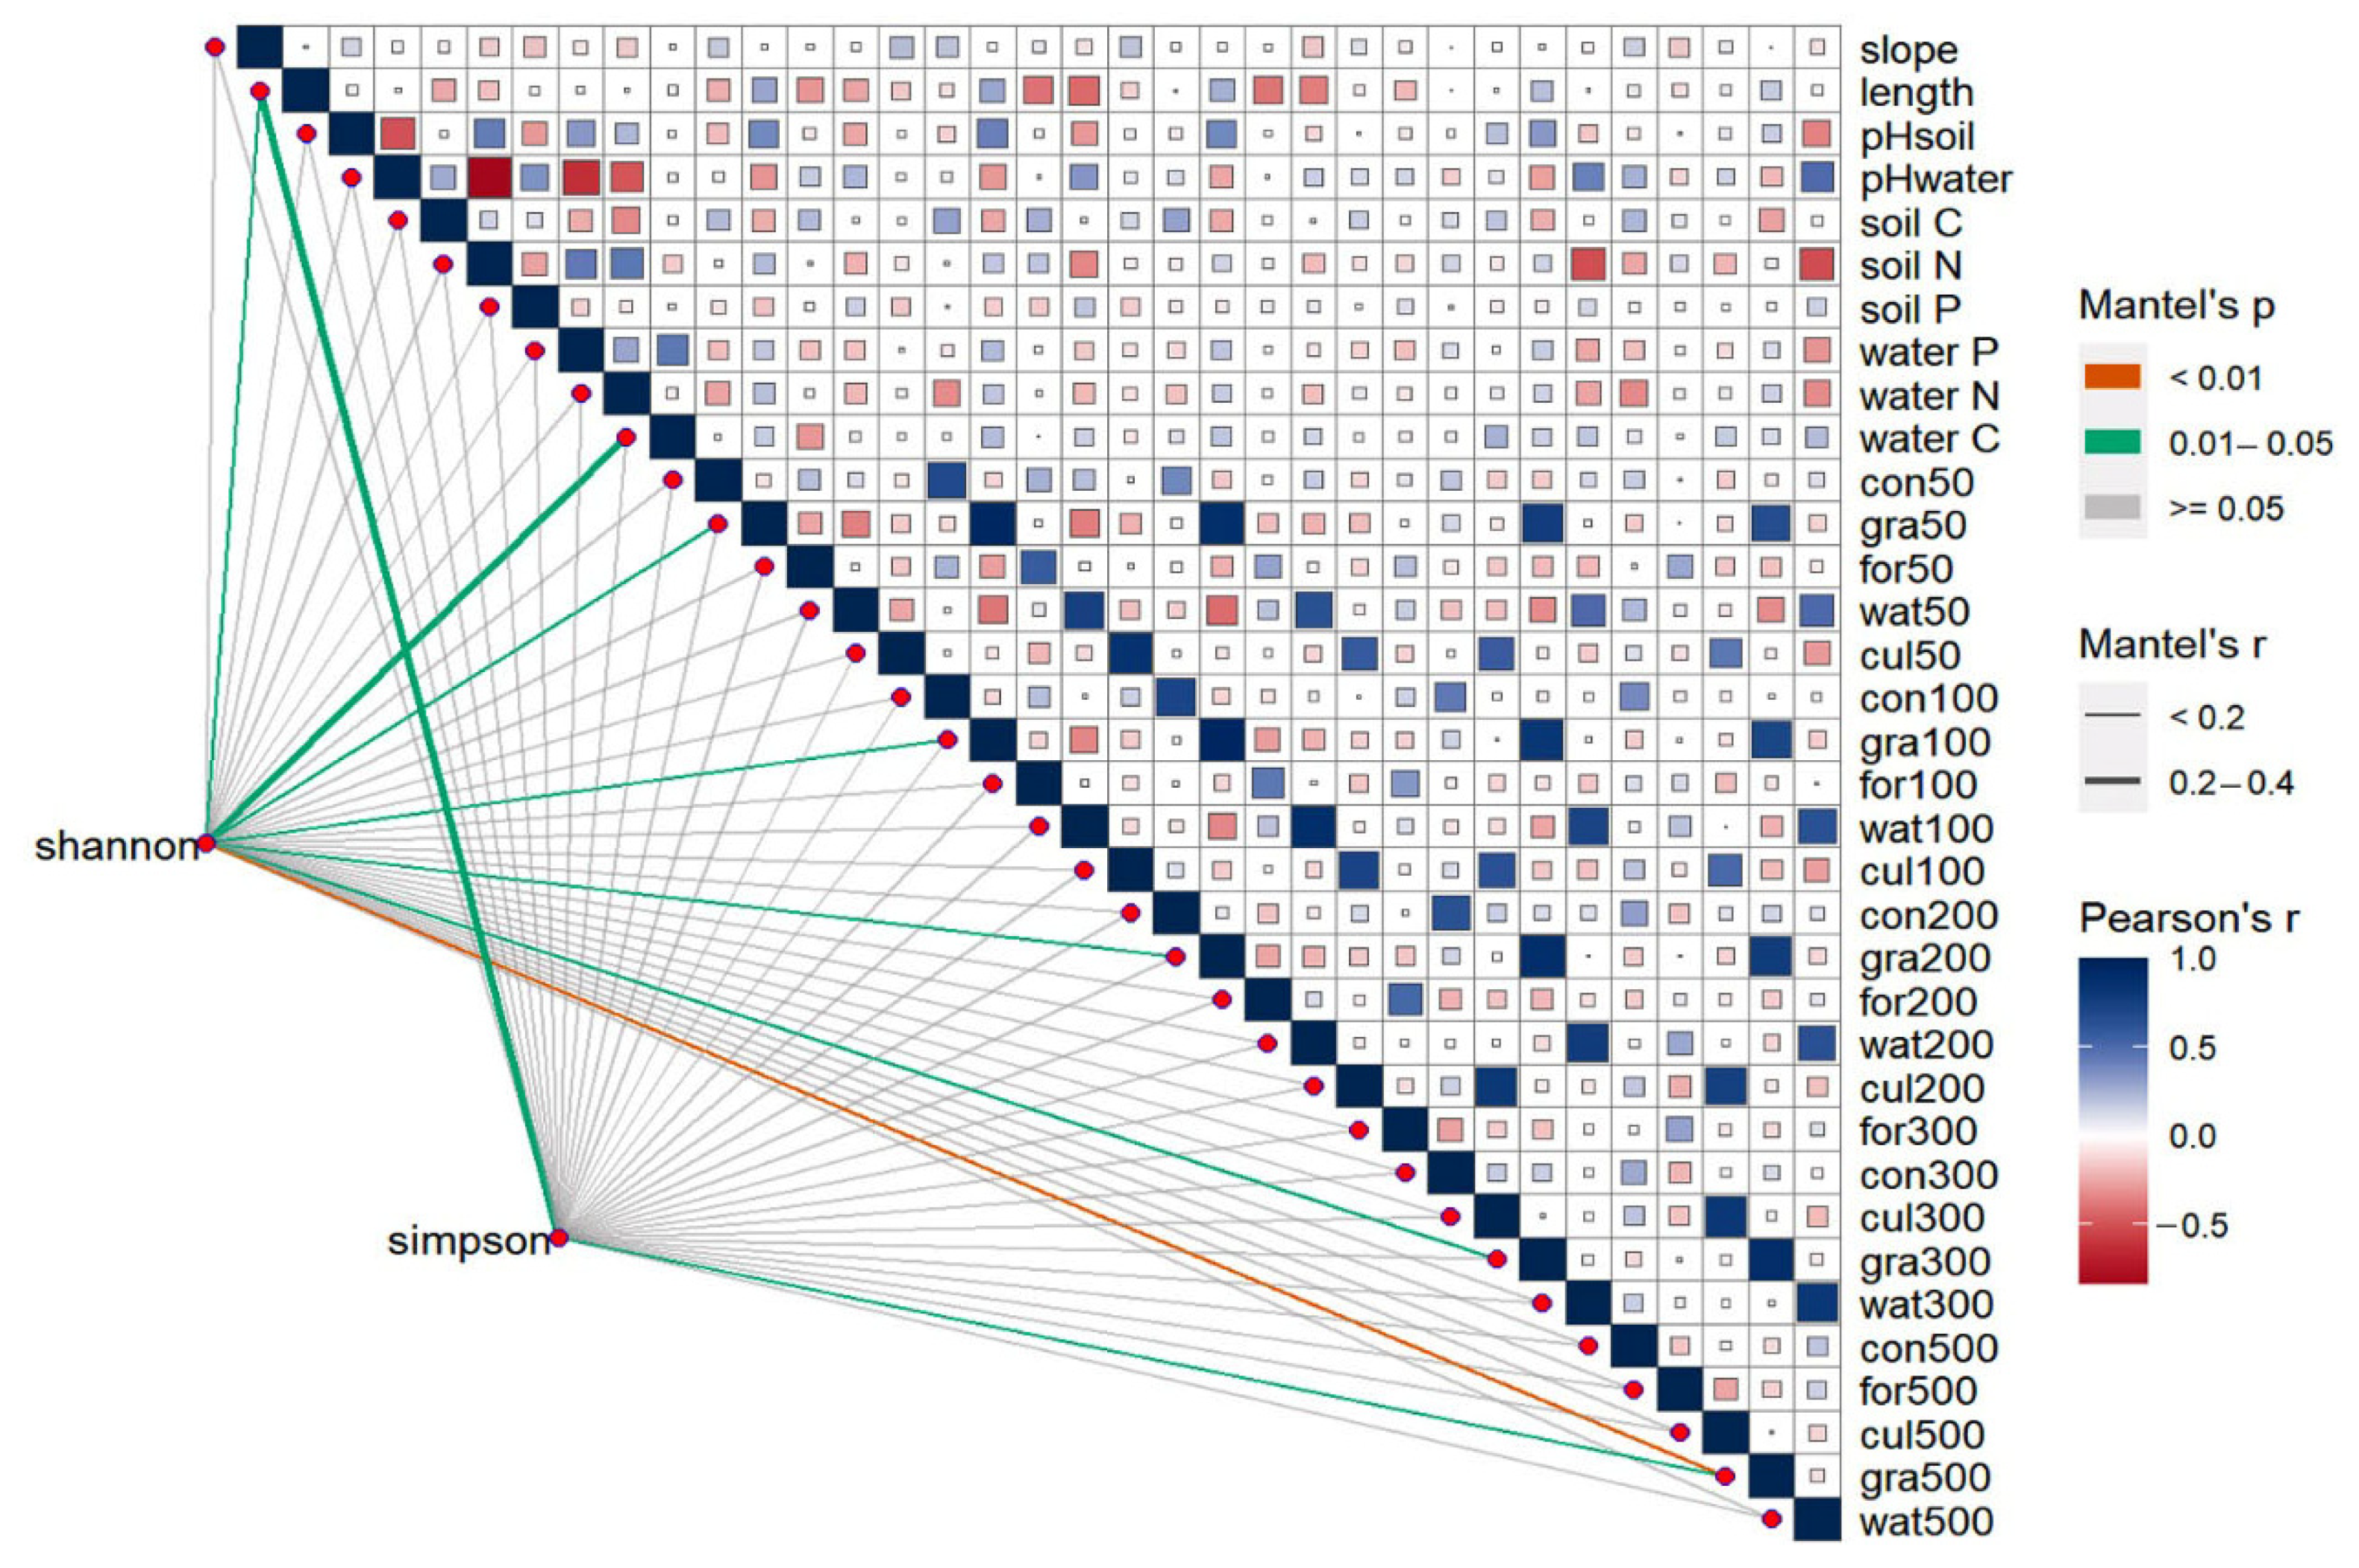
The results of the Mantel test for plant diversity and environmental factors in the wetlands of the Chaobai River (Figure 2) show that the Shannon–Wiener diversity had a strong correlation with the total organic carbon content in water (p < 0.05), a weak correlation with the length of the riparian zone (p < 0.05), and the strongest correlation with the 0–200 m green land area (p < 0.01). Simpson’s diversity index had the strongest correlation with the length of the riparian zone (p < 0.05) and weaker correlations with soil pH and the 0–200 m forest area (p < 0.05).
According to the correlation test between the environmental factors, the length of the riparian zone showed a positive correlation with green land area (p < 0.05) and a significant negative correlation with water pH (p < 0.05), soil organic matter (p < 0.05), and total soil nitrogen (p < 0.05). Water pH was positively correlated with forest area (p < 0.05) and negatively correlated with construction land (p < 0.05).
The total soil nitrogen was positively correlated with the construction land area and negatively correlated with the water area (p < 0.05). The total phosphorus content of water showed a positive correlation with water area (p < 0.05). The total nitrogen content of water also showed a positive correlation with water area (p < 0.05). The total organic carbon content of water showed a negative correlation with the forestland area and a positive correlation with the green land and cultivated land areas (p < 0.05). Soil organic matter showed a negative correlation with the green land area and a positive correlation with the construction land and forest areas (p < 0.05).
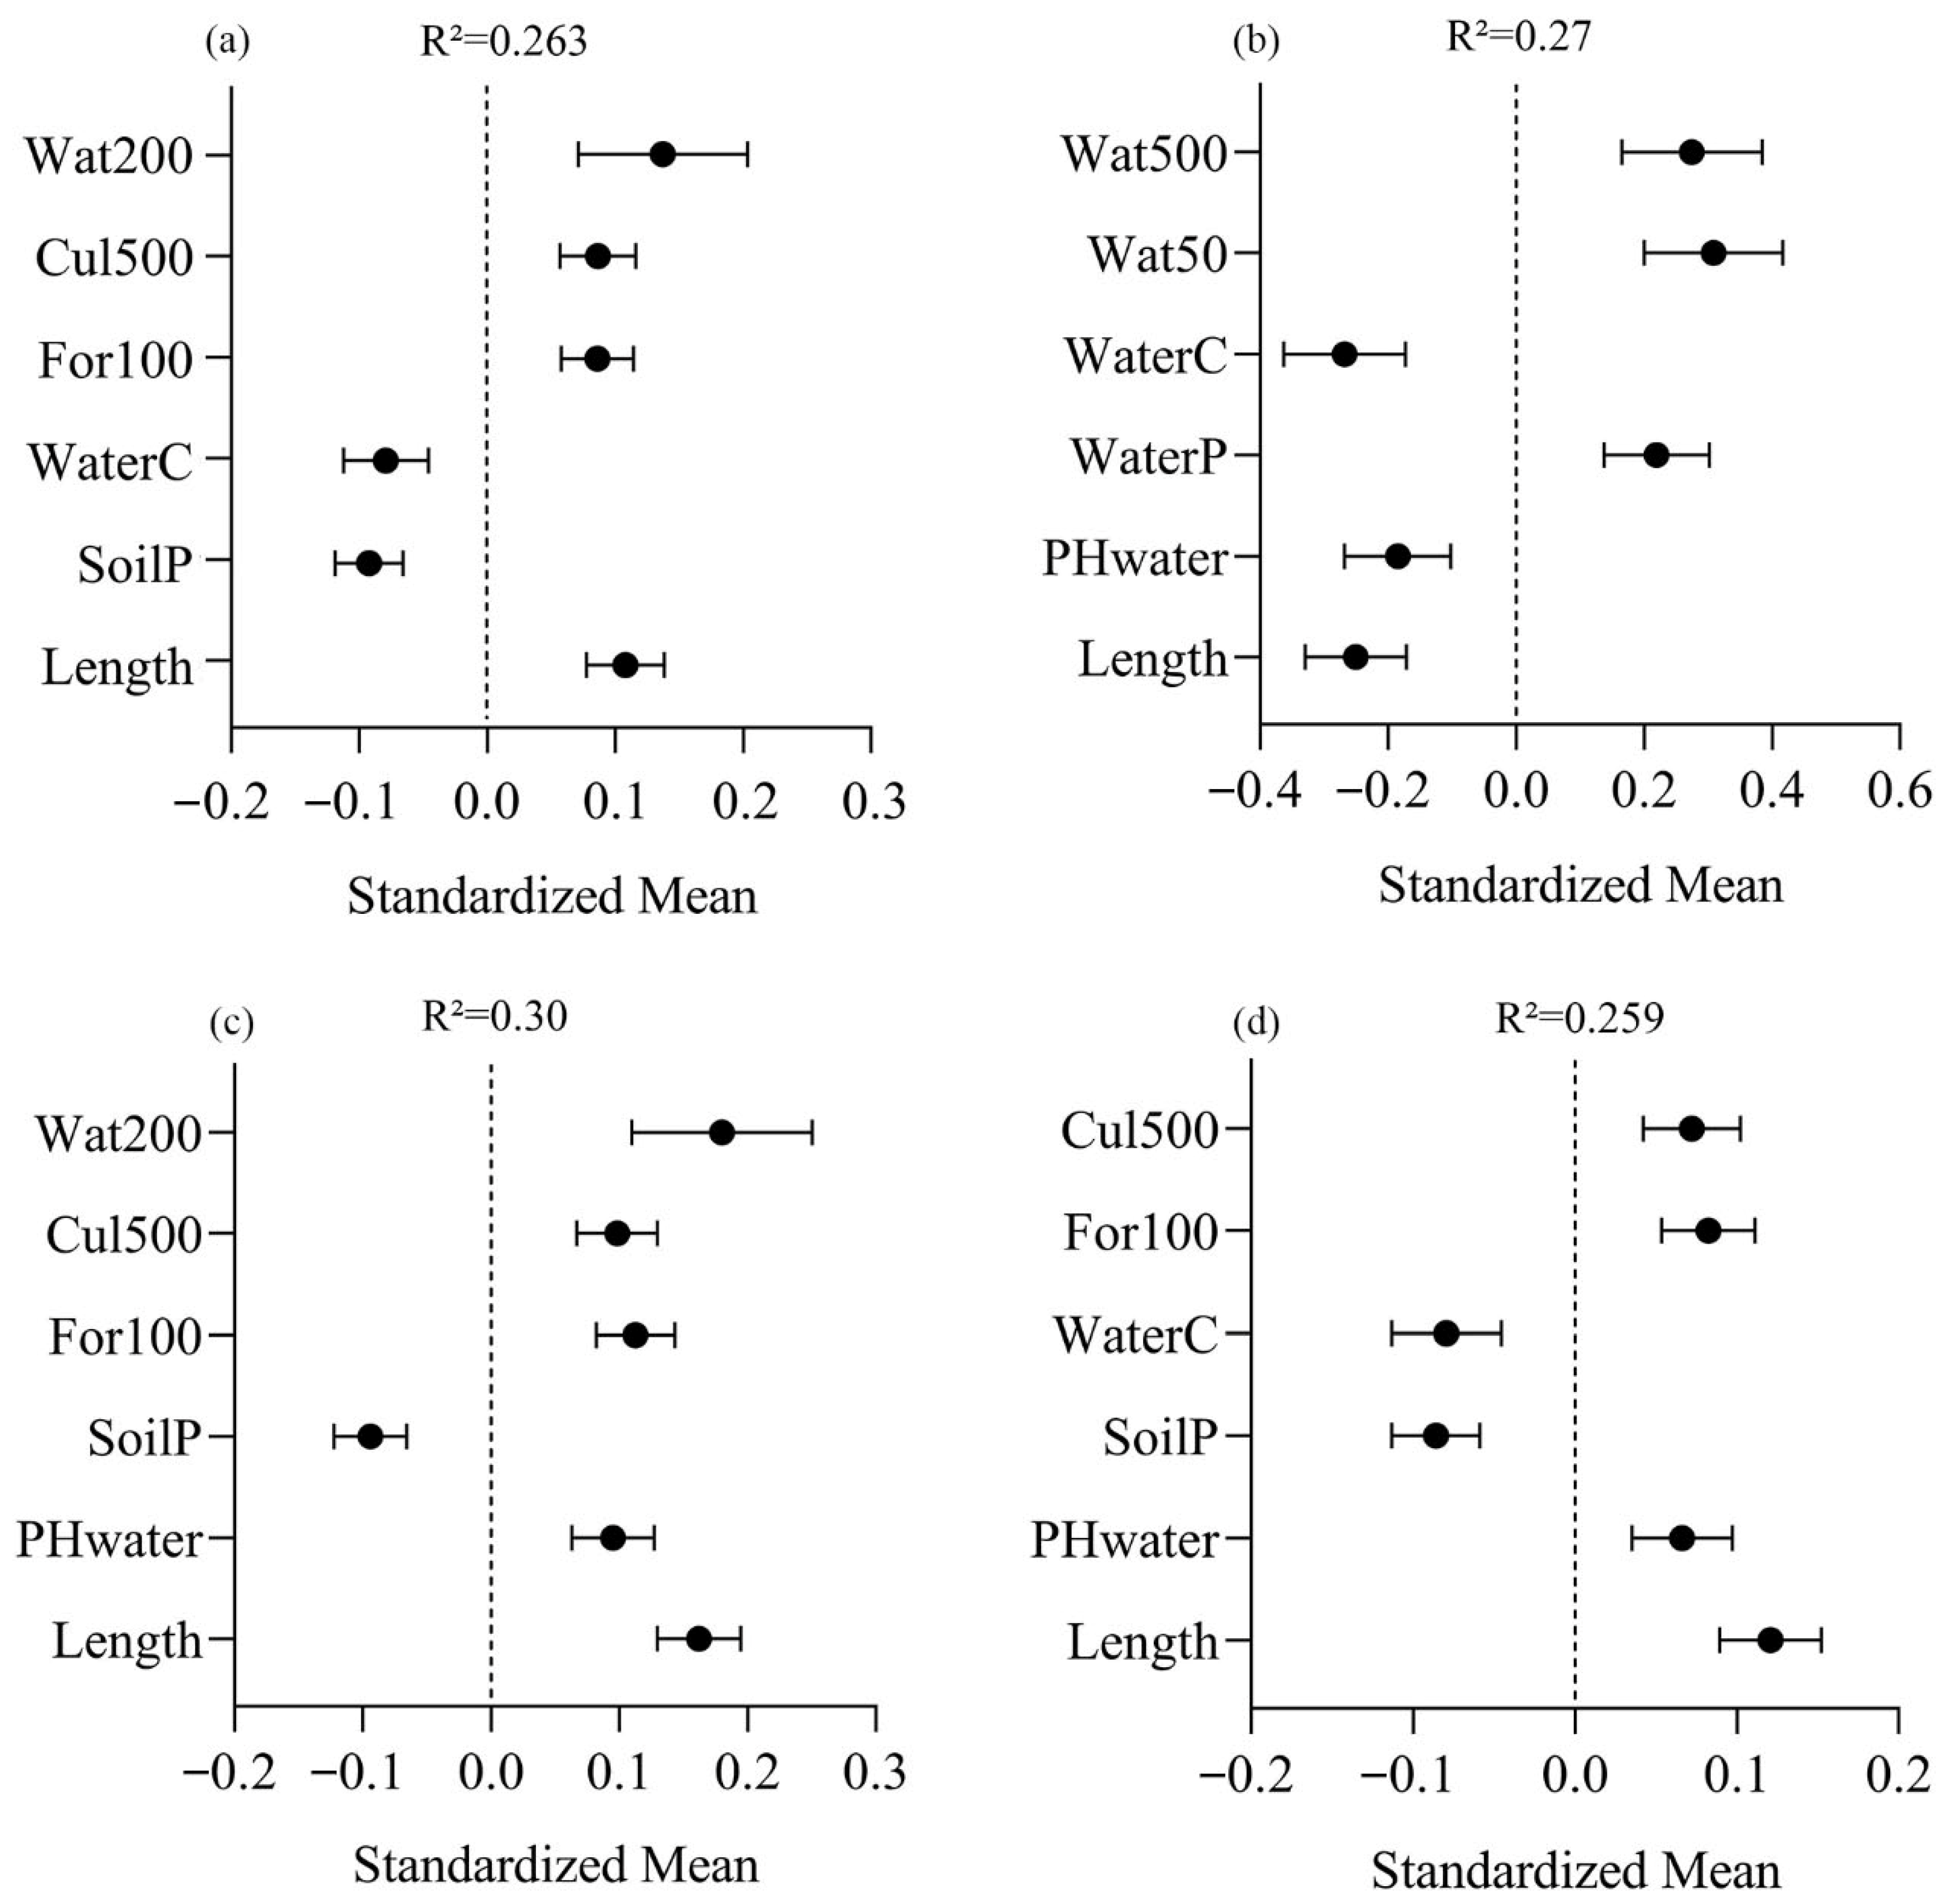
According to the generalized linear regression results of plant richness (Figure 3a), the plant richness of the Chaobai River in Beijing increased with an increasing wetland area, riparian zone length, forest area, and cultivated land area and decreased with an increasing total water organic carbon and total soil phosphorus. The wetland area was the most dominant influencing factor. Terrestrial plant richness (Figure 3b) was significantly affected by the wetland area, cultivated land area, forest area, water pH, and riparian zone length; it increased with an increasing wetland and forest area and decreased with an increasing riparian zone length. Terrestrial plant richness decreased with an increasing total soil phosphorus. The factors that affected terrestrial plant richness the most were wetland area and riparian zone length. Aquatic plant richness (Figure 3c) increased with the wetland area and total phosphorus content of water and decreased with the total organic carbon content of water, water pH, and length of the riparian zone. The wetland area and total organic carbon content of water were the major factors affecting aquatic richness. Native species richness (Figure 3d) decreased with increases in the total organic carbon, total soil phosphorus in water, and riparian zone length. The length of the riparian zone was the main factor affecting the abundance of native species, while the cultivated land area had a smaller effect on the native plant richness. Introduced plant richness was affected by only the area of cultivated land (p < 0.05, R² = 0.274), which was a positive effect.
According to the regression results of native plant abundance with environmental factors (Figure 4a), the cultivated land area and wetland area were the most important factors. The increase in the area of cultivated land led to a significant decrease in the abundance of native plants. The increase in the wetland area led to a significant increase in native plant abundance. The total organic carbon in water, total nitrogen in water, total phosphorus in water, total phosphorus in soil, total organic matter in soil, soil pH, and water pH positively affected native plant abundance. The forest area and green land area negatively affected native plant abundance. Introduced plant abundance was influenced by several environmental factors (Figure 4b). The cultivated land area, wetland area, forest area, green land area, total nitrogen in water, and riparian zone length positively affected introduced plants; the total soil phosphorus, soil organic matter, water pH, soil pH, and slope significantly negatively affected introduced plants. The wetland area was the most important influencing factor for introduced plant abundance. The land use near wetlands (Figure 4c) significantly negatively affected plants. Among the effects found, the negative effect of the cultivated land on plant abundance was the most significant. However, the green land and forest also seriously negatively affected plant abundance. The physicochemical properties of water and soil positively affected plant abundance. Aquatic plant abundance increased with the wetland area and total nitrogen content and total phosphorus content in water and decreased with the cultivated land area, forested area, total organic carbon in water, total soil phosphorus, soil pH, and riparian zone length. The wetland area had the greatest effect on aquatic plant abundance.

4. Discussion

The findings support the hypothesis that anthropogenic activities create multiple disturbance gradients in peri-urban areas. Plant richness was significantly affected by the wetland area. This was to be expected, as urbanization reduces wetland areas and produces visible damage to wetland plant habitats, leading to a significant reduction in plant richness. The area of green land and forestland significantly affected the abundance of wetland plants, a finding similar to that of other studies [33]. This may be due to reduced sources of propagules from forests and green spaces [34]. The effect of the total phosphorus content of water on plant abundance was also significant. This result was consistent with the findings of King (2020) on wetland plants surveyed in Ohio, where changes in plant abundance were apparently caused by pollutants associated with urbanization.
The forest and green land areas significantly affected plant diversity, a finding that is consistent with other studies [35,36,37]. Forests can promote the survival of shade-tolerant species and inhibit the invasion of faster-growing and shade-intolerant species by maintaining low light levels in the understory [38]. Plant diversity was also affected by soil pH and total organic carbon in the water. This finding was similar to that of Campion and Venzke (2011) in a floristic survey of wetlands in Kumasi, where plant diversity was affected by pollutants. The length of the riparian zone significantly affected plant diversity, probably because the riparian zone length directly affects the habitat area for terrestrial plants [39]. The greater the length of the riparian zone, the less urbanization the wetland was subjected to. However, the length of the riparian zone showed an opposite effect for aquatic plants and terrestrial plants.
A positive effect of wetland area on plant richness was also found in the regression analysis, confirming that the larger the wetland area, the greater the species richness in peri-urban wetlands [40]. In peri-urban wetlands with high habitat heterogeneity, introduced species can escape into the wetland from cultivated lands. Ehrenfeld [41] found that the level of introduced species invasions in wetlands was due to the proportion of the wetland’s surroundings that were under residential land use and was an indicator of anthropogenic activities, such as population density. The reason for the different conclusions may be the presence of large areas of agricultural land along the Chaobai River as it flows through the peri-urban area of Beijing, which may have led to introduced species invasions. We found that introduced plants were more tolerant to urbanization impacts in the Chaobai River wetland [6,42]. The abundances of introduced plants and native plants were affected by several factors. Native species were extremely significantly affected by the area of cultivated land [43], an effect that was more important than the reduction in the wetland area. Native species were more significantly affected by water pollution than soil pollution. The increase in the cultivated land area increased the total organic carbon content in water, which indirectly promoted native species growth and spread. The total nitrogen and phosphorus in water and soil organic matter promoted native species growth, but the influence was much smaller than the direct effect from agricultural activities. Native plants have difficulty adapting to understory environments in wetlands. The analysis of soil pH, water pH, soil organic matter, and slope showed opposing general trends between native plants and introduced plants. Introduced plants preferred areas with long riparian zones and small slopes. Introduced plants were significantly more adapted to the land around the wetland than native plants, which could promote their spread to green lands and forests but were significantly less adapted to the physicochemical properties of soil and water in urban wetlands than native species. Skultety and Matthews [44] suggest that introduced plants first take root in urban areas and then spread outward. However, we found that the cultivated land is also a source of introduced plants in peri-urban areas. Chu and Molano-Flores [45] found that replacement of the cultivated land with urban land increases plant richness. However, we came to the opposite conclusion, which may be because some introduced species have invaded the cultivated land in Beijing.
Aquatic plants have been affected by agricultural pollution, which is consistent with the impacts on the aquatic plant diversity in Mediterranean streams and rivers in Greece [46]. Bornette [47] suggested that aquatic plant richness responds to nutrients in a complex manner and may peak at moderate disturbance levels. In this study, different trends were found for aquatic plant responses to the total nitrogen in water and to the total organic carbon and total phosphorus in water. In addition, the response of aquatic plants to nutrients in the water was better than their response to nutrients in the soil and the response of terrestrial plants to nutrients in the soil (e.g., phosphorus). This may be because riparian plants absorb and retain agriculturally polluted effluents to some extent [48]. Terrestrial plants could resist pollution from agricultural activities and the erosion of forests and cultivated lands compared to aquatic plants.
Urban wetlands are usually considered to be of poor quality due to high disturbance levels [49]. In this study, wetland disturbance by several environmental factors was similarly found in the Chaobai River wetland in Beijing, resulting in large changes in plant diversity. In the Chaobai River wetland, both native and introduced species, as well as aquatic and terrestrial plants, responded differently to environmental factors, and different plants made different choices under the same environmental influences [50]. However, in general, the wetland area is the most important factor.
The extent of land use dominated by anthropogenic disturbances that significantly affected wetland plant communities mainly occurred within 300 m around the wetland, which was consistent with results from other studies [34]. The effect of human activities on plants may occur in both direct and indirect ways. Urbanization directly reduces the area of woodlands and green lands in wetlands, which directly changes plant diversity. Urbanization also indirectly affects the distribution of wetland plants. Increased human agricultural activities have led to the infiltration of pollutants from cultivated land into water [51], which elevated the total carbon content of the water and altered the nutrient levels of the wetland [52]. This result is consistent with other studies [53].
Since urbanization will continue to increase globally [54], it is important to understand plant habitats in urban wetlands and the drivers of plant diversity. The impact factors selected in this study focused on wetland eutrophication caused by urbanization and agricultural pollution and the possible impacts of land use around wetlands. However, there may be other environmental factors that have significant but unknown impacts on wetland plants. In addition, management practices within the wetland by authorities can lead to hydrologic fluctuations that may also affect the wetland environment and the plants.
In subsequent studies, long-term testing of the Chaobai River wetland in Beijing should be carried out to include the effects of anthropogenic management practices on wetlands. The scope of pollutant collection and analysis in wetlands should be increased to expand the scope of the study for the Chaobai River and to further clarify the effects of urbanization and agricultural pollution on the wetland environment and wetland plants.

5. Conclusions

The wetland area is the most influential factor on plant diversity in peri-urban wetlands. Both introduced and native species were affected by a variety of factors. Native species were extremely significantly affected by the area of the cultivated land. The increase in the cultivated land area increased the total organic carbon in water, which indirectly promoted the growth and spread of native species. The total nitrogen and phosphorus in water and soil organic matter promoted the growth of native species, but this impact was much lower than the direct negative effect caused by agriculture. The erosion of wetlands by forested land significantly reduced native plant abundance. The effects of the soil pH, water pH, soil organic matter, and slope on introduced species exhibit opposite trends to those on native species. Introduced species were significantly more adapted to the land use around the peri-urban wetland than native species.
Pollution from urbanization and agriculture had both positive and negative effects on aquatic plants. Aquatic plants responded better to nutrients in the water than nutrients in the soil. Terrestrial plants were better able to resist pollution from urbanization and agriculture than aquatic plants.

Supplementary Materials

The following supporting information can be downloaded at: https://www.mdpi.com/article/10.3390/w16010046/s1, File S1: diversity; File S2: environmental factor.

Author Contributions

Y.H. drafted the manuscript and participated in the experiments; J.L. participated in the experiments; G.L. participated in the experiments; W.Q. revised the manuscript; T.J. revised the manuscript; Y.W. revised the manuscript. All authors have read and agreed to the published version of the manuscript.

Funding

This work was supported by the Research and Application of Key Technologies for Seasonal River Ecosystem Management (SKS-2022070), the China Building Ecological Environment Engineering Research Center (CSCEC-PT-008) and the Research on Key Technologies for the Ecological Restoration of Rivers and Lakes in the Middle and Lower Reaches of the Yangtze River and Applications to the Yangtze River Protection Project (CSCEC-2022-Z-36).

Data Availability Statement

Data are contained within the article and Supplementary Materials.

Conflicts of Interest

Author Yuchen Hou, Tao Jin and Ying Wang has received research grants from Company China Construction Eco-Environmental Group Co., Ltd.

References

  1. Zhu, X.; Jiao, L.; Wu, X.; Du, D.; Wu, J.; Zhang, P. Ecosystem health assessment and comparison of natural and constructed wetlands in the arid zone of northwest China. Ecol. Indic. 2023, 154, 110576. [Google Scholar] [CrossRef]
  2. Cao, L.; Fox, A.D. Birds and people both depend on China’s wetlands. Nature 2009, 460, 173. [Google Scholar] [CrossRef] [PubMed]
  3. Fluet-Chouinard, E.; Stocker, B.D.; Zhang, Z.; Malhotra, A.; Melton, J.R.; Poulter, B.; Kaplan, J.O.; Goledwijck, K.K.; Siebert, S.; Minayeva, T.; et al. Extensive global wetland loss over the past three centuries. Nature 2023, 614, 281–286. [Google Scholar] [CrossRef] [PubMed]
  4. Van Asselen, S.; Verburg, P.H.; Vermaat, J.E.; Janse, J.H. Drivers of Wetland Conversion: A Global Meta-Analysis. PLoS ONE 2013, 8, e81292. [Google Scholar] [CrossRef] [PubMed]
  5. Zou, J.; Ziegler, A.D.; Chen, D.; McNicol, G.; Ciais, P.; Jiang, X.; Zheng, K.; Wu, J.; Lin, X.; He, X.; et al. Rewetting global wetlands effectively reduces major greenhouse gas emissions. Nat. Geosci. 2022, 15, 627–632. [Google Scholar] [CrossRef]
  6. King, C.M.; Hovick, S.M. Wetland plant community variation across replicate urban to rural gradients: Non-native species as both drivers and passengers in systems impacted by anthropogenic land-use. Urban Ecosyst. 2020, 23, 1209–1226. [Google Scholar] [CrossRef]
  7. Andrew, S.M.; Totland, Ø.; Moe, S.R. Spatial variation in plant species richness and diversity along human disturbance and environmental gradients in a tropical wetland. Wetl. Ecol. Manag. 2015, 23, 395–404. [Google Scholar] [CrossRef]
  8. Bowman Cutway, H.; Ehrenfeld, J.G. The influence of urban land use on seed dispersal and wetland invasibility. Plant Ecol. 2010, 210, 153–167. [Google Scholar] [CrossRef]
  9. Campion, B.B.; Venzke, J.-F. Spatial patterns and determinants of wetland vegetation distribution in the Kumasi Metropolis, Ghana. Wetl. Ecol. Manag. 2011, 19, 423–431. [Google Scholar] [CrossRef]
  10. Perron, M.A.C.; Pick, F.R. Stormwater ponds as habitat for Odonata in urban areas: The importance of obligate wetland plant species. Biodivers. Conserv. 2020, 29, 913–931. [Google Scholar] [CrossRef]
  11. Wondie, A. Ecological conditions and ecosystem services of wetlands in the Lake Tana Area, Ethiopia. Ecohydrol. Hydrobiol. 2018, 18, 231–244. [Google Scholar] [CrossRef]
  12. Larson, M.A.; Heintzman, R.L.; Titus, J.E.; Zhu, W. Urban Wetland Characterization in South-Central New York State. Wetlands 2016, 36, 821–829. [Google Scholar] [CrossRef]
  13. van Wyk, E.; Cilliers, S.S.; Bredenkamp, G.J. Vegetation analysis of wetlands in the Klerksdorp Municipal Area, North West Province, South Africa. S. Afr. J. Bot. 2000, 66, 52–62. [Google Scholar] [CrossRef]
  14. Asongwe, G.A.; Bame, I.B.; Ndam, L.M.; Orock, A.E.; Tellen, V.A.; Bumtu, K.P.; Tening, A.S. Influence of urbanisation on phytodiversity and some soil properties in riverine wetlands of Bamenda municipality, Cameroon. Sci. Rep. 2022, 12, 19766. [Google Scholar] [CrossRef] [PubMed]
  15. Magee, T.K.; Ernst, T.L.; Kentula, M.E.; Dwire, K.A. Floristic comparison of freshwater wetlands in an urbanizing environment. Wetlands 1999, 19, 517–534. [Google Scholar] [CrossRef]
  16. Du Toit, M.J.; Du Preez, C.; Cilliers, S.S. Plant diversity and conservation value of wetlands along a rural–urban gradient. Bothalia ABC 2021, 51, 1–18. [Google Scholar] [CrossRef]
  17. Hou, Y.; Li, J.; Li, G.; Qi, W. Negative effects of urbanization on plants: A global meta-analysis. Ecol. Evol. 2023, 13, e9894. [Google Scholar] [CrossRef]
  18. Wandl, A.; Magoni, M. Sustainable Planning of Peri-Urban Areas: Introduction to the Special Issue. Plan. Pract. Res. 2017, 32, 1–3. [Google Scholar] [CrossRef]
  19. Connell, J.H. Diversity in Tropical Rain Forests and Coral Reefs: High diversity of trees and corals is maintained only in a nonequilibrium state. Science 1978, 199, 1302–1310. [Google Scholar] [CrossRef]
  20. Faeth, S.H.; Bang, C.; Saari, S. Urban biodiversity: Patterns and mechanisms: Urban biodiversity. Ann. N. Y. Acad. Sci. 2011, 1223, 69–81. [Google Scholar] [CrossRef]
  21. McKinney, M.L. Effects of urbanization on species richness: A review of plants and animals. Urban Ecosyst. 2008, 11, 161–176. [Google Scholar] [CrossRef]
  22. Ortega-Álvarez, R.; Rodríguez-Correa, H.A.; MacGregor-Fors, I. Trees and the City: Diversity and Composition along a Neotropical Gradient of Urbanization. Int. J. Ecol. 2011, 2011, 704084. [Google Scholar] [CrossRef]
  23. Tian, Z.; Song, K.; Da, L. Distribution patterns and traits of weed communities along an urban-rural gradient under rapid urbanization in Shanghai, China: Weed communities on urban-rural gradient. Weed Biol. Manag. 2015, 15, 27–41. [Google Scholar] [CrossRef]
  24. Wanek, A.; Hargiss, C.L.M.; Norland, J. Hydric vegetation communities across rural, peri-urban, and urban zones within the Prairie Pothole Region. Urban For. Urban Green. 2022, 70, 127539. [Google Scholar] [CrossRef]
  25. Mao, D.; Wang, Z.; Wu, J.; Wu, B.; Zeng, Y.; Song, K.; Luo, L. China’s wetlands loss to urban expansion. Land Degrad. Dev. 2018, 29, 2644–2657. [Google Scholar] [CrossRef]
  26. Zhang, L.; Sun, Q.; You, Y.; Zhang, K.; Gao, C.; Peng, Y. Compositional and structural characteristics of dissolved organic matter in overlying water of the Chaobai River and its environment significance. Environ. Sci. Pollut. Res. 2021, 28, 59673–59686. [Google Scholar] [CrossRef]
  27. Geng, B.; Cao, Y.; Su, R.; Liu, S.; Feng, Z. Influence of land-use change on ecosystem services in the Chaobai River region of Beijing-Tianjin-Hebei. J. Agric. Resour. Environ. 2020, 37, 583–593. [Google Scholar] [CrossRef]
  28. R Core Team. R: A Language and Environment for Statistical Computing; R Foundation for Statistical Computing: Vienna, Austria, 2021. [Google Scholar]
  29. Huang, H.; Zhou, L.; Chen, J.; Wei, T. ggcor: Extended Tools for Correlation Analysis and Visualization; R Package Version 0.9.7; R Foundation for Statistical Computing: Vienna, Austria, 2020. [Google Scholar]
  30. Morandeira, N.S.; Kandus, P. Do taxonomic, phylogenetic and functional plant α- and β-diversity reflect environmental patterns in the Lower Paraná River floodplain? Plant Ecol. Divers. 2017, 10, 153–165. [Google Scholar] [CrossRef]
  31. Schouten, M.A.; Verweij, P.A.; Barendregt, A.; Kleukers, R.M.J.C.; Kalkman, V.J.; De Ruiter, P.C. Determinants of species richness patterns in the Netherlands across multiple taxonomic groups. Biodivers. Conserv. 2009, 18, 203–217. [Google Scholar] [CrossRef]
  32. Ding, Y.; Zang, R. Determinants of aboveground biomass in forests across three climatic zones in China. For. Ecol. Manag. 2021, 482, 118805. [Google Scholar] [CrossRef]
  33. Loewenstein, N.J.; Loewenstein, E.F. Non-native plants in the understory of riparian forests across a land use gradient in the Southeast. Urban Ecosyst. 2005, 8, 79–91. [Google Scholar] [CrossRef]
  34. Houlahan, J.E.; Keddy, P.A.; Makkay, K.; Findlay, C.S. The effects of adjacent land use on wetland species richness and community composition. Wetlands 2006, 26, 79–96. [Google Scholar] [CrossRef]
  35. Burton, M.L.; Samuelson, L.J. Influence of urbanization on riparian forest diversity and structure in the Georgia Piedmont, US. Plant Ecol. 2008, 195, 99–115. [Google Scholar] [CrossRef]
  36. Moges, A.; Beyene, A.; Ambelu, A.; Mereta, S.T.; Triest, L.; Kelbessa, E. Plant species composition and diversity in wetlands under forest, agriculture and urban land uses. Aquat. Bot. 2017, 138, 9–15. [Google Scholar] [CrossRef]
  37. Yuan, Z.; Xiao, M.; Su, X.; Zhao, H.; Li, Y.; Zhang, H.; Wang, W. Effects of Environment and Human Activities on Plant Diversity in Wetlands along the Yellow River in Henan Province, China. Diversity 2022, 14, 470. [Google Scholar] [CrossRef]
  38. von Behren, C.; Dietrich, A.; Yeakley, J.A. Riparian vegetation assemblages and associated landscape factors across an urbanizing metropolitan area. Écoscience 2013, 20, 373–382. [Google Scholar] [CrossRef]
  39. Lyons, M.N. The riparian flora and plant communities of the Pilbara region of Western Australia. Rec. West Aust. Mus. Sup. 2015, 78, 485. [Google Scholar] [CrossRef]
  40. Kallimanis, A.S.; Mazaris, A.D.; Tzanopoulos, J.; Halley, J.M.; Pantis, J.D.; Sgardelis, S.P. How does habitat diversity affect the species–area relationship? Glob. Ecol. Biogeogr. 2008, 17, 532–538. [Google Scholar] [CrossRef]
  41. Ehrenfeld, J.G. Exotic invasive species in urban wetlands: Environmental correlates and implications for wetland management. J. Appl. Ecol. 2008, 45, 1160–1169. [Google Scholar] [CrossRef]
  42. Kowarik, I. Novel urban ecosystems, biodiversity, and conservation. Environ. Pollut. 2011, 159, 1974–1983. [Google Scholar] [CrossRef]
  43. Alston, K.P.; Richardson, D.M. The roles of habitat features, disturbance, and distance from putative source populations in structuring alien plant invasions at the urban/wildland interface on the Cape Peninsula, South Africa. Biol. Conserv. 2006, 132, 183–198. [Google Scholar] [CrossRef]
  44. Skultety, D.; Matthews, J.W. Human land use as a driver of plant community composition in wetlands of the Chicago metropolitan region. Urban Ecosyst. 2018, 21, 447–458. [Google Scholar] [CrossRef]
  45. Chu, S.; Molano-Flores, B. Impacts of agricultural to urban land-use change on floristic quality assessment indicators in Northeastern Illinois wetlands. Urban Ecosyst. 2013, 16, 235–246. [Google Scholar] [CrossRef]
  46. Stefanidis, K.; Oikonomou, A.; Papastergiadou, E. Responses of different facets of aquatic plant diversity along environmental gradients in Mediterranean streams: Results from rivers of Greece. J. Environ. Manag. 2021, 296, 113307. [Google Scholar] [CrossRef]
  47. Bornette, G.; Puijalon, S. Response of aquatic plants to abiotic factors: A review. Aquat. Sci. 2011, 73, 1–14. [Google Scholar] [CrossRef]
  48. Franklin, H.M.; Robinson, B.H.; Dickinson, N.M. Plants for nitrogen management in riparian zones: A proposed trait-based framework to select effective species. Ecol. Manag. Restor. 2019, 20, 202–213. [Google Scholar] [CrossRef]
  49. Panuccio, M.; Foschi, F.; Audinet, J.-P.; Calò, C.; Bologna, M. Urban wetlands: Wastelands or hotspots for conservation? Two case studies from Rome, Italy. Avocetta 2017, 41, 13–18. [Google Scholar] [CrossRef]
  50. Gleason, H.A. The Individualistic Concept of the Plant Association. Bull. Torrey Bot. Club 1926, 53, 7–26. [Google Scholar] [CrossRef]
  51. Uddin, M.N.; Robinson, R.W. Can nutrient enrichment influence the invasion of Phragmites australis? Sci. Total Environ. 2018, 613–614, 1449–1459. [Google Scholar] [CrossRef] [PubMed]
  52. Hogan, D.M.; Walbridge, M.R. Urbanization And Nutrient Retention In Freshwater Riparian Wetlands. Ecol. Appl. 2007, 17, 1142–1155. [Google Scholar] [CrossRef] [PubMed]
  53. Nsor, C.A.; Acolatse, R.; Mensah, J.N.; Oppong, S.K.; Dompreh, D.; Addai-Wireko, L. Structural assemblages of plant species in the Owabi Ramsar Wetland in the Ashanti Region of Ghana. Afr. J. Aquat. Sci. 2022, 47, 100–114. [Google Scholar] [CrossRef]
  54. McDonald, R.I.; Mansur, A.V.; Ascensão, F.; Colbert, M.; Crossman, K.; Elmqvist, T.; Gonzalez, A.; Haase, D.; Hamman, M.; Hillel, O.; et al. Research gaps in knowledge of the impact of urban growth on biodiversity. Nat. Sustain. 2020, 3, 16–24. [Google Scholar] [CrossRef]
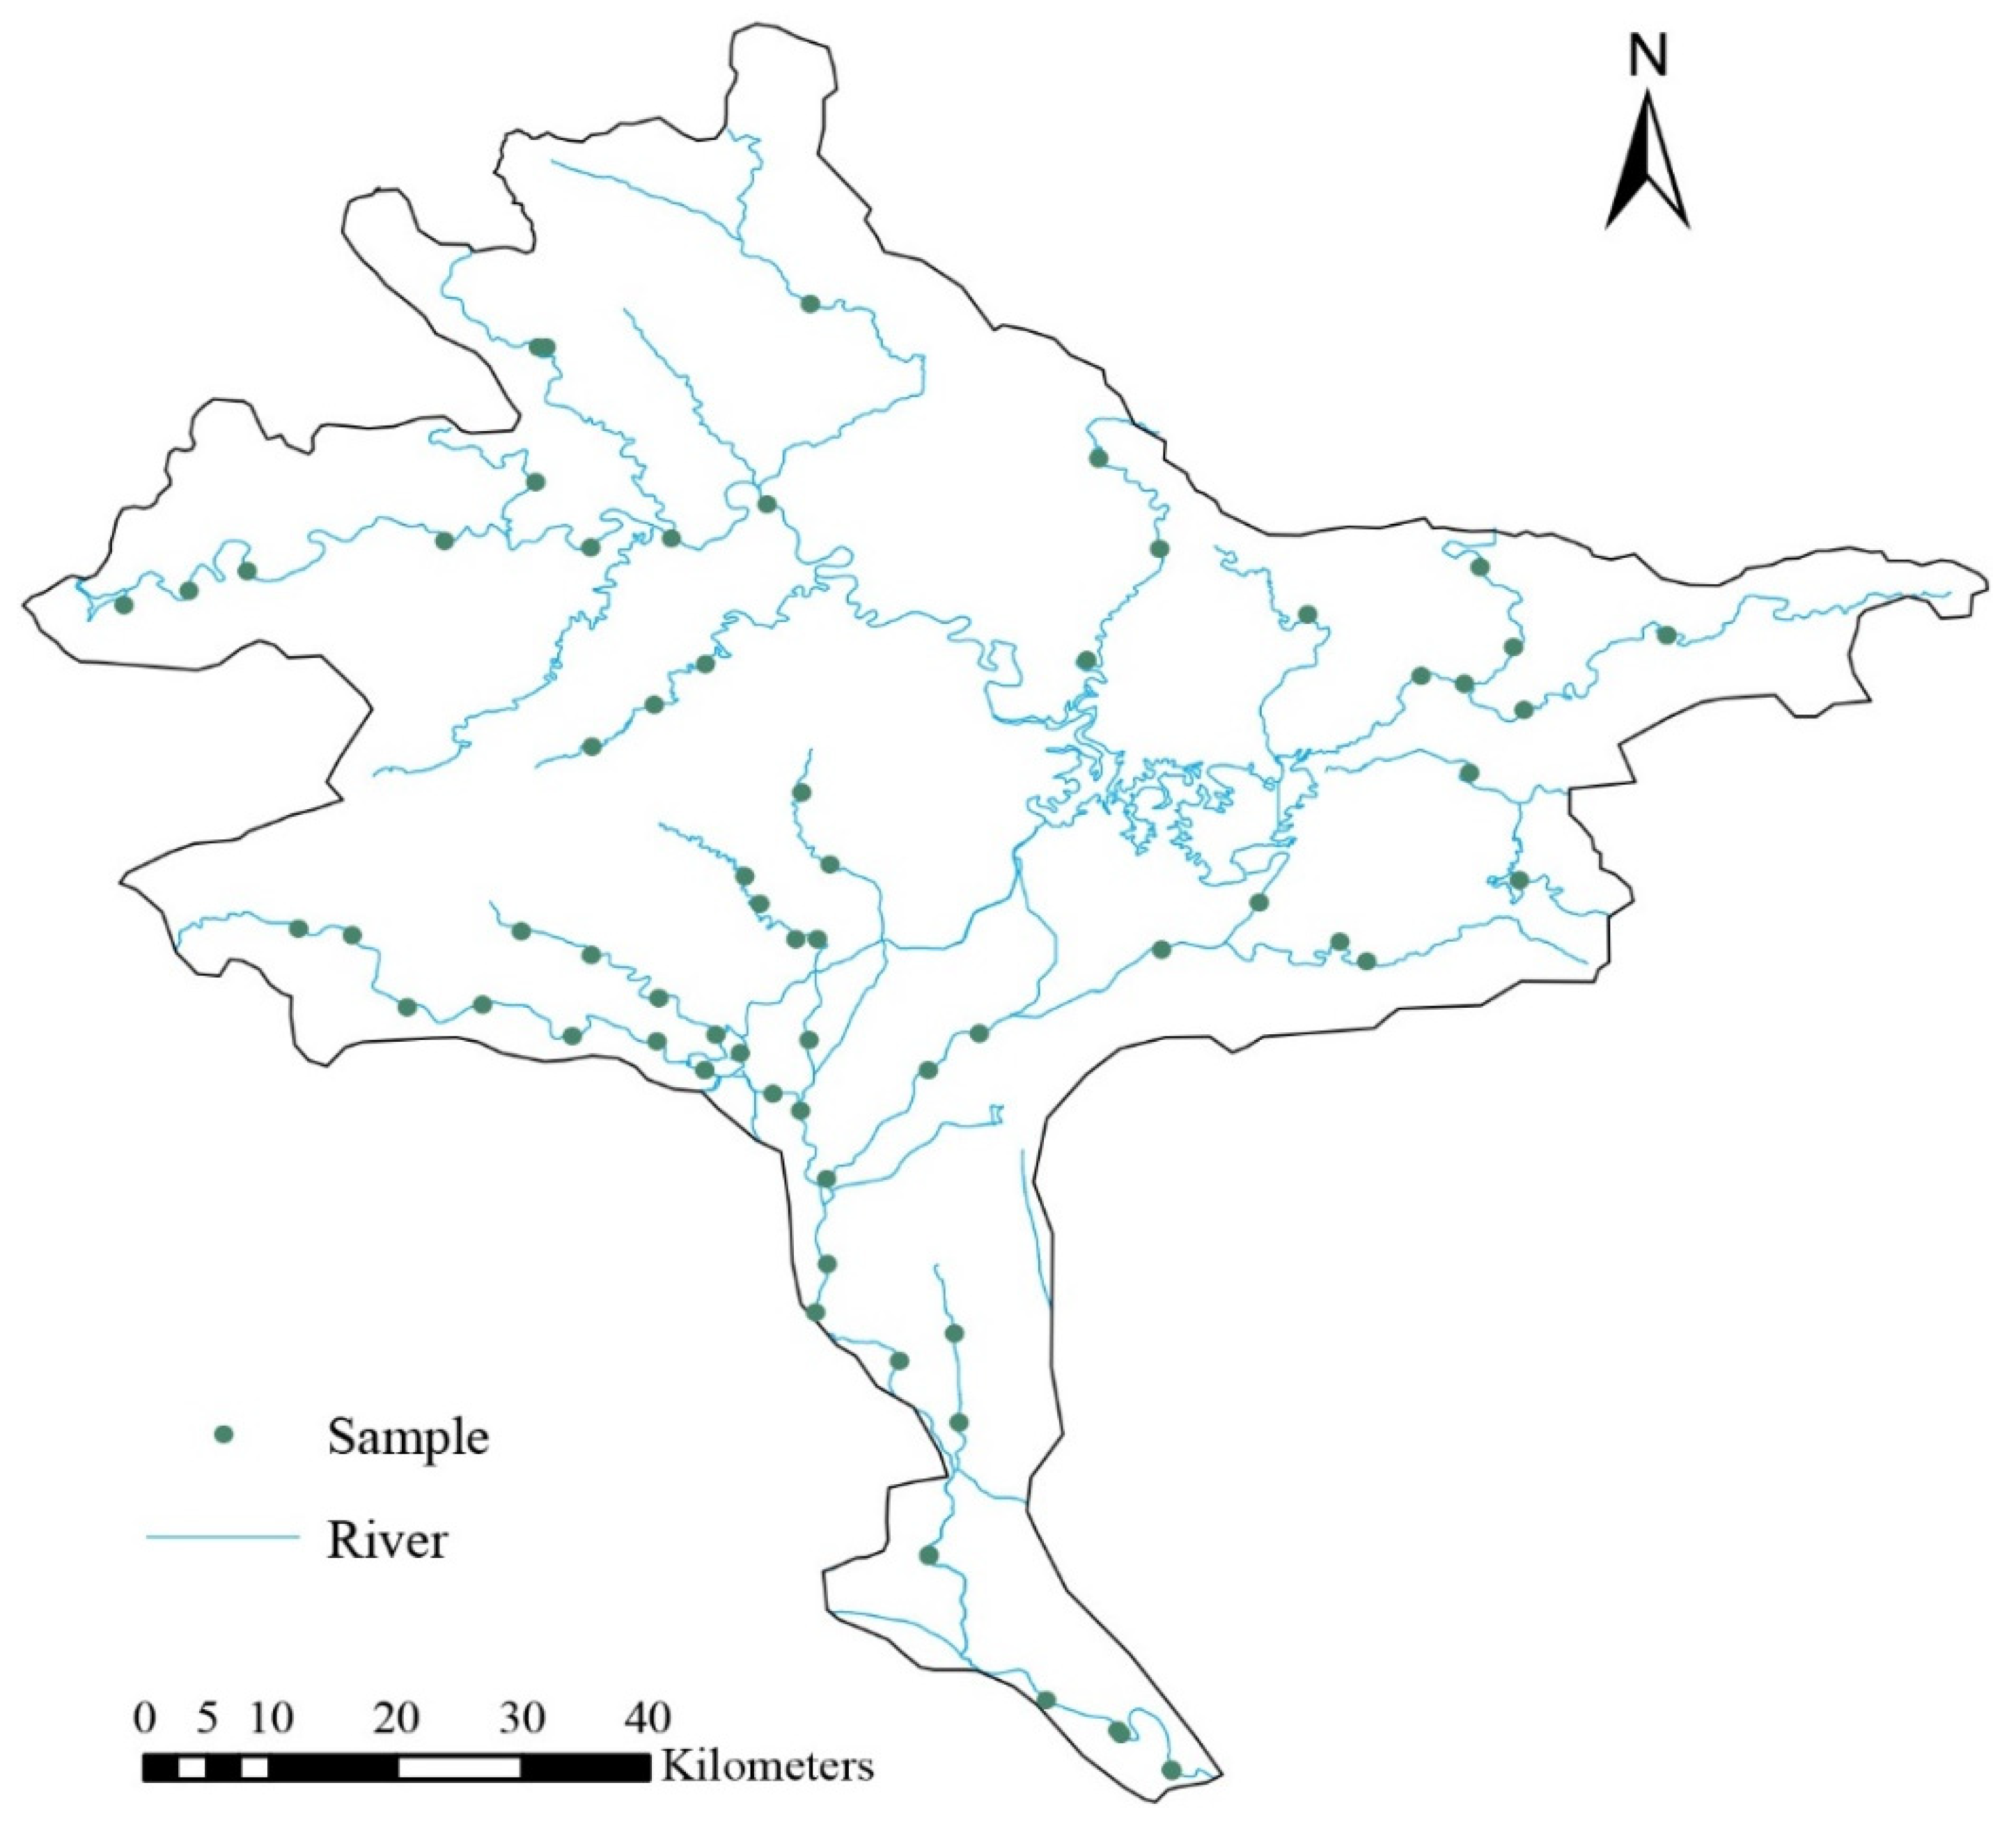
Figure 1. Sampling sites in the study area.
Water 16 00046 g001
Figure 2. Mantel test between plant diversity and environmental factors and correlation test of environmental factors. The meaning of abbreviations is in Table 1.
Water 16 00046 g002
Figure 3. Generalized linear regression of plant richness (a), aquatic plant richness (b), terrestrial plant richness (c), and native plant richness (d) with environmental factors.
Water 16 00046 g003
Figure 4. Generalized linear regression of native plant abundance (a), introduced plant abundance (b), plant abundance (c), and aquatic plant abundance (d) with environmental factors.
Water 16 00046 g004
Table 1. Abbreviations of environmental variables.
AbbreviationVariable
SlopeSlope
LengthLength of the riparian zone
pHsoilSoil pH
pHwaterWater pH
soil CSoil organic matter
soil NTotal soil nitrogen
soil PTotal soil phosphorus
water CWater organic matter
water NTotal water nitrogen
water PTotal water phosphorus
con500–50 m construction land area
con1000–100 m construction land area
con2000–200 m construction land area
con3000–300 m construction land area
con5000–500 m construction land area
gra500–50 m green land area
gra1000–100 m green land area
gra2000–200 m green land area
gra3000–300 m green land area
gra5000–500 m green land area
for500–50 m forestland area
for1000–100 m forestland area
for2000–200 m forestland area
for3000–300 m forestland area
for5000–500 m forestland area
cul500–50 m cultivated land area
cul1000–100 m cultivated land area
cul2000–200 m cultivated land area
cul3000–300 m cultivated land area
cul5000–500 m cultivated land area
wat500–50 m wetland area
wat1000–100 m wetland area
wat2000–200 m wetland area
wat3000–300 m wetland area
wat5000–500 m wetland area
Disclaimer/Publisher’s Note: The statements, opinions and data contained in all publications are solely those of the individual author(s) and contributor(s) and not of MDPI and/or the editor(s). MDPI and/or the editor(s) disclaim responsibility for any injury to people or property resulting from any ideas, methods, instructions or products referred to in the content.