Article

Batch Settling and Low-Pressure Consolidation Behaviors of Dredged Mud Slurry: Steady-State Evaluation and Mechanism Study

1
School of Civil & Engineering Management, Guangzhou Maritime University, Guangzhou 510725, China
2
Guangdong Port and Coastal High Performance Structure and Materials Engineering Technology Research Center, Guangzhou 510725, China
3
School of Civil Engineering & Transportation, South China University of Technology, Guangzhou 510641, China
4
CCCC Fourth Harbor Engineering Institute Co., Ltd., Guangzhou 510230, China
5
CCCC Key Lab of Environmental Protection & Safety in Foundation Engineering of Transportation, Guangzhou 510230, China
6
CCCC FHEC Harbor Engineering Design Co., Ltd., Guangzhou 510220, China
*
Authors to whom correspondence should be addressed.
Water 2024, 16(1), 7; https://doi.org/10.3390/w16010007
Submission received: 7 November 2023 / Revised: 12 December 2023 / Accepted: 15 December 2023 / Published: 19 December 2023

Abstract

:
Since the exploration of the characteristics of dredged mud slurry during batch settlement and low-pressure consolidation (less than 100 kPa) is still insufficient, the determination of the optimal time to start the vacuum preloading method (VPM) on dredged-fill foundations is still empirically oriented (due to a lack of enough scientific basis). To further explore the characteristics of dredged mud slurry during batch settlement and low-pressure consolidation, samples from typical dredged-fill land projects were obtained and used to conduct batch sedimentation model experiments and low-pressure (less than 100 kPa) consolidation tests. The results of experiments and analyses showed the following: (1) the clay (d < 0.005 mm) content is a main factor affecting the batch settlement and consolidation characteristics of dredged mud slurry, which is not conducive to the consolidation effect of dredged-fill foundations. (2) For dredged mud slurry whose clay content is within 40% to 60%, the cumulative change rate of the average porosity ratio of 60% to 75% is suitable for evaluating the steady state of its batch sedimentation process, i.e., the optimal starting time of VPM. Finally, based on the experimental analyses, a settlement prediction method that considers both the batch sedimentation and the low-pressure consolidation processes was developed and validated.

1. Introduction

At present, it is commonplace to encounter dredged sediments when near-river or near-sea projects are carried out, such as the daily dredging and maintenance of port channels, comprehensive management of the urban water environment, water conservancy, flood control, etc. The bulk dredged mud slurry produced in these projects, dominated by clay particles, is mostly a fluid-like material with high water content, congee consistency, and almost no bearing capacity [1,2,3]. One of the most effective methods that are widely acknowledged for reusing this material is land reclamation through this dredged fill [4], as shown in Figure 1.
During the land reclamation process, in situ sediments are first dredged from underwater with a hydraulic dredger or mechanical dredger and then pumped into a preselected mud yard through mud pumps and pipelines; the fluid-like dredged sediment is a kind of Bingham fluid [5] without initial media structures and cannot be used as foundation soil for engineering construction until it has been through batch sedimentation, water drainage, and vacuum preloading treatment processes [6]. The drainage and consolidation process of dredged-fill foundations can be divided into two stages, i.e., the batch sedimentation process and the Terzaghi consolidation process. During batch sedimentation, most particles are suspended in water, while some of the particles form flocculation structures due to the van der Waals force [7]. As time passes, the suspended particles gradually settle down due to gravity and form sediments; the distance between these flocculation structures then gradually diminishes and they form soil skeletons. At this stage, the suspended particles can be recognized as non-Terzaghi soil [8]; effective stress cannot form within them. Therefore, the mechanical behavior of dredged-fill foundations at this stage cannot be completely explained by the classical Terzaghi consolidation theory [9].
In contrast, the stage at which the suspended particles have all settled down and joined the sediments can be considered the beginning of the Terzaghi consolidation process. During this consolidation process, external loads can be applied on the soil skeletons and force out the pore water within them; with the drainage of the pore water, the soil will become denser, and its effective stress will increase. Ideally, to ensure a better treatment effect, a foundation reinforcement method, such as the vacuum preloading method (VPM), should be employed at this stage [10]. Otherwise, the vacuum pressure applied to the sediments may carry the suspended soil particles away along with the water and cause a clogging phenomenon [11] near the drains. However, due to the tight time limits for most construction projects and the lack of sufficient scientific basis for judging the ending time of the batch sedimentation process, in engineering practice, the VPM is often started before the batch sedimentation process is over [3,12,13,14,15].
The application of the VPM on dredged mud-slurry-filled foundations inevitably covers the two stages mentioned above, which leads to another problem: how to calculate and predict the total settlement of dredged mud-slurry-filled foundations treated by the VPM. For soft soil ground, the settlement is normally calculated based on the subdivision method [16]; the subdivision method is widely used in the theoretical calculation of foundation settlement, which uses the characteristics of the compression curves of soil. In practice, together with the settlement calculation, the discrepancy of different soil properties in different regions will be considered using an empirical coefficient ms [17]. However, the adjustment of the empirical coefficient ms has been questioned in terms of its scientific rationality. For large-scale dredged-fill foundations, Zhang et al. [18] claimed that if the water content of the sediment soil is less than the critical water content wc, at which consolidation settlement occurs, then the settlement can be calculated by the one-dimensional consolidation theory [19,20,21]. Otherwise, the batch sedimentation process will prevail in the soil, and the settlement should be calculated based on the sedimentation regularity. However, Zhang et al. [18] did not propose a clear method for calculating settlement during the batch sedimentation process.
On the other hand, the low-pressure consolidation characteristics of sediment soil have been extensively studied. For example, Loginov et al. [22] discussed the low-pressure compression–permeability characteristics of a bentonite sediment based on a centrifuge model test [20,21,23]; Chen et al. [24] claimed that the one-dimensional large strain consolidation of saturated soft materials that are deposited at very low density usually exhibits a time-variant compressibility relation and presents two modifications on two conventional equations for compressibility and permeability, but they did not propose a clear method for calculating the settlement considering low-pressure consolidation characteristics; Qin et al. [25] proposed an analytical solution to estimate the settlement by considering the sedimentation and consolidation, but the analytical solution is only applicable to indoor model experimental studies because of the need to obtain the state specifications during the settling process. Apparently, the influence of batch sedimentation and low-pressure consolidation has not been fully considered in the existing settlement calculation methods of VPM-treated dredged-fill foundations. This may be the crucial reason for the deviation between the design value of the total settlement and the situation of actual projects.
In this work, batch settling and low-pressure (less than 100 kPa) consolidation behaviors of dredged mud slurry were further studied via laboratory deposition experiments and low-pressure consolidation tests. Based on the experimental results, the characteristics of the batch sedimentation and the low-pressure consolidation were analyzed, a criterion for evaluating the stable time of the batch sedimentation process was concluded, and a settlement prediction formula considering both the batch sedimentation process and the low-pressure consolidation process was established. This work may provide a reference for the design and construction of dredged mud slurry foundations.

2. Materials and Methods

2.1. Experiment Preparation

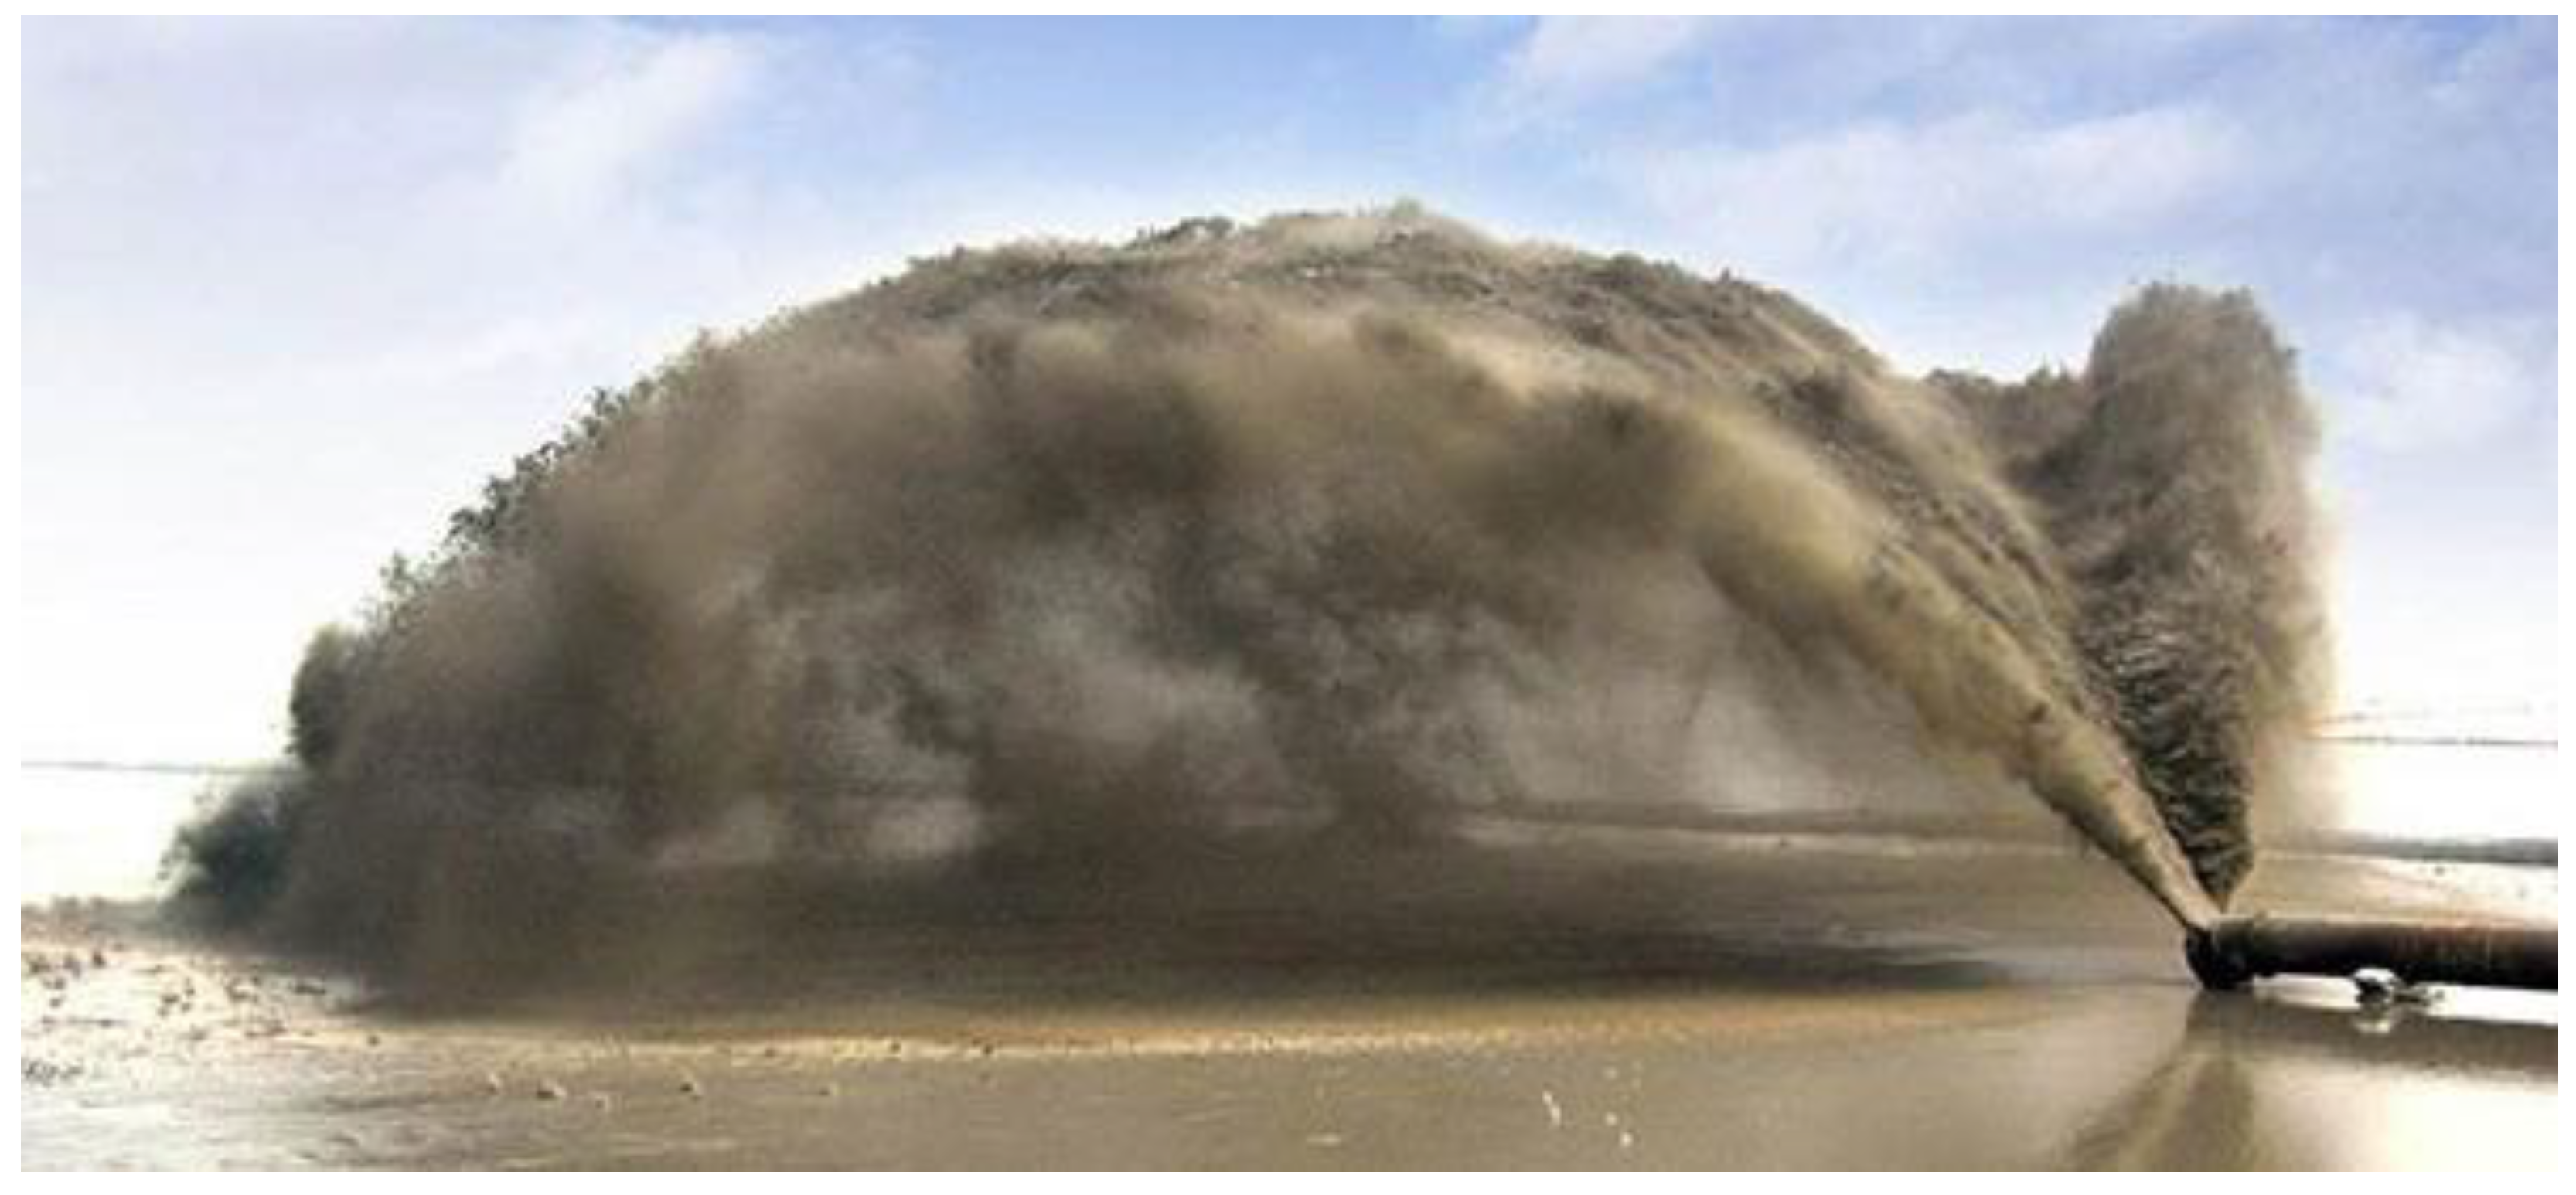
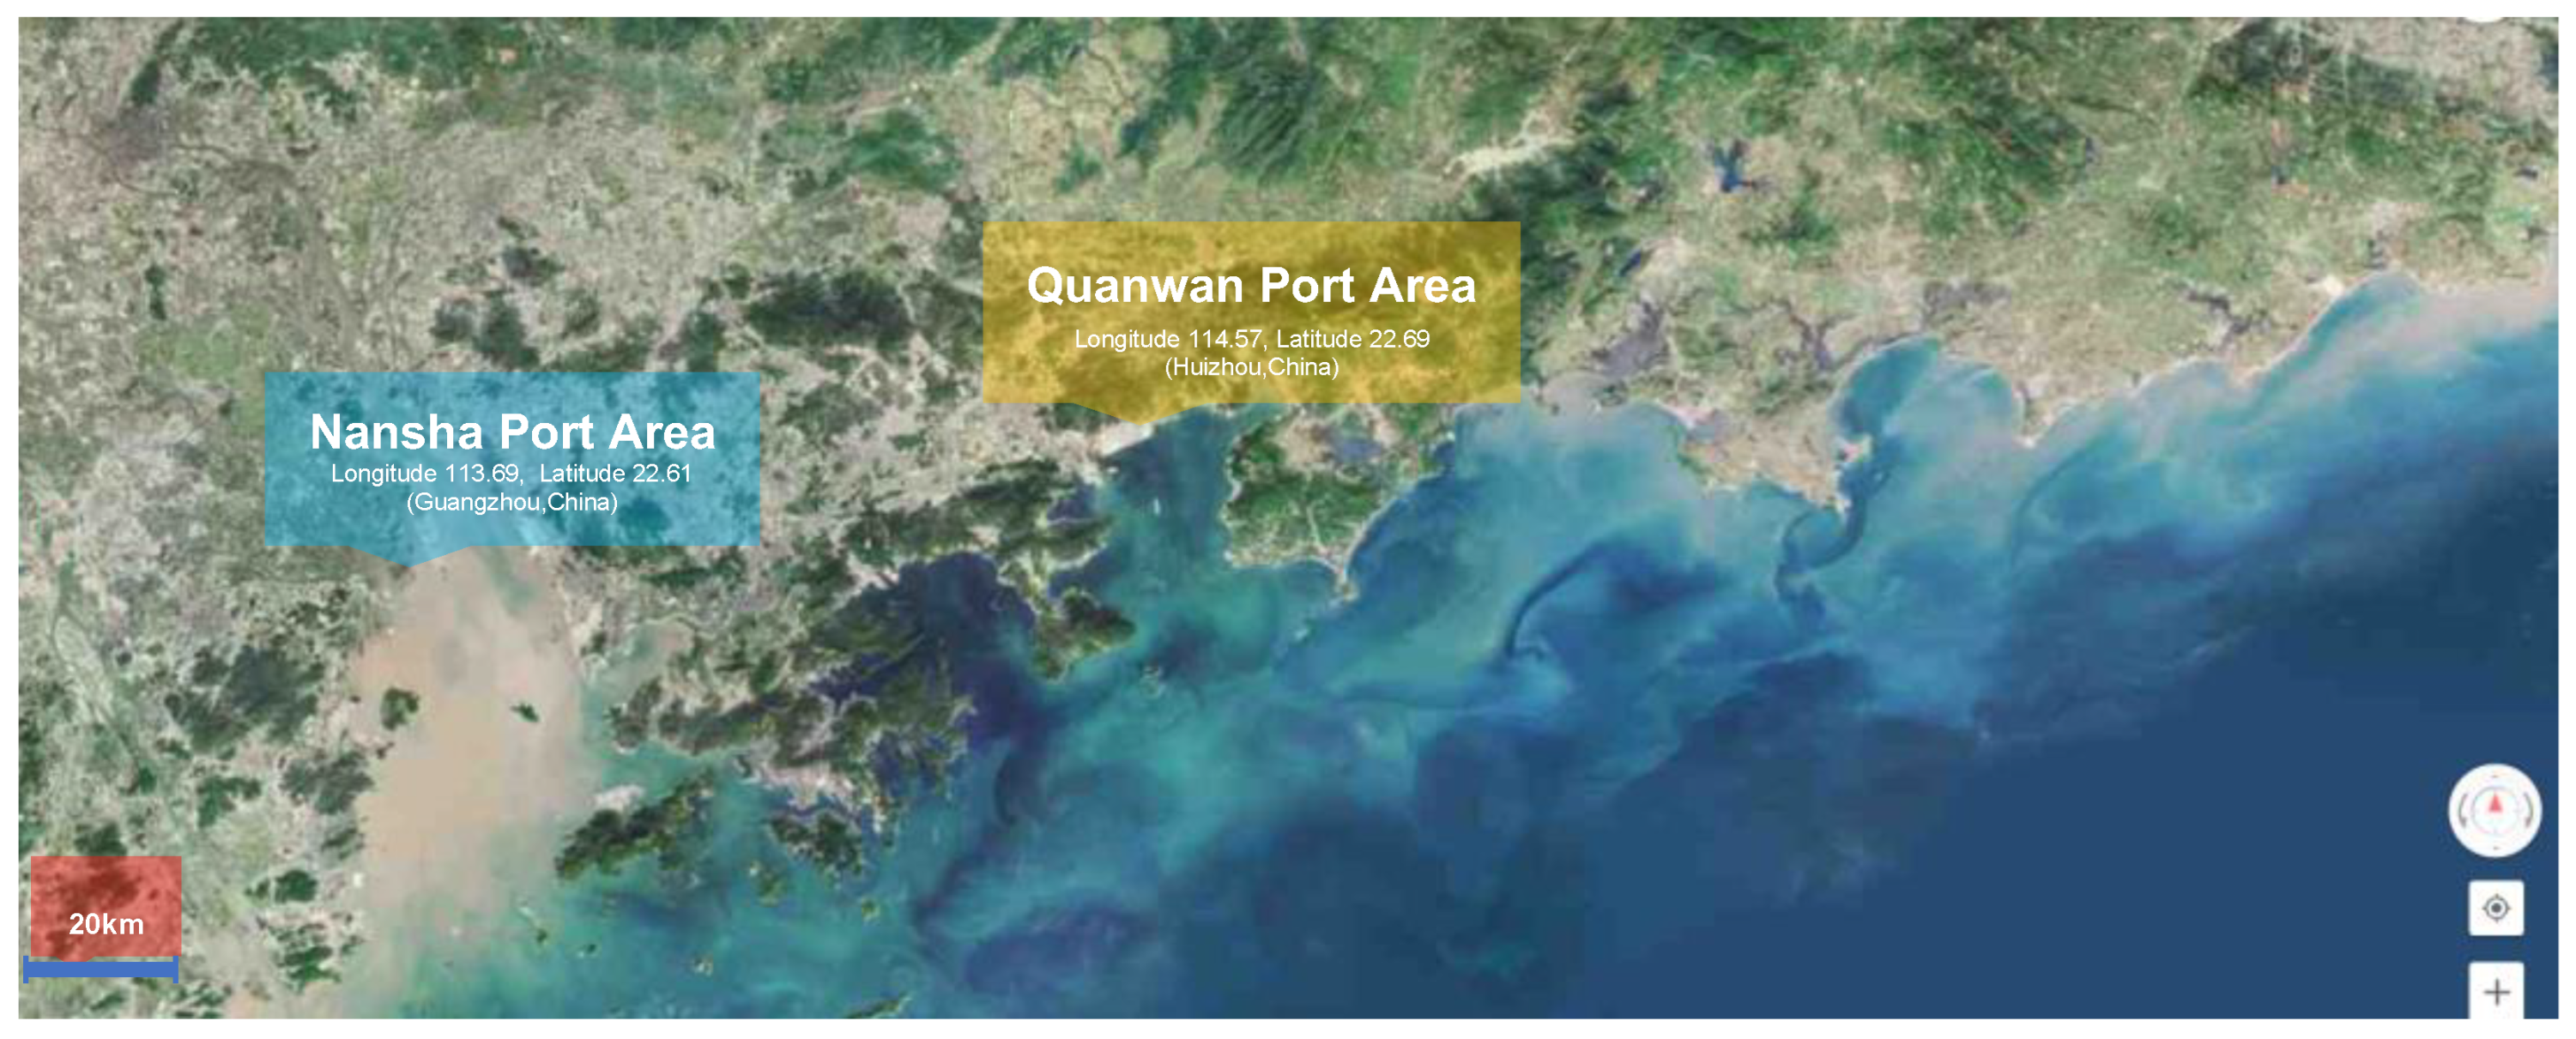
2.1.1. The Study Area and Sample Preparation

The dredged mud slurry samples for the experiments were obtained from Nansha Port Area (Guangzhou) and Quanwan Port Area (Huizhou), Guangdong Province, as highlighted in Figure 2. The mud slurry at the surface level of just-finished dredged-filled ground can be deemed uniform. Therefore, the samples all were dug from 1 to 1.5 m below the surface of the just-filled mud slurry ground. Using 0.53 mol/L NaCl solution as indoor dilution water, two sets of dredged-fill samples with ion concentrations similar to the actual seawater were prepared according to the approximate wet density of 1.10 g/cm3 and water content of 450%. After the dilution, the samples were sealed for 24 hours to let the sediment particles be fully soaked, and then the samples were stirred well with a motor mixer. The physical properties and compositions of the two kinds of samples were tested according to the soil mechanics laboratory manual [26]; the results are shown in Table 1. Since the clay (d < 0.005 mm) contents of these two samples are 40.7% and 60.9% (greater than 40%), and the water contents (380% and 548%) were more than five times the liquid limits, according to the statistics of Bao et al. [3], these two kinds of samples can be deemed as typical dredged mud slurry.

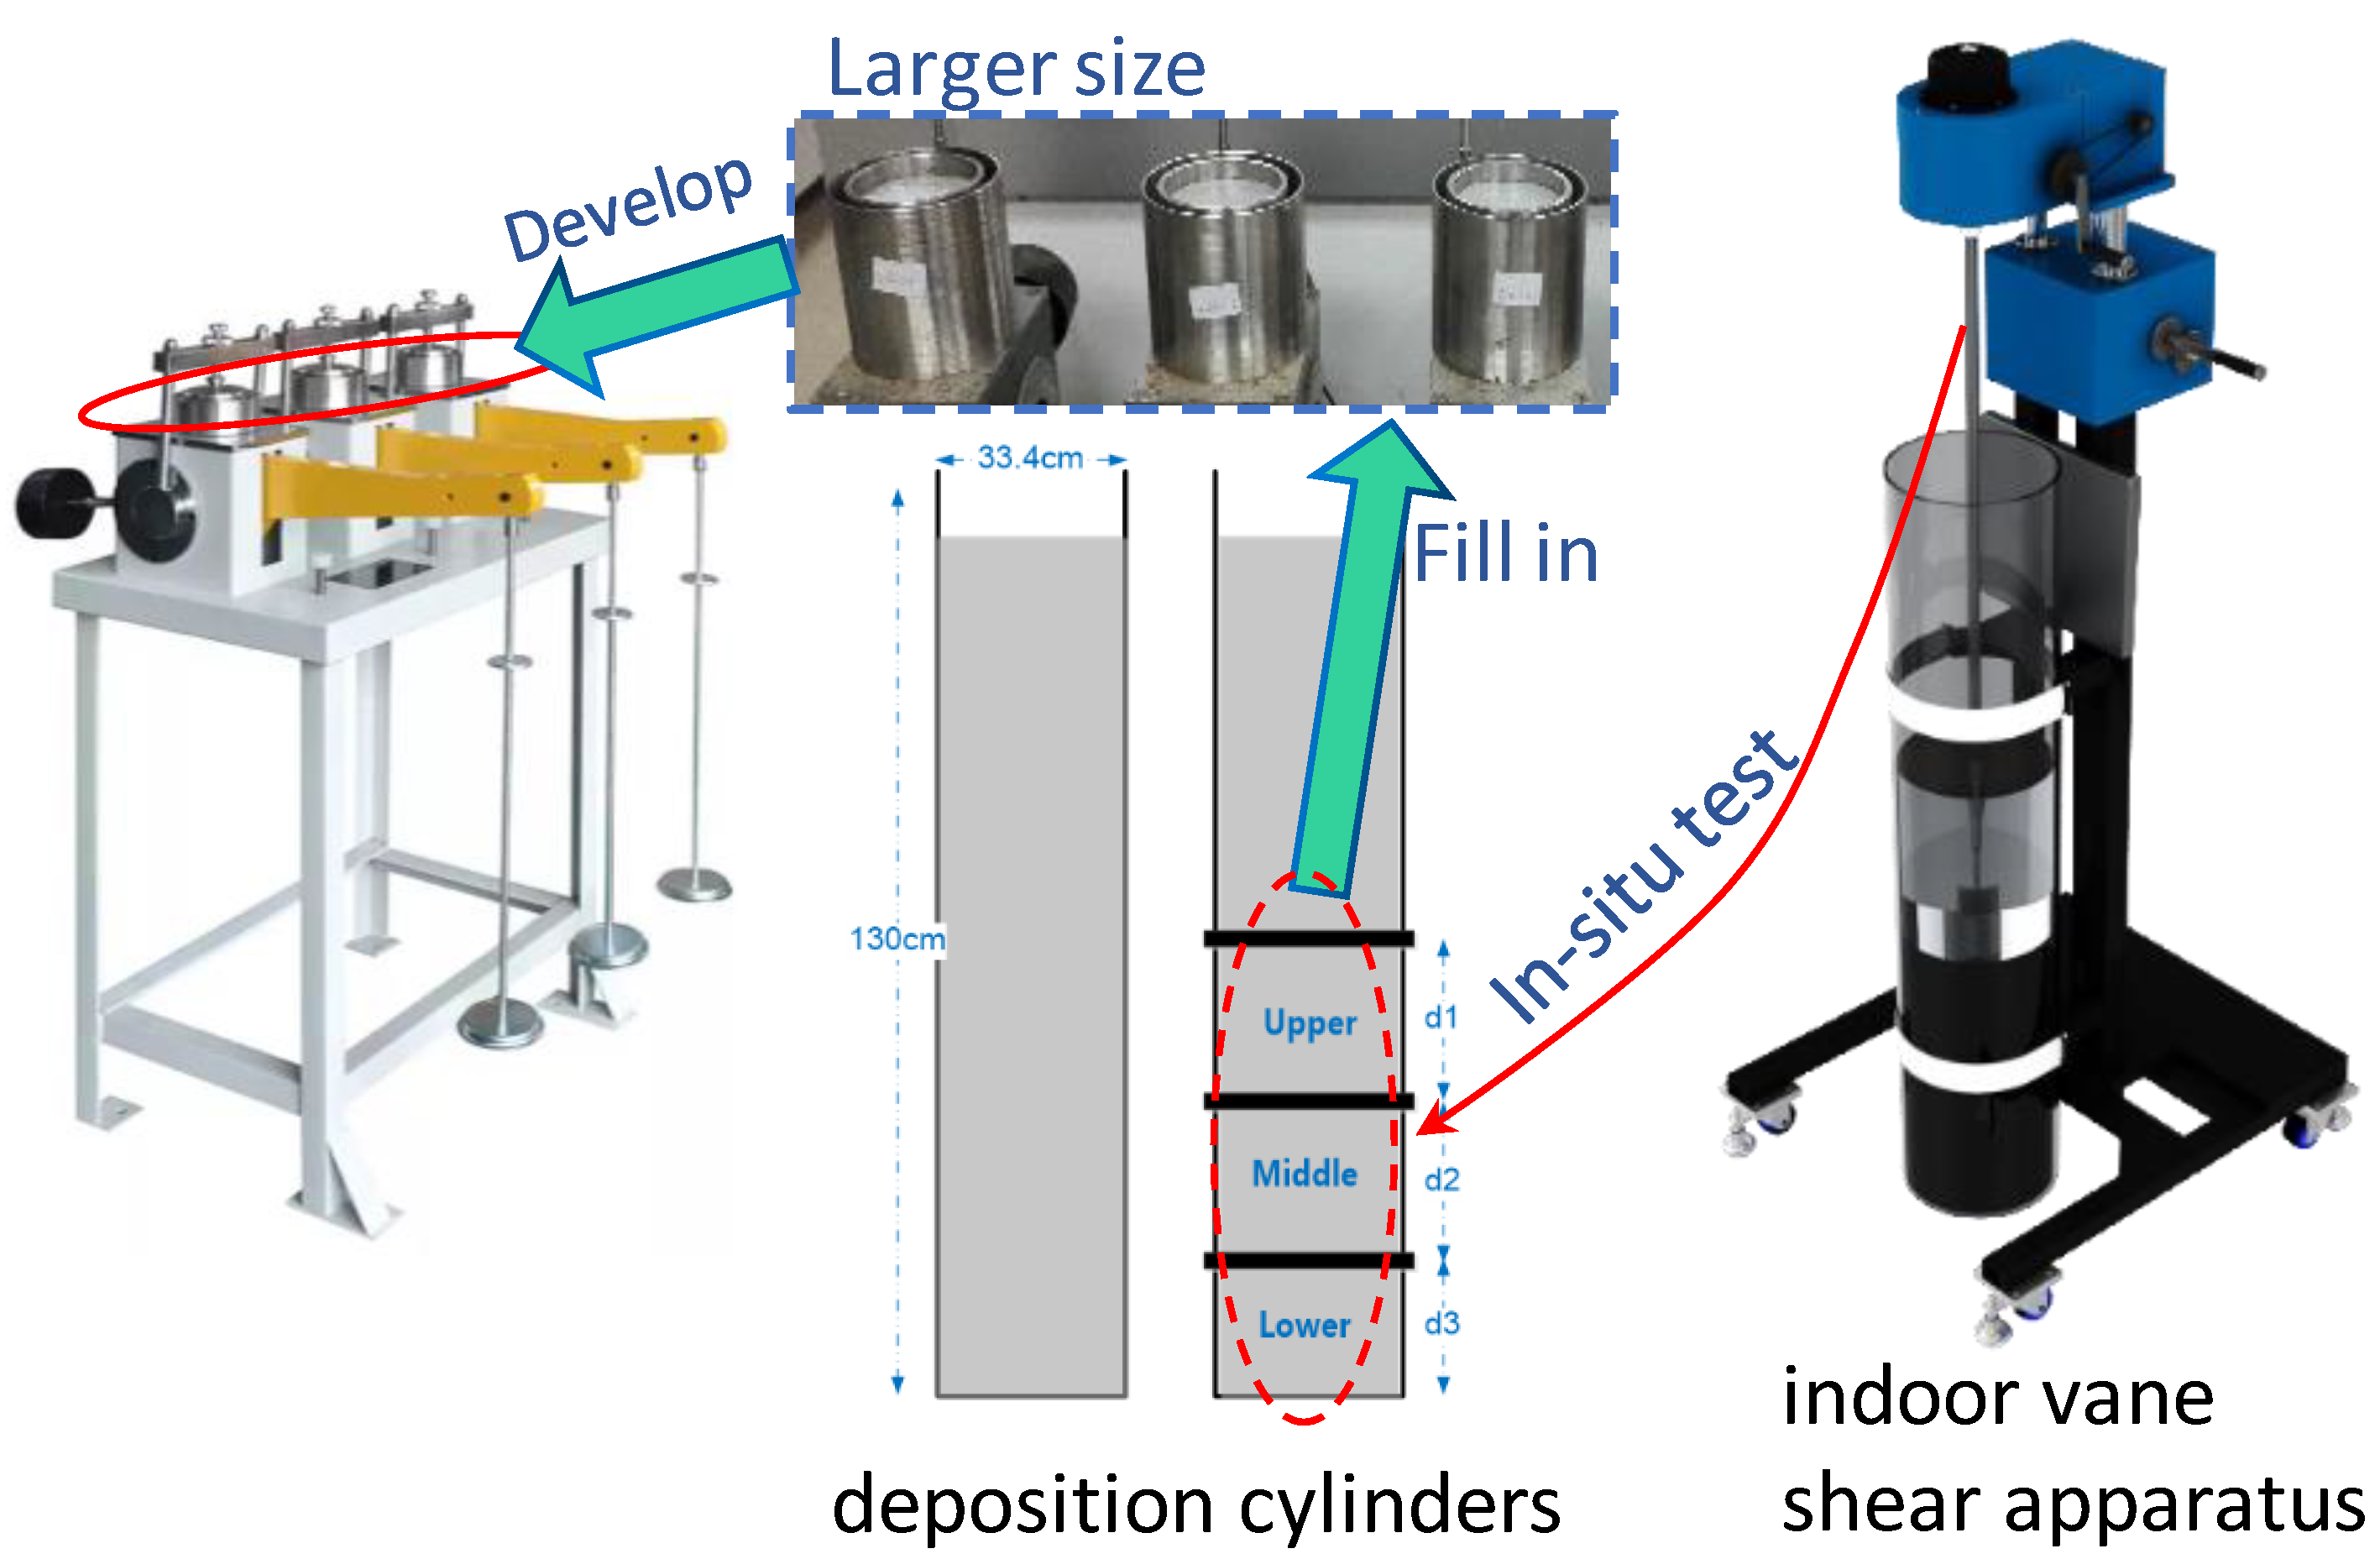
2.1.2. Experiment Apparatus

The experiment apparatus includes deposition cylinders, an indoor vane shear apparatus, self-developed consolidometers, and other conventional geotechnical test equipment and tools. Herein, the deposition cylinders all were made of polymethyl methacrylate (PMMA); two of them were made integral, and two were assembled piecewise; as shown in Figure 3, the height, wall thickness, and inner diameter of the cylinders were respectively 130 cm, 8 mm, and 33.4 cm. Each of the piecewise-assembled deposition cylinders is divided into four sections along the height direction; the heights of each section, i.e., d1, d2, and d3, were designed according to the characteristics of the long-term static batch sedimentation curve; every two adjacent sections can be connected by lofted flanges and sealed by sealing rings. Scales were set on the walls of each cylinder to determine the sediment height during the experiment, while the initial sediment heights in each cylinder were unified as 120 cm. The indoor vane shear apparatus (model type PS-VST-LEE-PS1000) shown in Figure 3 was produced by PENESON Co., Ltd. (Wuhan, China). Referring to the work of Islam et al. [28], consolidometers suitable for low-pressure consolidation tests were developed. Considering the very weak soil skeleton of the sample, the consolidometers were enlarged to increase the external load the sample could provide, which was aimed at better controlling the sample’s mechanical conditions. The experiments would otherwise fail too easily. The size of these self-developed consolidometers demonstrated in Figure 3 is larger than that of conventional consolidometers, as the inner diameter and height are 10 cm and 8 cm, respectively. All other information about the detailed components of the device is the same as the consolidometer described in the standard [29].

2.2. Experiment Methodology

2.2.1. Laboratory Experiment of the Batch Sedimentation Process

The two groups of samples (I and II) were employed to perform the batch sedimentation model experiments first within the integral cylinders and then the piecewise-assembled cylinders. First, sample I and sample II were respectively placed in the integral cylinders (termed I-1 and II-1) for batch sedimentation experiments (240 days). During the experiments, the relevant parameters used to judge the stable state of the batch sedimentation (as shown in Figure 4) were recorded, such as the settlement of solid–liquid interface, concentration of the particle suspension C, settlement time t, average water content, average wet density, average porosity ratio, etc., which have provided bases for determining the height of the cross-section of each lofted flange in the piecewise-assembled deposition cylinders. When the first-part batch sedimentation model experiments reached a stable state (the determination method was discussed in the Theoretical Analyses section), the rest of sample I and sample II were well stirred and placed in the piecewise-assembled cylinders (termed I-2 and II-2) for relatively short batch sedimentation model experiments. These short experiments were meant to obtain the physical and mechanical indexes (such as shear strength, water content, density, particle composition, etc.) of the samples deposited at different depths during the corresponding deposition time.

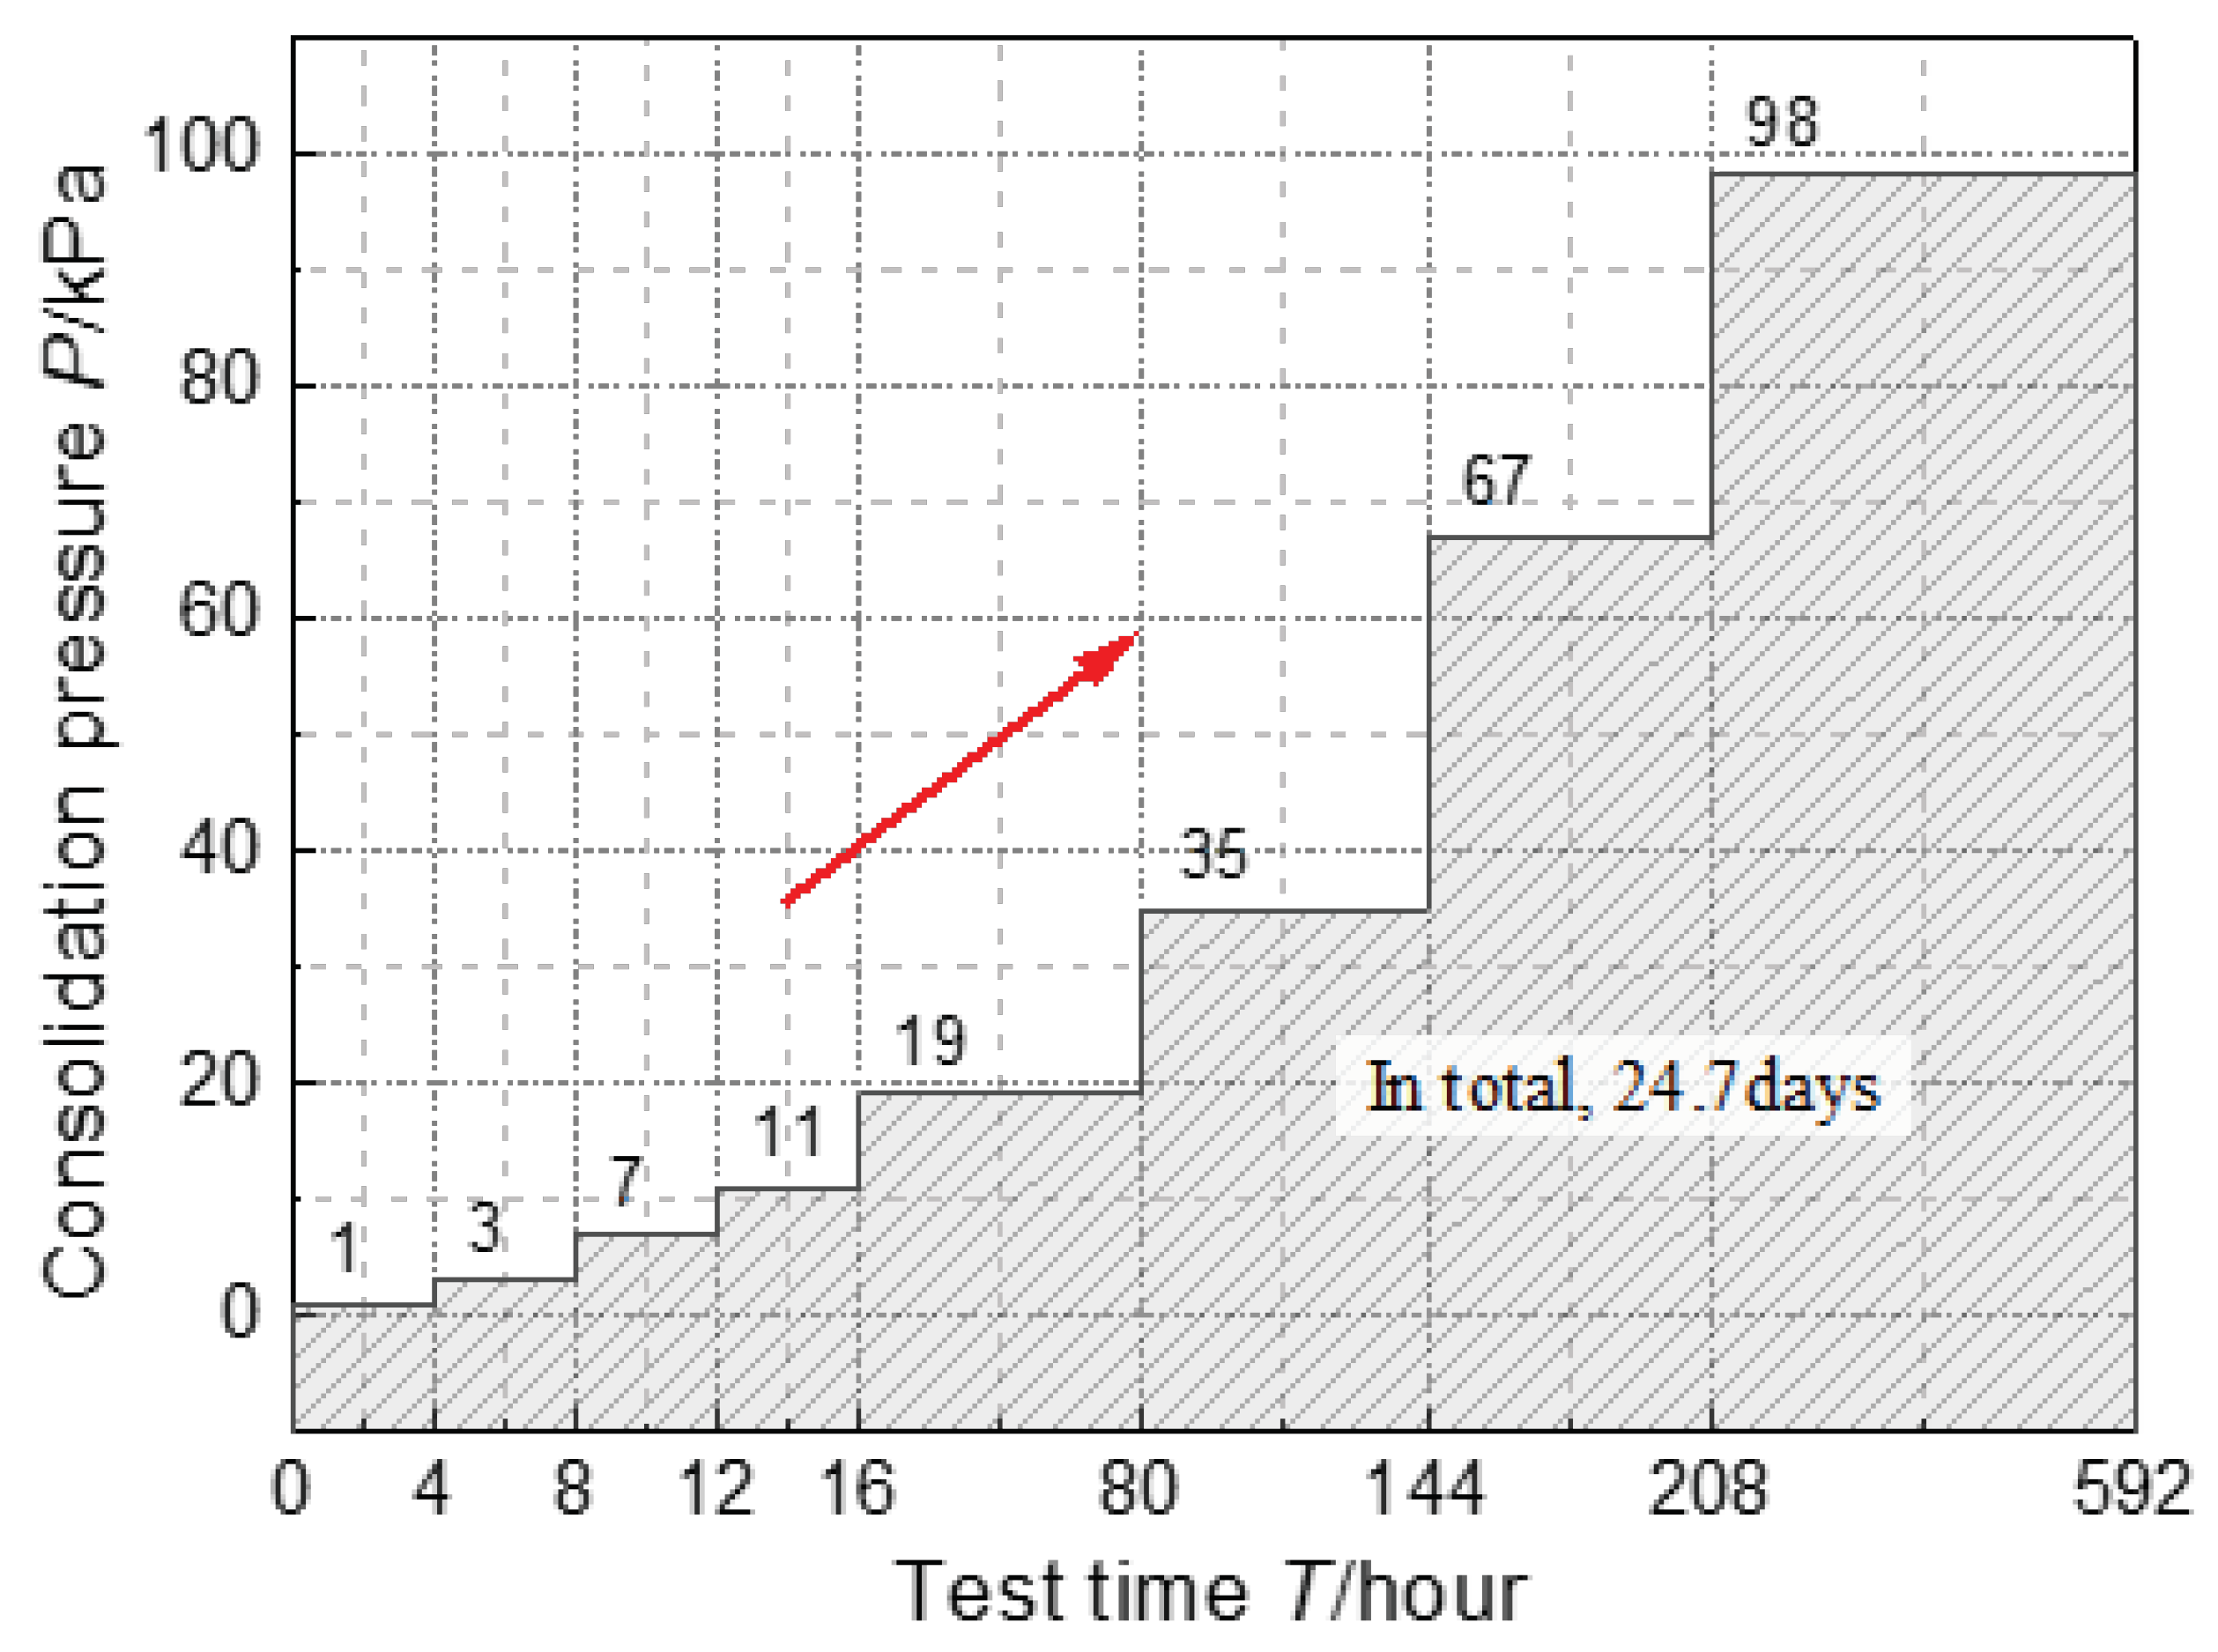
2.2.2. Low-Pressure Consolidation Test

Based on the results of the long-term batch sedimentation model experiments, samples at a certain deposition time and a certain depth were obtained from the I-2 and II-2 cylinders. Since the VPM is usually applied to reinforce the dredged soil before the completion of the batch sedimentation, the sampling time for low-pressure consolidation tests was also set before the stabilization of the batch sedimentation. Since the samples have very high compressibility (much greater than the conventional soft soil), to facilitate statistics and analyses of the settlement deformation during the consolidation, the low-pressure consolidation tests were carried out using self-developed consolidometers to study their low-pressure consolidation characteristics. The consolidation test plans were made in reference to the work of Islam et al. [28], as shown in Figure 5.
The specific sampling time, sampling depth, and sampling methods are as follows:
  • In engineering practice, the vacuum preloading treatment is usually carried out before the batch sedimentation process can reach a stable state, so the sampling time herein was determined to be about half of the time required for the batch sedimentation to be stable.
  • The sampling depth was picked at the middle of the middle section (100 cm from the top) of the I-2 cylinder and the middle of the lower section (120 cm from the top) of the II-2 cylinder.
  • The method of obtaining the sample at the corresponding depth is as follows: first, the deposition cylinder above the flange position was removed; then, the in situ shear strength of the sample at the corresponding position was measured by the indoor vane shear apparatus in the target segment, and the rest of the undisturbed samples at the corresponding position were obtained for the low-pressure consolidation tests.

3. Results

3.1. The Results of the Batch Sedimentation Experiments

The settlement changes in the solid–liquid interface (Si) during the long-term 240 d sedimentation process of I-1 and II-1 groups are shown in Figure 6. The slopes of the curves show that the batch sedimentation of I-1 and II-1 samples tends to stabilize with the settling rate ≤ 1.0 mm/d after 50 d (at point PI) and 91 d (at point PII), respectively, and the stabilized sample heights of I-1 and II-1 samples were respectively 39.4 cm and 48.4 cm (around 40 cm). Correspondingly, the height of each abovementioned section of the assembled deposition cylinders was set as 20 cm, and the sampling time for the low-pressure consolidation tests was determined as 25 d and 50 d, respectively, for the I-2 and II-2 groups. In addition, the average pore ratio of group I-1 and group I-2, respectively, stabilized at 3.025 and 5.867.

3.2. The Results of the Low-Pressure Consolidation and In Situ Shear Tests

The consolidation compression curve showing the change in the pore ratio is depicted in Figure 7, and the physical and mechanical test results of the samples during the low-pressure consolidation tests are shown in Figure 8.
It can be learned through Figure 7a that, under the low-pressure consolidation load (0~100 kPa), the typical characteristics of the e-P curve of the dredged mud slurry can be sorted into three parts, namely a straight steep drop section (large slope), a curve transition section (high curvature), and a straight gradient section (small slope). It can also be learned through Figure 7b that the typical characteristics of the corresponding e-lgP curve mainly show two stages, namely the straight steep descent section (large slope) and the straight gradual gradient section (relatively small slope), i.e., a concave broken line. Both the characteristics of the e-P and e-lgP curves are quite different from that of a conventional soft soil; the e-P and e-lgP of a conventional soft soil usually do not have a clear turning point, or the curves have a convex section [31,32,33]. The two-stage lines also denote that the curve slope of sample I-2 is steeper than that of II-2.
It can be seen from Figure 8a–c that as the vertical pressure grew continuously, the water content, density, and undrained shear strength of soil samples first changed rapidly and then stabilized at a certain level. The threshold of the vertical pressure that divides the rapidly changing phase and the stable phase appears to be 30 kPa. Figure 8d shows that during the low-pressure consolidation, the water content of the samples is inversely related to their density, and the correlation is nearly linear; though the variation trend seems tortuous, the undrained shear strength of the samples grew acceleratingly with the growth of their density and the decrease in the water content. Moreover, though the differences in the stabilized water content and density between the two samples were only 31.1% and 8.9%, the difference in undrained shear strength between them was as large as 56.6%.

4. Theoretical Analyses

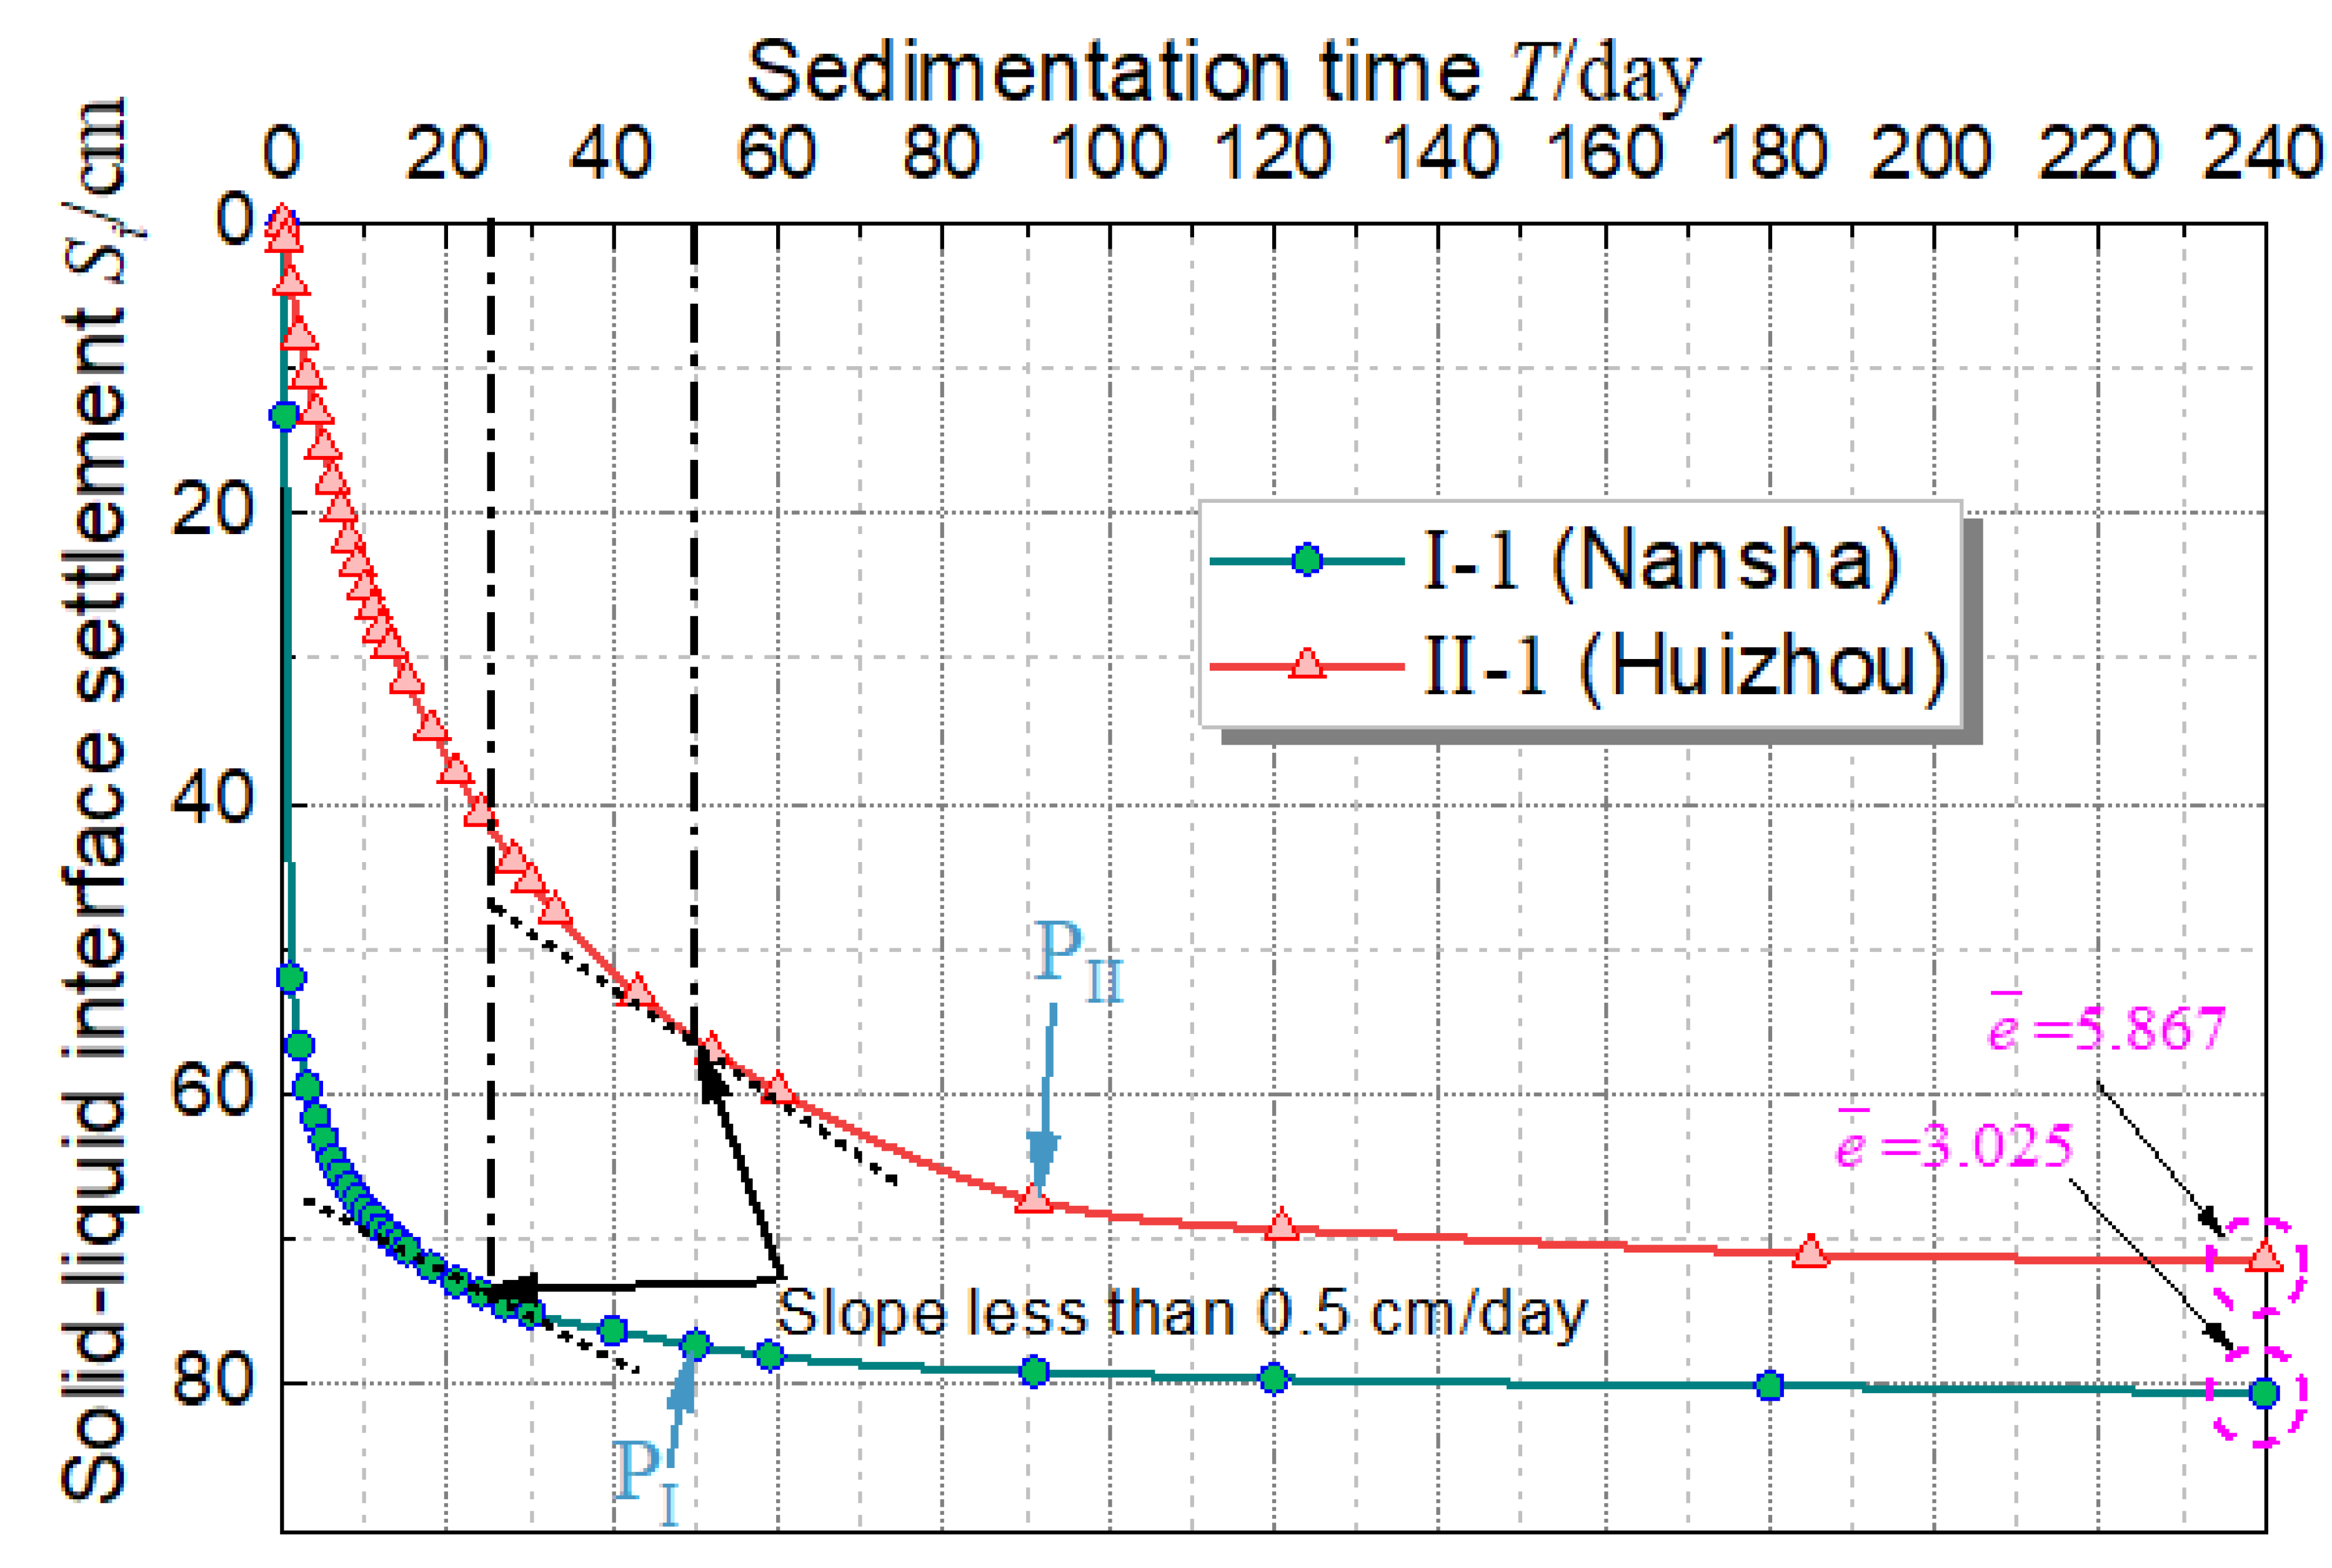
4.1. Characteristics Analysis and Stable Evaluation Criteria of the Batch Sedimentation Process

The batch sedimentation process includes the hindered settling process and the self-weight consolidation settling process. As shown in Figure 6, there are clear turning points P in the batch sedimentation characteristic curves of the dredged-fill samples; PI and PII are the demarcation points on the curves, also known as the compression point [34,35], that divide the hindered settling process and the self-weight consolidation settling process. As can be seen in Figure 9, one important characteristic of the hindered settling is that the particles at this phase will receive an upward additional force, which is caused by the liquid’s buoyancy and the particles’ motion [36]. Therefore, most of the settling particles during the hindered settling process will be suspended in water and slowly move downward at a speed much lower than when they are settling in pure water.
The main physical indexes affecting batch sedimentation characteristics of dredged mud slurry from rivers, lakes, and seas are clay (d < 0.005 mm) content, water content, interfacial settlement rate U, wet density, and void ratio. Clay (d < 0.005 mm) content is the key factor affecting the batch sedimentation characteristics of dredged mud slurry [3]. The higher the clay content is, the longer the time required for the batch sedimentation to stabilize, and the smaller the total settlement value will be. For instance, the clay (d < 0.005 mm) content of Huizhou samples is higher than that of Nansha samples; the time required for the batch sedimentation to stabilize for the Nansha sample of group I and the Huizhou sample of group II was 50 d vs. 91 d, and their total settlements were 77.3 cm vs. 67.3 cm.
However, it is hard to quantify or use the clay (d < 0.005 mm) content as a sole parameter criterion to distinguish the stable phase of the batch sedimentation. Herein, the static batch settlement behavior of dredged mud slurry suspension is analyzed based on Figure 4, and then the key physical indexes affecting its settlement behavior are theoretically analyzed. As shown in Figure 10, considering the unit layer between the height h and h + dh, the particle mass accumulating in the layer at the time interval δt can be described by the flux difference [37], as in Equation (1).
U C A ρ s [ U C + δ ( U C ) δ h d h ] A ρ s = δ C δ t A ρ s d h
where U is the settling velocity of the particle suspension, C is the concentration of the particle suspension (i.e., the solid-phase concentration, expressed by the volume fraction), A is the cross-section area of the deposition cylinder, and ρ s is the density of the particle suspension. Accordingly, Equation (2) can be derived.
δ ( U C ) δ h = δ C δ t
Equation (2) shows the relationship between the concentration change rate at a fixed height and the particle flux change with height in the deposition cylinder, which can be used to derive Equation (3).
δ ( U C ) δ C = δ h δ t
Equation (3) is the velocity of a fixed concentration in the deposition cylinder propagating through the settling column, which is a function of the particle flux changing with the solid-phase concentration. Meanwhile, the following theoretical relationships can be established between the settling velocity U of the particle suspension and the settling velocity ut and porosity ε of the particles [38].
U = u t ε n
Herein, ut is the settling velocity of particles in an infinite fluid, ε is the porosity of the particle suspension, and the exponential n is the Reynolds number of the particles, which pertains to particle diameter, the diameter of the indoor model deposition cylinder, etc. Since the porosity ε can be expressed by void ratio e, Equation (4) can be transformed to Equation (5).
U = u t ( e 1 + e ) n
Equations (2) and (3) are solved to obtain the settling velocity U; then, the solution of the settling velocity U can be expressed by Equation (6).
U = 1 C 0 h C t d h = 1 C C max C h t d C = u t ( e 1 + e ) n
According to Figure 4 and Figure 9, with the downward deposition of sediment particle suspension, the high-concentration area will gradually rise from the bottom of the sedimentation cylinder until it reaches the solid–liquid interface. By the time the high-concentration area transfers to the solid–liquid interface, the settling velocity USL at the solid–liquid interface will be equal to the average settling velocity of the particle suspension, which can be expressed as Equation (7).
U SL = U ¯ = 1 C ¯ 0 h C t d h = 1 C ¯ C max C h t d C = u ¯ t ( e ¯ 1 + e ¯ ) n ¯
Therefore, for a specific dredged mud slurry suspension, the average pore ratio e ¯ can be used as an indicator to judge whether the settling process has entered the stable state of the batch settlement. The definition of the average void ratio e ¯ can be expressed by Equation (8).
e ¯ = V ¯ v V ¯ s = V ¯ v 0 Δ V ¯ v V ¯ s = H 0 A n 0 Δ H A H 0 A ( 1 n 0 ) = H 0 e 0 S i ( 1 + e 0 ) H 0
Herein, Vv, Vs, H, A, n, and ΔH = Si are, respectively, the pore volume, solid particle volume, sample height, sample base area, porosity, and the incremental sample height per period, while the subscript 0 indicates the initial state of the sample. In engineering practice, the above average void ratio can also be calculated by Equation (9).
e ¯ = ρ ¯ s ( 1 + w ¯ ) ρ ¯ 1
where ρs is the specific density of the soil.
Equation (8) denotes that the settlement of the solid–liquid interface (Si) is inversely proportional to the average void ratio ( e ¯ ). This fact makes the average void ratio ( e ¯ ) more convenient in judging the stability of the batch sedimentation. Considering the physical and mechanical properties, e.g., the average pore ratio and clay (d < 0.005 mm) content, of dredged mud slurry can vary by different geographical locations and different compositions, a dimensionless index, the cumulative rate Re of the average void ratio as the main evaluation index, and the clay content as the auxiliary index have been introduced as the double control indexes for judging the stability of the batch sedimentation. The cumulative rate Re of the average void ratio can be conveyed by Equation (10).
R e = Δ e i e 0 = e 0 e ¯ stable e 0
where Δei is the void ratio increment per period, e0 is the void ratio before the batch sedimentation happens, and e ¯ stable is the average void ratio of the sediment when the batch sedimentation stabilized.
The curves of the cumulative change rate Re of the average pore ratio of samples from group I Nansha and group II Huizhou during the batch sedimentation are given in Figure 11, while the data of a study in Tianjin Binhai New Area [39] are also included.
As depicted in Figure 11, the cumulative change rates Re of samples from group I Nansha, Tianjin Binhai New Area, and group II Huizhou during the batch sedimentation process respectively stabilized at 73.7%, 72.4%, and 63.7%, and the samples’ corresponding clay contents are respectively 40.7%, 47%, and 60.9%. Among them, Huizhou samples belong to dredged mud slurry with very high clay content, which is relatively rare. In summary, for dredged mud slurry whose clay content is within 40% to 60%, this result suggested taking the cumulative change rate Re = 60% to 75% as the criteria for predicting the steady state of batch sedimentation. If the clay (d < 0.005 mm) content of one kind of dredged mud slurry is 40%, then the criteria value should be taken as 75%; if the clay (d < 0.005 mm) content is at 60%, then the criteria value should be taken as 60%. For other intermediate situations, the cumulative change rate should be obtained by linear interpolation according to the clay content. Soils whose Re is less than 40% or higher than 60% are seldom met in reclamation projects; this range of situations will be studied in the future whenever a suitable project is encountered.

4.2. Characteristics Analysis of the Low-Pressure Consolidation

As has been described above, the characteristics of dredged mud slurry during the low-pressure consolidation test are quite different from normal soft clayey soils. In particular, the prominent turning point appeared at around 30 kPa of the vertical loading pressure, as in Figure 7, which divides the rapidly changing phase and the relatively stable phase of the changing physical and mechanical parameters. The appearance of the turning point can be explained by the state change of the soil particles within the dredged mud slurry. As mentioned above, the batch sedimentation process is a process in which the suspended soil particles gradually settle down and make contact with each other so that the soil skeletons can be formed and effective stress can be borne within them, i.e., a process where non-Terzaghi soil transforms to Terzaghi soil [8]. During the low-pressure consolidation, inevitably, there is still some non-Terzaghi soil within the whole soil sample, which also means that some water can still move freely between the suspended soil particles. Therefore, when the external pressure was applied to the sample, this part of the water would be easily drained out of the sample. Since the first applied pressure is very small (0~30 kPa), the external pressure would not move the soil particles; instead, the applied force (0~30 kPa) would mainly provide a pressure gradient to force out the free water within the soil particles. This phase is very similar to the initial process of the staged vacuum preloading method [8]. When the free water is drained from the sample, the soil particles would touch each other and form many narrow channels. That is when the hydrophilicity of clay particles would start to play a major role. Its powerful potential field greatly diminished the flowing velocity of pore water, which also greatly increased the difficulty for the external load to induce the discharge of the pore water. Therefore, when the external load exceeds 30kPa, the progressive consolidation process would seem stabilized. This above analysis may explain the appearance of the prominent turning point during the low-pressure consolidation process. Moreover, as in Table 1, the clay contents of sample I-2 and sample II-2 were respectively 40.7% and 60.9%; according to the above analysis, it can also be understood that dredged mud slurry with higher clay content will have greater drainage resistance. Therefore, when the external load is at the same level, the slope of the pore ratio change curve of the II-2 sample (from Huizhou) will be less steep than that of the I-2 sample, as shown clearly in Figure 7b.
As for the changes in Figure 8, it should first be noticed that when the applied force was relatively low (0~30 kPa), the undrained shear strength Cu of samples I-2 and II-2 drastically grew from nearly 0 to around 25 kPa and 10 kPa, respectively. This further proved that the samples obtained from the short-term batch sedimentation experiment were initially mostly non-Terzaghi soil, in which no clear soil skeleton was formed; the loose state of the soil determined that it could not have much bearing capacity. Secondly, though the discrepancy in the undrained shear strength Cu of the two samples after the consolidation was great (56.6%), the discrepancies between them in water content w (31.1%) and density ρ (8.9%) changes were relatively smaller (as in Figure 8a,b). This seemingly abnormal phenomenon is rational, for the relationships between the mechanical index Cu and the physical indexes (w and ρ) are not based on one-to-one correspondence (tortuous variation trends shown in Figure 8d). However, the mechanism that lies within them is hard to explore. It at least meant that soils with similar physical parameters can have vastly different bearing capacities. According to Table 1, the most salient differences between the two samples were their plastic limit wP and clay content since higher clay contents usually pertain to higher plastic limits. Therefore, it can be deduced that the clay content is possibly a key factor affecting the consolidation characteristics of the dredged mud slurry and is not conducive to the consolidation effect of dredged-fill foundations.

4.3. Settlement Prediction Method on the Batch Sedimentation and the Low-Pressure Consolidation Processes

Based on the above analyses and the traditional one-dimensional compression theory [9], a settlement prediction method that considers both the batch sedimentation and the low-pressure consolidation processes was developed. The deduction of the formulas is given as follows:
According to the above long-term batch sedimentation characteristics of dredged mud slurry, it can be seen that the stable time of batch sedimentation is the best time to start discharging the water in the upper part of the site. Therefore, the total settlement during the batch sedimentation period of a large area dredged-fill site can be calculated by Equation (11).
S stable = e 0 e ¯ stable 1 + e 0 H 0
where Sstable is the total settlement of the batch sedimentation process, e0 is the initial void ratio of the dredged-fill soil, e ¯ stable is the average void ratio at the stable time of the batch sedimentation process, and H0 is the initial height of the dredged-fill ground.
Normally, the dredged mud slurry always maintains a water-saturated state, i.e., the saturation Sr = 100%, so once the initial water content of dredged mud slurry has been obtained through the laboratory test, then the initial void ratio of the sediment can also be obtained by Equation (12).
e 0 = w 0 G s S r = w 0 G s
Herein, w0 and Gs are, respectively, the initial water content and the specific gravity of the dredged mud slurry.
Combining Equations (10)–(12) will yield Equation (13).
S stable = R e w 0 G s 1 + w 0 G s H 0
This equation can serve as a supplement to the existing settlement calculation method of dredged mud slurry.
Based on the above analysis, it can be concluded that completion of the batch sedimentation process and the rapid water drainage in the upper layer of the site are the best starting times for vacuum preloading treatment. At that time, the additional load (less than 100 kPa) caused by the water discharge and the vacuum pressure can be equivalent to a large-area uniform load P. Therefore, the corresponding total settlement can also be calculated based on the one-dimensional compression theory [9]. The deduction of the low-pressure consolidation settlement calculation formula is given below.
S low = C C - low H 0 S stable 1 + e ¯ stable lg P 1 + P P 1
Where CC-low is the compression index under low additional load (0~100 kPa), which can be determined by the low-pressure consolidation test; P1 is the gravity stress of the whole stabilized sediment layer before the external load P was applied, which can be calculated by Equations (15) and (16).
P 1 = 1 2 γ sat ( H 0 S stable )
γ sat = G s + e ¯ stable 1 + e ¯ stable ρ w g
Herein, γsat is the saturated unit weight of the sediment, ρw is the density of water (adopted as 1 g/cm3 in this paper), and g is the gravitational acceleration (adopted as 10 N/kg in this paper).
Equations (11)–(13), (15), and (16) can be combined to give Equation (17).
P 1 = 1 2 ρ w g H 0 G s + ( 1 R e ) w 0 G s 1 + w 0 G s
Substituting Equations (11)–(13) into Equation (14) yields Equation (18).
S low = C C - low H 0 1 + w 0 G s lg P 1 + P P 1 = a low 1 + w 0 G s P H 0
Where alow is the compression coefficient of low-pressure consolidation (0~100 kPa).
Based on the above analysis, the total settlement calculation, shown by Equation (19), of the VPM-treated dredged-fill foundation can be carried out by combining the total settlement calculation during the batch sedimentation process and the total settlement calculation of low-pressure consolidation (0 to 100 kPa), i.e., Equations (13) and (18).
S total = S stable + S low = H 0 1 + w 0 G s R e w 0 G s + C C - low lg P 1 + P P 1
Equation (17) can be used to predict the total settlement of an actual land reclamation project that involves the batch sedimentation process and the vacuum preloading treatment. The settlement prediction can easily be realized by knowing the initial physical parameters of the dredged mud slurry along with the cumulative rate Re of the average void ratio and the compression index CC-low from the laboratory sedimentation and low-pressure consolidation experiments.
The correctness of Equation (19) is verified by using the experiment data in this paper. The total settlements predicted by Equation (19) upon the two soil samples are exhibited in Table 2. It can be seen that the use of Equation (19) is not complicated; only five parameters are needed for the prediction, i.e., the initial height H0 of the dredged mud surface, the initial water content w0 of the soil, the specific gravity of soil particles Gs, the cumulative rate Re of the average void ratio (proposed in this paper), and the compression index CC-low of the low-pressure consolidation experiments. Among them, H0 is a known value; w0 and Gs can be obtained via common soil tests; the Re can be determined according to the criterion introduced in Section 4.1; CC-low can be obtained as the slope of the initial point and the end point of the low-pressure consolidation e-logP curve (as in Figure 7b).
The comparison between the theory and the experiment in Table 2 shows that the prediction error for sample I was nigh 0, while the prediction error for sample II was 5.8%. A less than 6% error should be enough to validate the prediction. According to the equation derivation process, the higher error is suspected to come from the low-pressure consolidation experiment. For soil samples with water content higher than 500%, the initial external load that applies to the sample is extremely hard to control. It should be noted that this validation only indicates the correctness of the equation because all calculations used parameters from the same experiments used for the validation. As for the practicability of the proposed equation, it should be evaluated by an actual engineering project, which will be discussed in future studies.

5. Conclusions

In this paper, to study the characteristics of the batch sedimentation process and improve the settlement calculation method of vacuum preloading method (VPM)-treated dredged-fill foundation, soil samples from typical dredged-fill land reclamation projects were used to conduct batch sedimentation model experiments and low-pressure consolidation (consolidation load is less than 100 kPa) tests. The main conclusions obtained are as follows:
(1)
The clay (d < 0.005 mm) content is a main factor affecting the batch settlement and consolidation characteristics of dredged mud slurry; dredged mud slurry with higher clay content will have greater drainage resistance; thus, the consolidation effect will be worse.
(2)
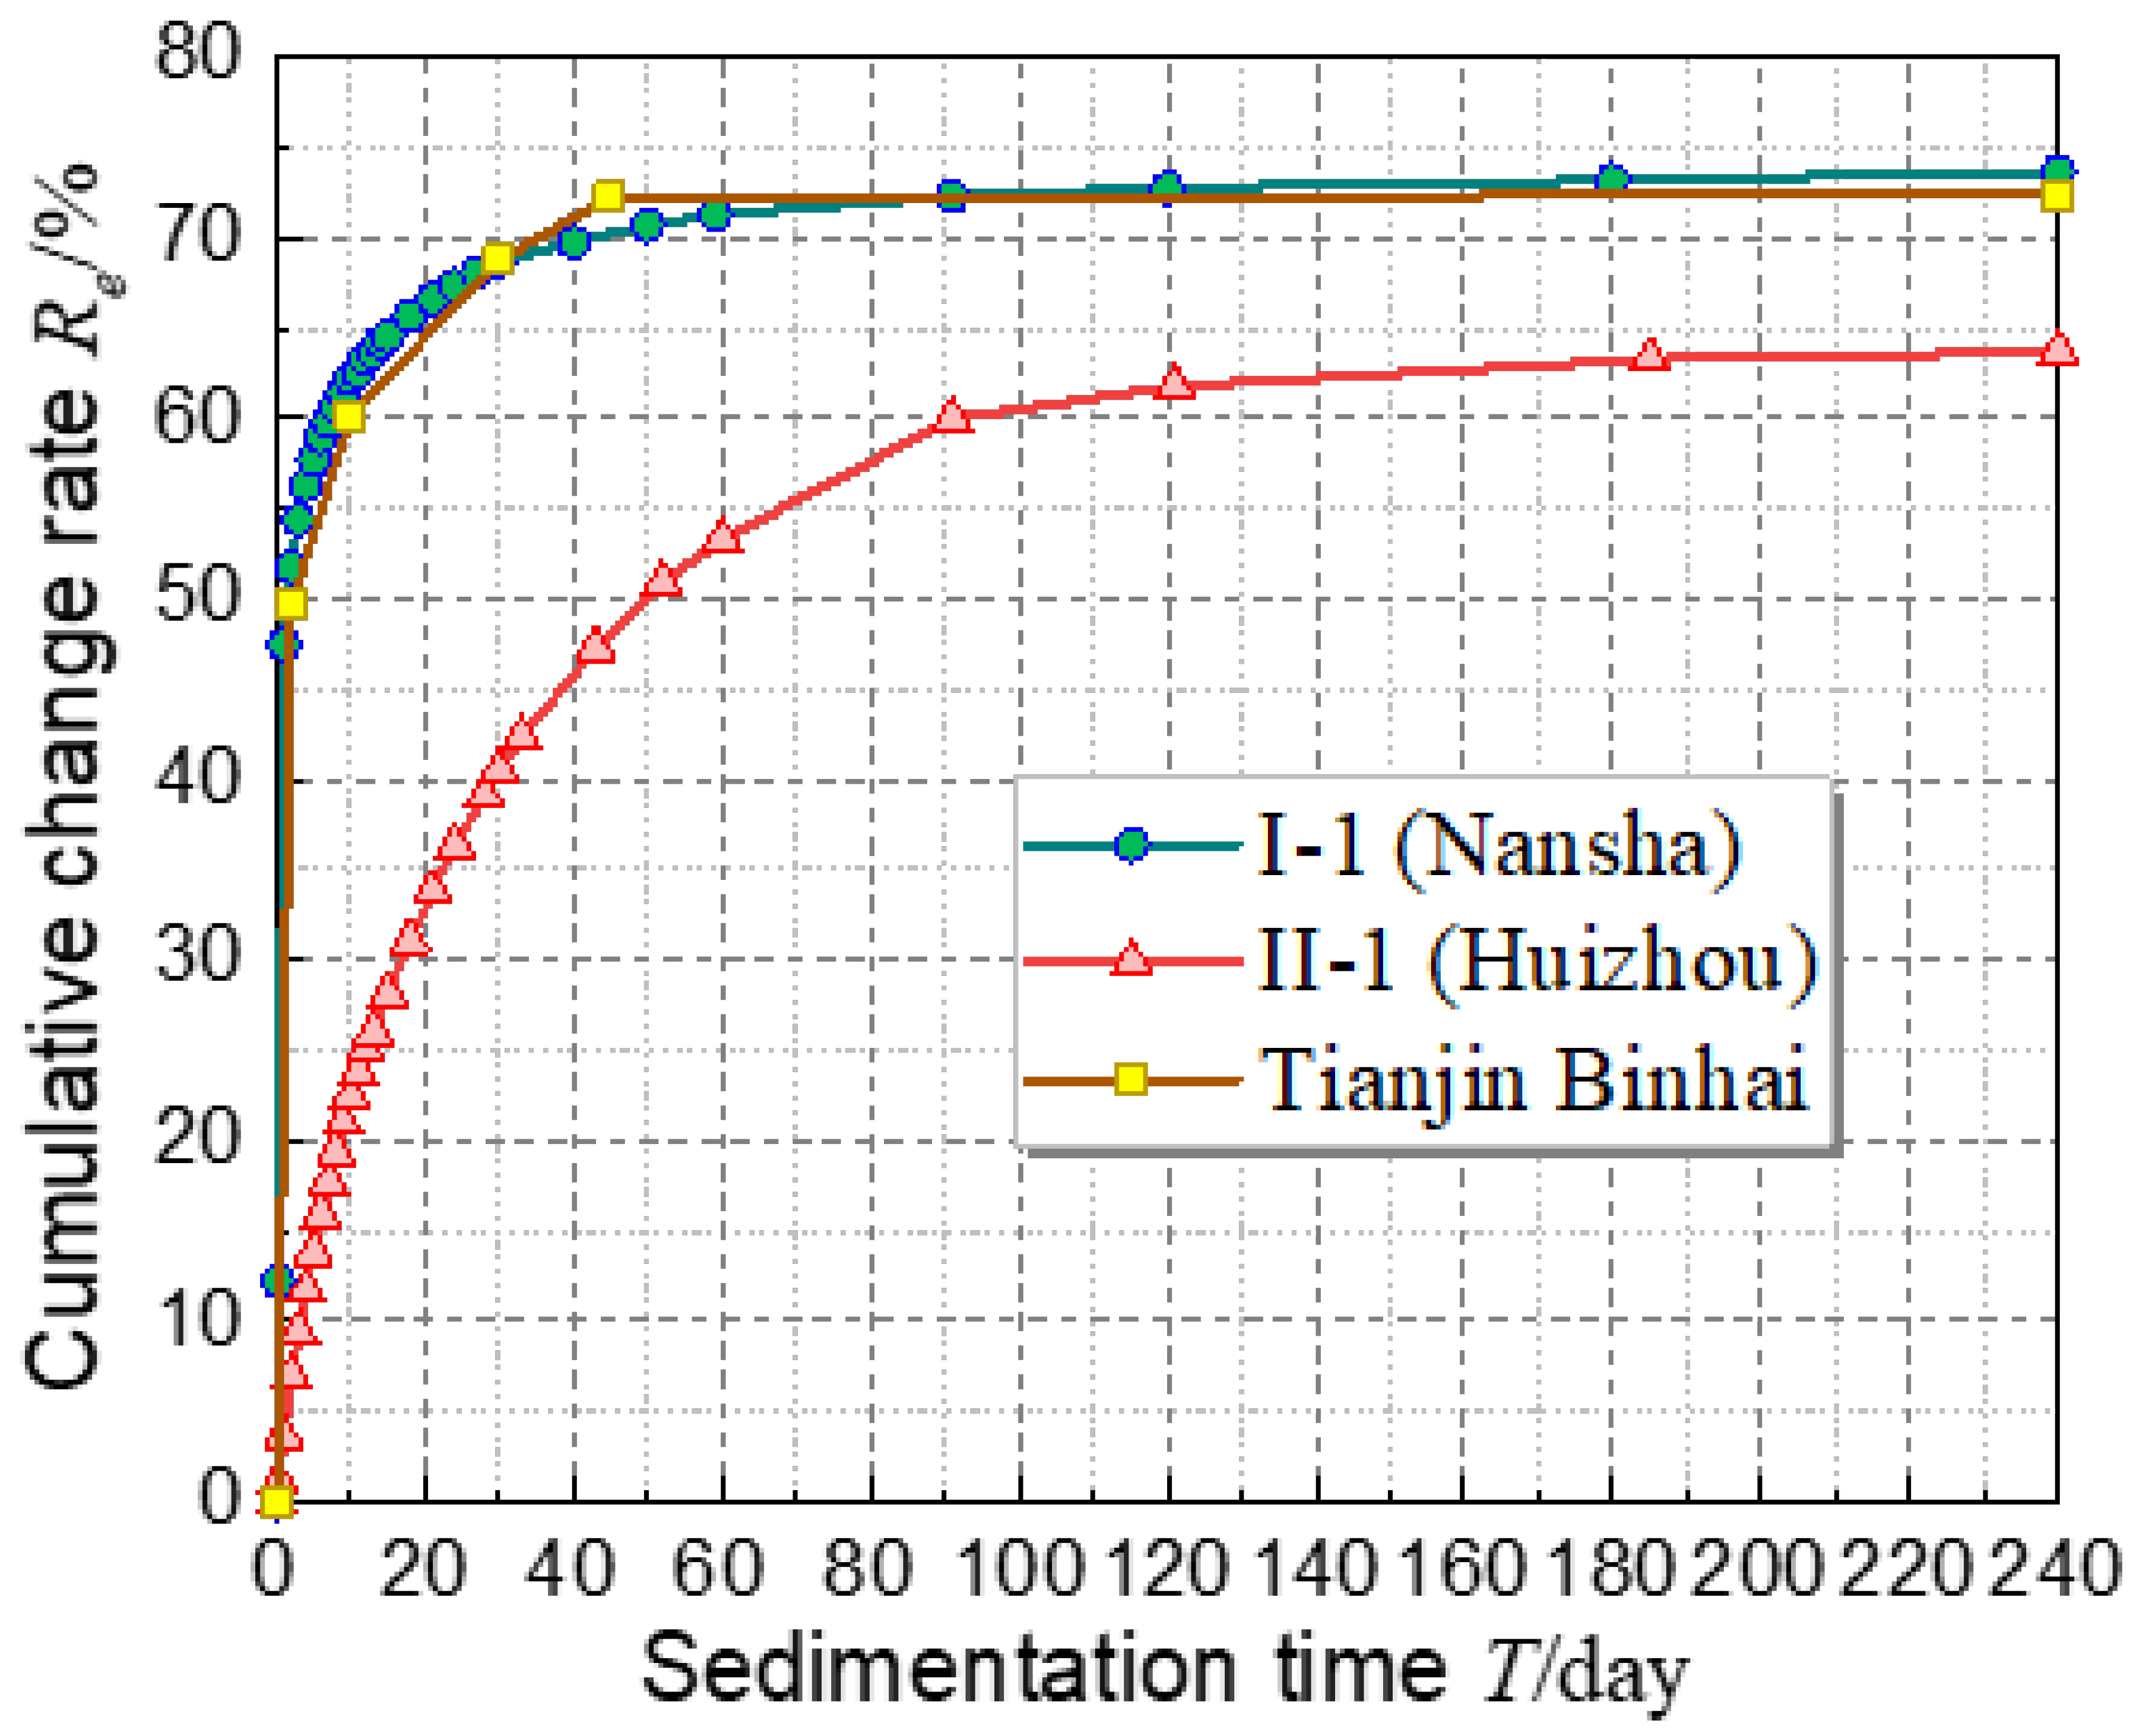
It was suggested that, for dredged fill whose clay content is within 40~60%, the cumulative change rate of average pore ratio of 60~75% could be used as the steady-state evaluation criteria for the batch sedimentation process, which can also be used to predict the best starting time for vacuum preloading treatment.
(3)
The compression curves e-P and e-lgP of the dredged mud slurry during the batch sedimentation have clear concave turning points, which are quite different from those of ordinary soft soil.
(4)
A settlement prediction method that considers both the batch sedimentation and the low-pressure consolidation processes was developed. The prediction can easily be realized by using the initial physical parameters of the dredged mud slurry along with the cumulative rate Re of the average void ratio of the laboratory sedimentation experiment and the compression index CC-low of the low-pressure consolidation experiment.
The study of this paper may enrich the understanding of mechanical characteristics of low-bearing-capacity soft soils and supplement deficiencies of current relevant codes in calculating the total settlement of VPM-treated dredged-fill foundations and can provide a reference for the design and construction of dredged-fill land reclamation projects.

Author Contributions

Conceptualization, S.B.; methodology, S.B. and L.G.; formal analysis, L.G. and S.Z.; investigation, S.B. and J.C.; resources, Z.D. and R.Z.; data curation, R.Z.; writing—original draft preparation, S.B. and L.G.; writing—review and editing, S.B. and L.G.; visualization, S.B. and L.G.; funding acquisition, S.B. and L.G. All authors have read and agreed to the published version of the manuscript.

Funding

This research was funded by the National Natural Science Foundation of China (Grant No. 12302502, No. 52109125, and No. 52308354), Guangdong University Innovation Team Project (Grant No. 2022KCXTD024), Guangdong Province key construction discipline research ability enhancement project (Grant No. 2022ZDJS091), Guangdong Basic and Applied Basic Research Foundation (Grant No. 2022A1515110804, No. 2023A1515012630, and No. 2021A1515011691), the Fundamental Research Funds for the Central Universities (Grant No. 2023ZYGXZRx2tjD2231010), and the Natural Science Foundation of Jiangsu Province (Grant No. BK20231217).

Data Availability Statement

Data are contained within the article.

Conflicts of Interest

Author Zhiliang Dong was employed by the CCCC Fourth Harbor Engineering Institute Co., Ltd. and Ruibo Zhou was employed by the CCCC FHEC Harbor Engineering Design Co., Ltd.. All authors declare that the research was conducted without any commercial or financial relationships that could be construed as a potential conflict of interest.

References

  1. Imai, G. Experimental studies on sedimentation mechanism and sediment formation of clay materials. Soils Found. 1981, 21, 7–20. [Google Scholar] [CrossRef]
  2. Zhu, W.; Min, F.L.; Lü, Y.Y.; Wang, S.; Sun, Z.; Zhang, C.; Li, L. Subject of “mud science and application technology” and its research progress. Rock Soil Mech. 2013, 34, 3041–3054. (In Chinese) [Google Scholar]
  3. Bao, S.-F.; Lou, Y.; Dong, Z.-L.; Mo, H.-H.; Chen, P.-S.; Zhou, R.-B. Causes and countermeasures for vacuum consolidation failure of newly-dredged mud foundation. Chin. J. Geotech. Eng. 2014, 36, 1350–1359. (In Chinese) [Google Scholar]
  4. Shi, L.; Wang, J.; Wang, X.; Sun, H.; Yu, Y.; Cai, Y. How energy is consumed in vacuum preloading treatment of soft ground. Géotechnique 2023, 1–13. [Google Scholar] [CrossRef]
  5. Balmforth, N.J.; Frigaard, I.A.; Ovarlez, G. Yielding to stress: Recent developments in viscoplastic fluid mechanics. Annu. Rev. Fluid Mech. 2014, 46, 121–146. [Google Scholar] [CrossRef]
  6. Indraratna, B.; Sathananthan, I.; Rujikiatkamjorn, C.; Balasubramaniam, A.S. Analytical and numerical modeling of soft soil stabilized by prefabricated vertical drains incorporating vacuum preloading. Int. J. Geomech. 2005, 5, 114–124. [Google Scholar] [CrossRef]
  7. Homede, E.; Zigelman, A.; Abezgauz, L.; Manor, O. Signatures of van der Waals and Electrostatic Forces in the Deposition of Nanoparticle Assemblies. J. Phys. Chem. Lett. 2018, 9, 5226–5232. [Google Scholar] [CrossRef]
  8. Fang, Y.; Guo, L.; Huang, J. Mechanism test on inhomogeneity of dredged fill during vacuum preloading consolidation. Mar. Georesources Geotechnol. 2019, 37, 1007–1017. [Google Scholar] [CrossRef]
  9. Terzaghi, K.; Peck, R.B.; Mesri, G. Soil Mechanics in Engineering Practice; John Wiley & Sons: Hoboken, NJ, USA, 1996. [Google Scholar]
  10. Shan, W.; Chen, H.-E.; Yuan, X.; Ma, W.; Li, H. Mechanism of pore water seepage in soil reinforced by step vacuum preloading. Bull. Eng. Geol. Environ. 2021, 80, 2777–2787. [Google Scholar] [CrossRef]
  11. Wang, J.; Ni, J.; Cai, Y.; Fu, H.; Wang, P. Combination of vacuum preloading and lime treatment for improvement of dredged fill. Eng. Geol. 2017, 227, 149–158. [Google Scholar] [CrossRef]
  12. Wang, P.; Han, Y.; Zhou, Y.; Wang, J.; Cai, Y.; Xu, F.; Pu, H. Apparent clogging effect in vacuum-induced consolidation of dredged soil with prefabricated vertical drains. Geotext. Geomembr. 2020, 48, 524–531. [Google Scholar] [CrossRef]
  13. Xu, B.H.; He, N.; Jiang, Y.B.; Zhou, Y.Z.; Zhan, X.J. Experimental study on the clogging effect of dredged fill surrounding the PVD under vacuum preloading. Geotext. Geomembr. 2020, 48, 614–624. [Google Scholar] [CrossRef]
  14. Cai, Y.-Q. Consolidation mechanism of vacuum preloading for dredged slurry and anti-clogging method for drains. Yantu Gongcheng Xuebao/Chin. J. Geotech. Eng. 2021, 43, 201–225. (In Chinese) [Google Scholar]
  15. Nguyen, V.-T.; Le, V.-A. Fluid mud properties and nautical depth estimation: A case study in navigation channel of Duyen Hai Port, Vietnam. Ocean Eng. 2023, 284, 115163. [Google Scholar] [CrossRef]
  16. Kirsch, K.; Bell, A. Ground Improvement; CRC Press: Boca Raton, FL, USA, 2013. [Google Scholar]
  17. Liu, H.L.; Peng, J.; Chen, Y.H. Simplified method of ground settlement under vacuum combined surcharge preloading. Yantu Lixue (Rock Soil Mech.) 2006, 27, 745–748. (In Chinese) [Google Scholar]
  18. Zhang, X.-W.; Yang, A.-W.; Kong, L.-W.; Zhou, Q.; Wang, T. Self-weight sedimentation and consolidation characteristics of hydraulic-dredged slurry in Tianjin Binhai District. Chin. J. Geotech. Eng. 2016, 38, 769–776. (In Chinese) [Google Scholar]
  19. Guo, W.; Chu, J. New observational method for prediction of one-dimensional consolidation settlement. Géotechnique 2017, 67, 516–522. [Google Scholar] [CrossRef]
  20. François, B.; Corda, G. Experimental characterization and numerical modeling of the self-weight consolidation of a dredged mud. Geomech. Energy Environ. 2022, 29, 100274. [Google Scholar] [CrossRef]
  21. Ngo, D.H.; Horpibulsuk, S.; Suddeepong, A.; Hoy, M.; Udomchai, A.; Doncommul, P.; Rachan, R.; Arulrajah, A. Consolidation behavior of dredged ultra-soft soil improved with prefabricated vertical drain at the Mae Moh mine, Thailand. Geotext. Geomembr. 2020, 48, 561–571. [Google Scholar] [CrossRef]
  22. Loginov, M.; Citeau, M.; Lebovka, N.; Vorobiev, E. Evaluation of low-pressure compressibility and permeability of bentonite sediment from centrifugal consolidation data. Sep. Purif. Technol. 2012, 92, 168–173. [Google Scholar] [CrossRef]
  23. He, B.; Qin, X.; Zhou, Z.; Xu, B.; Yu, S.; Qin, G.; Liu, K.; Peng, X.; Nie, X.; Ma, F.; et al. Experimental study on composite flocculant-electroosmosis combined with seg-mented solidification treatment of high-water-content slurry. Constr. Build. Mater. 2023, 400, 132729. [Google Scholar] [CrossRef]
  24. Chen, X.; Qi, S.; Simms, P.; Zhou, J.-W.; Yang, X.-G. Characterization of large strain consolidation parameters of soft materials with time-variant compressibility at low effective stress. Soils Found. 2022, 62, 101240. [Google Scholar] [CrossRef]
  25. Qin, J.; Zheng, J.; Li, L. An analytical solution to estimate the settlement of tailings or backfill slurry by considering the sedimentation and consolidation. Int. J. Min. Sci. Technol. 2021, 31, 463–471. [Google Scholar] [CrossRef]
  26. Das, B.M. Soil Mechanics Laboratory Manual, 6th ed.; Oxford University Press: New York, NY, USA, 2002. [Google Scholar]
  27. ASTM D2487-17; Standard Practice for Classification of Soils for Engineering Purposes (Unified Soil Classification System). ASTM International: West Conshohocken, PA, USA, 2017.
  28. Islam, S.; Williams, D.J.; Bhuyan, M.H. Consolidation testing of tailings in a slurry consolidometer using constant rate and accelerated loading. Proc. Inst. Civ. Eng.-Geotech. Eng. 2021, 176, 295–305. [Google Scholar] [CrossRef]
  29. ASTM D7181-20; Standard Test Method for Consolidated Drained Triaxial Compression Test for Soils. ASTM International: West Conshohocken, PA, USA, 2020.
  30. GB/T 50123–2019; Standard for Geotechnical Testing Method. National Standards of People’s Republic of China, China Planning Press: Beijing, China, 2019.
  31. Raheena, M.; Robinson, R.G. End-of-primary consolidation parameters using inflection point method. Géotechnique 2021, 71, 645–654. [Google Scholar] [CrossRef]
  32. Oliveira, F.S.; Martins, I.S.M.; Guimarães, L.J.N. A model for one-dimensional consolidation of clayey soils with non-linear viscosity. Comput. Geotech. 2023, 159, 105426. [Google Scholar] [CrossRef]
  33. Le, T.; Airey, D. Mechanical behaviour of a weakly structured soil at low confining stress. Géotechnique 2023, 73, 128–142. [Google Scholar] [CrossRef]
  34. Tan, T.S.; Yong, K.Y.; Leong, E.C.; Lee, S.L. Sedimentation of clayey slurry. J. Geotech. Eng. 1990, 116, 885–898. [Google Scholar] [CrossRef]
  35. Holdich, R.G.; Rushton, A.; Ward, A.S. Solid-Liquid Filtration and Separation Technology; John Wiley & Sons: Hoboken, NJ, USA, 2008. [Google Scholar]
  36. Wills, B.A.; Finch, J. Wills’ Mineral Processing Technology: An Introduction to the Practical Aspects of Ore Treatment and Mineral Recovery; Butterworth-Heinemann: Oxford, UK, 2015. [Google Scholar]
  37. Kynch, G.J. A theory of sedimentation. Trans. Faraday Soc. 1952, 48, 166–176. [Google Scholar] [CrossRef]
  38. Richardson, J.F.; Zaki, W.N. Sedimentation and fluidization: Part I. Chem. Eng. Res. Des. 1997, 75, S82–S100. [Google Scholar] [CrossRef]
  39. Yang, A.W.; Du, D.J.; Lu, L.Q. Study on sediment characteristics and micro-structure of soft dredger soil of Tianjin. Hydrogeol. Eng. Geol. 2010, 37, 83–87. (In Chinese) [Google Scholar]
Figure 1. A photo showing the filling process of dredged soil during a land reclamation project.
Water 16 00007 g001
Figure 2. A map showing the sample sources for the experiments. The map is originally from https://www.amap.com/, accessed on 10 December 2023.
Water 16 00007 g002
Figure 3. Schematic diagram of the experiment apparatus.
Water 16 00007 g003
Figure 4. Schematic diagram of the static batch settling process.
Water 16 00007 g004
Figure 5. Loading schedule of the low-pressure consolidation test. The loading time at all levels also refers to the time required for the sample with a height of 2 cm in Standard for Geotechnical Testing Method GB/T 50123-2019 [30]. Among them, the loading stage of 1 to 11 kPa was set to prevent the soil sample from being crushed.
Water 16 00007 g005
Figure 6. The settlement curve of the solid–liquid interface Si over time.
Water 16 00007 g006
Figure 7. The void ratio variation curves of the low-pressure consolidation tests. (a) e-P curves; (b) e-logP curves.
Water 16 00007 g007
Figure 8. The physical and mechanical test results of the low-pressure consolidation tests. (a) Water content; (b) Density; (c) Undrained shear strength; (d) 3D display.
Water 16 00007 g008
Figure 9. The schematic graphs of the entire batch sedimentation process. (a) Settling process of mixed particle groups with different particle sizes and density; (b) The flow field between two soil particles during the hindered settling.
Water 16 00007 g009
Figure 10. Changes in particle flux during intermittent settling.
Water 16 00007 g010
Figure 11. The curves of the cumulative change rate Re of the average pore ratio of samples from different regions. The water content and clay content of the referenced dredged soil from Binhai, Tianjin [39] are respectively 400% and 47%.
Water 16 00007 g011
Table 1. Physical properties and mineral compositions of the soil samples.
Property or CompositionUnitSample I (Nansha)Sample II (Huizhou)
Specific gravity Gs-2.7122.703
Water content w%380.0548.0
Density ρg/cm31.151.12
Liquid limit wL%50.856.9
Plastic limit wP%24.440.6
Medium sand
(d = 0.50~0.25 mm)
%1.451.25
Fine sand
(d = 0.25~0.075 mm)
%20.750.90
Silt
(d = 0.075~0.005 mm)
%37.1036.95
Clayey particles
(d < 0.005 mm)
%40.7060.90
Note: herein, the particle partitioning refers to the ASTM standard [27].
Table 2. The comparison of the theory prediction and the experiment results.
SamplesParameters for Calculations S total Pre S total Exp Error
H0/mw0/%GsReCc-low
Sample I1.23802.71273.71.3261.0231.0220.1%
Sample II1.25482.70363.72.1800.9671.0275.8%
Disclaimer/Publisher’s Note: The statements, opinions and data contained in all publications are solely those of the individual author(s) and contributor(s) and not of MDPI and/or the editor(s). MDPI and/or the editor(s) disclaim responsibility for any injury to people or property resulting from any ideas, methods, instructions or products referred to in the content.

