Article

Time-Lagged Response of Streamflow in the Lower Yellow River to the Water Regulation by Xiaolangdi Reservoir: Implication for Efficient Water Supply

1
College of Geodesy and Geomatics, Shandong University of Science and Technology, Qingdao 266590, China
2
Key Laboratory of Hydrometeorological Disaster Mechanism and Warning of Ministry of Water Resources, Nanjing University of Information Science and Technology, Nanjing 210044, China
*
Author to whom correspondence should be addressed.
Water 2024, 16(1), 78; https://doi.org/10.3390/w16010078
Submission received: 21 November 2023 / Revised: 15 December 2023 / Accepted: 20 December 2023 / Published: 24 December 2023
(This article belongs to the Special Issue Advances in Hydrology: Flow and Velocity Analysis in Rivers)

Abstract

:
The Lower Yellow River (LYR) is a vital water resource for agriculture, industry, and domestic use in the surrounding areas. Understanding the delayed response of local streamflow response to remote reservoir operations is crucial for effective water management and flood control. In this work, we utilize historical hydrological data and statistical analysis techniques to investigate the time-lagged response of streamflow in the LYR to water regulation by the Xiaolangdi Reservoir. The results demonstrate that there is a time lag of 1.98 days, 2.86 days, and 3.93 days between the record of water regulation at Xiaolangdi Reservoir and the arrival time at Gaocun, Aishan, and Lijin stations, respectively. Time lag correction is proven to be crucial when establishing the relationship between the daily streamflows in the LYR and those at Xiaolangdi station. Further analysis reveals that the travel distance of streamflow is the dominant factor determining the lag time, with a time lag coefficient of 0.57 days per hundred kilometers. It is expected that the findings in this study could offer a fundamental basis for decision-makers in water resource management.

1. Introduction

As an important part of the Earth’s circulation process, the river system has delivered on average 40% of the world’s land precipitation to oceans or inland sinks [1]. Meanwhile, it provides water supply for domestic and agricultural purposes as well as convenient navigation. Therefore, human societies evolved alongside rivers from ancient times [2]. Take the Ganges River Basin for instance, it nurses roughly 40% of India’s total population [3]. However, urbanization and climate change have together remarkably altered the river streamflow in recent decades, exacerbating water scarcity and security [4,5,6]. Many rivers are facing the risk of drying up or disappearing [7,8]. At the beginning of this century, about 2.3 billion people have been estimated to live in river basins under water stress [9], and this value exploded to 4.0 billion in 2016 [10]. To alleviate the water crisis, it is urgent to increase water use efficiencies and promote better sharing of the limited freshwater resources.
The Yellow River is the second-largest river in China and the most important source of water for Northwest China and North China [11]. In China, 12% of the population and 15% of the irrigated agricultural land rely on the Yellow River for their water supply [12]. With the increase in population and development of the social economy, the Yellow River faces an enormous challenge of water supply pressure during the last seven decades, especially for the region with high population density alongside the lower Yellow River (LYR) [13]. Since the 1950s, the streamflow of the Yellow River gradually dwindled away and even dried up severely in the late 20th century [14]. Especially in 1997, the observed no-flow days at Lijin station in the lower Yellow River is as high as 226 days with a dried-up length exceeding 700 km [14,15]. Benefiting from the regulation of Xiaolangdi Reservoir, the annual runoff in the LYR has slightly recovered and remained stable in recent years [16]. Moreover, the distribution of discharge within a year has also been frequently modulated for the combined purposes of water supply, power generation, and downstream channel dredging [17,18,19].
Currently, most previous studies have mainly focused on the qualitative response of runoff to the operation of Xiaolangdi Reservoir on an annual or daily scale [18,20,21,22,23]. It has been widely recognized that Xiaolangdi Reservoir exhibits little impact on the total streamflow in the long run while it dramatically changes the seasonal distribution [24]. However, in our life and practical produce, even one day delay in water supply can cause huge losses, especially in agricultural or fishery production. In order to achieve efficient and effective water regulation, it is necessary to establish a quantitative relationship between runoff changes in the lower Yellow River and the water regulation by Xiaolangdi Reservoir on a smaller time scale. Fortunately, the establishment of daily scale relationships can be achieved based on available daily hydrological data [24]. However, the water demand area in the lower Yellow River is usually several hundred kilometers away from the Xiaolangdi Reservoir, and runoff takes some time to reach the target area, consequently leading to a delayed response [16,25,26,27]. To the best of our knowledge, no one has been concerned about the time lag phenomenon when evaluating the hydrological response, which may cause significant errors. In this study, we systematically determined the time-lagged characteristics of the streamflow in the LRY in response to the water regulation by Xiaolangdi Reservoir and reconstructed the corresponding relationships based on time lag correction for the first time. It is expected that the findings in this study can provide valuable guidelines for efficient water resources management and regulation in the LYR.

2. Data and Methods

2.1. Study Area

In this study, the LYR is defined as the reach beginning from Xiaolangdi station and flowing for approximately 880 km across the North China plain, as depicted in Figure 1. This region holds significant importance as one of the major agricultural development areas in China, and the local agricultural practices are strongly influenced by the water resource conditions. To meet the water supply demands in the LYR, numerous reservoirs have been constructed along the main course and tributaries of the Yellow River, among which the Xiaolangdi Reservoir plays a major role. The Xiaolangdi Reservoir is situated at the outlet of the last gorge in the Yellow River Basin and is considered the final large-scale water conservancy project with water control capabilities. It officially intercepted the Yellow River in October 1997, began to store water in October 1999, and was officially put into use in May 2000. The reservoir has a total storage capacity of 12.65 × 10⁹ m3, a long-term effective storage capacity for water regulation of 5.1 × 10⁹ m3, a sediment storage capacity of 7.55 × 10⁹ m3, and a 225 m flood limit water level. In fact, there exists a reservoir known as Xixiayuan Reservoir situated 16 kilometers downstream of the Xiaolangdi Dam. The primary function of the Xixiayuan Reservoir is to manage the irregular outflow from the Xiaolangdi Reservoir during its hydropower generation operations, thereby ensuring a consistent and steady flow of discharged water. It is commonly held that the Xixiayuan Reservoir has no impact on the downstream water level of the Xiaolangdi Reservoir. The key hydrological stations along the LYR are Xiaolangdi (XLD), Huayuankou (HYK), Jiahetan (JHT), Gaocun (GC), Sunkou (SK), Aishan (AS), Luokou (LK) and Lijin (LJ) stations.

2.2. Data Sources

Daily hydrological data of Xiaolangdi, Huayuankou, Jiahetan, Gaocun, Sunkou, Aishan, Luokou, and Lijin stations in the mainstream were obtained from the Yellow River Conservancy Commission (YRCC) for the periods 1997 to 2020. The distance between various stations in the LRY and Xiaolangdi station was determined by extracting the channel centerline and calculating the corresponding length.

2.3. Methods

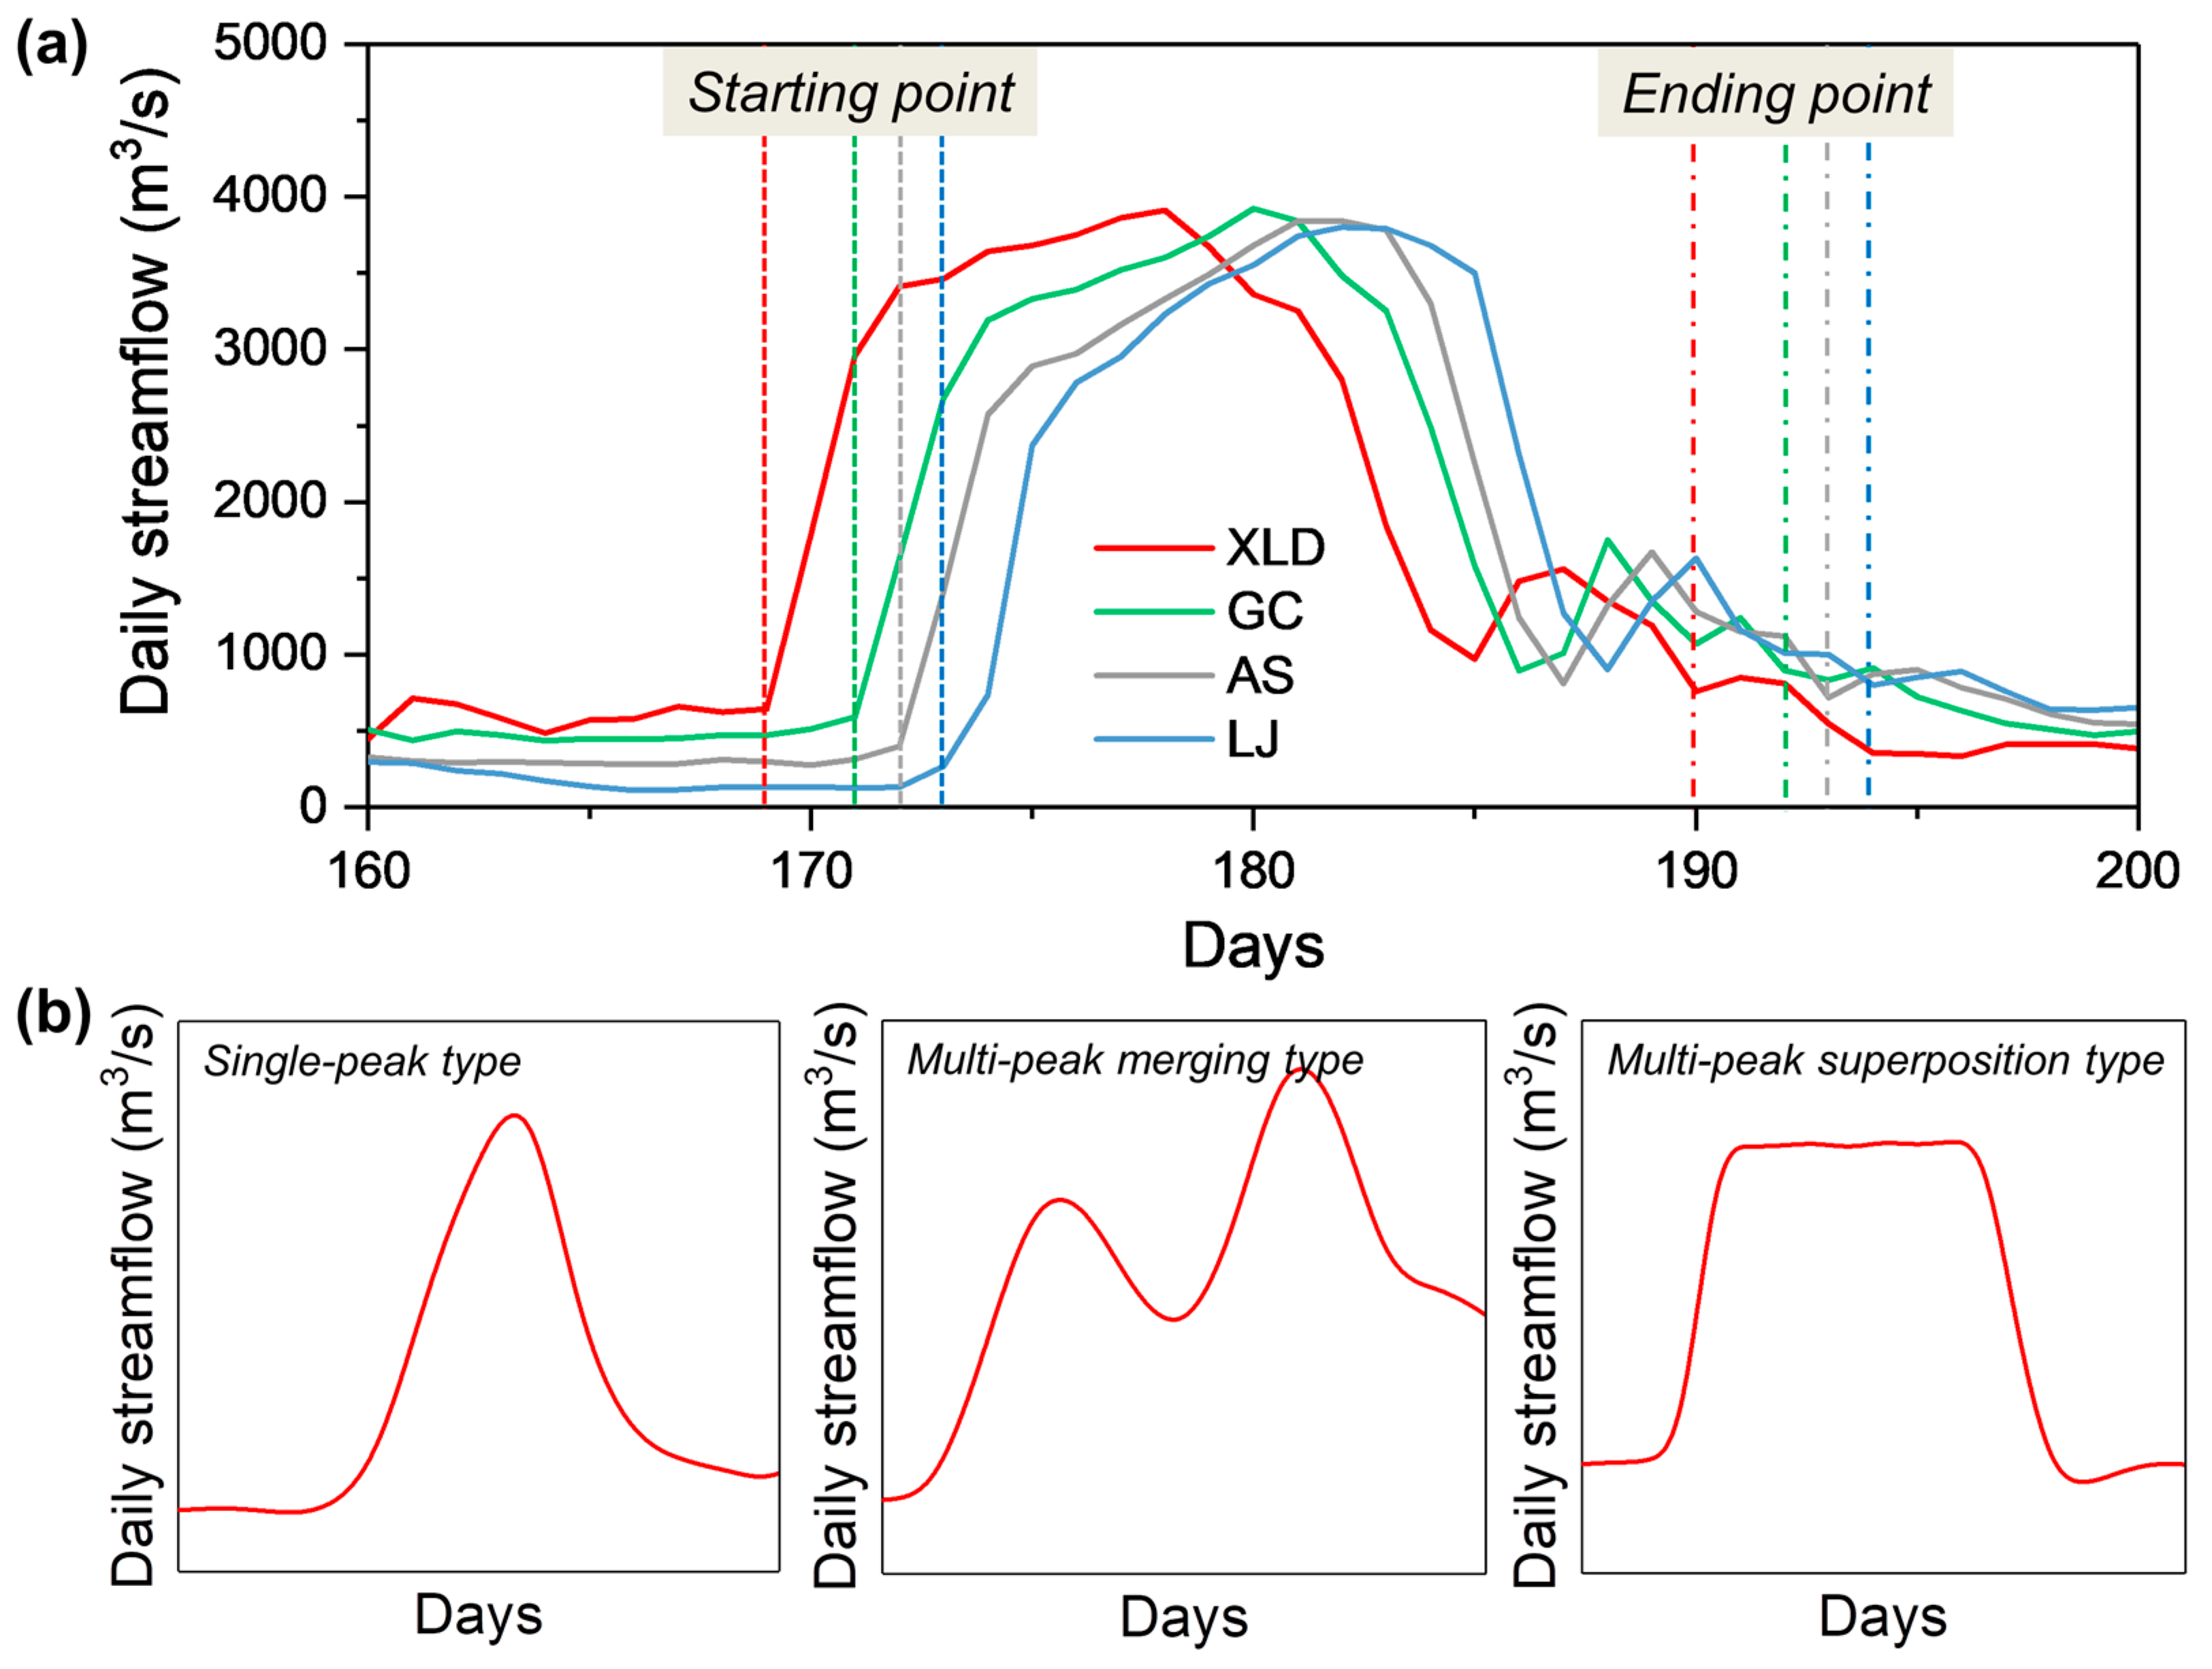
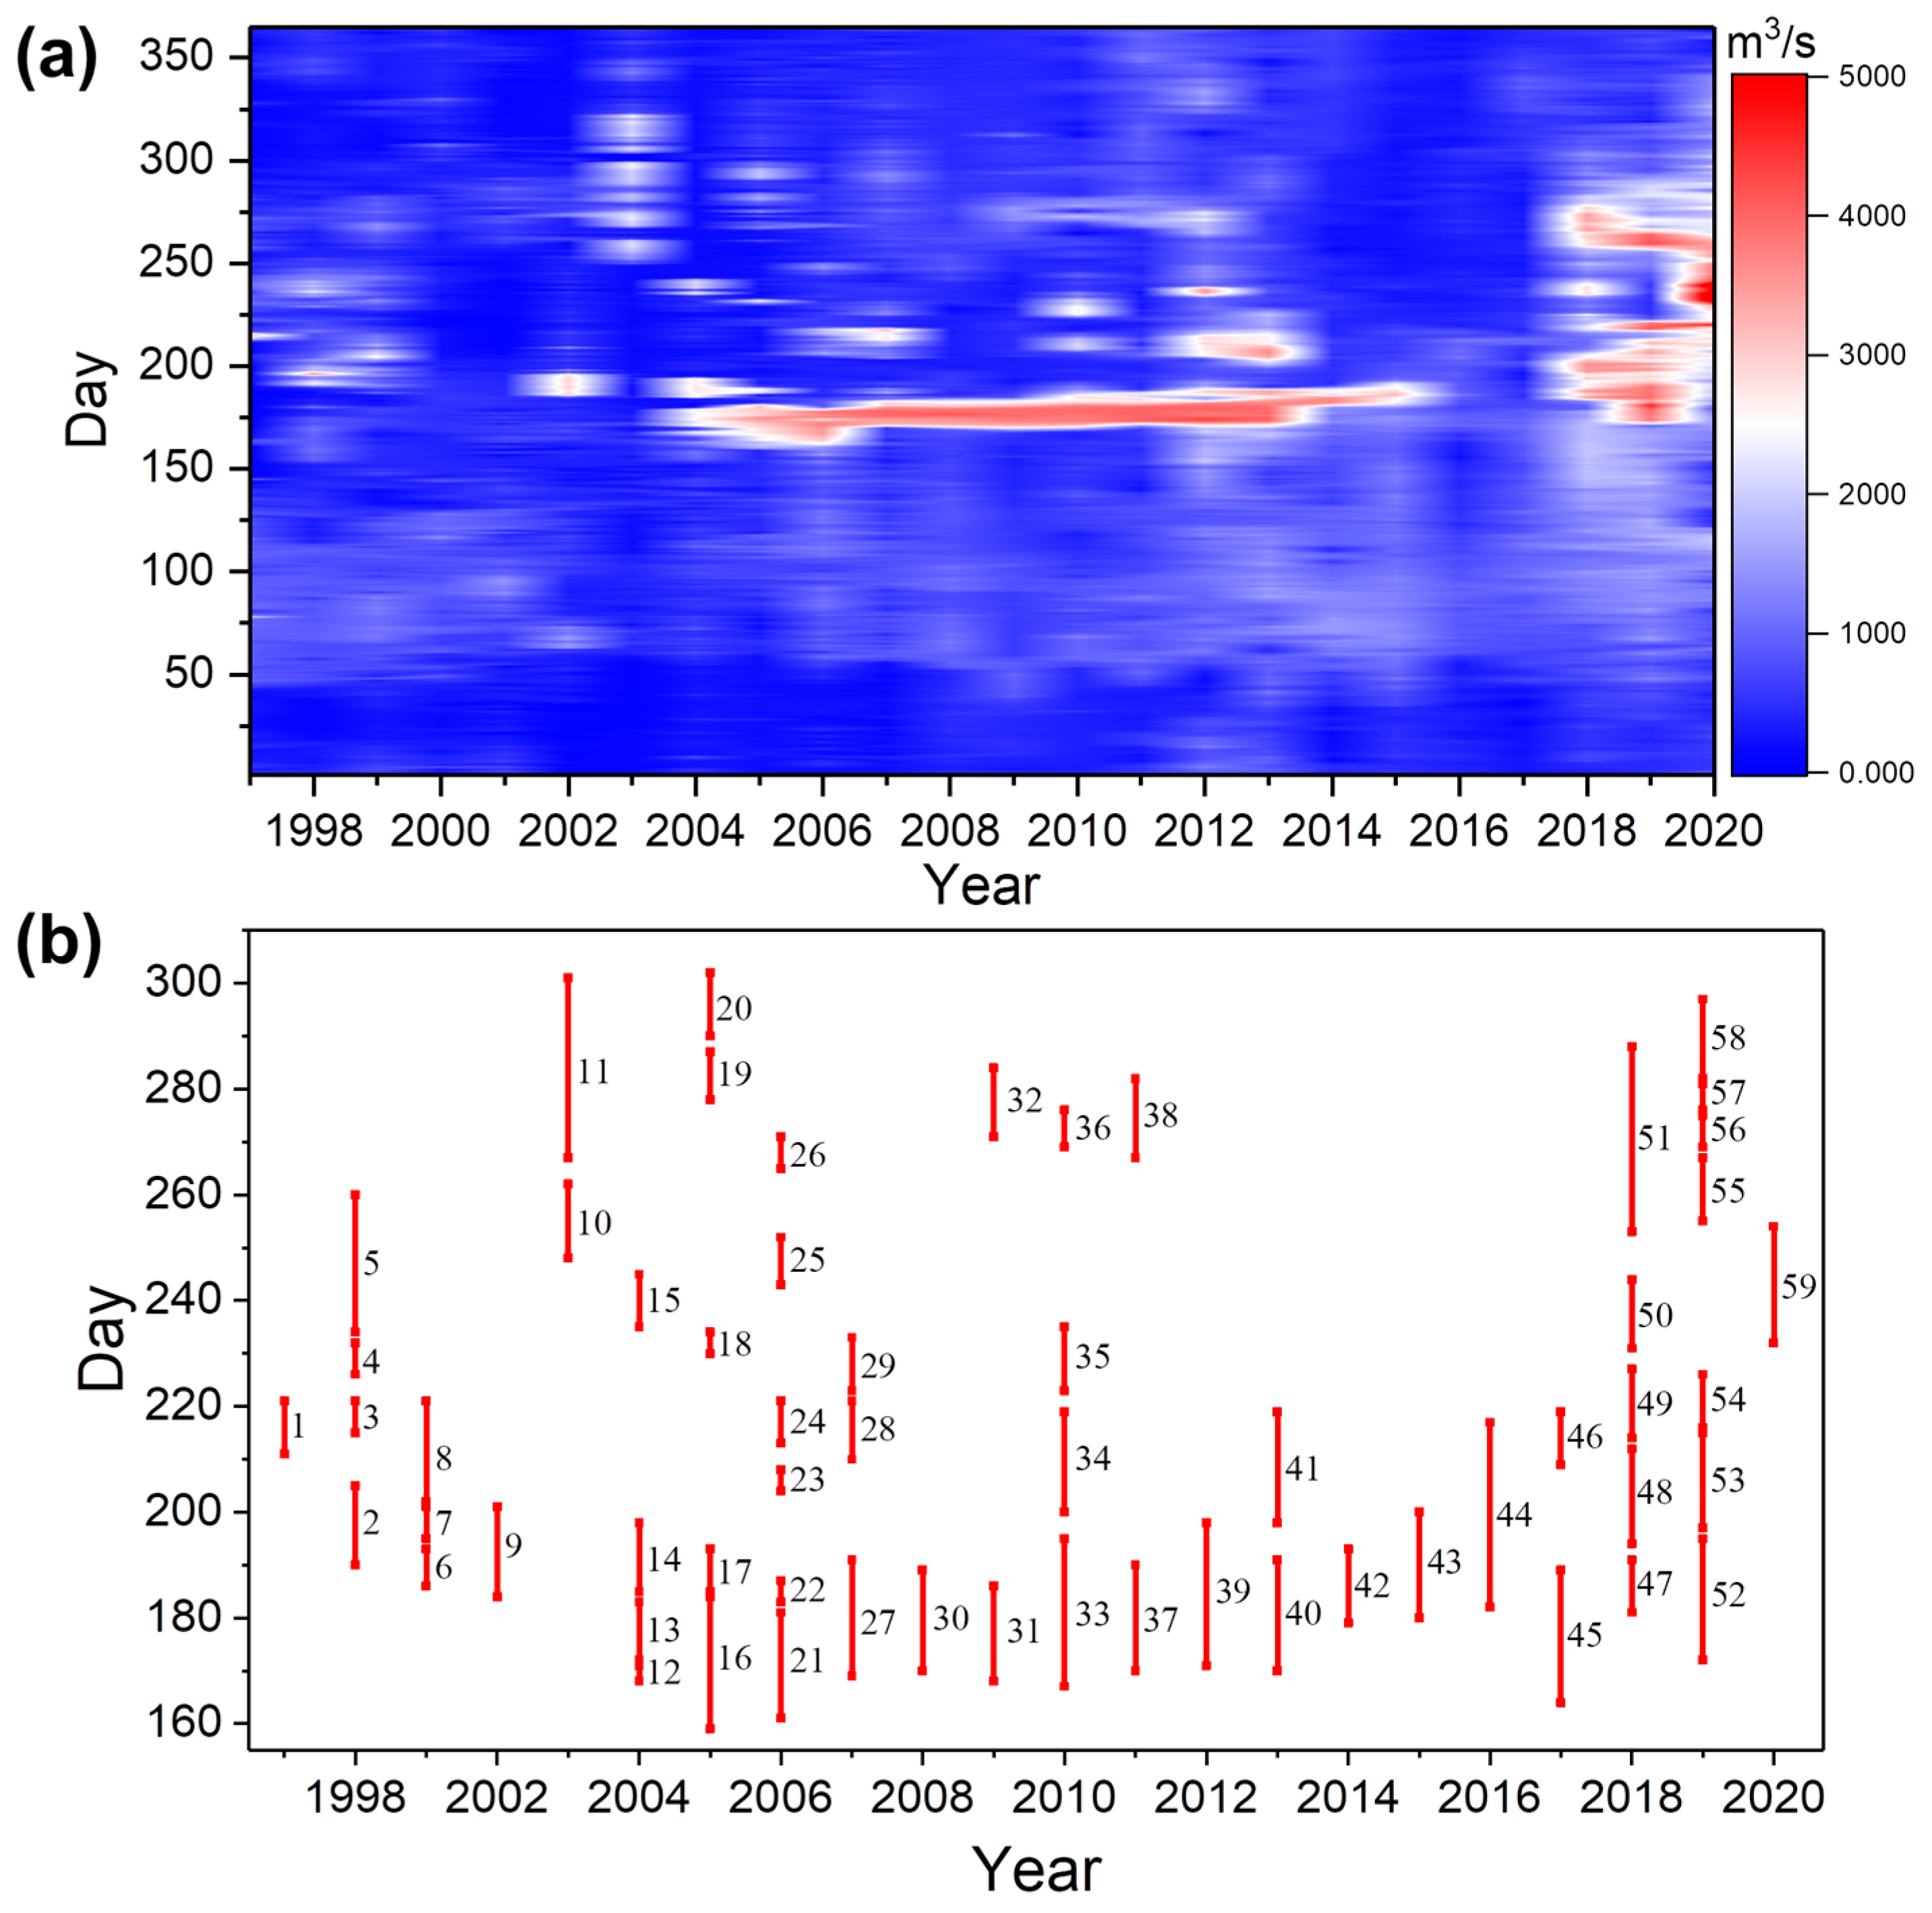
2.3.1. Identification and Classification of High Streamflow Event in the LYR

In order to determine the time lag using the method proposed in the following text, a streamflow fluctuation with peak discharge >1000 m3/s at Xiaolangdi station is identified as a high streamflow event. This is attributed so that the streamflow of less than 1000 m3/s at Xiaolangdi station cannot evolve to Lijin station based on comprehensive assessment. Therefore, for the subsequent determination of time lag, only these high streamflow events that can evolve to Lijin station are counted in this study. The typical process of a high streamflow event is illustrated in Figure 2a. The high streamflow event started on 18 June and finished on 9 July at Xiaolangdi station, while at Lijin station there is a 4-day time lag because the discharge released from Xiaolangdi Reservoir took almost 4 days to arrive at Lijin station. Therefore, influenced period of the high streamflow event regulated by Xiaolangdi Reservoir at Lijin station was between 22 June and 13 July. Generally, the streamflow in the LYR gradually decreases as it travels downstream, which is mainly attributed to the huge water extraction in the surrounding area and less streamflow replenishment from tributaries. Based on observed daily discharge data at stations alongside the LYR, a total of 59 high streamflow events are adapted during 1997–2020 in this study. According to the different peak patterns shown in Figure 2b, a high streamflow event can be classified into three types: single-peak type, double-peak superposition type, and multi-peak merging type.

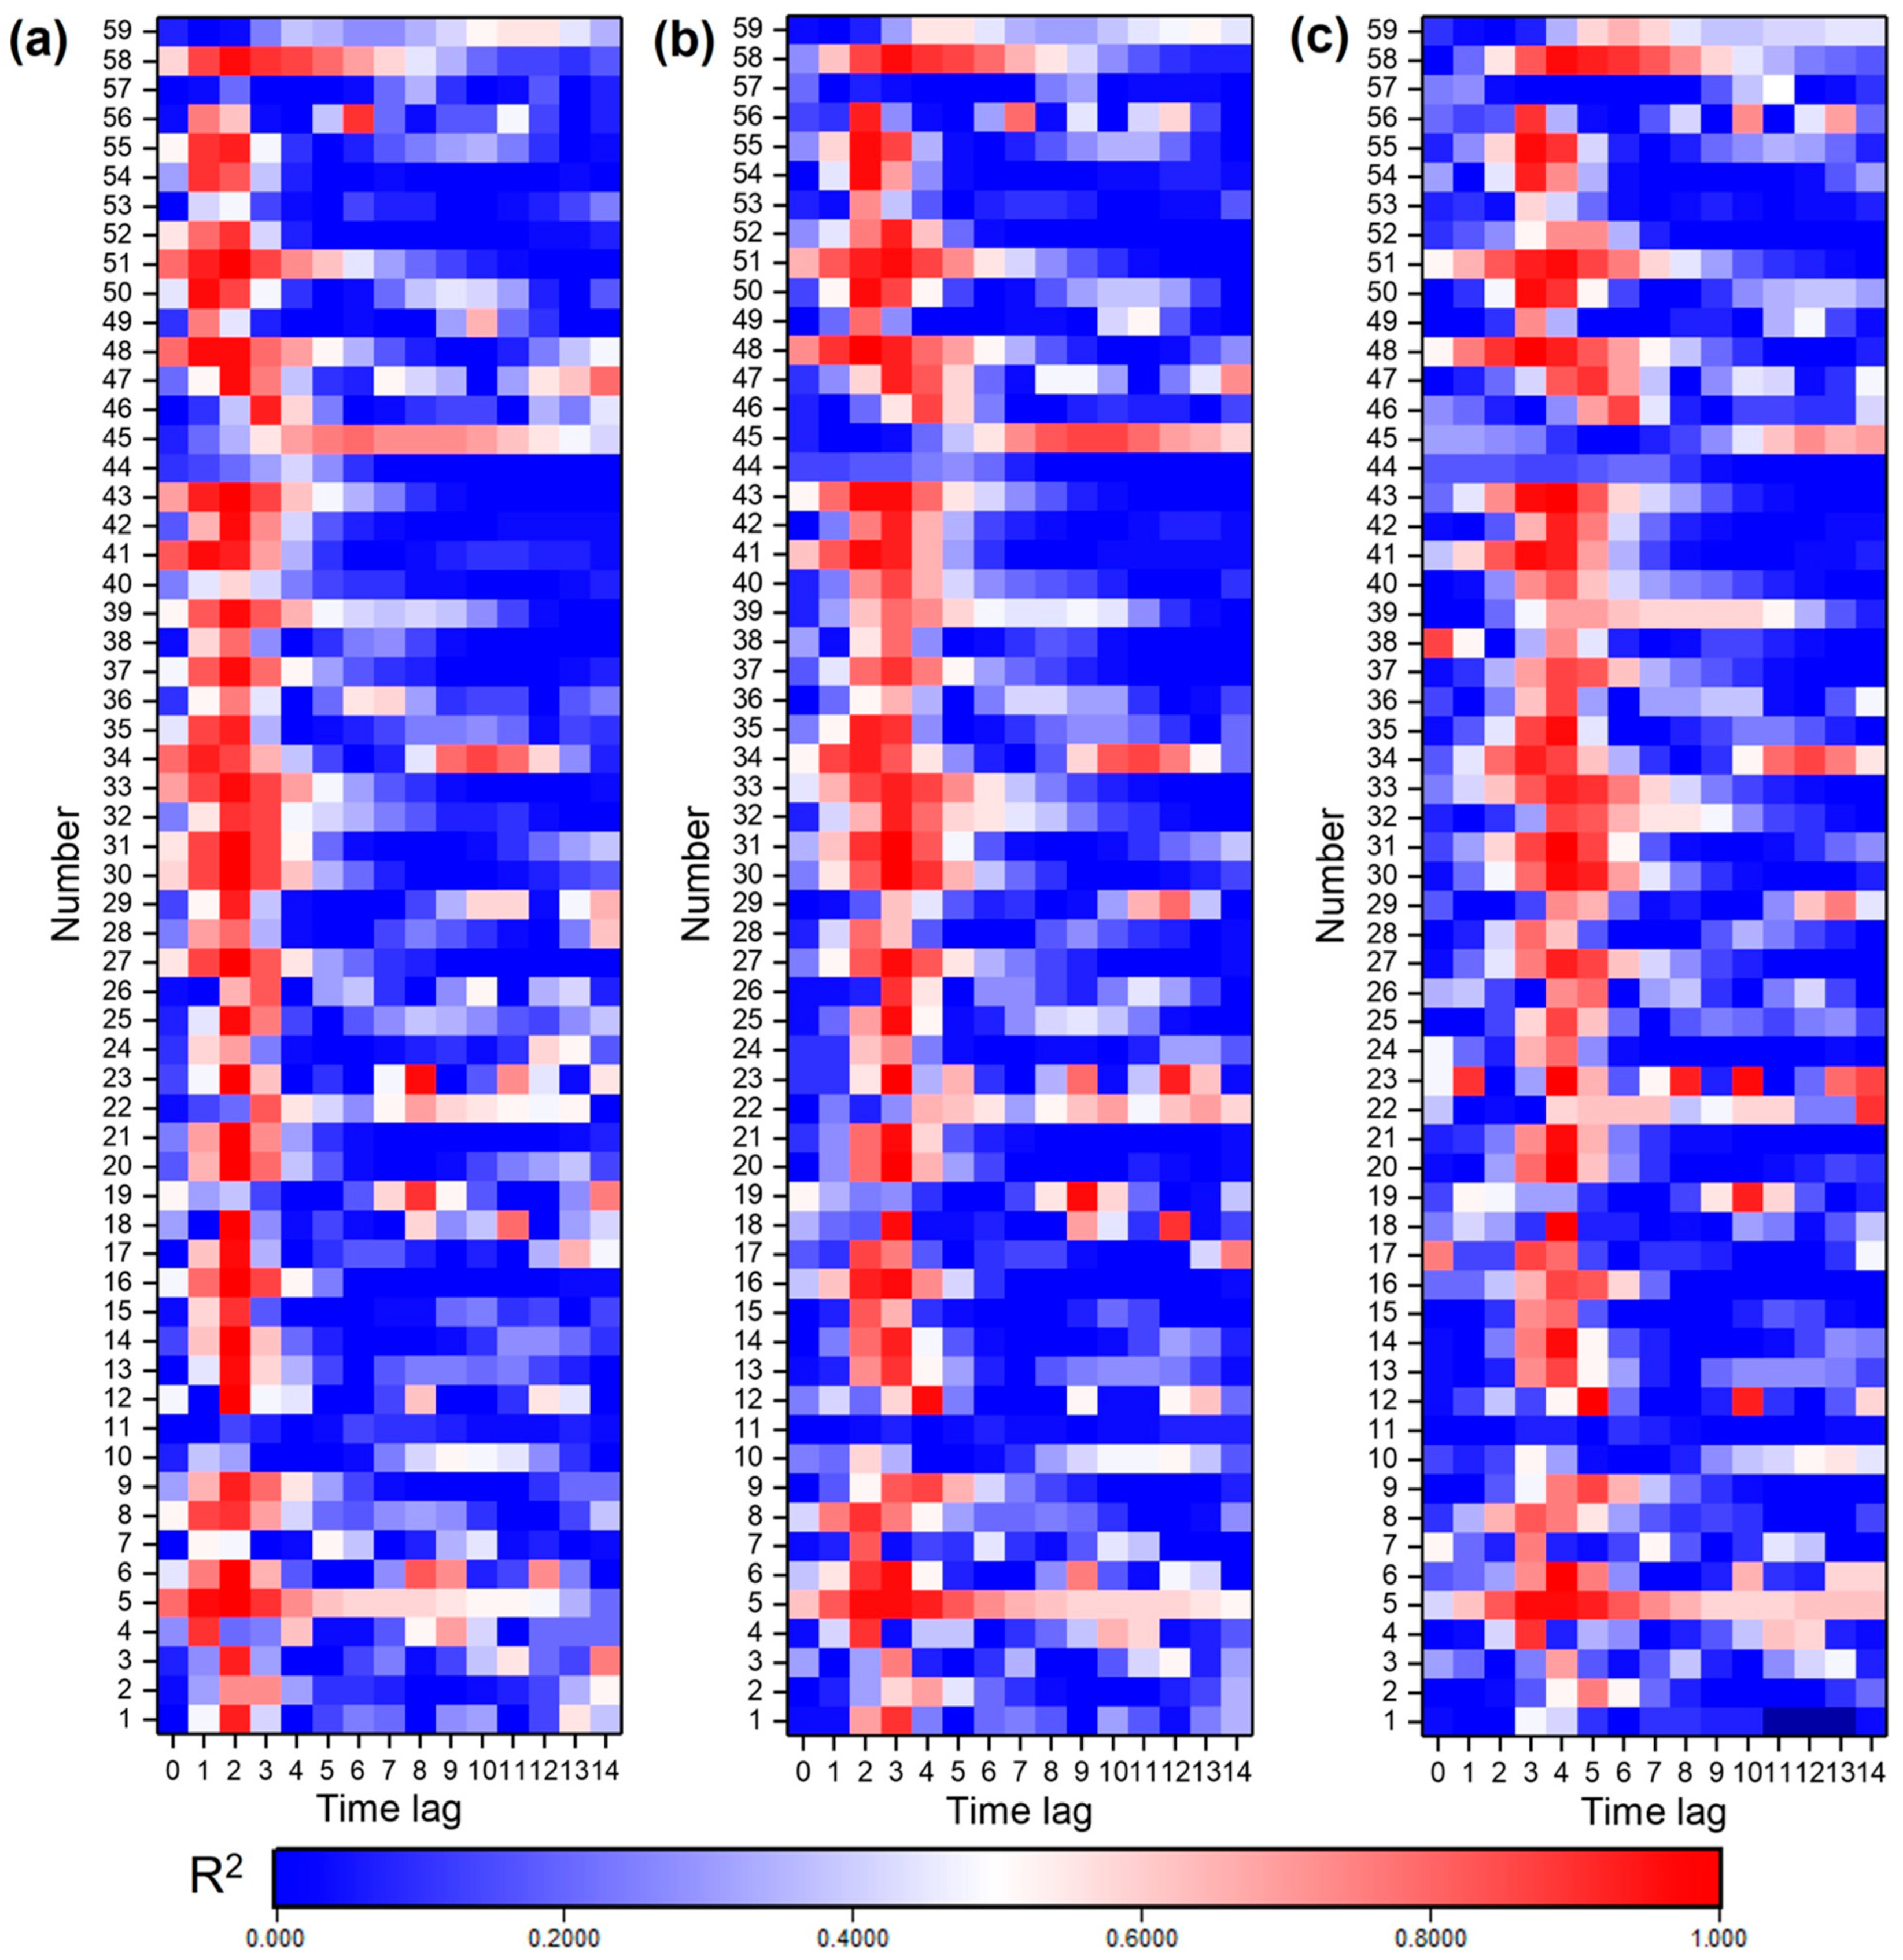
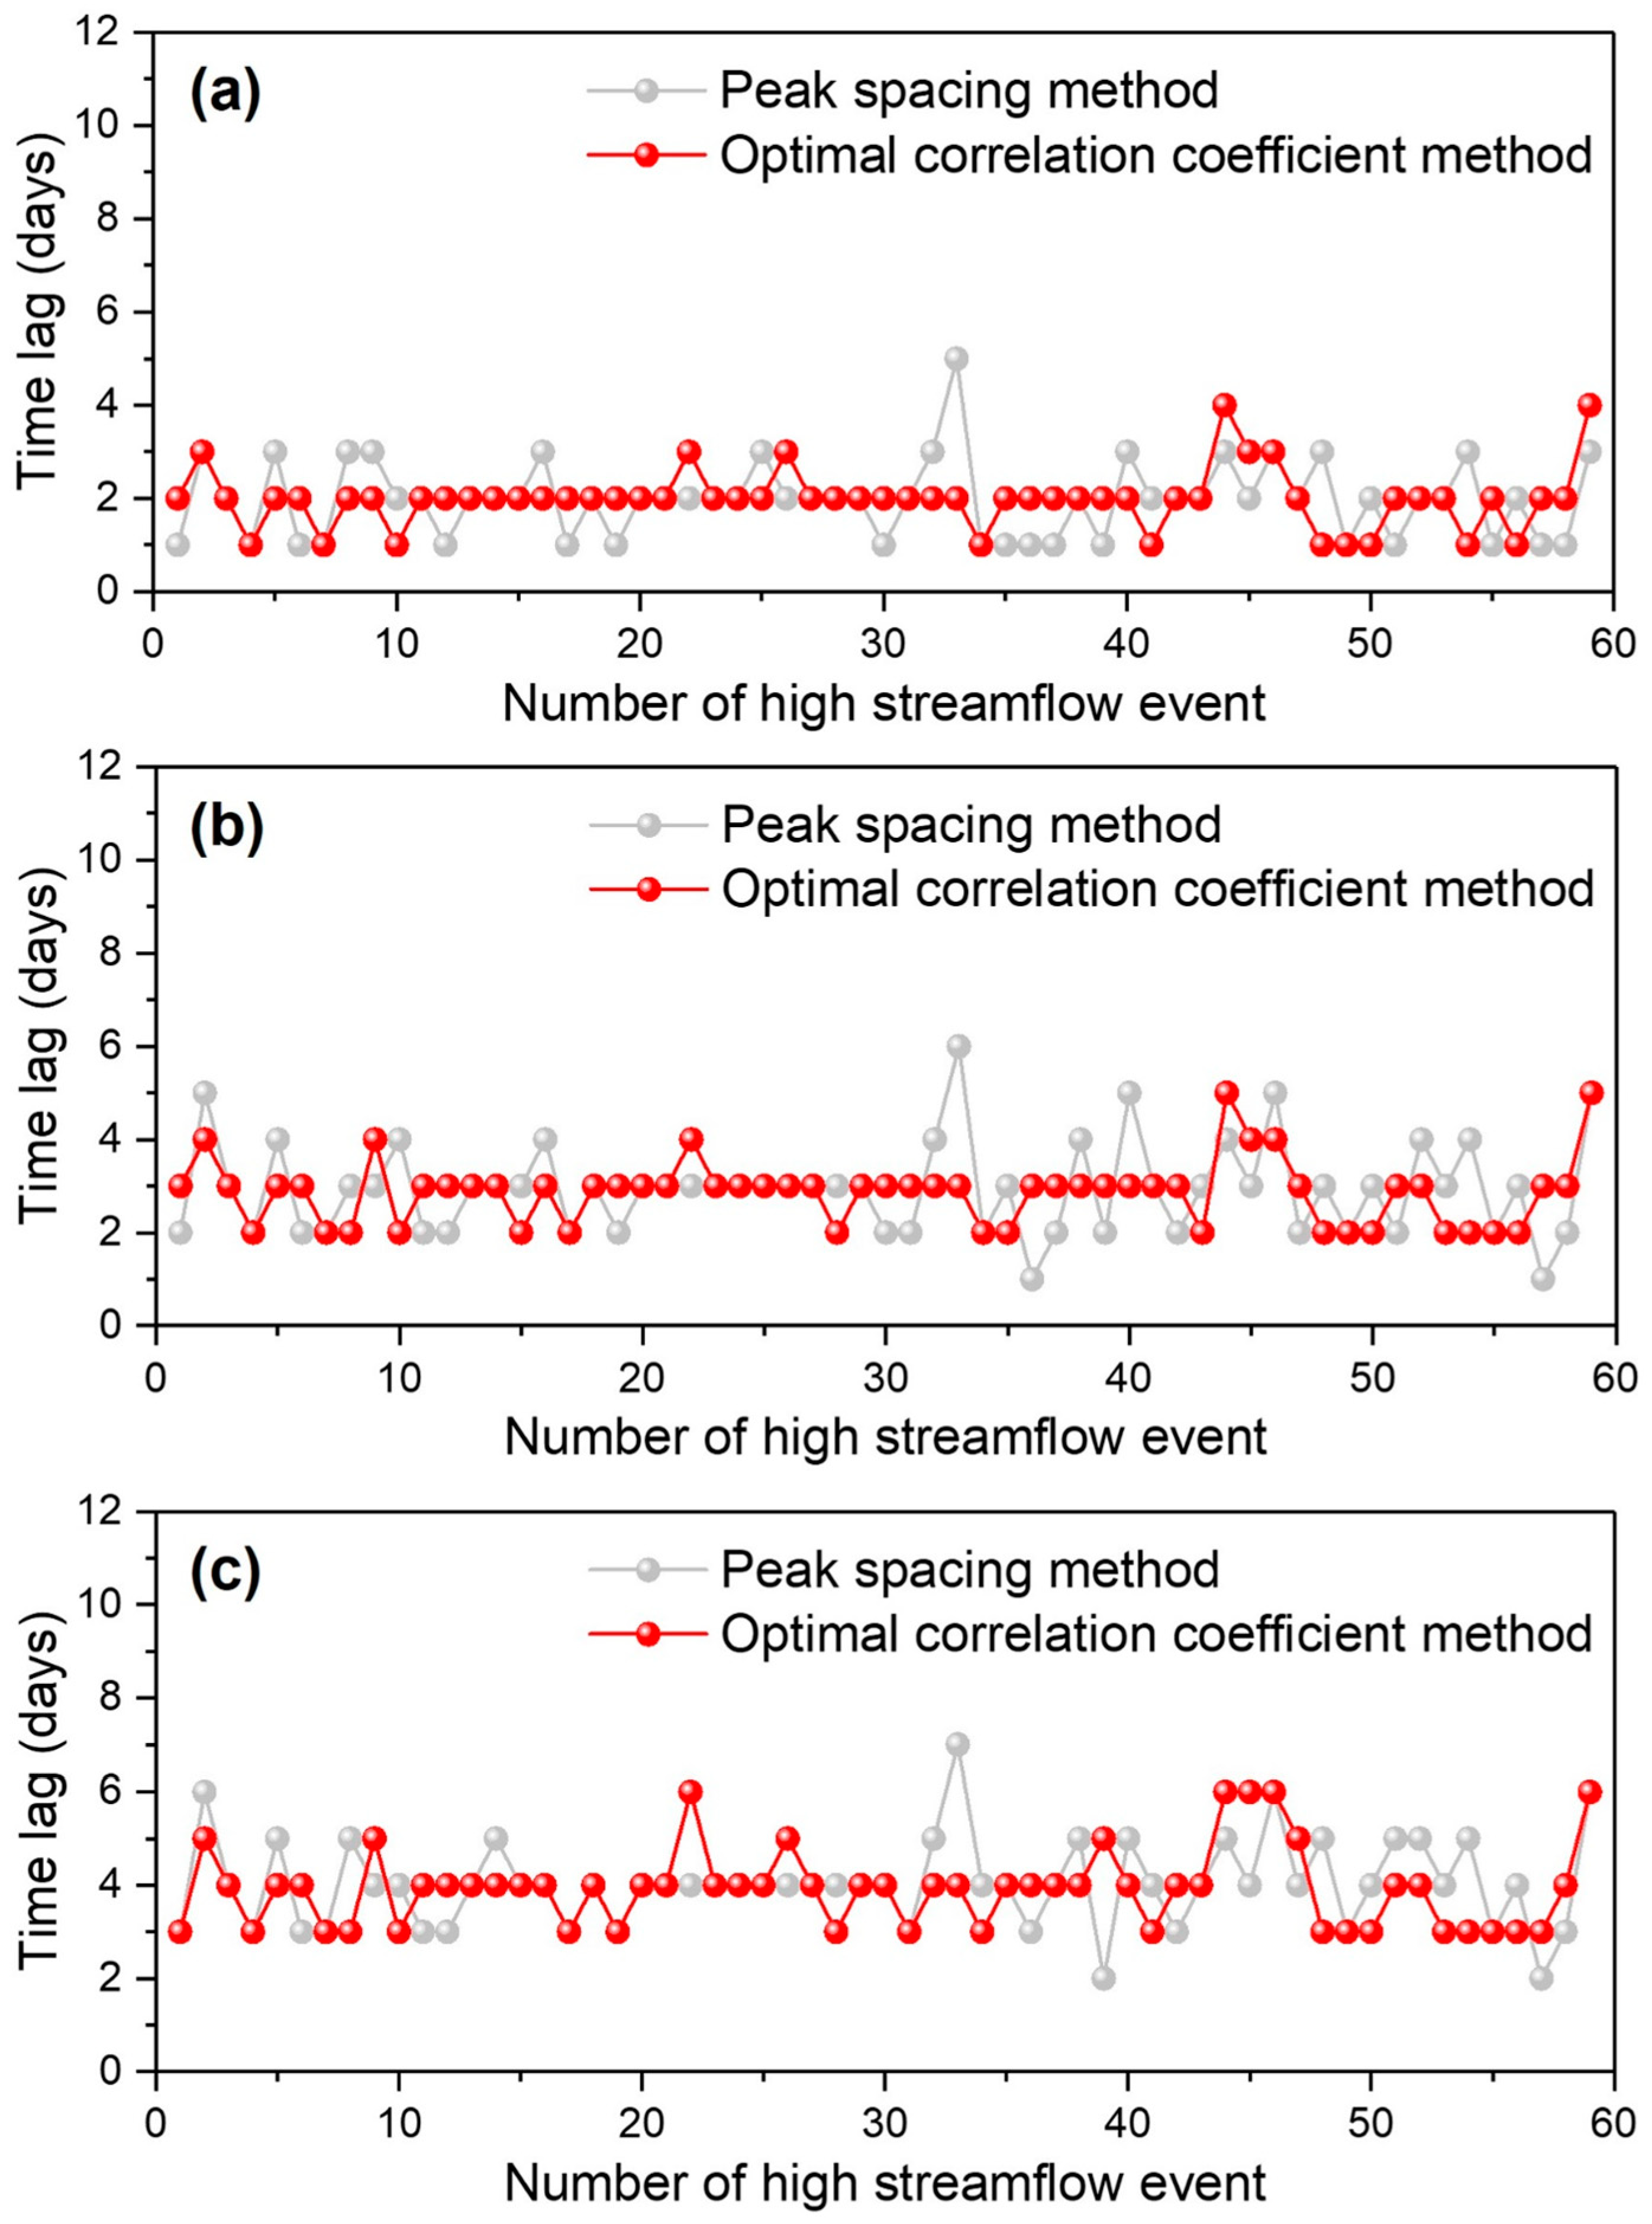
2.3.2. Determination of the Time Lag

In this study, we adopted two methods to determine the time lag. One is peak spacing method based on visual discrimination, and the other is optimal correlation coefficient method based on data sliding-linear regression. For the peak spacing method, the time lag is determined as the time interval between the streamflow peaks of two hydrological stations, which can be directly realized by visual discrimination (Figure 3a). A similar method has been applied to detect the time lag effect between variations in snow cover and runoff [28]. Despite its simplicity, the peak spacing method may result in errors induced by other factors, especially when the position of peak discharge is not prominent.
To eliminate this potential error, we developed an optimal correlation coefficient method based on data sliding linear regression. The basic procedure for this method is schematically illustrated in Figure 3b. Firstly, for a high streamflow event, a new series of the daily streamflow at a station in LYR with a time lag length of i days was reconstructed by moving the starting point i days ahead of the normal time series. Then, the relationship between the streamflow of the station in LYR and Xiaolangdi station was constructed using linear regression as follows:
Q LYR = k i × Q XLD + c
where k i is the regression coefficient with a time lag of i days, Q LYR is the daily streamflow of a station in LYR, Q XLD is the daily streamflow of Xiaolangdi station with a time lag of i days, and c is the intercept in the linear fitting equation, which is a constant term. In this study, time lag range of 0–14 days (i.e., i = 0, 1, 2, …, 14) is considered based on historical records [29]. For each station, the lag days (i) that have the highest coefficient of determination (R2) are the time lag for the streamflow in the LYR response to that at Xiaolangdi station.

3. Results

3.1. Variation in Daily Streamflow Delivered to the LYR

Figure 4a displays the variation in daily streamflow in the LYR from 1997 to 2020. It can be seen that the highest streamflow is generally in the dry season (mainly in June) during 2002–2020 due to the operation of Xiaolangdi Reservoir, which is different from that in the pre-dam period (before 1997). It has been reported that the highest discharge usually occurs in the wet season (July–October) before the construction of Xiaolangdi Reservoir [24]. The peak of the record during 1997–2020 occurred in 2020, with a peak discharge of 6260 m3/s (Figure 4a). After the Xiaolangdi Dam construction, the average daily discharge values of Xiaolangdi station in flood season and non-flood season were 1003 m3/s and 643 m3/s, respectively. This indicates that the ratio of average daily discharge during non-flood seasons to the average daily discharge during flood seasons at Xiaolangdi station is 64.1% during 1997–2020, which is much higher than that prior to the construction of Xiaolangdi Reservoir [24]. This increase reflects the flow regulation intensity, which largely favors water consumption in non-flood seasons. Based on the observed daily streamflow data, the 59 high streamflow events during 1997–2020 are annotated in Figure 4b in sequential order. Clearly, most of the high streamflow events occur in June and July, accounting for 58% of the total.

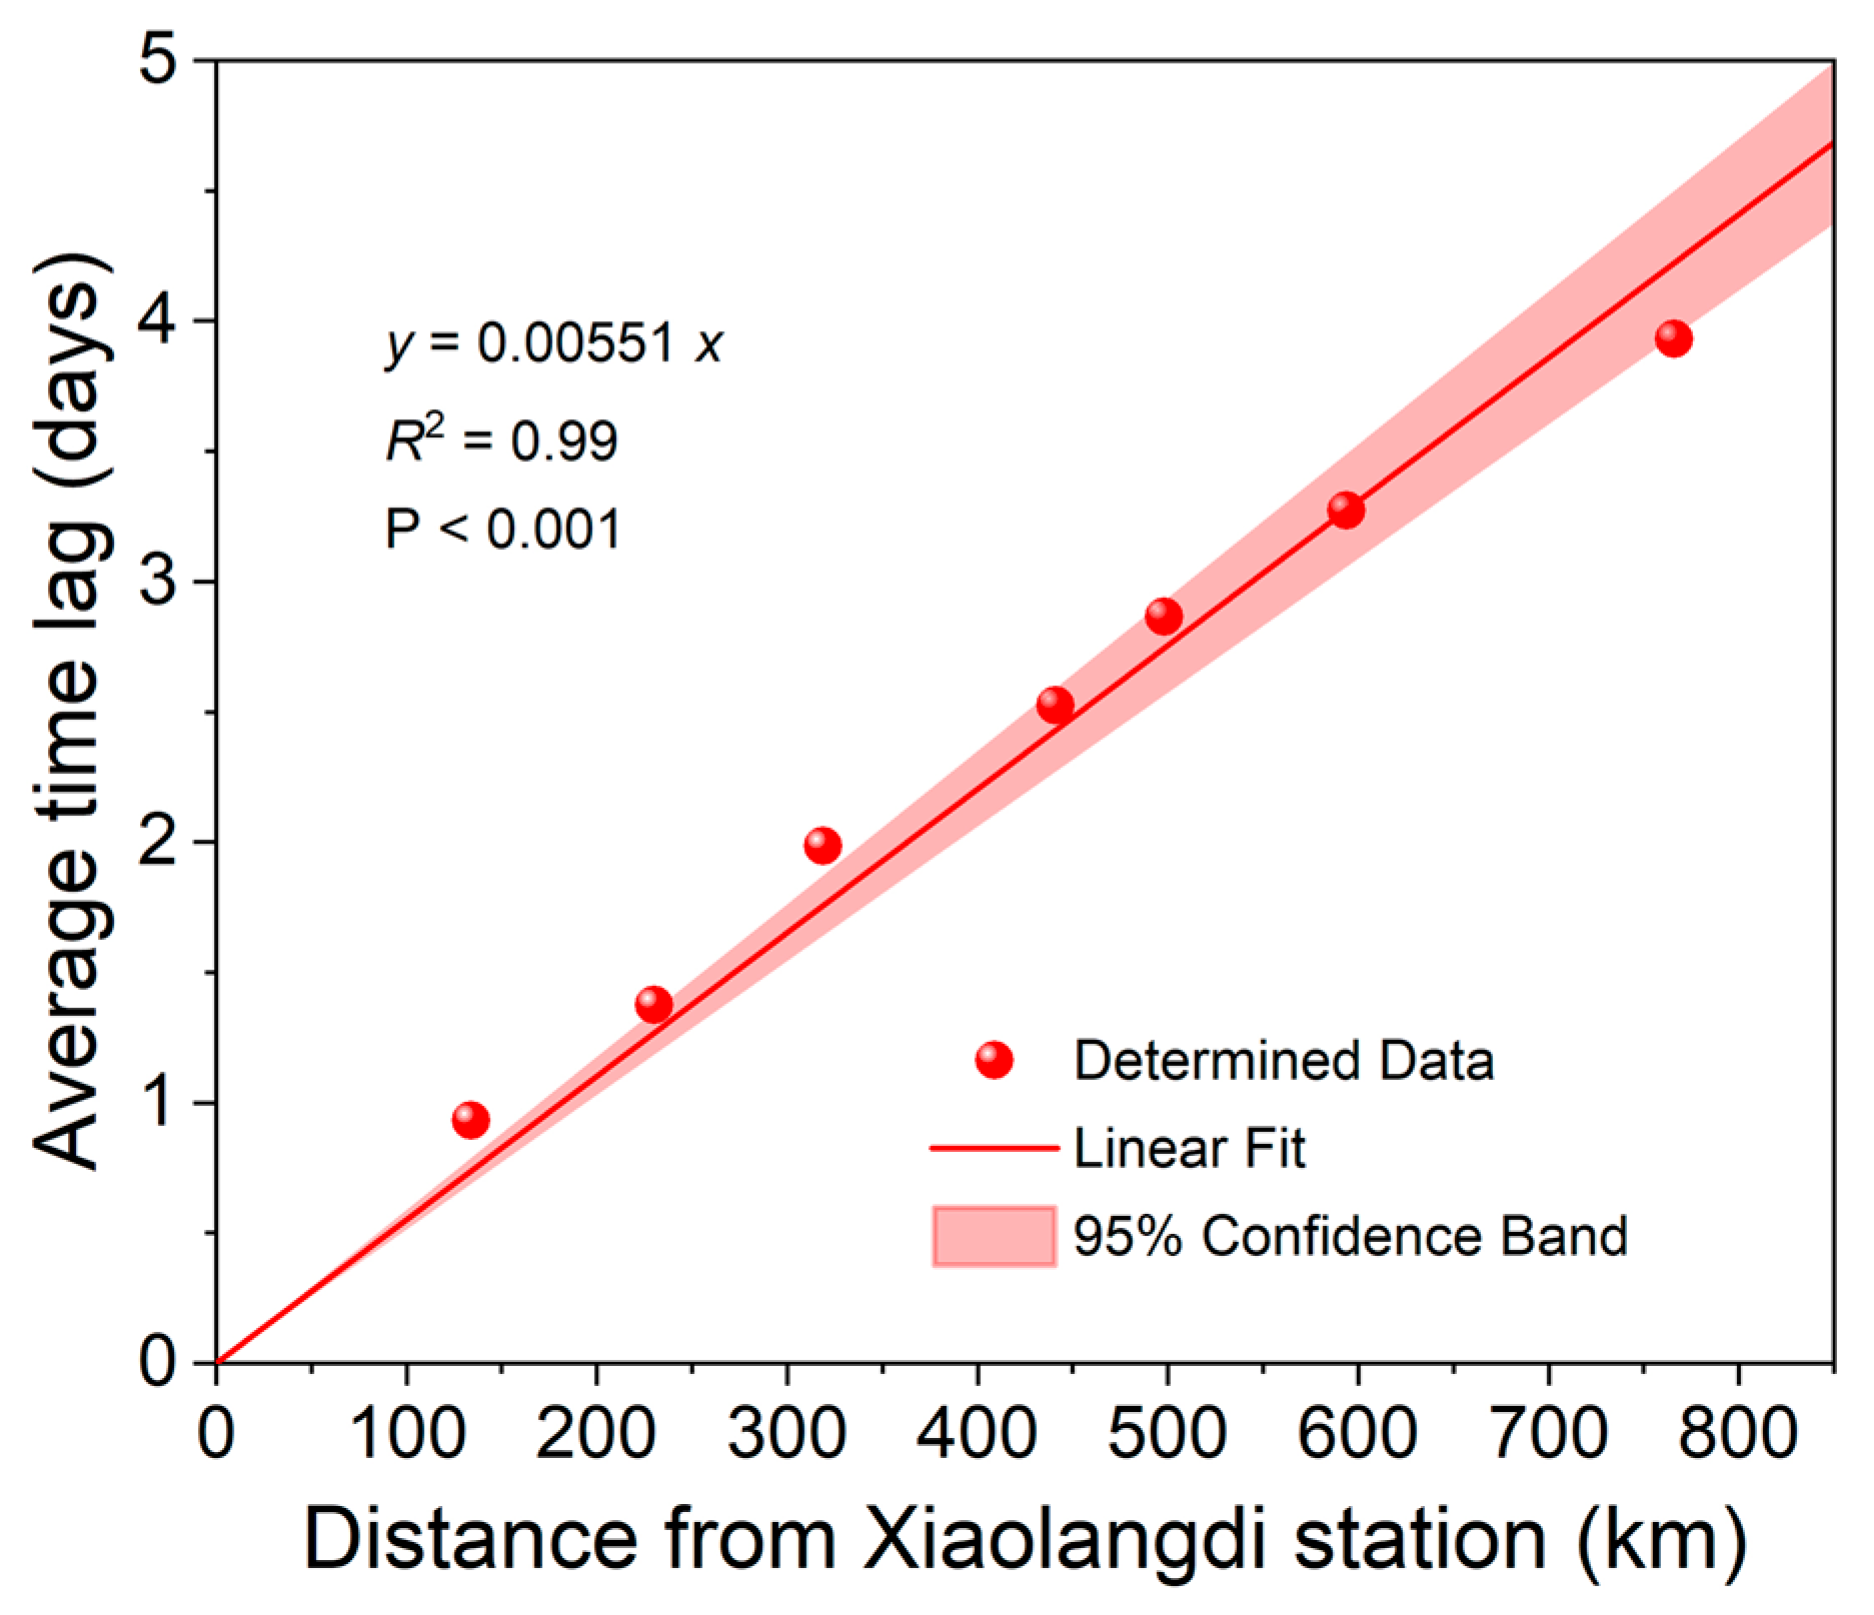
3.2. Time Lag of Streamflow in the LYR

To determine the time lag using the proposed optimal correlation coefficient method, we calculated the correlation coefficient between the streamflow in the LYR and the streamflow at Xiaolangdi station for a total of 59 high streamflow events. The analysis was performed within a time lag range of 0–14 days. It can be clearly seen from Figure 5 that the correlation coefficient between the streamflow in the LYR and that at Xiaolangdi station without considering time lag is significantly lower, indicating the existence of time lag. For most high streamflow events, there is a clear pattern in the relationship between lag time and correlation coefficient, with R2 rising initially and then falling as the time lag increases. Notably, for some specific high streamflow events, high correlation values are exhibited even after a time lag correction of more than 9 days, which are mainly attributed to the influence of the adjacent high streamflow events. For the streamflow at Gaocun, Aishan, and Lijin stations, the highest correlation coefficients fall within lag time ranges of 1–4 days, 2–5 days, and 3–6 days, respectively. On average, the maximum values of R2 at the Gaocun, Aishan, and Lijin stations are calculated to be 0.987, 0.979, and 0.978, respectively. The determined time lags of streamflow at Gaocun, Aishan, and Lijin stations relative to that at Xiaolangdi station are displayed in Figure 6. It can be observed that the results obtained by both the peak spacing method and the optimal correlation coefficient method exhibit good consistency. However, the lag time determined by the optimal correlation coefficient method shows lower volatility for the 59 events compared to that determined by the peak spacing method. For example, at the Gaocun station, 66% of the total events show the highest correlation coefficient with a lag time of 2 days. On average, the lag times for the Gaocun, Aishan, and Lijin stations are 1.98 days, 2.86 days, and 3.93 days, respectively. In other words, there will be a time lag of 1.98 days, 2.86 days, and 3.93 days between the record of water regulation at Xiaolangdi Reservoir and the arrival time at Gaocun, Aishan, and Lijin stations, respectively. Clearly, the time lag of streamflow increases as the distance from the Xiaolangdi Reservoir increases. This indicates that regulating water supply for different regions requires considering the effects of different time lags.

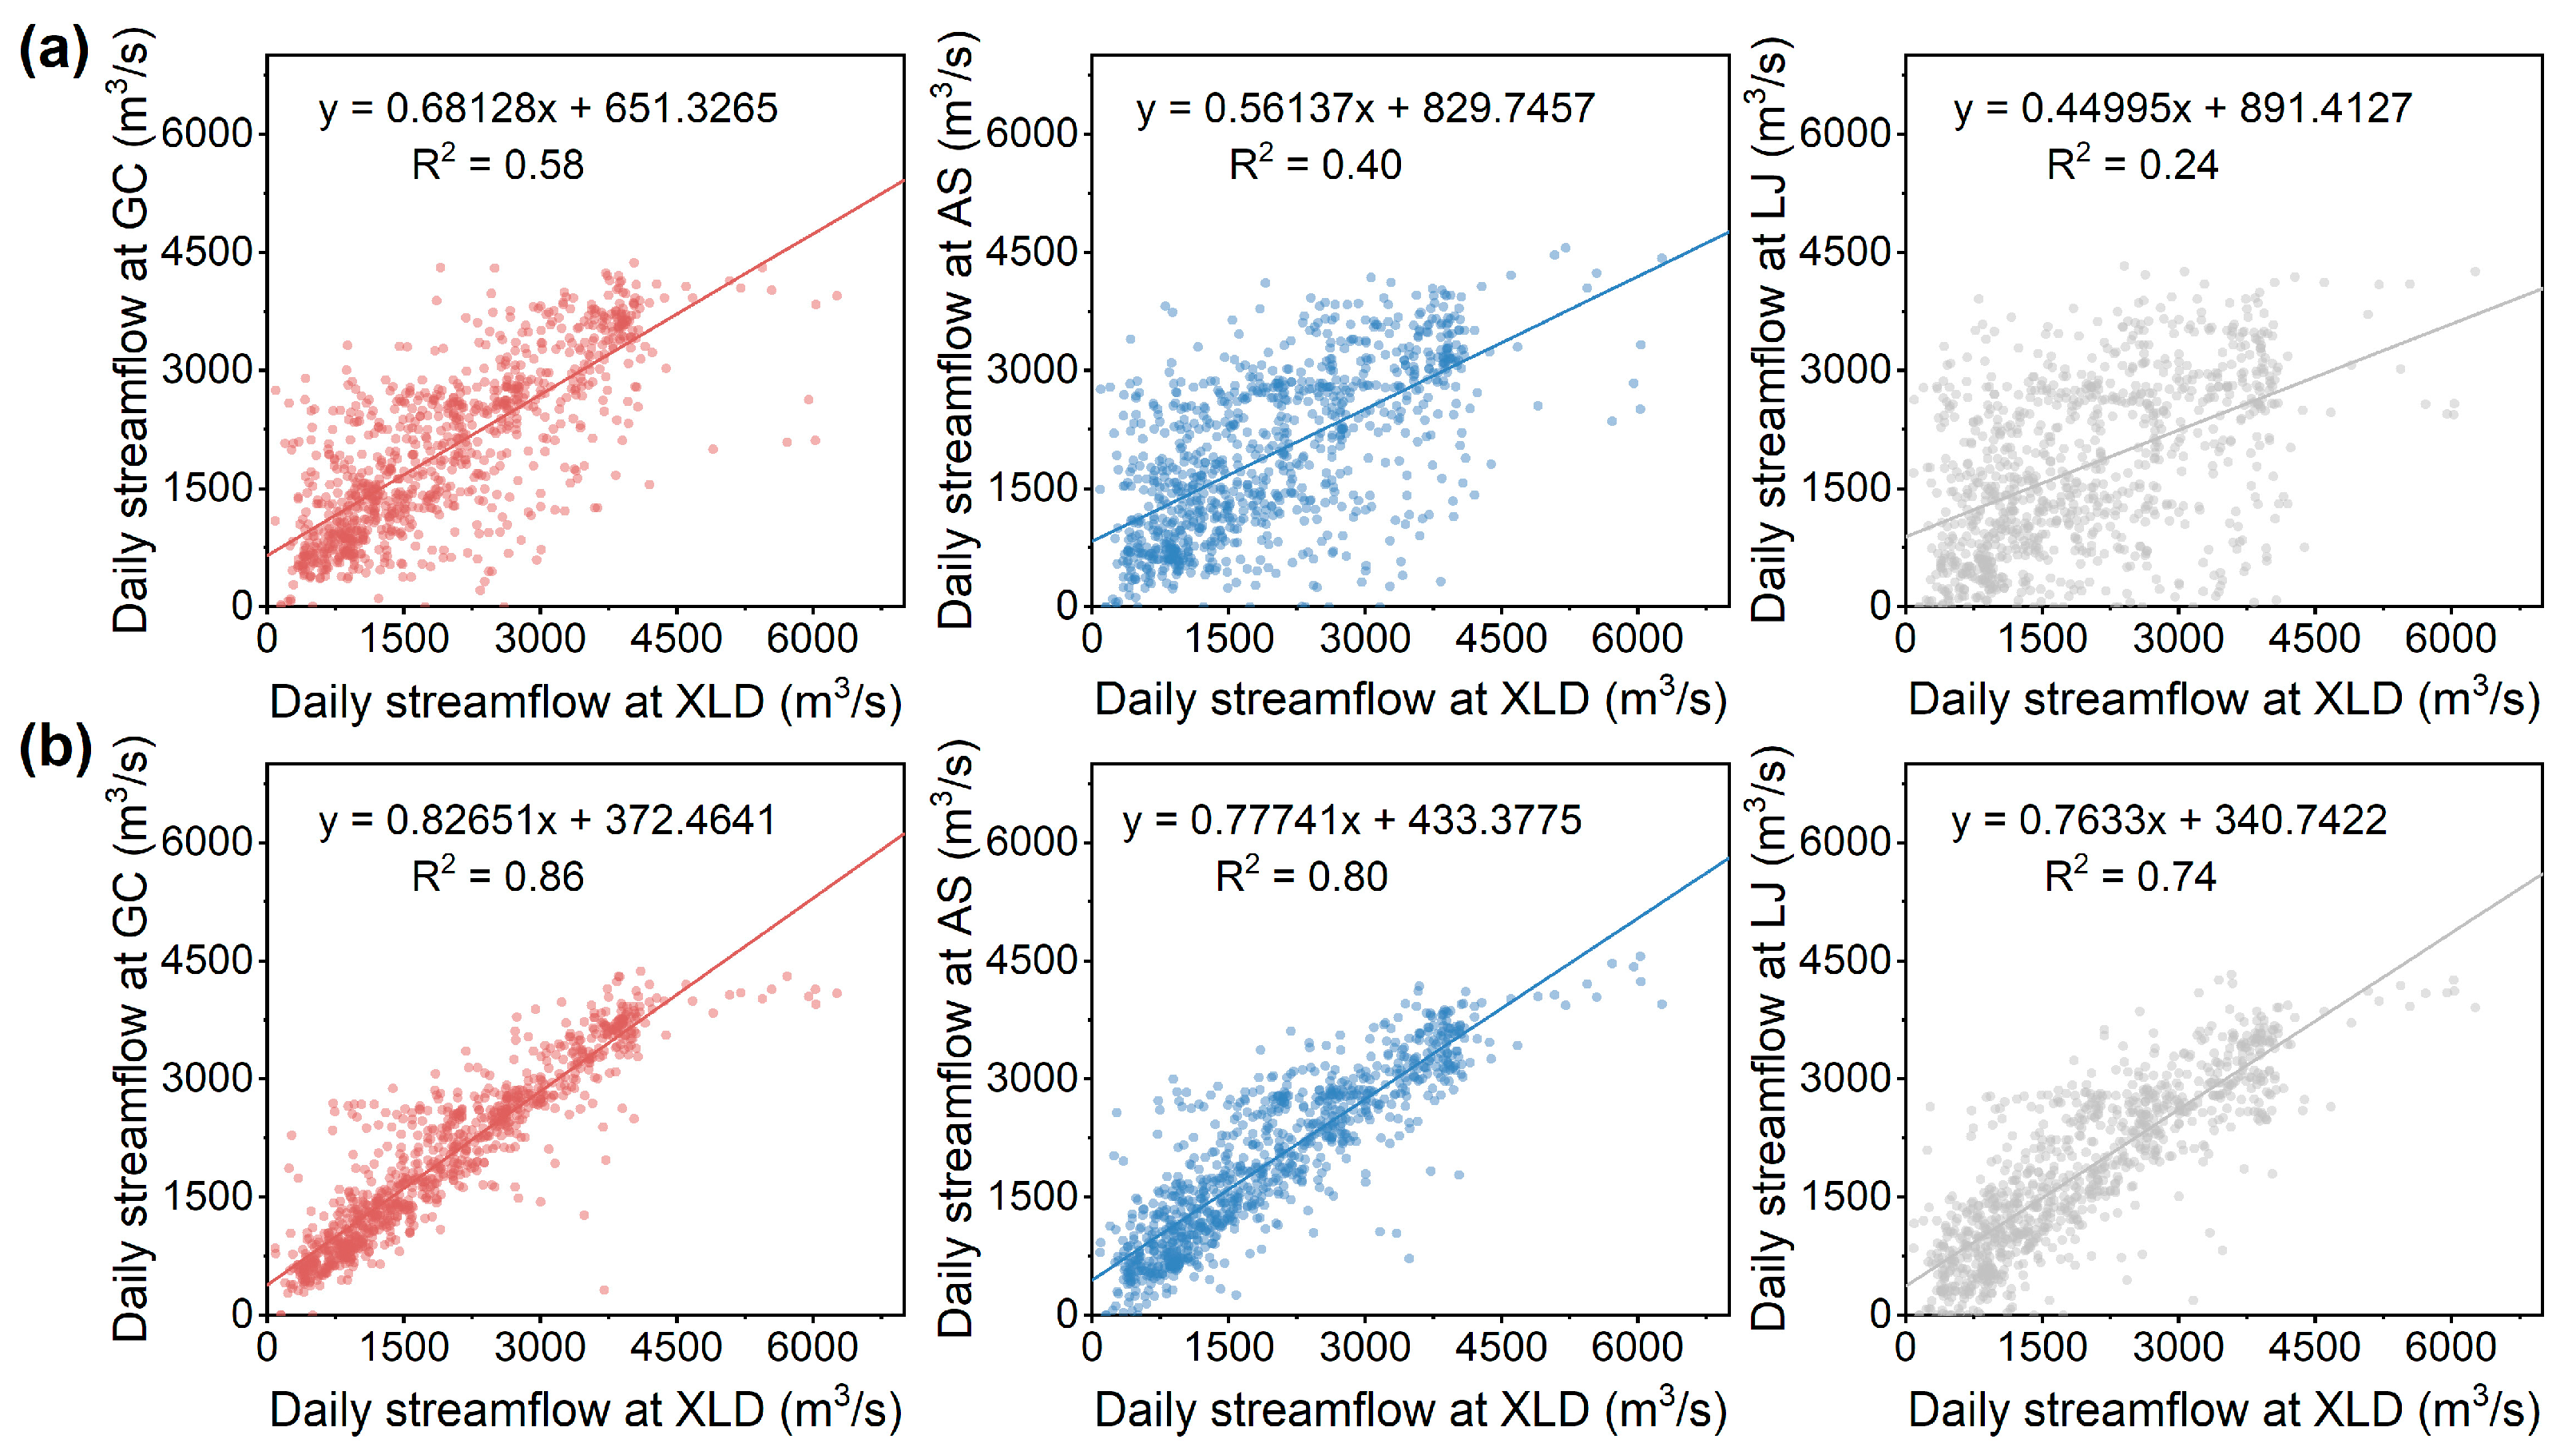
3.3. Reassessment of the Relationship of Streamflow in LYR and XLD

Since Xiaolangdi Reservoir is located at the mouth of the Yellow River Basin’s final gorge, it is considered the final large-scale water conservancy project with water control capabilities. In the context of diminishing water resources, precise management of water allocation is of paramount significance. Therefore, it is crucial to establish the relationship of streamflow in LYR and Xiaolangdi station. Based on these relationships, water resources can be efficiently allocated to the LYR through water regulation by Xiaolangdi Reservoir according to actual water demands. However, the water demand area in the lower Yellow River is often several hundred kilometers away from the Xiaolangdi Reservoir, and streamflow needs to travel some time to reach the target area. In a previous study, annual-scale discharge data were usually adopted to simply model the relationship [24]. These simplifications ignore the impact of streamflow hysteresis, which causes the built relationship to vary from reality and decreases model accuracy. Moreover, these modes based on annual streamflow datasets are inapplicable for fine water regulation within a year. Therefore, it is important to accurately model the relationship of streamflow in LYR and Xiaolangdi station using data with higher temporal resolution, taking into account the time lag effect. In this study, to establish the relationship between daily streamflow in LYR and Xiaolangdi station, simple linear regressions were conducted with and without time lag correction. Notably, other regression methods have also been used to describe the relationships between daily streamflow in LYR and Xiaolangdi station but have not been adopted due to poor goodness of fit or high complexity. From Figure 7a, it is evident that the daily streamflows at the Gaocun, Aishan, and Lijin stations are not well synchronized with the streamflow at the Xiaolangdi station without time lag correction. The corresponding goodness of fit (R2) for these stations are 0.58, 0.40, and 0.24, respectively. Although all the fittings show a significant linear relationship (p < 0.001), there are lots of scattered data points around the fitted lines. To eliminate the potential error, the time lag effect has been considered and the daily streamflows at Gaocun, Aishan, and Lijin stations have been reconstructed. As depicted in Figure 7b, there is an excellent linear relationship between the daily streamflows at Gaocun, Aishan, and Lijin stations and the streamflow at Xiaolangdi station when time lag correction is considered. The corresponding coefficients of determination for these stations are improved to 0.86, 0.80, and 0.74, respectively. This highlights the crucial role of considering the time lag effect when regulating the water supply from Xiaolangdi Reservoir to the LYR.

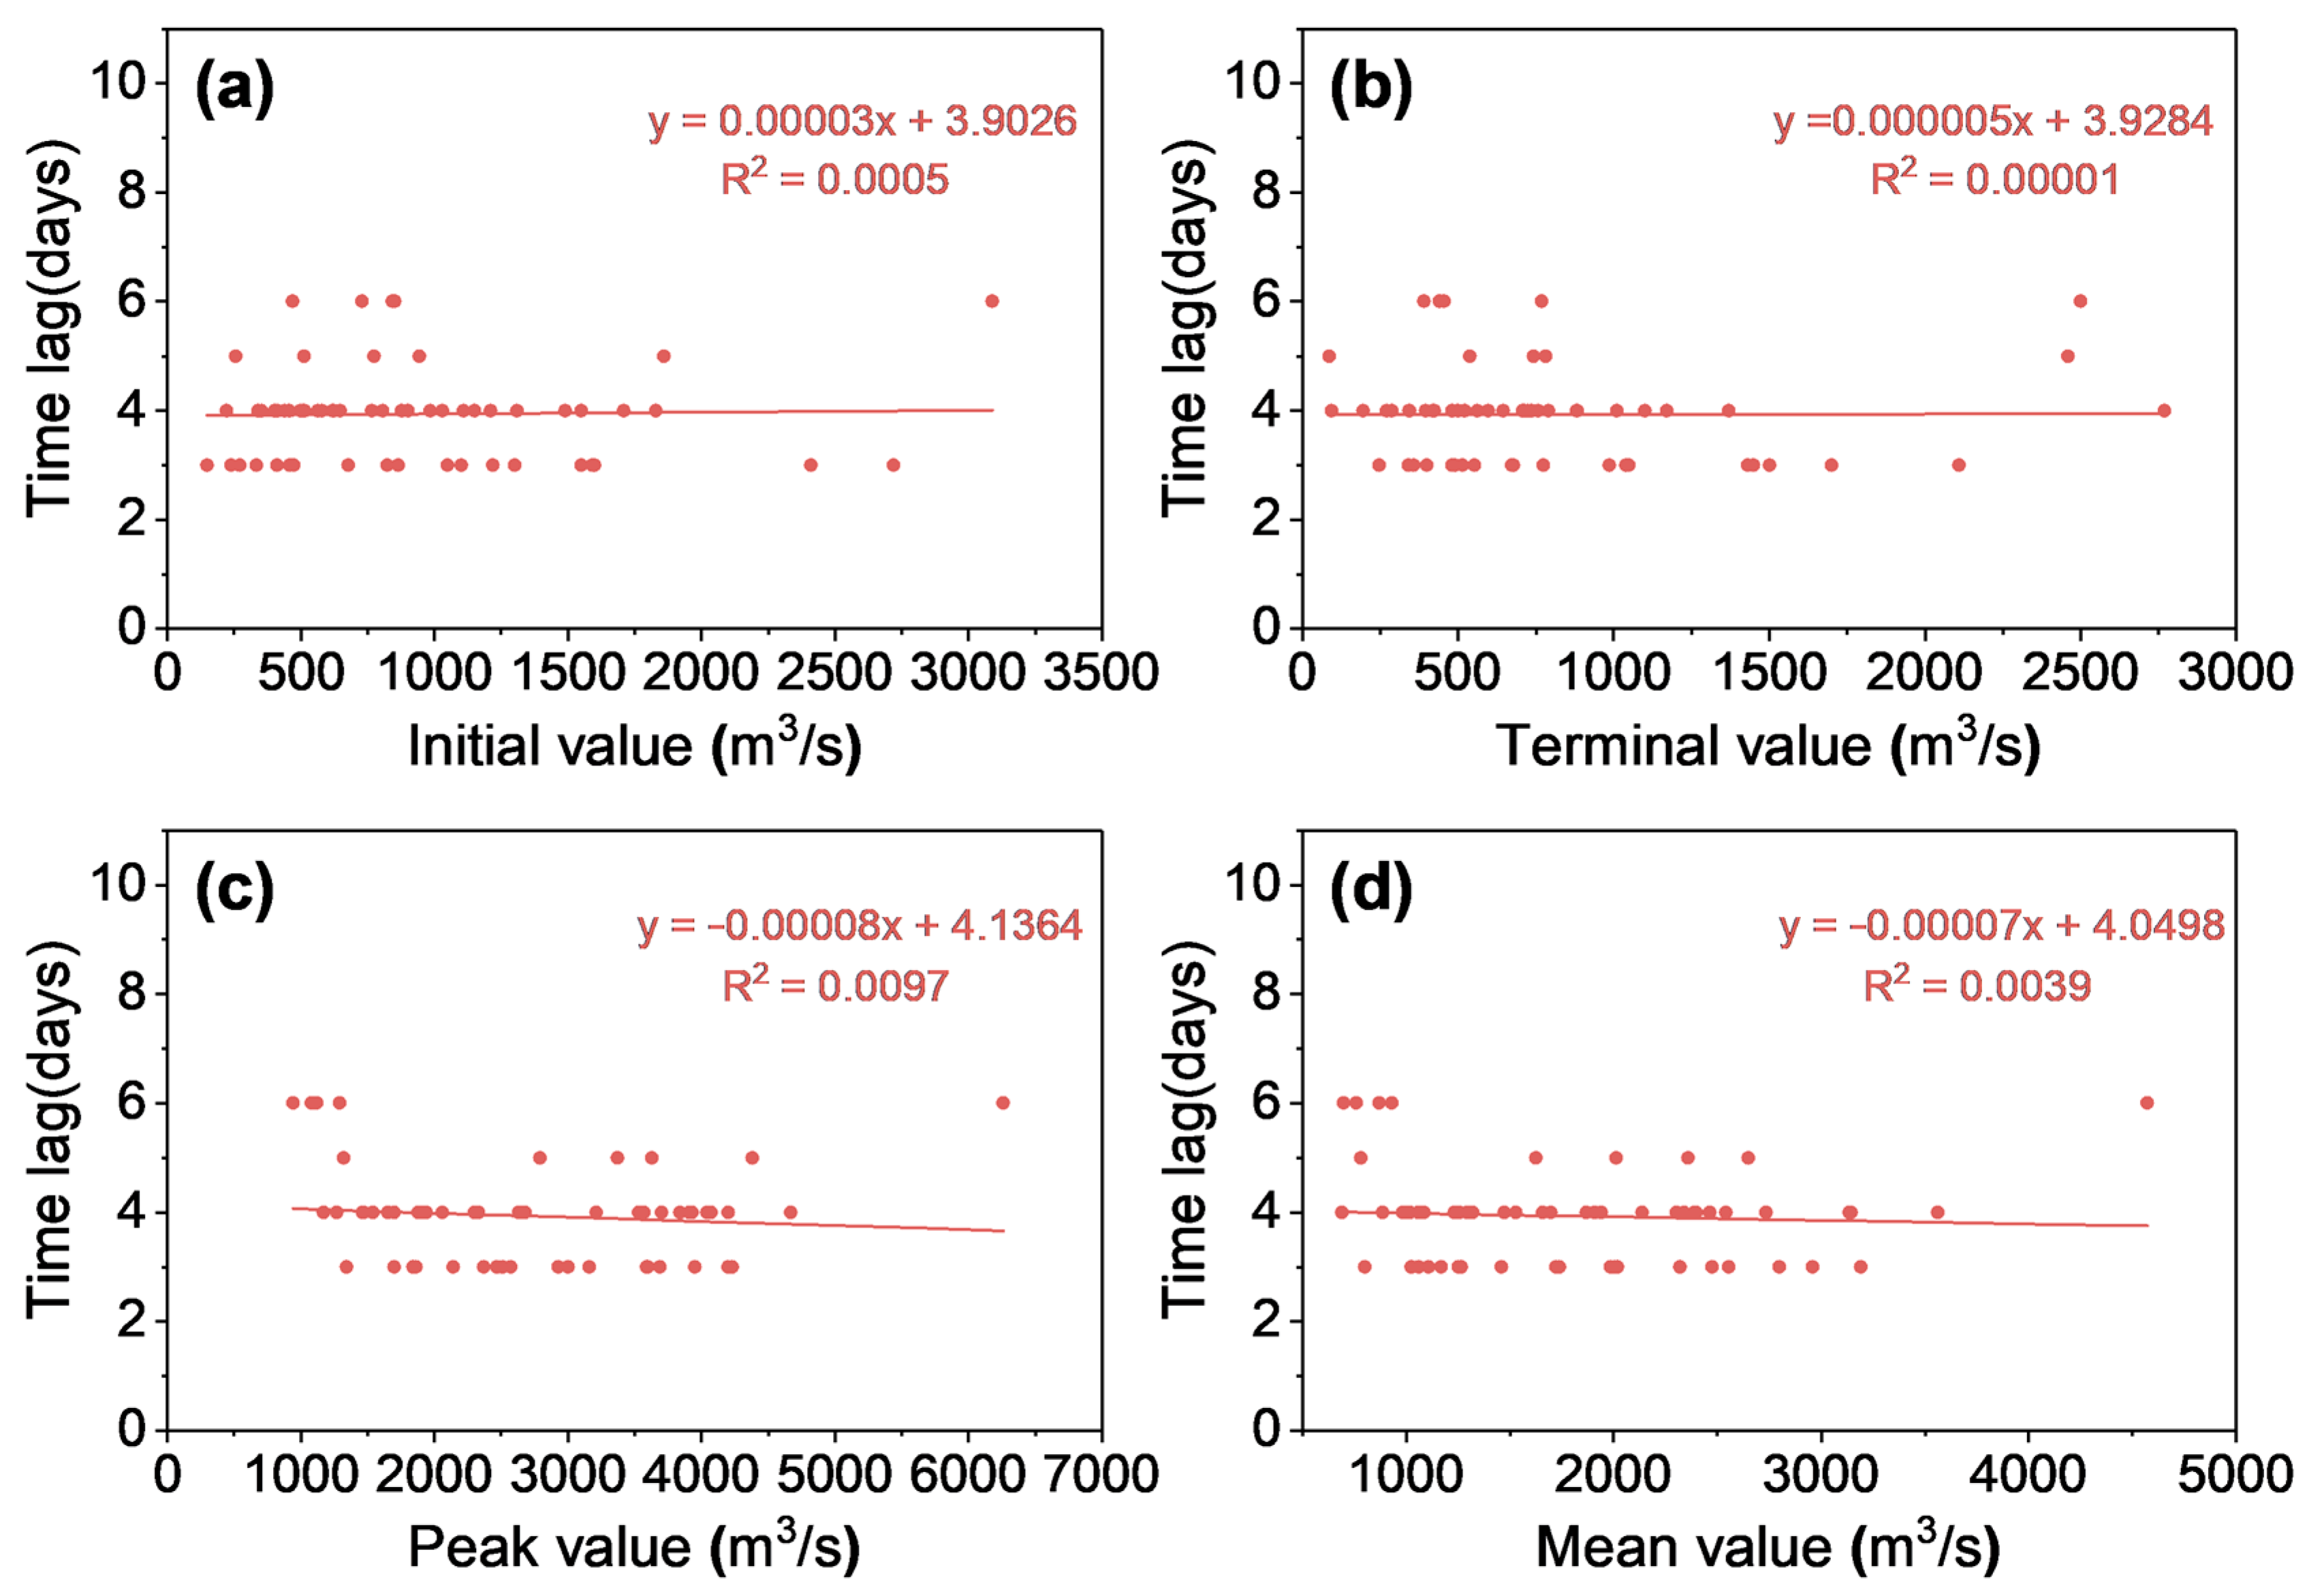
3.4. Possible Impact Factors on Time Lags

To investigate the reasons for different delay times, we primarily focused on two factors: the distance traveled by streamflow and the specific characteristics of high streamflow events. When considering the specific characteristics of high streamflow events, we took into account the initial value, terminal value, peak value, and mean value of high streamflow events. Theoretically, for a fixed runoff profile, high streamflow leads to high travel speed and therefore reduced lag time. However, as depicted in Figure 8, there are no significant correlations between the lag time and any of the specific characteristics of high streamflow events. This can be mainly attributed to the semi-enclosed nature of the river channel, where the runoff profile also increases during high streamflow events. Consequently, the influence of the characteristics of high streamflow events on the lag time is limited. On the contrary, a significant linear relationship exists between travel distance and lag time, with a goodness of fit of 0.99. A similar finding has been reported in a previous study where the groundwater level response to the water stage of the Yellow River is also mainly affected by the distance away from the Yellow River [30]. Based on the fitting formula shown in Figure 9, we can estimate that every 100 km of travel distance will result in a lag of approximately 0.57 days. Notably, previous studies reported that the travel time of the streamflow between two stations is also influenced by the river channel features, such as channel width, sinuosity, and slope. For the same distance, the flood travel time for the wide and shallow channels is less than that for the narrow and deep channels [31]. In the full-scale scouring experiments by regulating the discharges of water and silt from Xiaolangdi Reservoir in 2002, an artificial high streamflow event was created [32]. It took the peak discharge 4 days to travel 450 km through Henan Province with a speed of about 4.7 km h−1, and took 3 days to travel about 400 km through Shandong Province with a speed of about 5.6 km h−1 [33]. The relatively low velocity of the streamflow in Henan Province was thought to be attributed to increased channel resistance in the wandering and transition pattern of the Henan region especially along some narrow sections at the border of Henan–Shandong Provinces. The increased speed in Shandong Province is thought to be due to the faster or more smoothly bending river channel [33].

4. Discussion

4.1. Necessity of Considering Time Lag during Water Supply

The North China Plain near the LYR is one of the largest grain-producing areas in China, where winter wheat and summer maize are the main crop types [34]. In these regions, water has been recognized as one of the dominant constraints to agricultural production [35]. Since the water requirement of crop growth cannot be met by rainfall in time and quantity, irrigation has been inevitably implemented to maintain optimal crop growth and production. A previous study demonstrated that proper irrigation can promote corn yields by more than five-fold and wheat yields by two-fold, respectively [36]. The main source of water withdrawal for agricultural irrigation in the North China Plain is the Yellow River, and the irrigation water accounts for more than 80% of total water use in the Yellow River Basin [37]. The majority of scholars agreed that precipitation in the Yellow River Basin will increase under future climate change scenarios [38,39], which seems to alleviate water pressure for irrigation. However, the overall increase in water demand may compress the available irrigation water [40]. Therefore, in order to balance the water demand and water utilization, it is crucial to improve the water utilization efficiency and avoid waste of water resources, especially for long-distance water resource transportation. As determined above, there will be a time lag of 1.98 days, 2.86 days, and 3.93 days between the record of water release at Xiaolangdi Reservoir and the arrival time at the Gaocun, Aishan, and Lijin stations, respectively. Previous studies have reported that the sensitivity of winter wheat to water deficit varies at different growth stages, with pre- and post-joining stages being the most sensitive to water deficit [41,42]. Therefore, this finding could be extremely important for the management of water resource allocation since the delay of water supply may cause crops to miss their optimal growth period and result in a decrease in yield.

4.2. Comparison of Time-Lagged Response before and after Operation of Xiaolangdi Reservoir

In this study, we mainly evaluated the time-lagged response of streamflow in the lower Yellow River to the water regulation by Xiaolangdi Reservoir. To check the potential influence of reservoir operation, it is essential to compare the time lag with that prior to the construction of Xiaolangdi. It was reported in many previous studies that the average time for high streamflow traveling 800 km from Huayuankou to Lijin in 1950–1990 was 7–8 days [29,43,44]. Our study suggests that the time lag of streamflow at Lijin station response to that at Xiaolangdi station is only 4 days, which is consistent with that reported in a previous study [16]. In the study of Xu and Cheng [25], the peak discharges of a high streamflow event in 1977 appeared on August 8 at Huayuankou station and on August 12 at Lijin station, leading to a time lag of ~4 days. Based on the findings in this study, the corresponding time lag is only ~3 days between the streamflow at Huayuankou station and Lijin station. In our opinion, the slightly decreased time lag may be attributed to the change in channel features. Before the operation of Xiaolangdi Reservoir, the LYR experienced heavy sediment deposition, leading to the poor flood discharge capacity of the river channel. A flood does not flow down the river in a well-defined channel but moves randomly within a wide valley confined by the grand levees [45]. Thus, the mobile channel may cause a strong attack of the flood wave on the dikes, therefore slowing down the speed of water flow [43]. After the operation of Xiaolangdi Reservoir, especially the implementation of WSRS, the main river channels in the LYR have been fully scoured, leading to an increase in channel depth and bankfull discharge [46]. Moreover, the channel stability has also been improved after the operation of Xiaolangdi Reservoir [45], which should also account for the faster streamflow traveling speed.

4.3. Error Analysis

Obviously, the dominant error source is the low temporal resolution of the streamflow data. In this study, the daily scale streamflow data are employed since it is already the highest resolution data available. However, no matter what method is adopted for determining the time lag, the minimum time variation interval is 1 day. Notably, the actual lag time between two stations is usually a continuous value, not a discontinuous one. Therefore, based on existing data and methods, the determined lag time is larger or smaller than the actual lag time. This kind of error can be reduced only when there is streamflow data with higher temporal resolution.

5. Conclusions

In this work, the time-lagged response of streamflow in the LYR to water regulation by the Xiaolangdi Reservoir has been systematically investigated using historical hydrological data and statistical analytic methods. Based on the proposed optimal correlation coefficient method, it has been observed that there is a time lag of 1.98 days, 2.86 days, and 3.93 days between the record of water regulation at Xiaolangdi Reservoir and the arrival time at the Gaocun, Aishan, and Lijin stations, respectively. This emphasizes the need to take time lag correction into account when establishing a link between daily streamflows in the LYR and those at Xiaolangdi station. There is an excellent linear relationship between the daily streamflows at Gaocun, Aishan, and Lijin stations and the streamflow at Xiaolangdi station when time lag correction is considered. Further analysis reveals that the travel distance of streamflow is the dominant factor determining the lag time, with a time lag coefficient of 0.57 days per hundred kilometers. More accurate results can be determined by utilizing data with higher temporal resolution. Compared to that prior to the operation of the Xiaolangdi Reservoir, the time lag effect has slightly decreased, indicating that the operation of the reservoir has improved the flood discharge capacity of the lower Yellow River to a certain extent. Overall, the findings of this study are expected to provide valuable insights for decision-makers involved in water resource management.

Author Contributions

Conceptualization, D.K.; methodology, J.W. and D.K.; software, J.W. and D.K.; validation, J.W. and D.K.; formal analysis, J.W., J.X., and D.K.; investigation, J.W., J.X., and D.K.; resources, D.K.; data curation, D.K.; writing—original draft preparation, J.W.; writing—review and editing, J.W., J.X., and D.K.; visualization, J.W.; supervision, D.K.; project administration, D.K.; funding acquisition, D.K. All authors have read and agreed to the published version of the manuscript.

Funding

This research was funded by the National Natural Science Foundation of China (No. 42101050), the Shandong Provincial Natural Science Foundation, China (No. ZR2021QD003), and the Key Laboratory of Hydrometeorological Disaster Mechanism and Warning of Ministry of Water Resources (No. HYMED202304).

Data Availability Statement

All data reported in the manuscripts are available from the corresponding author upon justified request.

Acknowledgments

We are grateful to the Yellow River Conservancy Commission (YRCC) for providing hydrological data.

Conflicts of Interest

The authors declare no conflict of interest.

References

  1. Gerten, D.; Rost, S.; von Bloh, W.; Lucht, W. Causes of change in 20th century global river discharge. Geophys. Res. Lett. 2008, 35, L20405. [Google Scholar] [CrossRef]
  2. Fang, Y.; Jawitz, J.W. The evolution of human population distance to water in the USA from 1790 to 2010. Nat. Commun. 2019, 10, 430. [Google Scholar] [CrossRef] [PubMed]
  3. Trivedi, R. Water quality of the Ganga River–an overview. Aquat. Ecosyst. Health Manag. 2010, 13, 347–351. [Google Scholar] [CrossRef]
  4. He, C.; Liu, Z.; Wu, J.; Pan, X.; Fang, Z.; Li, J.; Bryan, B.A. Future global urban water scarcity and potential solutions. Nat. Commun. 2021, 12, 4667. [Google Scholar] [CrossRef] [PubMed]
  5. Vorosmarty, C.J.; McIntyre, P.B.; Gessner, M.O.; Dudgeon, D.; Prusevich, A.; Green, P.; Glidden, S.; Bunn, S.E.; Sullivan, C.A.; Liermann, C.R.; et al. Global threats to human water security and river biodiversity. Nature 2010, 467, 555–561. [Google Scholar] [CrossRef] [PubMed]
  6. Zhang, Y.; Zheng, H.; Zhang, X.; Leung, L.R.; Liu, C.; Zheng, C.; Guo, Y.; Chiew, F.H.; Post, D.; Kong, D. Future global streamflow declines are probably more severe than previously estimated. Nat. Water 2023, 1, 261–271. [Google Scholar] [CrossRef]
  7. Crabot, J.; Polášek, M.; Launay, B.; Pařil, P.; Datry, T. Drying in newly intermittent rivers leads to higher variability of invertebrate communities. Freshw. Biol. 2020, 66, 730–744. [Google Scholar] [CrossRef]
  8. Erlewein, A. Disappearing rivers—The limits of environmental assessment for hydropower in India. Environ. Impact Assess. Rev. 2013, 43, 135–143. [Google Scholar] [CrossRef]
  9. Johnson, N.; Revenga, C.; Echeverria, J. Managing water for people and nature. Science 2001, 292, 1071–1072. [Google Scholar] [CrossRef]
  10. Mekonnen, M.M.; Hoekstra, A.Y. Four billion people facing severe water scarcity. Sci. Adv. 2016, 2, e1500323. [Google Scholar] [CrossRef]
  11. Li, H.; Zhang, Q.; Singh, V.P.; Shi, P.; Sun, P. Hydrological effects of cropland and climatic changes in arid and semi-arid river basins: A case study from the Yellow River basin, China. J. Hydrol. 2017, 549, 547–557. [Google Scholar] [CrossRef]
  12. Wei, J.; Lei, Y.; Yao, H.; Ge, J.; Wu, S.; Liu, L. Estimation and influencing factors of agricultural water efficiency in the Yellow River basin, China. J. Clean. Prod. 2021, 308, 127249. [Google Scholar] [CrossRef]
  13. Piao, S.; Ciais, P.; Huang, Y.; Shen, Z.; Peng, S.; Li, J.; Zhou, L.; Liu, H.; Ma, Y.; Ding, Y.; et al. The impacts of climate change on water resources and agriculture in China. Nature 2010, 467, 43–51. [Google Scholar] [CrossRef] [PubMed]
  14. Yang, D.; Li, C.; Hu, H.; Lei, Z.; Yang, S.; Kusuda, T.; Koike, T.; Musiake, K. Analysis of water resources variability in the Yellow River of China during the last half century using historical data. Water Resour. Res. 2004, 40, W06502. [Google Scholar] [CrossRef]
  15. Shiau, J.; Feng, S.; Nadarajah, S. Assessment of hydrological droughts for the Yellow River, China, using copulas. Hydrol. Process. 2007, 21, 2157–2163. [Google Scholar] [CrossRef]
  16. Wang, H.; Wu, X.; Bi, N.; Li, S.; Yuan, P.; Wang, A.; Syvitski, J.P.M.; Saito, Y.; Yang, Z.; Liu, S.; et al. Impacts of the dam-orientated water-sediment regulation scheme on the lower reaches and delta of the Yellow River (Huanghe): A review. Glob. Planet. Change 2017, 157, 93–113. [Google Scholar] [CrossRef]
  17. Wang, Y.; Zhao, W.; Wang, S.; Feng, X.; Liu, Y. Yellow River water rebalanced by human regulation. Sci. Rep. 2019, 9, 9707. [Google Scholar] [CrossRef] [PubMed]
  18. Wang, S.; Wang, X. Changes in Water and Sediment Processes in the Yellow River and Their Responses to Ecological Protection during the Last Six Decades. Water 2023, 15, 2285. [Google Scholar] [CrossRef]
  19. Ji, H.; Chen, S.; Jiang, C.; Fan, Y.; Fu, Y.; Li, P.; Liu, F. Damming-Induced Hydrogeomorphic Transition in Downstream Channel and Delta: A Case Study of the Yellow River, China. Water 2022, 14, 2079. [Google Scholar] [CrossRef]
  20. Wang, J.; Shi, B.; Yuan, Q.; Zhao, E.; Bai, T.; Yang, S. Hydro-geomorphological regime of the lower Yellow river and delta in response to the water–sediment regulation scheme: Process, mechanism and implication. Catena 2022, 219, 106646. [Google Scholar] [CrossRef]
  21. Yu, Y.G.; Shi, X.F.; Wang, H.J.; Yue, C.K.; Chen, S.L.; Liu, Y.G.; Hu, L.M.; Qiao, S.Q. Effects of dams on water and sediment delivery to the sea by the Huanghe (Yellow River): The special role of Water-Sediment Modulation. Anthropocene 2013, 3, 72–82. [Google Scholar]
  22. Zhao, Q.; Ding, S.; Ji, X.; Hong, Z.; Lu, M.; Wang, P. Relative Contribution of the Xiaolangdi Dam to Runoff Changes in the Lower Yellow River. Land 2021, 10, 521. [Google Scholar] [CrossRef]
  23. Zhang, X.; Qiao, W.; Lu, Y.; Huang, J.; Xiao, Y. Quantitative Analysis of the Influence of the Xiaolangdi Reservoir on Water and Sediment in the Middle and Lower Reaches of the Yellow River. Int. J. Environ. Res. Public Health 2023, 20, 4351. [Google Scholar] [CrossRef]
  24. Kong, D.; Miao, C.; Duan, Q.; Li, J.; Zheng, H.; Gou, J. Xiaolangdi Dam: A valve for streamflow extremes on the lower Yellow River. J. Hydrol. 2022, 606, 127426. [Google Scholar] [CrossRef]
  25. Xu, J.; Cheng, D. Relation between the erosion and sedimentation zones in the Yellow River, China. Geomorphology 2002, 48, 365–382. [Google Scholar] [CrossRef]
  26. Lu, T.; Wang, H.; Hu, L.; Wu, X.; Bi, N.; Dang, Y.; Assavapanuvat, P.; Bianchi, T.S. Dynamic transport of particulate organic carbon in the Yellow River during dam-orientated Water-Sediment Regulation. Mar. Geol. 2023, 460, 107054. [Google Scholar] [CrossRef]
  27. Sui, J.; Yu, Z.; Jiang, X.; Xu, B. Behavior and budget of dissolved uranium in the lower reaches of the Yellow (Huanghe) River: Impact of Water–Sediment Regulation Scheme. Appl. Geochem. 2015, 61, 1–9. [Google Scholar] [CrossRef]
  28. Kobayashi, D.; Motoyama, H. Effect of Snow Cover on Time Lag of Runoff from a Watershed. Ann. Glaciol. 1985, 6, 123–125. [Google Scholar] [CrossRef]
  29. Wang, Z.Y.; Lin, B. Sediment studies and management strategies in China. Int. J. River Basin Manag. 2004, 2, 39–50. [Google Scholar] [CrossRef]
  30. Cai, Y.; Huang, R.; Xu, J.; Xing, J.; Yi, D. Dynamic Response Characteristics of Shallow Groundwater Level to Hydro-Meteorological Factors and Well Irrigation Water Withdrawals under Different Conditions of Groundwater Buried Depth. Water 2022, 14, 3937. [Google Scholar] [CrossRef]
  31. Sun, Z.; Wang, W.; Li, Y.; Zhang, M.; Shang, H.; Zhang, F. Can the narrowing of the Lower Yellow River by regulation result in non-siltation and even channel scouring? J. Geogr. Sci. 2016, 26, 1337–1348. [Google Scholar] [CrossRef]
  32. Guoying, L. The Yellow River Water and Sediment Regulation. Yellow River 2002, 11, 1–4. [Google Scholar]
  33. Yu, L. The Huanghe (Yellow) River: Recent changes and its countermeasures. Cont. Shelf Res. 2006, 26, 2281–2298. [Google Scholar] [CrossRef]
  34. Liu, Y.; Lin, Y.; Huo, Z.; Zhang, C.; Wang, C.; Xue, J.; Huang, G. Spatio-temporal variation of irrigation water requirements for wheat and maize in the Yellow River Basin, China, 1974–2017. Agric. Water Manag. 2022, 262, 107451. [Google Scholar] [CrossRef]
  35. Nakayama, T. Simulation of the effect of irrigation on the hydrologic cycle in the highly cultivated Yellow River Basin. Agric. For. Meteorol. 2011, 151, 314–327. [Google Scholar] [CrossRef]
  36. Matson, P.A.; Parton, W.J.; Power, A.G.; Swift, M.J. Agricultural intensification and ecosystem properties. Science 1997, 277, 504–509. [Google Scholar] [CrossRef]
  37. Chen, J.; He, D.; Cui, S. The response of river water quality and quantity to the development of irrigated agriculture in the last 4 decades in the Yellow River Basin, China. Water Resour. Res. 2003, 39, 1047. [Google Scholar] [CrossRef]
  38. Wang, G.; Zhang, J.; Jin, J.; Weinberg, J.; Bao, Z.; Liu, C.; Liu, Y.; Yan, X.; Song, X.; Zhai, R. Impacts of climate change on water resources in the Yellow River basin and identification of global adaptation strategies. Mitig. Adapt. Strateg. Glob. Change 2017, 22, 67–83. [Google Scholar] [CrossRef]
  39. Zhang, Q.; Liu, J.; Singh, V.P.; Shi, P.; Sun, P. Hydrological responses to climatic changes in the Yellow River basin, China: Climatic elasticity and streamflow prediction. J. Hydrol. 2017, 554, 635–645. [Google Scholar] [CrossRef]
  40. Wang, T.; Zhao, Y.; Xu, C.; Ciais, P.; Liu, D.; Yang, H.; Piao, S.; Yao, T. Atmospheric dynamic constraints on Tibetan Plateau freshwater under Paris climate targets. Nat. Clim. Change 2021, 11, 219–225. [Google Scholar] [CrossRef]
  41. Liu, B.; Wang, B.; Chen, Z.; Zhang, W. Effect of Time of Once Irrigation in Spring on Yield and Growth Characteristics of Winter Wheat. J. Irrig. Drain. 2021, 40, 122–128. [Google Scholar] [CrossRef]
  42. Johnson, K.M.; Jordan, G.J.; Brodribb, T.J. Wheat leaves embolized by water stress do not recover function upon rewatering. Plant Cell Environ. 2018, 41, 2704–2714. (In Chinese) [Google Scholar] [CrossRef] [PubMed]
  43. Wang, Z.-Y.; Plate, E. Recent flood disasters in China. Proc. Inst. Civ. Eng.-Water Marit. Eng. 2002, 154, 177–188. [Google Scholar] [CrossRef]
  44. Wang, Z.-Y.; Lee, J.H.; Melching, C.S.; Wang, Z.-Y.; Lee, J.H.; Melching, C.S. Flood defense and water/sediment management—With particular reference to the Yellow River. In River Dynamics and Integrated River Management; Springer: Berlin/Heidelberg, Germany, 2015; pp. 337–395. [Google Scholar]
  45. Kong, D.; Latrubesse, E.M.; Miao, C.; Zhou, R. Morphological response of the Lower Yellow River to the operation of Xiaolangdi Dam, China. Geomorphology 2020, 350, 106931. [Google Scholar] [CrossRef]
  46. Kong, D.; Miao, C.; Wu, J.; Duan, Q.; Sun, Q.; Ye, A.; Di, Z.; Gong, W. The hydro-environmental response on the lower Yellow River to the water–sediment regulation scheme. Ecol. Eng. 2015, 79, 69–79. [Google Scholar] [CrossRef]
Figure 1. Location of the lower Yellow River and the key hydrological stations. Insert shows the location of the Yellow River basin.
Water 16 00078 g001
Figure 2. (a) Typical hydrological regime of a high streamflow event; (b) Schematic diagrams of three typical types of high streamflow event.
Water 16 00078 g002
Figure 3. Schematic illustration of two time lag detection methods. (a) Peak spacing method; (b) Optimal correlation coefficient method.
Water 16 00078 g003
Figure 4. (a) Daily discharge measured at Xiaolangdi station from 1997 to 2020; (b) Distribution of the 59 high streamflow events from 1997 to 2020.
Water 16 00078 g004
Figure 5. Correlation coefficient of the streamflow at Gaocun station (a), Aishan station (b), and Lijin station (c) with that in Xiaolangdi station during the total 59 high streamflow events.
Water 16 00078 g005
Figure 6. The determined time lags of streamflow at Gaocun (a), Aishan (b), and Lijin (c) stations relative to that at Xiaolangdi station. Results obtained by both two methods are plotted for comparison.
Water 16 00078 g006
Figure 7. Relationship between streamflow in LYR and Xiaolangdi station without (a) and with (b) time lag correction.
Water 16 00078 g007
Figure 8. Relationship between time lag at Lijin station and streamflow features at Xiaolangdi station. (a) Initial streamflow value of high streamflow events; (b) Terminal streamflow value of high streamflow events; (c) Peak streamflow value of high streamflow events; (d) Mean streamflow value of high streamflow events.
Water 16 00078 g008
Figure 9. Average time lag as function of distance from Xiaolangdi station.
Water 16 00078 g009
Disclaimer/Publisher’s Note: The statements, opinions and data contained in all publications are solely those of the individual author(s) and contributor(s) and not of MDPI and/or the editor(s). MDPI and/or the editor(s) disclaim responsibility for any injury to people or property resulting from any ideas, methods, instructions or products referred to in the content.

