
Assessment of Groundwater Vulnerability to Seawater Intrusion Using GALDIT, SITE and SIVI Methods in Laspias River Coastal Aquifer System, NE Greece

 ,
,  , and
, and
Abstract
1. Introduction
2. Material and Methods
- –
- The Na+/Cl− ratio is related to groundwater salinization and seawater intrusion or to the existence of residual saline deposits within the aquifer [32]. The north part and the south coastal part of the area are considered problematic, as groundwater has undergone salinization (Na+/Cl− < 0.876 ± 10%).
- –
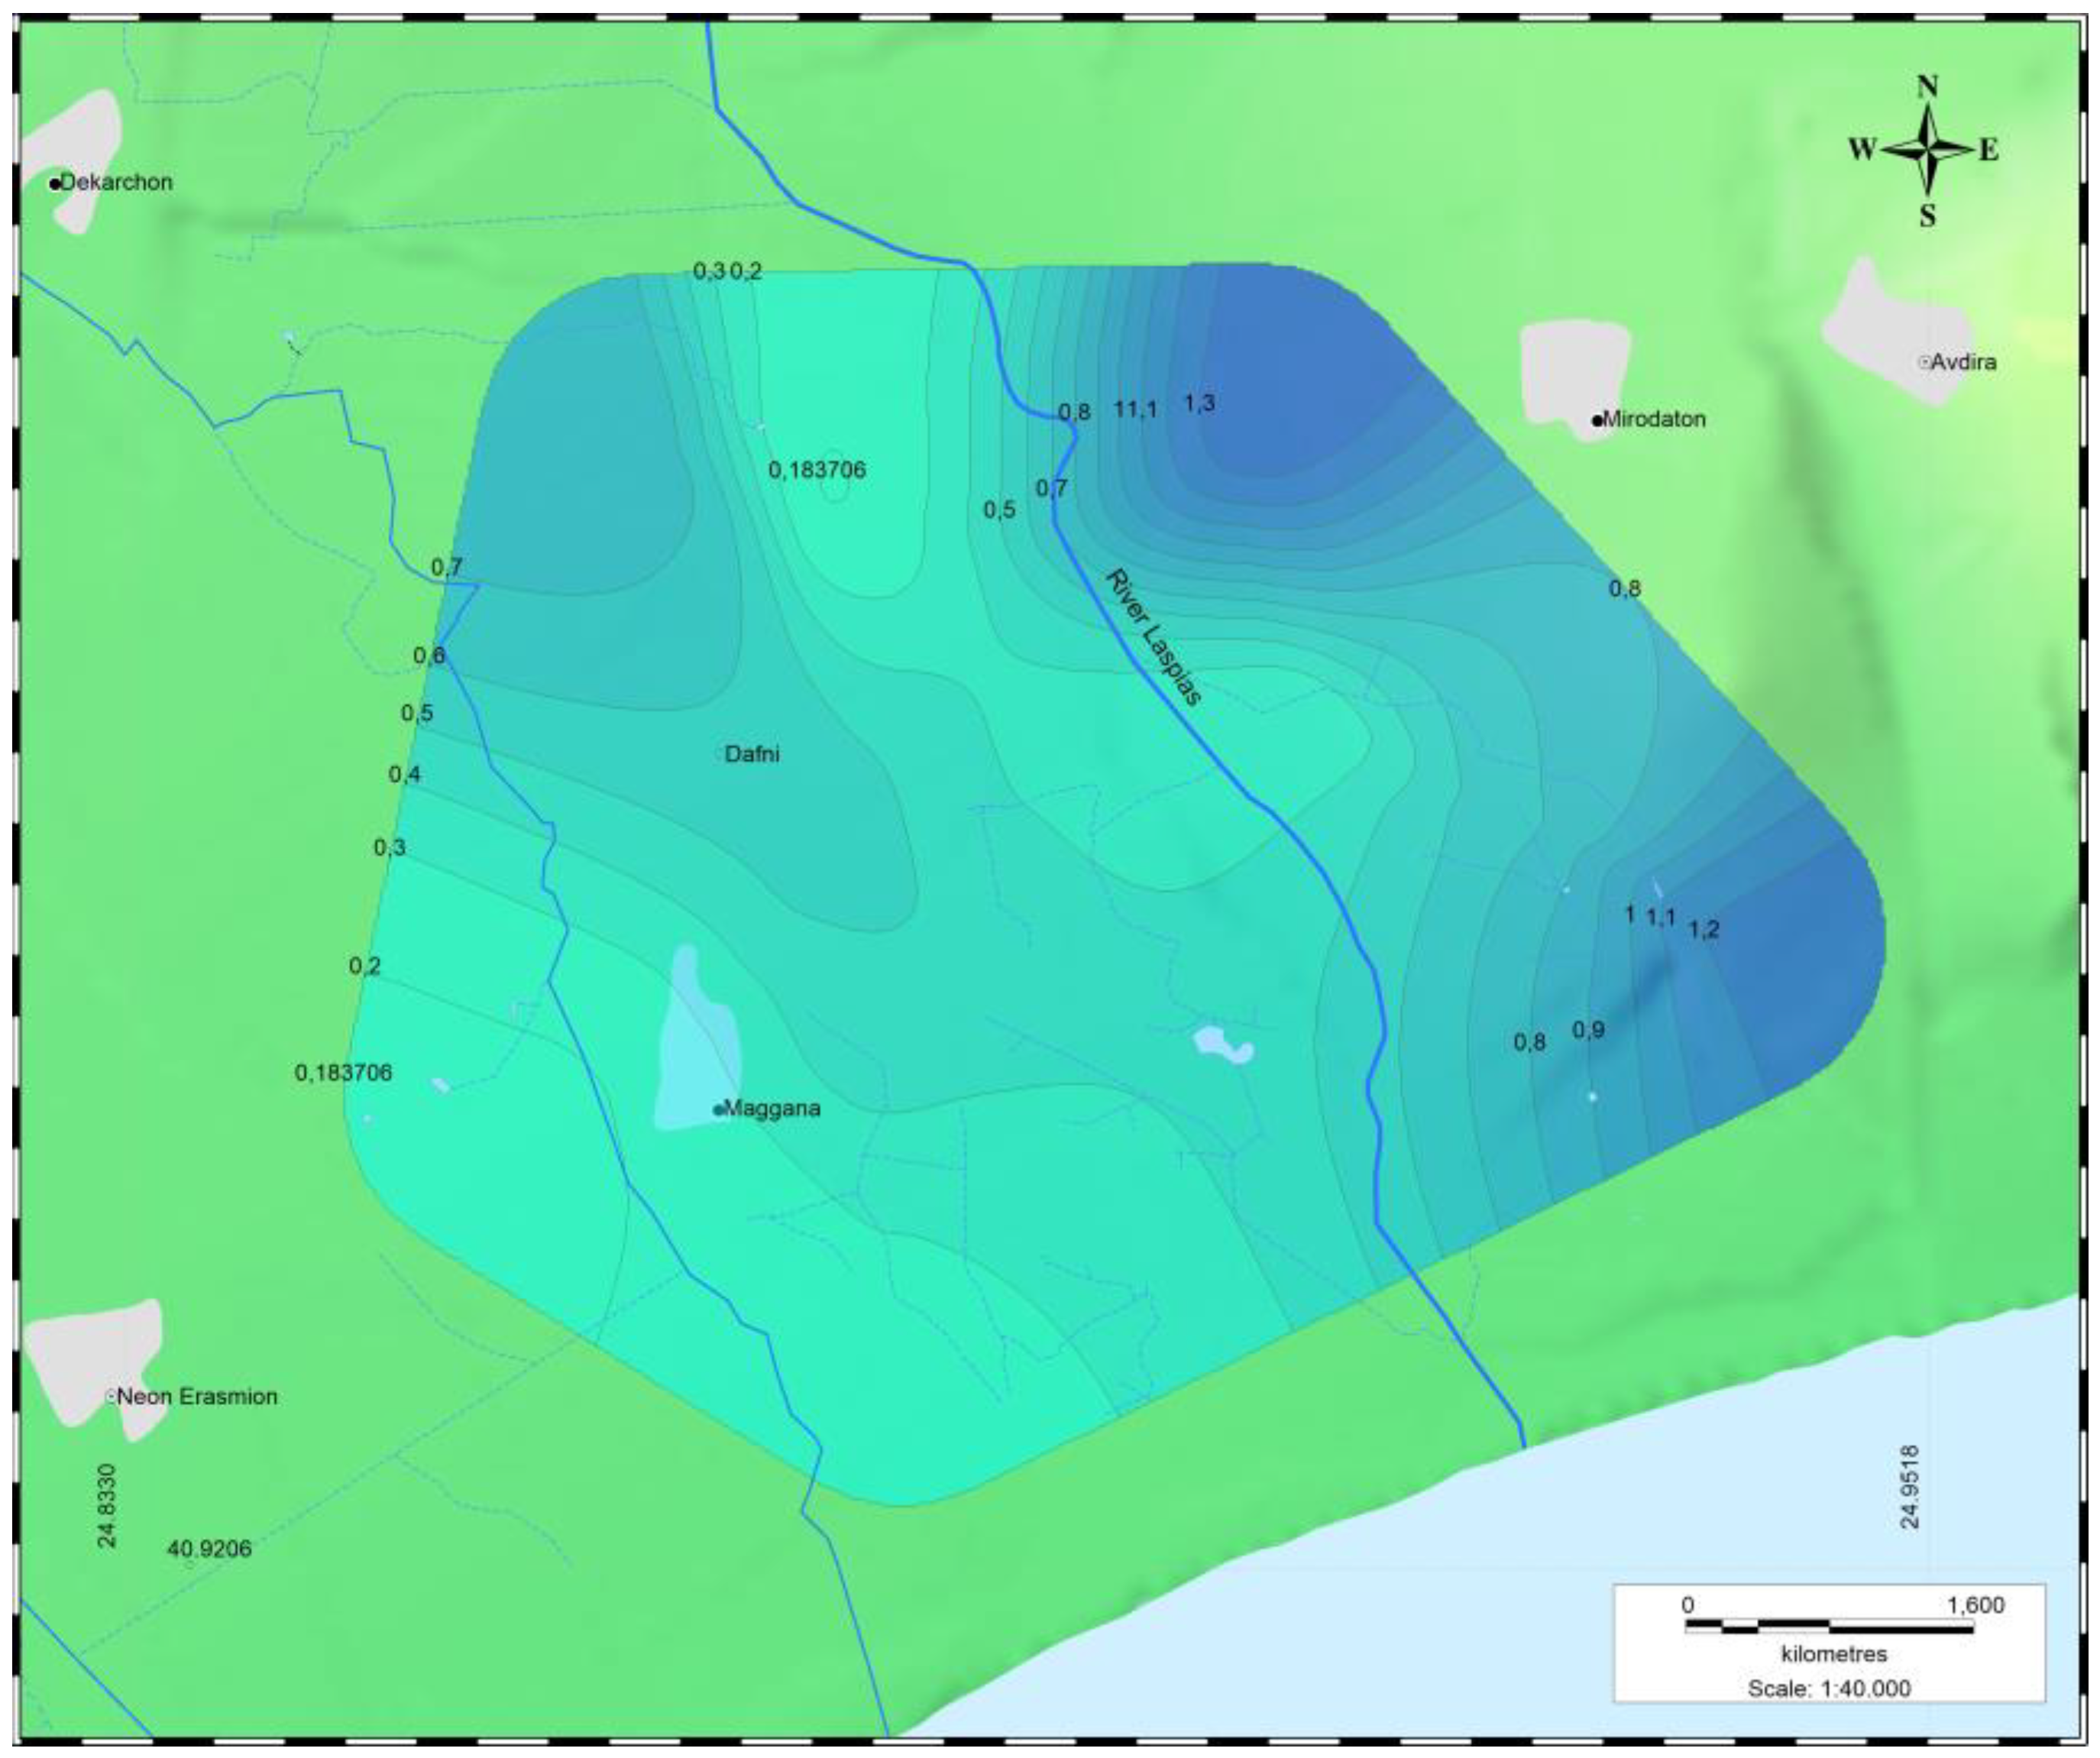
- The SO42−/Cl− ratio demonstrates the evolution of the salinity of aquifers and is also used to investigate the hydrochemical conditions of coastal aquifers [32]. In the north and the S-SW coastal section of the aquifer, it appears that groundwater is chlorinated or of seawater origin (SO42−/Cl− = 0.1–0.2).
- –
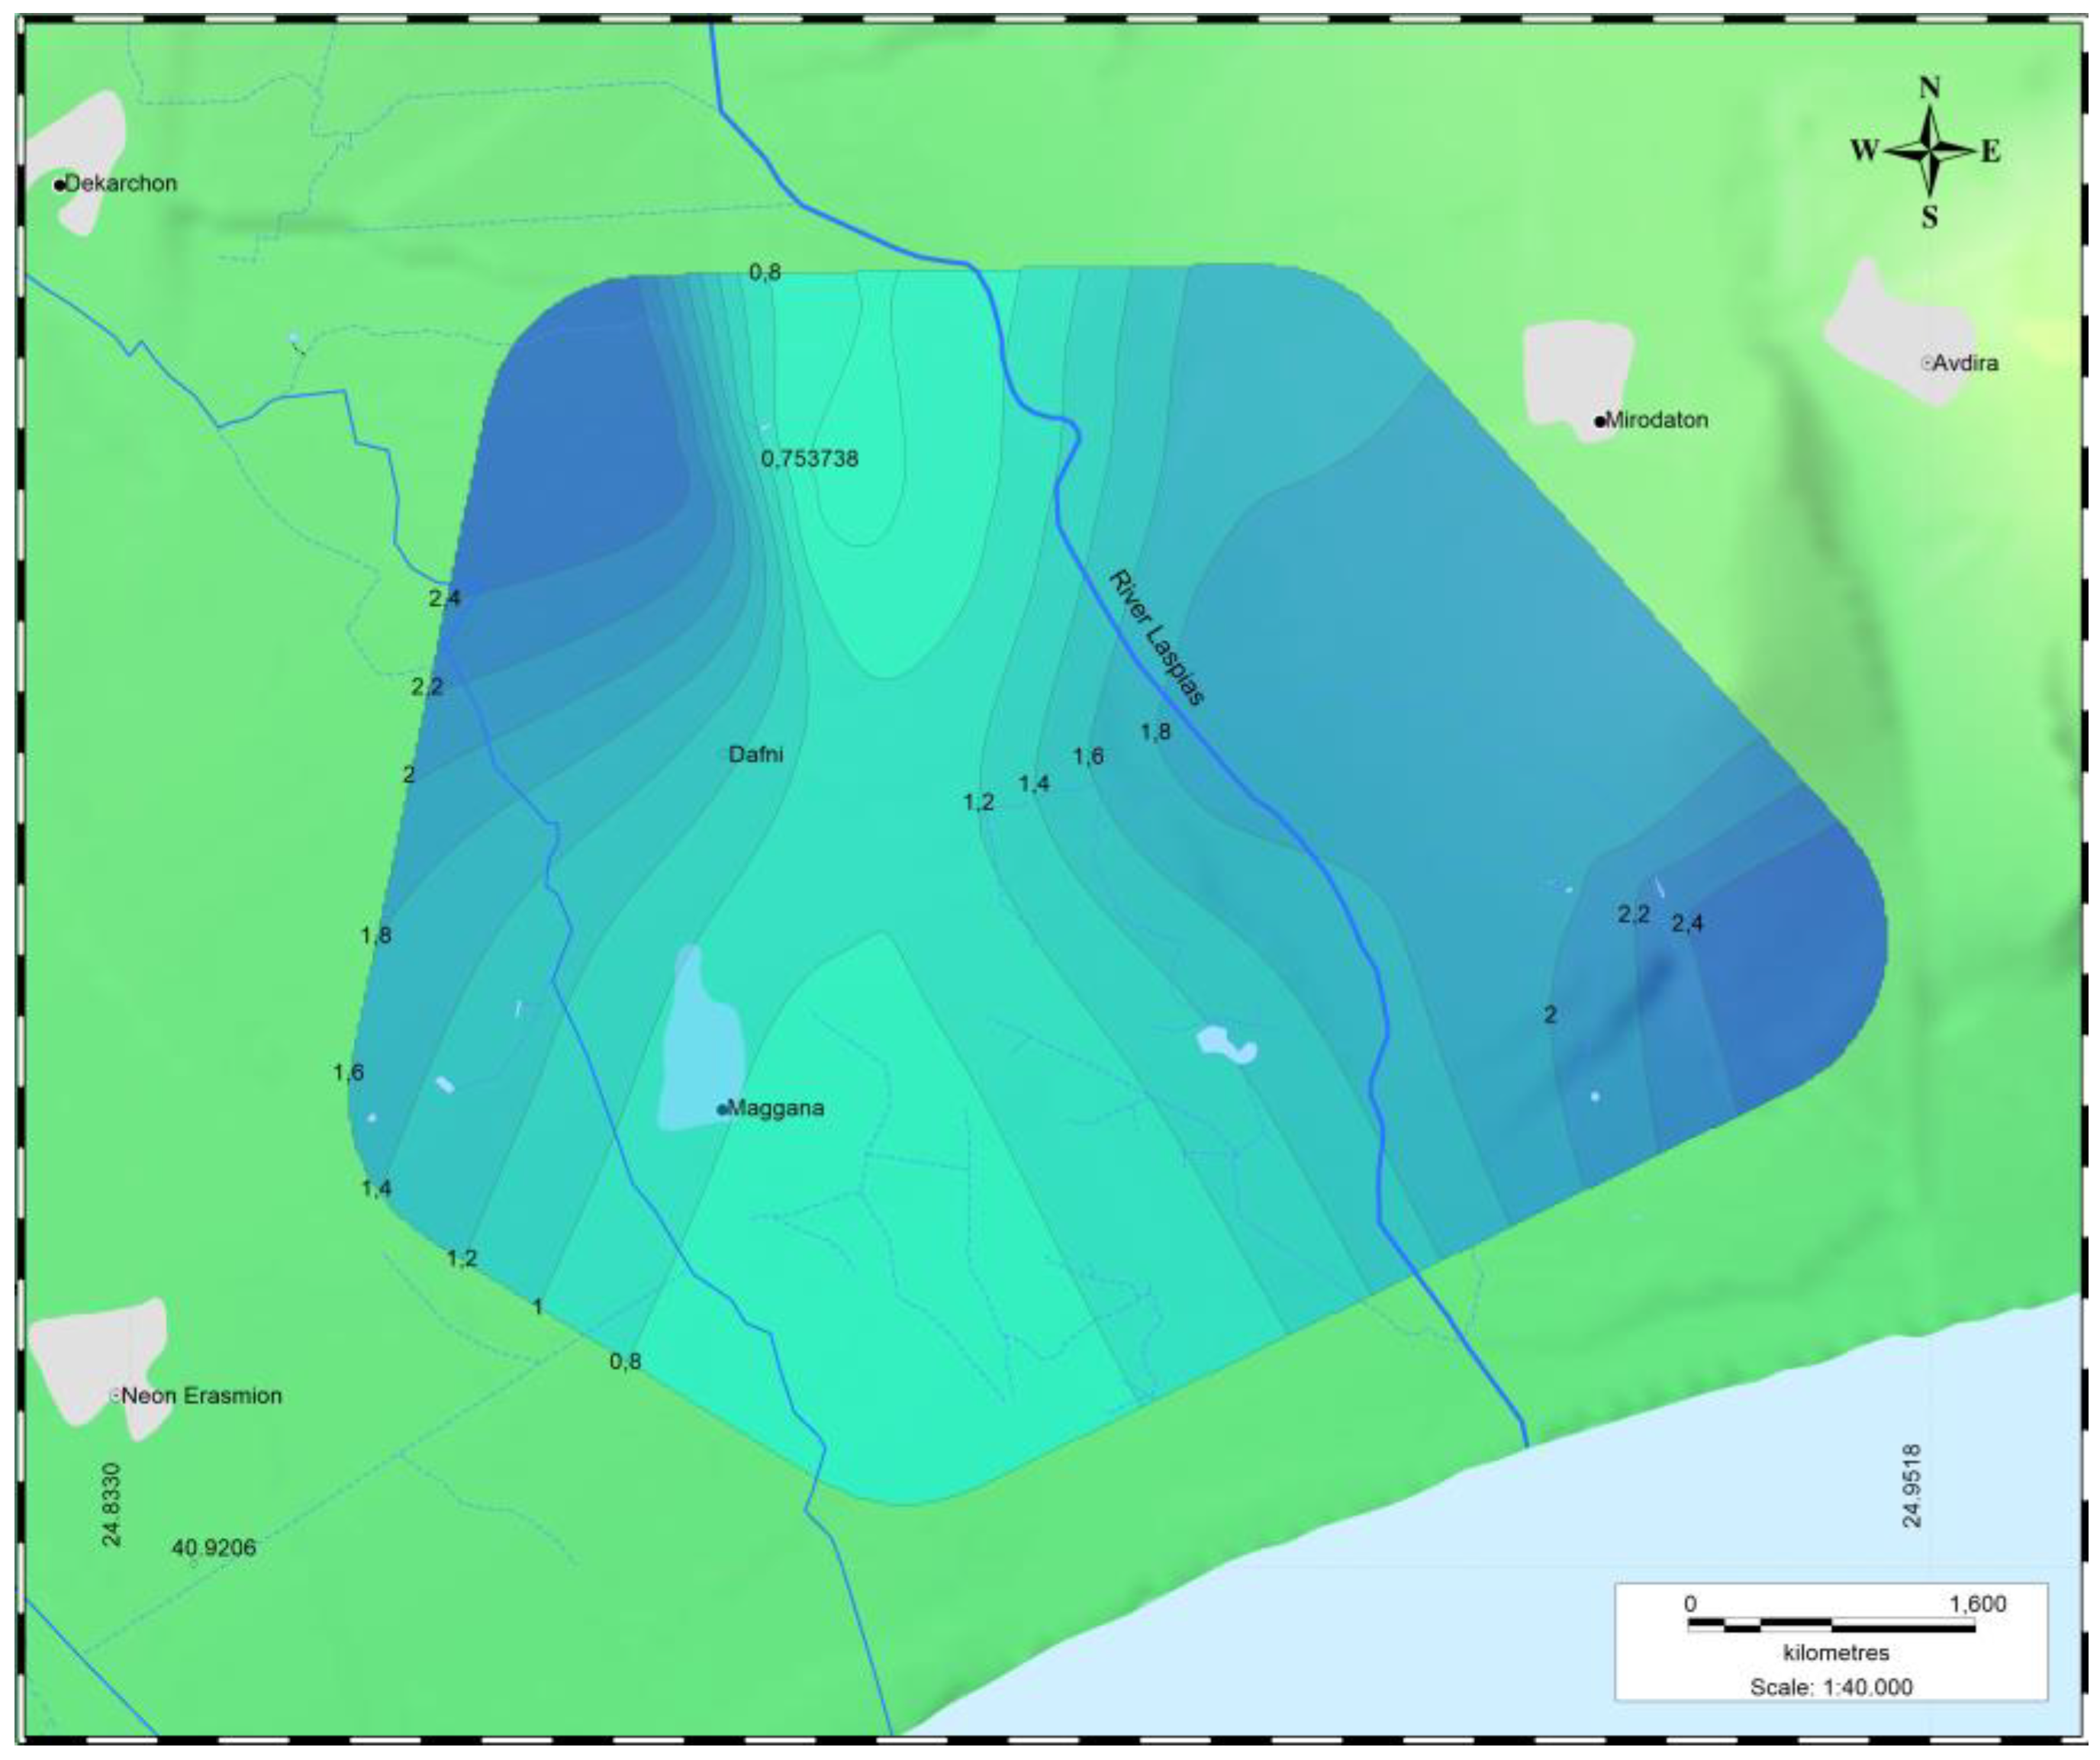
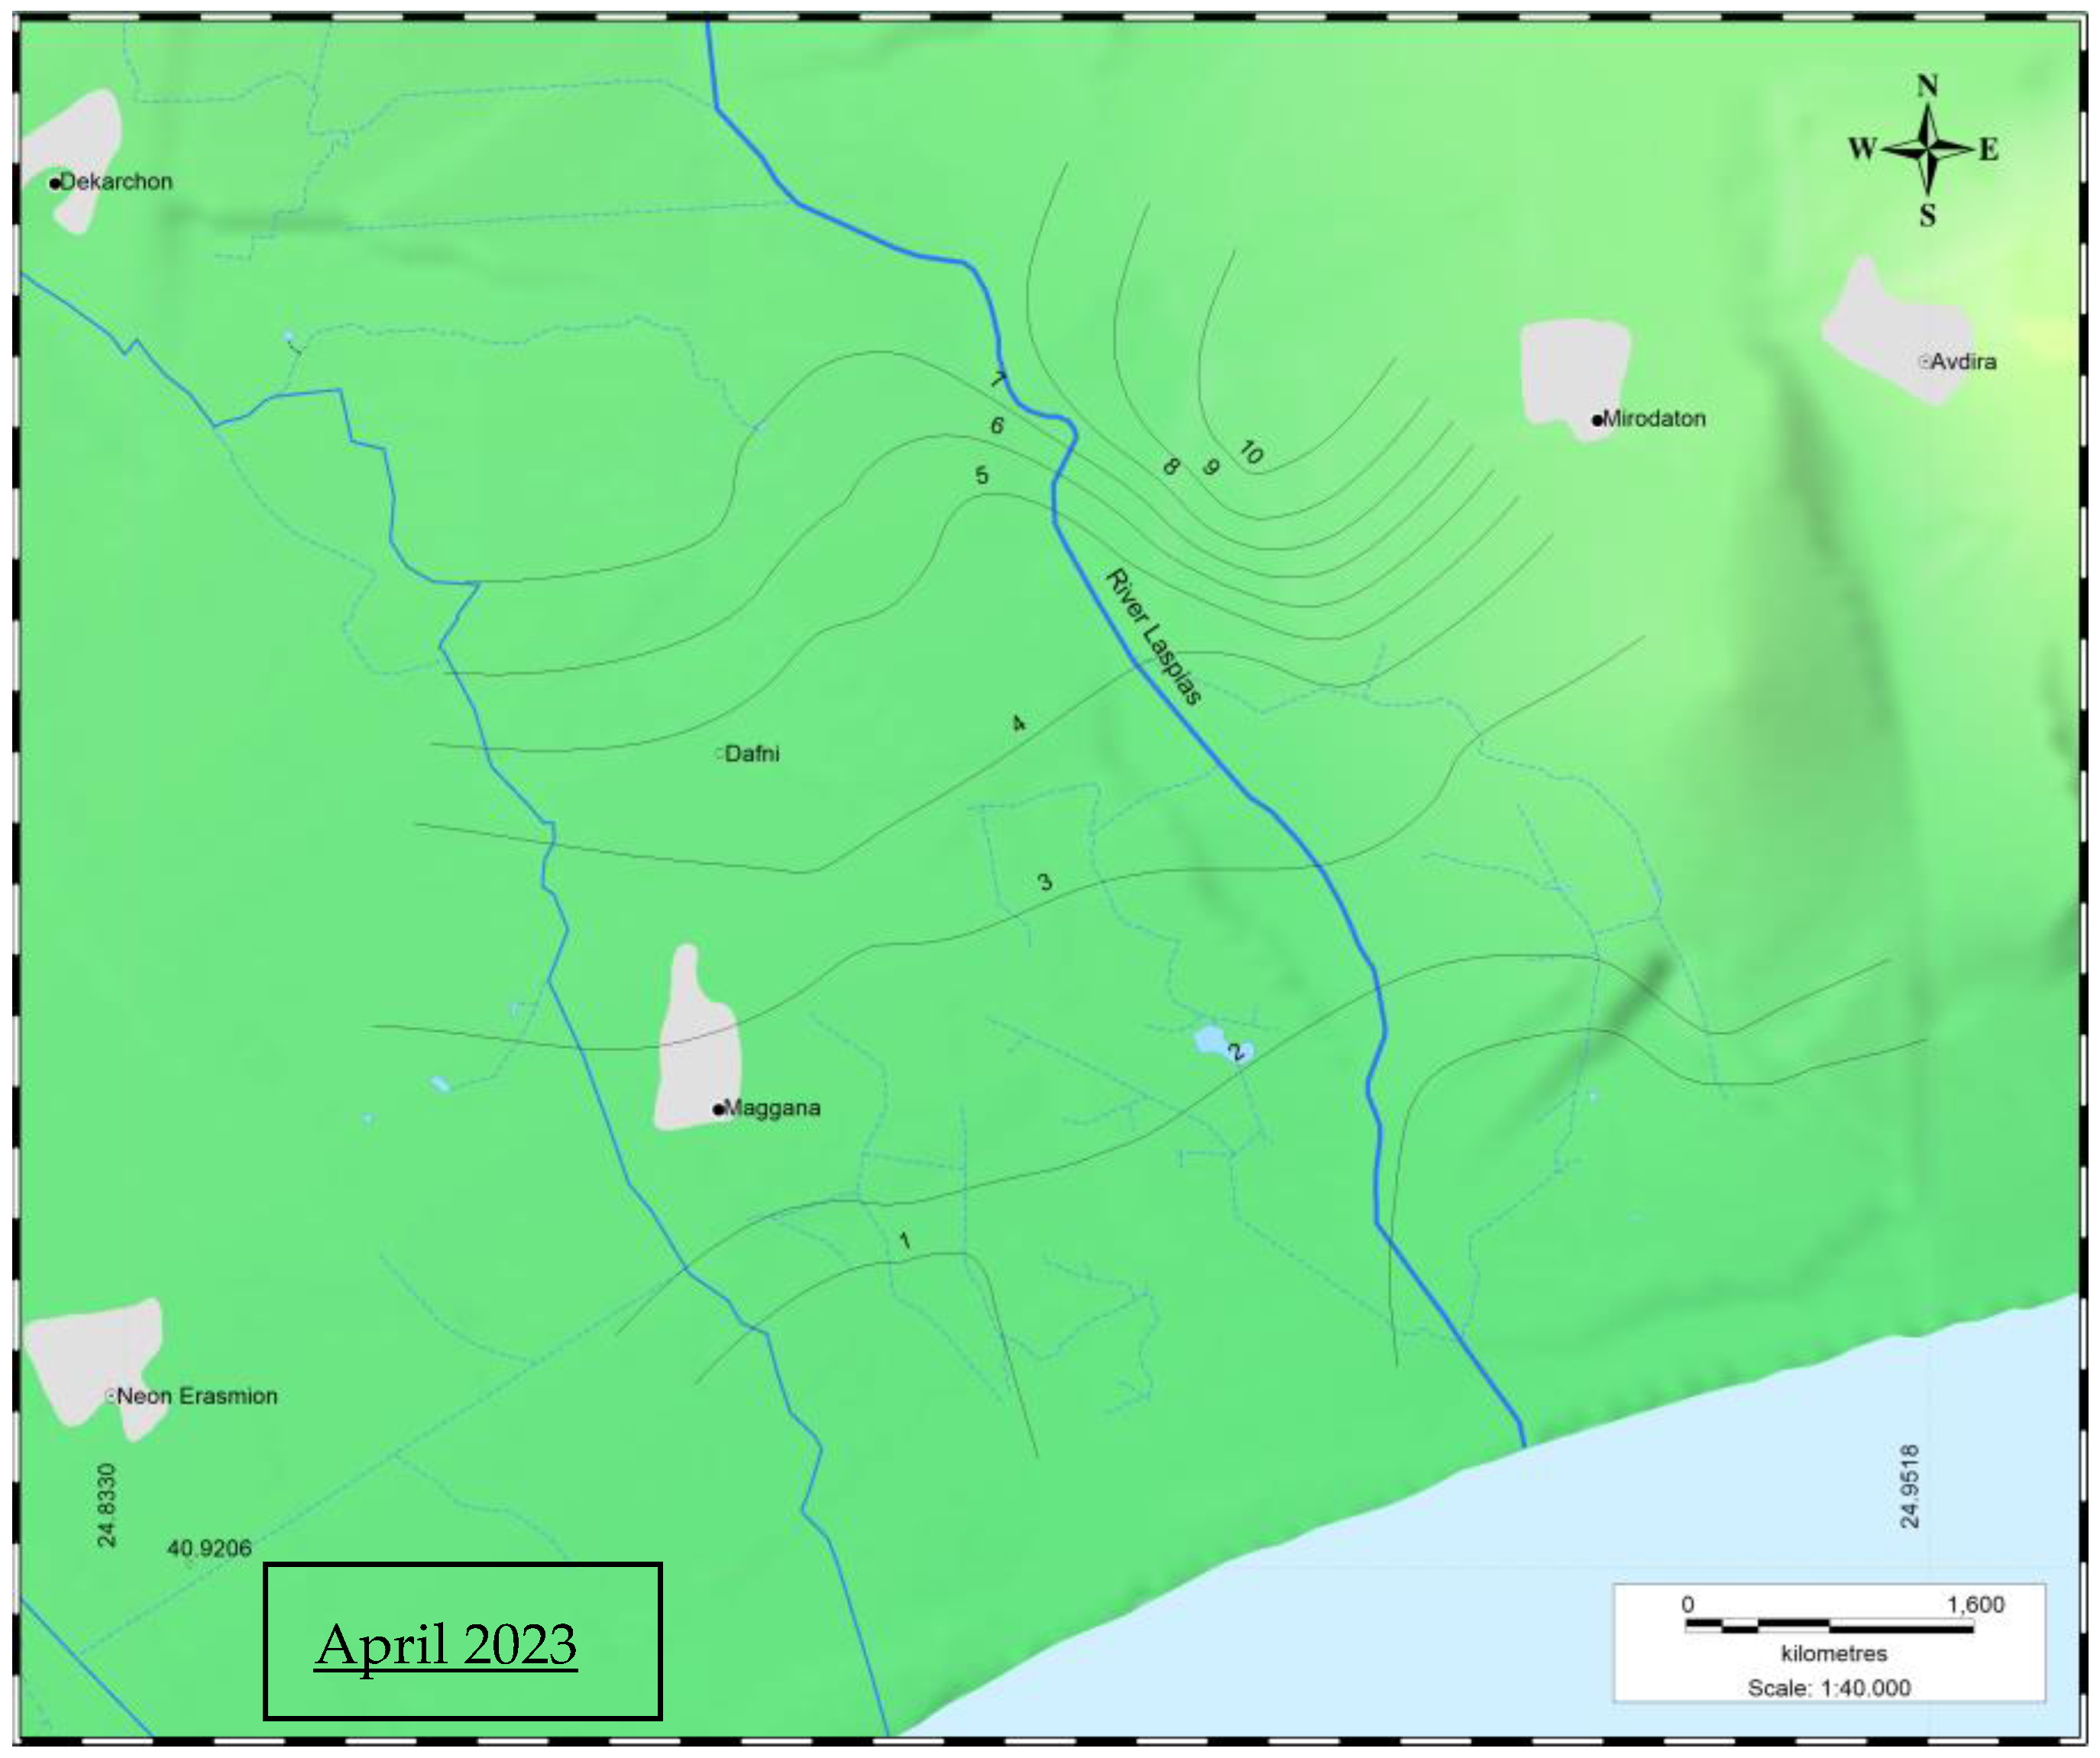
- The ionic ratio (Ca2++Mg2+)/(Na++K+) is related to groundwater recharge and gives information about the areas where the groundwater is recharged [27]. Noticeable inflows from the west and the north are detected (Ca2++Mg2+)/(Na++K+ > 1), a finding which is also confirmed in the piezometric maps in Figure 4. Sections of low recharge are located in the S and SW coastal sections.

3. Results and Discussion
- –
- Reference value (higher acceptable value) Vr = 250 mg/L (Ministerial Decision 1811/2011—Official Gazette 3322/B′ 30 December 2011).
- –
- –
- The denominators of Equations (9) and (10) (Table 1) have the values 30 and 28, respectively, because these are the maximum values that the SITE and SIVI indices can take.
- –
- –
- –
- –
- –
- There is a relative identification of the parts of greater vulnerability with the parts of moderate pollution from seawater intrusion and with the parts with increased chloride concentration values. This is a strong piece of evidence in highlighting the reliability of the effort to assess groundwater vulnerability of the study area to seawater intrusion with the SITE and SIVI methods.
- –
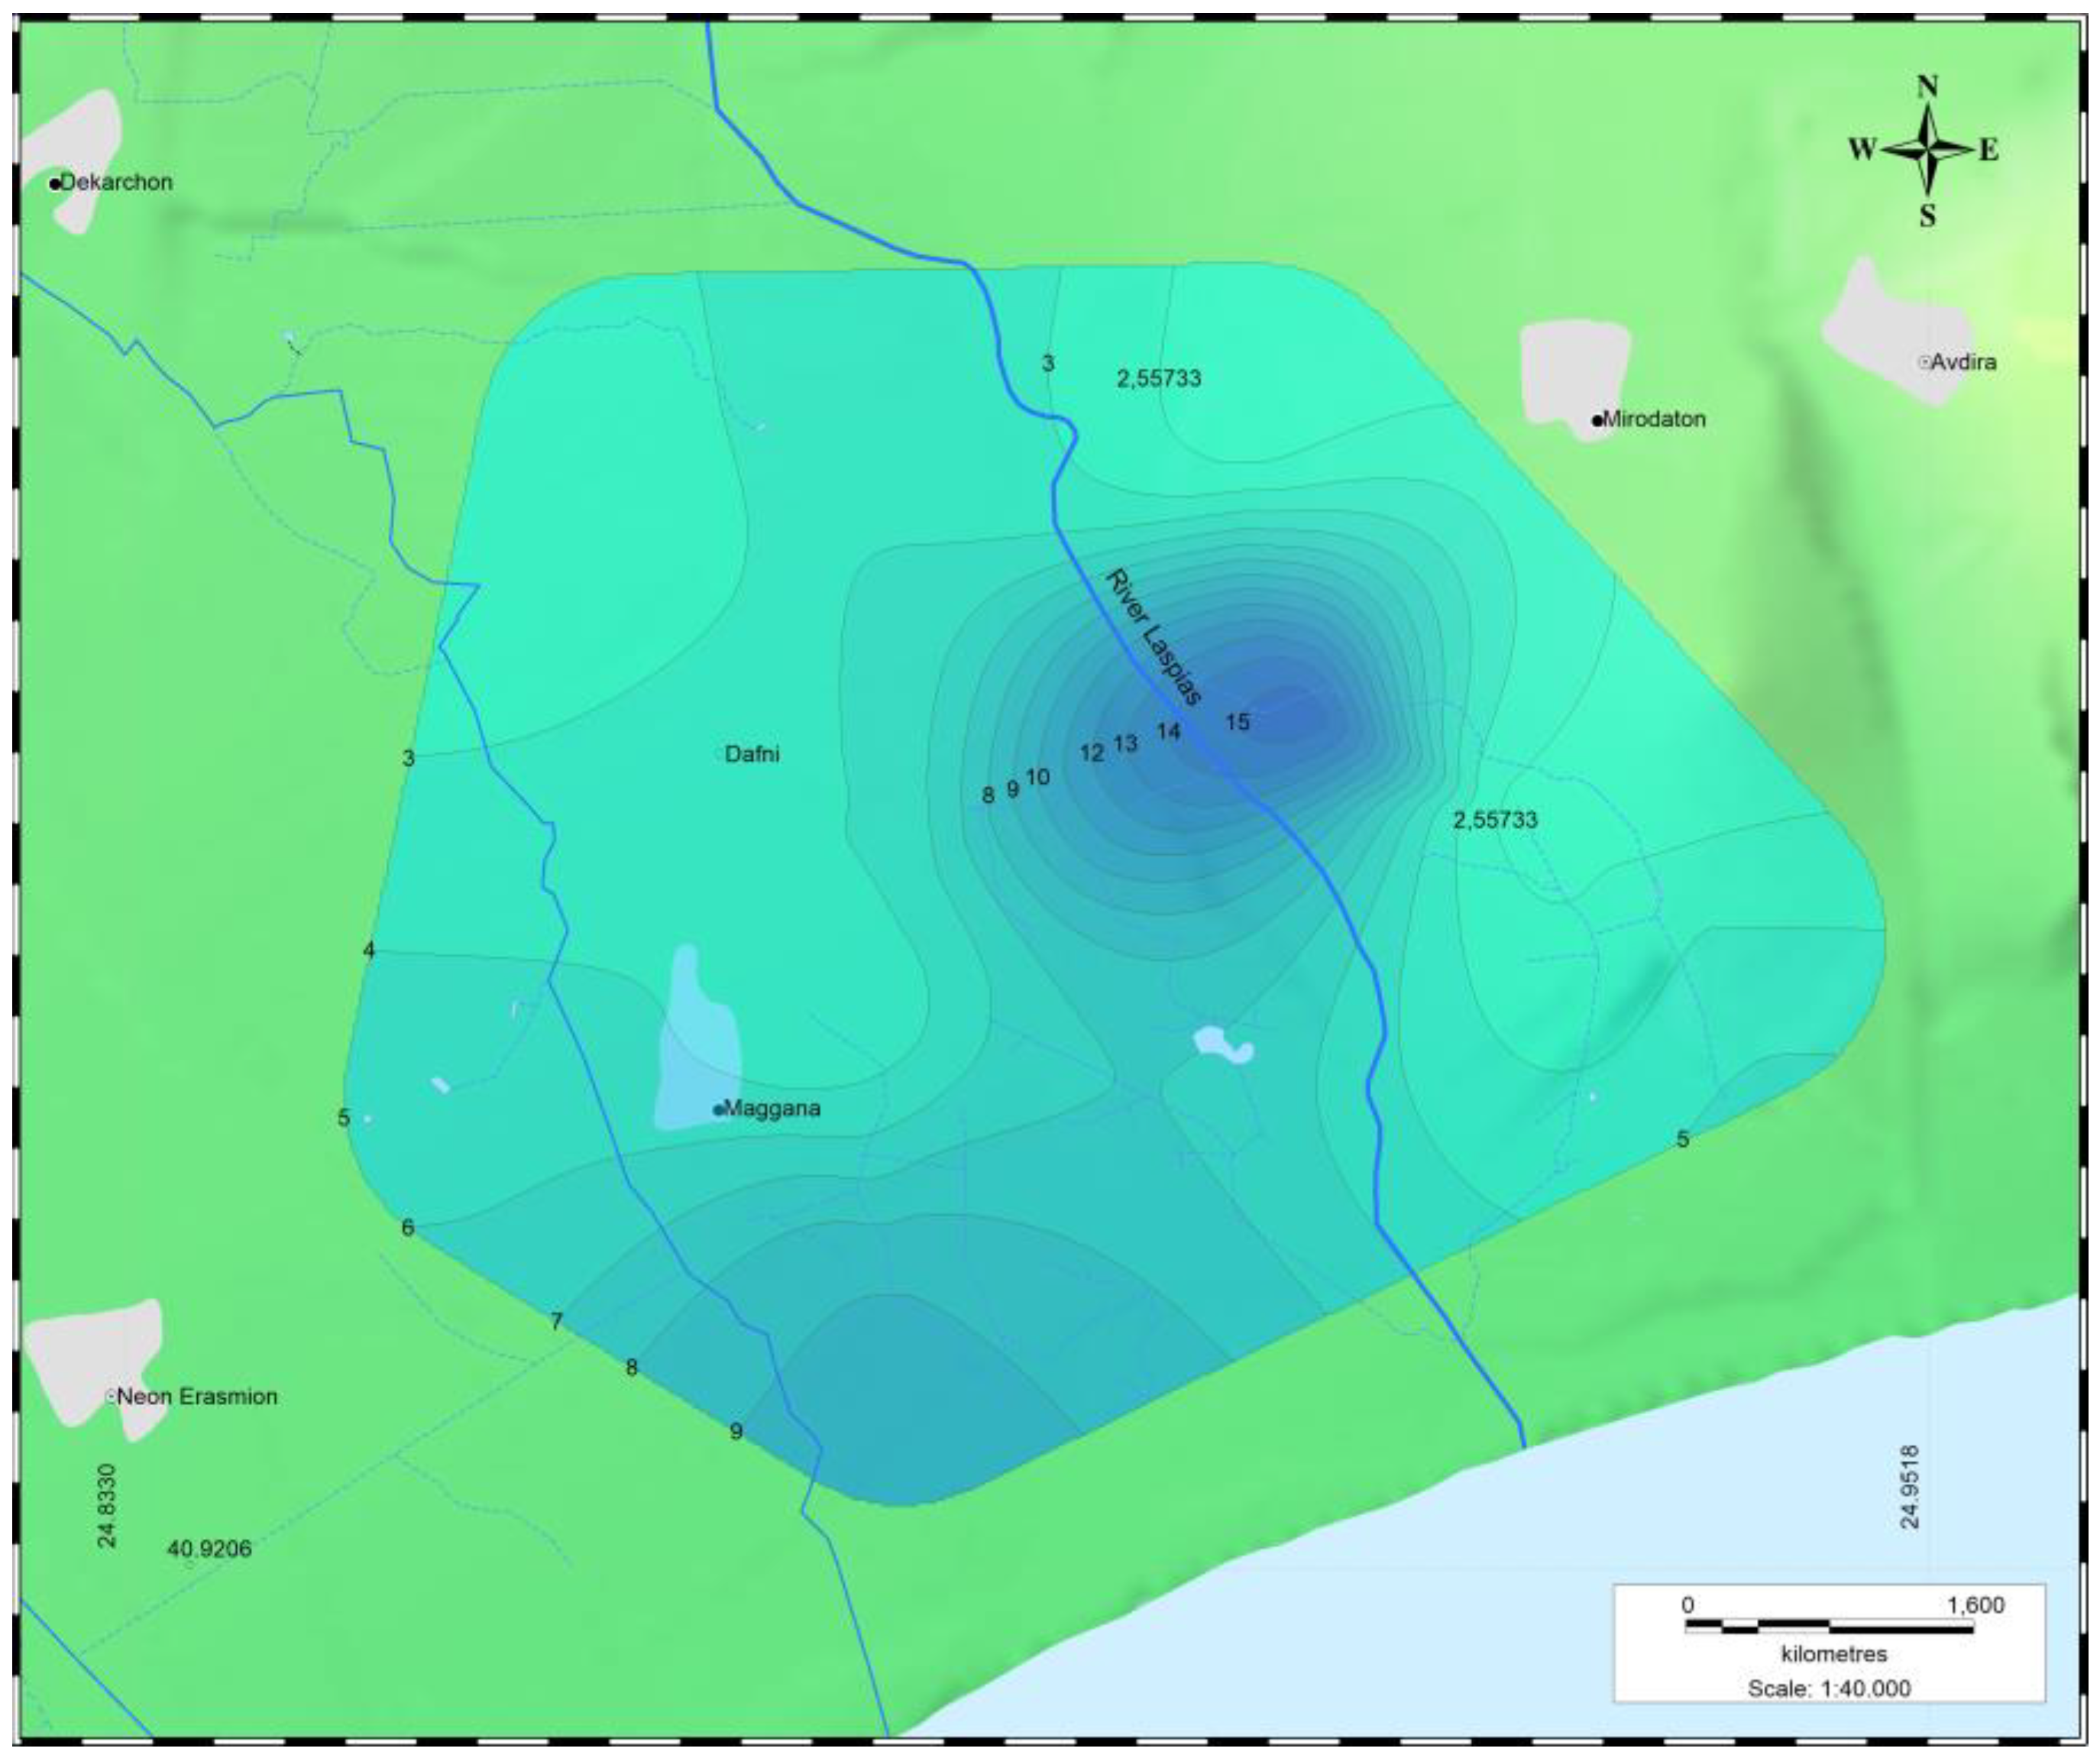
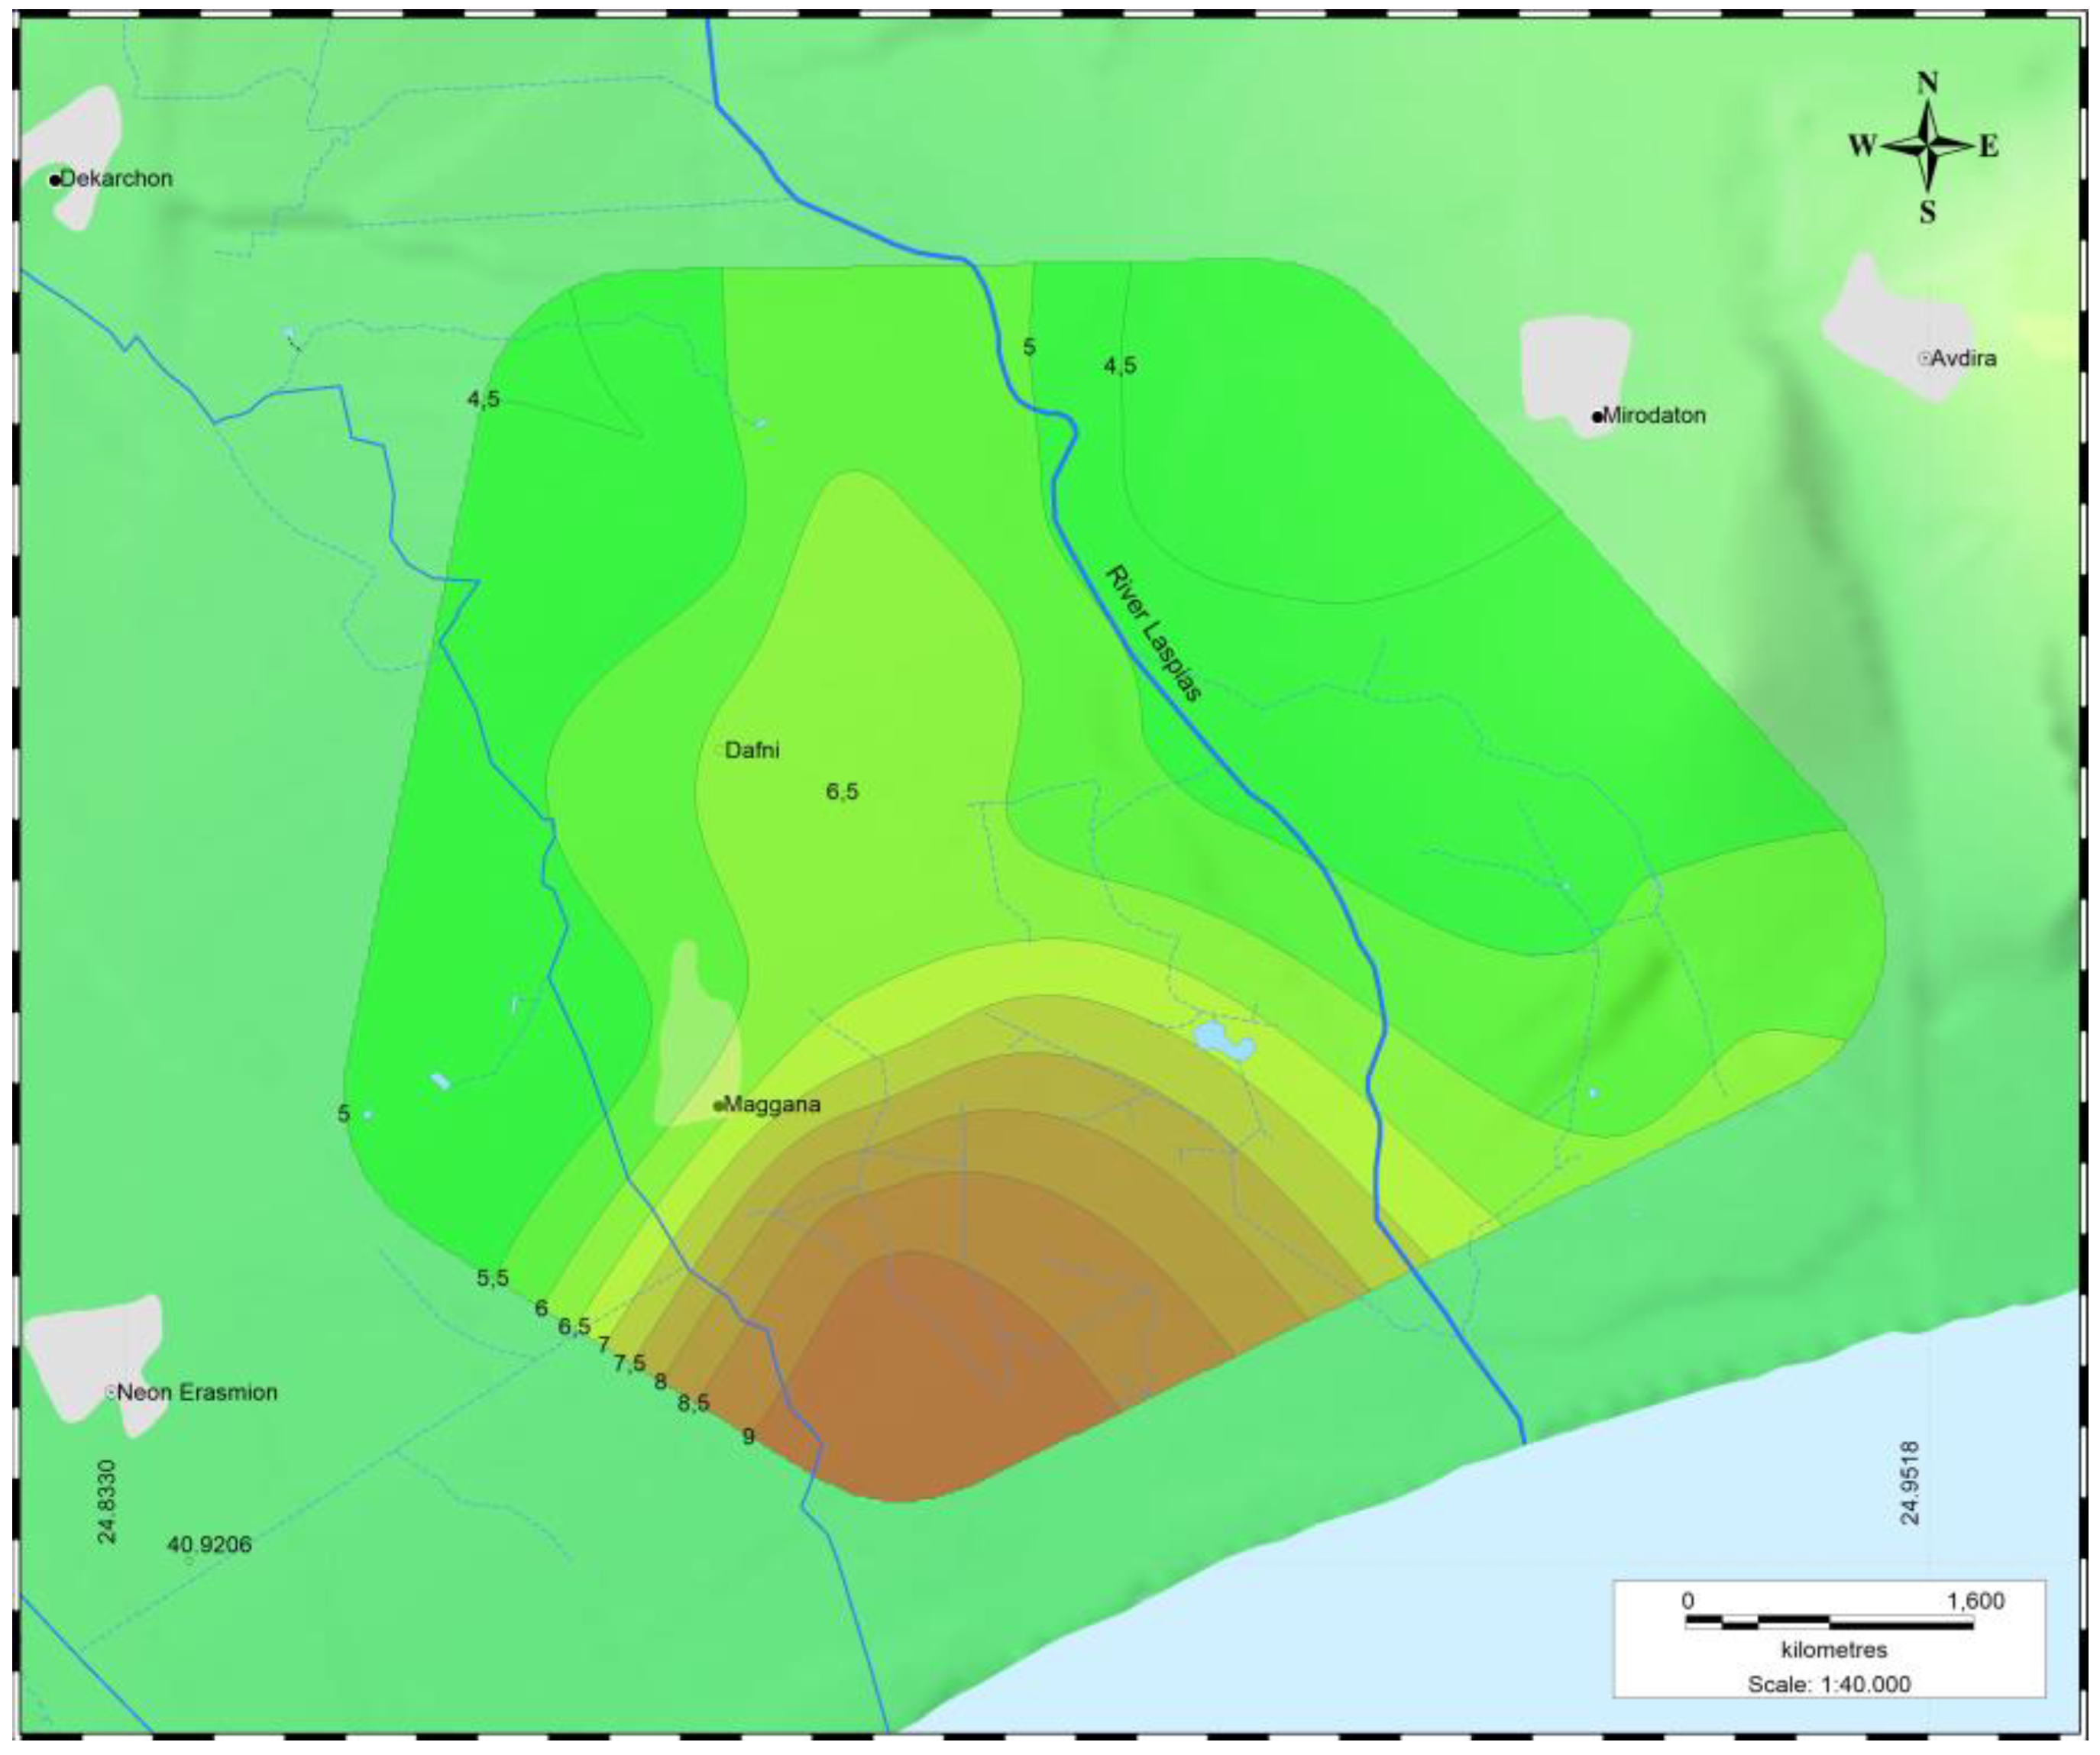
- It is found that, in April and October 2023, the values of the SIVI index increased towards the southeast part, with a maximum value of 0.50, while the values decreased towards the east part and the north NW part, with a minimum value of 0.14.
- –
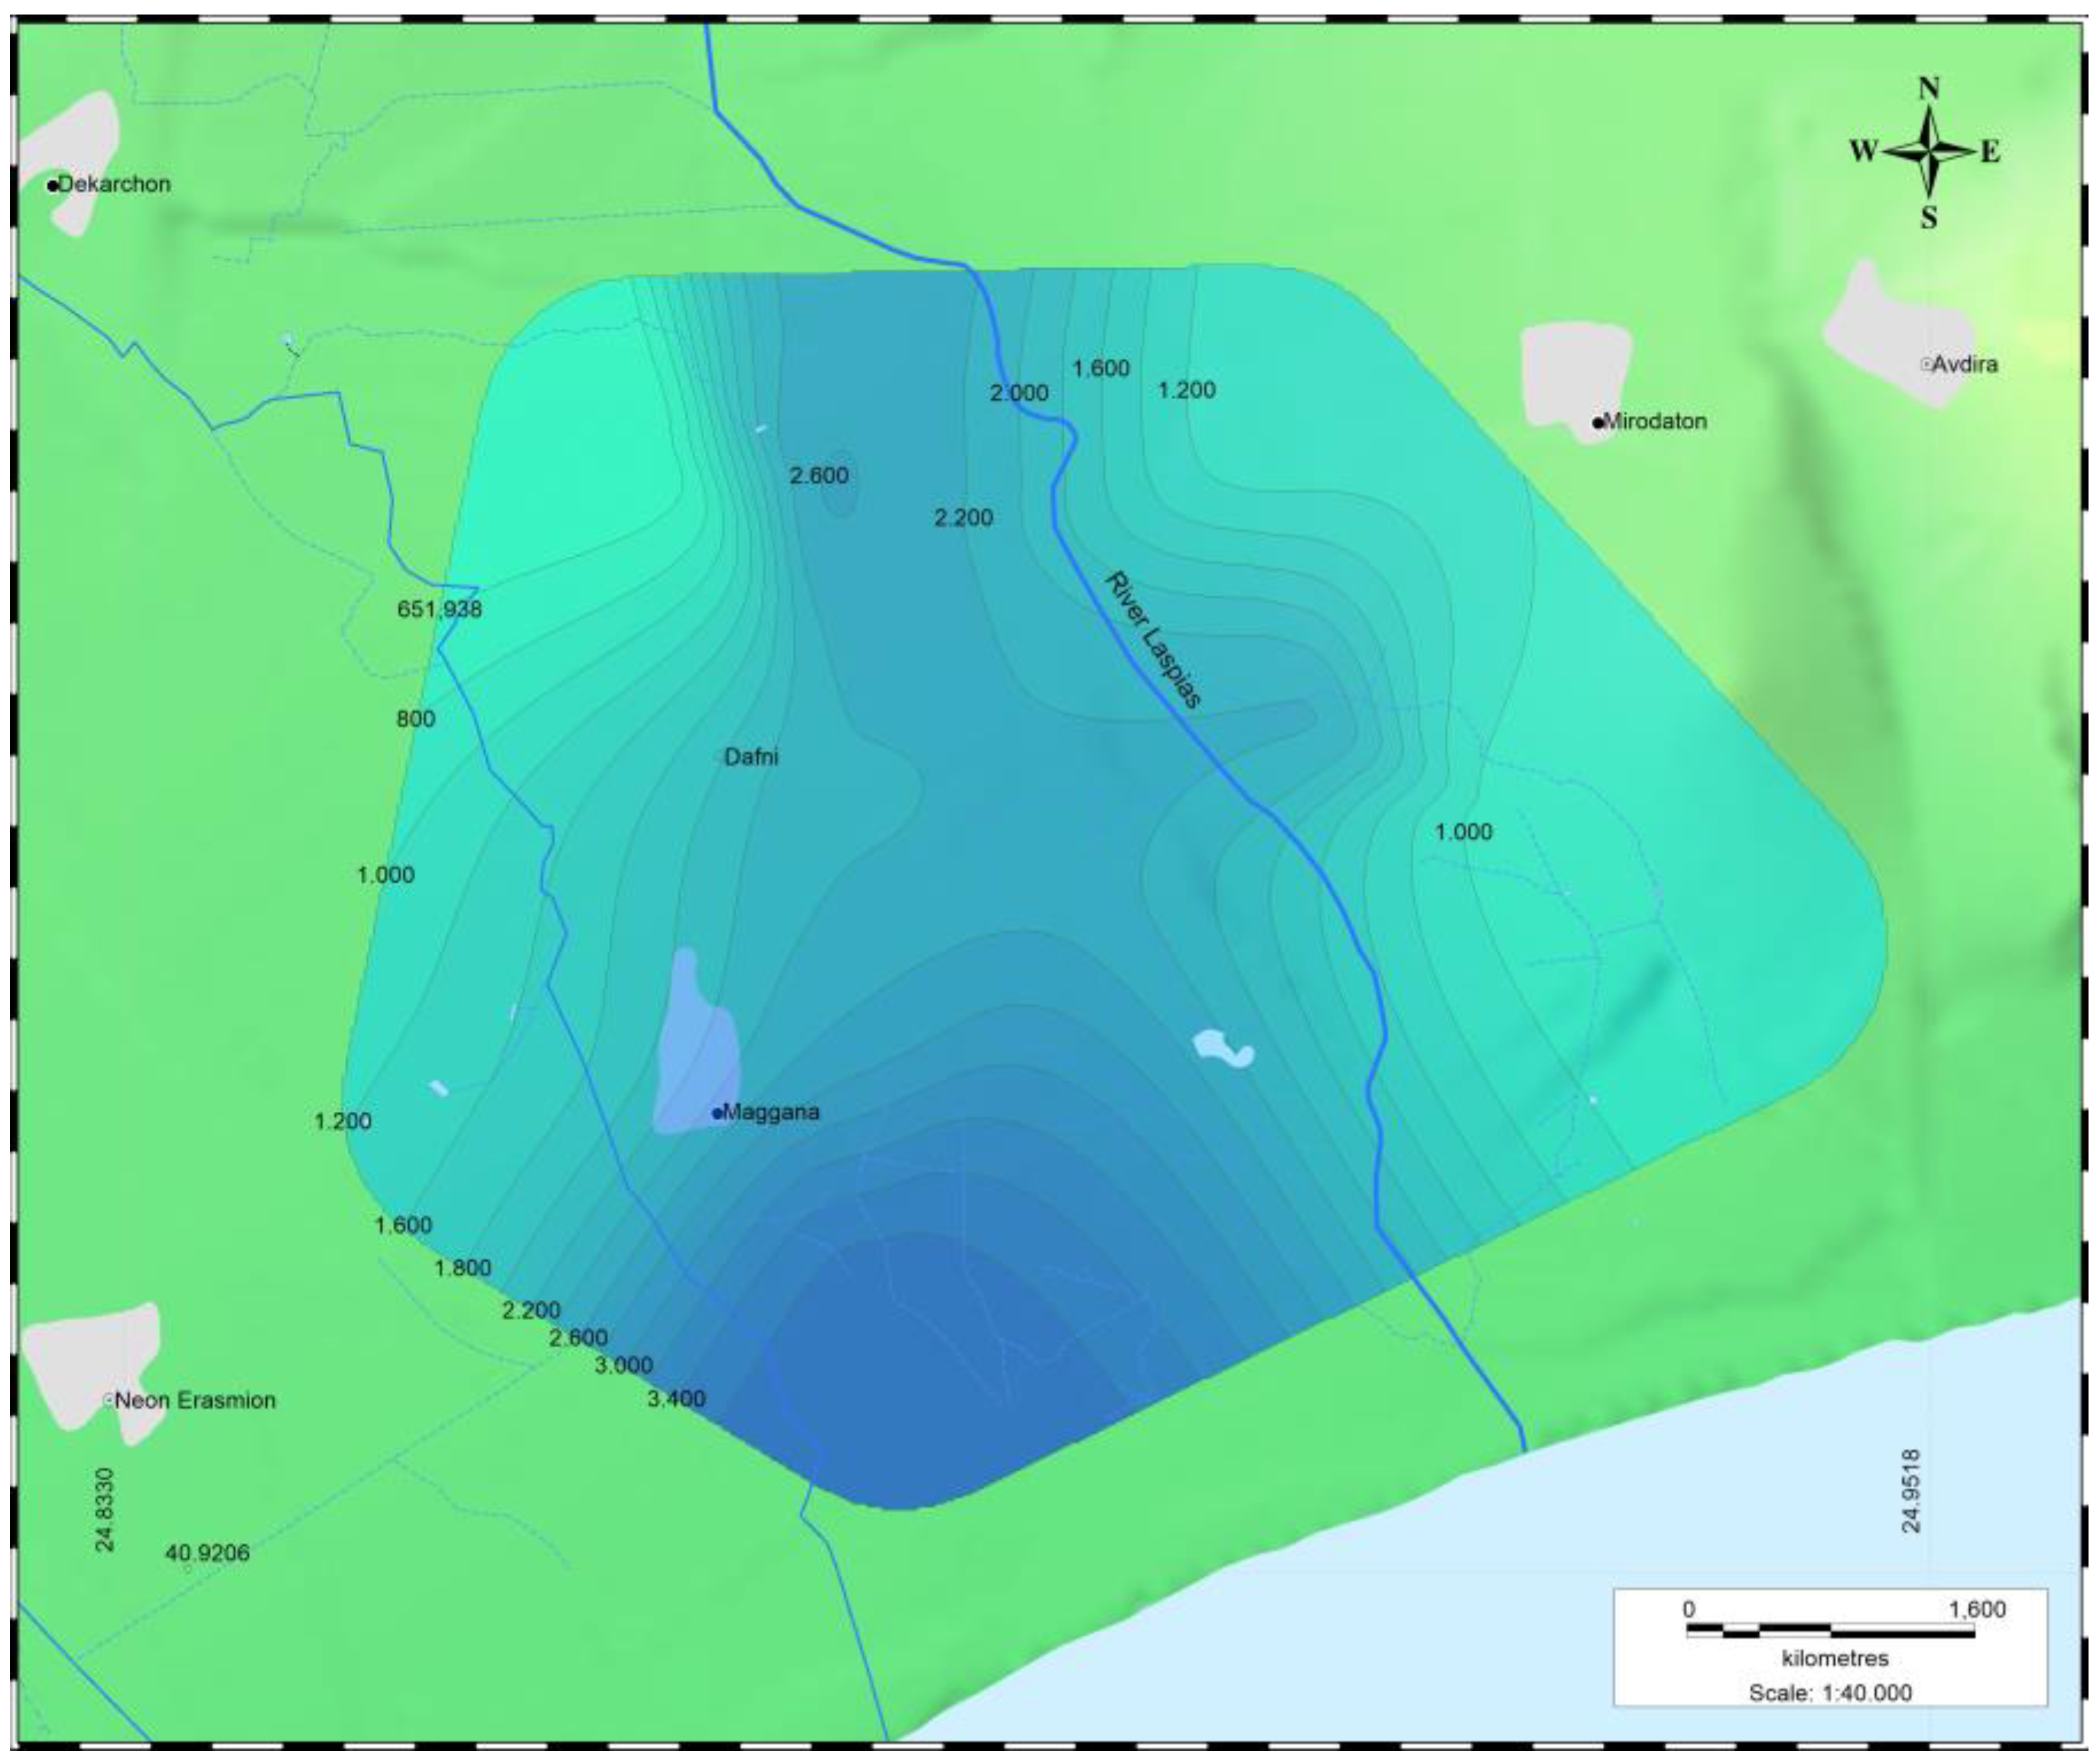
- A relative matching in the southeastern part of the study area is found, between the SIVI vulnerability index (Figure 15) and chloride (Cl−) concentration values, with a maximum value of 815.5 (Figure 5), and electrical conductivity (EC) values, with a maximum value of 3770 μS/cm (Figure 6), as well as the GALDIT vulnerability index (GVI) values, with a maximum value of 9.2 (Figure 13).
4. Conclusions
Author Contributions
Funding
Data Availability Statement
Acknowledgments
Conflicts of Interest
References
- Parizi, E.; Hosseinia, S.M.; Ataie-Ashtianib, B.; Simmons, C.T. Vulnerability mapping of coastal aquifers to seawater intrusion: Review, development and application. J. Hydrol. 2019, 57, 555–573. [Google Scholar] [CrossRef]
- Alongi, D.M. Coastal Ecosystem Processes; CRC Press: Boca Raton, FL, USA, 1999. [Google Scholar]
- Tan, W.J.; Yang, C.F.; Châteauc, P.A.; Leed, M.T.; Chang, Y.C. Integrated coastal-zone management for sustainable tourism using a decision support system based on system dynamics: A case study of Cijin, Kaohsiung, Taiwan. Ocean Coast. Manag. 2018, 153, 131–139. [Google Scholar] [CrossRef]
- Klassen, J.; Allen, D.M. Assessing the Risk of Saltwater Intrusion in Coastal Aquifers. J. Hydrol. 2017, 551, 730–745. [Google Scholar] [CrossRef]
- Kallioras, A.; Pliakas, F.; Skias, S.; Gkiougkis, I. Groundwater vulnerability assessment at SW Rhodope aquifer system in NE Greece. In Advances in the Research of Aquatic Environment; Lambrakis, N., Stournaras, G., Katsanou, K., Eds.; Springer: Berlin/Heidelberg, Germany, 2011; pp. 351–358. [Google Scholar] [CrossRef]
- Kura, N.U.; Ramli, M.F.; Ibrahim, S.; Sulaiman, W.N.A.; Aris, A.Z.; Tanko, A.I.; Zaudi, M.A. Assessment of groundwater vulnerability to anthropogenic pollution and seawater intrusion in a small tropical island using index-based methods. Environ. Sci. Pollut. Res. 2014, 22, 1512–1533. [Google Scholar] [CrossRef] [PubMed]
- Luoma, S.; Okkonen, J.; Korkka-Niemi, K. Comparison of the AVI, modified SINTACS and GALDIT vulnerability methods under future climate-change scenarios for a shallow low-lying coastal aquifer in southern Finland. Hydrogeol. J. 2017, 25, 203–222. [Google Scholar] [CrossRef]
- Kazakis, N.; Spiliotis, M.; Voudouris, K.; Pliakas, F.-K.; Papadopoulos, B. A fuzzy multicriteria categorization of the GALDIT method to assess seawater intrusion vulnerability of coastal aquifers. Sci. Total Environ. 2018, 621, 524–534. [Google Scholar] [CrossRef] [PubMed]
- Zeynolabedin, A.; Ghiass, R. The SIVI index: A comprehensive approach for investigating seawater intrusion vulnerability for island and coastal aquifers. Environ. Earth Sci. 2019, 78, 666. [Google Scholar] [CrossRef]
- Lobo-Ferreira, J.P.; Chachadi, A.G.; Diamantino, C.; Henriques, M.J. Assessing aquifer vulnerability to seawater intrusion using GALDIT method: Part 1—Application to the Portuguese Aquifer of Monte Gordo. In Proceedings of the 4th InterCeltic Colloquium on Hydrology and Management of Water “Water in Celtic Countries: Quantity, Quality and Climate Variability”, Guimarães, Portugal, 11–13 July 2005; Ferreira, J.P.L., Vieira, M.P., Eds.; 2005; pp. 161–171. [Google Scholar]
- Pedreira, R.; Kallioras, A.; Pliakas, F.; Gkiougkis, I.; Schuth, C. Groundwater vulnerability assessment of a coastal aquifer system at River Nestos eastern Delta, NE Greece. Environ. Earth Sci. 2015, 73, 6387–6415. [Google Scholar] [CrossRef]
- Recinos, N.; Kallioras, A.; Pliakas, F.; Schuth, C. Application of GALDIT index to assess the intrinsic vulnerability to seawater intrusion of coastal granular aquifers. Environ. Earth Sci. 2015, 73, 1017–1032. [Google Scholar] [CrossRef]
- Najib, S.; Fadili, A.; Mehdi, K.; Riss, J.; Makan, A.; Guessir, H. Salinization process and coastal groundwater quality in Chaouia Morocco. J. Afr. Earth Sci. 2016, 115, 17–31. [Google Scholar] [CrossRef]
- Amarni, Ν.; Fernane, L.; Naili, M.; Lounas, R.; Belkessa, R. Mapping of the vulnerability to marine intrusion “in coastal Cherchell aquifer, Central Algeria” using the GALDIT method. Groundw. Sustain. Dev. 2020, 11, 100481. [Google Scholar] [CrossRef]
- Boufekane, A.D.; Maizi, E.; Madene, G.; Busico, A.; Zghibi, A. Hybridization of GALDIT method to assess actual and future coastal vulnerability to seawater intrusion. J. Environ. Manag. 2022, 318, 115580. [Google Scholar] [CrossRef] [PubMed]
- Nadiri, A.A.; Bordbar, M.; Nikoo, M.R.; Silabi, L.S.S.; Senapathi, V.; Xiao, Y. Assessing vulnerability of coastal aquifer to seawater intrusion using Convolutional Neural Network. Mar. Pollut. Bull. 2023, 197, 115669. [Google Scholar] [CrossRef] [PubMed]
- Chronidou, D.; Tziritis, E.; Panagopoulos, A.; Oikonomou, E.K.; Loukas, A. A Modified GALDIT Method to Assess Groundwater Vulnerability to Salinization—Application to Rhodope Coastal Aquifer (North Greece). Water 2022, 14, 3689. [Google Scholar] [CrossRef]
- Setiawan, I.; Morgan, L.K.; Doscher, C. Mapping the vulnerability of groundwater to saltwater intrusion from estuarine rivers under sea level rise. J. Hydrol. 2024, 628, 130461. [Google Scholar] [CrossRef]
- Ballesteros, B.J.; Morell, I.; García-Menéndez, O.; Renau-Pruñonosa, A. A standardized index for assessing seawater intrusion in coastal aquifers: The SITE index. Water Resour. Manag. 2016, 30, 4513–4527. [Google Scholar] [CrossRef]
- Mavriou, Z.; Kazakis, N.; Pliakas, F.-K. Assessment of groundwater vulnerability in the north aquifer area of Rhodes Island using the GALDIT method and GIS. Environ. J. 2019, 6, 56. [Google Scholar] [CrossRef]
- Chachadi, A.G.; Raikar, P.S.; Lobo Ferreira, J.P.; Oliveira, M.M. GIS and Mathematical Modelling for the Assessment of Groundwater Vulnerability to Pollution: Application to an Indian Case Study Area in Goa; Laboratório Nacional de Engenharia Civil. Lisboa Laboratório: Lisboa, Portugal, 2001. [Google Scholar]
- Chachadi, A.G.; Lobo-Ferreira, J.P. Sea water intrusion vulnerability mapping of aquifers using GALDIT method. Coastin A Coast. Policy Res. Newsl. 2001, 4, 7–9. [Google Scholar]
- Chachadi, A.G.; Lobo-Ferreira, J.P. Assessing aquifer vulnerability to sea water intrusion using GALDIT method: Part 2-GALDIT Indicators Description. In Proceedings of the Fourth Inter-Celtic Colloquium on Hydrology and Management of Water Resources, Guimarães, Portugal, 11–14 July 2005. [Google Scholar]
- Gkiougkis, I. Investigation of Seawater Intrusion in Coastal Aquifers in Deltaic Environment. The Case of Nestos River Delta. Ph.D. Thesis, Department of Civil Engineering, Democritus University of Thrace, Xanthi, Greece, 2018. (In Greek). [Google Scholar]
- Gkiougkis, I.; Pouliaris, C.; Pliakas, F.-K.; Diamantis, I.; Kallioras, A. Conceptual and Mathematical Modeling of a Coastal Aquifer in Eastern Delta of R. Nestos (N. Greece). Hydrol. J. 2021, 8, 23. [Google Scholar] [CrossRef]
- Sakkas, I.; Diamantis, I.; Pliakas, F. Groundwater Artificial Recharge Study of Xanthi—Rhodopi Aquifers (in Thrace, Greece). Greek Ministry of Agriculture Research Project, Final Report; Sections of Geotechnical Engineering and Hydraulics of the Civil Engineering Department of Democritus University of Thrace: Xanthi, Greece, 1998. (In Greek) [Google Scholar]
- Kallergis, G. Applied—Environmental Hydrogeology; TCG: Athens, Greece, 2000; Volume B, 345p. (In Greek) [Google Scholar]
- Ayers, R.S. Quality of water for irrigation. In Proceedings of the Irrigation and Drainage Division, Specialty Conference, ASCE, Logan, Utah, 13–15 August 1975; pp. 24–56. [Google Scholar]
- Richards, L.A. Diagnosis and Improvement of Saline Alkali Soils; Handbook No. 60; USDA: Washington, DC, USA, 1954; 160p.
- Wilcox, L.V. Classification and Use of Irrigation Waters; Agric. Circ.: Washington, DC, USA, 1955. [Google Scholar]
- Revelle, R. Criteria for recognition of sea water in ground waters. Trans. Amer. Geophys. Union 1941, 22, 593–597. [Google Scholar]
- Soulios, G. Hydrogeology; University Studio Press: Thessaloniki, Greece, 2006; Volume D. (In Greek) [Google Scholar]
- Gkiougkis, I.; Tzevelekis, T.; Pliakas, F.; Diamantis, I.; Pechtelidis, A. Geophysical research of groundwater degradation at the eastern Nestos River Delta, NE Greece. Adv. Res. Aquat. Environ. Environ. Earth Sci. 2011, 1, 259–266. [Google Scholar]
- Gkiougkis, I.; Kallioras, A.; Pliakas, F.; Pechtelidis, A.; Diamantis, V.; Diamantis, I.; Ziogas, A.; Dafnis, I. Assessment of soil salinization at the eastern Nestos River Delta, N.E. Greece. Cateba 2015, 128, 238–251. [Google Scholar] [CrossRef]
- Lymperiadou, G.; Gkiougkis, I.; Karasogiannidis, D.; Pliakas, F.-K. Research for the updated conceptual model of a coastal aquifer in River Nestos Eastern Delta. In Proceedings of the 12th International Hydrogeological Conference, Nicosia (Lefkosia), Cyprus, 20–22 March 2022; pp. 336–344. [Google Scholar]
- Gkiougkis, I.; Adamidis, A.; Empliouk, I.; Karasogiannidis, D.; Pliaka, C.; Tzevelekis, T.; Pliakas, F.-K. Research for The Conceptual Model Development of River Lissos Coastal Aquifer System, NE Greece. In Proceedings of the 16th International Congress of the Geological Society of Greece, Patras, Greece, 17–19 October 2022; pp. 450–451. [Google Scholar]
- Pliakas, F.-K.; Gkiougkis, I.; Pliaka, C.; Karasogiannidis, D.; Adamidis, A.; Empliouk, I. Project Eye4water (MIS 5047246): Strengthening the Water Management Practices (in EMT-R) through the Development of Innovative ICT Methodologies and Improvement of Research Infrastructures; Deliverable 2.3, 1. Technical Report of Groundwater Quality Status (19-5-2023); Eye4water: Xanthi, Greece, 2023. [Google Scholar]
- Kallergis, G. Applied—Environmental Hydrogeology; TCG: Athens, Greece, 1999; Volume A, 345p. (In Greek) [Google Scholar]
- Todd, D.K.; Mays, L.W. Groundwater Hydrology, 3rd ed.; John Wiley and Sons Inc.: New York, NY, USA, 2005. [Google Scholar]
- Domenico, P.A.; Schwartz, W. Physical and Chemical Hydrogeology; Wiley: New York, NY, USA, 1998. [Google Scholar]


| Parameter | Weight | Classification | Rating | |
|---|---|---|---|---|
| Groundwater occurrence (G) | 1 | Confined aquifer | 10 | |
| Unconfined aquifer | 7.5 | |||
| Leaky confined aquifer | 5 | |||
| Bounded aquifer | 2.5 | |||
| Aquifer hydraulic conductivity (A) (m/d) | 3 | High | >40 | 10 |
| Medium | 40–10 | 7.5 | ||
| Low | 10–5 | 5 | ||
| Very low | <5 | 2.5 | ||
| Height of groundwater level above sea level (L) (m) | 4 | High | <1.0 | 10 |
| Medium | 1.0–1.5 | 7.5 | ||
| Low | 1.5–2.0 | 5 | ||
| Very low | >2.0 | 2.5 | ||
| Distance from the shore (D) (m) | 4 | High | <2500 | 10 |
| Medium | 2500–5000 | 7.5 | ||
| Low | 5000–7500 | 5 | ||
| Very low | >7500 | 2.5 | ||
| Impact of existing status of seawater intrusion (I) | 1 | High | >2 | 10 |
| Medium | 1.5–2.0 | 7.5 | ||
| Low | 1.0–1.5 | 5 | ||
| Very low | <1 | 2.5 | ||
| Thickness of the aquifer (T) (m) | 2 | High | >10 | 10 |
| Medium | 7.5–10 | 7.5 | ||
| Low | 5–7.5 | 5 | ||
| Very low | <5 | 2.5 | ||
| Parameter | Equation | Explanation | |
|---|---|---|---|
| Surface area of groundwater affected by salinization (S) | (2) | St: the total aquifer surface Sα: the surface that exceeds the amount of chloride ion concentration from the reference value Vr | |
| Intensity of the intrusion (I) | (3) | Si: the surface area (km2) between the isochloride lines (with a value greater than or equal to Vr) CIi: the mean chlorine concentration between two isochloride lines | |
| Temporality or seasonality (T) | (4) | f(x): the mean chloride concentration for a particular year : the mean of the whole series | |
| (5) | |||
| Evolution of seawater intrusion (E) | (6) | nn−1: the average chloride concentration in the current and preceding situation, respectively | |
| Aquifer type (A) | Unconfined, leaky, confined aquifer | ||
| Hydraulic conductivity (C) | (7) | Sb: the surface that exceeds the amount of hydraulic conductivity from the reference value | |
| Height of groundwater level above sea elevation (H) | (8) | Sc: the surface that the height of groundwater level above sea elevation is less than the reference value | |
| Distance from shoreline (D) | (9) | Sd: the surface that exceeds the amount of distance from shore from the reference value | |
| SITE value | (10) | ||
| SIVI index | (11) | Pavi: the ith parameter assigned value |
| Min | Max | Aver | SD | |
|---|---|---|---|---|
| Ca2+ (mg/L) | 48.10 | 200.40 | 115.11 | 53.66 |
| Mg2+ (mg/L) | 9.72 | 72.90 | 35.31 | 21.08 |
| SO42− (mg/L) | 64.00 | 300.00 | 176.10 | 92.78 |
| HCO3− (mg/L) | 131.15 | 895.48 | 421.27 | 217.12 |
| PO42− (mg/L) | 0.13 | 3.88 | 1.49 | 1.14 |
| NO3− (mg/L) | 0.00 | 62.40 | 31.33 | 24.30 |
| Cl− (mg/L) | 63.83 | 815.58 | 326.41 | 251.69 |
| EC (μS/cm) | 652.00 | 3770.00 | 1944.80 | 966.39 |
| pH | 6.72 | 7.86 | 7.27 | 0.30 |
| K+ (mg/L) | 2.50 | 34.30 | 12.41 | 9.33 |
| Na+ (mg/L) | 105.00 | 500.00 | 258.00 | 148.70 |
| Fe2+ (mg/L) | 0.00 | 0.96 | 0.16 | 0.30 |
| Mn2+ (mg/L) | 0.50 | 4.90 | 1.55 | 1.28 |
| Na+/Cl− | 0.75 | 2.54 | 1.58 | 0.64 |
| SO42−/Cl− | 0.18 | 1.38 | 0.60 | 0.42 |
| (Ca2++Mg2+)/(Na++K+) | 0.18 | 1.50 | 0.89 | 0.40 |
| Well → | 26 | 74 | 147 | 229 | 28 | 50 | 14 | 17 | 18 | 23 | |
|---|---|---|---|---|---|---|---|---|---|---|---|
| Groundwater occurrence (G) | G | Unconfined | |||||||||
| W1 | 1 | 1 | 1 | 1 | 1 | 1 | 1 | 1 | 1 | 1 | |
| R1 | 7.5 | 7.5 | 7.5 | 7.5 | 7.5 | 7.5 | 7.5 | 7.5 | 7.5 | 7.5 | |
| W1xR1 | 7.5 | 7.5 | 7.5 | 7.5 | 7.5 | 7.5 | 7.5 | 7.5 | 7.5 | 7.5 | |
| Aquifer hydraulic conductivity (A) * | A (×10−5 m/s) | 6.0 | 12.0 | 20.0 | 20.0 | 4.0 | 12.0 | 3.0 | 3.0 | 3.0 | 3.0 |
| A (m/day) | 5.18 | 10.37 | 17.28 | 17.28 | 3.46 | 10.37 | 2.25 | 2.59 | 2.59 | 2.59 | |
| W2 | 3 | 3 | 3 | 3 | 3 | 3 | 3 | 3 | 3 | 3 | |
| R2 (rating) | 5 | 7.5 | 7.5 | 7.5 | 2.5 | 7.5 | 2.5 | 2.5 | 2.5 | 2.5 | |
| W2xR2 | 15.0 | 22.5 | 22.5 | 22.5 | 7.5 | 22.5 | 7.5 | 7.5 | 7.5 | 7.5 | |
| Height of groundwater level above sea level (L)—April 2023 | L (m) | 7.57 | 6.10 | 4.26 | 2.80 | 2.95 | 0.35 | 10.35 | 3.63 | 2.80 | 2.88 |
| W3 | 4 | 4 | 4 | 4 | 4 | 4 | 4 | 4 | 4 | 4 | |
| R3 | 2.5 | 2.5 | 2.5 | 2.5 | 2.5 | 10 | 2.5 | 2.5 | 2.5 | 2.5 | |
| W3xR3 | 10 | 10 | 10 | 10 | 10 | 40 | 10 | 10 | 10 | 10 | |
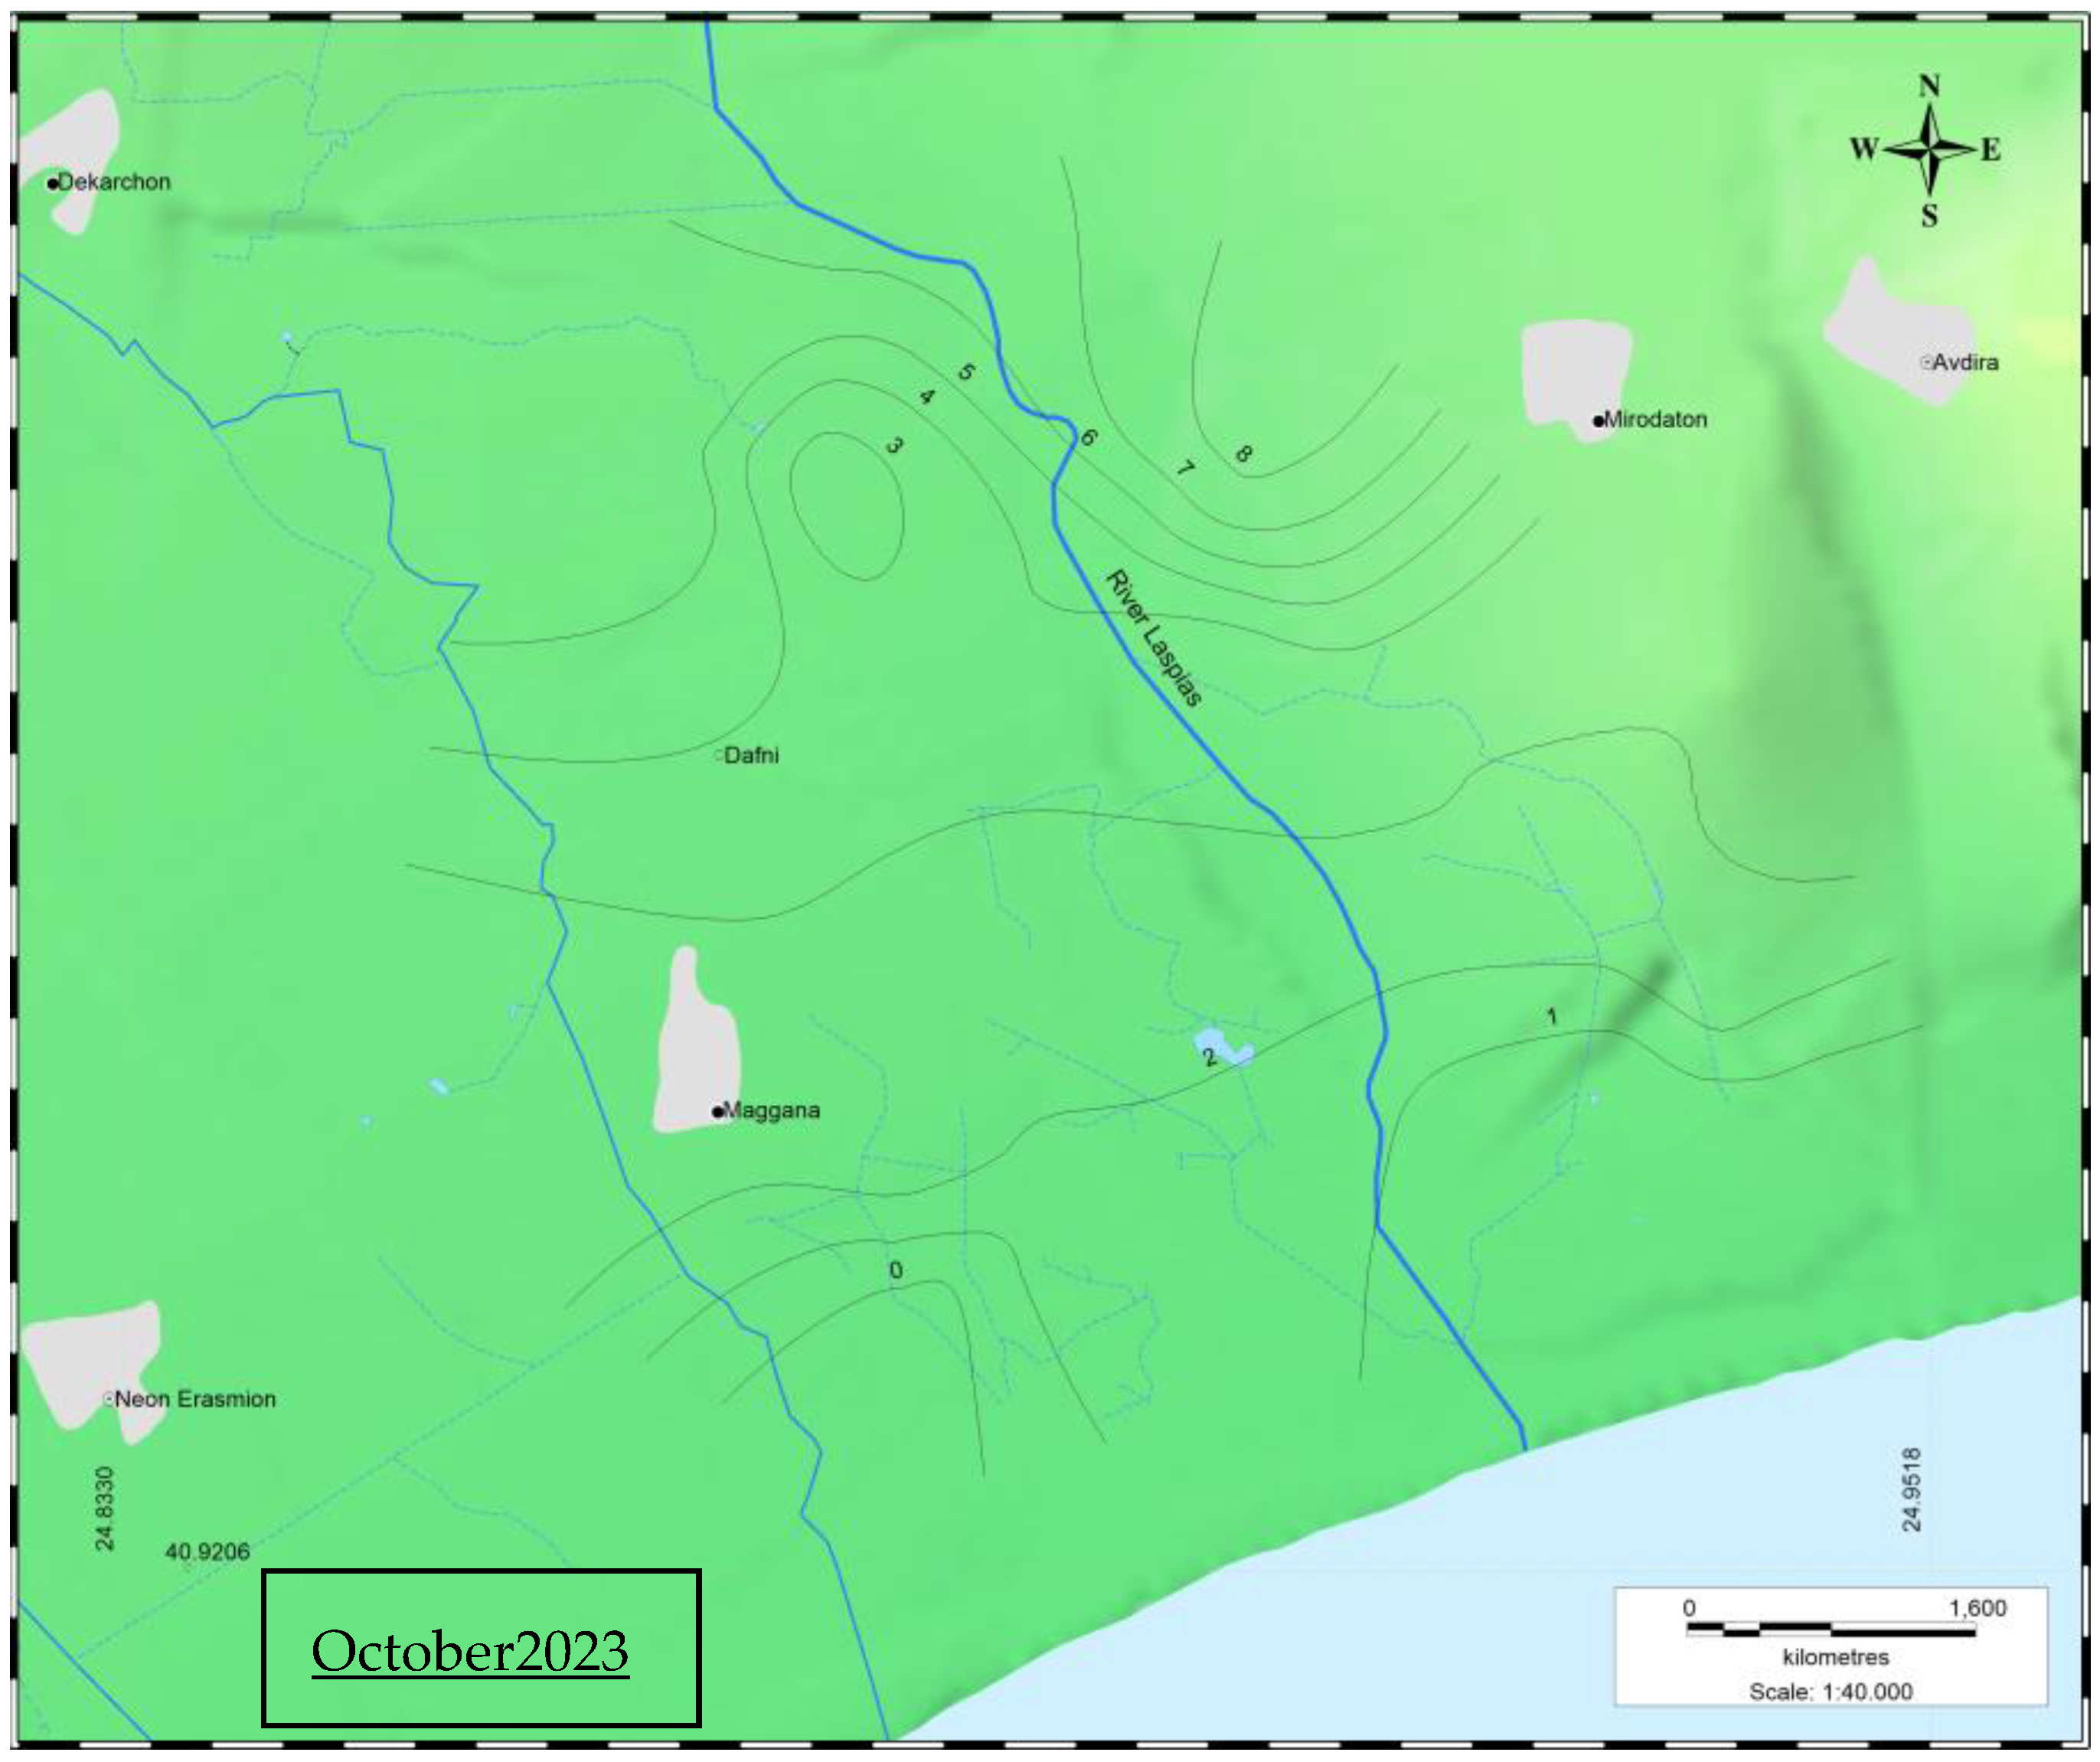
| Height of groundwater level above sea level (L)—October 2023 | L (m) | 5.66 | 2.65 | 3.49 | 2.23 | 2.48 | −0.45 | 8.30 | 3.18 | 2.96 | 2.89 |
| W3 | 4 | 4 | 4 | 4 | 4 | 4 | 4 | 4 | 4 | 4 | |
| R3 | 2.5 | 2.5 | 2.5 | 2.5 | 2.5 | 10 | 2.5 | 2.5 | 2.5 | 2.5 | |
| W3xR3 | 10 | 10 | 10 | 10 | 10 | 40 | 10 | 10 | 10 | 10 | |
| Distance from the shore (D) | D (m) | 7113 | 6443 | 4796 | 3730 | 4187 | 1965 | 5910 | 4327 | 3343 | 2433 |
| W4 | 4 | 4 | 4 | 4 | 4 | 4 | 4 | 4 | 4 | 4 | |
| R4 | 5 | 5 | 7.5 | 7.5 | 7.5 | 10 | 5 | 7.5 | 7.5 | 10 | |
| W4xR4 | 20 | 20 | 30 | 30 | 30 | 40 | 20 | 30 | 30 | 40 | |
| Impact of existing status of seawater intrusion (I) | I (Revelle) | 0.84 | 3.57 | 1.79 | 1.98 | 0.82 | 1.57 | 0.45 | 1.16 | 0.40 | 0.78 |
| W5 | 1 | 1 | 1 | 1 | 1 | 1 | 1 | 1 | 1 | 1 | |
| R5 | 2.5 | 10.0 | 7.5 | 7.5 | 2.5 | 7.5 | 2.5 | 5 | 2.5 | 2.5 | |
| W5xR5 | 2.5 | 10 | 7.5 | 7.5 | 2.5 | 7.5 | 2.5 | 5 | 2.5 | 2.5 | |
| Thickness of the aquifer (T) (m) | T (m) | 27 | 27 | 27 | 27 | 27 | 27 | 27 | 27 | 27 | 27 |
| W6 | 2 | 2 | 2 | 2 | 2 | 2 | 2 | 2 | 2 | 2 | |
| R6 | 10 | 10 | 10 | 10 | 10 | 10 | 10 | 10 | 10 | 10 | |
| W6xR6 | 20 | 20 | 20 | 20 | 20 | 20 | 20 | 20 | 20 | 20 | |
| GVI April 2023 GVI October 2023 | 5.0 | 6.0 | 6.5 | 6.5 | 5.2 | 9.2 | 4.5 | 5.3 | 5.2 | 5.8 | |
| 5.0 | 6.0 | 6.5 | 6.5 | 5.2 | 9.2 | 4.5 | 5.3 | 5.2 | 5.8 | ||
| Cl (mg/L) | 0–250 mg/L | ≥250 mg/L | |||||||
| Sα (km2) | 18.46 | 23.00 | |||||||
| St (km2) | 41.46 | ||||||||
| S → | 0.555 | ||||||||
| Cl (mg/L) | 250–532.80/L | 532.80–815.58 mg/L | |||||||
| Si (km2) | 16.478 | 6.522 | |||||||
| n (mg/L) | 391.40 | 674.20 | |||||||
| (km2) | 6449.489 | 4397.132 | |||||||
| I → | 471.592 | ||||||||
| year | n ) (mg/L) | (2023) (mg/L) | (mg/L) (2021, 2022, 2023) | T0 ↓ | T ↓ | ||||
| 2021 * | 324.81 | 326.41 | 315.68 | 0.034 | 0.042 | ||||
| 2022 ** | 295.82 | ||||||||
| 2023 | 326.41 | ||||||||
| n−1 (mg/L) (2022 **) | n (mg/L) (2023) | E ↓ | |||||||
| 295.82 | 326.41 | 1.103 | |||||||
| Κ (m/s) *** | 0–8 × 10⁻⁵ m/s | >8 × 10⁻⁵ m/s | |||||||
| Si (km2) | 9.76 | 13.24 | |||||||
| Sb (km2) | 13.24 | ||||||||
| St (km2) | 23.00 | ||||||||
| C → | 0.576 | ||||||||
| h (m) | <1.0 m **** April 2023 | <1.0 m **** October 2023 | |||||||
| Sc (km2) | 2.37 | 2.90 | |||||||
| St (km2) | 41.46 | ||||||||
| H → | 0.057 | 0.070 | |||||||
| Distance from shoreline **** | Sd (km2) | St (km2) | D ↓ | ||||||
| >7 km | 38.09 | 41.46 | 0.919 | ||||||
| Calculated Value | Assigned Value | Characterization | |
|---|---|---|---|
| S | 0.555 | 3 | High |
| I | 471.592 | 1 | low |
| T | 0.042 | 0 | Very low |
| E | 1.103 | 1 | Moderate deterioration |
| A | Unconfined | 3 | High |
| C | 0.576 | 3 | High |
| H (April 2023) | 0.057 | 0 | Very low |
| H (October 2023) | 0.070 | 0 | Very Low |
| D | 0.919 | 2 | Very Far |
| SITE value → | 0.408 | Moderate | |
| SIVI Index → | 0.464 (April and October 2023) | Moderate | |
| 26 | 74 | 147 | 229 | 28 | 50 | 14 | 17 | 18 | 23 | |||
|---|---|---|---|---|---|---|---|---|---|---|---|---|
| Cl− | July 2023 | (mg/L) | 63.83 | 585.09 | 407.79 | 460.98 | 257.09 | 815.58 | 99.29 | 390.06 | 99.29 | 85.10 |
| Hydraulic conductivity | (×10−5 m/s) | 6.0 | 12.0 | 20.0 | 20.0 | 4.0 | 12.0 | 3.0 | 3.0 | 3.0 | 3.0 | |
| Water table (h) | April 2023 | (m) | 7.57 | 6.10 | 4.26 | 2.80 | 2.95 | 0.35 | 10.35 | 3.63 | 2.80 | 2.88 |
| October 2023 | (m) | 5.66 | 2.65 | 3.49 | 2.23 | 2.48 | −0.45 | 8.30 | 3.18 | 2.96 | 2.89 | |
| Distance from shoreline (d) | (m) | 7113 | 6443 | 4796 | 3730 | 4187 | 1965 | 5910 | 4327 | 3343 | 2433 | |
| S | cv | _ | 0.555 | 0.555 | 0.555 | 0.555 | 0.555 | _ | 0.555 | _ | _ | |
| av | 0 | 3 | 3 | 3 | 3 | 3 | 0 | 3 | 0 | 0 | ||
| I | cv | _ | 471.592 | 471.592 | 471.592 | 471.592 | 471.592 | _ | 471.592 | _ | _ | |
| av | 0 | 1 | 1 | 1 | 1 | 1 | 0 | 1 | 0 | 0 | ||
| T | cv | 0.042 | 0.042 | 0.042 | 0.042 | 0.042 | 0.042 | 0.042 | 0.042 | 0.042 | 0.042 | |
| av | 0 | 0 | 0 | 0 | 0 | 0 | 0 | 0 | 0 | 0 | ||
| E | cv | 1.103 | 1.103 | 1.103 | 1.103 | 1.11 | 1.103 | 1.103 | 1.103 | 1.103 | 1.103 | |
| av | 1 | 1 | 1 | 1 | 1 | 1 | 1 | 1 | 1 | 1 | ||
| A | cv | UA | UA | UA | UA | UA | UA | UA | UA | UA | UA | |
| av | 3 | 3 | 3 | 3 | 3 | 3 | 3 | 3 | 3 | 3 | ||
| C | cv | _ | 0.576 | 0.576 | 0.576 | _ | 0.576 | _ | _ | _ | _ | |
| av | 0 | 3 | 3 | 3 | 0 | 3 | 0 | 0 | 0 | 0 | ||
| H | April 2023 | cv | _ | _ | _ | _ | _ | 0.057 | _ | _ | _ | _ |
| av | 0 | 0 | 0 | 0 | 0 | 0 | 0 | 0 | 0 | 0 | ||
| October 2023 | cv | _ | _ | _ | _ | _ | 0.070 | _ | _ | _ | _ | |
| av | 0 | 0 | 0 | 0 | 0 | 1 | 0 | 0 | 0 | 0 | ||
| D | cv | _ | 0.919 | 0.919 | 0.919 | _ | 0.919 | _ | 0.919 | _ | _ | |
| av | 0 | 2 | 2 | 2 | 0 | 2 | 0 | 2 | 0 | 0 | ||
| SIVI Index (April 2023) | 0.14 | 0.46 | 0.46 | 0.46 | 0.29 | 0.50 | 0.14 | 0.36 | 0.14 | 0.14 | ||
| SIVI Index (October 2023) | 0.14 | 0.46 | 0.46 | 0.46 | 0.29 | 0.50 | 0.14 | 0.36 | 0.14 | 0.14 | ||
Disclaimer/Publisher’s Note: The statements, opinions and data contained in all publications are solely those of the individual author(s) and contributor(s) and not of MDPI and/or the editor(s). MDPI and/or the editor(s) disclaim responsibility for any injury to people or property resulting from any ideas, methods, instructions or products referred to in the content. |
© 2024 by the authors. Licensee MDPI, Basel, Switzerland. This article is an open access article distributed under the terms and conditions of the Creative Commons Attribution (CC BY) license (https://creativecommons.org/licenses/by/4.0/).
Share and Cite
Pliaka, C.; Gkiougkis, I.; Karasogiannidis, D.; Angelidis, P.; Kallioras, A.; Pliakas, F.-K. Assessment of Groundwater Vulnerability to Seawater Intrusion Using GALDIT, SITE and SIVI Methods in Laspias River Coastal Aquifer System, NE Greece. Water 2024, 16, 1341. https://doi.org/10.3390/w16101341
Pliaka C, Gkiougkis I, Karasogiannidis D, Angelidis P, Kallioras A, Pliakas F-K. Assessment of Groundwater Vulnerability to Seawater Intrusion Using GALDIT, SITE and SIVI Methods in Laspias River Coastal Aquifer System, NE Greece. Water. 2024; 16(10):1341. https://doi.org/10.3390/w16101341
Chicago/Turabian StylePliaka, Christina, Ioannis Gkiougkis, Dimitrios Karasogiannidis, Panagiotis Angelidis, Andreas Kallioras, and Fotios-Konstantinos Pliakas. 2024. "Assessment of Groundwater Vulnerability to Seawater Intrusion Using GALDIT, SITE and SIVI Methods in Laspias River Coastal Aquifer System, NE Greece" Water 16, no. 10: 1341. https://doi.org/10.3390/w16101341
APA StylePliaka, C., Gkiougkis, I., Karasogiannidis, D., Angelidis, P., Kallioras, A., & Pliakas, F.-K. (2024). Assessment of Groundwater Vulnerability to Seawater Intrusion Using GALDIT, SITE and SIVI Methods in Laspias River Coastal Aquifer System, NE Greece. Water, 16(10), 1341. https://doi.org/10.3390/w16101341