Article

Study on Seismic Source Parameter Characteristics of Baihetan Reservoir Area in the Lower Reaches of the Jinsha River

1
Institute of Earthquake Forecasting, China Earthquake Administration, Beijing 100036, China
2
Yunnan Earthquake Agency, Kunming 650216, China
3
Institute of Geophysics, China Earthquake Administration, Beijing 100081, China
*
Author to whom correspondence should be addressed.
Water 2024, 16(10), 1370; https://doi.org/10.3390/w16101370
Submission received: 15 April 2024 / Revised: 7 May 2024 / Accepted: 9 May 2024 / Published: 11 May 2024
(This article belongs to the Special Issue Safety Evaluation of Dam and Geotechnical Engineering, Volume II)

Abstract

:
The source parameters of earthquakes (stress drop, corner frequency, seismic moment, source size, radiant energy, etc.) provide important information about the source features, the state of stress, and the mechanism of earthquake rupture dynamics. Using the digital observation data obtained from a high-density seismic monitoring network deployed in the Baihetan reservoir area of the lower Jinsha River, we obtained Brune source parameters of the 459 earthquakes ranging in magnitude ML 1.50~4.70. The results revealed seismic moments M0 within the range of 2.03 × 10¹²~1.45 × 10¹⁶ N·m, corner frequencies f c between 2.00 and 10.00 Hz, and source dimensions varying from 130.00 to 480.00 m, with stress drops spanning from 0.12 to 61.24 MPa. It is noteworthy that the majority of the earthquakes had stress drops less than 10.00 MPa, with as much as 73.30% of these events having stress drops within the range of 0.10 to 2.00 MPa. We found that stress drop, corner frequency, and source size in the study area exhibited positive correlations with earthquake magnitude. Earthquakes occurring at shallower depths for the same magnitude tended to have smaller stress drops and corner frequencies, but larger rupture scales. During the first 2 years of impoundment with significant water level fluctuation, earthquakes beneath or near the reservoir released higher stress drops relative to pre-reservoir conditions, with average stress drops significantly elevated from 5.52 to 13.562 Mpa for events above ML3 since the impoundment. The radiated energy released by earthquakes with magnitudes below ML3.0 are significantly more than before impoundment, indicating that earthquakes of similar magnitudes in the reservoir area may produce greater intensity and perceptibility following the impoundment. According to our result, the triggered seismicity will continue to be active under annual regulation changes in the water level of the Baihetan Dam at high elevations in future years.

1. Introduction

Reservoir-induced seismicity (RIS) refers to the earthquakes caused by the change in water level after the artificial construction of reservoirs and water storage [1]. In order to have a more in-depth study on the characteristics of reservoir-induced seismicity and its genesis mechanism, scholars have studied and analyzed reservoir earthquakes from many aspects such as lithology, tectonics, waveform characteristics, source features, stress, etc., [2]. Among them, the source parameters are important data to study the source features and the difference of RIS with a tectonic earthquake. The source parameters of earthquakes (stress drop, seismic moment, source size, radiant energy, etc.) provide important information about the state of stress at the source and the mechanism of earthquake rupture dynamics, which is a key parameter for assessing seismic hazards and for making predictions of strong ground motions.
For tectonic earthquakes, there are varying degrees of correlation between the stress drop released by earthquakes and earthquake magnitude, depth, type of focal source mechanism, and tectonic background. The stress drop has also been used to distinguish between tectonic earthquakes and induced earthquakes. The Koyna reservoir in India is recognized as the reservoir where the largest reservoir-induced earthquake (M6.3 on 10 December 1967) has occurred so far [3,4], and for more than 50 years earthquakes have continued to be active in a 30 km area between Koyna and Warna dams. The results of several studies on seismic source parameters have been published. In [5], they calculated the source spectral parameters of 193 earthquakes with ML 1.5~4.7 during 1994.10–1995.6 by using a method similar to that used in this paper, and the results showed that these earthquakes had seismic moments in the range of 1011 to 1016 N·m with a source radius ranging from 94 to 538 m, and with stress drops ranging from 0.03 to 19.00 MPa. The high stress drop earthquakes were located in the depth ranges of 0~1 km and 5~13 km, respectively. Among them, the ML 4.7 earthquake released the maximum stress drop of 19 MPa. Yadav et al. calculated the source parameters of 38 events with ML 3.5~5.2 that occurred in the Koyna reservoir area in 2012 [6]. These earthquakes had seismic moments in the range of 1013~1016 N·m, and the radius of the source, corner frequency, and the stress drop were in the range of 0.1~0.4 km, 2.9~9.4 Hz and 3.0~26.0 MPa, respectively. They found that the stress drop in the Koyna–Warna region increased with the magnitude of the earthquakes and the depth of the source.
Mahato and Shashidhar used the spectral ratio method to determine the parameters of the stress drop, corner frequency of the 689 earthquakes with ML 0.5~4.0 of 2017 in the Koyna reservoir area, and found that the corner frequency ranged from 1.0 to 25.0 Hz, and the stress drop ranged from 0.01 to 14.00 MPa, and their results support that there is no significant positive correlation between the stress drop and the magnitude of the earthquakes in the reservoir area [7]. Tomic et al. studied the source parameters of six earthquakes with depths of less than 5 km and with 0.9 ≤ ML ≤ 2.1 induced by changes in the water level of the Acu Reservoir area in northeastern Brazil, and found that the stress drop of these earthquakes ranged from 26 to 179 MPa, which is much higher than that of tectonic earthquakes of the same magnitude, thus concluding that the shallower depth of the source and the presence of water did not lead to a small stress drop [8]. They also found that the median seismic stress drop did not show a positive correlation with magnitude compared to previous earthquakes in the reservoir area. However, a study has suggested that reservoir-induced earthquakes of the same magnitude have smaller stress drops of an order of magnitude compared to natural tectonic earthquakes [9]. It has also been suggested that this difference may stem from a different tectonic setting or a shallower depth of the induced earthquakes, and that the difficulty of correcting for attenuation and site response during calculations may also contribute to the underestimation of the stress drop.
Although there are some studies on reservoir-induced earthquakes, the genesis mechanism, discrimination with tectonic one, and prediction of reservoir-induced earthquakes in high-intensity zones are still unsolved challenges due to the very limited number of examples of earthquakes occurring around large reservoirs. Baihetan Dam was formally impounded on 5 April 2021, and this paper is based on the high-density digital seismic network deployed in the reservoir area since 2016. We systematically calculated a series of source parameters, such as stress drop, corner frequency, rupture radius, radiation energy, seismic moment, etc., for earthquakes in the reservoir area. It is hoped that by analyzing these parameters, the characteristics of the seismic source parameters and their temporal and spatial changes before and after water impoundment will be revealed, and the effects of the magnitude, location, and depth of the earthquakes in the reservoir area on the characteristics of the seismic source will be explored.

2. Study Area and Background

The Jinsha River, China’s largest hydropower base, boasts a natural drop of 5100 m, accounting for 95% of the total gradient along the mainstream of the Yangtze River, making it the world’s most concentrated hydroelectric resource. The Baihetan Hydropower Station is the second-tier power station among the four cascaded hydropower plants on the lower reaches of the Jinsha River—Wudongde, Baihetan, Xiluodu, and Xiangjiaba, located in the border areas of Ningnan County, Liangshan Yi Autonomous Prefecture, Sichuan Province, and Qiaojia County, Zhaotong City, Yunnan Province.
On 6 April 2021, the Baihetan Reservoir officially commenced water storage, with the upstream water levels rising from 658 to 821 m by October 2021, with the water level rising by 163 m. From October 2021 to August 2022, the water level gradually dropped to 770 m, then significantly increased in early September 2022, reaching its designed maximum water level of 825 m by December. From January to March 2023, the water level descended to 780 m and maintained this level for three months, followed by another significant rise to the peak water level of 825 m between June and October 2023. Subsequently, the reservoir entered a normal annual variation state, with the water level cyclically fluctuating annually between 770 m and 825 m, the corresponding reservoir capacity at the highest water level was 20.6 billion cubic meters.
The Baihetan region is situated near the eastern boundary of the Sichuan-Yunnan Rhombic Block, which is jointly composed of the Xianshuihe Fault, Anninghe Fault, Zemuhe Fault, and Xiaojiang Fault. Specifically, it lies at the intersection of the northwest-trending Zemuhe Fault, the northeast-trending Lianfeng Fault, the nearly north–south trending Si Kai-Jiaoji River Fault, the Ninghui Fault, and the Xiaojiang Fault (Figure 1). This area has a complex geological tectonic background, where the strong oblique subduction and compression of the Indian Plate against the Eurasian Plate have led to the intense uplift of the Qinghai-Tibet Plateau, causing the Sichuan-Yunnan Rhombic Block to move southeastward since the Quaternary Period, predominantly characterized by left-lateral strike-slip movements [10]. Most faults within the study area are closely related to historically recorded moderate-to-strong earthquakes.
In 2021, She et al. simulated the changes in gravity and Coulomb stress caused by the water storage in the Baihetan Hydropower Station, concluding that the Coulomb stress change exceeds 0.01 MPa in two regions south and north of Qiaojia, potentially triggering earthquakes [11]. Guo et al., based on dense array observations set up in the reservoir area, studied the seismic activity characteristics in the Baihetan Reservoir region from 2016 to June 2022 [12]. They found that following reservoir impoundment, micro-seismic activities significantly intensified along the main section of the Baihetan Reservoir and the tributary reservoir area of the Heishui River. Before reservoir impoundment, earthquakes mainly occurred in the northern segment of the Xiaojiang Fault Zone and the southern segment of the Zemuhe Fault, with earthquake focal depths around 10 km. Earthquake activities east of Baihetan were primarily clustered around the 2014 Ludian MS6.5 earthquake and the 2020 Qiaojia MS5.0 earthquake, accompanied by numerous micro-seismic events. After the Baihetan Dam was filled, seismic activities downstream of the Jinsha River were conspicuously concentrated along the river course, while the aftershock activities in the Ludian earthquake zone slightly decreased, demonstrating that reservoir impoundment significantly altered the regional seismic distribution. Guo and Zhao calculated the source mechanism solutions of earthquakes in the reservoir area, revealing a marked increase in normal-faulting type earthquake events after water storage, with the dominant orientation of the inferred fault planes consistent with the major local structures or fault zones, suggesting that seismic activity is controlled by the local tectonic environment [13].
Figure 1 presents the distribution of seismic activities in the reservoir research area from 2016 to December 2023, while Figure 2 shows the M-T diagram and the daily frequency-water level time series chart. Consistent with Guo et al. [12], based on stratum lithology, geological conditions, hydrogeology, and seismic activities in the reservoir area, this paper divides the area within 10 km of both banks of the main channel of the Jinsha River and the Heishui River tributary into three zones (A, B, C) and an eastern area affected by the Ludian earthquake (E Zone) for analysis (refer to Figure 1). Zone A experienced one magnitude-4 earthquake, while fault zones such as the Zemuhe Fault, the northern segment of the Xiaojiang Fault, and the Si Kai-Jiujie River Fault in Zones B and C intersect with the reservoir water body and exhibit hot spring outcrops, indicating these faults may possess water-conducting properties. Prior to impoundment, earthquakes mainly occurred along the Zemuhe and northern Xiaojiang Faults. Over the past two and a half years of reservoir impoundment, earthquake depths in the fault zones remained generally consistent with those before impoundment, albeit with an increased frequency, implying that the depth of post-impoundment earthquakes is also primarily controlled by the major regional fault zones. Meanwhile, locations without pre-impoundment seismic activities showed significantly shallower earthquake depths, such as those occurring around Hulu Kou to Luo Ge Town and on the eastern side of the Heishui River tributary, all at about 5 km deep. These areas consist of carbonate mylonitized breccias and squeezed lens bodies with multiple hot springs, suggesting that they could be small-scale karst collapse earthquakes induced by reservoir loading and flooding expansion. As the reservoir water infiltrates rock fissures and bedding planes, cracks may interconnect, with their tips possibly branching out, leading to multi-directional microfractures, thus resulting in the complexity and randomness of the slip modes. Figure 2 illustrates the correlation between seismic activities and variations in reservoir water levels.

3. Method and Data

3.1. Method

The key to obtaining source spectra lies in the process of restoring observational data recorded at stations back to the source, which necessitates corrections for factors such as elastic and inelastic attenuation along the propagation path, as well as station site effects. There are multiple methods employed for calculating seismic source parameters [14]. The extensively used spectral ratio method (EFG) directly eliminates the influences of path and site effects by using the spectral ratio of earthquakes of different magnitudes occurring at the same location, thereby directly yielding the spectral parameters of larger earthquakes [15]. However, this method requires earthquake pairs (EGF) and does not yield individual results for every earthquake. Given the abundance of observational data provided by the seismic network in the Baihetan Reservoir area [16,17,18,19], this study employed a multi-station, multi-earthquake joint inversion approach. Initially, the regional medium attenuation [20] and the site response model for each station. Moya et al. are inverted using the observational data [21]. Subsequently, waveform data from each earthquake are corrected directly to restore the information back to the source, thus yielding the corresponding source spectrum parameters [16,19]. This method is suitable for small-scale seismic network-based calculations and studies of source parameters, with its advantage being that it first establishes a Q attenuation model for the network’s scope and individual site effect models for each station, subsequently allowing for the derivation of source parameters for each earthquake. The specific principle operates as follows.
In the frequency domain, the seismogram recorded by the seismograph at station j for the i th earthquake can be expressed as [15]:
U i j f S i f ϕ i θ i j , δ , λ P i j f L j f + N j f S u r f j I j f
where U i j f is the displacement spectrum of the ith earthquake recorded at the jth seismic station. f is the frequency, S i f is the source spectrum of the i th earthquake, and ϕ i θ i j , δ , λ is the radiation pattern of the ith earthquake. θ i j is the azimuth angle of the j th seismic station relative to the i th earthquake source, while δ and λ   represent the dip angle and slip angle of the fault plane, respectively; P i j f is the propagation path effect from the i th earthquake to the j th seismic station, also known as the Green’s function, describing the attenuation of seismic waves during their propagation; L j f   is the local site effect at the jth seismic station, which is the amplification effect of the near surface geological medium near the station to seismic wave; N j f is the ground motion noise near the j th seismic station; I j f   is the instrument response of the j th seismic station, converting ground motion into seismic instrument records, also known as the transfer function; S u r f j     is the free surface effect at the near-surface ground of the seismic station. From Equation (1), it can be observed that to obtain the source spectrum S i f , it is necessary to eliminate the influence of other terms on the right-hand side of the expression.
In the study, the initial seismic records were first processed by removing noise and instrument response. SH waves were chosen due to their free surface effect S u r f j = 2   to better eliminate the influence of the surface. The average effect of the radiation pattern ϕ i θ i j , δ , λ   was employed to remove the influence of the source radiation pattern. The propagation path effect P i j f can be represented as follows:
P i j f = G i j e π R i j f V Q f
where G i j   is the geometrical spreading factor, R i j   is the focal distance, V   is the seismic wave propagation velocity, and Q f is the quality factor of the medium. Tsehe geometric spreading is described using a segmented model [20] based on the seismic wave’s propagation path. The quality factor of the medium c f can be expressed in terms of the non-elastic attenuation coefficient:
Q f = log e π f c f V s
First, the method of multi-station and multi-source joint inversion proposed by Atkinson et al., is used to calculate the Q-value for the region, to obtain the relationship Q f = Q 0 f η . Assuming that the source spectra of the same earthquake obtained by different stations are the same, the specific calculation principle of Atkinson’s method is: ① Set the site response of all stations to be 1 (without considering the site response), and for a given inelastic attenuation coefficient, c(f), obtain the amplitude of the source spectra of the corresponding earthquakes by geometric diffusion and inelastic attenuation corrections of the station recordings, and adjust the magnitude of the value of c(f) to minimize the residual difference between the source spectral amplitudes of the same earthquake obtained by each station; ② the source spectrum of an earthquake is set to be the average of the source spectrum amplitudes obtained by different stations, and the logarithm of the site response of each station is the average of the difference between the logarithm of the source spectrum amplitudes obtained by that station and the logarithm of the source spectrum amplitude of the earthquake; ③ the corrected source spectrum amplitudes of each station are recalculated by considering the site response of each station, and the residual difference between the source spectrum amplitudes obtained for the same earthquake is minimized by adjusting the c value. The Q-value of the region is then obtained by using Equation (3).
Then, the site response can be obtained from the seismic records of different earthquake events at a given seismic station, assuming that the seismic source parameters are known. By using a genetic algorithm, different seismic source spectrum parameters are sought to minimize the standard deviation of the site responses obtained from different events. This process aims to obtain the most stable site response and seismic source spectrum parameters. This method has been widely applied [21]. The theoretical seismic source spectrum model is represented as:
S i f = Ω 0 1 + f f c γ
In the equation, the low-frequency asymptotic value of the seismic source spectrum Ω 0 is known as the zero-frequency spectrum value, which is referred to as the seismic source spectrum amplitude. The frequency at which the low-frequency asymptotic line intersects with the high-frequency asymptotic line is known as the corner frequency f c . The shape of the corner in the seismic source spectrum is usually controlled using the Brune model ω 2 [22], which is derived from the faulting theory, where γ in Formula (4) is equal to 2.
Finally, based on the Brune circular crack model, the following expressions are used to calculate seismic source parameters such as seismic moment, source radius, stress drop, radiated energy, and apparent stress [22]:
M 0 = 4 π ρ V s 3 Ω 0 2 R ϑ ϕ
r = 2.34 V s 2 π f c
Δ σ = 7 M 0 16 r 3
E r a d = 4 π ρ β 2 0 V 2 f d f = 8 π 4 ρ V s Ω 0 2 f c 3
Although Brune’s theory of computation of body wave spectrum is based on the model ω 2 , his results are also applicable to other source models. In this study, the assumptions are made that the average values for the medium density ρ = 2.7   g cm 3 , S-wave velocity V s = 3.5 km/s, and SH-wave radiation pattern coefficient R ϑ ϕ are taken as 0.41 [23].

3.2. Data

Since 2016, the research team has deployed a total of 76 reservoir earthquake monitoring stations along the lower reaches of the Jinsha River Reservoir area. These stations, in conjunction with the Qiaojia Array’s 62 stations and an additional 33 stations across Sichuan, Yunnan, and Guizhou provinces, have formed a reservoir seismic monitoring network consisting of nearly 200 stations, with station spacing within the Baihetan Reservoir area being less than 10 km apart. Among the instruments used are broadband seismometers including the CMG-40T from Guralp Systems, the CMG-3T ultra-wideband seismometer, and a smaller number of BBVS-60 broadband seismometers. This monitoring network has continuously observed and recorded the seismic activity before and after the impoundment of the Baihetan Reservoir, as well as the changes that occurred. In this study, the Baihetan Reservoir area (26.0° N~28.0° N, 102.0° E~104.0° E) was designated as the study area, focusing on calculating seismic source parameters for earthquakes with ML ≥ 1.5, the maximum magnitude reached was ML4.7, and the earthquake hypocentral depths ranged from 0 to 18 km. The locations of the earthquake sources were derived from the results of tomographic double-difference (tomoDD) processing applied to the initial station-based locations provided by the network [12,24].

4. Results and Analysis of Seismic Source Parameter Calculation

In this study, a criterion was established where earthquakes were included for regional Q value modeling and site response calculations if they were recorded by at least three or more stations, with each station recording a minimum of three or more earthquakes. Consequently, 90 stations within the reservoir network range and 266 earthquakes with local magnitudes ML ≥ 2.0 were selected. The distribution of ray paths associated with these chosen earthquakes and stations is illustrated in Figure 3.
The resulting non-linear attenuation relationship derived for the Baihetan region is as follows: Q f = 104.8 f 0.836 . This model exhibits a relatively large η value and a smaller Q 0 . For comparison, previous research by Hua et al. calculated the non-linear attenuation for the Three Gorges Reservoir area to be Q f = 112.0 f 0.918 [19], while for the Longtan Reservoir area in Guangxi, it was found to be Q f = 145.5 f 0.794 . The similarity between these results and those obtained from the present study suggests that areas hosting high dams and large reservoirs generally have lower uniformity in their subsurface media properties.
The geological bedrock beneath most stations in the Baihetan Reservoir area consists primarily of limestone, with minor occurrences of sandstone and basalt. Figure 4 presents the computed site response results for some of the seismic stations, with the majority showing amplification factors ranging from 0.1 to 10.0, with many stations having responses close to unity. These site response results indicate that most stations are situated on good foundation conditions; however, a minority of the site response patterns might be influenced by local environmental conditions and topographical features specific to the station’s location.
Based on the obtained results of non-elastic attenuation and site response, 459 reliable seismic source spectra (Figure 5) and seismic source parameters were obtained, with a magnitude range of ML 1.5~4.7, their corresponding seismic moment M0 ranged from 2.03 × 10¹² to 1.45 × 10¹⁶ N·m. The range of corner frequency f c was 2.0~10.0, and the source size ranged from 130 to 480. The stress drops ranged from 0.12 to 61.24 MPa.
As can be seen in Figure 6, prior to reservoir impoundment, the earthquakes with larger stress drops predominantly occurred in Region E, whereas after impoundment, those with significant stress drops were mainly concentrated in Region C. Before water storage, out of the three magnitude-4 earthquakes that took place, two happened in Region E and one in Region A, releasing stress drops of 13.36, 18.51, and 30.42 MPa, respectively. Following the initiation of water storage, three earthquakes above magnitude 4 occurred, with two taking place in Region C (Qiaojia Hulukou Town), which experienced the largest increase in reservoir water coverage and loading, and one in Region E, releasing stress drops of 61.24, 51.20, and 11.10 MPa, respectively. Aside from these six magnitude 4 earthquakes where stress drops exceeded 10 MPa, the vast majority of earthquakes showed stress drops less than 10 MPa, with a remarkable 73.3% of them falling within the range of 0.1 to 2.0 MPa.

5. Analysis and Discussion

5.1. The Relationship between Source Parameters

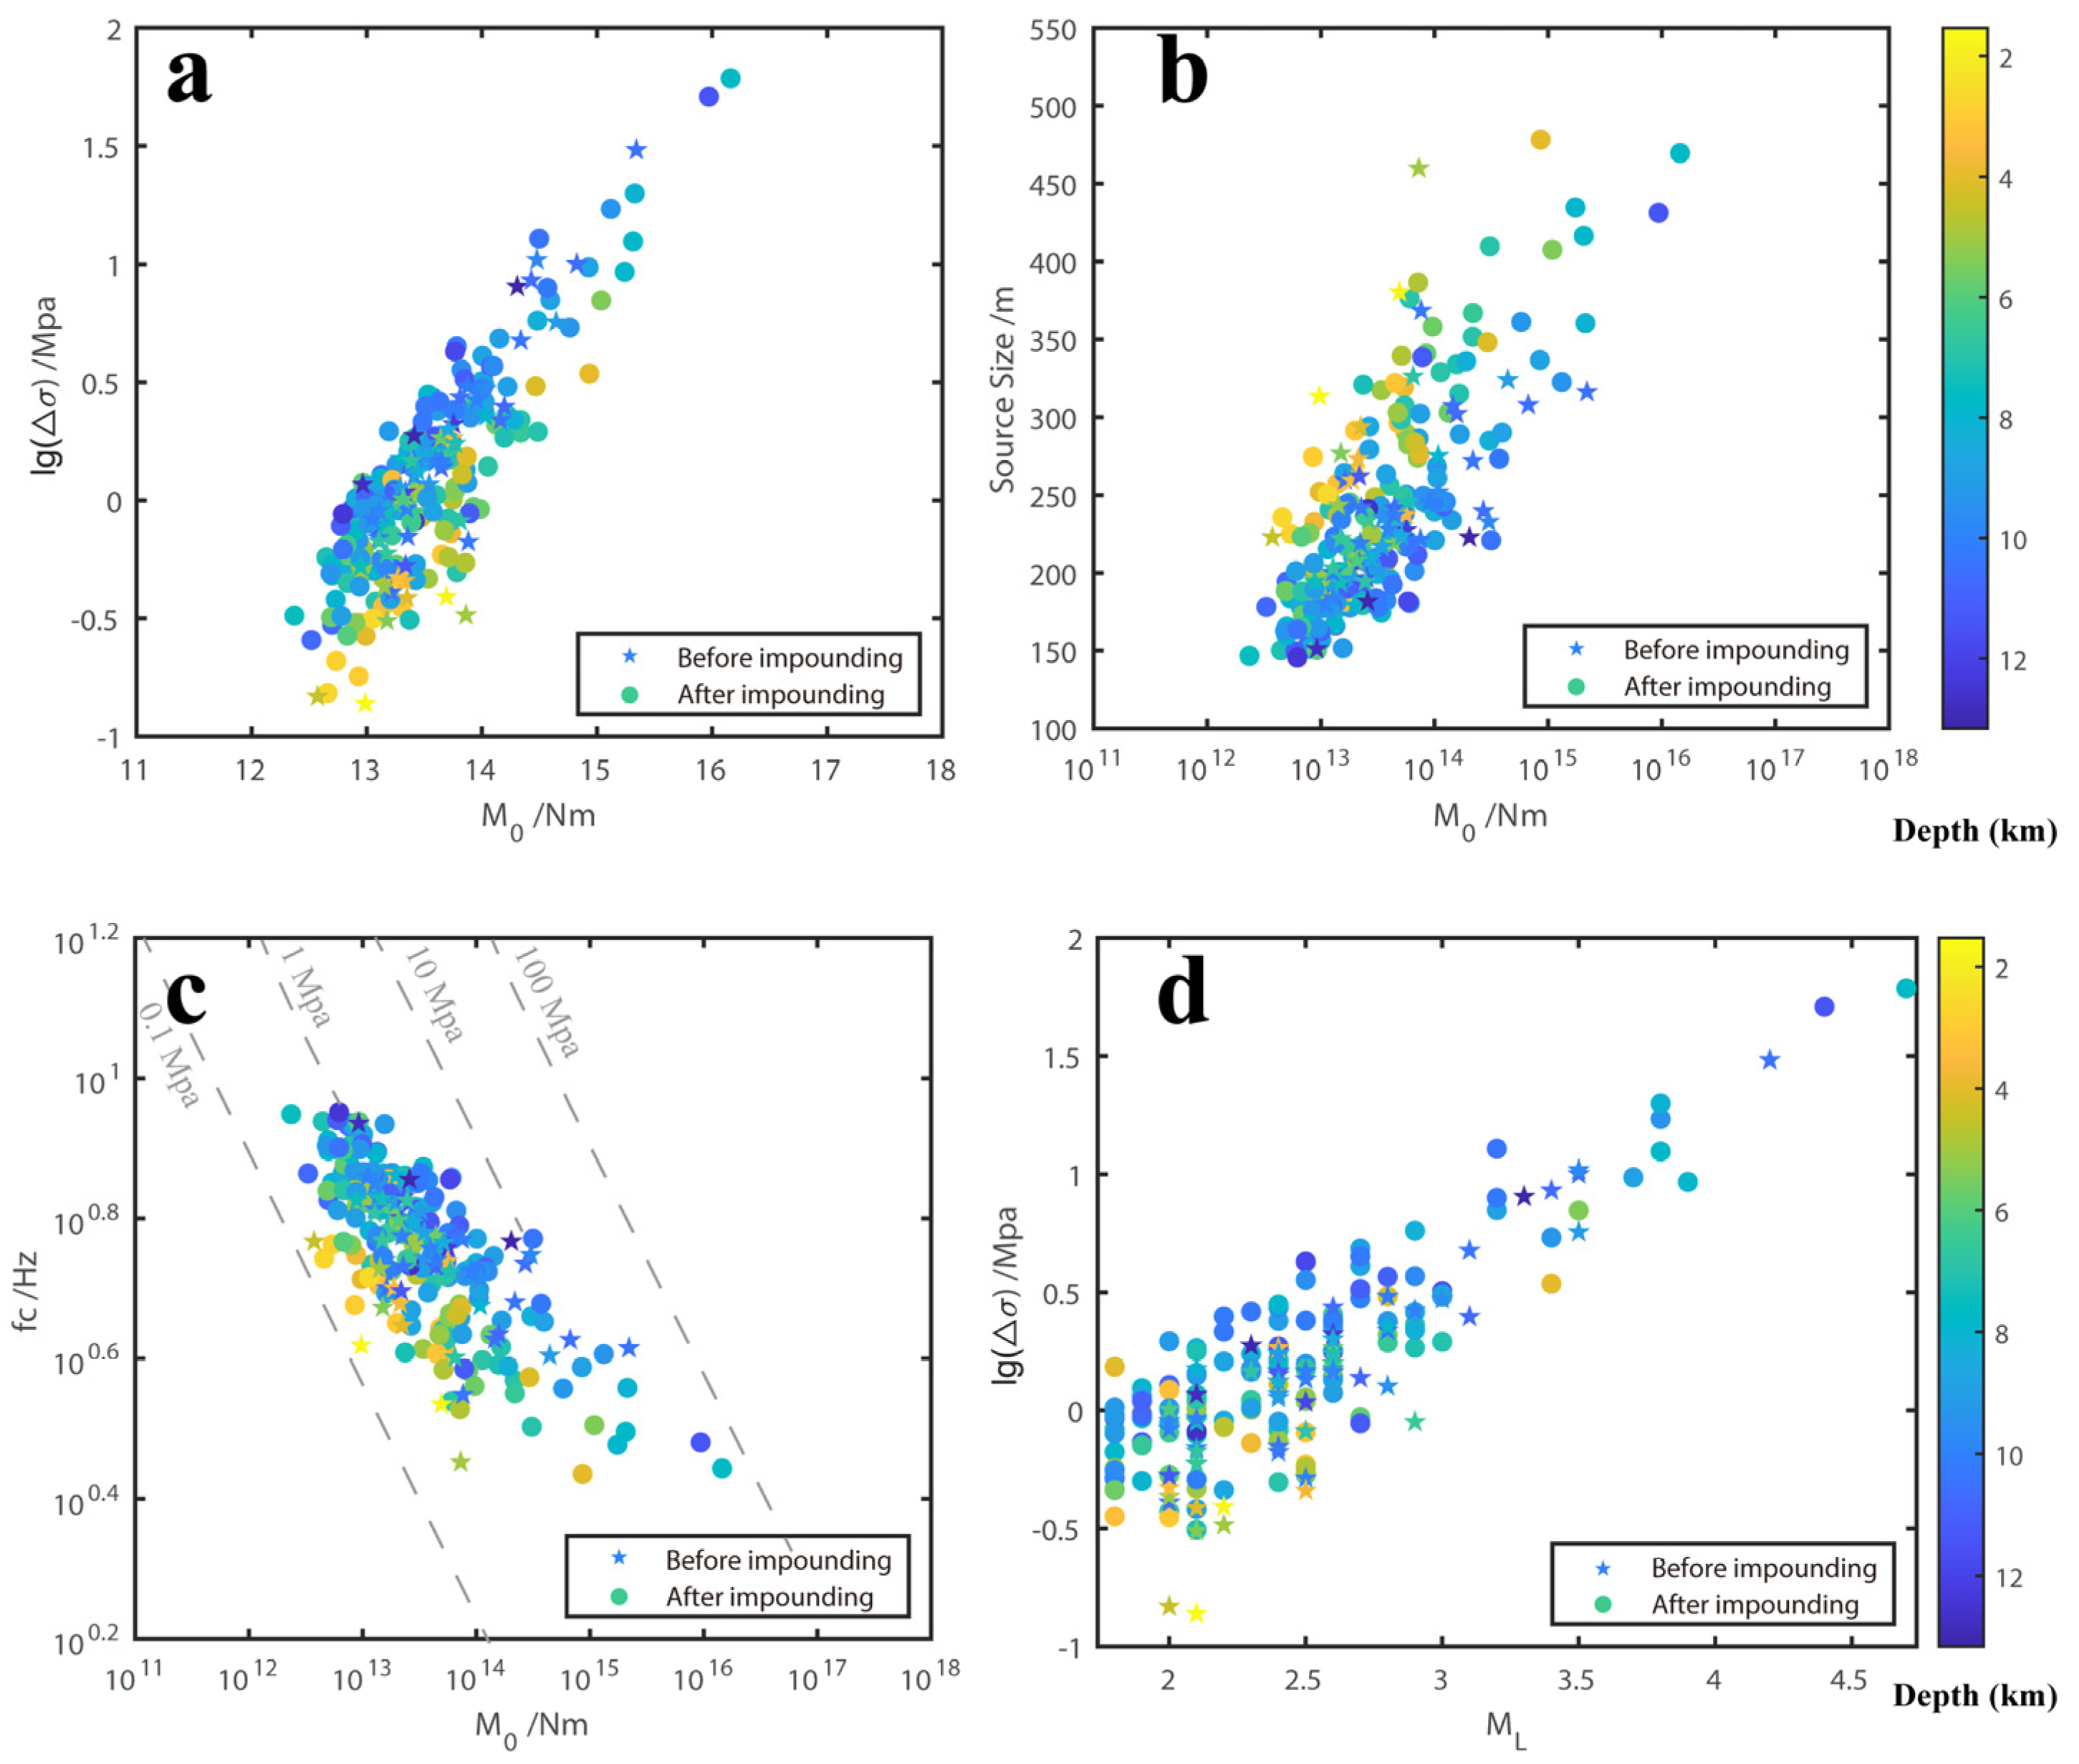
The relationship between source parameters, commonly referred to as scaling relations, is intimately linked with the self-similarity of earthquakes and plays a pivotal role in elucidating the physical mechanisms behind seismic events. However, discrepancies in stress drop values obtained through different methods have led to numerous contradictions and uncertainties regarding this issue [14,25]. Some studies suggest that stress drops for small earthquakes increase with increasing magnitude [26], while others argue that they remain constant [14], or propose systematic changes over time for repeating earthquakes [27], or exhibit multifractal characteristics [28,29]. Research on source parameters in the Koyna Reservoir region in India indicates that scaling laws can differ during various stages of reservoir impoundment. As shown in Figure 7, the study reveals a positive correlation between stress drop, corner frequency, and source dimension with local magnitude for earthquakes in the Baihetan Reservoir area ranging from 1.5 ≤ ML ≤ 4.7. This suggests that stress drop and rupture size generally increase with increasing magnitude, and for earthquakes of the same magnitude, those occurring at shallower depths tend to have smaller stress drops, lower corner frequencies, and larger rupture dimensions. Previous research [16,30,31,32] has suggested that stress drops for reservoir-induced earthquakes are lower than those for tectonic earthquakes, and can be typically one order of magnitude lower when the magnitude ML 1.0~1.9 [16,32]. The asterisks in Figure 7 represent earthquakes before water storage and, according to our findings, there is no significant difference between stress drop values before and after impoundment. The fitting results for the scaling relationships before and after reservoir impoundment are presented in Equations (9)–(12). The correlation coefficients of l g Δ σ and l g M 0 before and after impounding were 0.85 and 0.86, and the correlation coefficients of l g Δ σ and M L before and after impounding were all 0.87. This shows that there is a significant positive correlation between l g Δ σ and l g M 0 , as well as l g Δ σ and M L . The correlation coefficients of l g f c and l g M 0 before and after impounding are −0.49 and −0.79, and the correlation coefficients of r and l g M 0 before and after impounding are 0.74 and 0.57.
Before impoundment:
l g Δ σ = 0.74 l g M 0 9.91
l g f c = 0.09 l g M 0 + 1.93
After impoundment:
l g Δ σ = 0.57 l g M 0 7.61
l g f c = 0.14 l g M 0 + 2.70
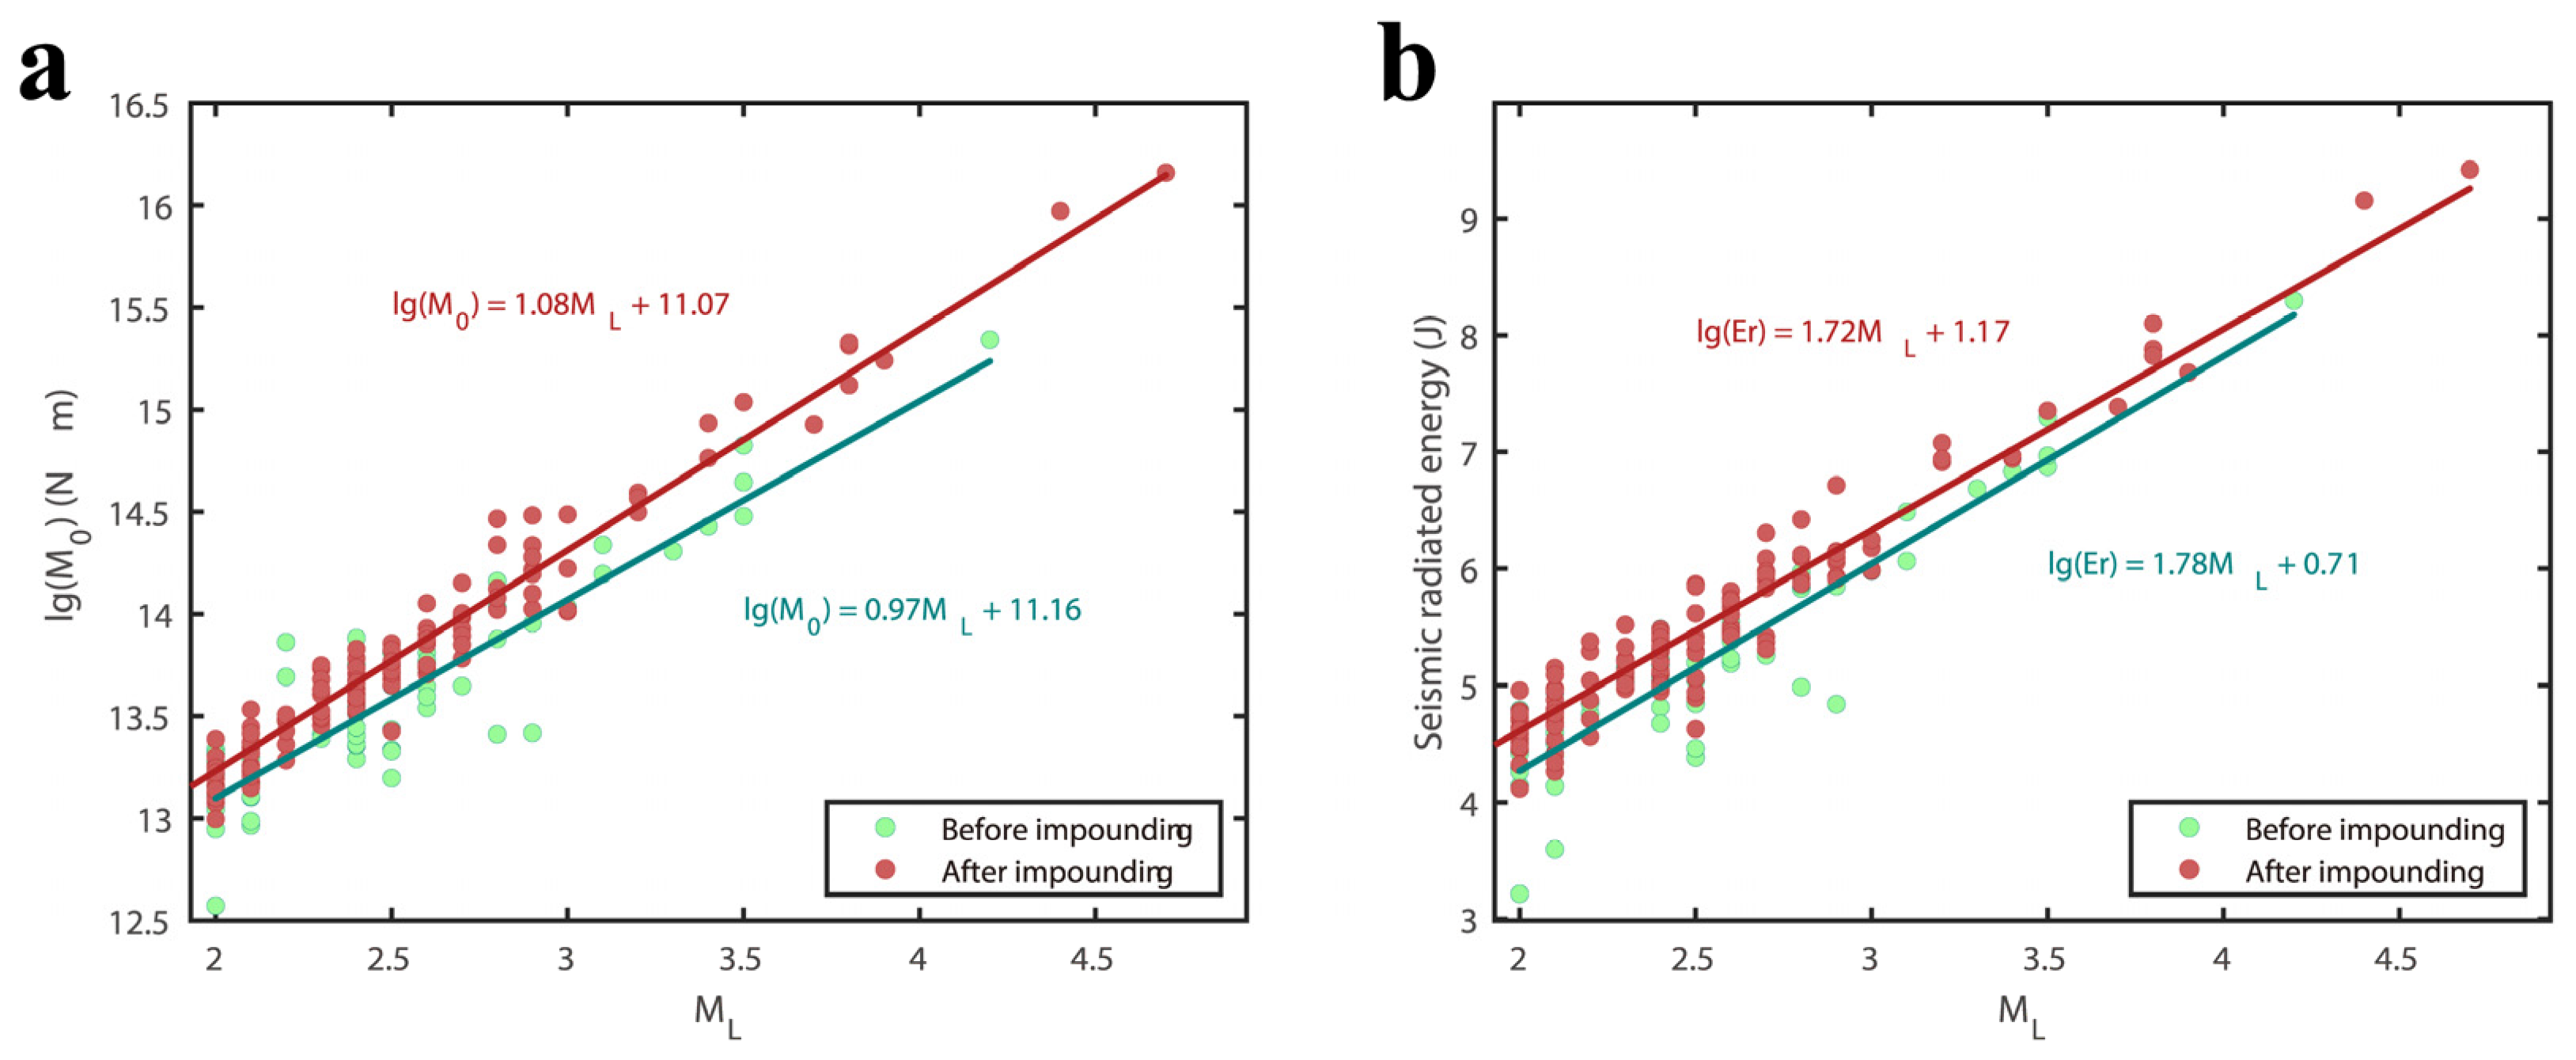
We fitted the relationships between seismic moment, radiated energy, and local magnitude M L for earthquakes both before and after impoundment (Figure 7, Equations (13) and (14)). The relationship between seismic moment and magnitude aligns with the basic consistency found by other seismologists worldwide. The corner frequencies of the 460 earthquakes varied between 2 and 10 Hz, which is generally lower compared to typical tectonic earthquakes. This phenomenon has also been observed in studies on reservoirs such as Zipingpu Reservoir [33] and Shanchi Reservoir in Wenzhou [34]. It shows that the small corner frequency may be the common characteristic of reservoir earthquakes. The reasons for the lower corner frequencies are multifaceted. Yao proposed that this could be attributed to increased fractures, permeation of reservoir water, and reduced rock strength after impoundment [35]. In Figure 8a, it is evident that post-impoundment earthquakes display slightly higher seismic moments for the same magnitude compared to pre-impoundment earthquakes. Figure 8b and Figure 9b demonstrate that the radiated energy for earthquakes below ML3.0 significantly increases after impoundment, approximately by one order of magnitude. These results imply that earthquakes of similar magnitudes in the reservoir area may produce greater intensity and perceptibility following the impoundment, compared to those prior to it, this is consistent with the actual observations reported in the storage area.
l g M 0 = 1.08 M L + 11.0
l g E r = 1.72 M L + 1.17
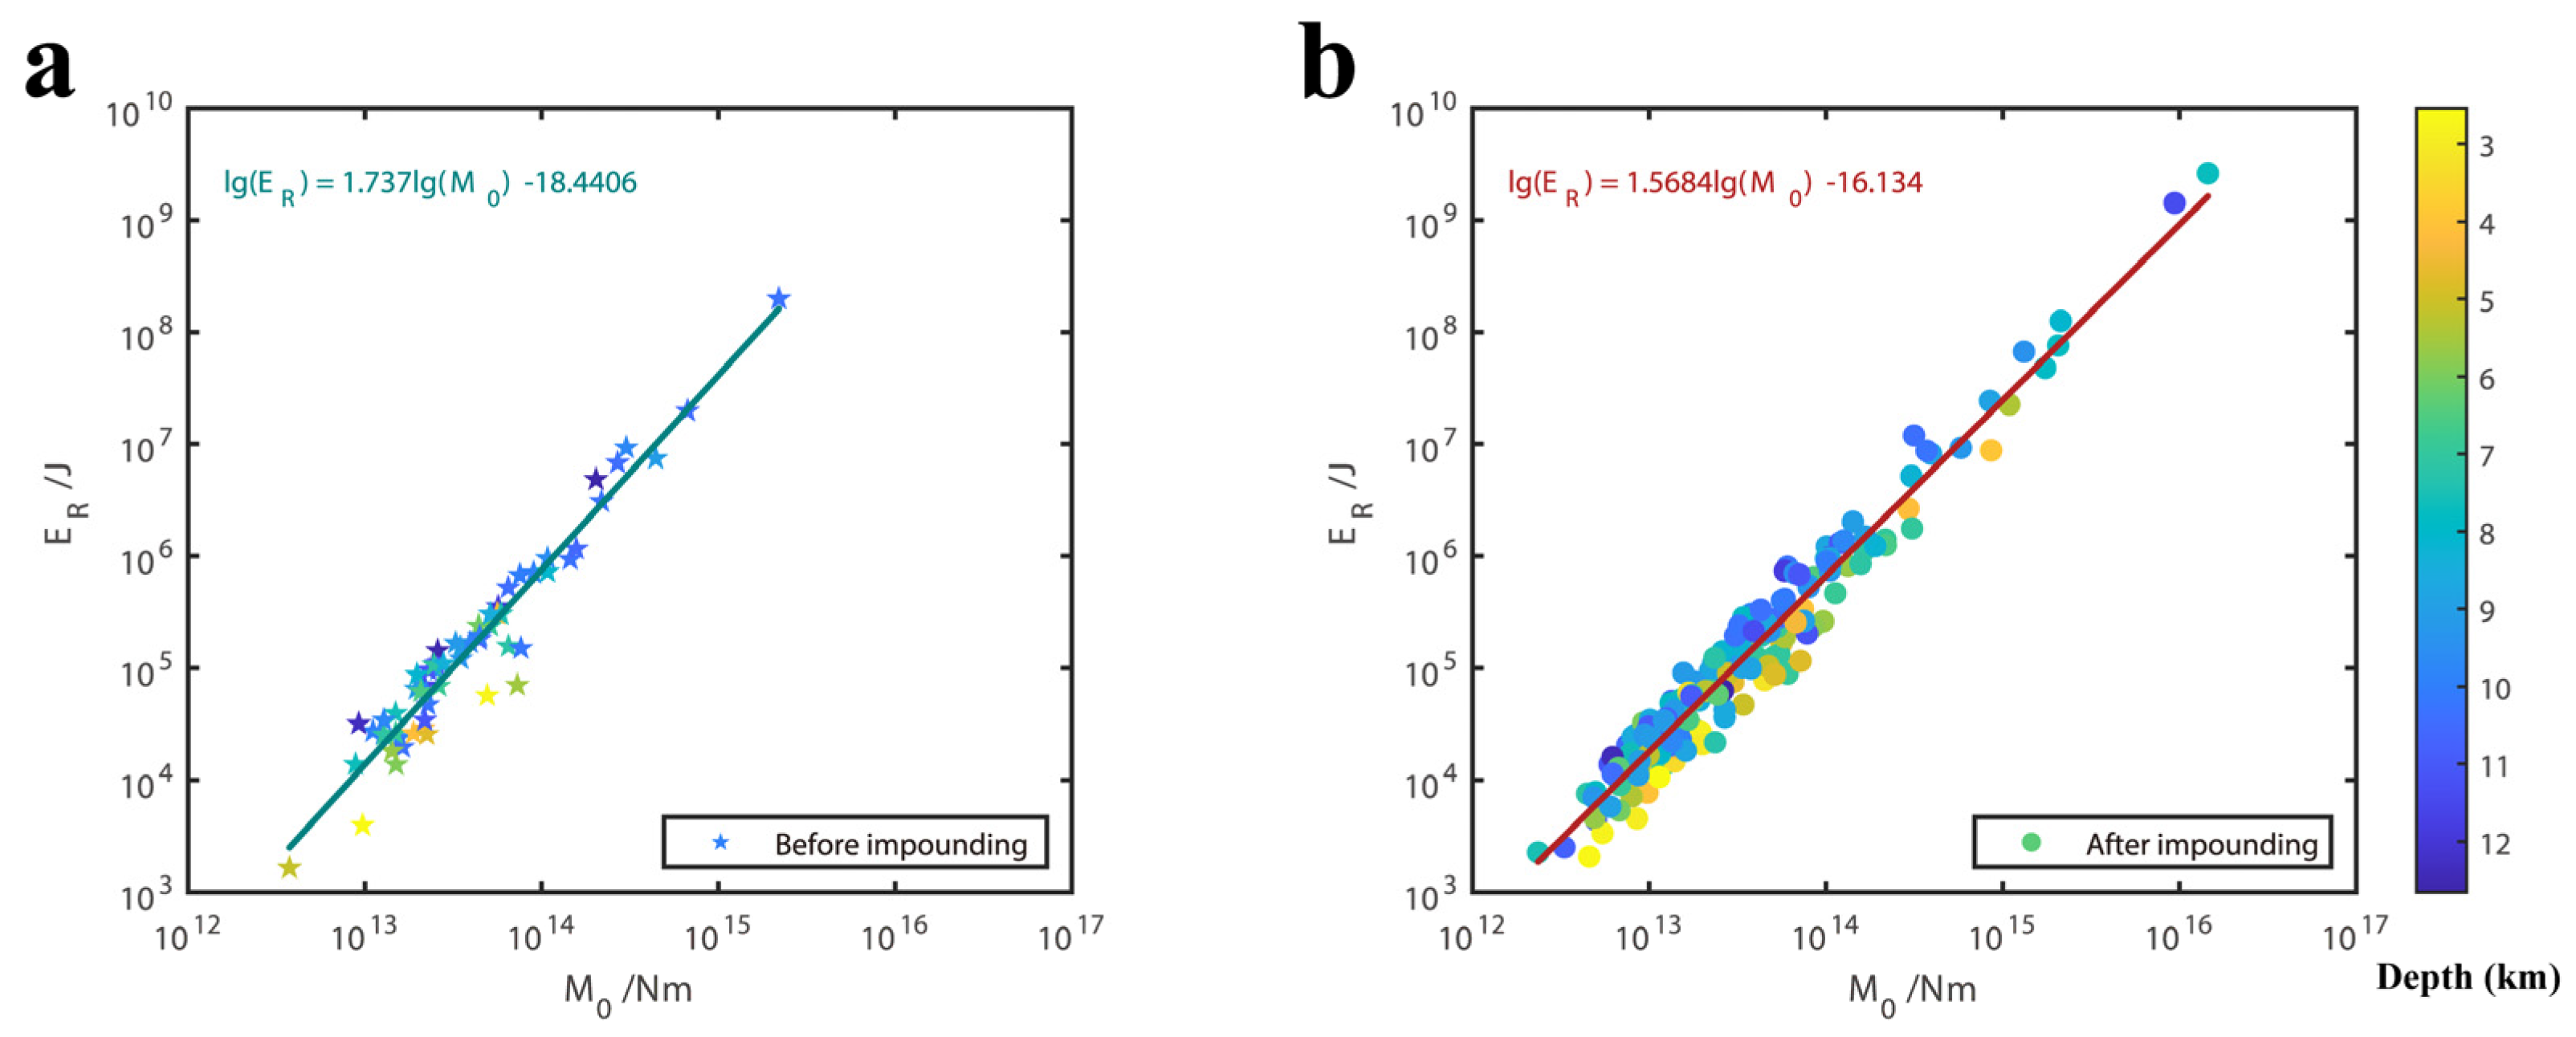
The ratio of the radiated seismic energy to the seismic moment, known as the radiation efficiency or the energy–moment ratio ( E R M 0 ), represents the amount of seismic wave energy emitted per unit seismic moment and is related to the strain involved in the earthquake rupture process. It serves as a critical parameter reflecting the efficiency of seismic energy release. The variations in energy–moment ratios are related to the rupture velocity on the fault and the type of rupture mechanism. As shown in one study [36], earthquakes occurring on faults with high stress accumulation or fresh ruptures tend to exhibit higher energy–moment ratios compared to those that do not involve recent slip. Globally, there exists an excellent linear relationship between seismic wave radiation energy and seismic moment. However, even for earthquakes with identical seismic moments, the differences in the amount of seismic wave energy they radiate can be quite substantial, varying by multiple orders of magnitude. The Baihetan reservoir area predominantly experiences moderate to small earthquakes; the calculated moment ratios are between 4.0 × 10⁻¹⁰ and 2.0 × 10⁻⁷ (Figure 8), respectively, which is significantly lower than the global average of 8 × 10⁵ (with magnitude 5.5 ≤ MS ≤ 9.0) for shallow-source strike–slip earthquakes [36]. Moreover, no substantial difference in the moment ratio was observed before and after water impoundment, suggesting that the stress environment in this area has not undergone significant change due to reservoir impoundment thus far.

5.2. The Relationship between Stress Drops and Earthquake Magnitude and Water Storage

Table 1 presents the average stress drops for earthquakes of magnitudes 2, 3, and 4 in the three sections before and after impoundment. The stress drop for magnitude 2 earthquakes was slightly lower post-impoundment compared to pre-impoundment. Before water storage, a magnitude 4 earthquake occurred on the western side of the Si Kai-Jiaoji River Fault Zone; however, following impoundment, earthquakes mainly clustered in a small area between its eastern flank and the Jinsha River. Post-impoundment, the mean stress drop for magnitude 3 earthquakes was approximately 8.0 MPa. In Regions B and C, the average stress drops for magnitude 2 earthquakes remained relatively consistent before and after reservoir filling, while the stress drops for magnitude 3 earthquakes were higher after impoundment (double that of pre-impoundment levels in Region B). Notably, the two magnitude 4 earthquakes that took place in the Qiaojia Basin within Region C after impoundment exhibited significantly higher stress drops than the pre-impoundment magnitude 4 earthquake. Region C, a roughly 20 km long segment situated within the Qiaojia Basin, with its central Hulukou Town submerged after impoundment, reaching depths close to 200 m and widths up to about 3 km, experiences the most substantial reservoir loading among all segments. The magnitude 4.7 and 4.2 earthquakes occurred during October 2022 when the reservoir water level reached its second peak at 825 m and in March 2023, when it significantly receded to the low water level of 780 m. These two 4-level earthquakes were located on the eastern and western branches of the northern segment of the Xiaojiang Fault, with their focal mechanisms being strike–slip faulting, respectively. In contrast, the earthquake that took place in Region A prior to impoundment had a thrust mechanism [13]. Studies suggest that the average stress drop for normal faulting earthquakes is generally less than that for thrust mechanism earthquakes [37]. Therefore, it can be inferred that the two magnitude 4 earthquakes in the C section might be closely related to fluid actions and the loading and unloading of reservoir capacity. Furthermore, the mean stress drops for both magnitude 2 and 3 earthquakes in Region E remained consistent before and after impoundment, indicating that this area was not affected by the reservoir’s water storage activities.

5.3. The Relationship between Stress Drops and Depth

In the study of stress drop in small and medium earthquakes [38], it was found that the seismic stress drop in small and medium earthquakes in the Parkfield region of California does not increase with the depth of the epicenter, i.e., there is no dependence of the stress drop on depth [37]. Hardebeck and Aron found that the stress drop in the Hayward Fault in California is around 5 MPa at a depth of 1~7 km, and around 10 MPa at a depth of 7~13 km, and when the depth exceeds 13 km, the stress drop released by earthquakes stabilizes at around 50 MPa [26]. In addition, Goertz-Allmann et al. calculated the stress drop for 1000 small earthquakes near a hydraulic fracturing well in a geothermal area in Switzerland and found that the stress drop increased by a factor of 5 for earthquakes in the range of 10 to 300 m from the fracturing well, revealing the effect of pore pressure perturbation, and the study further concluded that the Brune model stress drop can be used as an indicator for monitoring pore pressure distribution during hydraulic fracturing in environments where elastic parameters are sufficiently known [38].
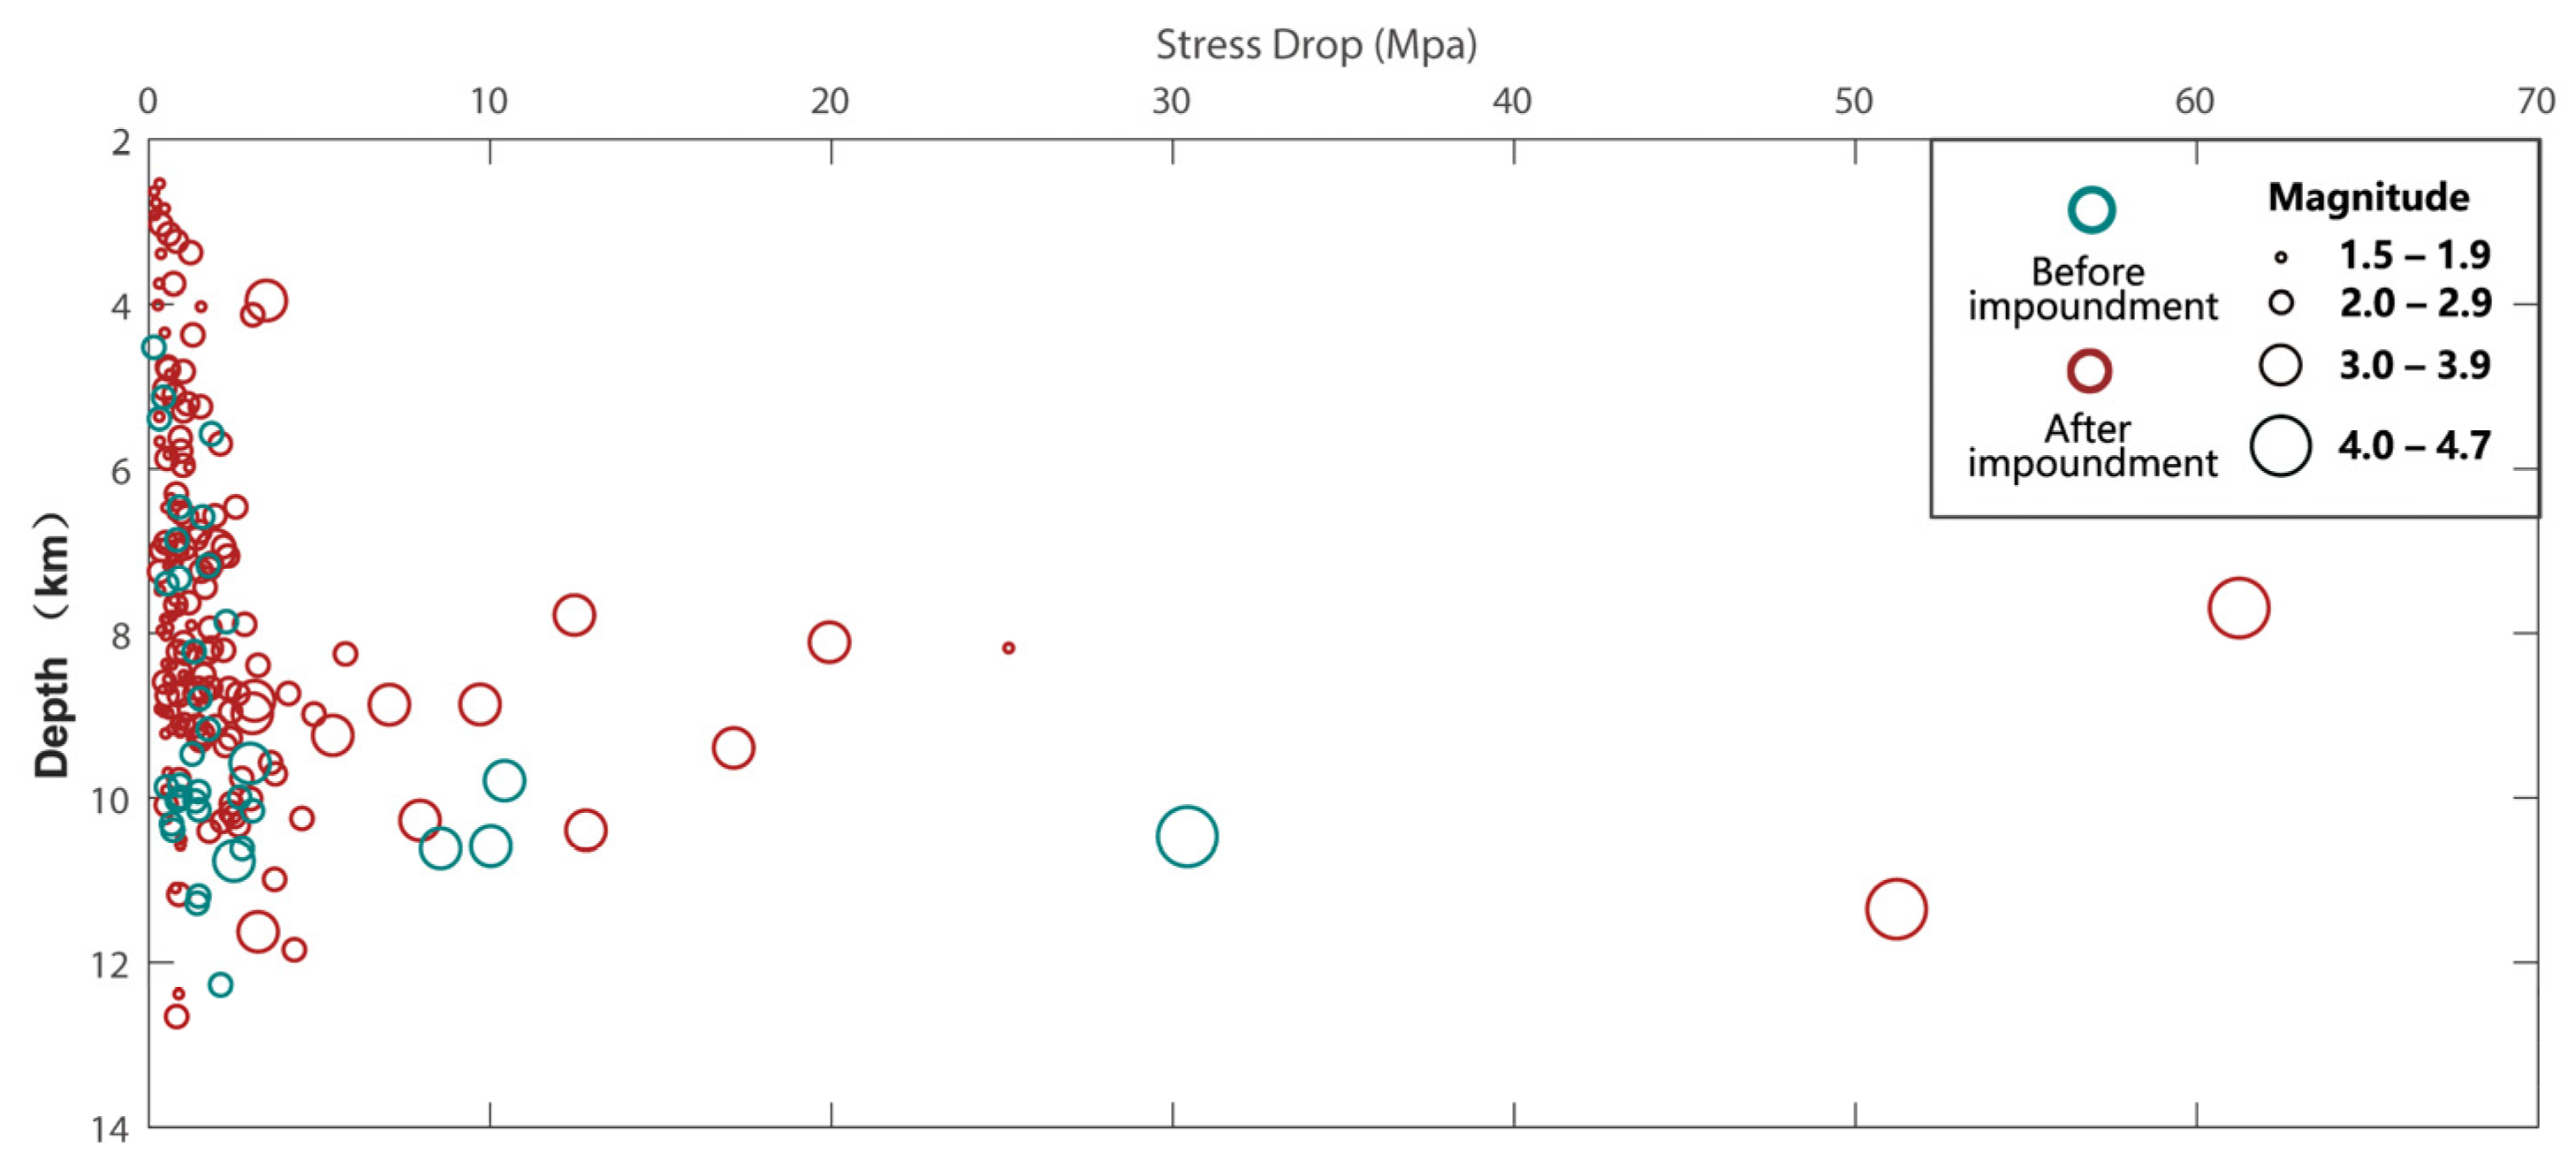
The concern of this paper is not only the depth, but also the variability before and after impoundment of large reservoirs. Figure 10 shows the relationship between seismic stress drop and depth and magnitude in the Baihetan reservoir area (ABC area). It can be seen that there is a positive correlation between the stress drop and the magnitude, which is relatively more obvious for earthquakes above magnitude 3. Generally speaking, the deeper the depth, the greater the stress drop. However, the stress drop of two magnitude 4 earthquakes after impoundment (located in Zone C, respectively, strike–slip mechanism) was significantly higher than that before impoundment (located in Zone A, thrust mechanism), and the stress drop of magnitude 3 earthquakes with a depth of 8~10 km was also higher than that of those with a depth of 10 km or so before impoundment. This revealed that in the rapid adjustment of the water level after the impoundment of the Baihetan Reservoir, the earthquakes occurred under or near the reservoir area had higher stress drops compared with those before the impoundment. Considering the location, depth, water level load, and mechanism solution type of the earthquake in Area C, we speculated that the causes of the earthquakes above magnitude 3 in the reservoir area after the impoundment were mostly the fault instability caused by the diffusion of pore pressure and the flow through the hydraulic channel under the gravity load of the reservoir water.

5.4. Time Distribution Characteristics of Seismic Source Parameters

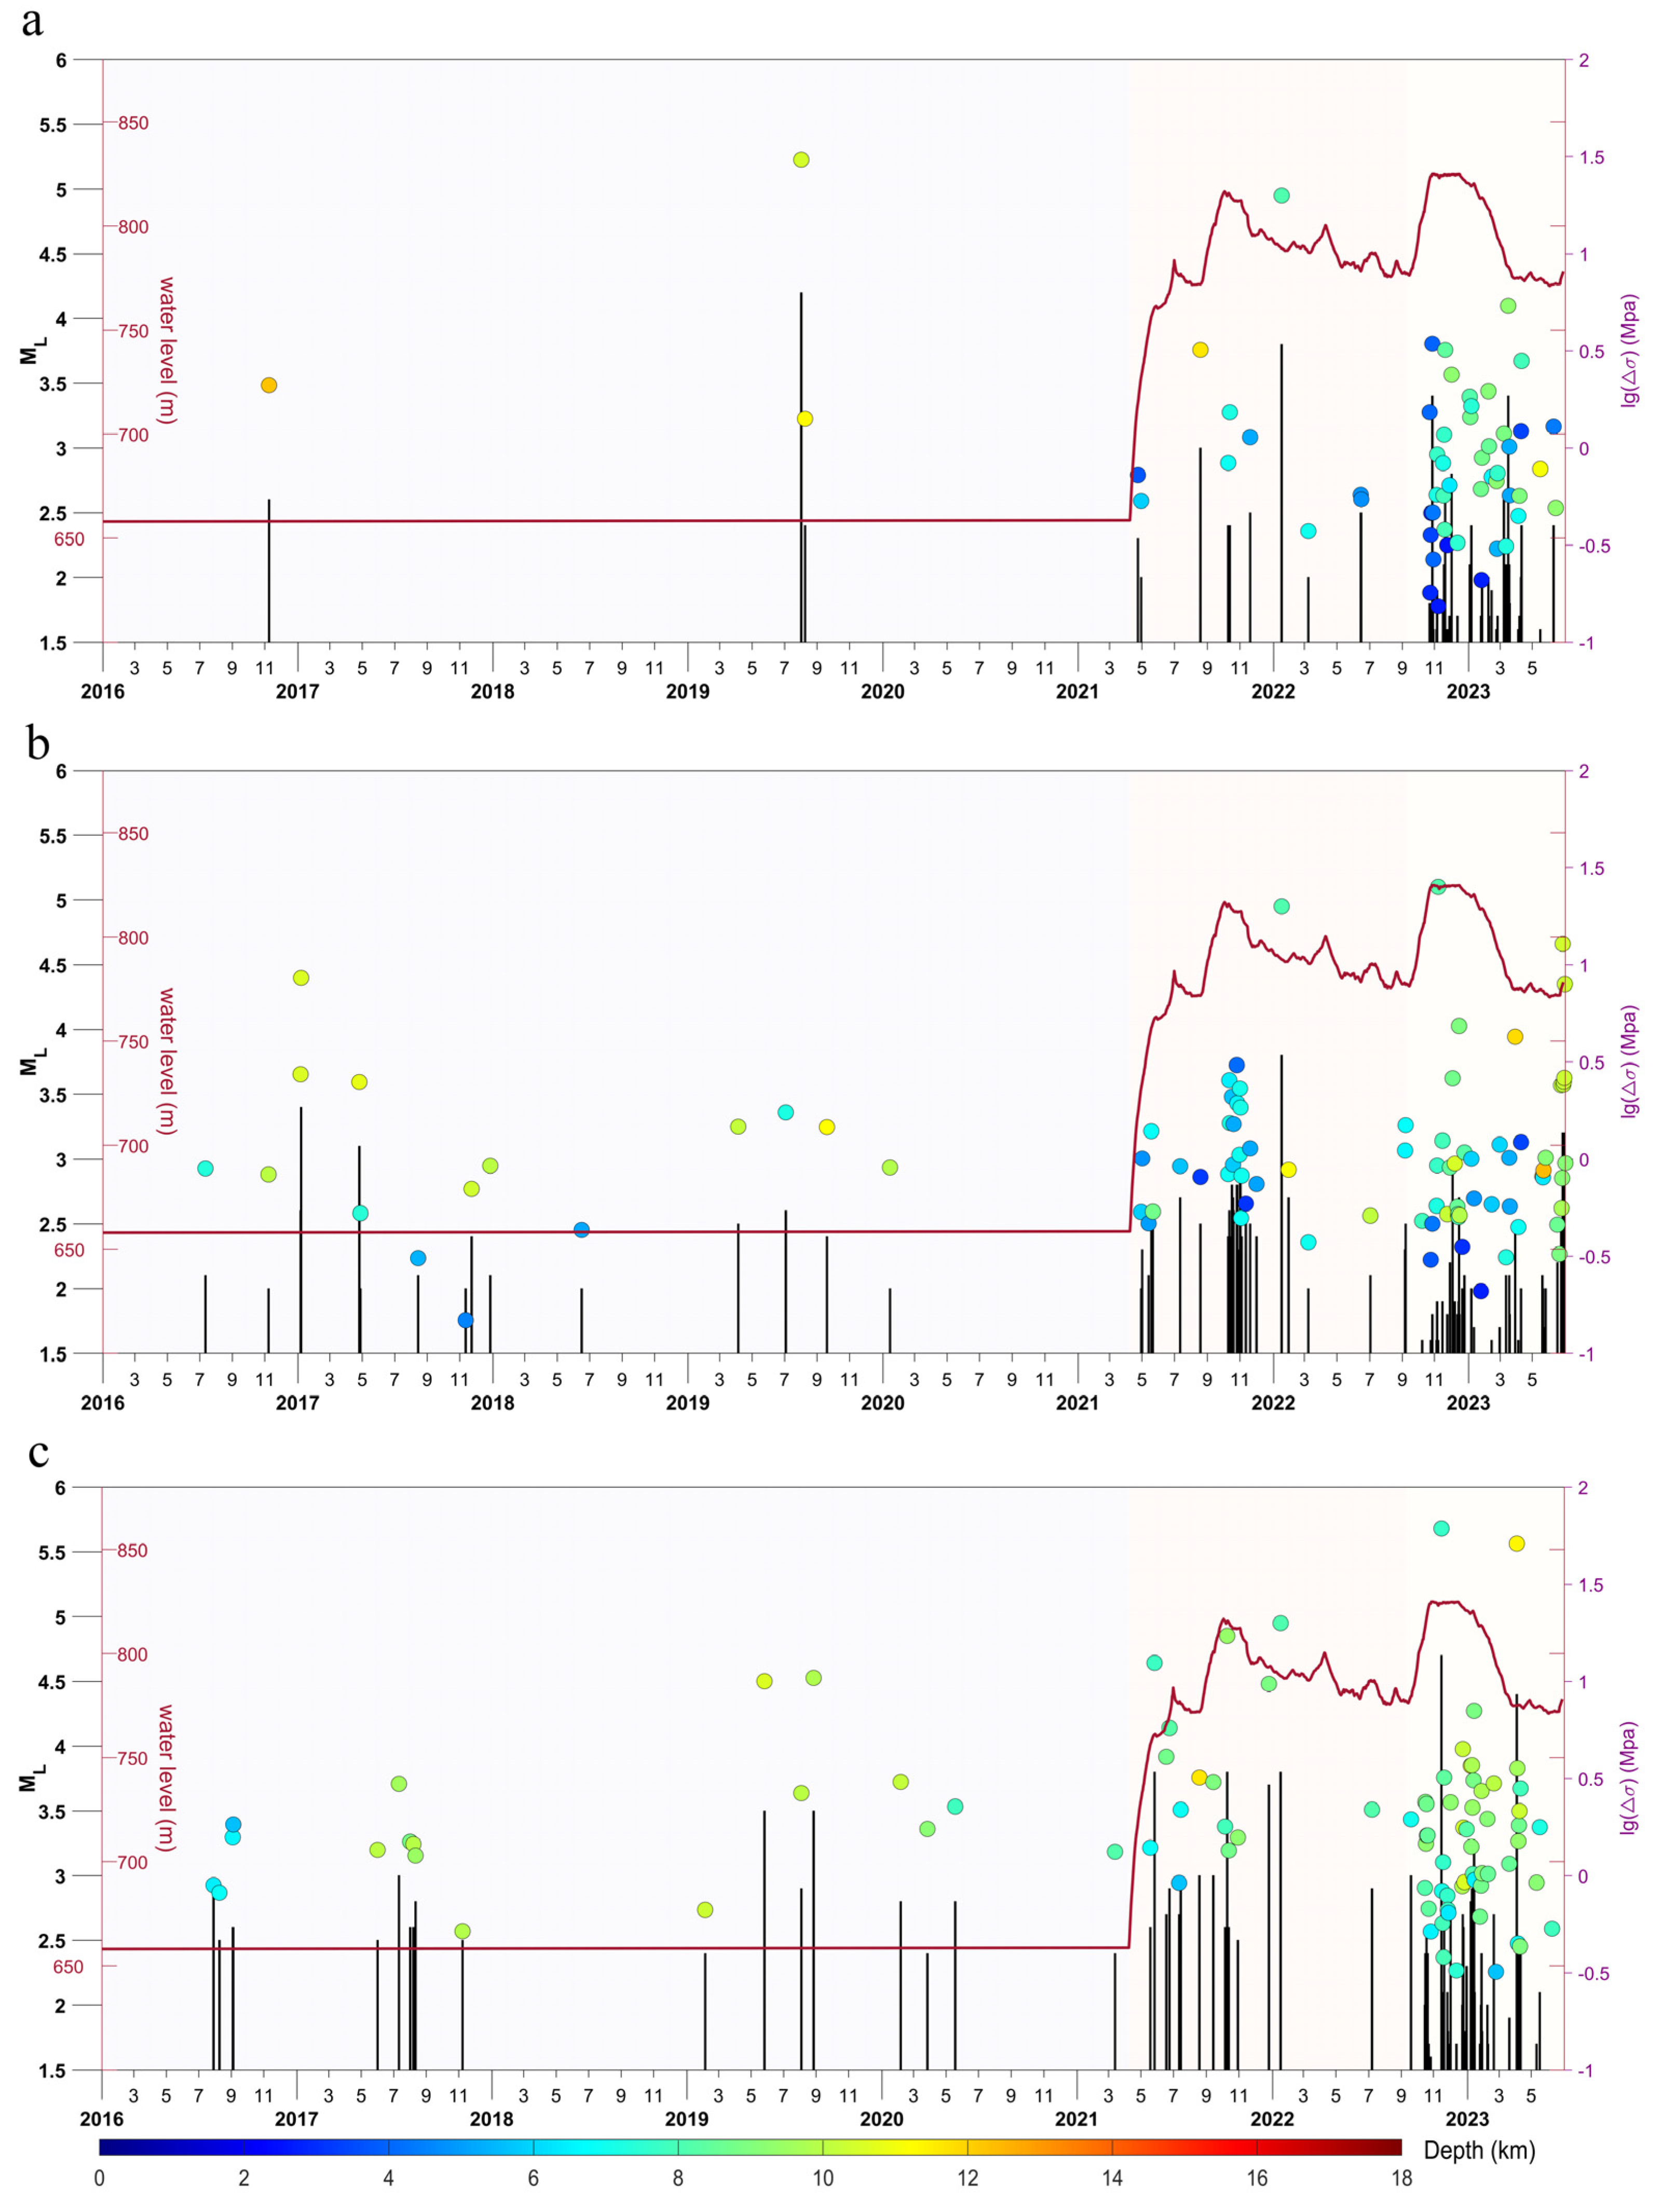
We have drawn the time series of water level, earthquake magnitude, and stress drop in the three zones (Figure 11, where colors represent depth). The water level change process of the Baihetan Reservoir mainly includes a large lifting from April 2021 (from 658 to 821 m, a water level lifting of 163 m) and operation at the high-water level of 770 m, and a water storage-drainage process with an amplitude of 50 m at the high-water level of 770 m from October 2022 to March 2023.
From Figure 6 and Figure 11a, it is evident that before impoundment, seismic activity in Zone A was sparse, with earthquakes occurring primarily on the western side of the Si Kai-Yi Jiao He Fault Zone and at considerable depths. Following the water level increase, clusters of shallow-depth, low-magnitude earthquakes emerged, including the largest recorded M3 event on 15 January 2022, which had a depth of 8.1 km and released a stress drop of 19.94 MPa, approaching that of pre-impoundment M4 events. We can see that the stress drop released during the first water level stage rise was greater than that of the second stage rise.
In Figure 11b,c, there were relatively many earthquakes in which source parameters were calculated before water storage. Before impoundment, the earthquakes in Zone B were mainly distributed along the Zemuhe fault zone with a depth of about 10 km. Since 8 May 2021, when the water level of the tributary of the Heishui River rose more than 30 m, seismic activity began to appear on the east side of the Heishui River along the direction of the Zemu River fault from Hukou Town, showing a zonal distribution consistent with the basin trend between the fault zones of the NNW trend. The farther east from the Heishui River tributary, the shallower the focal depth (about 3 km). The seismic depth on the fault zone is consistent with that before water storage, indicating that 10 km depth is the seismogenic layer depth in the southern section of the Zemuhe fault zone. After impounding, the stress drop released by the earthquake in the two stages of substantial water level rise is higher than that before impounding, and the second stage is higher than that in the first stage.
In Zone C, which is the longest and deepest submerged area along the river valley, housing the northern segment of the Xiaojiang Fault’s eastern and western branches as well as the Qiaojia Basin. Prior to impoundment, seismic activity in this region was mainly concentrated near the eastern branch of the Xiaojiang Fault’s northern segment. Following the reservoir filling, the area experienced increased seismicity, with earthquakes primarily occurring within the basin between the eastern and western branches of the Xiaojiang Fault and also along the western branch of the fault. Consistent with observations in Zone B, after the reservoir water level was significantly raised during both stages, the stress drops associated with earthquakes were higher than those prior to impoundment. In particular, during the second stage, two M4 earthquakes occurred, releasing stress drops that were notably greater than those observed in the first stage. This suggests a strong likelihood of induced tectonic earthquakes related to reservoir operations in the future for Zone C. Based on the above results, we make a preliminary prediction: the heightened seismic response to water level changes may imply that the stress field has been altered to a degree where it may trigger larger magnitude events if similar conditions persist or intensify over time. However, continuous monitoring of the area is still required.

6. Conclusions

The Baihetan Dam, the second-largest hydroelectric project after the Three Gorges Dam, has experienced notable micro-seismic activity following reservoir impoundment. Leveraging high-density seismic monitoring data collected from a network deployed in the downstream Jinsha River area of the Baihetan Reservoir between 2016 and June 2023, we employed multi-station, multiple-earthquake joint inversion techniques to derive Brune model source parameters for 459 earthquakes. On this basis, we examined the relationships among source parameters, the correlation between stress drops and earthquake magnitude and depth, as well as the relationship between source parameters before and after impoundment with changes in reservoir water levels.
It is important to note that this study focuses specifically on the Baihetan reservoir area, which has a unique geological and tectonic setting. The results and interpretations presented here may not be directly generalizable to other reservoir regions with different geological conditions, fault systems, and stress regimes. The response of a reservoir-induced seismicity to water level fluctuations can be influenced by various factors, including the local geology, fault orientations, rock properties, and the reservoir geometry itself. Therefore, caution should be exercised when extrapolating the findings of this study to other reservoir environments. Further investigations in diverse geological settings are necessary to develop a more comprehensive understanding of the mechanisms governing reservoir-induced seismicity and its relationship with water level changes.
Our key findings include:
(1)
Based on the derived seismic wave attenuation model and station’s site response model for the Baihetan Reservoir area, we have recovered the source spectrum and further computed the source parameters for a total of 459 earthquakes within the magnitude range ML1.5 to 4.7 in the Baihetan reservoir region. The results obtained show that the earthquake moments M0 vary between 2.03 × 10¹²~1.45 × 10¹⁶ N·m, corner frequencies f c span from 2.0 to 10.0 Hz, the source dimensions range from 130 to 480 m, and stress drops fall within the interval of 0.12 to 61.24 MPa.
(2)
A positive correlation was observed between seismic stress drop, corner frequency, and source dimension with respect to earthquake magnitude. This means that both stress drop and rupture size generally increase as the magnitude of the earthquake increases. Additionally, for earthquakes of the same magnitude, those occurring at shallower depths tend to have smaller stress drops, lower corner frequencies, but larger rupture dimensions. The corner frequency and rupture scale of earthquakes in the Baihetan Reservoir area are relatively small, which may be the common characteristics of reservoir earthquakes. The reason for the low corner frequency may be caused by the development of reservoir fractures, reservoir water infiltration, and rock strength reduction. We found that the radiation energy of earthquakes below ML3.0 magnitude after impounding was significantly higher than that before impounding, roughly one order of magnitude higher, revealing that the seismic intensity and seismic feeling of earthquakes with the same magnitude are higher than those before impounding.
(3)
In the Baihetan Reservoir area of the Jinsha River, earthquakes following reservoir impoundment can be categorized into relatively shallow karst collapse events and deeper earthquakes induced by regional fault structures. Over the two-and-a-half years since water storage began, as the Baihetan Reservoir’s water level has significantly risen and undergone annual adjustments at high levels, earthquakes occurring near the reservoir have exhibited higher stress drops compared to those prior to impoundment. In particular, for earthquakes above magnitude 3 in Zones B and C, the stress drop values are notably greater after the reservoir is filled, with a gradual increase in released stress drops observed. With the Baihetan Dam continuing its annual water level regulation at high elevations, it is estimated that triggered seismic activity will persist, and there may remain a risk of inducing tectonic earthquakes within the reservoir area over the next several years. The dynamic changes in reservoir water levels, coupled with the inherent geological characteristics and loading effects on underlying faults, indicate an ongoing potential for seismically active periods during the operation of the dam.

Author Contributions

J.S. and C.Z. conceived and designed the study. L.X. collected the data. J.S. analyzed the data and results. J.S. and C.Z. completed the writing of the manuscript. J.S. and C.Z. reviewed and edited the manuscript. J.S. and Z.Y. improved software applications. All authors have read and agreed to the published version of the manuscript.

Funding

This research was funded by the National Key Research and Development Program of China (2021YFC3000703) and the Special Fund of the Institute of Earthquake Forecasting, China Earthquake Administration (CEAIEF20220401).

Data Availability Statement

The data presented in this study are not publicly available due to confidentiality agreements.

Acknowledgments

We thank the four anonymous reviewers for their valuable comments and suggestions, which have improved the quality of this article.

Conflicts of Interest

The authors declare no competing interests.

Abbreviations

RISReservoir-induced seismicity
M0Seismic moments
MLRichter magnitude scale
MSSurface wave magnitude
MWMoment magnitude scale

References

  1. Ding, Y. The Reservoir Induced Earthquake. South China Seismol. 1989, 9, 64–72. [Google Scholar] [CrossRef]
  2. Nikolaev, N.I. Tectonic Conditions Favourable for Causing Earthquakes Occurring in Connection with Reservoir Filling. Eng. Geol. 1974, 8, 171–189. [Google Scholar] [CrossRef]
  3. Gupta, H.K. Reservoir Induced Earthquakes. Currentence 1992, 62, 183–198. [Google Scholar] [CrossRef]
  4. Gupta, H.K.; Rastogi, B.K. Developments in Geotechnical Engineering 11: Dams and Earthquakes. 1976. Available online: https://trid.trb.org/View/48488 (accessed on 1 March 2024).
  5. Rastogi, B.K.; Mandal, P. Foreshocks and Nucleation of Small- to Moderate-Sized Koyna Earthquakes (India). Bull. Seismol. Soc. Am. 1999, 89, 829–836. [Google Scholar] [CrossRef]
  6. Yadav, A.; Shashidhar, D.; Mallika, K.; Rao, N.P.; Rohilla, S.; Satyanarayana, H.V.S.; Srinagesh, D.; Gupta, H. Source Parameters of Earthquakes in the Reservoir-Triggered Seismic (RTS) Zone of Koyna–Warna, Western India. Nat. Hazards 2013, 69, 965–979. [Google Scholar] [CrossRef]
  7. Mahato, C.R.; Shashidhar, D. Stress Drop Variations of Triggered Earthquakes at Koyna–Warna, Western India: A Case Study. J. Earth Syst. Sci. 2022, 131, 106. [Google Scholar] [CrossRef]
  8. Tomic, J.; Abercrombie, R.E.; Do Nascimento, A.F. Source Parameters and Rupture Velocity of Small M ≤ 2.1 Reservoir Induced Earthquakes. Geophys. J. Int. 2009, 179, 1013–1023. [Google Scholar] [CrossRef]
  9. Saadalla, H.; El-Aal, A.E.-A.K.A.; Mohamed, A.; El-Faragawy, K. Determination of Earthquake Source Parameters Using the Inversion of Waveform Data: A Case of Small Earthquakes around High Dam Lake, Aswan Region, Egypt. J. Afr. Earth Sci. 2019, 151, 403–416. [Google Scholar] [CrossRef]
  10. Li, P.; Wang, L. Research on Basic Seismological Characteristics of Yunnan and Western Sichuan Region. Sci. Geol. Sin. 1975, 4, 308–325. [Google Scholar]
  11. She, Y.; Fu, G.; Zhao, Q.; Guo, L. Simulating Changes of Gravity and Coulomb Stress Caused by the Impoundment of the Baihetan Hydropower Station. Chin. J. Geophys. 2021, 64, 1925–1936. [Google Scholar]
  12. Guo, W.; Zhao, C.; Zuo, K.; Zhao, C. Characteristics of Seismicity before and after Impoundment of Baihetan Dam in the Lower Reaches of Jinsha River. Chin. J. Geophys. 2022, 65, 4659–4671. [Google Scholar]
  13. Guo, W.; Zhao, C. Focal Mechanisms and Stress Field Characteristics of Microearthquakes in Baihetan Reservoir in the Downstream Area of Jinsha River. Water 2023, 15, 709. [Google Scholar] [CrossRef]
  14. Abercrombie, R.E. Resolution and Uncertainties in Estimates of Earthquake Stress Drop and Energy Release. Phil. Trans. R. Soc. A 2021, 379, 20200131. [Google Scholar] [CrossRef] [PubMed]
  15. Hartzell, S.H. Earthquake Aftershocks as Green’s Functions. Geophys. Res. Lett. 1978, 5, 1–4. [Google Scholar] [CrossRef]
  16. Hua, W.; Chen, Z.; Zheng, S. Source Parameters and Scaling Relations for Reservoir Induced Seismicity in the Longtan Reservoir Area. Pure Appl. Geophys. 2013, 170, 767–783. [Google Scholar] [CrossRef]
  17. Liu, J.; Zheng, S.; Huang, Y. The Inversion of Anelastic Coefficient, Source Parameters and Site Respond Using Genetic Algorithm. Acta Seismol. Sin. 2003, 16, 226–232. [Google Scholar] [CrossRef]
  18. Zhao, C.; Chen, Z.; Hua, W.; Wang, Q.; Li, Z.; Zheng, S. Study on Source Parameters of Small to Moderate Earthquakes in the Main Seismic Active Regions, China Mainland. Chin. J. Geophys. 2011, 54, 1478–1489. [Google Scholar]
  19. Hua, W.; Chen, Z.; Zheng, S.; Yan, C. A Study on Characteristics of Source Parameters in Three Gorges Reservoir Area. Seismol. Geol. 2010, 32, 533–542. [Google Scholar]
  20. Atkinson, G.M.; Mereu, R.F. The Shape of Ground Motion Attenuation Curves in Southeastern Canada. Bull. Seismol. Soc. Am. 1992, 82, 2014–2031. [Google Scholar] [CrossRef]
  21. Moya, A.; González, J.; Irikura, K. Inversion of Source Parameters and Site Effects from Strong Ground Motion Records Using Genetic Algorithms. Bull. Seismol. Soc. Am. 2000, 90, 977–992. [Google Scholar] [CrossRef]
  22. Brune, J. Seismic Sources, Fault Plane Studies and Tectonics. Eos Trans. Am. Geophys. Union 1971, 52, IUGG 178–IUGG 187. [Google Scholar] [CrossRef]
  23. Stork, A.; Ito, H. Source Parameter Scaling for Small Earthquakes Observed at the Western Nagano 800-m-Deep Borehole, Central Japan. Bull. Seismol. Soc. Am. 2004, 94, 1781–1794. [Google Scholar] [CrossRef]
  24. Zuo, K.; Lei, H.; Zhao, C.; Zhao, C.; Zhang, H. 3D VP, VS, and VP/VS Structures and Seismicity of the Lower Reaches of the Jinsha River, China. Seismol. Res. Lett. 2023, 94, 2384–2396. [Google Scholar] [CrossRef]
  25. Jiang, N.; Wu, W.; Hong, Z. Review of International Research Progress in Source Stress Drop. J. Seismol. Res. 2024, 47, 163–177. [Google Scholar]
  26. Hardebeck, J.L.; Aron, A. Earthquake Stress Drops and Inferred Fault Strength on the Hayward Fault, East San Francisco Bay, California. Bull. Seismol. Soc. Am. 2009, 99, 1801–1814. [Google Scholar] [CrossRef]
  27. Marone, C.; Vidale, J.; Ellsworth, W. Fault Healing Inferred from Time Dependent Variations in Source Properties of Repeating Earthquake. Geophys. Res. Lett. 1995, 22, 3095–3098. [Google Scholar] [CrossRef]
  28. Atkinson, G.M. Empirical Attenuation of Ground-Motion Spectral Amplitudes in Southeastern Canada and the Northeastern United States. Bull. Seismol. Soc. Am. 2004, 94, 1079–1095. [Google Scholar] [CrossRef]
  29. Shi, J.; Kim, W.-Y.; Richards, P.G. The Corner Frequencies and Stress Drops of Intraplate Earthquakes in the Northeastern United States. Bull. Seismol. Soc. Am. 1998, 88, 531–542. [Google Scholar] [CrossRef]
  30. Yang, Z.; Zhang, X. The Transition of Apparent Stress Scaling Law before and after Impounding in Zipingpu Reservoir Region. Chin. J. Geophys. 2010, 53, 2861–2868. [Google Scholar]
  31. Abercrombie, R.; Leary, P. Source Parameters of Small Earthquakes Recorded at 2.5 Km Depth, Cajon Pass, Southern California: Implications for Earthquake Scaling. Geophys. Res. Lett. 1993, 20, 1511–1514. [Google Scholar] [CrossRef]
  32. Hua, W.; Zheng, S.; Yan, C.; Wang, M. Attenuation, Site Effects, and Source Parameters in the Three Gorges Reservoir Area, China. Bull. Seismol. Soc. Am. 2013, 103, 371–382. [Google Scholar] [CrossRef]
  33. Zhang, Y.; Zhao, C. Study of Attenuation Characteristics, Site Response and Seismic Source Parameters of the Zipingpu Reservoir Region. Seismol. Geol. 2009, 31, 664–675. [Google Scholar]
  34. Zhong, Y.; Zhu, X.; Zhang, Z. Source Parameter Characteristics of ML3.9 Earthquake Swarm Occurred in Shanxi Reservoir, Wenzhou, Zhejiang Province. Earthquake 2004, 24, 107–114. [Google Scholar]
  35. Yao, L.; Zhong, Y.; Zhang, Z. Influence of Impregnated Rock Mass on the Corner Frequency. Northwestern Seismol. J. 2004, 26, 315–321. [Google Scholar]
  36. Choy, G.; Mcgarr, A.; Kirby, S.; Boatwright, J. An Overview of the Global Variability in Radiated Energy and Apparent Stress. Geophys. Monogr. Ser. 2006, 170, 43–57. [Google Scholar] [CrossRef]
  37. Goebel, T.H.W.; Hauksson, E.; Shearer, P.M.; Ampuero, J.P. Stress-Drop Heterogeneity within Tectonically Complex Regions: A Case Study of San Gorgonio Pass, Southern California. Geophys. J. Int. 2015, 202, 514–528. [Google Scholar] [CrossRef]
  38. Goertz-Allmann, B.; Goertz, A.; Wiemer, S. Stress Drop Variations of Induced Earthquakes at the Basel Geothermal Site. Geophys. Res. Lett. 2011, 38, L09308. [Google Scholar] [CrossRef]
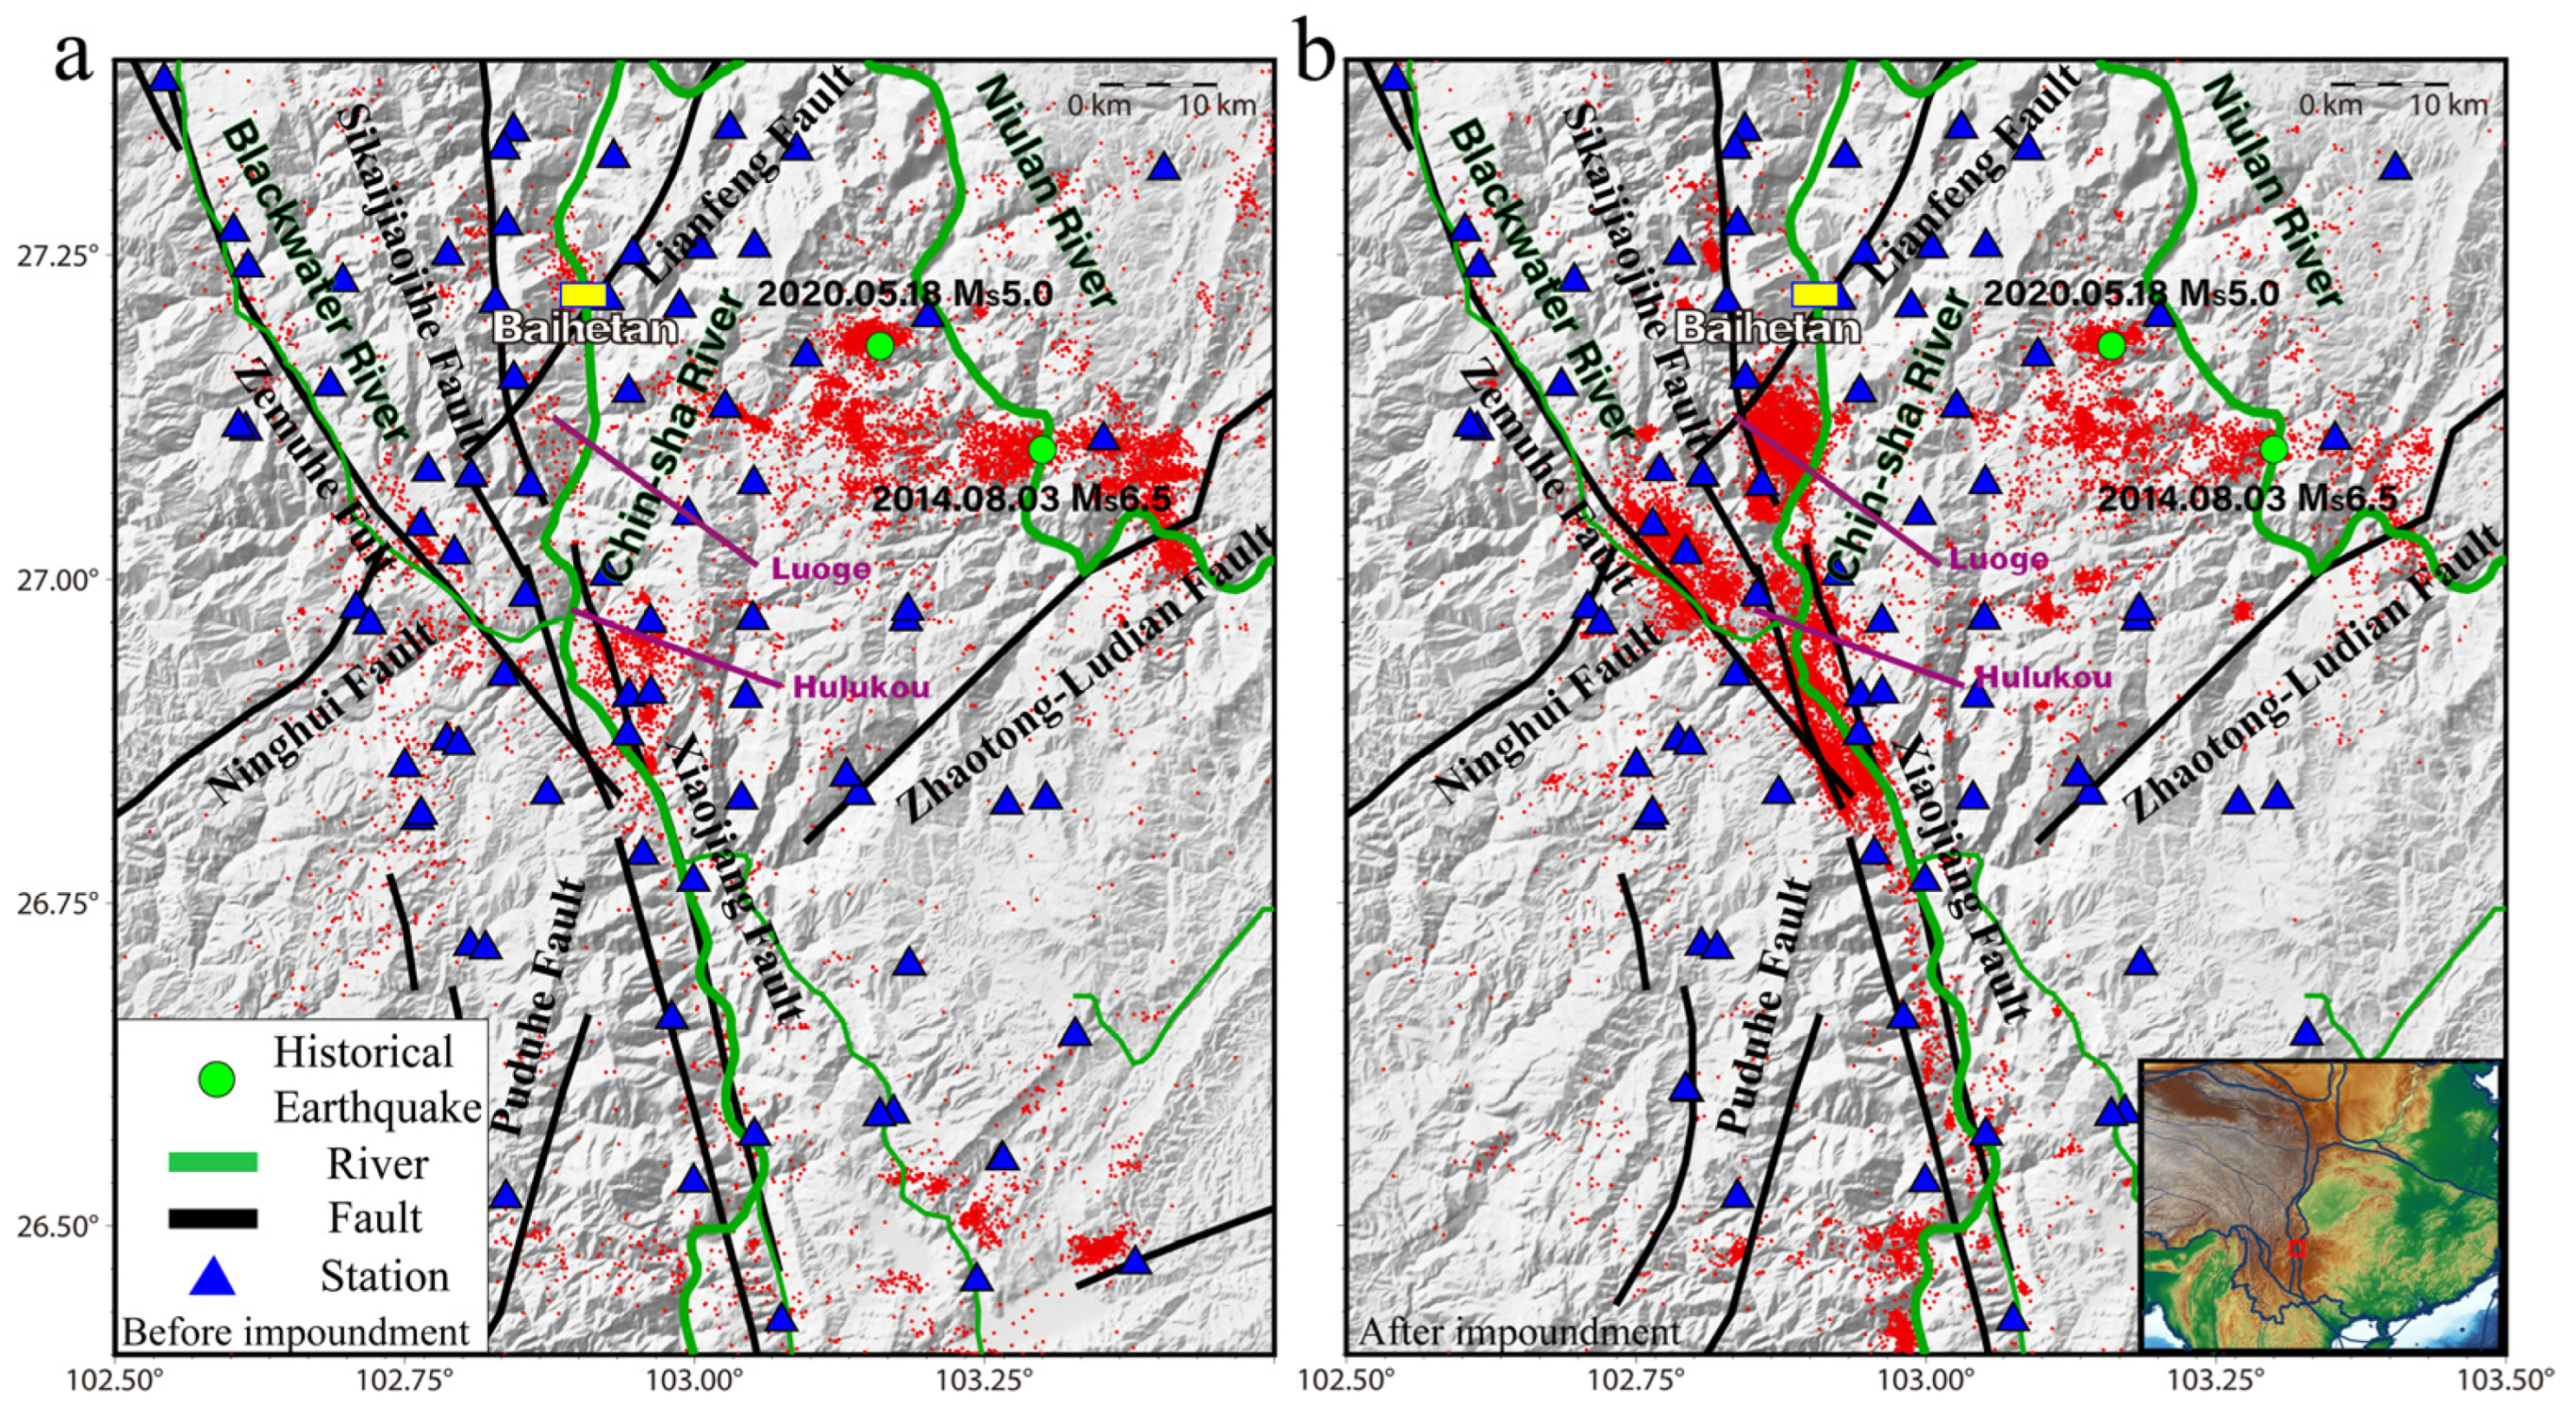
Figure 1. Distribution map of seismicity and stations in the study area. (a) Earthquakes that occurred from 1 January 2016 to before the reservoir was filled. (b) Earthquakes that occurred from 6 June 2021 to 6 June 2023 after the reservoir was filled. The direction of the main road of the Jinsha River is SN, the yellow rectangular box represents the dam, the blue box is the research area.
Water 16 01370 g001
Figure 2. The ML-T map and water level with cumulative monthly frequency. (a) The height of the black line represents the size of the ML and the blue line represents the height of the water level. (b) The height of the bar represents the monthly frequency of earthquakes, and the blue line represents the height of the water table.
Water 16 01370 g002
Figure 3. The ray path distribution for the selected seismic stations and earthquakes used in calculating the non-elastic attenuation and site response in the Baihetan reservoir area. (The blue lines in the picture represent rivers. The thick black lines represent faults. The dark blue dots represent place names. The purple rectangles represent dams).
Water 16 01370 g003
Figure 4. The site response for some of the seismic stations.
Water 16 01370 g004
Figure 5. Examples of source spectra results of magnitude 2, 3, and 4 earthquakes. The green line represents the calculated average source spectrum and the red line represents the theoretical source spectrum fitted to the model.
Water 16 01370 g005
Figure 6. Seismic distribution map of stress drops before and after impoundment. (The color represents the magnitude; the size of the circle represents the magnitude of the stress drop).
Water 16 01370 g006
Figure 7. Calculation results of source parameters in the Baihetan Reservoir Area (ABC). (The asterisk represents the earthquakes that occurred before impoundment. The solid circle represents the earthquakes that occurred after impoundment. The color code represents the depth of the earthquake source). (a) Seismic moment and stress drop. (b) Seismic moment and source size. (c) Seismic moment and corner frequency. (d) Magnitude and stress drop.
Water 16 01370 g007
Figure 8. Energy moment ratio of earthquakes before and after water storage in the Baihetan Reservoir Area (A, B, C). (a) Earthquakes that occurred before impounding. (b) Earthquakes that occurred after impounding. The color code represents the focal depth of the earthquake.
Water 16 01370 g008
Figure 9. Comparison of seismic moment and radiation energy calculation results before and after water storage in the Baihetan Reservoir Area (A, B, C). (a) The statistical relationship between ML and seismic moments. (b) The relationship between ML and source radiation energy. The green dots represent earthquakes that occurred before impounding. The red dots represent earthquakes that occurred after impounding.
Water 16 01370 g009
Figure 10. The relationship between seismic stress drop, magnitude, and depth before and after water storage.
Water 16 01370 g010
Figure 11. Time series diagram of stress drop in ABC zones. (a) Time series diagram of stress drop in zone A. (b) Time series diagram of stress drop in zone B. (c) Time series diagram of stress drop in zone C.
Water 16 01370 g011
Table 1. Average stress drop before and after impounding (Mpa).
MagnitudeABCE
BeforeAfterBeforeAfterBeforeAfterBeforeAfter
2.0–2.91.7591.3001.0051.3931.5272.1311.4541.701
3.0–3.9——7.9925.5213.5627.8018.6175.5325.247
4.0–4.730.423————————56.22115.938——
Disclaimer/Publisher’s Note: The statements, opinions and data contained in all publications are solely those of the individual author(s) and contributor(s) and not of MDPI and/or the editor(s). MDPI and/or the editor(s) disclaim responsibility for any injury to people or property resulting from any ideas, methods, instructions or products referred to in the content.