Article

A Sand Boil Database for Piping Risk Management in the Po River, Italy

1
Department of Civil, Chemical, Environmental and Materials Engineering (DICAM), Alma Mater Studiorum - Università di Bologna, 40136 Bologna, Italy
2
Interregional Agency for the Po River (AIPo), Strada Garibaldi 75, 43121 Parma, Italy
*
Author to whom correspondence should be addressed.
Water 2024, 16(10), 1384; https://doi.org/10.3390/w16101384
Submission received: 7 April 2024 / Revised: 8 May 2024 / Accepted: 11 May 2024 / Published: 13 May 2024
(This article belongs to the Section Water Erosion and Sediment Transport)

Abstract

:
Sand boil formation at the toe of river embankments is the typical manifestation of the initiation and progression of an internal erosion process known as backward erosion piping, which is recognized to be a major concern in many river systems worldwide. In Italy, more than 130 sand boils have been detected along the Po River, many of them experiencing recurrent reactivations during high-water events. In recent years, as part of the activities of the European project LIFE SandBoil, the Italian authority responsible for flood protection and flood damage reduction along the Po River has implemented a GIS-based web application to catalogue the sand boils observed in its operating area. The resulting database allows keeping records of a comprehensive and varied set of information, in terms of predisposing factors, initiation conditions and surface effects. Taking as a reference a well-documented cross-section of the Po River prone to piping, this paper describes the main features of this versatile and flexible tool, whose long-term aim is to support vulnerability studies and the development of risk maps against piping. The database, which might also accommodate data from different river basins, is thus meant to help in flood risk management, by suggesting priorities for the implementation of mitigation measures and allowing the monitoring of intervention effectiveness.

1. Introduction

Sand boils at the toe of river embankments during high-water events are clear indicators of the initiation and progression of an internal erosion process known as backward erosion piping. A bubbling spring of fluidised sand is observed on the ground surface, most often accompanied by the ejection of soil particles that deposit to form a sand volcano around the exit zone. Such an erosion process, due to excessive underseepage in shallow pervious strata beneath river embankments, may gradually lead to excessive settlement and the potential failure of flood protection structures.
Backward erosion piping is recognized to be a major concern in many river systems worldwide. Van Beek et al. [1] reported a number of river embankment failures occurring in the last century that are likely to be attributed to backward erosion piping, such as those that occurred near Zalk, Nieuwkuijk and Tholen in the Netherlands, or some well-documented collapses along the Yangtze River and tributaries in China, during the 1998 flood event. Another recent catastrophic event in China was reported in the work by Zhou et al. [2], who described an embankment failure due to piping occurred in the province of Hunan in 2016, causing more than 23,600 residents to be evacuated. Major breaches due to piping were also recognized along the Mississippi River. In particular, from 1890 to 1927, at least six river embankment failures along the Lower Mississippi River, corresponding to 10% of the total amount of major breaches, are believed to have been caused by piping [3]. More recently, during the 2005 hurricane Katrina, at least one of the 50 major breaches experienced by the New Orleans river embankment system was attributed to backward erosion piping [4]. In Italy, a study carried out by the Po River Basin Authority (AdBPo) in 2005 [5] reported approximately 30 breaches due to piping occurring along the Po River from 1800 to 2000, but this estimate refers to all internal erosion processes and not only to backward erosion piping beneath river embankments.
Historically, according to statistics of embankment dam failures provided by the International Commission on Large Dams (ICOLD) [6], internal erosion has caused nearly half (46%) of total failures reported for structures constructed between 1800 and 1986 worldwide, thus appearing to be equal in importance to failures by overtopping. Robbins and van Beek [7], in particular, report that backward erosion piping accounts for approximately one-third of all internal erosion failures, thus confirming the significant incidence of this phenomenon.
Although, in the last decades, monitoring activities and mitigation strategies adopted against floods, coupled with well-established emergency measures, have turned out to be generally effective in preventing structural failures, excessive underseepage and the formation of sand boils are routinely detected along many river embankment systems during high-water events. As an example, the 2011 Mississippi flooding resulted in the activation or reactivation of many large, high-energy sand boils, together with numerous small to medium size sand boils [8]. Furthermore, in recent years, hundreds of medium to large sand boils have been reported to reactivate along some specific segments of the Mississippi, for moderate to major flood events related to water levels well below the design flood [9].
In the Netherlands, 120 and 180 sand boils were detected along the Rhine, Waal, IJssel and Meuse rivers, in the years 1993 and 1995, respectively, thus revealing the susceptibility of the river embankment systems of this area to backward erosion piping phenomena [1]. Other major river embankment systems that regularly suffer from piping activity are those of the Danube, especially in Hungary, where 165 single sand boils and 13 line-wise sand boil chains (from 20 to 150 m long) were triggered during major high-water events that occurred from 1965 to 2013 [10].
In Italy, sand boils are often observed along the Po River and its major tributaries. The sand boils so far reported along the mid–lower segment of the Po River are approximately 130 [11], though this is most likely an underestimate of the actual number of activations/reactivations occurring in the last decades. During the severe high-water event that occurred in 2000, a large part of these sand boils reactivated simultaneously, with a serious risk for the safety of the surrounding territory and the human activities of such a densely populated and highly developed area.
As a consequence of the widespread occurrence of backward erosion piping effects along many river systems worldwide and the related flood risk, the detailed cataloguing of evidence of the phenomenon is nowadays widely recognized as a key step for the careful planning both of maintenance activities on embankments and mitigation actions. Over the last years, in particular, databases of sand boils have been increasingly seen as an essential tool for identifying triggering conditions, assigning hazard classes to river embankment sections susceptible to piping phenomena, and giving priorities for the implementation of mitigation measures. Indeed, although the presence of a sand boil does not imply an imminent potential failure, yet it proves useful for detecting piping-prone areas and can be used to calibrate predictive models of piping initiation [12].
Valuable examples of sand boil databases have been developed in the Netherlands: we refer, in particular, to the GIS Portaal Wellen, which was implemented on the initiative of seven regional water authorities with the support of the Foundation for Applied Water Research STOWA, and to the recent database (http://pipingdb-rws-coe.nl, accessed on 7 April 2024) resulting from international cooperation between the Rijkswaterstaat (the Dutch Ministry of Infrastructure and the Environment) and the U.S. Army Corps of Engineers and maintained by Deltares, which is currently populated with 3 failure cases and 2840 sand boils located in the Netherlands and the United States [12]. These tools are generally devised to include different pieces of information, such as geometric features, geological settings, geotechnical parameters, hydraulic conditions and sand boil characteristics, thus providing a methodological approach for better and exhaustive data acquisition. In this respect, Van Beek et al. [12] have recently stressed the need for a structured, uniform and centralised organization of data on backward erosion piping, not only from field observations but also from the large amount of laboratory experiments conducted by various research programmes, which might help in better understanding the piping mechanism, developing prediction models, and improving safety assessment.
As regards the Po River, following an early attempt at systematic collection carried out by the Po River Basin District Authority (AdBPo) after the major high-water event in 2000 and the next enhanced version of a sand boil database proposed by the Interregional Agency for the Po River [13], a GIS-based web application has been recently developed as part of the activities devised by the project LIFE SandBoil (https://lifesandboil.eu/, accessed on 7 April 2024), funded by the European Commission.
This paper describes the main features of this flexible and versatile tool, which is devised to provide important insights into the hydraulic and geological conditions making the embankment systems prone to piping, as well as an effective characterization of the backward erosion piping hazard along the Po River. Indeed, the database appears to respond to the ever-increasing demand for rapid and yet robust hazard mapping, which is especially relevant in the context of large-scale emergency assessment and limited data [14], capable of supporting decision-makers in the better management of flood risk. The structure, different sections and functionalities of the web application are presented and discussed in detail, with reference to a representative cross-section located in the middle segment of the watercourse.

2. General Mechanics of Backward Erosion Piping and Predisposing Geologic Factors

Backward erosion piping is a form of internal erosion caused by seepage in the shallow pervious strata beneath river embankments. Over the last years, the mechanism has been extensively investigated, and a number of experimental studies, mainly based on small-scale physical models (e.g., [1,15,16,17]), have provided important insights into the different phases of the erosion process and the conditions for piping initiation and progression.
Figure 1a–d show how seepage in a confined aquifer beneath a thin fine-grained top layer (the latter being typically referred to as the “blanket”) drives the onset of erosion and leads to failure. During flood events, indeed, the increase in the water level of the river causes, in turn, a significant increase in pore water pressure in the confined aquifer, as a consequence of their hydraulic connection, and the uplift pressure may create a localized exit spot in the blanket. Then, flow lines concentrate towards this discharge point landside, and the resulting upward seepage pressure can lead to sand fluidisation inside the hole, this being an early sign of the initiation of the erosion process: sand basically looks like a boiling fluid, hence the name “sand boil”. It is worth mentioning that the exit hole can also be a pre-existing discontinuity in the blanket, either natural or artificial, as well as any other weak point. Once triggered, the erosion may develop at the roof of the aquifer, in a direction opposite to the groundwater flow (i.e., towards the river), forming a single small open conduit or a net of such conduits, typically referred to as “pipes”.
The sand particles thus eroded are transported within the flow path and, in the case of a pressure and flow rate sufficiently high, can be ejected from the exit hole to form a ring around the fluidised zone, similar to a volcano crater (Figure 2a). In some cases, multiple sand boils, aligned at the toe of river embankments to form a sort of chain, can be observed, as shown in Figure 2b. Once at least one erosion pipe reaches the upstream section, a direct connection with the landside exit hole is created and the erosion process accelerates, producing a widening and deepening of the pipes. At this stage, the process can result in a collapse of the river embankment.
In many cases, the hydraulic conditions required for progression are not reached, and therefore the phenomenon turns out to be regressive. However, repeated reactivations of a sand boil may cause the erosion pipes to widen and deepen to such an extent that the phenomenon can occur also for progressively lower water levels in the river, thus increasing the sensitivity of the river embankment system to piping.
A number of studies (e.g., [18,19,20]) have shown a correlation between the locations of sand boils and local geologic conditions. The relative arrangement of pervious and impervious floodplain deposits beneath river embankments, and the angle at which such layers are crossed by the overlying structures, have indeed been recognized to be controlling factors in the localisation of sand boils. These studies have stressed, in particular, the importance of identifying the different alluvial landforms encountered along the river systems, such as point bars, abandoned channel fillings, natural levees and backswamp deposits, as a key first step in order to predict the amount of underseepage and uplift pressure which develops landward of the river embankment. Aerial/satellite imagery [21,22] is often used to detect morphological factors that may reveal the susceptibility to backward erosion piping of the river embankment system. Work by the U.S. Army Corps of Engineers (USACE) along the Mississippi River (e.g., [22,23]) found that point bar deposits—consisting of low ridges of silty sand/sand with intervening arcuate depressions (referred to as swales) filled with fine-grained sediments–and channel fill deposits are the primary geologic environments for sand boil formation. Swales and channel fill deposits indeed tend to confine, funnel or otherwise significantly affect the groundwater flow through the subsurface [18], thereby increasing the local pore water pressure.
Along the Po River, numerous close and intersecting traces of abandoned riverbeds can be recognized at the plain level or slightly below [24]. The river, 652 km long, flows eastward from the western Alps to the Adriatic Sea (Figure 3a), with a meandering course flanked by a system of embankments for the protection of the surrounding territory. The geomorphological evolution of its basin, which is delimited by the Alpine chain to the north and the Apennines to the south, has been strongly driven by tectonics, together with climate change [25]. The activity of Apennine thrusts has indeed caused a generalised northward shifting of the Po riverbed, hence the large number of abandoned channels [24]. Fluvial ridges, related to the abandoned hydrographic network, are the most common geomorphological features on the right side of the Po River, in the middle sector. The above landforms, together with specific stratigraphic features encountered in many segments of the Po River, make the whole embankment system prone to backward erosion piping during high-water events.

3. An Example of a Historical Sand Boil along the Po River

3.1. Boretto Case Study

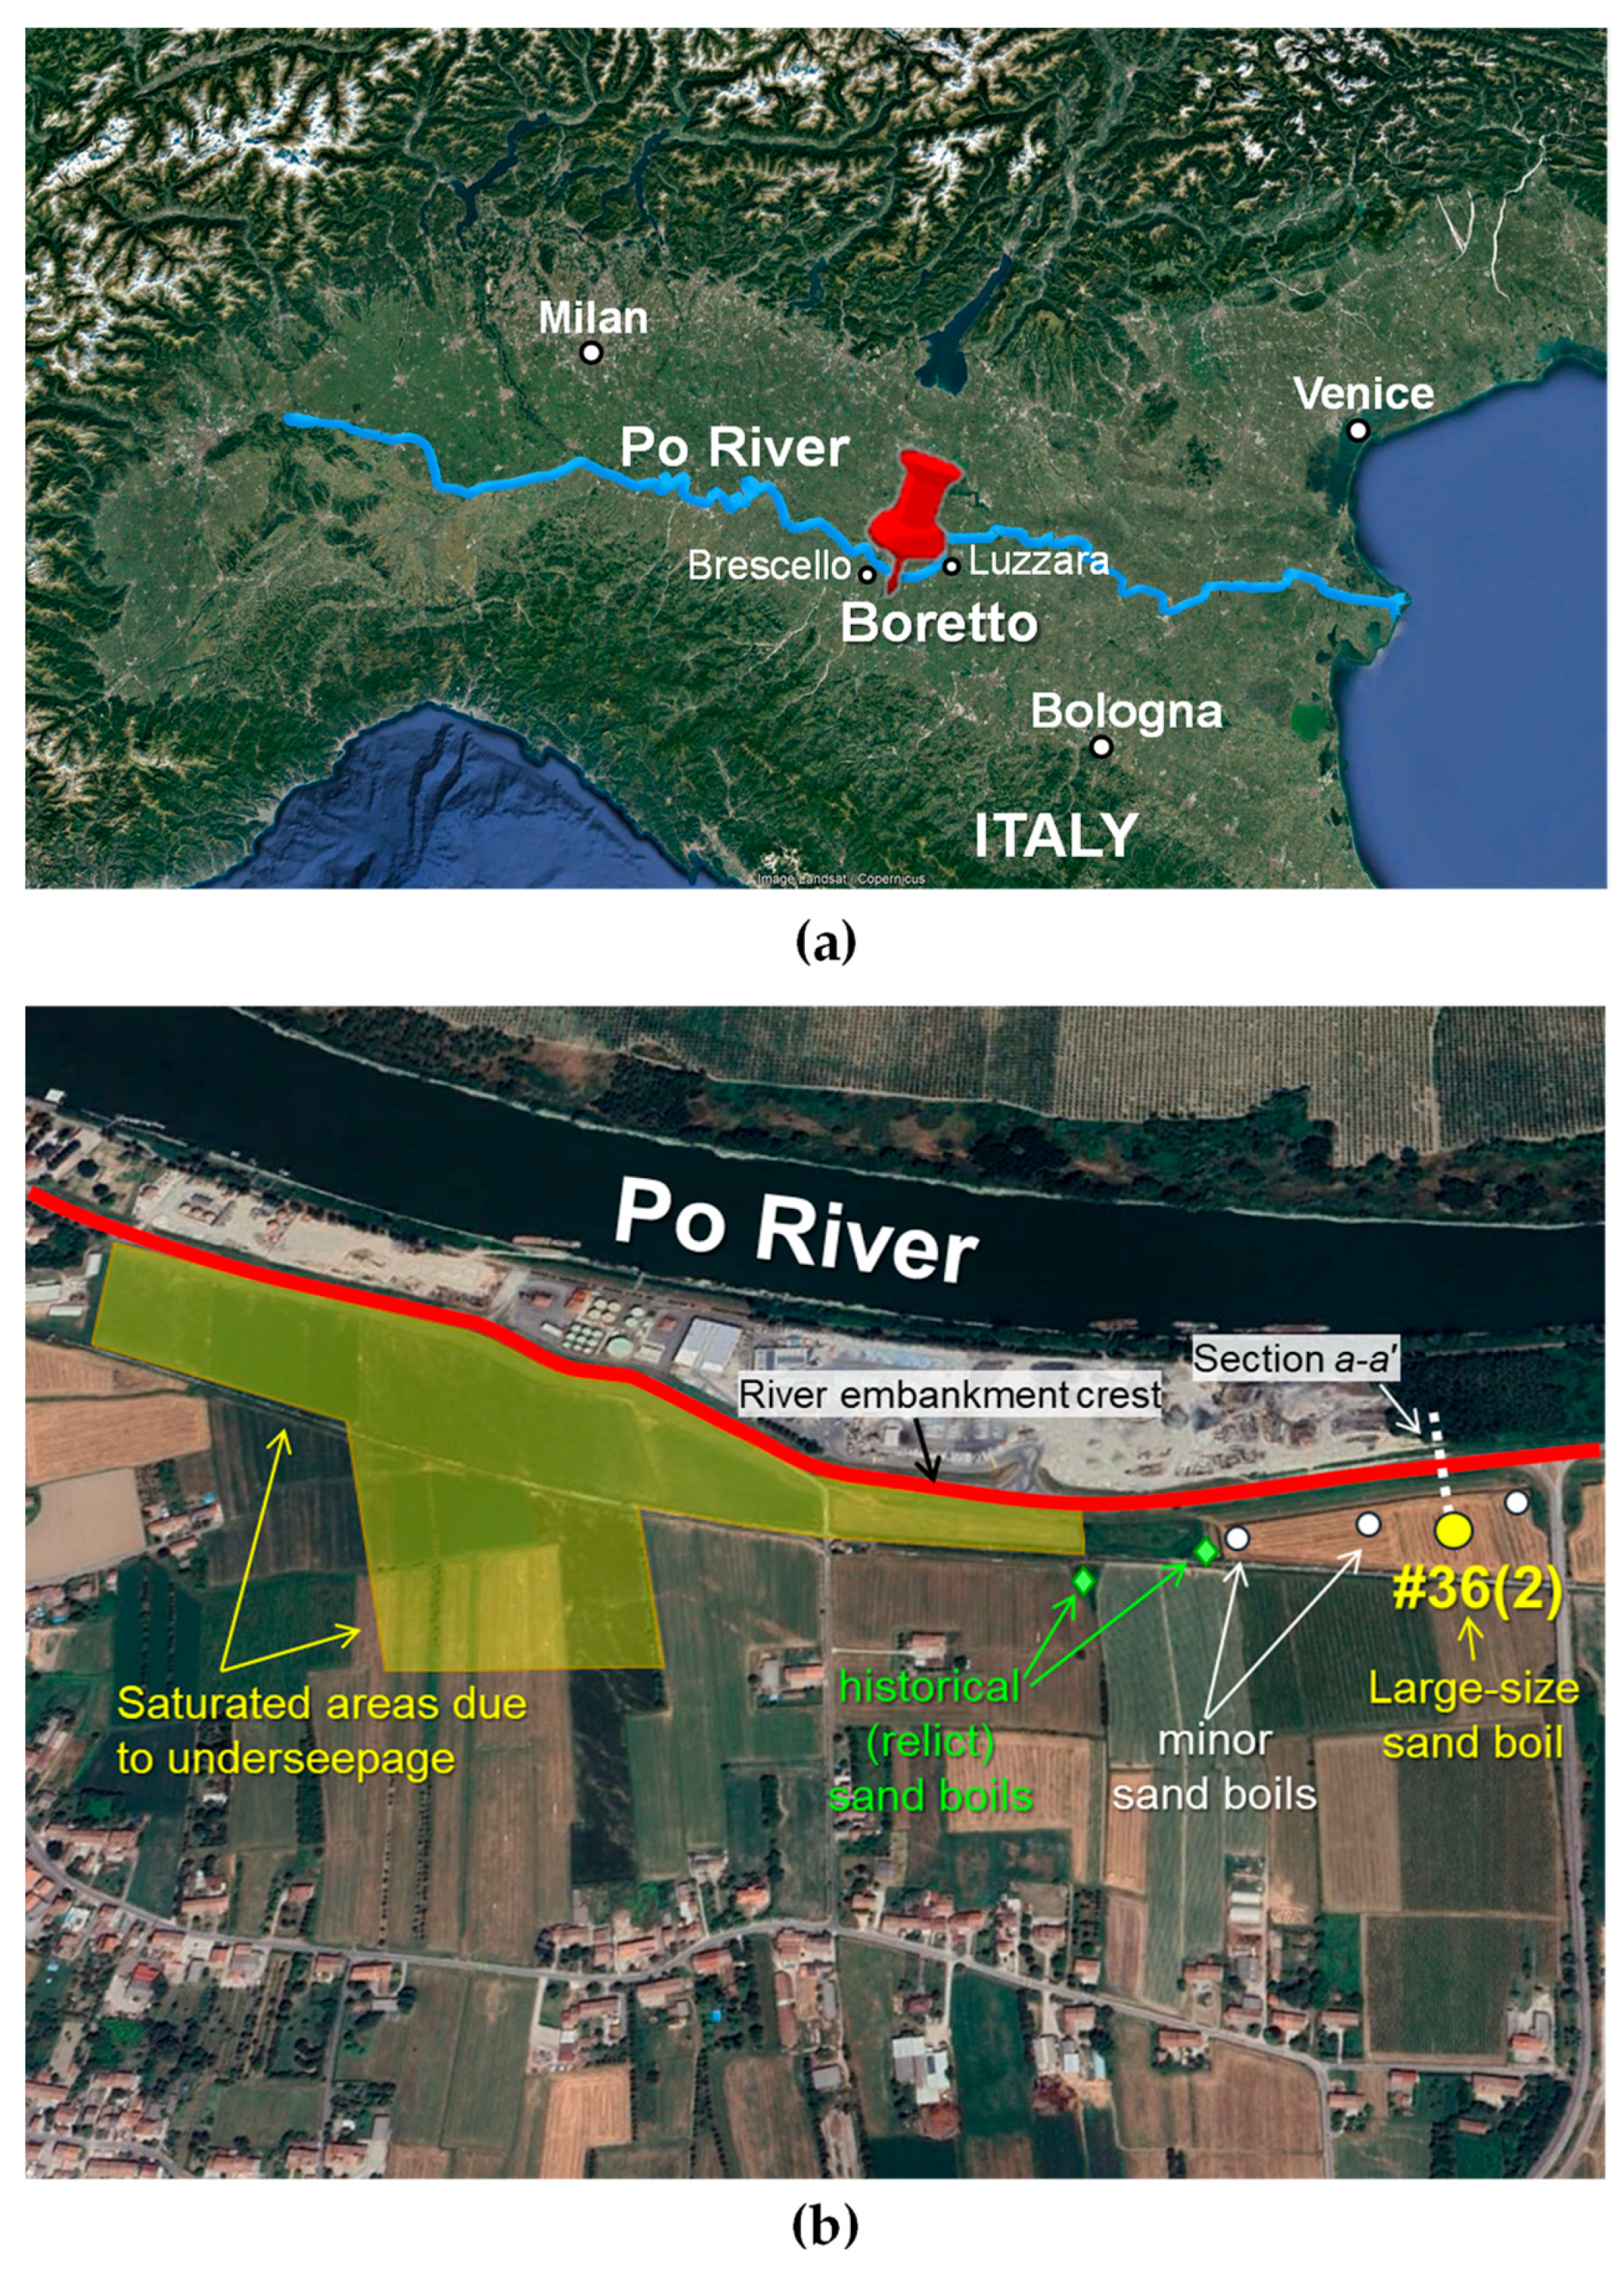
The village of Boretto (Reggio Emilia province, Emilia-Romagna region) is located in the central portion of the Po plain, on the right side of the Po River (Figure 3a). The site has a history of sand boil development. The stretch of river embankment adjacent to Boretto has indeed been recurrently affected by sand boil formation during high-water events, with landside reactivations of “so-called” historical sand boils, some of them of significant size, together with the widespread presence of saturated areas or even water on the surface. Figure 3b is an aerial view displaying the location of the sand boils, including a few defined as “relict”, and saturated areas due to underseepage, with the red line showing the main river embankment system.
During the 1990s, cut-off walls were installed in selected stretches of the Po River embankments, on the right side from Brescello to Luzzara (thus including Boretto), in order to mitigate the susceptibility to backward erosion piping in the most critical areas. Shortly after the installation of such measures, the same 19 km long river embankment segment was raised and reinforced in order to meet the geometrical requirements defined in the directive on flood risk reduction issued by the Po River Basin District Authority. Although the above interventions turned out to be effective against piping phenomena for the majority of the reinforced stretches during the major high-water event in 2000 and also later, yet sand boil reactivations and other clear evidence of underseepage effects have been recurrently observed in Boretto. Figure 4 shows a reactivation triggered in this area by the November 2014 high-water event, with a sack ring placed during emergency operations around a sand boil of significant size, in order to stop soil particle transport.
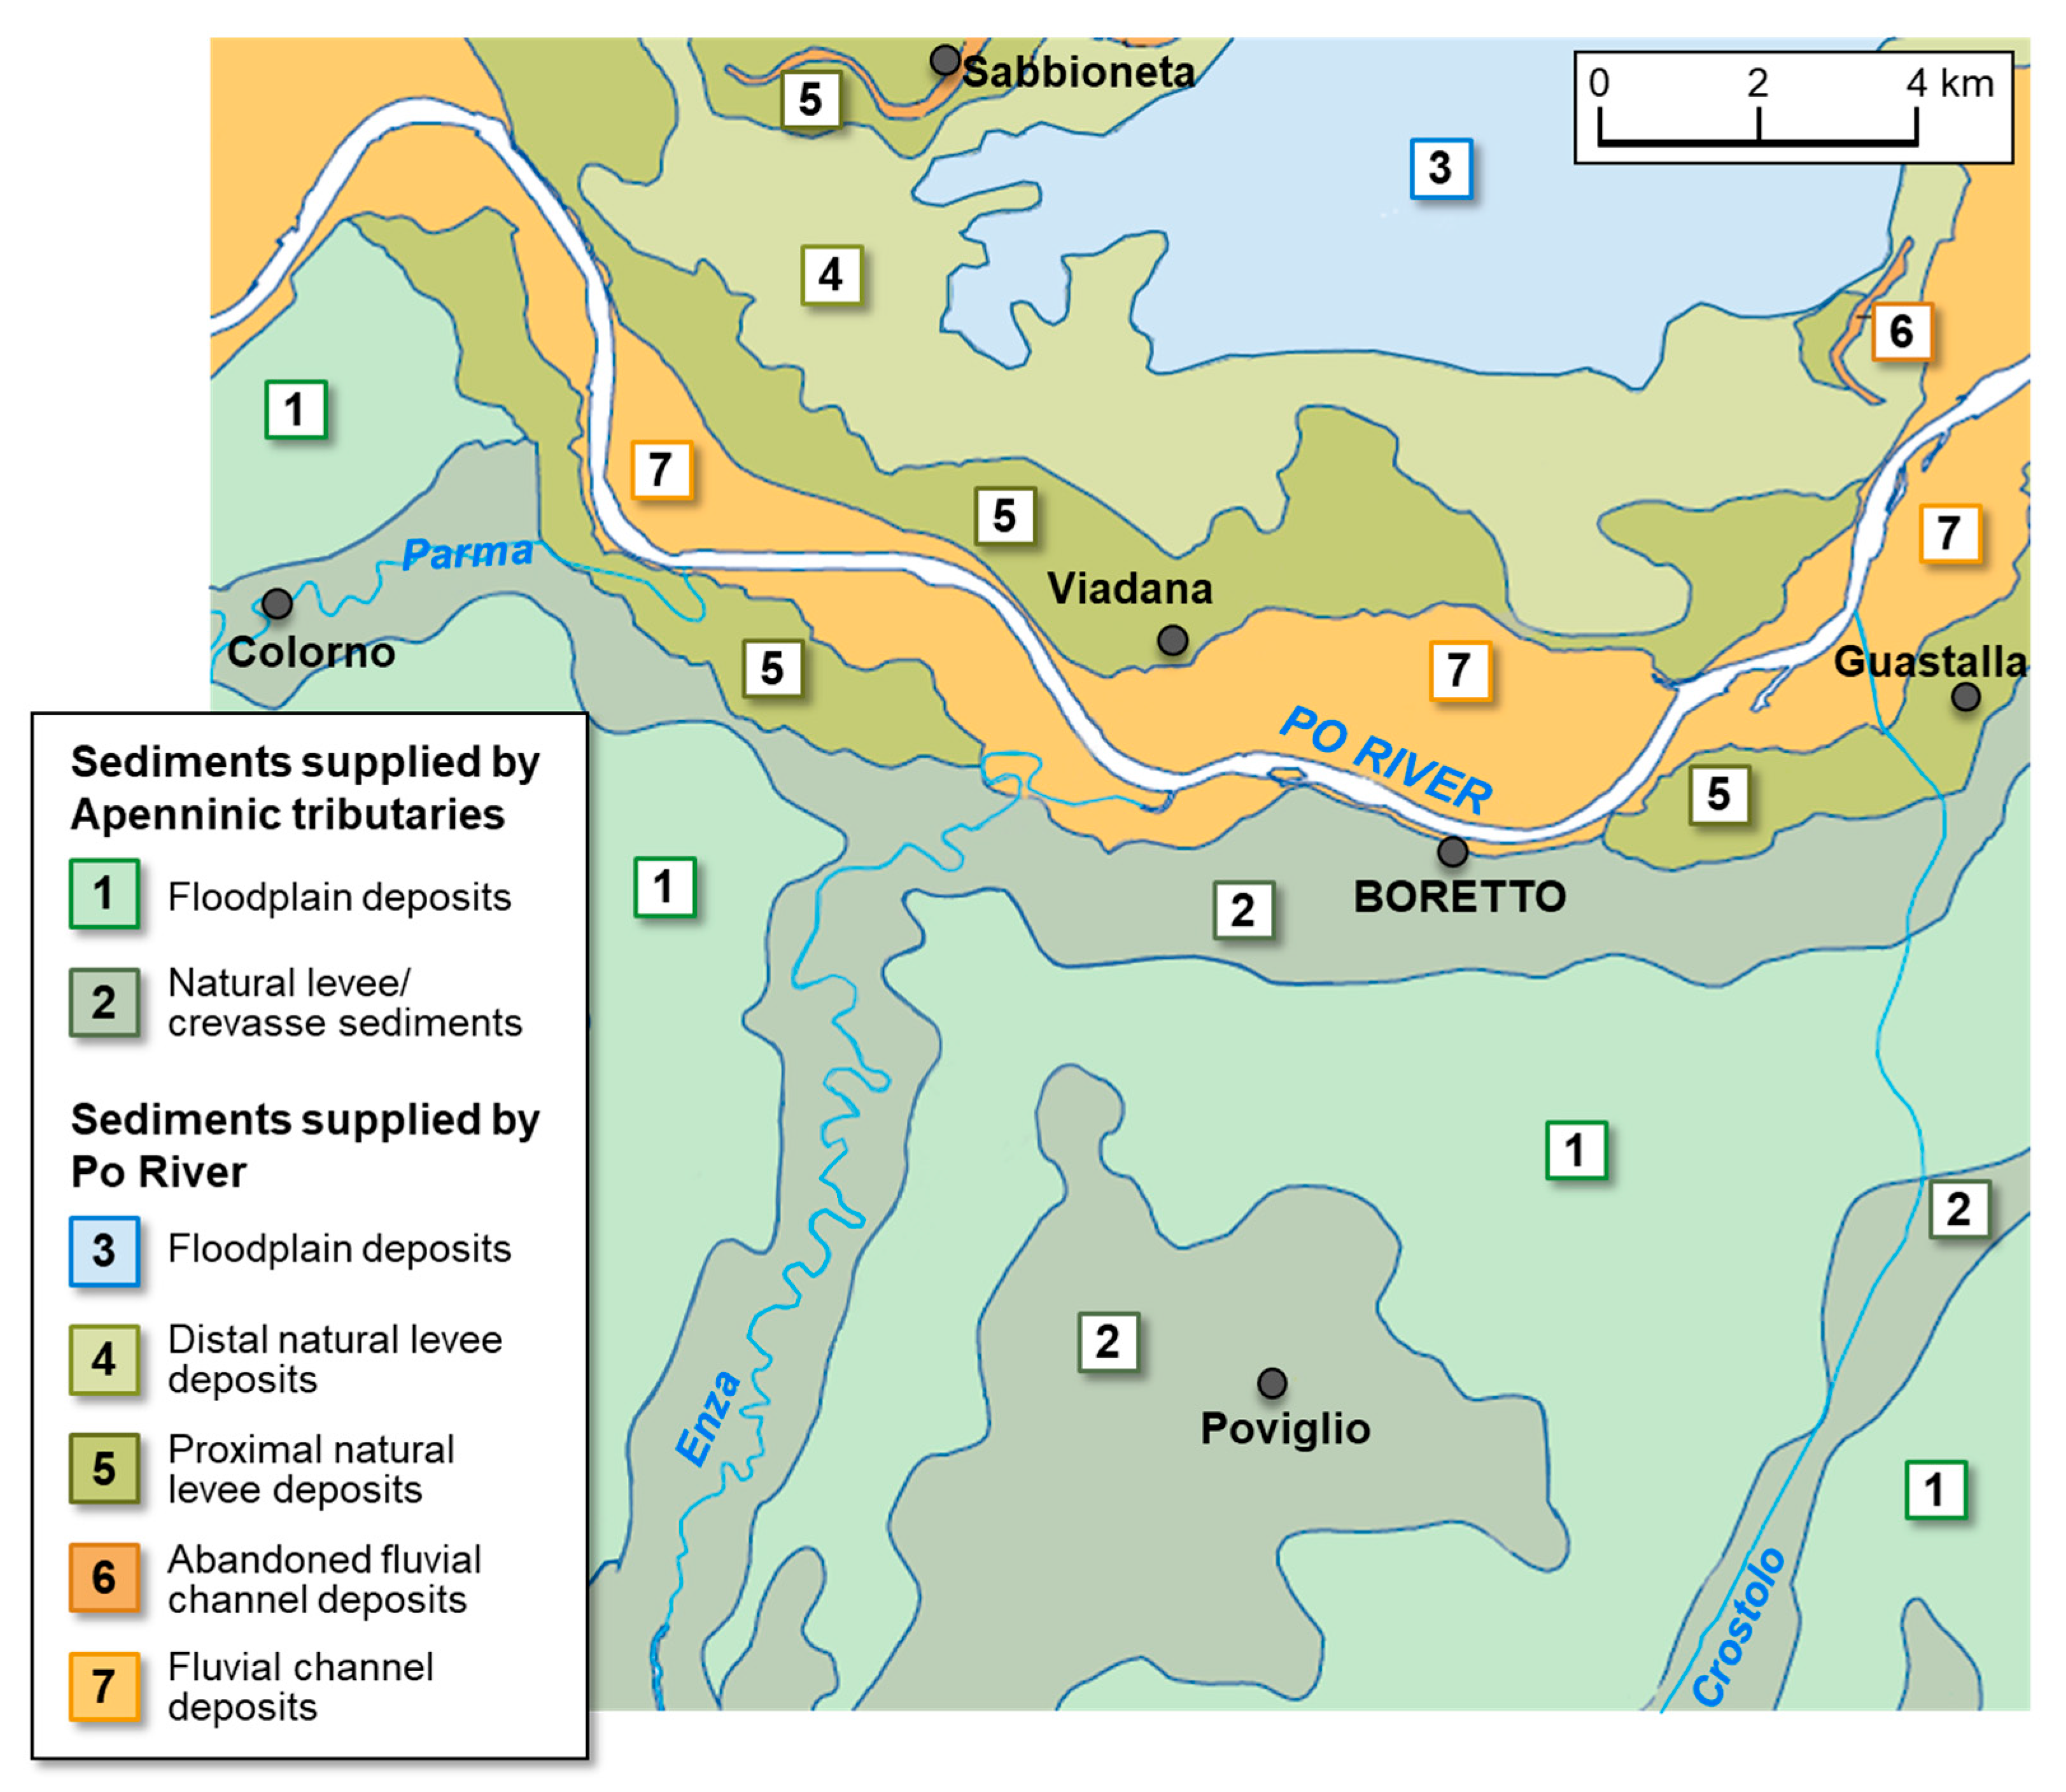
Shallow geophysics, cone penetration tests and boring data have been used in recent years to better understand the stratigraphic arrangement of the subsoil and its influence on piping phenomena. From a geological point of view, the shallowest soil deposits encountered in this area are part of the so-called Upper Emilia-Romagna Synthem—in particular, the Ravenna Subsynthem (AES8) of Holocene age—and result from sediment accumulation in a continental depositional environment, due to both the Po River and the Apennine tributary rivers, as shown in Figure 5 [26]. This facies association typically includes (i) fine to very fine sands at the plain level or fine to very coarse sands slightly below, referable to fluvial channel sand deposits; (ii) silts and sandy silts, referable to channel fill deposits located along the traces of relict hydrography; and (iii) clays, clayey silts and silty clays located in topographical depressions and interpreted as floodplain deposits. In particular, typical meandering river floodplain deposits characterise the subsoil beneath the river stretch under consideration.
The stratigraphic model of the river embankment system depicted in Figure 6 has been obtained by interpreting piezocone tests (CPTU) carried out along the representative cross-section a-a′ (drawn in Figure 3b), located in close proximity to the sand boil shown in Figure 4. The tests are part of a dataset collected for the project SISMAPO [27,28], whose objective was the seismic stability assessment of about 90 km of embankments along the middle–lower stretch of the Po River. Site investigations allowed the identification of the following five different soil units: (i) Unit R, given by a complex alternation of sands, silty sands and clayey silts forming the river embankment; (ii) the highly heterogeneous Unit A, i.e., a thick fluvial channel sand body referred to as the Padano Aquifer, composed of medium-fine to coarse and very coarse sands subjected to the erosion process in case of piping; (iii) a predominantly silty unit (Unit B), typically attributable to a natural levee depositional environment; (iv) a clayey soil layer labelled as Unit C, 4 to 10 m thick, to be interpreted as a deposit of floodplain environment; and (v) the fine-grained sediments of Unit D, forming the upper 4–5 m of the riverside floodplain area. From the river embankment profile shown in Figure 6, the elevation of the riverside floodplain area appears to be higher (up to +3 m) than the landside area, also as a consequence of some earthworks related to activities in the industrial settlements located therein.
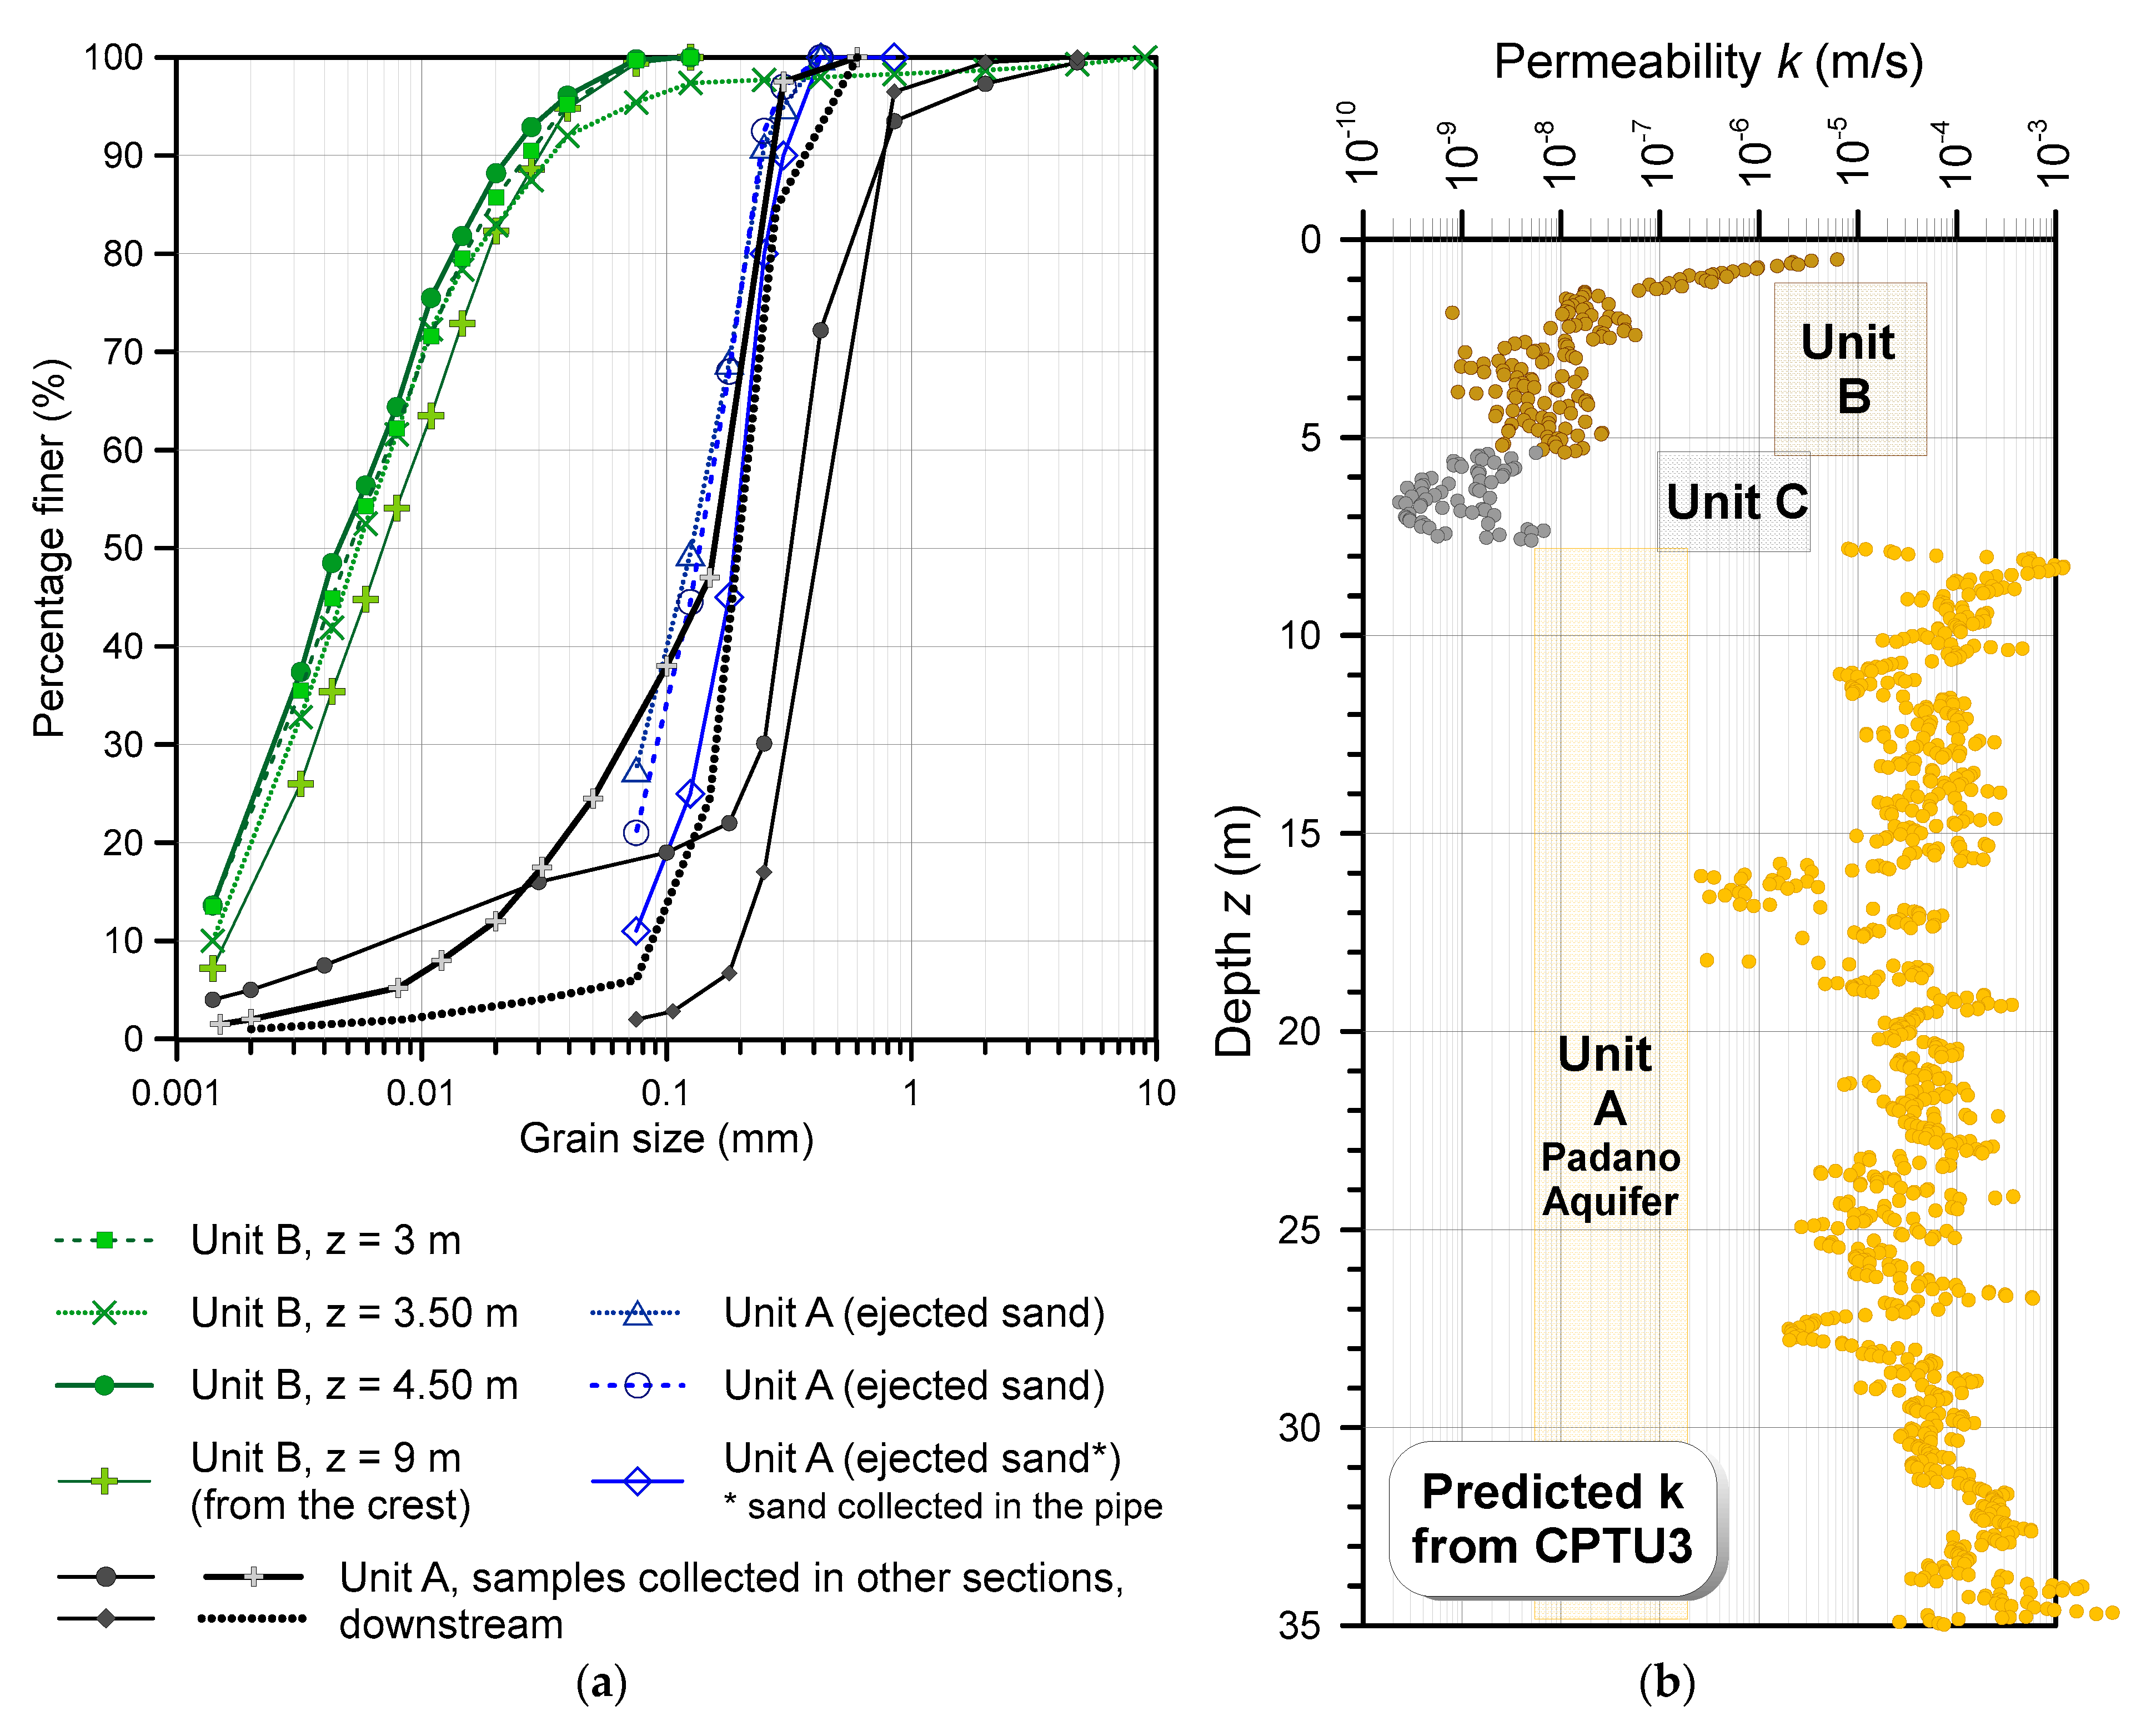
Particle-size analyses by the sedimentation method on a few fine-grained soil samples, extracted from nearby boreholes, have confirmed the prevalence of the silty fraction in Unit B, as shown by the curves of Figure 7a. Examples of particle-size distribution curves, determined by sieving coupled with the sedimentation method, have been reported also for Unit A, though referred to samples recovered from the Padano Aquifer at a few kilometres away from the study area discussed herein. In spite of a certain heterogeneity that has been recognized by various authors (e.g., Martelli et al. [29]), the upper portion of the Padano Aquifer is typically composed of medium-fine, uniform sands; at times, a small or moderate amount of silts can be encountered in the shallowest layers. For a useful comparison, the grain size distributions of the ejected sand, collected in the volcano crater and in the pipe during the November 2019 reactivation of the historical sand boil in Boretto, are also shown in the figure.
The permeability k of the soil units relevant to the backward erosion piping process beneath the embankment (i.e., units A, B and C) has been estimated by an interpretation of the piezocone tests, according to empirical correlations proposed by Robertson [30]. Such an approach, based on the use of the well-known Soil Behaviour Type index Icn, has already been validated on the sediments of the Po River basin at a number of relevant cross-sections along the main watercourse or its tributaries, as shown in Bertolini et al. [31] and Gottardi et al. [32]. The profile of the computed estimates from the piezocone test CPTU3 is shown in Figure 7b, whereas the mean values obtained from the whole set of CPTUs are summarized in Table 1. It is worth observing that these CPTU-based estimates are in very good agreement with the direct determinations of k obtained from a few Lefranc permeability tests carried out in this study area, within the upper 5–10 m of the Padano Aquifer: in these tests, indeed, permeability was found to vary in the range 4.9 × 10⁻⁶–3.9 × 10⁻⁵ m/s, thus being fully consistent with the interval identified by the mean value of log10(k) and the standard deviation σlog10(k) reported in Table 1.
According to the proposed stratigraphic model and taking into account the values of permeability shown in Table 1, the continuous clayey unit C and the overlying wedge-shaped silty unit B create, on the whole, an impervious blanket, affecting the amount of underseepage and the uplift pressure that develops landward of the river embankment. Furthermore, by comparing a number of logs from boreholes carried out in an extended area, approximately covering a 1 km long river segment upstream, it turns out that the blanket thickness landside may vary significantly and tends to reduce in proximity to the historical sand boil location. This undoubtedly creates favourable conditions for backward erosion piping initiation.
A large-scale study of groundwater conditions along the middle–lower segment of the Po River [33] allowed the identification of a shallow phreatic aquifer, located in the predominantly silty sediments referable to floodplain deposits, and a sub-artesian confined aquifer directly connected with the river. The second, in particular, corresponds to the Padano Aquifer mentioned above. A typical trend of the river level and of the hydraulic heads measured in the confined and unconfined (phreatic) aquifers is shown in Figure 8.
These data were collected in a section equipped with piezometers, located 2.5 km from the area affected by sand boils. The piezometers, two of them installed in the confined aquifer (labelled as 3_c and BOR_c) and one in the phreatic (labelled as 4_f), were placed at different distances from the river. They provided evidence of a phreatic surface located in Unit B (piezometer 4_f in Figure 8), mainly governed by rainfall and evapotranspiration but also sensitive to the river regime. The confined aquifer, located in Unit A, appeared instead to be well-synchronized with the river (piezometer 3_c), also at significant distances, according to what was recorded on a piezometer 1.3 km away from the riverbed (piezometer BOR_c). As shown by the collected data, most of the time, the piezometric level in the confined aquifer turns out to be 2–5 m lower than the phreatic surface, thus causing the confined aquifer to drain the unconfined one. By contrast, during major high-water events, this condition is reversed and the piezometric surface of the Padano Aquifer may be higher than the phreatic level. Such an increase reached 2.5 m during the high-water event recorded in the monitoring period shown in Figure 8.
As a final remark, it must be observed that the geological, geotechnical and groundwater conditions of a site, as commented above, turn out to be crucial pieces of information whenever analytical approaches need to be applied in order to assess the risk of initiation and progression of backward erosion piping.

3.2. Application of Simplified Methods to Assess Piping Susceptibility

In this section, two relatively simple, though well-established, methods are applied to the river embankment system described in Section 3.1, in order to provide a preliminary assessment of piping susceptibility in this area. As is known, criteria for the initiation and progression of backward erosion piping may be related to local hydraulic conditions in the exit section, or global hydraulic conditions averaged along the flow path [34].
Among them, it is worth mentioning the well-known set of analytical solutions typically referred to as “blanket theory” [3,35]. This method may be used to estimate the zero effective stress condition and thus localise the area landward of the river embankment where backward erosion might initiate. The approach, which basically relies on a simplified three-component scheme, including the embankment, the fine-grained blanket and the underlying aquifer, provides closed-form solutions for seepage pressures and flows, in a variety of configurations of impervious and semi-pervious top stratum conditions. The factor of safety against uplift FSuplift can be expressed as the ratio between the critical pressure head hcrit, depending in turn on the critical hydraulic gradient icrit = γ′/γw, and the excess hydrostatic head h0 at the downstream toe of the river embankment:
F S u p l i f t = h c r i t h 0
with h0 being related to the net head on the river embankment, the geometry of the structure and the foundation, the permeability and the character of the top stratum both riverward and landward. Details can be found in USACE [35].
The river embankment cross-section being analysed herein has been modelled according to the most suitable configuration among those addressed by the blanket theory, i.e., a semi-pervious top stratum both riverside and landside (Figure 9), also taking into account the suggested method for transforming the multi-layered downstream blanket, formed by soil units B and C, into an equivalent thickness zbl with a constant vertical permeability kbl. The semi-pervious assumption allows vertical flow (but not horizontal) through the blanket, consistently with the groundwater conditions discussed in the previous section. It is worth observing that the blanket theory does not consider geometric complexities, such as layers of varying thickness; therefore, the actual stratigraphy in the field must be adjusted to the available schemes, whenever possible. For the river embankment being examined, the stratigraphic conditions could be rather easily cast into one of the cases addressed by the theory, namely case no. 7 discussed in USACE [35].
Thus, if the base width of the river embankment is equal to L2 and assuming no seepage exit is present on the landside, i.e., L3 = ∞, the head h0 beneath the top stratum, at the landside toe, can be expressed as:
h 0 = Δ H x 3 x 1 + L 2 + x 3
where x1 is the distance from the effective seepage entry to the riverside embankment toe and x3 is the distance from the landside toe to the effective seepage exit, both calculated according to the procedure described in USACE [35]. Δ H is the net hydraulic head on the river embankment.
At the same time, the head hx beneath the top stratum, at a distance x landward from the landside toe, is given by:
h x = h 0 · e x p k b l k f · z b l · d 0.5 x
where kf and d are the horizontal permeability and the thickness of the pervious substratum (the Padano Aquifer, in the case being examined), respectively.
Table 2 summarises the input values that have been adopted for the river embankment in Boretto. The permeability values are the CPTU-based estimates already shown in Table 1 and rounded to one decimal place; the permeability kbl of the landward blanket, in particular, has been assumed to be equal to the permeability of the clayey Unit C, this being the most impervious stratum. The geometrical data required by the method, such as L1 and L2, have been deduced from the existing river embankment cross-section, whereas the thickness of the different soil layers is based on the stratigraphic model shown in Figure 6.
Assuming a net hydraulic head ΔH equal to 5.6 m, i.e., the hydraulic load that caused sand boil occurrence in this area during the November 2014 high-water event, a factor of safety against uplift FSuplift = hcrit/h0 = 1.31 has been obtained at the landside toe of the river embankment. FSuplift increases to 1.4 when it is calculated at a distance x = 52 m from the landside toe, corresponding to the position of the historical sand boil mentioned before. In this case, thus, the flood event did not induce any uplift effect at the toe, with the development of new cracks within the top stratum; rather, the piping activity observed therein is very likely to be attributed to the reactivation of a pre-existing sand boil, that can be triggered by lower local gradients. Indeed, as also observed by Kelley et al. [9] for to the Mississippi River, in chronic seepage areas, sand boil activity can form at lower levels of flooding because of the accumulated effects of internal erosion at these locations. The effect of a pre-eroded soil volume on the initiation of piping has been also investigated by García Martínez et al. [36] using an FE approach, with reference to a well-documented cross-section of the Po River close to the delta.
The cross-section has been also analysed using the theoretical approach known as Sellmeijer’s model [37,38]. Unlike the blanket theory, which focuses on the initiation of the erosion process, this conceptual model was devised to predict the critical head at which backward erosion leads to structural failure. The equilibrium of soil particles at the pipe bottom is used as a criterion for pipe progression. According to this method, the critical hydraulic head, ΔHc, that causes the pipe to reach the upstream side (and thus leads to failure) is determined by three components, namely, the resistance factor FR, the scale factor FS and the geometrical shape factor FG, as specified below:
Δ H c L = F R · F S · F G
where L is the horizontal seepage length. Given the actual hydraulic head over the river embankment, ΔH, and the thickness of the top layer zt, the model predicts that backward erosion piping is prevented if:
H 0.3 z t < F R · F S · F G · L
The resistance factor is in turn a function of the equilibrium of forces, the scale factor depends on the ratio of grain size to seepage length, while the geometry factor is a function of the effect of the aquifer shape on the groundwater flow. They are expressed as:
F R = η γ p γ w tan θ
F S = d 70 κ · L 3
F G = 0.91 h a L 0.04 + 0.28 / [ h a / L 2.8 1 ]
with γ′p = submerged unit weight of grains, γw = unit weight of water, θ = bedding angle, η = White’s coefficient (assumed equal to 0.25), κ = intrinsic permeability, d70 = grain diameter at 70% and passing, and ha = thickness of the aquifer (uppermost sand layer sensitive to backward erosion). Later modifications of Equations (6)–(8) [39], based on a multivariate analysis of a number of small-scale experiment results, were meant to incorporate the influence of relative density, uniformity and particle roundness into the piping rule. However, as the extension and adaptation are of an empirical nature, and the application range is limited to the parameters used during the reference testing, the model version described by Equations (4)–(8) has been applied in this study.
The input parameters adopted for the river embankment section in Boretto, as obtained from the interpretation of field and laboratory tests or taken from the literature (such as η = 0.25), are listed in Table 3. An average value equal to 0.15 mm was assumed for d70.
For the hydraulic load ΔH recorded during the high-water event that occurred in 2014, equal to 5.6 m, the criterion defined by Equation (5) turns out to be:
Δ H 0.3 z t = 3.35 < 22.7 = F R · F S · F G · L
and the stability condition, therefore, is fully satisfied.
Thus, although both models above have been used for decades as powerful and theoretically robust tools for piping analyses beneath river embankments, with respect to either initiation or progression, they have proved ineffective in describing the piping activity detected in Boretto. The overestimation of the margin of safety may be due in this case to a number of factors, such as the simplified stratigraphic assumptions needed to adapt the actual foundation subsoil to the model schemes, or uncertainties in the calibration of some model parameters. A major issue is undoubtedly related to difficulties in modelling a pre-eroded soil volume, when the reactivation of “chronic” piping phenomena is to be analysed.

4. The Italian Sand Boil Database

The database described in this paper has been developed as part of the activities of the European project LIFE SandBoil, whose main objective is the validation of an innovative and sustainable technology for the mitigation of backward erosion piping. The project, currently underway, is coordinated by the University of Bologna and involves the Interregional Agency of the Po River (AIPo), Officine Maccaferri Italia and the North Transdanubian Water Directorate (ÉDUVIZIG) as project beneficiaries.
Within the LIFE SandBoil project objectives, the development and implementation of a methodological strategy for the structured collection of information on backward erosion piping evidence along the Po River have been considered as extremely useful, not only for the prediction of possible reactivations of sand boils and the efficient coordination of emergency actions, but also for the identification of the most critical river sections that might require the installation of mitigation solutions. Thus, the sand boil database is meant to be a powerful tool for early warning, as well as flood risk assessment and management.
The new sand boil database [40,41] draws on years of experience of data collection along the middle–lower segment of the Po River and builds on earlier attempts to catalogue such piping manifestations. In 2004, following the 2000 major high-water event, the Po River Basin District Authority (AdBPo) indeed organised a registry of the Po River embankments from the confluence of the Tanaro river to the Po delta. This archive, known as “Catasto delle arginature maestre del fiume Po” (https://www.adbpo.it/atlanti-del-po/, accessed on 7 April 2024), provides a map of seepage areas and sand boil locations (numbering 77, at that time), together with other information useful in outlining a picture of the safety conditions of the whole river embankment system. A later attempt was carried out by the Interregional Agency for the Po River, who started to organize a large amount of field observations into a geographic information system (GIS) project, using a standardised format for records [13].
The database described herein is a powerful and user-friendly web application, based on the Ubuntu 20.04. 2 LTS Operating System and Laravel, a popular PHP web application framework. The free and open-source software QGIS was used to create and manage geospatial information. The design of the database was coordinated by AIPo, who is also responsible for data collection and uploading. Indeed, high standards and the correctness of the information must be ensured; therefore, external users are not allowed to populate the database. At present, since full validation is still ongoing, only authorised users can access and query the database, although the final goal would be to make this resource available to other public bodies and entities involved in flood risk assessment and management and, potentially, to any other user. A total of 132 sand boils have been so far catalogued, 77 of them located in the main course of the Po River and 55 in the delta area. However, it is worth mentioning here that the application has been designed in such a way that it can easily accommodate data from a number of river basins in addition to the Po, and thus become an international database of backward erosion piping phenomena worldwide.

4.1. Database Structure

The data structure adopted in the application is basically composed of two sections, corresponding to the following major entities:
  • The river, with the associated hydrometric network providing river flow information. This is used by the flood simulation algorithm to calculate the river level in sections where sand boils are observed during flood events;
  • The sand boil, together with the list of high-water events, which is the core of the database.
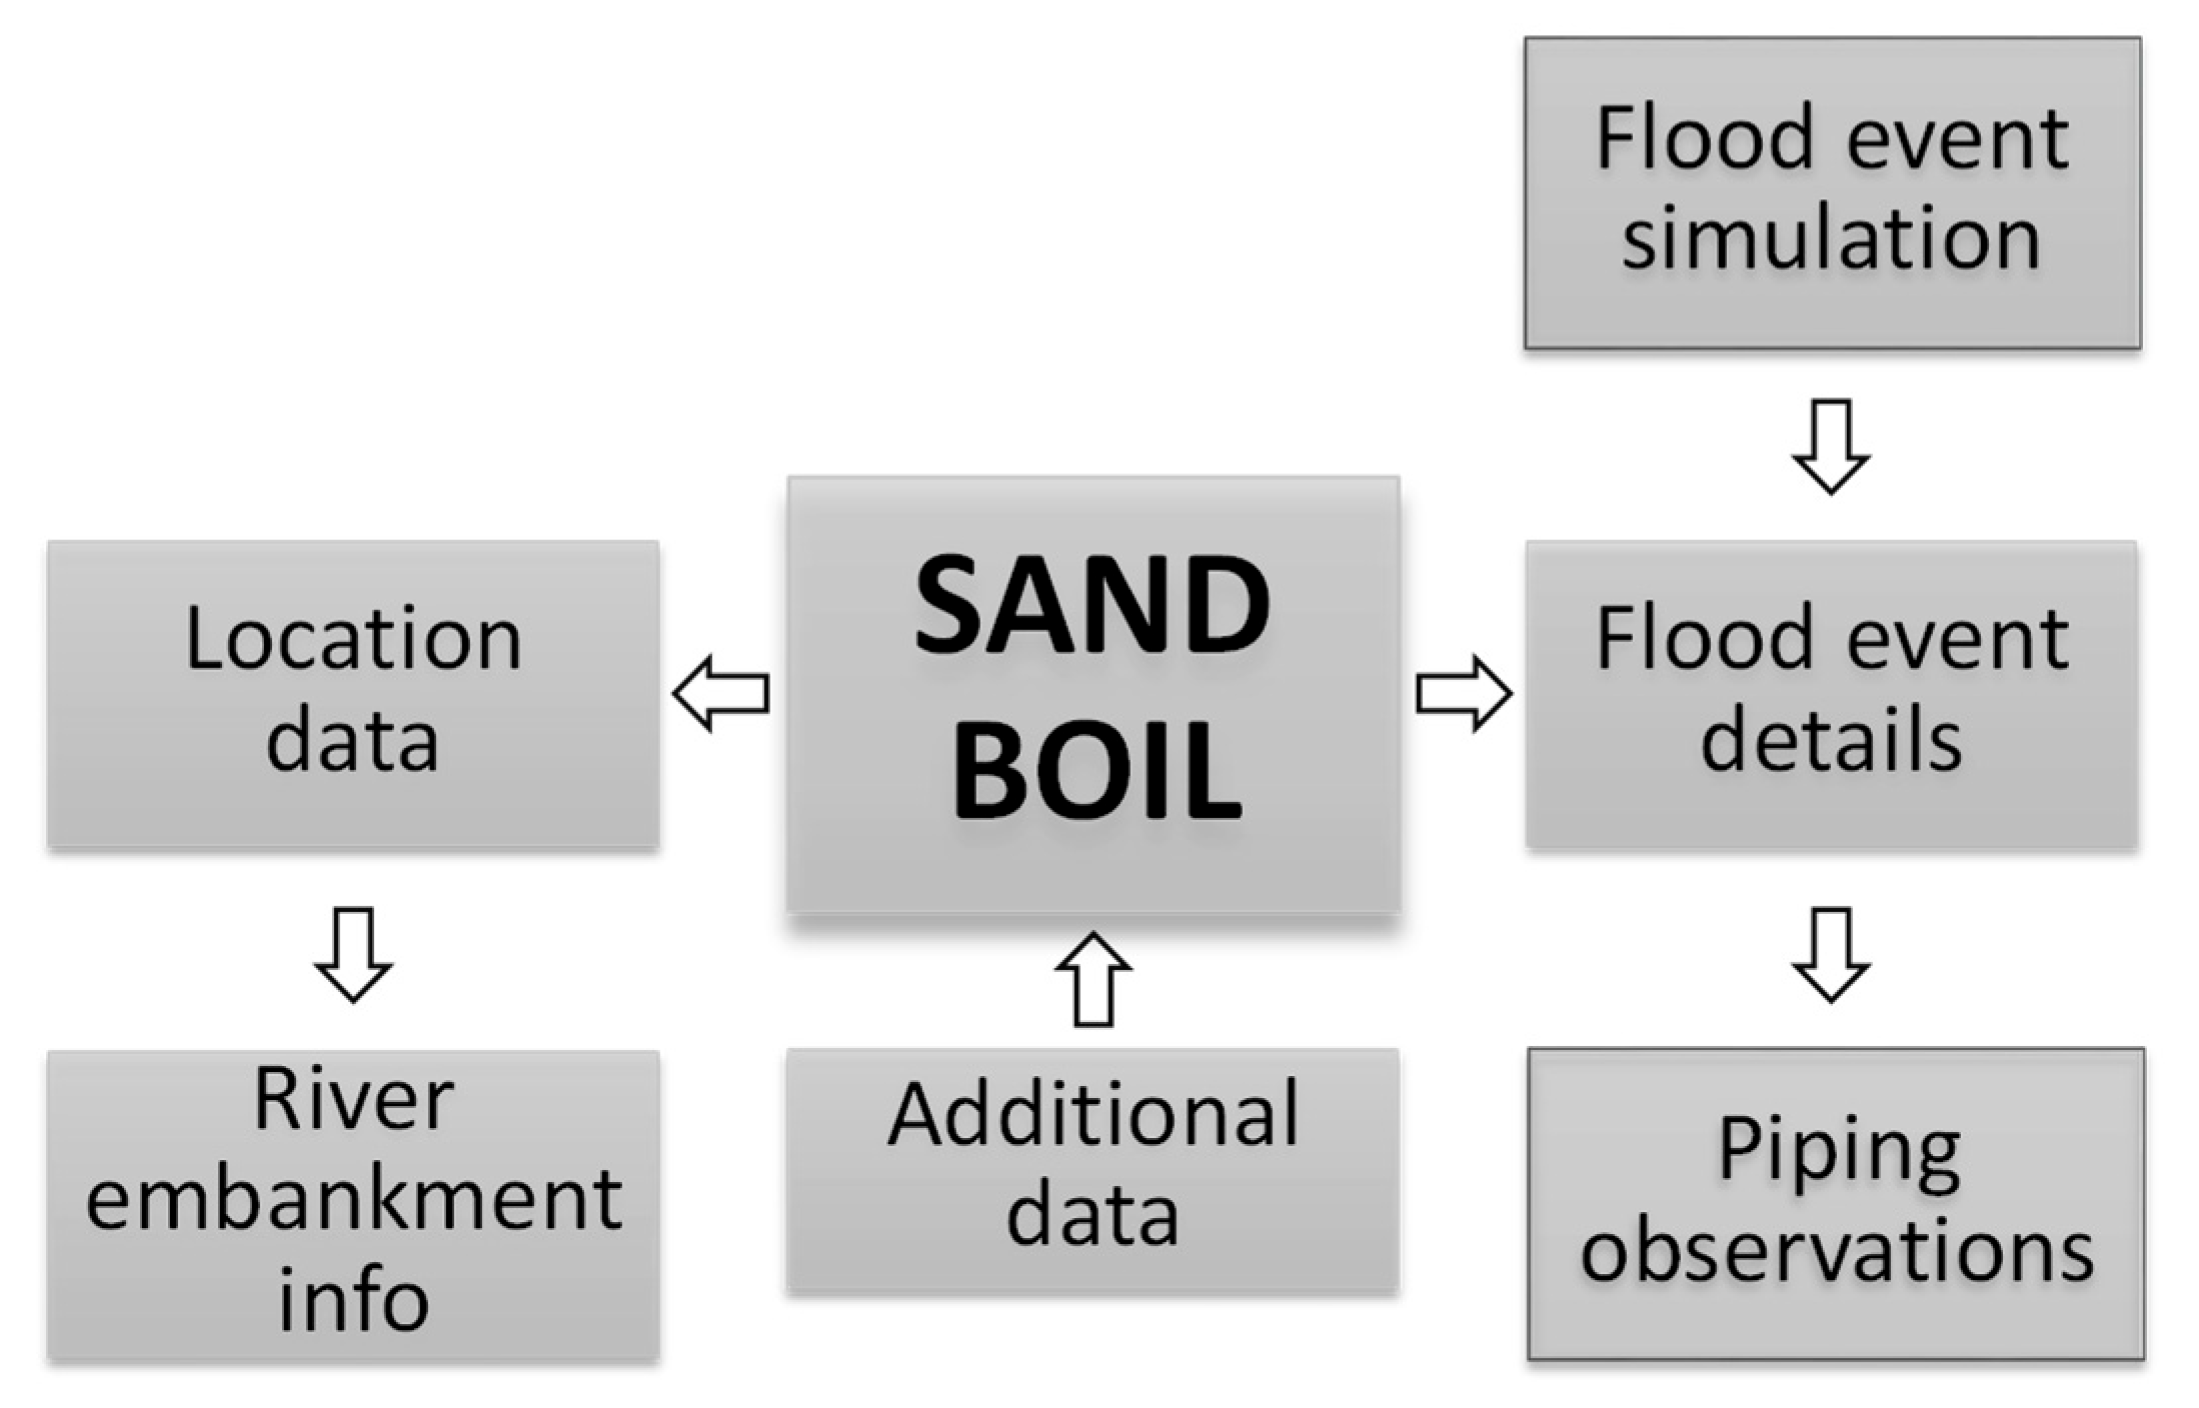
The structure of the “sand boil section”, including in turn different sub-sections, is illustrated in Figure 10. The section has been devised to allow the user to save a wide variety of data useful for a comprehensive description of the existing piping process, i.e., spatial, geometrical and temporal details, coupled with flood characteristics. A summary of the pieces of information that can be entered into the database, encompassing field measurements collected during the flood emergency stage, site investigations and monitoring activity, is provided in Figure 11. Most of these key data are typically collected also in other similar existing databases, in particular the two pioneering examples developed in the Netherlands and previously mentioned [12]. It must be observed that the field data to be taken of the sand boils during reactivations are generally simple, relatively fast and do not imply the use of complex procedures, having to be compatible with simultaneous emergency activities typically foreseen by the relevant protocols.
For each river segment affected by the piping evidence, geometric details of the embankment can be entered in the so-called “levee information window”, as shown in Figure 12, for the cross-section being discussed in this paper. This data entry window also allows specifying important stratigraphic details, such as the thickness of the blanket and the soil type (e.g., clay, silty clay, etc.) forming it. These are key pieces of information, as is also confirmed by the analyses carried out in Section 3.2, being indeed capable of affecting the susceptibility to piping of river embankment systems. Further geological, stratigraphic and geotechnical information, in the form of logs from site investigations, laboratory tests on collected soil samples or reports, can be uploaded as additional data in order to provide the most detailed possible description of the sandy aquifer and the overlying blanket layer.
Either a single sand boil or multiple ones can be associated with each cross-section; therefore, chains or rows of adjacent sand boils, such as those previously shown in Figure 2b, can be properly catalogued as well. As a matter of fact, besides single or multiple sand boils, the database system allows storing and classifying a variety of piping evidence at the ground surface, of either minor or major degree, such as spring water, soaking, leakage, subsoil softening and heaving, among others. A total of 14 different categories are available for selection, in order to properly describe all possible types of piping manifestation.
Each sand boil (or surface piping evidence), identified by an ID number, latitude and longitude, is then described in terms of the time of activation/reactivation, diameter of the throat (i.e., the vertical flow channel that extends through the blanket) and type/degree of activity, the latter reflecting how much material has been eroded and is moved from the boil. The size of the vertical pipe and the amount of material deposited at the surface are indeed recognized to be crucial indicators of the likelihood of a highly developed erosion process in the foundations and potential structural failure. The database, in particular, allows defining three different degrees of activity—namely, low, moderate and high—in relation to the size of the sand cone accumulated around the sand boil and the turbidity of the seepage discharge. The characteristics of the ejected sand, either obtained from field observation or from analysis on collected samples, and details of emergency actions adopted during the sand boil reactivation can be also added.
As an example, data entered for the sand boil #36(2), located in Boretto, during the November 2014 flood event, are shown in Figure 13. In this case, the vertical pipe diameter was found to be approximately 50 cm, but the sand volcano diameter was much higher, about 15 m, as is also suggested by the picture in Figure 4. Additional information can be uploaded in a free text field, in order to obtain a detailed record over the time of any changes in site conditions that might be correlated with the observed piping activity. Since sand boils may activate periodically, due to different hydraulic conditions, the above set of data is linked to a specific flood event, whose characteristics are compiled in a dedicated window of the database.
The flood event is described in terms of duration, maximum discharge and readings from nearby piezometers. Accordingly, for each sand boil, a series of observations collected in different flood events become available. This allows carrying out a comparative analysis of the river embankment response with respect to piping phenomena, as a function of different river water levels and flood durations.
Figure 14 shows a GIS digital map of the Po River basin, with green dots representing the sand boil locations currently entered into the database. All sand boils are typically monitored on site “manually”, by technicians of AIPo who are in charge of surveying critical cross-sections, detecting sand boil activations/reactivations during high-water events and implementing emergency actions to stop erosion progression, whenever necessary. In this respect, it must be observed that the growing need for an accurate, possibly automated identification of surface evidence of backward erosion piping worldwide has encouraged in recent years the application of sophisticated techniques, such as satellite or drone imagery together with machine learning models (e.g., [9,22,42]), which are meant to facilitate capturing sand boil activity and local predisposing conditions.

4.2. Database Query

The data stored in the database can be easily exported to standard .xls and .csv files, or interpreted through graphs that are basically meant to compare the effect of different flood events or the response of different historical sand boils during the same high-water event. The sand boil management tool allows the creation of two different types of graph, referred to as (i) river graphs and (ii) historical graphs. The first provides a profile of the maximum river water level reached in a flood event at the different sections monitored for piping, with different symbol colours for activated or non-reactivated sand boils. An example of a river graph is shown in Figure 15, where profiles of the 2014 and 2019 flood events are displayed in the same plot.
It is worth mentioning here that the water level at each sand boil location is obtained directly from records of the relevant hydrometric station, whenever available for the river section being analysed, or through the flood simulation algorithm also implemented in the database system, which interpolates hydrometric measurements collected at the nearest upstream and downstream stations. Figure 16 shows the water level in the Po River from January 2014 to December 2019, as provided by the hydrometric station located in Boretto, where automated measurements are continuously taken at 10 min intervals.
The second type of graph aims at providing an overview of the activations/non-reactivations observed in a single sand boil location for different flood events occurring in the past. The red bars are used to indicate activations or reactivations of the sand boil, whereas the green ones are adopted when no evidence of piping was detected. The bar height provides information on the water level reached in the river section during the flood event. This level can be compared with both the measured minimum water level causing piping initiation in the past (Hmin, red line) and the maximum hydrometric level (Hmax, green line) for which no activation was observed. This type of graph turns out to be very useful for defining threshold values of the water level triggering piping phenomena and thus for supporting early warning and early action systems. An example of a historical graph is shown in Figure 17, with respect to sand boil #36(2) located in Boretto and a few major flood events that occurred in the period 2000–2020. Piping activity in the sand boil was observed in 2000, 2014 and 2019. Furthermore, according to the available records, Hmin = 27.46 m (above m.s.l.) and Hmax = 26.01 m.
Two further examples of historical graphs are reported in Figure 18 and Figure 19, with respect to the cross-sections located in Carbonara Po and Guarda Ferrarese, respectively. The first is located at approximately 65 km downstream from Boretto, while the second is 120 km downstream, in the lower catchment of the river, close to the delta (see also Figure 14 for locations). Both sections have a history of sand boil development, similarly to the Boretto site. The stratigraphic model of each section, as obtained from cone penetration testing and boreholes, has been also provided in the figures. In this respect, it is worth observing that the river embankment cross-sections in Boretto, Carbonara Po and Guarda Ferrarese have similar stratigraphic arrangements. In particular, the relatively limited thickness of the blanket layer landside appears to be a common feature, which creates favourable conditions for backward erosion piping initiation. Furthermore, in spite of the distance, the grain size characteristics of the soil units involved in the underseepage and piping processes are fully comparable.
According to the records for the Carbonara Po sand boil (#62) shown in Figure 18, piping activity was observed in 2000 and 2014. The threshold water levels for sand boil activation (Hmin) and non-reactivation (Hmax) turn out to be very close to each other, 16.51 m above mean sea level and 16.04 m, respectively; thus, in this case, the hydraulic conditions causing initiation can be predicted with good accuracy.
As regards the Guarda Ferrarese cross-section (Figure 19), intense piping activity occurred here in 2014, 2018 and 2019. During the 2014 high-water event, in particular, evidence of major underseepage was reported, with the throat of the sand boil moving outside the sandbag ring and thus requiring re-ringing. In this case, the apparent inconsistency in the database response—i.e., the minimum water level causing reactivation being lower than the maximum water level for which no piping effects were observed—is most likely due to changes in site conditions that occurred after 2000. Indeed, a database note reports that a ditch was excavated parallel to the road embankment, resulting in an increase in susceptibility to backward erosion piping and a change in threshold river levels for sand boil reactivation. However, if we exclude the 2000 record, which cannot be compared with the others for the reasons specified above, it turns out that, once again, Hmin is very close to Hmax, and therefore the threshold water level for reactivation is, in all probability, around 7.60 m above mean sea level.

5. Conclusions

This paper has presented the main features of a database that is meant to catalogue the large amount of backward erosion piping evidence, mainly referable to so-called sand boils, detected along the major Italian watercourse, namely the Po River. This versatile and flexible GIS-based web application has been created as part of the activities devised in the European project LIFE SandBoil, coordinated by the University of Bologna, for the development of innovative and sustainable mitigation strategies against piping.
An accurate description of the different database sections has been preceded by an overview of the piping mechanism, the predisposing geologic and stratigraphic factors in river embankments and the incidence of the phenomenon along the Po River. In particular, a well-documented stretch of river embankment, recurrently affected by piping, has been presented in detail as a meaningful example of the typical stratigraphic arrangement encountered in Po River embankments with a history of sand boil development.
The database allows storing a wide variety of information, encompassing geometric and stratigraphic features of the river embankment systems and characteristics of piping evidence, together with a number of details about the flood events. In this respect, the database results in a methodological approach driving not only a careful collection of field measurements on sand boils during flood events, but also the effective planning of targeted field investigations and topographic surveys of the river embankment segment affected by piping, in order to identify local conditions facilitating underseepage. Indeed, while records of past sand boil reactivations often appear to be somewhat incomplete, with key pieces of information being unavailable, the “monitoring protocol” suggested by the database has resulted in accurate data collection for the latest reactivations.
By containing data on more than 130 sand boils, from the 2000 major flood event to the present, the database is undoubtedly capable of providing considerable insight into backward erosion piping phenomena along the Po River, in terms of incidence, severity, type of activity and triggering conditions. Virtual flood events may be also created by the system through the simulation algorithm, and, based on the recorded piping history along the river and the correlated triggering water levels, a spatial distribution of potential sand boil reactivations can be obtained. This feature undoubtedly makes the database an effective and useful predictive tool, to be used in conjunction with the well-known analytical methods typically adopted for backward erosion piping risk assessment. The latter, on the other hand, have been found to have some limitations in predicting the actual susceptibility to erosion initiation and progression, when applied to river embankment segments that have already experienced piping effects, likely due to both simplified stratigraphic assumptions and uncertainties in the proper characterization of pre-eroded subsoil.
Ongoing activities are intended to improve the geological, stratigraphic and geotechnical description at each sand boil location, since these vital pieces of information are not available at present for the total number of cross-sections catalogued in the database. This may sometimes require programming additional site investigation campaigns, mainly based on boreholes and cone penetration testing.
A desirable enhancement of the current web application should consist in importing geologic maps into the database, in order to easily correlate sand boil spatial distributions and specific alluvial landforms that are recognized to affect groundwater flow and facilitate piping occurrence. This additional feature would significantly improve the predictive capability of the database, which could effectively support the identification of other areas potentially susceptible to backward erosion piping phenomena. Finally, a long-term challenging development might also involve the application of machine learning algorithms to assist in hazard classification and piping risk assessment. Machine learning models, applied to satellite or drone imagery, could be also used for detecting sand boils along the Po River, in addition to traditional inspections on site. In this respect, recent successful experiments have been carried out in the United States.
In conclusion, the detailed presentation contained in this paper has shown that the proposed sand boil database, in its current form, turns out to be particularly suitable for vulnerability studies with respect to backward erosion piping and may undoubtedly help in assigning hazard classes to different river embankment sections, identifying priorities for the implementation of mitigation measures, as well as monitoring the effectiveness of the interventions that have been installed. Thus, it serves as a tool to efficiently support flood risk assessment and management against piping phenomena along the Po River. In this respect, the continuous and accurate updating of data during future high-water events will obviously be crucial, in order to progressively increase the potential of the database.
It is worth finally observing that, although the database contains at present only data referred to the Po River, the system has been designed in such a way as to accommodate data from various river basins, with the potential to become an international database of backward erosion piping phenomena observed worldwide.

Author Contributions

Conceptualization, L.T. and M.M.; methodology, LT. and M.M.; software, A.B. and A.R.; validation, LT., M.M., A.B. and A.R.; formal analysis, L.T. and M.M.; investigation, L.T., M.M., A.B. and A.R.; data curation, L.T., M.M., A.B. and A.R.; writing—original draft preparation, L.T. and M.M.; writing—review and editing, L.T.; funding acquisition, L.T. All authors have read and agreed to the published version of the manuscript.

Funding

The database presented in this paper was developed as part of the activities of the LIFE SandBoil project (“Natural-based solution to mitigate flood risk due to SAND BOIL reactivations along the Po River”, Grant Agreement no. LIFE19 ENV/IT/000071) funded by the European Commission and coordinated by the University of Bologna.

Data Availability Statement

The data discussed in this study are made available within the paper. For specific datasets, please contact the corresponding author.

Conflicts of Interest

The authors declare no conflicts of interest.

References

  1. Van Beek, V.M. Backward Erosion Piping. Initiation and Progression. Doctoral Dissertation, Delft University of Technology, Delft, The Netherlands, 2015. Available online: http://repository.tudelft.nl/ (accessed on 5 December 2015).
  2. Zhou, R.; Wen, Z.; Su, H. Detect submerged piping in river embankment by passive infrared thermography. Measurement 2022, 202, 111873. [Google Scholar] [CrossRef]
  3. US Army Corps of Engineers. Investigation of Underseepage and Its Control—Lowser Mississippi River Levees; Technical Memorandum No. 3-424; Waterways Experiment Station: Vicksburg, MS, USA, 1956; Volume 1. [Google Scholar]
  4. US Army Corps of Engineers. Performance Evaluation of the New Orleans and Southeast Louisiana Hurricane Protection System; Final Report of the Interagency Performance Evaluation Task Force; US Army Corps of Engineers: Washington, DC, USA, 2009; Volume 1. [Google Scholar]
  5. Po River Basin Authority. Progetto Strategico per il Miglioramento delle Condizioni di Sicurezza Idraulica dei Territori di Pianura Lungo l’Asta Medio-Inferiore del Fiume Po; Technical Report; Po River Basin Authority: Parma, Italy, 2005; p. 88. (In Italian) [Google Scholar]
  6. ICOLD. Internal Erosion of Existing Dams, Levees and Dikes, and Their Foundations; Bulletin 164; ICOLD: Paris, France, 2015; p. 342. [Google Scholar]
  7. Robbins, B.A.; Van Beek, V.M. Backward erosion piping: A historical review and discussion of influential factors. In Proceedings of the ASDSO Dam Safety Conference, New Orleans, LA, USA, 13–17 September 2015; pp. 1–20. [Google Scholar]
  8. DeHaan, H.; Stamper, J.; Walters, B. Mississippi River and Tributaries System. 2011 Post-Flood Report; USACE, Mississippi Valley Division: Vicksburg, MS, USA, 2012. [Google Scholar]
  9. Kelley, J.R.; Parkman, K.B.; Strange, R.C.; Breland, B.R.; Dunbar, J.B.; Corcoran, M.K. Investigation of Sand Boils near Ware, IL, Middle Mississippi River, Preston Levee District; Report No. ERDC/GSL TR-19-36; USACE, Engineer Research and Development Center: Vicksburg, MS, USA, 2019. [Google Scholar]
  10. ÉDUVIZIG. Report on the Latest Reactivations of Sand Boils, including New Geological and Geotechnical Data to be Added to Existing Database (Danube and Marcal River Basins); Technical Report, LIFE19 ENV/IT/000071—LIFE SandBoil; ÉDUVIZIG: Győr, Hungary, 2021; p. 16. [Google Scholar]
  11. Marchi, M.; García Martínez, M.F.; Gottardi, G.; Tonni, L. Field measurements on a large natural sand boil along the river Po, Italy. Q. J. Eng. Geol. Hydrogeol. 2021, 54, qjegh2020-097. [Google Scholar] [CrossRef]
  12. Van Beek, V.; Wiersma, A.; Van Egdom, M.; Robbins, B.A. Databases for Backward Erosion Piping Laboratory Experiments and Field Observations. In Proceedings of the EWG-IE 26th Annual Meeting 2018, Milan, Italy, 10–13 September 2018; Springer: Cham, Switzerland, 2019; pp. 336–346. [Google Scholar]
  13. Aielli, S.; Pavan, S.; Parodi, S.; Rosso, A.; Tanda, M.G.; Marchi, M.; Vezzoli, G.; Pantano, A.; Losa, D.; Sirtori, M. Collection and analysis of the reactivation data of the historical sand boils in the Po river levees. In Proceedings of the EWG-IE 26th Annual Meeting 2018, Milan, Italy, 10–13 September 2018; Springer: Cham, Switzerland, 2019; pp. 327–335. [Google Scholar]
  14. Zhou, Q.; Su, J.; Arnbjerg-Nielsen, K.; Ren, Y.; Luo, J.; Ye, Z.; Feng, J. A GIS-based hydrological Modeling Approach for Rapid Urban Flood Hazard Assessment. Water 2021, 13, 1483. [Google Scholar] [CrossRef]
  15. Dirkx, W.-J.; van Beek, R.; Bierkens, M. The Influence of Grain Size Distribution on the Hydraulic Gradient for Initiating Backward Erosion. Water 2020, 12, 2644. [Google Scholar] [CrossRef]
  16. Pan, H.; Rice, J.D.; Peng, S.; Cao, H.; Luo, G. Analytical Modeling with Laboratory Data and Observations of the Mechanisms of Backward Erosion Piping Development. Water 2022, 14, 3420. [Google Scholar] [CrossRef]
  17. Riha, J.; Petrula, L. Experimental Research on Backward Erosion Piping Progression. Water 2023, 15, 2749. [Google Scholar] [CrossRef]
  18. Kolb, C.R. Geologic Control of Sand Boils along Mississippi River Levees; Final Report, Miscellaneous Paper S-75-22; Soils and Pavements Laboratory, U.S. Army Engineer Waterways Experiment Station: Vicksburg, MS, USA, 1975. [Google Scholar]
  19. Semmens, S.N.; Zhou, W. Evaluation of environmental predictors for sand boil formation: Rhine-Meuse Delta, Netherlands. Environ. Earth Sci. 2019, 78, 457. [Google Scholar] [CrossRef]
  20. Girolami, L.; Bonelli, S.; Valois, R.; Chaouch, N.; Burgat, J. On internal erosion of the pervious foundation of flood protection dikes. Water 2023, 15, 3747. [Google Scholar] [CrossRef]
  21. Arfa-Fathollahkhani, A.; Ayyoubzadeh, S.A.; Shafizadeh-Moghadam, H.; Mianabadi, H. Spatiotemporal Characterization and Analysis of River Morphology Using Long-Term Landsat Imagery and Stream Power. Water 2022, 14, 3656. [Google Scholar] [CrossRef]
  22. Downard, A.D.; Semmens, S.N.; Robbins, B.A. Automated Characterization of Ridge-Swale Patterns along the Mississippi River; Report ERDC/GSL TR-21-13; Engineer Research and Development Center, US Army Corps of Engineers: Washington, DC, USA, 2021. [Google Scholar]
  23. Martin, S.M.; Dunbar, J.B.; Corcoran, M.K.; Schmitz, D.W. Geologic Controls of Sand Boil Formation at Buck Chute, Mississippi; Report ERDC/GSL TR-17-12; Engineer Research and Development Center, US Army Corps of Engineers: Washington, DC, USA, 2017. [Google Scholar]
  24. Castaldini, D.; Marchetti, M.; Norini, G.; Vandelli, V.; Zuluaga Vélez, M.C. Geomorphology of the central Po Plain, Northern Italy. J. Maps 2019, 15, 780–787. [Google Scholar] [CrossRef]
  25. Campo, B.; Amorosi, A.; Bruno, L. Contrasting alluvial architecture of Late Pleistocene and Holocene deposits along a 120-km transect from the central Po Plain (northern Italy). Sediment. Geol. 2016, 341, 265–275. [Google Scholar] [CrossRef]
  26. Rosselli, S.; Molinari, F.C.; Severi, P. Note Illustrative della Carta Geologica d’Italia alla Scala 1:50,000, Foglio 182 Guastalla; Regione Emilia-Romagna, Servizio Geologico, Sismico e dei Suoli: Bologna, Italy; p. 95. Available online: https://www.isprambiente.gov.it/Media/carg/note_illustrative/182_Guastalla.pdf (accessed on 15 March 2024).
  27. Gottardi, G.; Marchi, M.; Tonni, L. Static stability of Po river banks on a wide area. In Geotechnical Engineering for Infrastructure and Development, Proceedings of the XVI ECSMGE, Edimburgh, UK, 13–17 September 2015; ICE Publishing: London, UK, 2015; Volume 4, pp. 1675–1680. [Google Scholar]
  28. Merli, C.; Colombo, A.; Riani, C.; Rosso, A.; Martelli, L.; Rosselli, S.; Severi, P.; Biavati, G.; De Andrea, S.; Fossati, D.; et al. Seismic stability analyses of the Po river banks. In Proceedings of the XII IAEG, Torino, Italy, 15–19 September 2014; Springer: Cham, Switzerland, 2014; Volume 2, pp. 877–880. [Google Scholar]
  29. Martelli, L.; Severi, P.; Biavati, G.; Rosselli, S. Modello Geologico per le Verifiche di Stabilità in Condizioni Sismiche dell’argine Destro del Po tra Boretto (RE) e Ro (FE); Report SISMAPO; Regione Emilia-Romagna—Servizio Geologico, Sismico e dei Suoli: Bologna, Italy, 2011; p. 21. [Google Scholar]
  30. Robertson, P.K. Estimating in-situ soil permeability from CPT & CPTu. In Proceedings of the 2nd International Symposium on Cone Penetration Testing, CPT’10, Huntington Beach, CA, USA, 9–11 May 2010; Volume 1. [Google Scholar]
  31. Bertolini, I.; Gottardi, G.; Marchi, M.; Tonni, L.; Bassi, A.; Rosso, A. Application of CPT to the evaluation of permeability in a Po river embankment prone to backward erosion piping. In Proceedings of the 5th International Symposium on Cone Penetration Testing (CPT’22), Bologna, Italy, 8–10 June 2022; CRC Press: Leiden, The Netherlands, 2022; pp. 300–305. [Google Scholar] [CrossRef]
  32. Gottardi, G.; Gragnano, C.G.; Ranalli, M.; Tonni, L. Reliability analysis of riverbank stability accounting for the intrinsic variability of unsaturated soil parameters. Struct. Saf. 2020, 86, 101973. [Google Scholar] [CrossRef]
  33. Severi, P.; Biavati, G. Definizione del Modello Geologico e Idrogeologico della Zona Arginale del Fiume Po in Destra Idrografica da Boretto (RE) a Ro (FE); Servizio Geologico, Sismico e dei Suoli, Regione Emilia-Romagna: Bologna, Italy, 2013. (In Italian) [Google Scholar]
  34. CIRIA. The International Levee Handbook; CIRIA: London, UK, 2013. [Google Scholar]
  35. US Army Corps of Engineers. Design and Construction of Levees; Engineer Manual 1110-2-1913; US Army Corps of Engineers: Washington, DC, USA, 2000. [Google Scholar]
  36. García Martínez, M.F.; Tonni, L.; Marchi, M.; Tozzi, S.; Gottardi, G. A numerical tool for the prediction of sand boil reactivations near river embankments. J. Geotech. Geoenviron. Eng. 2020, 146, 06020023. [Google Scholar] [CrossRef]
  37. Sellmeijer, J.B. On the Mechanism of Piping under Impervious Structures. Doctoral Dissertation, Technical University of Delft, Delft, The Netherlands, 1988. [Google Scholar]
  38. Sellmeijer, J.B.; Koenders, M.A. A mathematical model for piping. Appl. Math. Model. 1991, 15, 646–651. [Google Scholar] [CrossRef]
  39. Sellmeijer, J.B.; Lopéz de la Cruz, J.; Van Beek, V.M.; Knoeff, J.G. Fine-tuning of the piping model through small-scale, medium-scale and IJkdijk experiments. Eur. J. Environ. Civ. Eng. 2011, 15, 1139–1154. [Google Scholar] [CrossRef]
  40. Hortus. Sand Boil Management: User Manual; Hortus: Longiano, Italy, 2021. [Google Scholar]
  41. AIPO. Report on the Latest Reactivations of Sand Boils, including New Geological and Geothechnical Data to be Added to Existing Database (Po River Basin); LIFE SandBoil (LIFE19 ENV/IT/000071): Deliverable 1—Action A1 Update of the sand boil databases for the Po and Danube rivers; AIPO: Parma, Italy, 2021. [Google Scholar]
  42. Kuchi, A.; Hoque, M.T.; Abdelguerfi, M.; Flanagin, M.C. Machine learning applications in detecting sand boils from images. Array 2019, 3–4, 100012. [Google Scholar] [CrossRef]
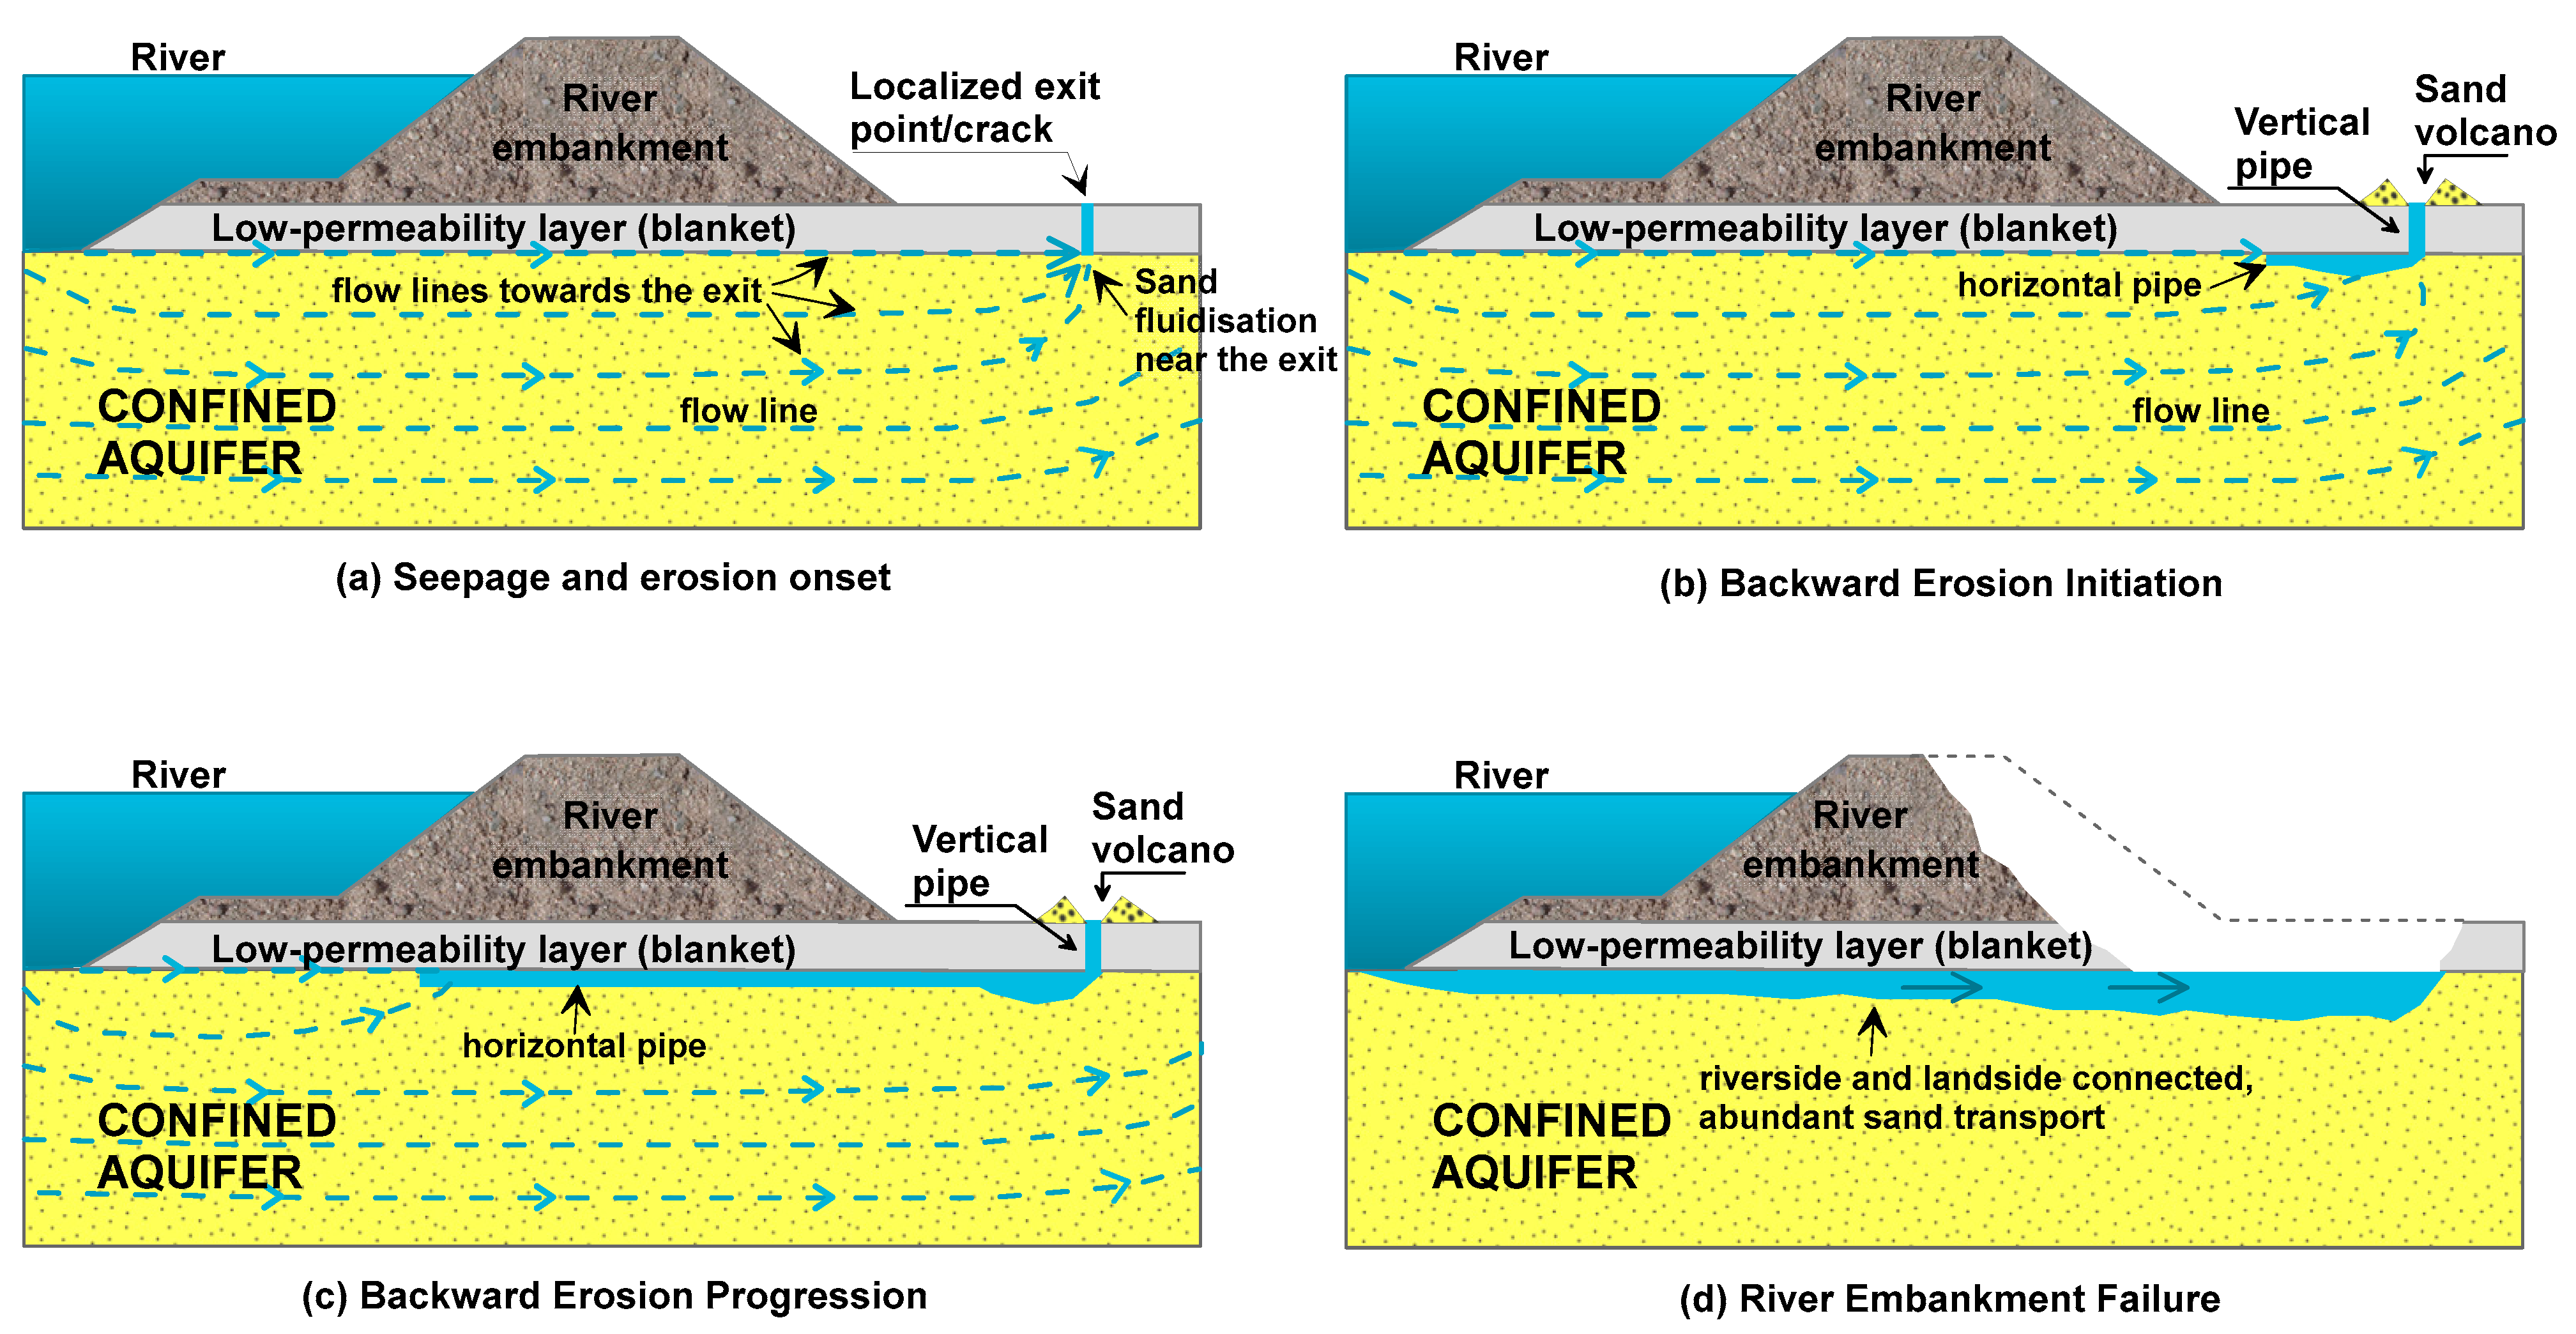
Figure 1. Model of backward erosion-piping process: (a) initiation of sand fluidisation around the exit hole, (b) backward erosion initiation, (c) progression of horizontal pipe below the river embankment, and (d) widening of the horizontal pipe, leading to failure.
Water 16 01384 g001
Figure 2. (a) A sand volcano created at the ground surface, inside a ditch, during the November 2023 reactivation of a historic sand boil along the Po River, close to the delta (Mazzorno, Ferrara province, Italy); (b) chain of sand boils along the Danube River, in Hungary (courtesy of ÉDUVIZIG).
Water 16 01384 g002
Figure 3. (a) A satellite view of the Po River basin and the location of the selected study area, in Boretto. (b) Segment of Po River flowing in Boretto, with location of sand boils and saturated areas due to underseepage observed on landside of the river embankment. The yellow and white circles are used for sand boils still subjected to recurrent reactivations during high-water events; the green diamonds indicate “relict” sand boils, with no reactivations over the last 25 years. The red line indicates the crest of the river embankment.
Water 16 01384 g003
Figure 4. An aerial view of the largest historical sand boil (#36(2)) in Boretto, during the November 2014 reactivation. In the background, note saturated areas landward, due to underseepage. (Image courtesy of the Italian Firefighters Corps, Vigili del Fuoco).
Water 16 01384 g004
Figure 5. Scheme of the sedimentary facies associations identified in the investigated Po plain area. Modified from Rosselli et al. [26].
Water 16 01384 g005
Figure 6. Stratigraphic model of the investigated river embankment (cross-section a-a’), with piezocone (CPTU) log profiles.
Water 16 01384 g006
Figure 7. (a) Particle-size distribution curves of soil samples collected from Unit A and Unit B; (b) profile of predicted permeability values of soil units A, B and C from interpretation of CPTU 3 data.
Water 16 01384 g007
Figure 8. Trend of piezometer readings carried out in Section 1-1, located at about 2.5 km from the investigated area (as shown in the map above, on the left). The relevant stratigraphic scheme is provided above on the right side, together with a sketch of the three boreholes equipped with piezometers.
Water 16 01384 g008
Figure 9. The basic geometry of the river embankment adopted in the blanket theory.
Water 16 01384 g009
Figure 10. Scheme of the database structure, with particular reference to the section “sand boil”.
Water 16 01384 g010
Figure 11. Summary of the types of data that can be incorporated in the sand boil database.
Water 16 01384 g011
Figure 12. Example of a data entry window containing details on the river embankment geometry and stratigraphic arrangement. The entered data refer to the large sand boil labelled as #36(2), located in Boretto.
Water 16 01384 g012
Figure 13. Data entry window of the web application containing details of the sand boil and the piping activity. The entered data refer to the reactivation of sand boil #36(2) in Boretto, during the November 2014 flood event.
Water 16 01384 g013
Figure 14. Map showing the location (green symbols) of the sand boils detected along the Po River (downloaded from the database).
Water 16 01384 g014
Figure 15. Example of data extraction in the form of a “river graph”, showing profiles for the 2014 and 2019 flood events. Red circles are used for reactivations; green circles indicate non-reactivations.
Water 16 01384 g015
Figure 16. Record of the water level in the Po River from January 2014 to December 2019, provided by the hydrometric station located in Boretto. The datum of the station is 19.9 m above mean sea level. The light orange, orange and ruby red horizontal lines indicate fixed water level warning thresholds, according to AIPo guidelines.
Water 16 01384 g016
Figure 17. Example of data extraction in the form of “historical graph”, with reference to the large-size sand boil #36(2) observed in Boretto.
Water 16 01384 g017
Figure 18. (a) Stratigraphic model of Carbonara Po cross-section; (b) “historical graph” for sand boil #62(1) detected in this area.
Water 16 01384 g018
Figure 19. (a) Stratigraphic model of Guarda Ferrarese cross-section; (b) “historical graph” for sand boil #75a detected in this area. The apparent inconsistency in the database response is likely due to a change in site conditions, occurring after 2000.
Water 16 01384 g019
Table 1. Mean values of soil permeability k estimated from CPTU data. Standard deviation of computed log10(k) included in brackets.
Soil Unitlog10(k)
with k Expressed in m/s
k
(m/s)
A−4.73 (0.65)1.87 × 10⁻⁵
B−7.81 (0.77)1.53 × 10⁻⁸
C−8.93 (0.39)1.17 × 10⁻⁹
Table 2. Parameters adopted for tseepage analysis (blanket theory).
L1
(m)
L2
(m)
zbl
(m)
d
(m)
x
(m)
kbl
(m/s)
kf
(m/s)
113622.6230521.2 × 10−91.9 × 10⁻⁵
Table 3. Parameters used in piping assessment using Sellmeijer’s model.
η
(-)
θ
(°)
γ′p
(kN/m3)
d70
(mm)
κ
(m2)
L
(m)
ha
(m)
0.2536.4916.50.151.94 × 10−1225230
Disclaimer/Publisher’s Note: The statements, opinions and data contained in all publications are solely those of the individual author(s) and contributor(s) and not of MDPI and/or the editor(s). MDPI and/or the editor(s) disclaim responsibility for any injury to people or property resulting from any ideas, methods, instructions or products referred to in the content.