Article

Digital Flow in a Pool Induced by a Vertical Jet

1
Department Civil Engineering, University of Coimbra, MARE—Marine and Environmental Research Centre/ARNET—Aquatic Research Network, Polo II, 3030-788 Coimbra, Portugal
2
Water Michael Baker International, Dallas, TX 75234, USA
*
Author to whom correspondence should be addressed.
Water 2024, 16(10), 1386; https://doi.org/10.3390/w16101386
Submission received: 10 March 2024 / Revised: 2 May 2024 / Accepted: 5 May 2024 / Published: 13 May 2024
(This article belongs to the Section Hydraulics and Hydrodynamics)

Abstract

:
Turbulent water jets remain a critical study area, particularly the relation of the water flow with air entrainment and its role in energy dissipation at different hydraulic structures. Plunge pools, formed by the impact of jets on water cushions, play a pivotal role in energy dissipation. Understanding the complex flow dynamics within these pools is essential for designing efficient hydraulic structures. In this research, we present a comprehensive investigation of different numerical simulations, defining two-phase (air-water) in different ways, and them compare with experimental measurements. The primary objective is to analyze the pressure distribution at the bottom of a plunge pool induced by a vertical jet and understand the importance of accurately defining air-water flow in the dynamics of the jet into the pool. Our study bridges the gap between empirical data and computational modeling, shedding light on the intricate behavior of such flows with different method-based solvers: VOF, sub-grid, and multi-phase Euler. Various computational domains, mesh configurations, and analyses spanning different time periods, frequencies, and scales were considered.

1. Introduction

Turbulent water jets and their interaction with air along the way, from the release until reaching water cushions, are crucial in various hydraulic engineering scenarios, including flow through gates or over dams. It is believed that this influences energy dissipation in the plunge pool downstream of dams. The behavior of the jet due to the atmosphere that surrounds it and into the pool where it falls has been the subject of extensive experimental investigation for several decades [1,2,3,4,5,6,7,8,9,10,11,12,13,14,15,16,17,18]. Physical modeling has provided valuable insights into water jet behavior and into pressure hydrodynamics at the pool bottom [11].
The jets undergo intricate interactions with the surrounding atmosphere, leading to turbulence-induced disintegration and secondary interactions between air and water [7]. It is known that flow through the surrounding atmosphere suffers disintegration due to turbulence and these secondary interactions. Upon impact with the free surface of the pool, the jet generates strong vorticity, air entrainment, and spray [11]. The local flow dynamics within the plunge pool are influenced by factors such as roughness and free surface breaking. These phenomena are dominated by momentum concentration and turbulence, resulting in fluctuating pressures at the pool bottom. Despite the significance of these processes, a comprehensive understanding of the detailed jet characteristics and their impact on the pool remains indefinite due to inherent measurement challenges. Visualizing and quantifying these complex interactions pose substantial difficulties.
The effects on roughness and free surface breaking are particularly relevant for local velocities, dominated by the concentration of momentum and turbulence, which induce pressures that fluctuate randomly at the bottom, producing hydrodynamic forces. The detailed characteristics of the jet and its impact on a pool are not known, as they are difficult to measure, see, and quantify. On the other hand, knowledge about pressure hydrodynamics at the bottom is well reported by physical modelling [11,13]. However, it is essential to acknowledge the limitations of physical models, as they do not fully account for pool aeration, primarily due to non-compliance with the Weber similarity criteria.
The simulation of turbulent flows involving free surfaces is critical in hydraulic engineering. Researchers have explored various numerical techniques, including the volume of fluid model (VOF) [19] or smoothed particle hydrodynamics—SPH [20] together with different turbulent models. InterFoam, a VOF integrated into the OpenFOAM® framework, is widely employed for modeling free-surface phenomena. Unfortunately, interFoam falls short in accurately describing air-water interaction within a true two-phase modelis [19,21,22,23]. The main concept in VOF modeling is the VOF function, denoted as F = F ( x , y , z , t ) , ranging from 0 to 1. These values correspond, respectively, to cells without water and those fully occupied by water. This function evolves through the mass and momentum conservation equations and it is updated using an advection equation [24,25]. Despite its utility, InterFoam struggles to capture the complexities of air entrainment and dynamic interface behavior.
Significant improvements in VOF models, such as surface tension and interface curvature, have been made. Additionally, artificial compression terms have been introduced to enhance the accuracy of the interface representation [26,27]. The VOF method in interFoam has two particularities: a volumetric surface force, explicitly estimated by the continuum surface force (CSF) function of the surface tension, and the interface curvature, which are included in the momentum equation.
Numerical prediction of self-aeration and two-phase interaction has been gaining interest in numerically predicting self-aeration and two-phase interactions. Researchers have explored various approaches to achieve more accurate physical descriptions in this context. In the case of dispersed two-phase flows, where a significant portion of the two-phase structures is smaller than the computational grid, a commonly used approach is the two-fluid (Euler-Euler) model. This model involves a set of equations for each phase, allowing for interaction terms between the phases. However, it comes with the drawback of significantly increased computational costs. Lopes et al. [21,22] developed the airInterFoam model, which was integrated into code OpenFOAM® v.2.3.0. This serves as a sub-grid air-entrainment model, providing a time-averaged solution for air concentration values in self-aeration and two-phase flows. Introducing air entrainment as a sub-grid model makes it possible to describe the interface more accurately as air is incrementally introduced into the water. Almeland et al. [23] further enhanced the airInterFoam model and updated it to OpenFOAM® v.5.0. The modification involved refining the interface detection algorithm. Specifically, they introduced a parabola-based function combined with a distance limit approach to control the air source. These adjustments resulted in more stable simulation results, especially when the computational grid was refined.
Other recent improvements were done by Anez et al. [28] developing an Euler–Lagrange spray atomization (ELSA) approach in the OpenFOAM® framework. This Eulerian formulation dedicated to jet atomization is a quasi-multiphase Eulerian (QME) approach and was used to simulate “salte del Angel”. Recently, this model has been investigated for application in other related applications, for example, cavitating sprays by McGinn et al. [29] and flash evaporation by Gratner and Kronenburg [30].
In this study, we investigate fluid flow within an experimental installation (Figure 1) using OpenFOAM®. The installation includes various models of jets plunging into pools with different water depths [3,12]. Specifically, we focus on smaller water depths. Our analysis involves a statistical examination of variables, following a methodology based on reduced-scale physical models. We evaluate mean pressures and statistical properties. Additionally, we statistically describe the impact pressures generated by rough, turbulent jets, considering both mean values and high-order moments for variable pool depths.

2. Physical Model—Experimental Installation at the EPFL

The Laboratory of Hydraulic Constructions (LCH) within the École Polytechnique Fédérale de Lausanne (EPFL) in Switzerland had an installation (Figure 1), [3,12], where experimental tests were done, conducting the physical data collection used in this study. The laboratory installation contains a circular pool with a 3-m diameter and a horizontally curved pipe (90 degrees) directing a high-velocity jet vertically through a nozzle (exit diameter D = 0.072 m) positioned at 0.7 m above the pool bottom. The system operates as a closed circuit and undergoes testing across various discharge flow conditions, with Q ranging from 30 to 120 L/s. Under different conditions, water pool depths varied from Y = 0.072 to 0.87 m. High-velocity jets entrain air within the pool, resembling scenarios encountered in prototype applications for water release structures such as dams [12].
Pressure measurements were done at the pool bottom utilizing a 3 mm diameter piezo-resistive micro-transducer (Kulite XTL-190-17BAR-A), flush-mounted at six points relative to the center: 0.025 m, 0.050 m, 0.075 m, 0.095 m, 0.150 m, and 0.200 m. Sampling occurred at a frequency of 2 kHz for 32.5 s, with an estimated accuracy of 0.1%. Discharge measurements relied on a 1% accurate electromagnetic flowmeter (refer to [12] for detailed information). In our current study, we conducted tests with a jet velocity of Q = 30 (m/s) exploring pool water depths ranging from Y = 0.2 to 0.67 m and pool depth-to-jet diameter ratios spanning from Y / D = 2.8 to 9.3 (see Table 1). Key parameters include the average velocity at the nozzle exit ( V 0 ), Reynolds number ( R e = V 0 D / ν ), the Froude number ( F r = V 0 / ( g D ) 0.5 ), the jet travel distance in the air (L), and the jet break-up length in the air ( L b ).

3. Numerical Modelling

3.1. Numerical Solver

In the context of numerical turbulent models used in this study, they rely on the Reynolds-Averaged Navier–Stokes equations (RANS) to describe 3D incompressible and isothermal flows. Turbulence is characterized using the S S T k ω turbulence model, known for its accuracy in predicting water elevation and velocity profiles. Water and air are treated as Newtonian fluids, with kinematic viscosities ( ν k ) of 1 ×   10 6 and 1.48 ×   10 5 , and densities ( ρ k ) of 1000 and 1, respectively. Our simulations encompass three distinct flow models within OpenFOAM®: (1) interFoam (volume-of-fluid method)—considering a single set of RANS equations (Equations (1) and (2)) for the mixing fluid ( ρ = ρ w · α + ρ g · ( 1 α ) ; ν = ν w · α + ν g · ( 1 α )), an additional equation to describe the free-surface (Equation (3)), which contains a compression term to be applied in the interface (third term), as proposed by [26] and the transport equations for turbulent variables k and ω (Equation (5) where c is k and ω , respectively); (2) airInterFoam (derived from interFoam, [21,22,23]) in order to take into account the air entrainment generated in spread and impinging into the water as a sub-grid model (Equation (4)); and (3) Euler-EulerFoam (multiphase flow), which considers, apart from turbulent equations (Equation (5)), a set of Navier Stokes equations (Equations (1) and (2)) for each flow.
𝜕 ( ρ k α k ) 𝜕 t + · ( ρ k U k ) = 0 .
𝜕 ( ρ k α k U k ) 𝜕 t + · ( ρ k α k U U ) = · ( α k p ) g · x · ( ρ k α k ) + · ( α k τ k ) + F
𝜕 𝜕 t ( α ) + · ( α U ) + · ( [ u c α ( 1 α ) ] ) = 0 .
𝜕 𝜕 t ( α g ) + · ( u g α g ) · ( [ Γ α g 2 α g ] ) = S g .
𝜕 𝜕 t ( ρ c ) + · ( ρ k c U ) = · ( Γ c 2 c ) + P c Y c + D c .

3.2. Numerical Set

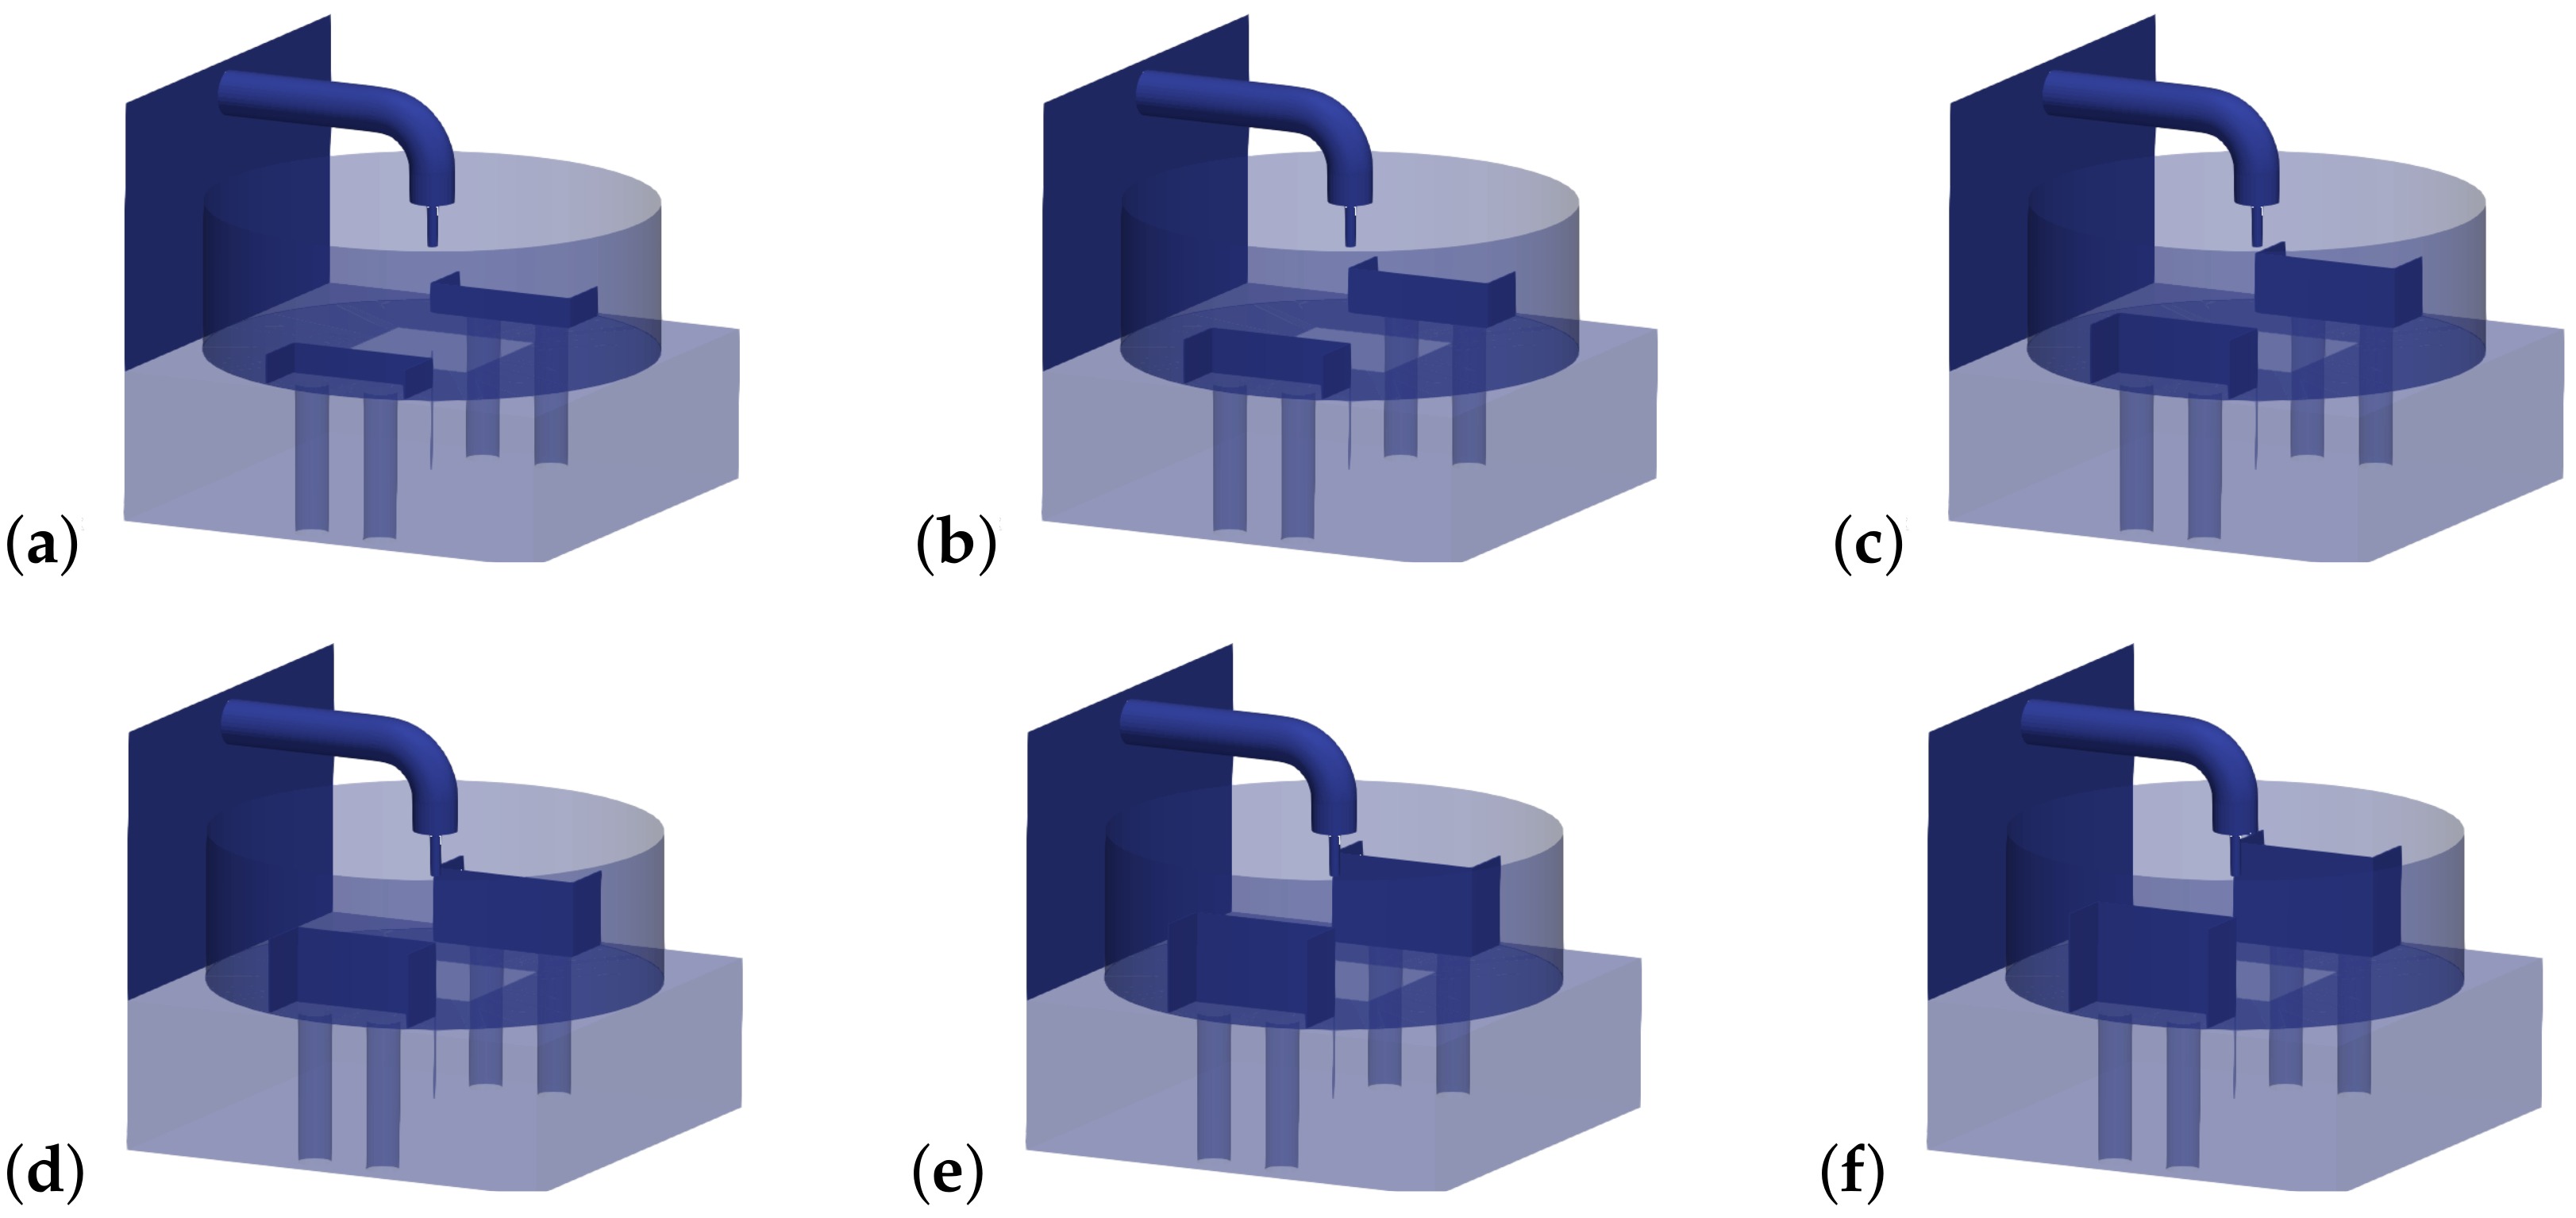
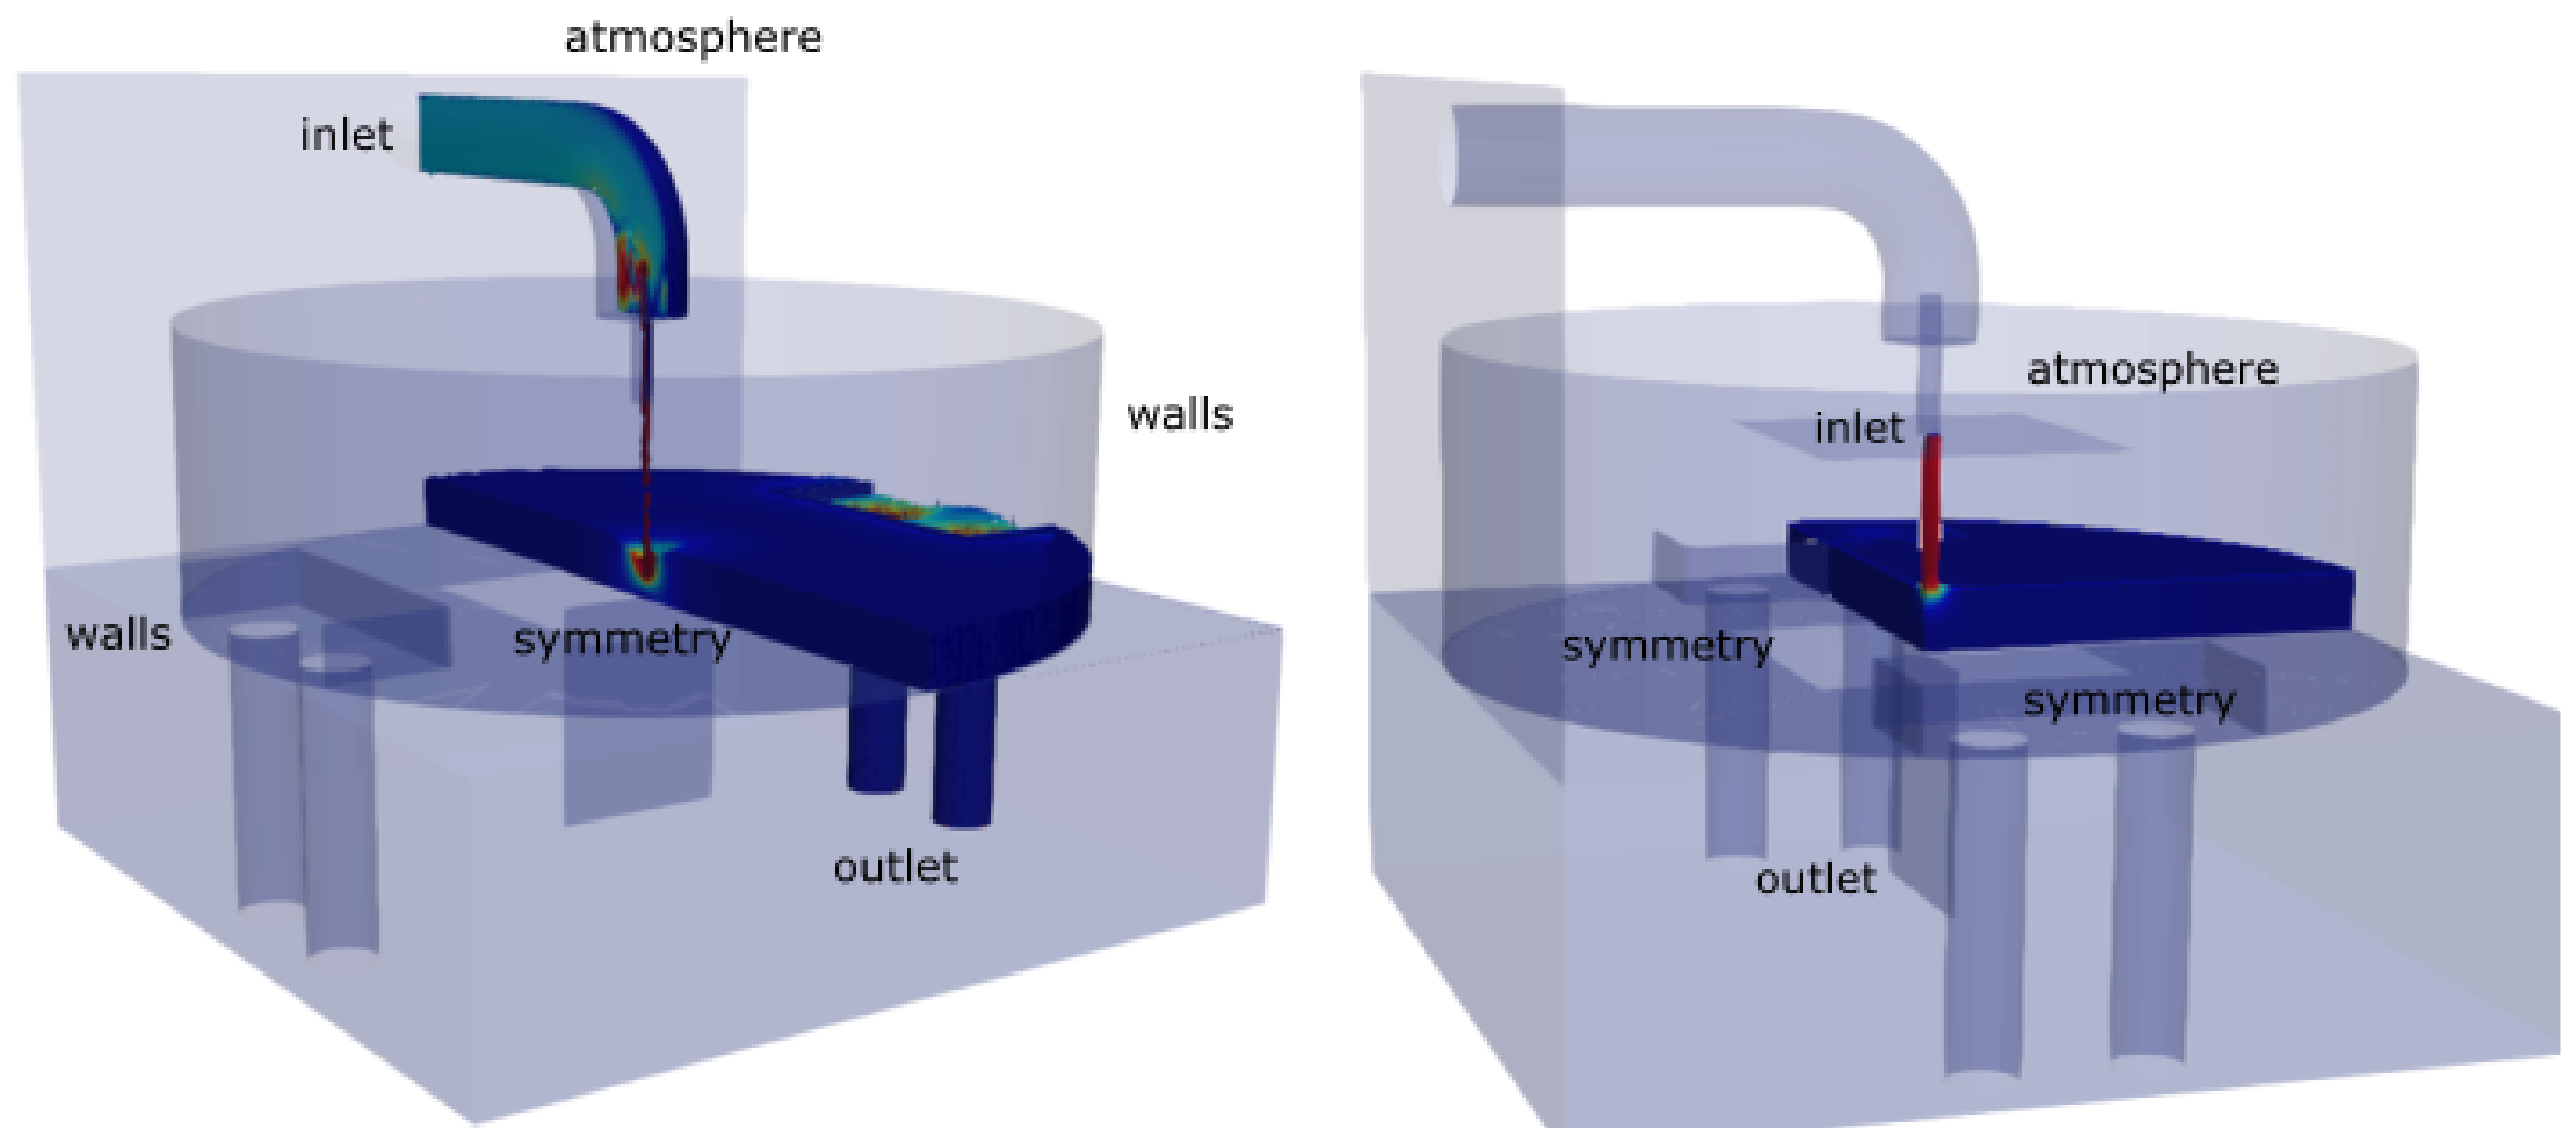
The geometry of the installation depicted in Figure 1 was created using SALOME-9.2.2, and the generated stl (“stereolithography”) files from this geometry defined the boundaries and facilitated mesh construction using the snappyHexMesh tool in OpenFOAM®-v.22.12. Refinement parameters near the walls were specified in the snappyHexMesh Dictionary, employing two refinement levels for each surface-based refinement and maintaining three cells between levels. We explored six geometries based on pool water depth, which correlates with weir height near the pool outlet (Figure 2). Preliminary simulations encompassed various domain sizes, including the entire structure and only the domain between the pool bottom and nozzle exit, with consideration for one or two axes of symmetry (Figure 3). Boundary conditions were defined for the inlet, outlet, walls (including pipes, nozzle, pool, bottom, and weir), atmosphere (surrounding the installation), and symmetry. Fixed pressure boundaries were prescribed at the outlet, while atmospheric pressure was set at the atmosphere boundary. Velocity was assigned a zeroGradient condition to allow free airflow if needed. Close wall boundaries adhered to the no-slip condition. Initial conditions involved a water volume with constant depth in the pool and velocity inside the pipe calculated based on measured discharge flow. Inlet conditions represented a fully developed steady flow, considering an inverse power pipe flow profile. The models were simulated using variable time steps dynamically adjusted to meet CFL requirements, running in parallel mode with eight processors.

3.3. Data Analysis

Paraview was used to analyze simulations along time and to select variables along the bottom as well as values at certain points along time and export them to be analyzed by Matlab codes developed to calculate statistics on those points. Plotting along time at the points where pressure transducers were measured allowed us to analyze unsteady character. After selecting the steady state period, statistics were calculated, namely, average, maximum and minimum values, median, mode, standard deviation, skewness, and kurtosis. Those characteristics were calculated considering different frequencies ( Δ t = 0.1 s, 0.01 s and 0.005 s), and different graphs were plotted to allow the achievement of the frequency for the characteristics analysis. Histograms of all variables were calculated, and pressure and velocity distributions were also plotted against normal, gamma, and gumbel laws.

4. Results and Discussion

4.1. Grid Sensitivity

A mesh analysis was done for the 0.2 water pool case, following the Richardson extrapolation method reported by [31]. Computational meshes were different for different water depths (see Table 2).

4.2. Solver Sensitivity

Figure 4 and Figure 5 illustrate jet discharge from the nozzle, entering the 0.2 m water depth pool, impacting the pool bottom, and spreading in the pool, simulated by the different solvers and different meshes: interFoam, airInterFoam, and multiphaseEulerFoam. The results are not identical. For example, at t = 0.1 s, multiphaseEulerFoam shows a jet penetration into the pool different from the others, particular different from coarser meshes, which shows a round spread; at t = 1 s, free surface is different for the various simulations—multiphaseEulerFoam seems more real and coarser meshes with interFoam shows more unreal results; at t = 10 s, multiphaseEulerFoam would take long time and would request a lot of memory to save the results, but we believe the results would be better. The following work will focus on the solvers interFoam and airInterFoam, which have advantages concerning practical cases and wider use. In spite of the differences, the influenced area and time of perturbation caused by the jet into the pool was similar.

4.3. Unsteady Character

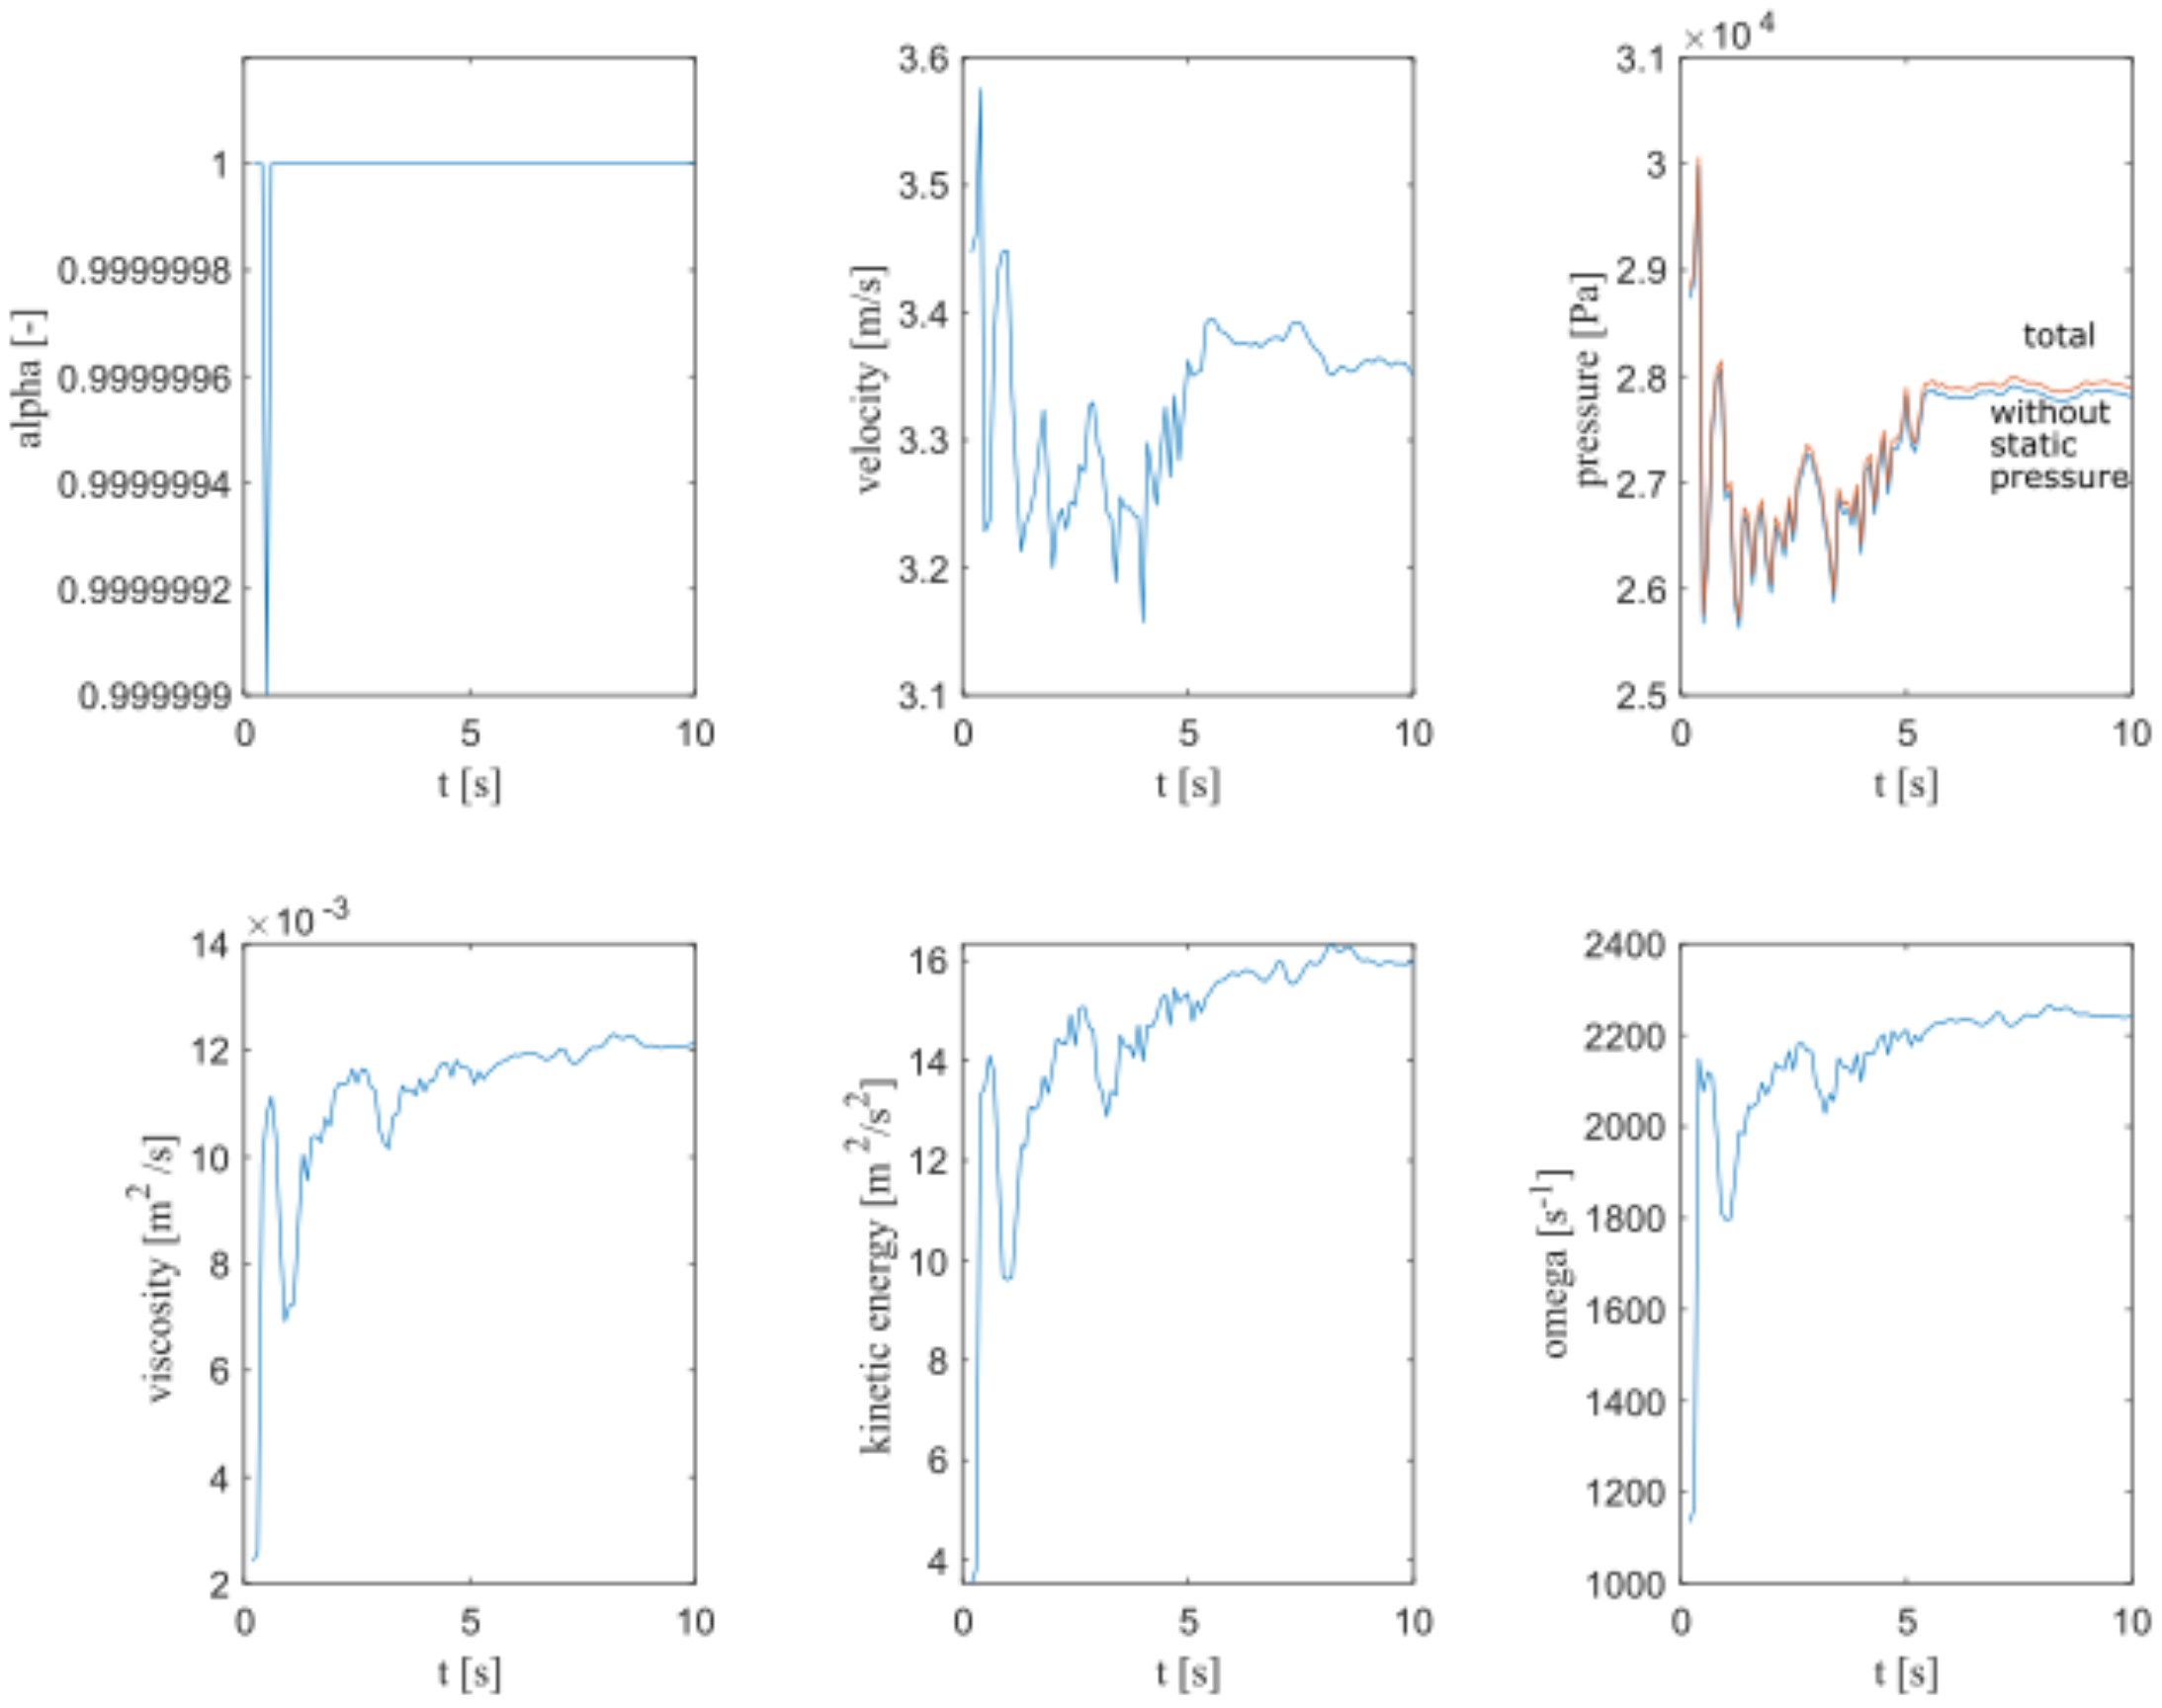
Figure 6 illustrates variation along the time of flow variables using interFoam in OpenFOAM® v.22.12, which shows that variables are steady, apart from unsteady characteristic inherent to RANS models, after 5 s. This is in accordance with other results reported in Moreira et al. [20]. This period is much smaller than the 1 to 3 min typically evaluated in physical models.

4.4. Statistical Characteristics

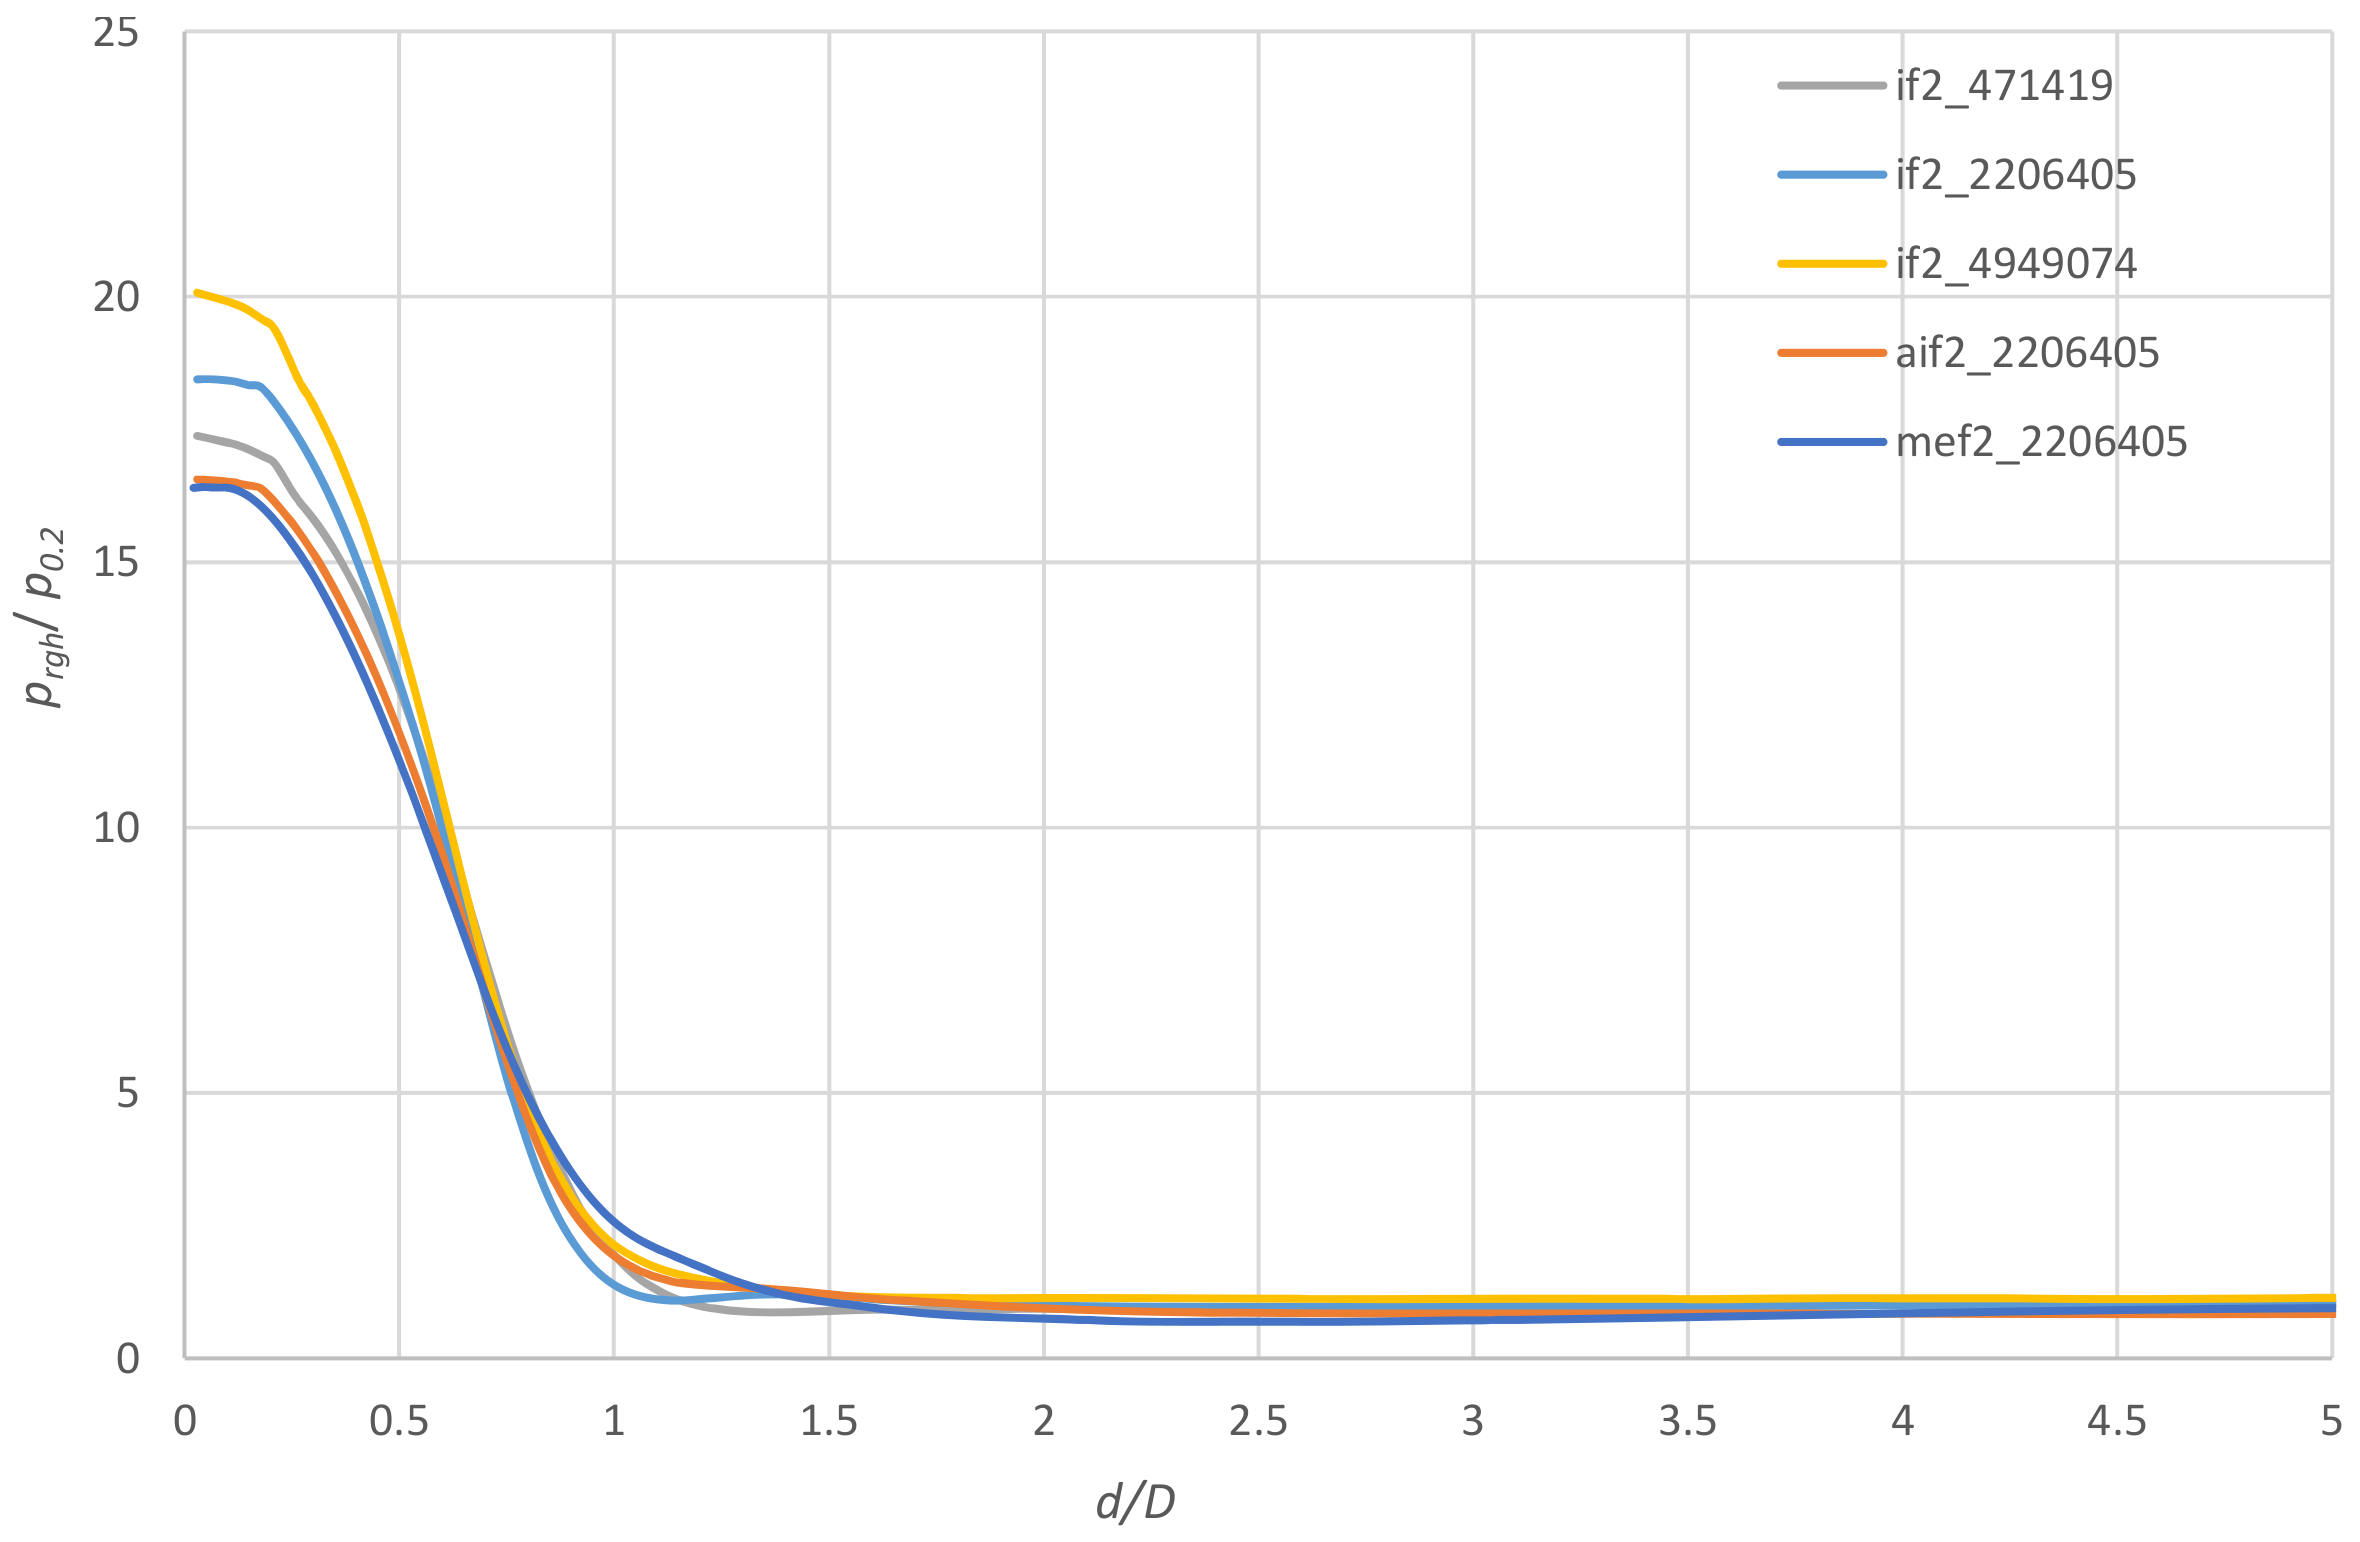
Figure 7 shows main statistics, boxplots of the variables considering Δ t = 0.1 s for simulations with interFoam and airInterFoam. Extreme values obtained by interFoam or airInterFoam are different but on the same order of magnitude, except the pressure, for which interFoam reaches higher values. Some peak values are associated with the presence of air. Figure 8 shows the pressure profile at the bottom, being p r g h dynamic pressure at the pool bottom, p 0.2 , the hydrostatic pressure at a 0.2 water depth bottom, and d the distance from the pool center. Indeed, using the VOF method (interFoam), the maximum pressure at the pool center is higher, the finer the mesh. Simulations using airInterFoam and multiphaseEulerFoam, in OpenFOAM® v.5 and v.22.12, respectively which account for the air-water interaction led to lower pressure values and similar results, corresponding to the smaller pressure value at the core center. It must be noted that the profile with simulations with multiphaseEulerFoam was not plotted as an average but only over the 1 s time, as it was only run up to that time. The mesh chosen for multiphaseEulerFoam and for airInterFoam was the intermediate.
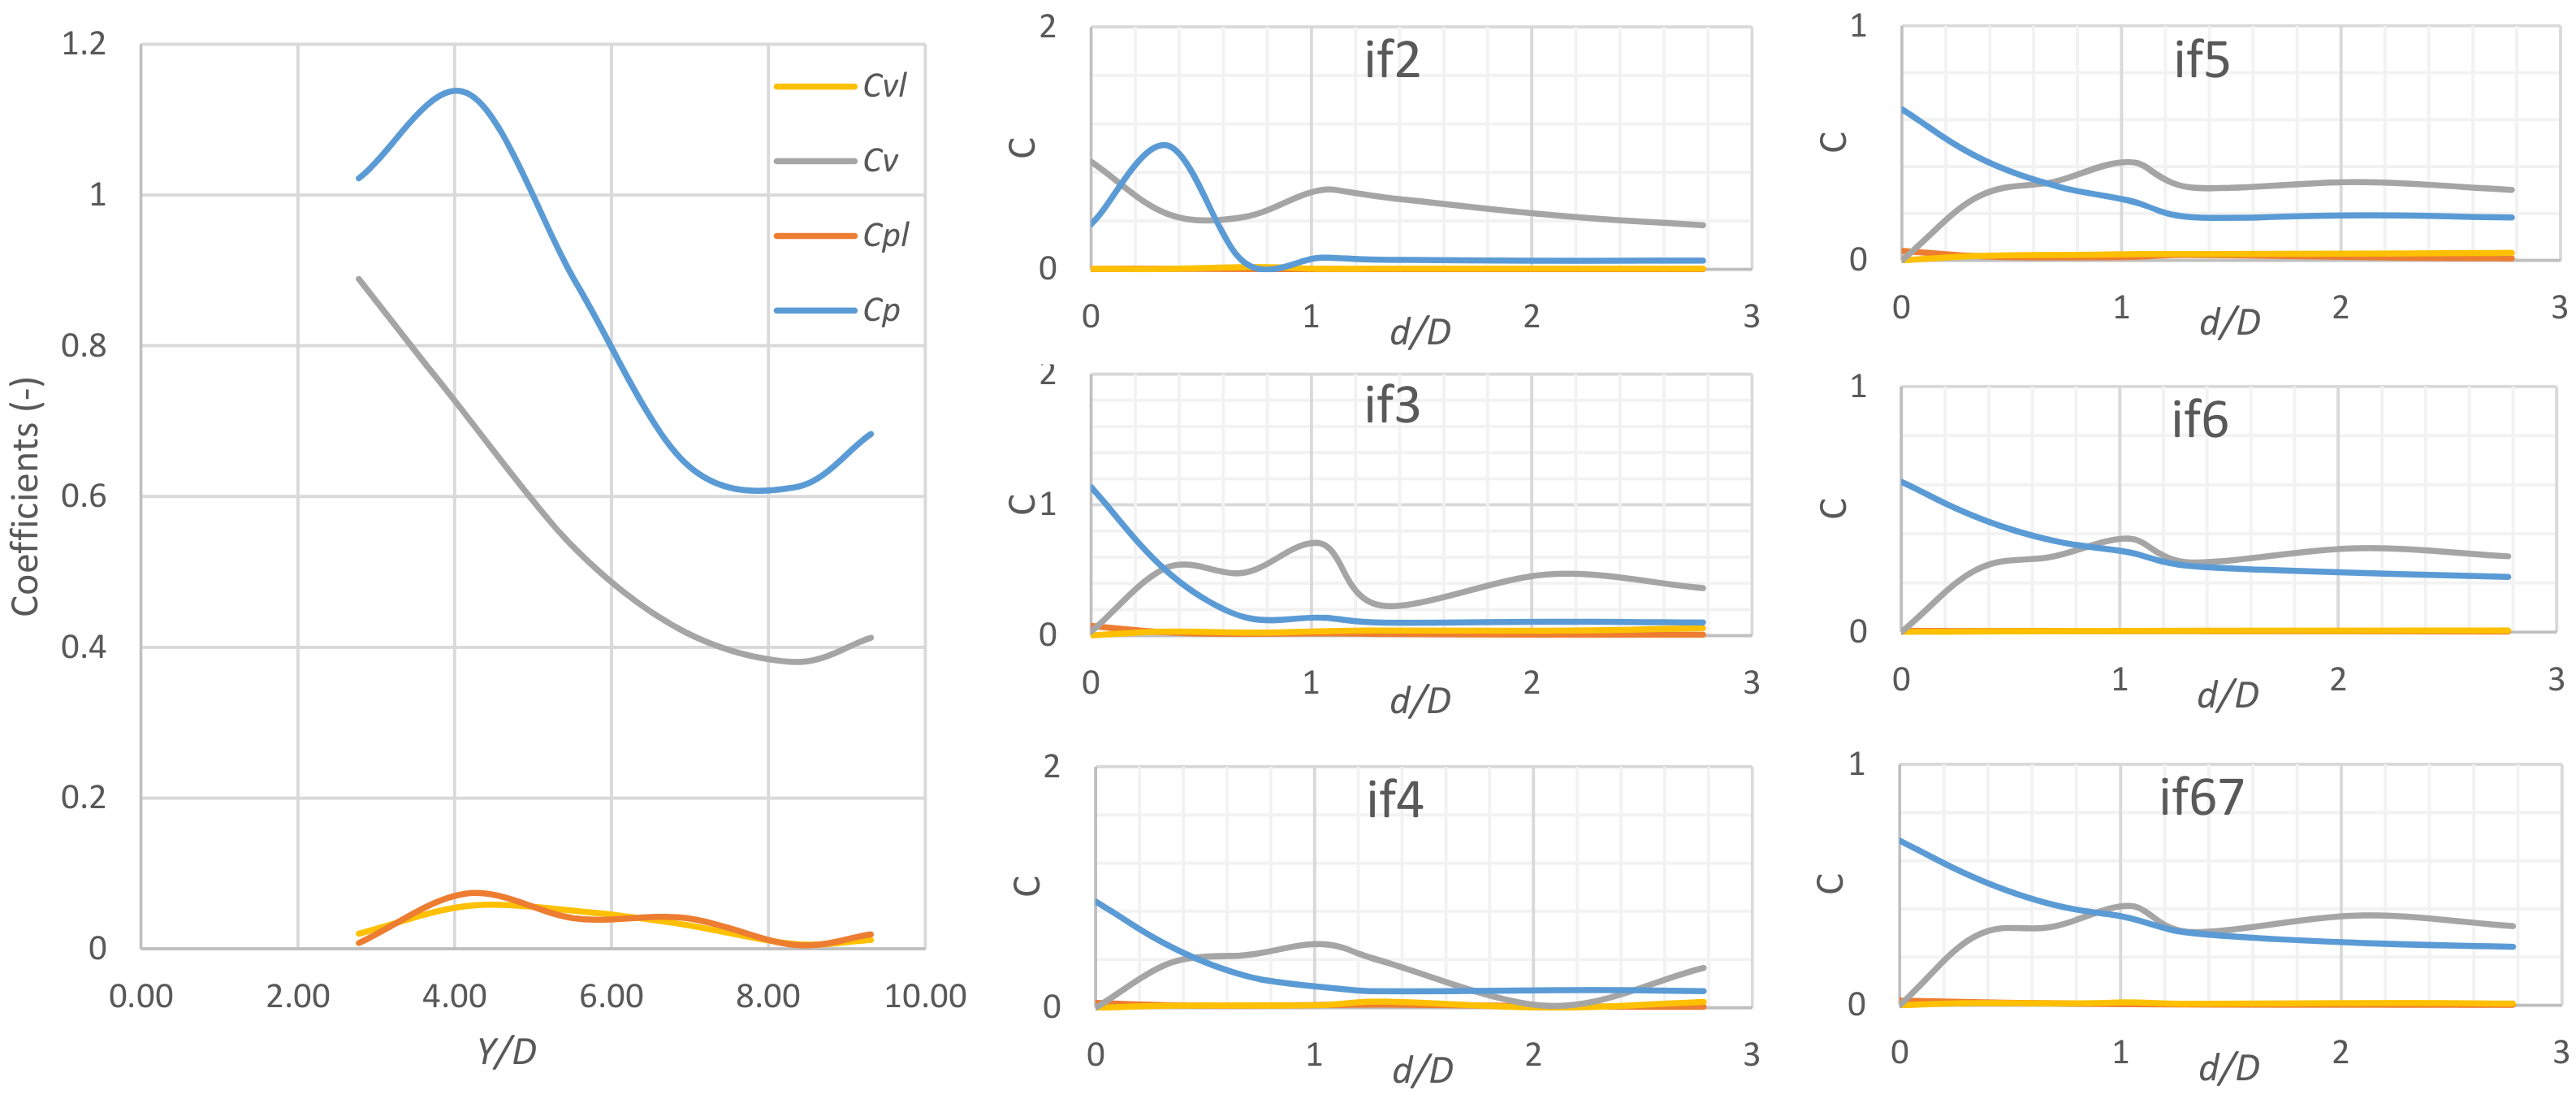
Figure 9 illustrates the non-dimensional mean dynamic pressure coefficient C p and mean velocity coefficient C v as a function of the geometrical ratio of plunge pool depth Y to jet diameter D. Non-dimensional fluctuating pressure coefficient C p l and fluctuating velocity coefficient C v l were also calculated. As expected, mean values agree with the measurements from the physical model [12]. The timing of the simulation, associated with the frequency and turbulence model, leads to much smaller fluctuating values than those obtained by physical model measurements, which is also expected as these simulations were done with RANS models. However, values show similar variation, as turbulent kinetic energy (k) values attained 16 m2/s2 (see Figure 9 which is in accordance with the fluctuating velocity of 4 m/s reported in Manso et al. [12].
Graphs for shallow pools (Y = 0.2 m, Y / D = 2.8), in which jet impacts the pool bottom at the center, differ from the graphs for intermediate water depth (0.3 m ≤ Y ≤ 0.5 m, 4 ≤ Y/D ≤ 8) and those from the deep pool (0.6 m ≤ Y ≤ 0.67 m, 8 ≤  Y / D  ≤ 9.3), where the jet develops before impacting the pool bottom.
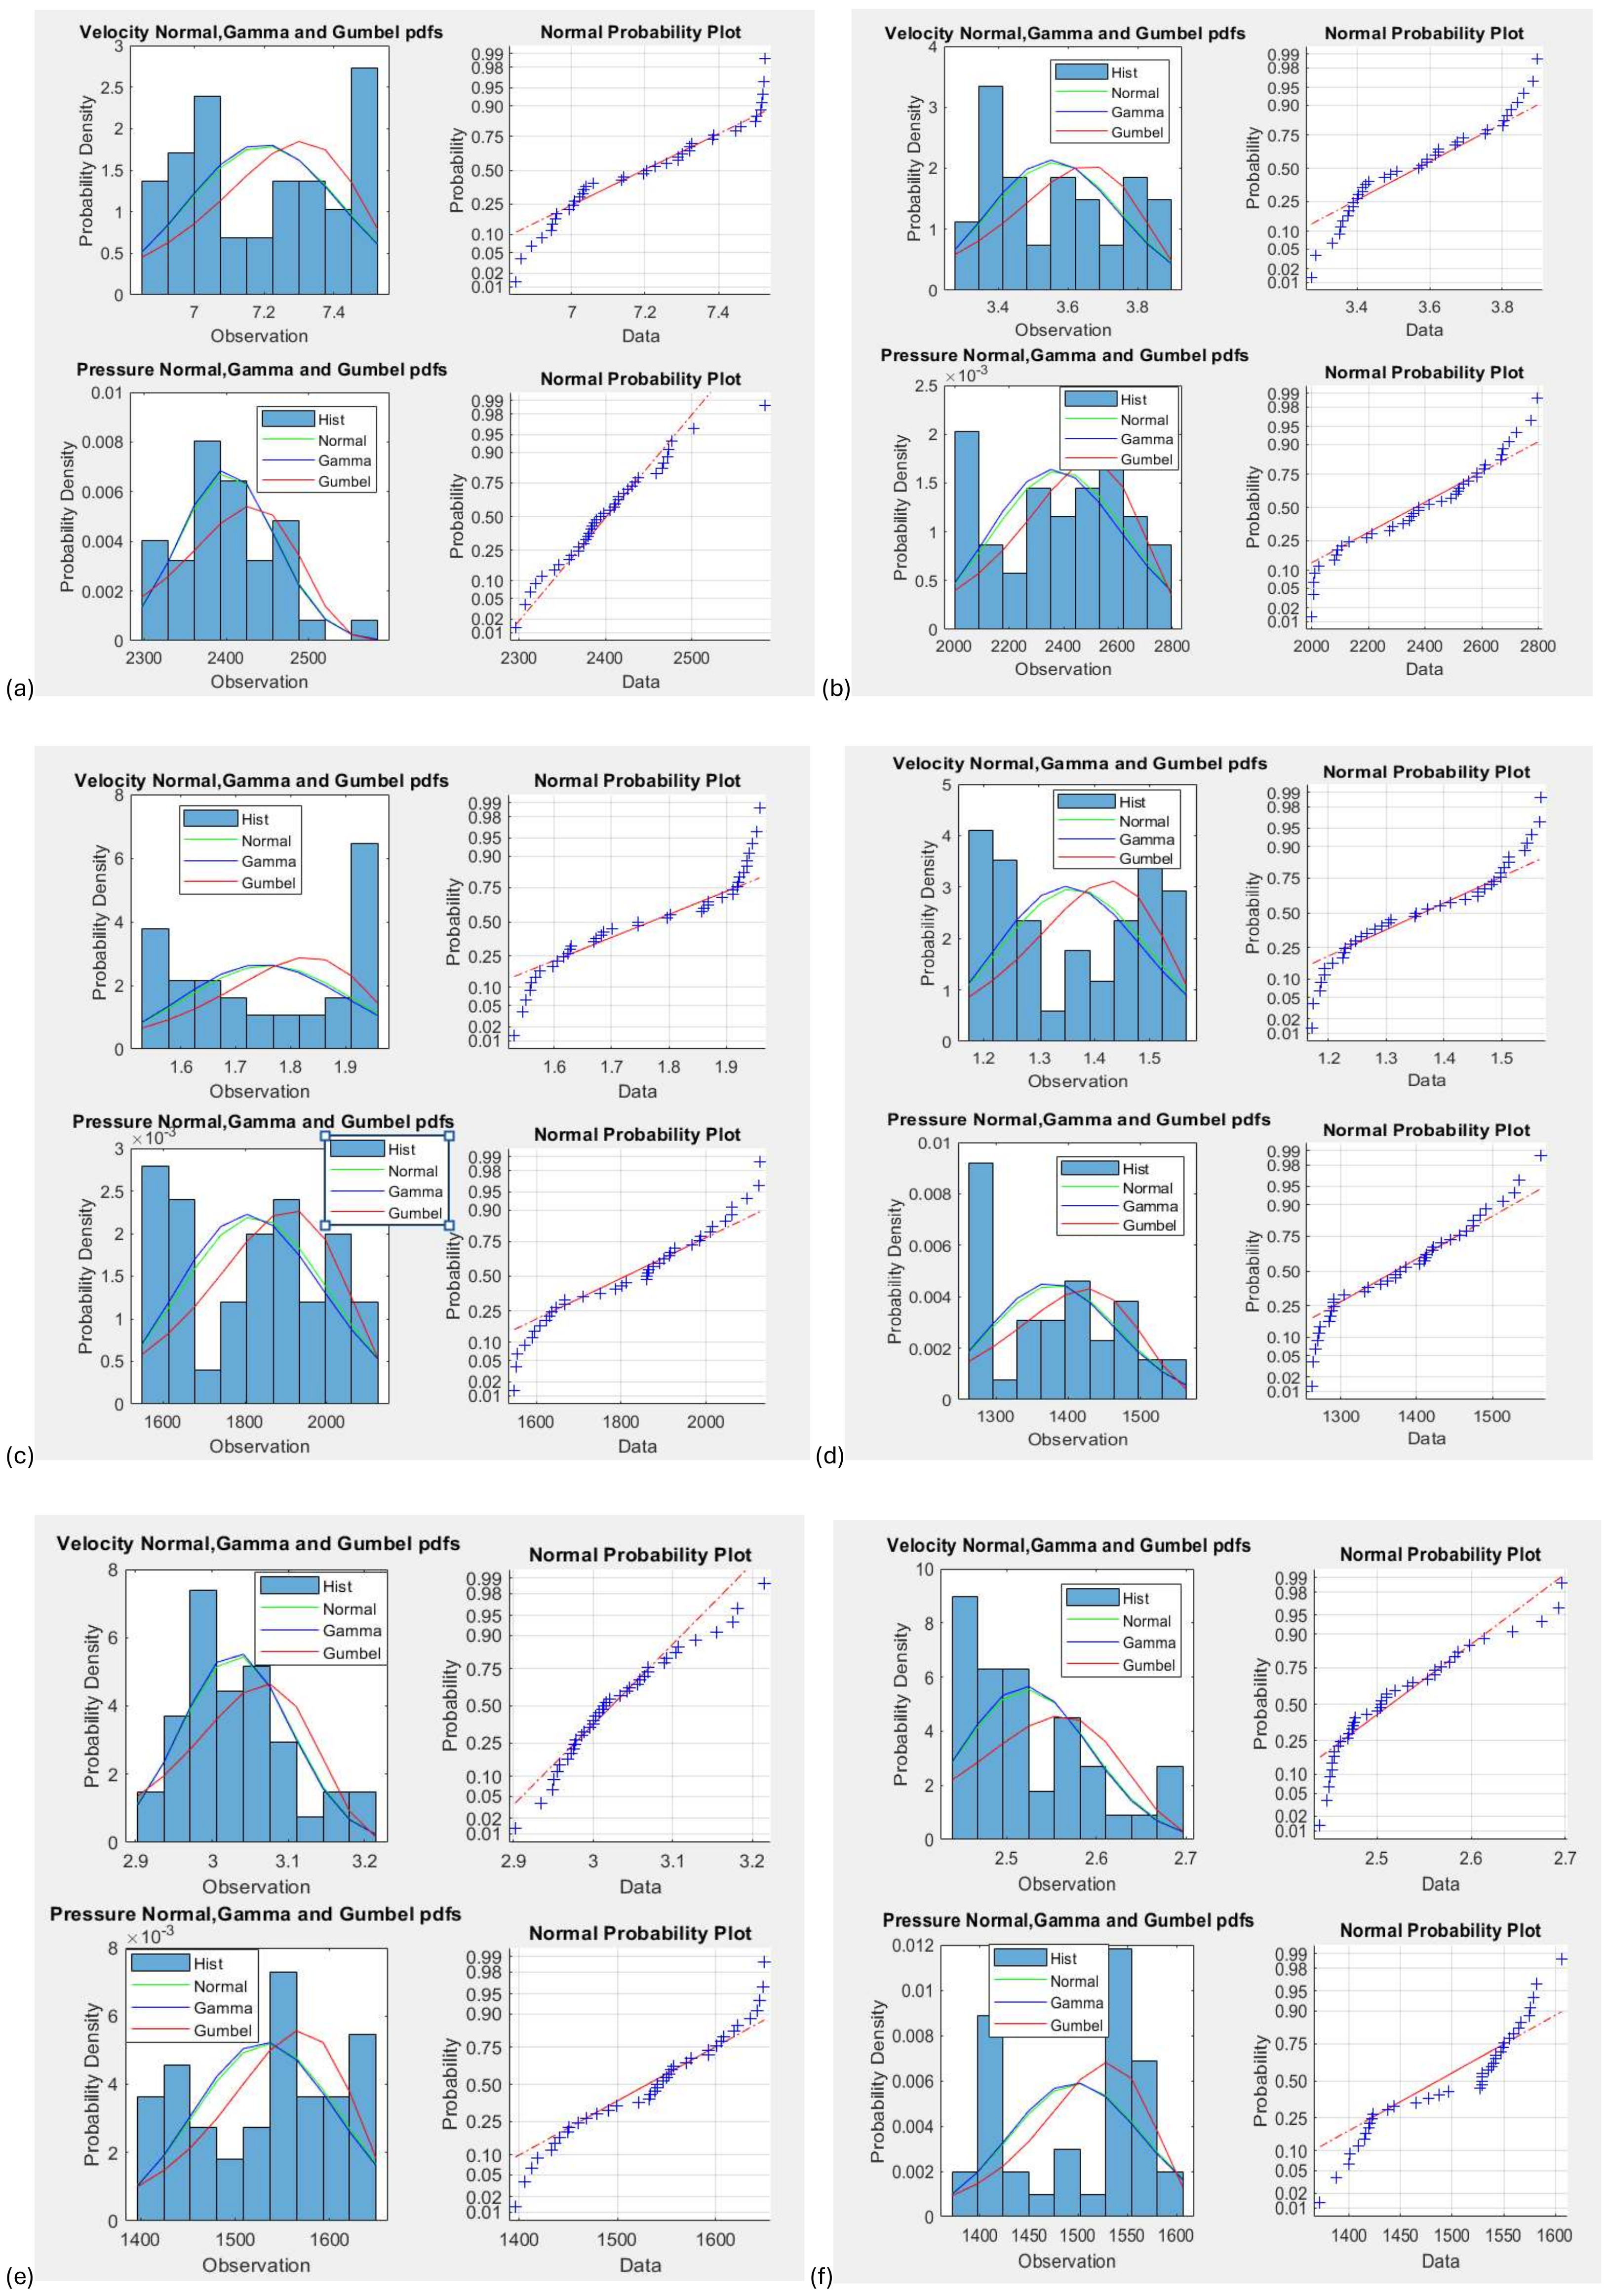
Figure 10 and Figure 11 illustrate the statistical characteristics, considering interFoam and airInterFoam. Apart from discrepancies, where small pressure values were captured (see Graphs in Figure 10a and Figure 11f), normal or Gauss distribution is appropriate. This is also in accordance with Manso et al. [12], where pressure distributions were plotted against normal and Gumbel distributions and found to be the most adequate to represent those values. Small deviations were found at extreme values.
Pressure average, minimum, maximum, and standard deviation become less pronounced at higher water depths. The pressure for the most shallow pool presents skewness. Intermediate pools present less skewness than the shallowest. The deepest pool, (Y = 0.67 m), presents negative skewness values. These results, apart from this last value, are in accordance with Manso et al. [12].
Concerning velocity, in the first group (shallow pools, Y = 0.2 m, Y / D = 2.8), average minimum and maximum velocity presents a maximum at the center, followed by a local minimum and a second maximum. In the second group (intermediate water depth, 0.3 m ≤ Y ≤ 0.5 m, 4 ≤ Y/D ≤ 8), the velocity maximum is not located at the center but at a small distance. The velocity standard deviation presents a minimum at the center for all water depths. The maximum is near the center for the shallowest pool and increases with distance for deeper water depths. Almost all water depths present increasing skewness velocity and decreasing kurtosis with the distance from the center.

5. Conclusions

A plunging jet into a pool with a different water depth was analyzed by means of numerical simulation using OpenFOAM® and three different conceptual models, defining air-water in different ways: (1) interFoam (Volume-Of-Fluid Method), (2) airInterFoam (Derived from interFoam), and (3) Euler-EulerFoam (Multiphase Flow). The description of the flow was analyzed along the jet trajectory from the nozzle outlet, at the impact on the free surface, and at the bottom and found to be best done with multiphaseEulerFoam, considering water and air. However, the model is unpractical for usual applications, requiring a significant amount of calculation as well as larger data storage. AirInterFoam can be used instead with a less fine mesh to better describe the flow.
The models including air description (multiphaseEulerFoam and airInterFoam) leads to fewer higher values at the bottom center. The use of interFoam requires the finest mesh for practical use.
The analysis of unsteadiness allows the identification of a steady period to be analyzed. Although a turbulent model was employed, some variation can be identified in the runs using different Δ t. When using RANS, turbulent kinetic energy can predict the magnitude of unsteadiness with accuracy. With the Δ t = 0.1 s rather than Δ t = 0.005 s, extreme values are lost but mean characteristics are preserved, with the advantage of not having to save a large amount of data storage.
Although the present analysis was done for just 5 s (a stable period between 5 and 10 s), a period much shorter than those reported in physical models [12], variables were analyzed statistically, and average, maximum, minimum, standard deviation, skewness, and kurtosis were calculated for velocity, pressure, viscosity, kinetic energy, and rate of dissipation. The values are in accordance with those reported in Manso et al. [12], namely pressure values. Also, Gauss law was found more appropriate to describe distribution. In addition, similar analyses were done for velocities, viscosity, kinetic energy, and a specific turbulent dissipation rate. Future work will include simulations of the jet into the plunge pool by ELSA and the influence of such simulations on the bottom pressures.

Author Contributions

Conceptualization: R.F.C.; methodology: R.F.C., P.M.L. and M.N.A.B.; software: openSource; validation: R.F.C., P.M.L. and M.N.A.B.; formal analysis: R.F.C.; investigation: R.F.C., P.M.L. and M.N.A.B.; resources: R.F.C., P.M.L. and M.N.A.B.; data curation; R.F.C.; writing—original draft preparation: R.F.C.; writing revision: M.N.A.B. All authors have read and agreed to the published version of the manuscript.

Funding

This study had the support of national funds through Fundação para a Ciência e Tecnologia, I. P (FCT), under the projects UIDB/04292/2020, UIDP/04292/2020, granted to MARE, and LA/P/0069/2020, granted to the Associate Laboratory ARNET.

Data Availability Statement

Data are contained within the article.

Conflicts of Interest

Author Md Nazmul A. Beg was employed by the company Water Michael Baker International. The remaining authors declare that the research was conducted in the absence of any commercial or financial relationships that could be construed as a potential conflict of interest.

Nomenclature

cgeneral quantity for defining transport equations (k, ω for turbulent variables in
RANS models, S S T   k ω turbulence model)
C p Non-dimensional mean dynamic pressure coefficient
C p l Fluctuating pressure coefficients
C v Mean velocity coefficient
C v l Fluctuating pressure coefficients
dDistance from the pool center
DNozzle diameter
D c Cross-diffusion term of quantity c ( D k = 0)
FVolume of Fluid Function
F r Froude number (= V 0 / ( g D ) 0.5 )
gAcceleration due to gravity
kTurbulent kinetic energy
LJet length from nozzle to water surface, jet travel distance in the air
L b Distance from nozzle to pool’ bottom
p Pressure resulting by removing the hydrostatic component to total pressure
p 0.2 Hydrostatic pressure at a 0.2 water depth bottom
p r g h Dynamic pressure at the pool bottom
QDischarge Flow
R e Reynolds number (= V 0 D / ν )
S g Source term for gaseous air at the free-surface
tTime
u c Compression velocity
u g Velocity of the gaseous air fluid
U k Velocity of the fluid k
UVelocity
V 0  Average velocity at the nozzle exit, jet initial velocity
xMain horizontal coordinate
yOther horizontal coordinate
YWater pool depth
Y c Dissipation term of quantity c
zVertical coordinate
α Volume of liquid fluid in a control volume (water)
α g Volume of gaseous air fluid in a control volume
α k Volume of fluid k in a control volume
Δ tTime step
Γ c Effective diffusivity of c (k or ω )
Γ α g Diffusivity tensor of α g
ψ c Production/generation term of quantity c
ν Kinematic viscosity
ν g Kinematic viscosity of the gaseous air fluid
ν k Kinematic viscosity of the fluid k
ν w Kinematic viscosity of the water
ω Specific dissipation rate
ρ Density (for the mixing fluid)
ρ g Density of the gaseous air fluid
ρ k Density of the fluid k
ρ w Density of the water

References

  1. Albertson, M.L.; Dai, Y.B.; Jensen, R.A.; Rouse, H. Difusion of submerged jets. Proc. Am. Soc. Civ. Eng. 1948, 74, 639–663. [Google Scholar]
  2. Bertola, N.J.; Wang, H.; Chanson, H. Air Bubble Entrainment at Vertical Plunging Jets: A Large-Scale Experimental Study; Hydraulic Model Report No.CH104/17; School of Civil Engineering, The University of Queensland: Brisbane, QLD, Australia, 2017; 256p. [Google Scholar]
  3. Bollaert, E.; Schleiss, A. Scour of rock due to the impact of plunging high velocity jets Part I: A state-of-the-art review. J. Hydraul. Res. 2003, 41, 451–464. [Google Scholar] [CrossRef]
  4. Bonetto, F.; Lahey, R. An experimental study on air carry under due to a plunging liquid jet. Int. J. Multiph. Flow 1993, 19, 281–294, Discussion: 1994, 20, 667–770. [Google Scholar] [CrossRef]
  5. Brattberg, T.; Chanson, H. Air entrapment and air bubble dispersion at two-dimensional plunging water jets. Chem. Eng. Sci. 1998, 53, 4113–4127. [Google Scholar] [CrossRef]
  6. Carrillo, J.M.; Castillo, L.G.; Marco, F.; García, J.T. Experimental and Numerical Analysis of Two-Phase Flows in Plunge Pools. J. Hydraul. Eng. 2020, 146, 04020044. [Google Scholar] [CrossRef]
  7. Castillo, L.G.; Carrillo, J.M. Experimental and numerical analysis of velocities in plunge pools of free falling spillways. In Proceedings of the E-Proceedings of the 36th IAHR World Congress, The Hague, The Netherlands, 28 June–3 July 2015. [Google Scholar]
  8. Cummings, P.D.; Chanson, H. Air entrainment in the developing flow region of plunging jets—Part 1: Theoretical development. J. Fluids Eng. 1997, 119, 597–602. [Google Scholar] [CrossRef]
  9. Cummings, P.D.; Chanson, H. Air entrainment in the developing flow region of plunging jets—Part 2: Experimental. J. Fluids Eng. 1997, 119, 603–608. [Google Scholar] [CrossRef]
  10. Ervine, D.A. Effects of Turbulence intensity on the rate of air-entrainment by plunging water jets. Proc. Inst. Civ. Eng. 1980, 69, 425–445. [Google Scholar] [CrossRef]
  11. Ervine, D.A.; Falvey, H.T. Behaviour of turbulent water jets in the atmosphere and in plunge pools. Proc. Inst. Civ. Eng. 1987, 83, 295–314. [Google Scholar] [CrossRef]
  12. Manso, P.A.; Bollaert, E.F.R.; Schleiss, A.J. Impact pressures of turbulent high-velocity jets plunging in pools with flat bottom. Exp. Fluids 2007, 42, 49–60. [Google Scholar] [CrossRef]
  13. Pinheiro, A.N.; Melo, J.F.; Ramos, C.M. Forces on Plunge Poll Slabs: Influence of Joints Location and Width. J. Hydraul. Eng. 2006, 132, 49–60. [Google Scholar]
  14. Pfister, M.; Hager, W.H. Deflector-generated jets. J. Hydraul. Res. 2009, 47, 466–475. [Google Scholar] [CrossRef]
  15. Rajaratnam, N. Turbulent Jet. In Development in Water Science; Elsevier Scientific Publishing Company: New York, NY, USA, 1976; Volume 5. [Google Scholar]
  16. Volkart, P. The mechanism of air buble entrainment in self aerated flows. Int. J. Multiph. Flow 1980, 6, 411–423. [Google Scholar] [CrossRef]
  17. Wang, H.; Slamet, N.S.; Zhang, G.; Chanson, H. Intrusive measurements of air-water flow properties in highly turbulent supported plunging jets and effects of inflow jet conditions. Chem. Eng. Sci. 2018, 177, 245–260. [Google Scholar] [CrossRef]
  18. Wood, I.R. Air entrainment in free-surface flows. In IAHR Hydraulic Structures Design Manual. 4. Hydraulic Design Considerations; Balkema Publisher: Rotterdam, The Netherlands, 1991; p. 149. [Google Scholar]
  19. Lopes, P.; Tabor, G.; Carvalho, R.F.; Leandro, J. Explicit calculation of natural aeration using a Volume-of-Fluid model. Appl. Math. Model. 2016, 40, 7504–7515. [Google Scholar] [CrossRef]
  20. Moreira, A.; Leroy, A.; Violeau, D.; Taveira-Pinto, F. Dam spillways and the SPH method: Two case studies in Portugal. J. Appl. Water Eng. Res. 2021, 7, 228–245. [Google Scholar] [CrossRef]
  21. Lopes, P.; Carvalho, R.F.; Leandro, J. Numerical and experimental study of the fundamental flow characteristics of a 3D gully box under drainage. Water Sci. Technol. 2017, 75, 2204–2215. [Google Scholar] [CrossRef] [PubMed]
  22. Lopes, P.; Leandro, J.; Carvalho, R.F. Self-Aeration Modelling Using a Sub-Grid Volume-Of-Fluid Model. Int. J. Nonlinear Sci. Numer. Simul. 2017, 18, 559–574. [Google Scholar] [CrossRef]
  23. Almelanda, S.K.; Mukhab, T.; Bensow, R.E. An improved air entrainment model for stepped spillways. Appl. Math. Model. 2021, 100, 170–191. [Google Scholar] [CrossRef]
  24. Carvalho, R.F.; Lemos, C.M.; Ramos, C.M. Numerical computation of the flow in hydraulic jump stilling basins. J. Hydraul. Res. 2008, 46, 739–752. [Google Scholar] [CrossRef]
  25. Hirt, C.W.; Nichols, B.D. Volume of Fluid (VOF) Method for the Dynamics of Free Boundaries. J. Comput. Phys. 1981, 39, 201–225. [Google Scholar] [CrossRef]
  26. Rusche, H. Computational Fluid Dynamics of Dispersed Two-Phase Flows at High Phase Fractions. Ph.D. Thesis, University of London, London, UK, 2002. [Google Scholar]
  27. Weller, H. A New Approach to VOF-Based Interface Capturing Methods for Incompressible and Compressible Flows; Report TR/HGW/04; OpenCFD Ltd.: Bracknell, UK, 2008. [Google Scholar]
  28. Anez, J.; Puggelli, S.; Hecht, N.; Andreini, A.; Reveillon, J.; Demoulin, F.X. Liquid Atomization Modeling in OpenFOAM®; Springer: Berlin/Heidelberg, Germany, 2019; pp. 297–308. [Google Scholar]
  29. McGinn, P.; Tretola, G.; Vogiatzaki, K. Three-component volume of fluid method coupling with interface compression method and Eulerian—Lagrangian spray atomization surface density model for prediction of cavitating sprays. Phys. Fluids 2024, 36, 022118. [Google Scholar] [CrossRef]
  30. Gärtner, J.W.; Kronenburg, A. A novel ELSA model for flash evaporation. Int. J. Multiph. Flow 2024, 174, 104784. [Google Scholar] [CrossRef]
  31. Celik, I.B.; Ghia, U.; Roache, P.J.; Freitas, C.J. Procedure for estimation and reporting of uncertainty due to discretization in CFD applications. J. Fluids Eng. 2008, 130, 078001. [Google Scholar]
Figure 1. Experimental installation of LCH at the EPFL (from [12]): photo and schema.
Water 16 01386 g001
Figure 2. Geometry of the installation at the LCH at the EPFL considering different water depth pool: (a) 0.2 m; (b) 0.3 m; (c) 0.4 m; (d) 0.5 m; (e) 0.6 m; (f) 0.67 m—outlet with different baffle heights, according experiments.
Water 16 01386 g002
Figure 3. Experimental installation of LCH at the EPFL domain considering one and two axes of symmetry.
Water 16 01386 g003
Figure 4. Jet from nozzle, entering the pool of 0.2 m water depth, impacting the pool bottom, and spreading in the pool ( Δ t = 0.1 s, 1 s, and 10 s) considering solvers: interFoam (if with chosen finest mesh, intermediate mesh (im), and coarse mesh (cm).
Water 16 01386 g004
Figure 5. Jet from nozzle, entering the pool of 0.2 m water depth, impacting the pool bottom and spreading in the pool ( Δ t = 0.1 s, 1 s and 10 s) considering solvers: airInterFoam (aif) and multiphaseEulerFoam (mef).
Water 16 01386 g005
Figure 6. Variation of variables along time at a point in a 0.2 m pool water depth (x = 0.025 m, y = 0; z = 0; Δ t = 0.1 s)—interFoam.
Water 16 01386 g006
Figure 7. Statistics of Variables interFoam and airinterFoam (x = 0.025 m, y = 0; z = 0; Δ t = 0.1 s).
Water 16 01386 g007
Figure 8. Pressure at the pool bottom along x axis (y = 0, z = 0).
Water 16 01386 g008
Figure 9. Non-dimensional mean dynamic pressure coefficient C p , mean velocity coefficient C v , and fluctuating pressure and velocity coefficients ( C p l and C v l ) as a function of the geometrical ratio of plunge pool depth to jet diameter Y / D (right) and along x axis (y = 0, z = 0).
Water 16 01386 g009
Figure 10. Variables characteristics along the bottom in a 0.2 m pool water depth (evaluated at the following points (af) x = 0.025; 0.05; 0.075; 0.095; 0.15 and 0.2 m; y ≃ 0; z ≃ 0; from simulations with interFoam, Δ t = 0.1 s).
Water 16 01386 g010
Figure 11. Variables characteristics along the bottom in a 0.2 m pool water depth (evaluated at the following points: (af) x = 0.025; 0.05; 0.075; 0.095; 0.15 and 0.2 m; y ≃ 0; z ≃ 0; from simulations with airInterFoam, Δ t = 0.1 s).
Water 16 01386 g011
Table 1. Test conditions and parameters.
Q = 30 L/s; V 0 = 7.4 m/s; Re = 4.6 × 10 5 ; Fr = 8.8
Y  (m) Y / D  (–) L  (m) L / L b  (–)
0.22.80.50.32–0.35
0.34.20.40.26–0.28
0.45.60.30.19–0.21
0.56.90.20.13–0.14
0.68.30.10.06–0.07
0.679.30.030.02
Table 2. Mesh sizes.
Pool Water Depth (m)Number of Cells ( x × y × z )
0.2471,419 (25 × 25 × (10 + 25));
2,206,405 (50 × 50 × (20 + 50));
4,949,074 (100 × 100 × (40 + 100))
0.34,263,456
0.44,421,496
0.54,579,536
0.64,737,576
0.674,848,204
Note: (z = z under free surface + z above free-surface).
Disclaimer/Publisher’s Note: The statements, opinions and data contained in all publications are solely those of the individual author(s) and contributor(s) and not of MDPI and/or the editor(s). MDPI and/or the editor(s) disclaim responsibility for any injury to people or property resulting from any ideas, methods, instructions or products referred to in the content.