Article

Variations in Greenhouse Gas Fluxes at the Water–Gas Interface in the Three Gorges Reservoir Caused by Hydrologic Management: Implications for Carbon Cycling

1
Hubei Key Laboratory of Intelligent Yangtze and Hydroelectric Science, China Yangtze Power Co., Ltd., Yichang 443000, China
2
Key Laboratory of Construction and Safety of Water Engineering of the Ministry of Water Resources, China Institute of Water Resources and Hydropower Research, Beijing 100038, China
3
Hubei Key Laboratory of Petroleum Geochemistry and Environment & College of Resources and Environment, Yangtze University, Wuhan 430100, China
*
Author to whom correspondence should be addressed.
Water 2024, 16(12), 1642; https://doi.org/10.3390/w16121642
Submission received: 7 May 2024 / Revised: 27 May 2024 / Accepted: 30 May 2024 / Published: 7 June 2024
(This article belongs to the Section Water and Climate Change)

Abstract

:
The Three Gorges Project is the largest hydraulic hub project in the world, and its hydrological management has altered the hydrological environment of the reservoir area, affecting the carbon emission and absorption of the reservoir water. In this study, representative hydrological stations in the Three Gorges Reservoir area were selected as research sites to monitor the CO2 and CH4 fluxes of the reservoir water and nine environmental factors during the drainage and impoundment periods in 2022. The study aimed to explore the mechanisms of hydrological management and environmental factors on greenhouse gas emissions. The results showed that the mean CO2 fluxes of the reservoir water during the drainage and impoundment periods were (103.82 ± 284.86) mmol·m−2·d−1 and (134.39 ± 62.41) mmol·m−2·d−1, respectively, while the mean CH4 fluxes were (1.013 ± 0.58) mmol·m−2·d−1 and (0.571 ± 0.70) mmol·m−2·d−1, respectively, indicating an overall “carbon source” characteristic. Through the evaluation of the characteristic importance of environmental factors, it was found that the main controlling factors of CO2 flux during the drainage period were total phosphorus (TP) and chlorophyll a (Chl_a), while total nitrogen (TN) was the main controlling factor during the impoundment period. Dissolved organic carbon (DOC) was the main controlling factor of CH4 flux during the different periods. Based on these findings, a “source-sink” mechanism of CO2 and CH4 in the Three Gorges Reservoir water under reservoir regulation was proposed. This study is of great significance for revealing the impact of reservoir construction on global ecosystem carbon cycling and providing scientific support for formulating “emission reduction and carbon sequestration” plans and achieving “dual carbon” goals.

1. Introduction

The carbon cycle is one of the most important material cycles in the Earth’s ecosystem, referring to the process of carbon migration and transformation among the Earth’s atmosphere, hydrosphere, lithosphere, pedosphere, and biosphere. It helps maintain the stability of the biosphere’s structure and functionality and is crucial for global material and energy cycles as well as climate change [1]. The concentration of CO2 in the atmosphere is one of the main factors affecting global climate warming [2]. In today’s increasingly industrialized world, human activities have disrupted the balance of CO2 exchange among various carbon reservoirs, leading to a more complex mechanism of CO2 emissions. A significant portion of carbon in inland water bodies is transported to the ocean, both in dissolved and solid forms. Additionally, a fraction of this carbon (25% to 44%) is directly emitted into the atmosphere as greenhouse gases, such as CO2 and CH4. [3]. The global inland water bodies emit approximately 2.1 PgC and 0.7 PgC of CO2 and CH4 gases to the atmosphere each year, respectively, while the global terrestrial ecosystems absorb approximately 2.6 PgC of carbon per year [4,5,6]. These two quantities are of the same order of magnitude, and their contributions to global climate change should not be ignored.
The construction of dams in rivers disrupts their continuity and alters the carbon sources and sinks in reservoirs. The construction of dams and subsequent reservoir impoundment has brought about a series of changes that have modified the temporal and spatial patterns of carbon exchange in the reservoir, giving rise to a distinct carbon cycling pattern within the reservoir. For example, dam impoundment increases the residence time of water, providing favorable conditions for the generation of endogenous carbon-containing substances and the degradation of organic matter [7]. The release of CO2 from reservoir surfaces accounts for approximately 4% of all anthropogenic sources [8], and the annual emission of greenhouse gases from reservoirs to the atmosphere continues to increase [9,10]. With the accelerated pace of hydropower development, river dam construction technology is rapidly expanding worldwide. Currently, the total surface area of global dam reservoirs in rivers is approximately 1.5 × 10⁶ km2, which is comparable to the surface area of natural lakes. There are over 70,000 large dams, and the total volume of reservoirs is seven times that of natural rivers [11]. Water reservoirs are important facilities for storing and regulating water sources, and they are closely linked to the water distribution network (WDN) system. In the distribution network, the water network partitioning method is often used to improve the pressure performance of the WDN, with the aim of reducing water resource loss [12]. In the management and regulation process of large-scale water reservoirs, partitioned management is also required, so that the regulation of water reservoirs can reduce carbon emissions without affecting the domestic water use of residents, which is essential.
As the world’s largest hydraulic project, the Three Gorges Dam has attracted extensive attention from researchers in recent years regarding the carbon cycling process in its ecosystem. Some scholars believe that the Three Gorges Reservoir area will submerge a large number of plants growing in the fluctuation zone, which will decompose and produce a significant amount of greenhouse gases [13]. Other scholars argue that the Three Gorges Reservoir has unique characteristics in terms of deep-water river channels, and the pre-flooding reservoir-clearing work results in relatively low greenhouse gas emissions [14]. Additionally, the hydrodynamic conditions after impoundment enhance the growth of algae, contributing to carbon sequestration [15]. Previous studies on greenhouse gases in reservoirs have often focused on specific periods or individual factors, leaving significant gaps in understanding the mechanisms of greenhouse gas emissions in relation to hydrological management and environmental factors. This study takes the Three Gorges Reservoir area as an example and conducts on-site measurements and sample collection at ten hydrological stations within the reservoir area. By analyzing the spatiotemporal differences in greenhouse gas flux, the differences in the physicochemical properties of the water, and the effects of reservoir regulation, the study aims to identify the key processes and mechanisms influencing carbon sources and sinks. The goal is to provide a basis for accurately evaluating greenhouse gas emissions from the reservoir, develop emission reduction and carbon sequestration strategies, and contribute to the achievement of the “dual carbon” targets.

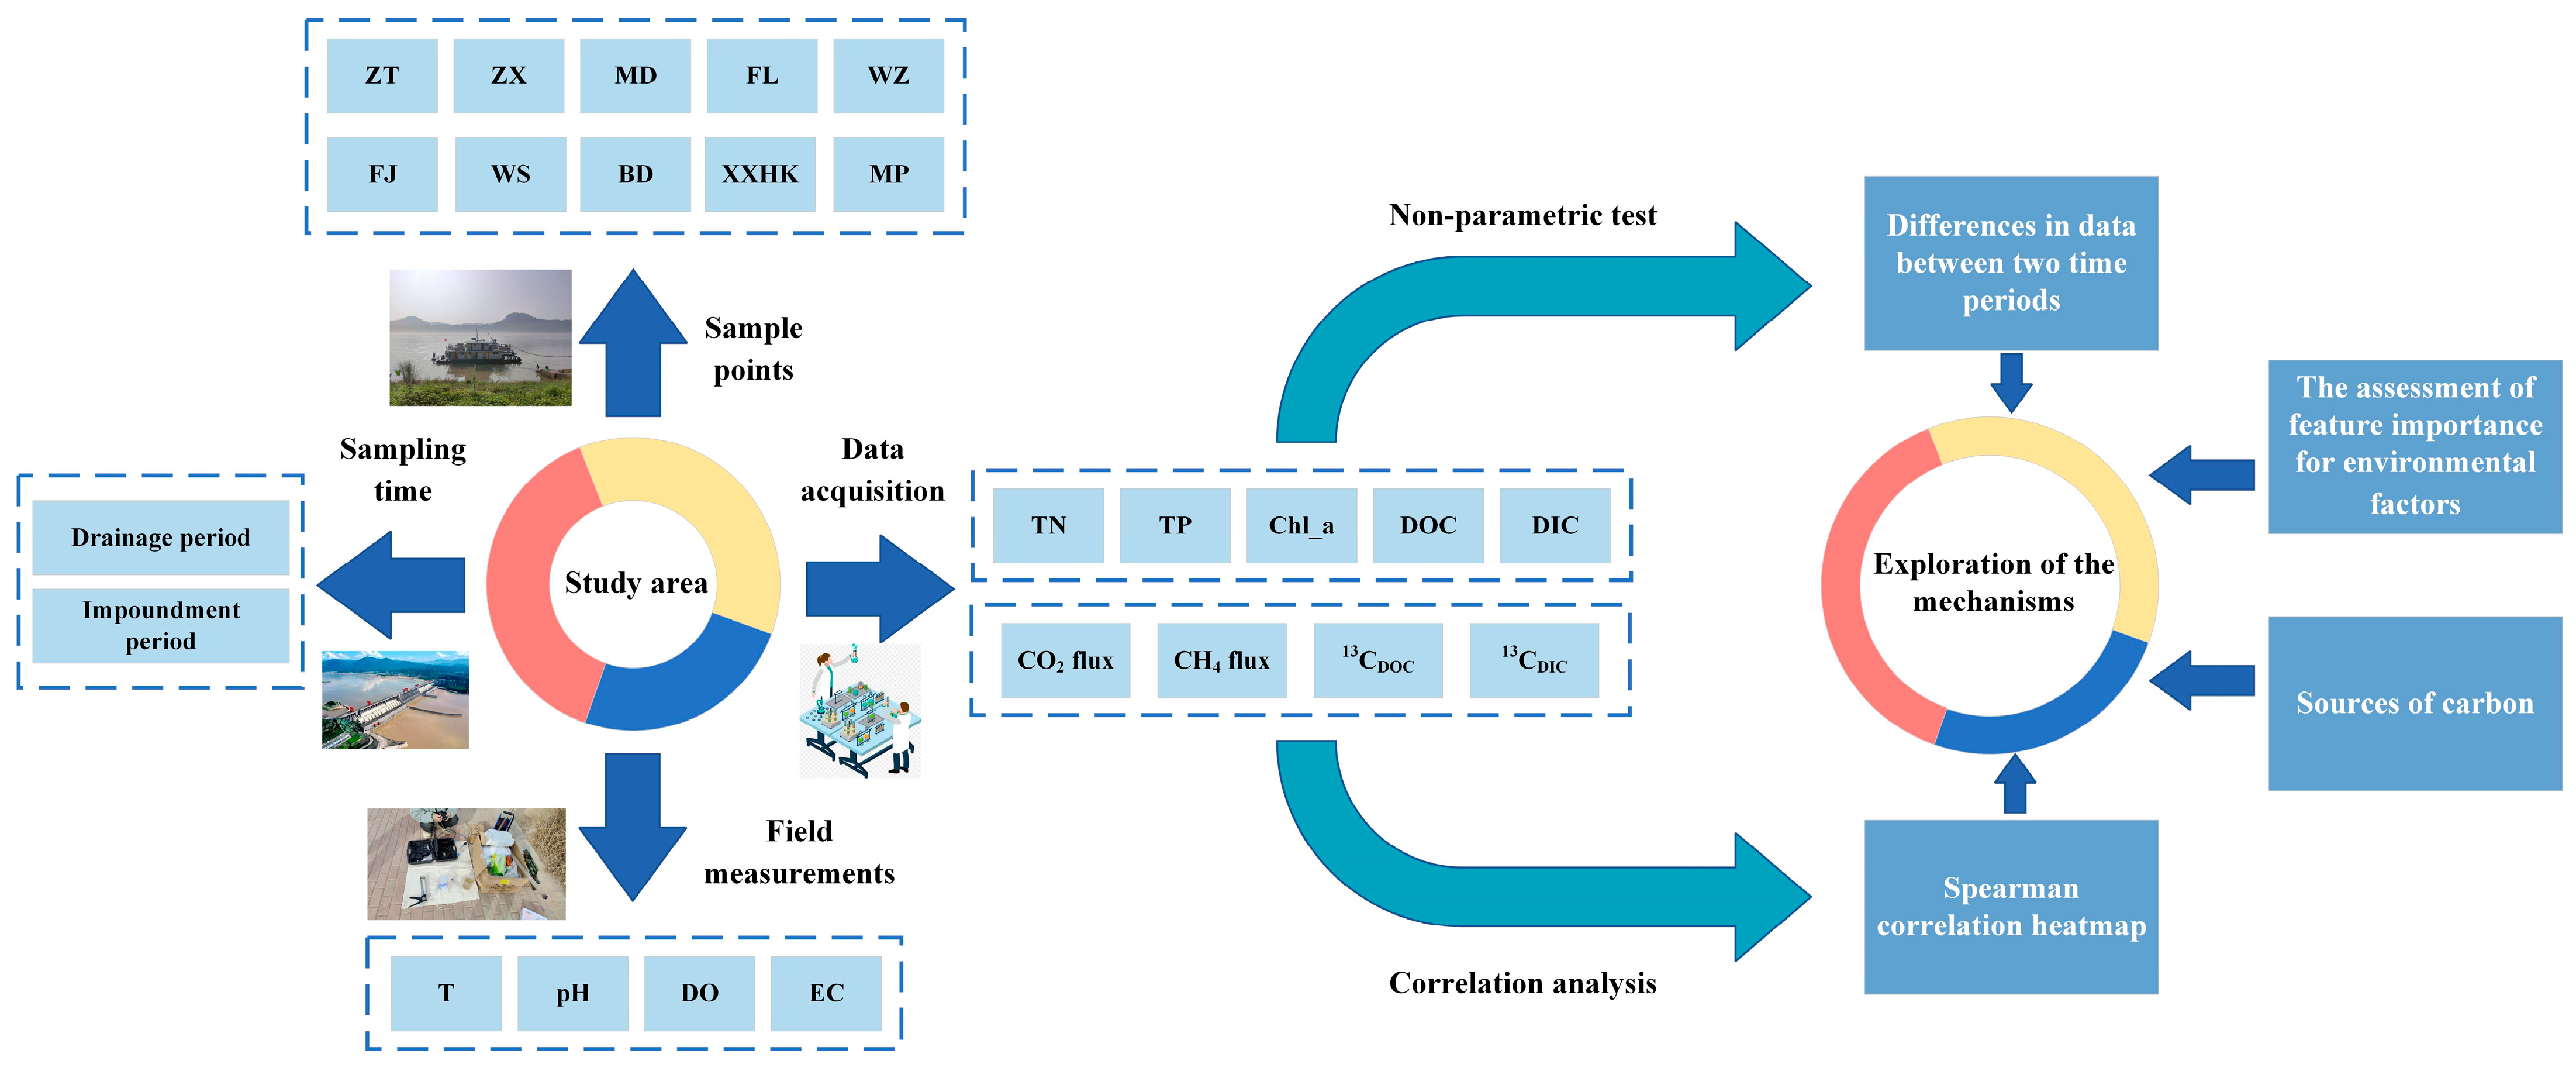
2. Materials and Methods
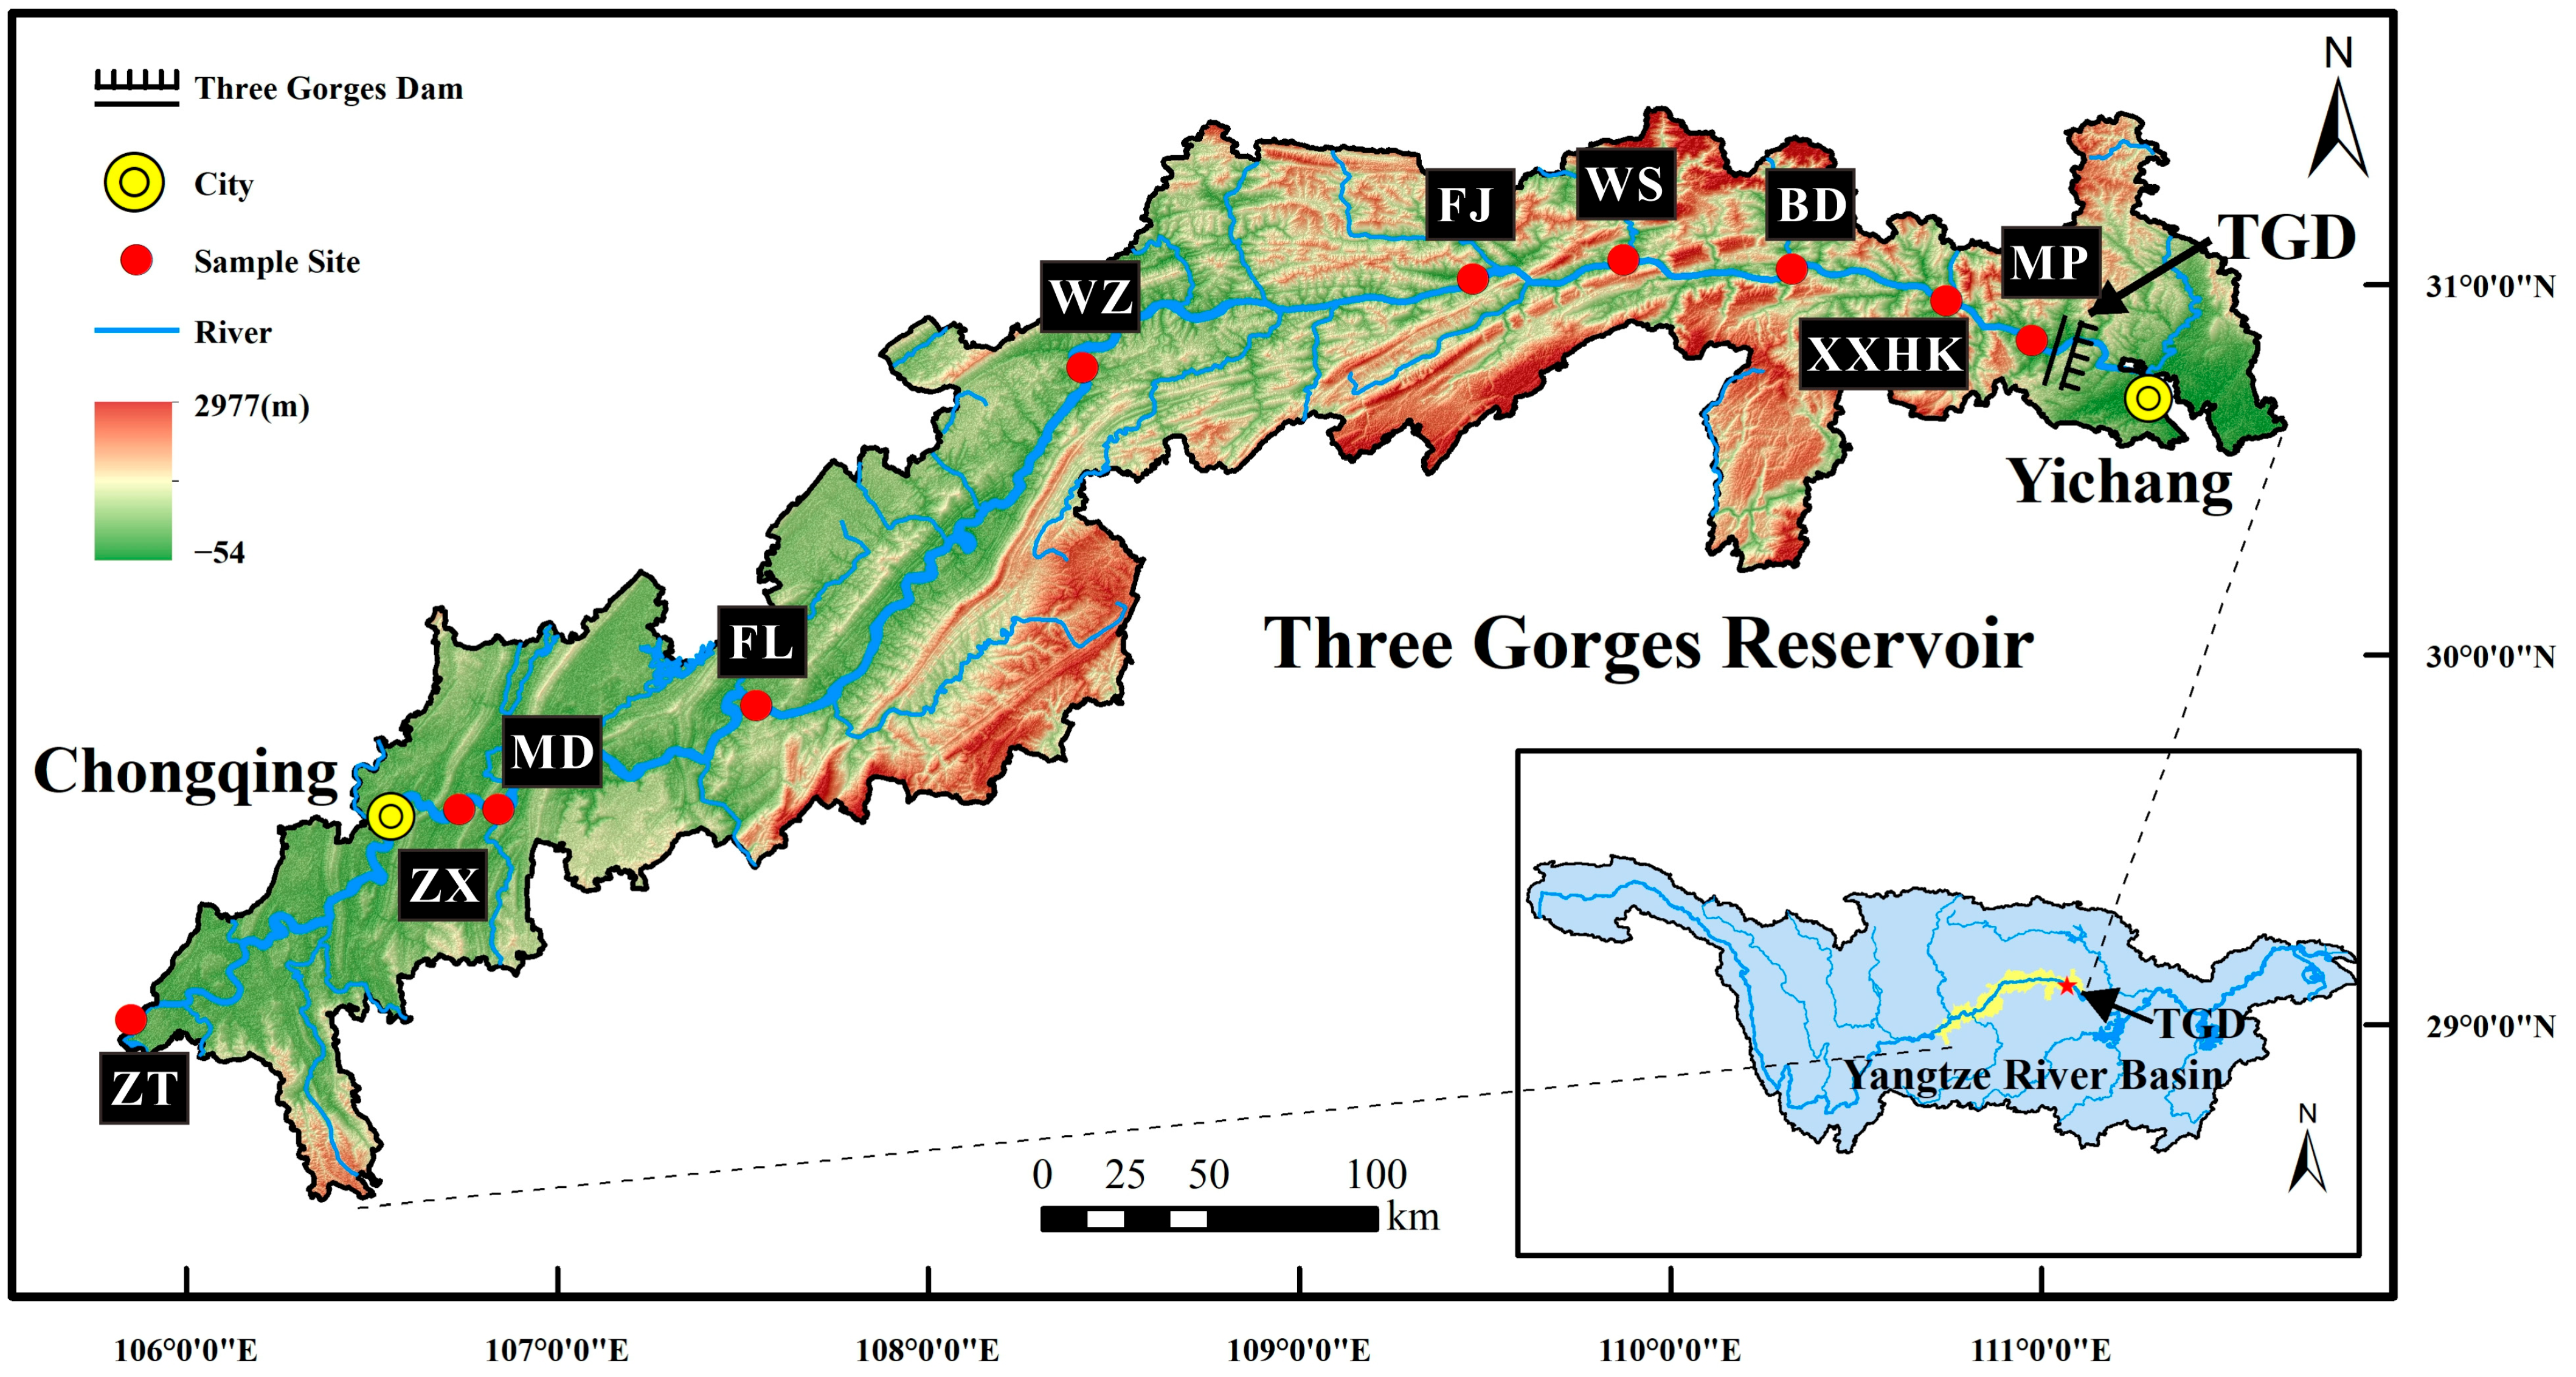
2.1. Study Area

The Three Gorges Dam is located at the lower end of the upstream Yangtze River (106°14′~111°28′ E, 28°56′~31°44′ N). It is a typical river-valley-type reservoir with steep slopes on both sides of the river channel [16]. The reservoir has a water surface area of 1080 km2 and a storage capacity of up to 39.9 × 10⁶ m3 [17]. The Three Gorges Reservoir area covers 20 districts and counties, with a total area of 54,200 km2. In the reservoir area, agriculture is primarily focused on crop cultivation and livestock farming [18]. The upstream and middle reaches of the Three Gorges Reservoir area are mainly composed of sandstone and mudstone, while the downstream area is dominated by carbonate rocks and clastic rocks [19]. Of the area in the reservoir, 96% is mountainous, while 4% is plains. The main land use types are croplands and forests, accounting for 36.57% and 46.88%, respectively [20]. The operation and management of the dam follow the “storage and controlled discharge” strategy, which involves storing water in winter and discharging it in summer, resulting in a fluctuation zone with water levels fluctuating between 145 m and 175 m [21]. The reservoir region has a subtropical monsoon climate, with an average annual temperature of 17 °C and an average annual precipitation of 1250 mm [22].

2.2. Sample Collection and Field Measurements

Ten representative hydrological stations were selected within the Three Gorges Reservoir area, starting from Chongqing and extending to the Three Gorges Dam. These stations include Zhutuo (ZT), Zhongxian Shibaozhai (ZX), Mudong (MD), Fuling (FL), Wanzhou (WZ), Fengjie (FJ), Wushan (WS), Badong (BD), Xiangxi River Estuary (XXHK), and Maoping (MP). These locations cover the overall range of water storage in the Three Gorges Reservoir area. In the Three Gorges Reservoir area, the low water level corresponds to the drainage period in July, while the high water level corresponds to the storage period in December. Water samples were collected at the selected hydrological stations in July and December of 2022. Sampling started from the upstream and proceeded along the direction of the Yangtze River. Sampling was conducted on the banks adjacent to the hydrological stations. Each sampling event lasted approximately one week. The sampling sites are shown in Figure 1, The information for the Sampling sites is as shown in Table 1.
At each sampling point, on-site measurements and sample collection of the water body were performed. The samples were collected at a depth of 30–50 cm below the water surface, and the water samples obtained were measured onsite for water quality parameters such as temperature (T), pH, dissolved oxygen (DO), and electrical conductivity (EC) using a Thermo Scientific Orion Star A320 series (Waltham, MA, USA) portable electrochemical meter. Surface water samples were collected using 5 L plastic buckets. On the same evening, the samples were filtered using a filtration pump. Different pretreatment methods were applied based on the specific parameters of interest. Total nitrogen (TN) samples were acidified to pH < 2 using H2SO4 (Zhongtian Chemical Co., Ltd, Wuhan, China). Total phosphorus (TP) samples were acidified to pH < 2 using HNO3 (Zhongtian Chemical Co., Ltd, Wuhan, China). The water samples were filtered using pre-burned Whatman GF/F glass fiber membranes (0.7 μm) (Limin Industrial Co., Ltd, Shanghai, China) that were pre-soaked in 5% dilute HNO3 overnight. The filtrate was stored in pre-burned glass bottles at 450 °C, and saturated HgCl2 solution was added before sealing. The samples were stored at low temperatures for determination of dissolved organic carbon (DOC). The water samples were filtered using acetate fiber membranes (0.45 μm) (Limin Industrial Co., Ltd, Shanghai, China) in needle filters that were pre-soaked in 5% dilute HNO3 overnight. The filtrate was stored in special bottles, and saturated HgCl2 solution was added before storage at low temperatures for determination of dissolved inorganic carbon (DIC). After filtering the water sample with GF/C filters, the filters were stored in a freezer at −20 °C for determination of chlorophyll-a (Chl_a). The data on CO2 and CH4 gas flux in this study were obtained from the testing results of the “Hubei Key Laboratory of Intelligent Yangtze and Hydroelectric Science, China Yangtze Power Co., Ltd., Yichang, China”.

2.3. Analytical Methods

In the laboratory, the total nitrogen (TN) content in the water samples was determined using the alkaline potassium persulfate oxidation–ultraviolet spectrophotometric method. Total phosphorus (TP) was determined using the potassium persulfate oxidation–spectrophotometric method. Chlorophyll-a (Chl_a) was determined using the acetone extraction–spectrophotometric method. The concentrations of dissolved organic carbon (DOC) and dissolved inorganic carbon (DIC) in the water samples, as well as their corresponding isotopes, were analyzed at the Third Institute of Oceanography, Ministry of Natural Resources. The DOC content was determined using the iso TOC CUBE total organic carbon analyzer, which measures the corresponding peak area and calculates the DOC concentration of the sample. The DIC content was measured by preparing standard solutions of NaHCO3 and Na2CO3 in a 1:1 mass ratio at different concentrations. The instrument measured the peak area and concentration, and a standard curve was plotted to calculate the DIC content of the sample. Stable carbon isotopes are represented by the symbol “δ” and indicate the parts per thousand deviations of the isotope ratio in the sample relative to the isotope ratio of a standard sample:
δ 13 C = R sample / R standard 1 × 1000
where R is 13C/12C and δ13C corresponds to international standard Pee Dee belemnite (PDB).

2.4. Data Analysis

Non-parametric tests were employed to determine the significant differences in environmental factors and greenhouse gas fluxes between the two periods. A Spearman correlation analysis was conducted to examine the relationships between the influencing factors and greenhouse gas fluxes in the Three Gorges Reservoir area during the drainage and storage periods. Heatmaps illustrating the correlation between greenhouse gas fluxes and environmental factors were generated.
The contribution of each environmental factor to CO2 and CH4 fluxes, known as a feature importance assessment, was calculated using the random forest algorithm. This assessment involved computing the contribution value of each feature in every decision tree within the random forest. The Python 3.9 programming software was utilized, with the software framework based on the TensorFlow framework using the Keras deep learning tool. The RandomForestClassifier algorithm from the sklearn library was employed for the sensitivity analysis of relevant indicators and CO2 and CH4 fluxes, enabling the determination of the importance percentage of each indicator. By analyzing the data results, the mechanisms underlying the greenhouse gas emissions in the Three Gorges Reservoir could be explored. Figure 2 shows the flowchart of the study.

3. Results

3.1. Physiochemical Variations in the Surface Waters of the TGR

The physicochemical properties of the water in the Three Gorges Reservoir area are presented in Table 2. The pH values during the different periods ranged from 8.21 to 8.67 and 7.59 to 7.8, respectively. The pH was significantly higher during the drainage period compared to the water impoundment period (p < 0.05). This difference is attributed to changes in the hydrodynamic environment caused by water management practices, and the values at different sampling points exhibited relatively small fluctuations (Figure 3a). The water temperature (T) in the reservoir area ranged from 23.75 °C to 25.35 °C during the drainage period and from 15.08 °C to 16.69 °C during the water impoundment period. The water temperature was significantly higher during the drainage period compared to the water impoundment period (p < 0.05), and the differences in T among different sampling points were relatively small (Figure 3b). The electrical conductivity (EC) of the water varied from 304.5 to 381 μs/cm during different periods and from 314.25 to 400.4 μs/cm during the water impoundment period. The EC was higher during the water impoundment period compared to the drainage period, and the seasonal differences were significant (p < 0.05). The fluctuations in EC at different sampling points were relatively small (Figure 3c). The dissolved oxygen (DO) levels ranged from 5.78 to 8.38 mg/L during different periods and from 8.42 to 9.78 mg/L during the water impoundment period. The DO levels were significantly higher during the water impoundment period compared to the drainage period (p < 0.05), and the fluctuations in DO at different sampling points were relatively small (Figure 3d).
The total nitrogen (TN) concentration in the water of the Three Gorges Reservoir area during the drainage period ranged from 1.58 to 2.49 mg/L, while during the water impoundment period, it ranged from 1.26 to 1.56 mg/L. The TN concentrations exhibit slightly greater fluctuations during the drainage period compared to the water impoundment period. This can be attributed to the decrease in water level during the drainage period, which results in less hydraulic connectivity among different spatial locations and leads to certain differences in water sources [23]. The total phosphorus (TP) concentrations during the two periods ranged from 0.06 to 3.17 mg/L and 0.05 to 0.07 mg/L, respectively. TN and TP exhibited significant differences between the two periods (p < 0.05). These differences are attributed to various factors, such as soil properties, human activities, and variations in hydraulic conditions of the water body during different periods (Figure 3e,f).
During the drainage period and water impoundment period, the concentration range of dissolved organic carbon (DOC) in the water was 4.59–9.02 mg/L and 1.63–2.94 mg/L, respectively. The mean values were (6.29 ± 1.54) mg/L and (2.16 ± 0.28) mg/L, respectively. The DOC concentration during the drainage period was slightly higher than the global average of 5.75 mg/L for rivers [24]. This difference is likely attributed to various factors such as human activities, plant decomposition, and hydrological processes. The DOC concentration was significantly higher during the drainage period compared to the water impoundment period (p < 0.05). The concentration range of dissolved inorganic carbon (DIC) during different periods was 2.77–6.76 mg/L and 12.04–27.88 mg/L, with mean values of (4.96 ± 1.35) mg/L and (23.54 ± 5.39) mg/L, respectively. The DIC concentration was significantly higher during the water impoundment period compared to the drainage period (p < 0.05).
The chlorophyll-a (Chl_a) concentration during different periods ranged from 1.53 to 69.41 μg/L and 0.25 to 1.07 μg/L, with mean values of (14.13 ± 22.17) μg/L and (0.60 ± 0.24) μg/L, respectively. The Chl_a concentration was significantly higher during the drainage period compared to the water impoundment period (p < 0.05). This difference is related to the geographical location and climatic conditions of the Three Gorges Reservoir. During the drainage period, there were significant spatial variations in Chl_a concentration, with higher values downstream of the reservoir, which to some extent affects the greenhouse gas emissions in the reservoir area. In contrast, the Chl_a content during the water impoundment period was very low with small fluctuations (Figure 3i).

3.2. Carbon Isotope Characteristics

The δ13C is commonly used to analyze the source of carbon in water bodies. Studies have shown that the carbon isotope composition in the main stream of the Yangtze River does not exhibit significant seasonal variations [25]. Therefore, carbon isotope testing in this study was only conducted on water samples during the drainage period. The test results are shown in Table 3. The range of δ13CDOC in the sampled points within the reservoir area was −32.61‰ to −30.11‰, with an average value of −31.35‰. The range of δ13CDIC in the water samples from the reservoir area was −7.96‰ to −4.89‰, with an average value of −6.72‰. There was not a significant difference between the δ13CDOC and δ13CDIC values in the sampled points. The analysis of δ13C is crucial for further determining the sources of carbon in the water bodies within the reservoir area.

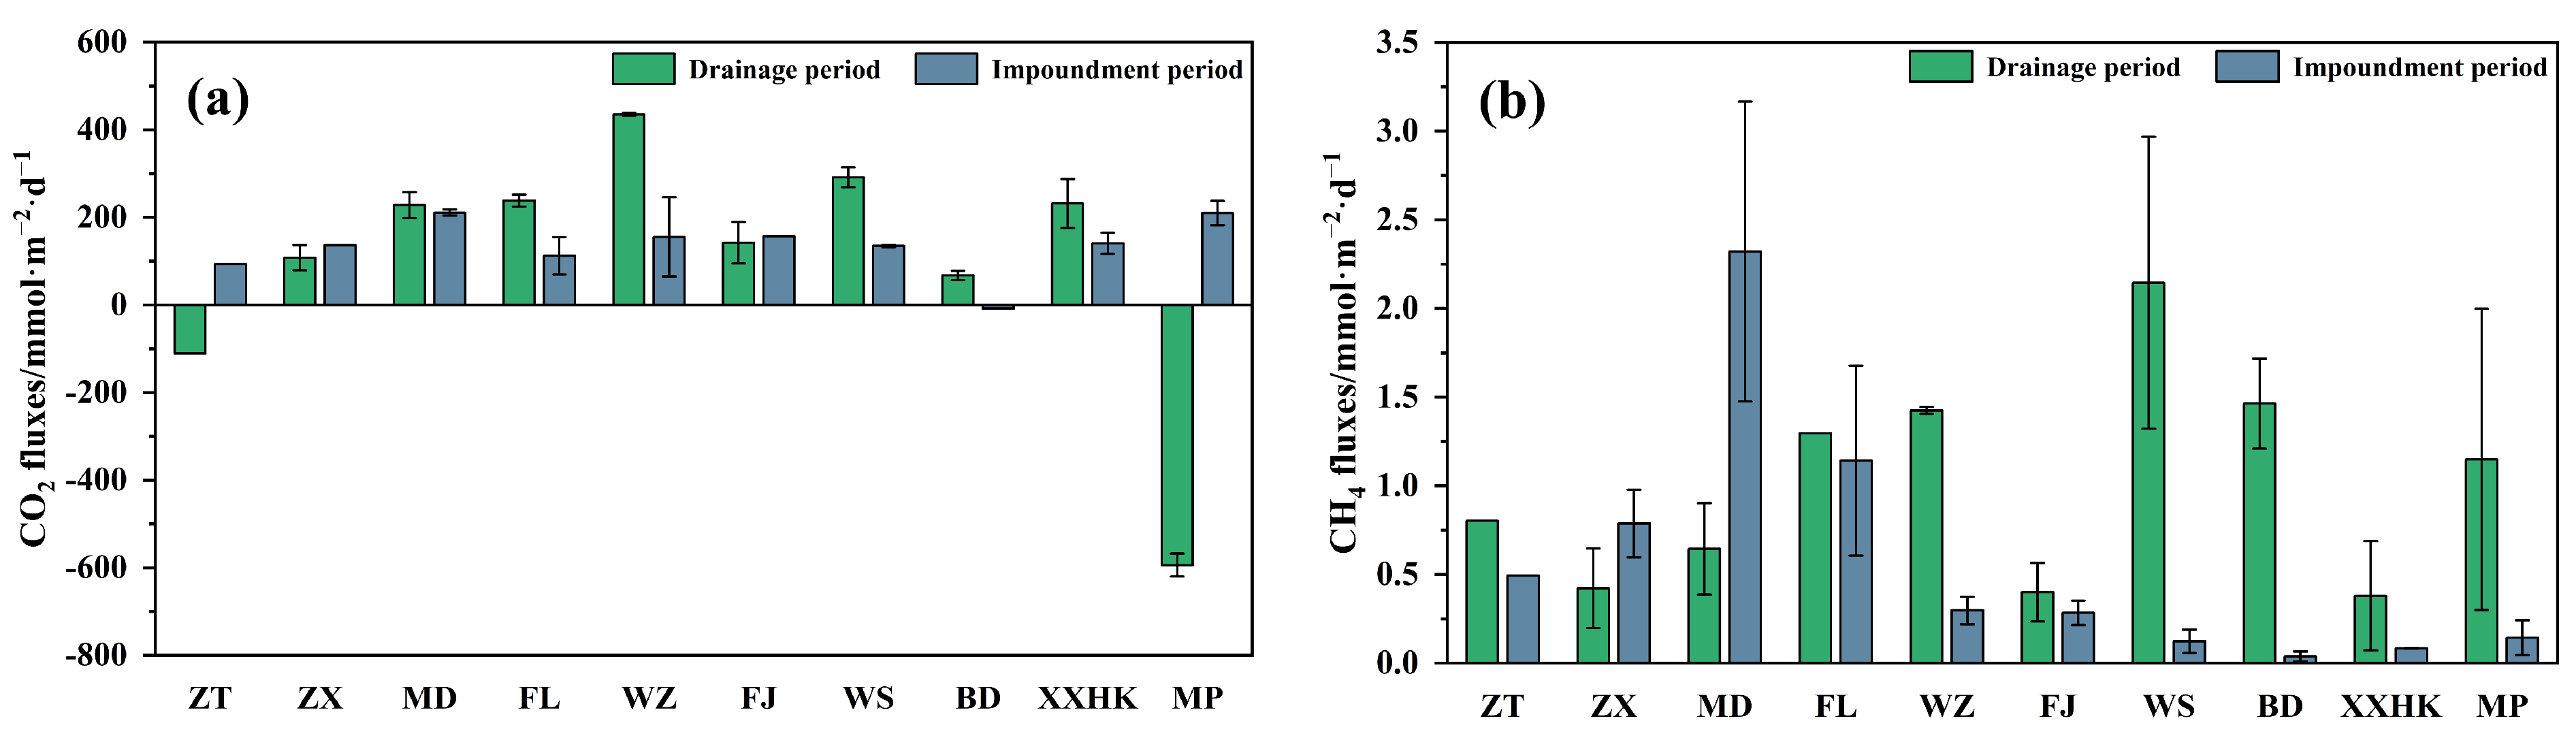
3.3. Spatiotemporal Variation of Greenhouse Gas Fluxes

The average CO2 fluxes during the two periods were 103.82 ± 284.86 mmol·m−2·d−1 and 134.39 ± 62.41 mmol·m−2·d−1, respectively. From Figure 4a, it can be observed that the CO2 flux exhibited a “source” characteristic during the drainage period. The CO2 flux was significantly higher at the “WZ” and “WS” points, while it was negative (indicating CO2 uptake) at the “ZT” and “MP” points, indicating a CO2 “sink”. During the impoundment period, the CO2 flux at the “MP” within the reservoir exhibited relatively small variations and remained stable as a CO2 “source”. However, compared to the drainage period, the CO2 flux significantly decreased, and at the BD point, it showed a CO2 “sink” characteristic. There was no significant difference in CO2 flux between the different periods (p > 0.05).
The average CH4 fluxes during the drainage period and the impoundment period were 1.013 ± 0.58 mmol·m−2·d−1 and 0.571 ± 0.70 mmol·m−2·d−1, respectively. Figure 4b shows that the CH4 flux exhibited a “source” characteristic during both the drainage and impoundment periods, with higher CH4 fluxes at the “ZX” and “MD” sampling points during the impoundment period compared to the drainage period. Overall, there was a significant seasonal difference in CH4 flux, with significantly higher fluxes during the drainage period than the impoundment period (p < 0.05).

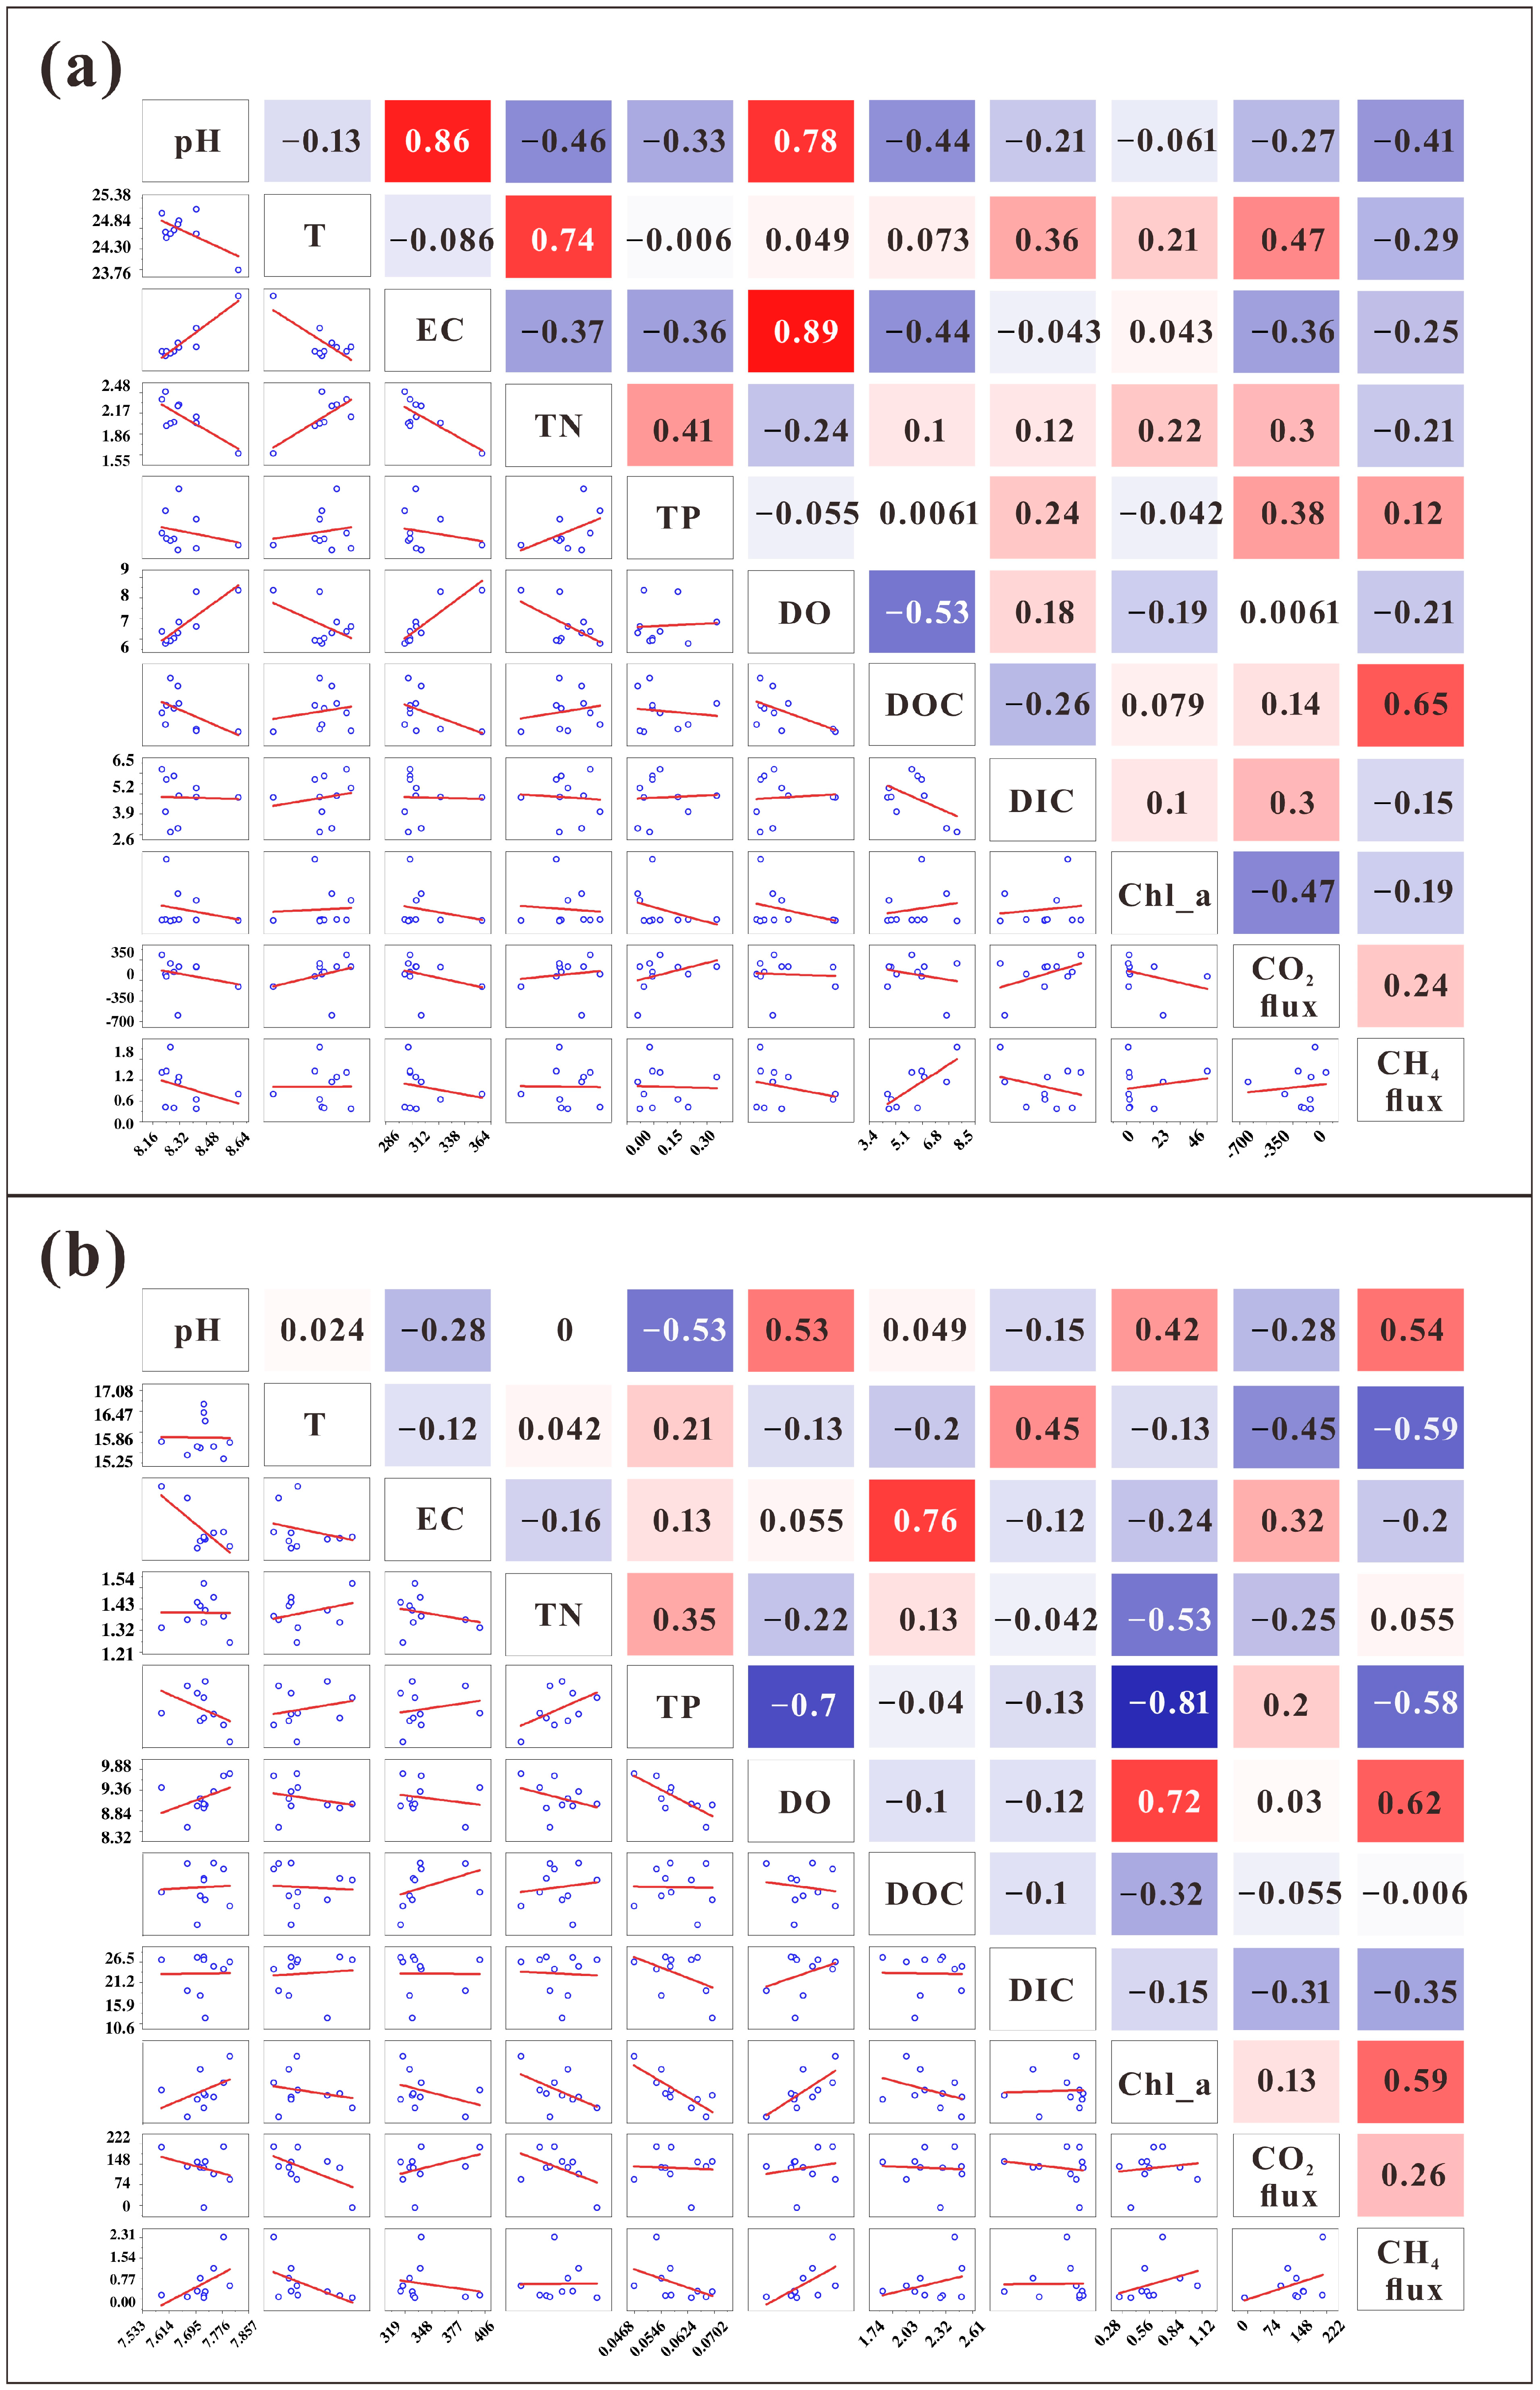
3.4. Correlation of Environmental Factors

3.4.1. Hydrochemical Factors

The correlation heatmap between the greenhouse gas flux and environmental factors is shown in Figure 5. During the drainage period, there was a positive correlation between the water temperature (T) and CO2 in the water, while during the impoundment period, they exhibited a negative correlation. On one hand, the high temperature during the drainage period can increase microbial activity in the water, leading to an increase in CO2 emissions [26,27]; on the other hand, during the impoundment period, the decrease in water temperature and the stabilization of the water body result in reduced nutrient input at the bottom of the water, leading to a decrease in the abundance of phytoplankton. As a result, the dominance of respiratory decomposition processes in the water persists [28]. Although the CO2 flux during the impoundment period is weaker than that during the drainage period, it still exhibits a CO2 “source” characteristic. In both periods, there was a negative correlation between T and CH4 flux, with higher CH4 flux during the drainage period compared to the impoundment period. This finding differs from previous studies. High temperatures can promote CH4 production [24,29], and lower water levels and stronger hydraulic conditions during the drainage period are more conducive to CH4 oxidation [30,31]. The reason for the discrepancy in this study is primarily that the high temperature during the drainage period promotes CH4 production but is offset by increased water flow and oxygen availability, while the low temperature during the impoundment period inhibits methane production but is offset by higher water levels and lower dissolved oxygen. The relatively small variations in CH4 flux between different periods in this study indicate that hydrological management in the reservoir plays a significant role in greenhouse gas emissions.
pH can affect the CO2 concentration in the water by altering the equilibrium (CO2 + H2O ⥫⥬ H2CO3 ⥫⥬ H+ + HCO3 ⥫⥬ 2H+ + CO32−) [32]. As pH increases, the water can absorb more CO2. Therefore, pH is negatively correlated with CO2 flux in different periods. During the drainage period, pH is negatively correlated with CH4 flux, whereas the opposite relationship is observed during the impoundment period. Methanogenic archaea thrive at pH levels ranging from 6.5 to 7.8, and they are typical anaerobic microorganisms [33]. In this study, the pH of the water during the drainage period was relatively higher than the optimal pH range for methanogenic archaea, which could reduce CH4 flux to some extent. However, during the impoundment period, the pH of the water was suitable for the growth of methanogenic archaea, which could facilitate CH4 production to a certain extent.
The relationship between dissolved oxygen (DO) and CO2 in water is primarily influenced by the combined effects of photosynthesis and respiration. On one hand, photosynthesis by plants can convert inorganic carbon in the water into organic carbon, thereby reducing CO2 concentration and flux. On the other hand, respiration in the water consumes dissolved oxygen. In theory, these processes should exhibit an inverse relationship [34]. However, in this study, the correlation between DO and CO2 flux was weak. The relationship between DO and CH4 flux varied in different periods. In theory, DO in water is unfavorable for the survival of methanogenic archaea. However, during the impoundment period, there was a positive correlation between DO and CH4 flux. This may be attributed to the limitation of the collected samples in this study, which were surface water samples and may not fully reflect the DO conditions in the deeper parts of the water body. Additionally, the correlation between electrical conductivity (EC) in water and greenhouse gas flux was relatively weak in this study.

3.4.2. Nutrient Factors

During the drainage period, total nitrogen (TN) and total phosphorus (TP) showed an overall positive correlation with greenhouse gas flux. On one hand, TN and TP can provide favorable conditions for the growth of phytoplankton in the water, which can then utilize photosynthesis to absorb greenhouse gases. On the other hand, when phytoplankton die, they provide a carbon source for microbial decomposition, leading to the release of more greenhouse gases. TN and TP also provide favorable conditions for microbial proliferation in the water, enhancing greenhouse gas emissions. In the assessment of lake impacts, nutrient ratios in the water, specifically the TN/TP ratio, can indicate nutrient limitation for algal growth. A TN/TP ratio above 20:1 indicates phosphorus limitation, while a ratio below 13:1 indicates nitrogen limitation [35]. In this study, during the drainage period, the growth of phytoplankton was to some extent limited by nitrogen availability.
During the impoundment period, TN showed a weak correlation with CO2 and CH4 flux, while TP exhibited a positive correlation with CO2 flux and a negative correlation with CH4 flux. During the impoundment period, the TN/TP ratio in the water was greater than 20:1, indicating that the growth of phytoplankton was to some extent limited by phosphorus availability. The weak correlation between TN and TP with greenhouse gas fluxes during this period can be attributed to environmental factors such as temperature (T) and dissolved oxygen (DO), which suppress microbial activity and subsequently affect greenhouse gas emissions. Additionally, the differences in TN/TP ratio between different periods are influenced by the release processes of nitrogen and phosphorus in the water. Specifically, during the drainage period, phosphorus is more easily released from sediments, while during the impoundment period, nitrogen is more likely to be obtained from water and soil runoff in the reservoir area. The specific processes are detailed in Section 4.2 of the study.

3.4.3. Carbon Source Factors

There is no significant correlation between dissolved organic carbon (DOC) content and the emission of CO2 gas in the reservoir water. Although carbon sources play a role in greenhouse gas emissions from the perspective of element conversion and material conservation, there are many factors that collectively influence the conversion of carbon sources into CO2 gas. Dissolved inorganic carbon (DIC) in the water, which directly exchanges with CO2 gas in the atmosphere, shows opposite correlations in different periods. The reason for this can be attributed to the high temperature during the drainage period. On one hand, the carbonate equilibrium reaction in the water tends to shift towards the production of CO2 gas. On the other hand, higher temperatures decrease the solubility of gases in the water. Additionally, the lower water level during the drainage period leads to a significant positive correlation between inorganic carbon and CO2 gas flux. In contrast, during the impoundment period with lower temperatures and higher water levels, a certain negative correlation is observed.
During the drainage period, there is a significant positive correlation between DOC and methane (CH4) flux, while the correlation is weaker during the impoundment period. The production of CH4 gas is closely related to anaerobic methane-producing bacteria. The high temperature during the drainage period enhances the utilization of DOC by methane-producing bacteria, leading to the production of CH4 gas [36]. However, the production of CH4 is largely influenced by reservoir hydrological management, resulting in relatively small fluctuations in CH4 flux in different periods. There is no direct connection between DIC and methane-producing bacteria, and there is no significant correlation between DIC in the water and CH4 gas flux.

3.4.4. Chlorophyll-a

During the drainage period, Chl_a (chlorophyll-a) and CO2 flux exhibit a negative correlation, while during the impoundment period, they show a positive correlation. In the downstream water of the reservoir during the drainage period, the Chl_a content is much higher than in the upstream and midstream areas. This results in higher primary productivity in this region compared to the respiratory activities of organisms and microbes. This is an important reason why the downstream “MP” in the reservoir acts as a CO2 sink and contributes to the negative correlation between Chl_a and CO2 flux. During the impoundment period, dam construction and water regulation lead to the homogenization of water areas [36], resulting in a relatively uniform spatial distribution of Chl_a during this period. However, the lower temperatures and nutrient limitations during the impoundment period may affect the photosynthetic activity of the water, leading to a negative correlation between Chl_a and CO2 flux during the impoundment period.
Chl_a and CH4 flux are negatively correlated during the drainage period. The higher Chl_a levels in the downstream area of the reservoir during this period indicate higher photosynthetic activity, resulting in increased dissolved oxygen in the water. This, to some extent, inhibits the activity of methane-producing bacteria and reduces CH4 production. However, during the impoundment period, Chl_a and CH4 flux show a positive correlation, which contradicts expectations. Previous studies suggest that after the death of phytoplankton, they become a carbon source in the water, providing favorable conditions for methane-producing bacteria [37]. Additionally, the rise in water levels during reservoir impoundment submerges a large amount of vegetation in the littoral zone, providing conditions for the proliferation of anaerobic methane-producing bacteria. These factors contribute to the observed positive correlation between Chl_a and CH4 flux during the impoundment period.

4. Discussion

4.1. Sources of Carbon in the Waters of the Three Gorges Reservoir Area

The range of δ13CDOC values for different source end-members is summarized in Table 4. The δ13CDOC range in the reservoir water was between −32.61‰ to −30.11‰, which is comparable to the δ13C range of phytoplankton (−42‰ to −24‰) and C3 plant-synthesized organic carbon (−38‰ to −23‰). Thus, it is suggested that a significant portion of the organic carbon in the reservoir water originates from phytoplankton and terrestrial C3 plants, indicating the influence of agricultural activities in the Three Gorges Reservoir area on organic carbon in the water. Previous studies have also shown that terrestrial C3 plants are a major source of organic carbon in water. For example, in Canada’s Lake Mackenzie, the primary supply of DOC comes from terrestrial C3 plants, while contributions from aquatic plants account for only about 15%. Similarly, in thermal karst lakes, the main source of DOC is also terrestrial plants [38].
Dissolved inorganic carbon in water bodies primarily originates from the following sources: CO2 in soil (including the decomposition of soil organic matter and silicate rocks), carbonate rock minerals, and atmospheric input through precipitation [39]. In the Yangtze River Basin, soil CO2 is derived from the oxidation of organic matter and undergoes diffusion, with a range of δ13C values from −30.2‰ to −19.8‰ [40,41,42]. After soil CO2 dissolves in water, the range of δ13CDIC should be −21.8‰ to −10.8‰, with an average value of −17‰ [43,44]. The dissolution of carbonate rocks can be categorized into sulfate-driven carbonate dissolution and carbonic acid-driven carbonate dissolution. For sulfate-driven carbonate dissolution, the δ13CDIC is solely derived from the carbonate itself. In carbonic acid-driven carbonate dissolution, two distinct DIC components with different isotopic compositions are produced in equal amounts. One component originates from soil CO2, and the other component originates from the mineral itself. Marine carbonate rock minerals exhibit a δ13C enrichment range of approximately −3.33‰ to 2.44‰, with a mean value of around 0‰ [45,46]. The contribution of DIC from atmospheric precipitation is relatively low and is typically neglected. The contribution of DIC sources in water bodies can be calculated based on the principle of mass balance:
δ 13 C car × R c + δ 13 C C 0 2 × R s = δ 13 C DIC  
R c + R s = 1
where δ13Ccar, δ13CCO2, and δ13CDIC represent the δ13C values of carbonate rock dissolution, soil CO2, and the DIC in the reservoir water, respectively. Rc and Rs represent the proportions of DIC derived from carbonate minerals and soil, respectively. The average value of δ13CDIC in the water body is −6.72‰. By simultaneously solving Equations (1) and (2), the proportions of DIC derived from carbonate rock minerals and soil CO2 can be obtained as 60.47% and 39.53%, respectively.
Table 4. The δ13C distribution of the different end-members.
Organic Carbon End-Memberδ13C (V-PDB, ‰)ReferenceInorganic Carbon End-Memberδ13C (V-PDB, ‰)Reference
Soil−26~−23[47]Soil CO2−21.8~−10.8[43,44]
River Plankton−42~−24[48,49,50]Carbonate rock−3.33~2.4[45,46]
Sewage−28.5~−23[51,52,53]Atmosphere−8~−6[40]
Vascular Plant−30~−16[47,54]
C3 Plants−38~−23[46]
C4 Plants−17~−9[55]

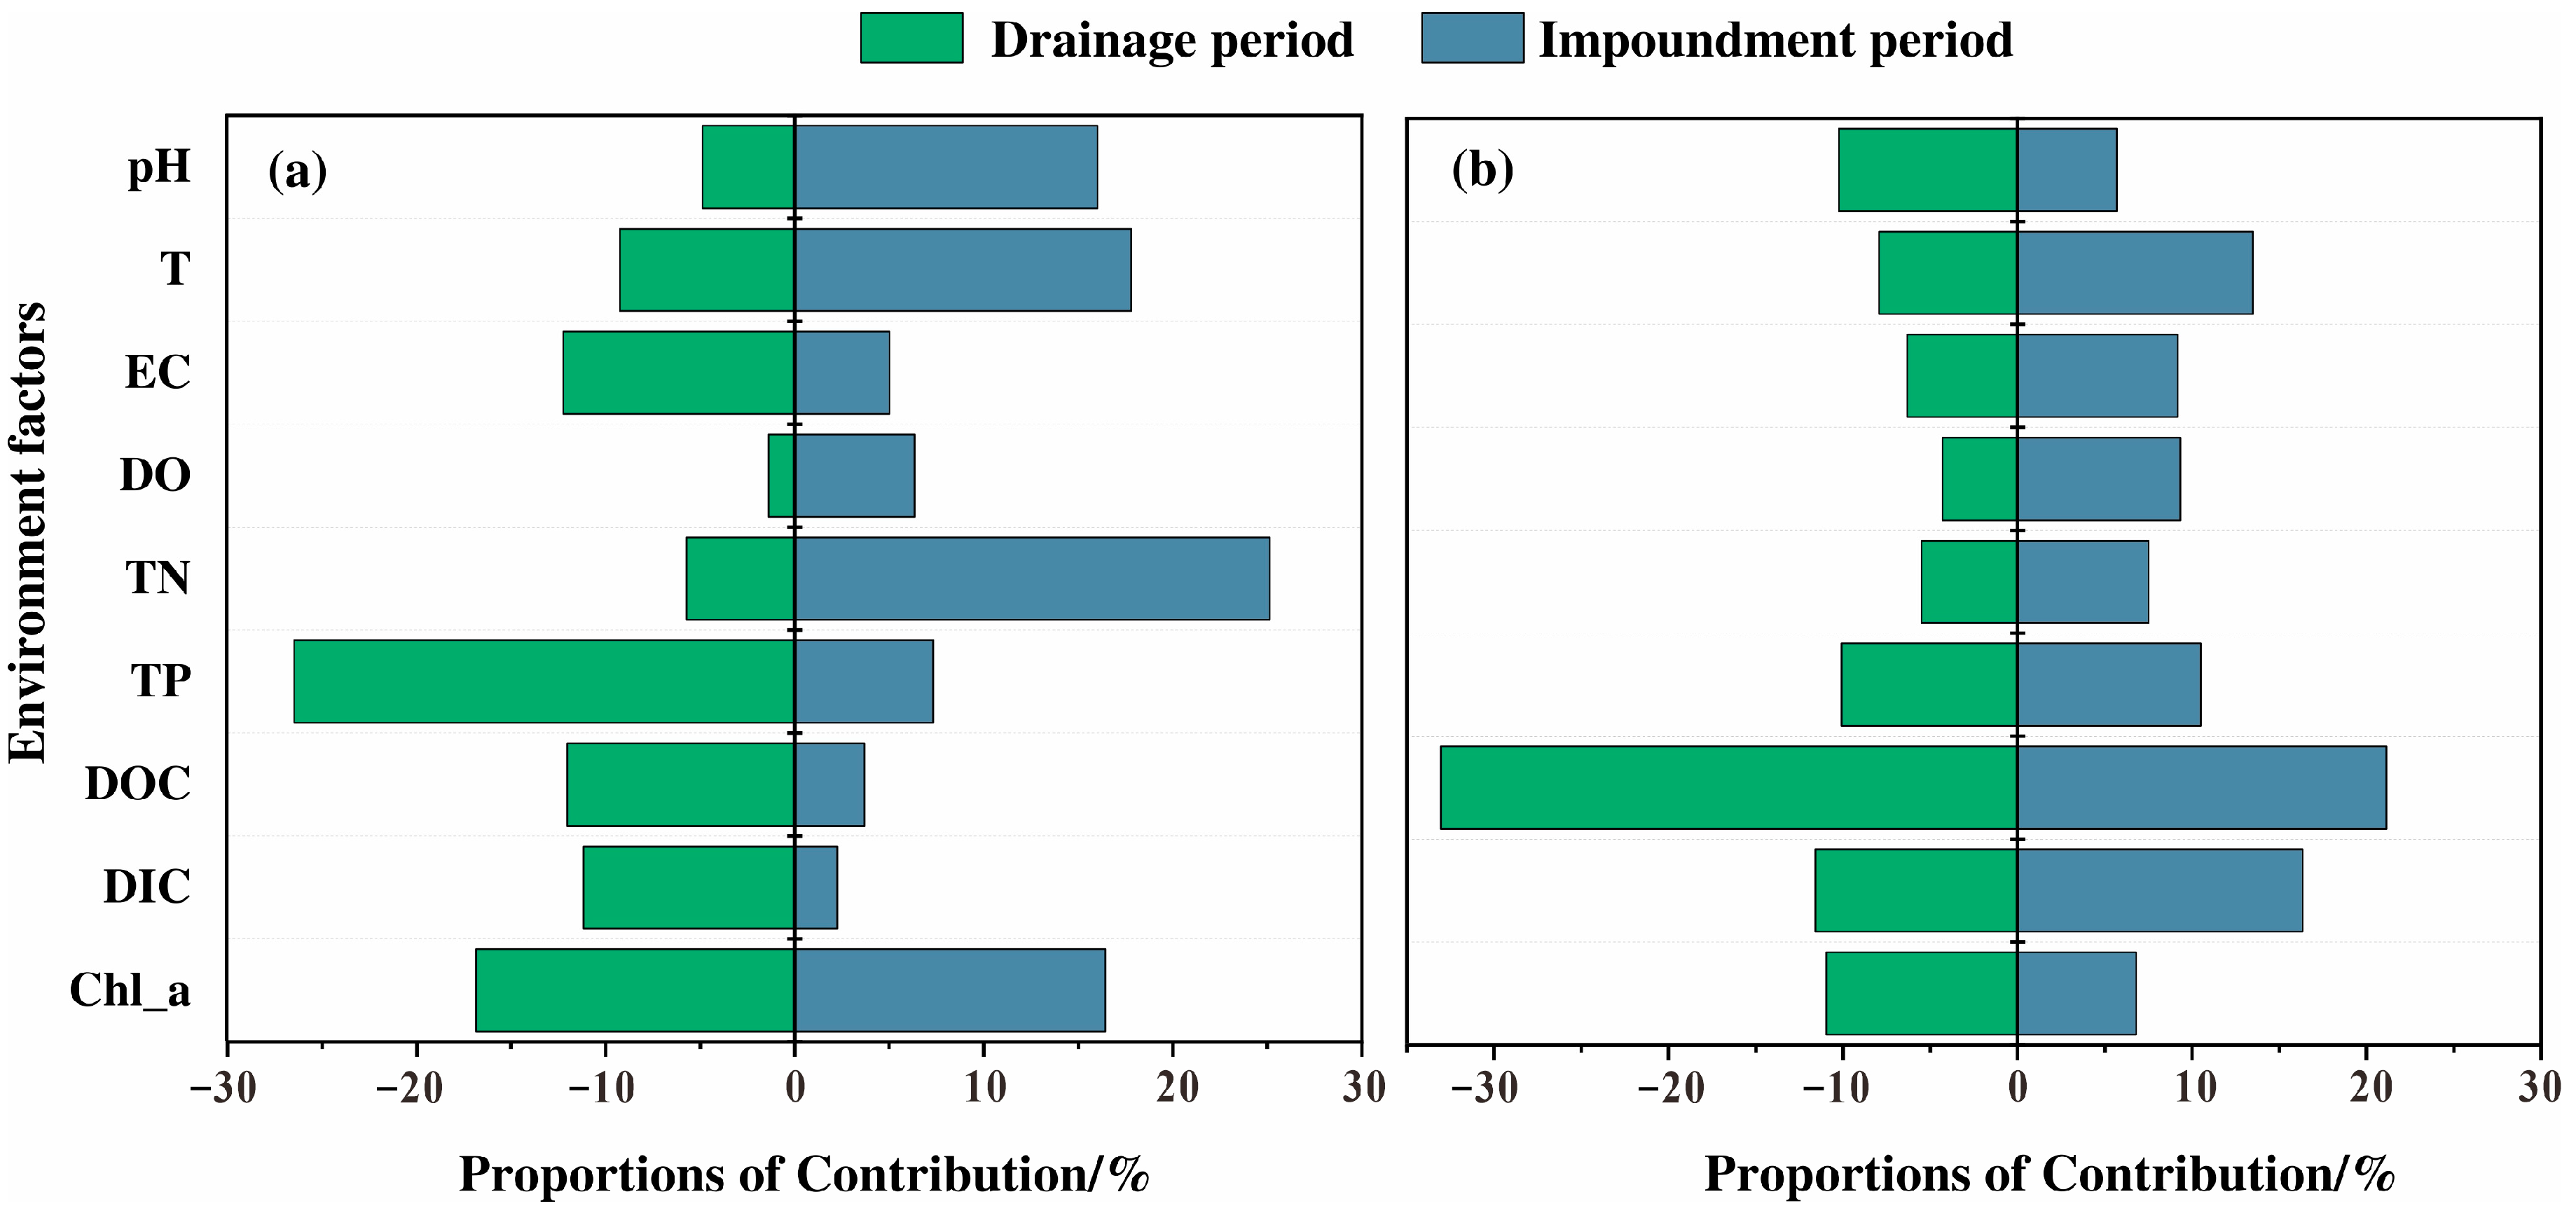
4.2. The Assessment of Feature Importance for Environmental Factors

This study utilized the random forest algorithm to calculate the contribution of various influencing factors to CO2 and CH4 fluxes in the Three Gorges Reservoir. Specifically, the feature importance assessment was conducted [56]. By inputting the different influencing factors as independent variables and CO2 and CH4 fluxes as the dependent variables into the random forest algorithm, the contribution rates of each influencing factor to greenhouse gas fluxes during different periods were obtained (Figure 6). During the drainage period, the main controlling factors for CO2 flux were TP and Chl_a with contribution rates of 26.47% and 16.86%, respectively. In the impoundment period, TN was the main controlling factor for CO2 flux with a contribution rate of 25.14%. T, Chl_a, and pH had contribution rates of around 16%. The higher pH, temperature, and growth of algae and other phytoplankton during the drainage period can cause the release of a large amount of phosphorus from sediments [57]. In the impoundment period, high water levels can result in significant nitrogen loss from the reservoir soil into the water [58], leading to an increase in the N/P ratio in the water. Both nitrogen and phosphorus are essential elements for microbial cytoplasm synthesis, gene transcription, and protein synthesis in the water. The changes in the N/P ratio due to the increase in different nutrients in the reservoir promote the proliferation of different types of microorganisms, leading to the decomposition of carbon sources in the water. For example, researchers have conducted experiments on nitrogen–phosphorus imbalance in sludge, and the results showed that under P limitation, the growth of Proteobacteria in the sludge increased to some extent [59]. Another study found that abundant filamentous bacteria proliferated in wastewater when nitrogen was deficient and phosphorus was sufficient [60]. Therefore, the main controlling factors for CO2 flux vary during different periods in the reservoir.
The main controlling factor for CH4 flux during both the drainage period and the impoundment period is DOC, with contribution rates of 33.06% and 21.16%, respectively. The primary source of CH4 in the water is the anaerobic decomposition of organic carbon by methane-producing bacteria. DOC, as a direct carbon source for microorganisms, is a key factor in controlling CH4 production. It is worth noting that in both periods, DIC has the second-highest contribution to CH4 flux, with a contribution rate of 16.33% during the impoundment period. Theoretically, DIC has a relatively small impact on CH4 production in the water. However, its higher contribution rate is likely related to the process of me-thane production. The process of CH4 production in the water involves a complex microbial food chain, in which certain microbial groups decompose organic carbon into intermediate products for methane-producing bacteria to further break down, leading to the release of a large amount of inorganic carbon into the water environment. Therefore, the process of CH4 production is often accompanied by the generation of a significant amount of inorganic carbon, resulting in the relatively high contribution of DIC to CH4 flux.

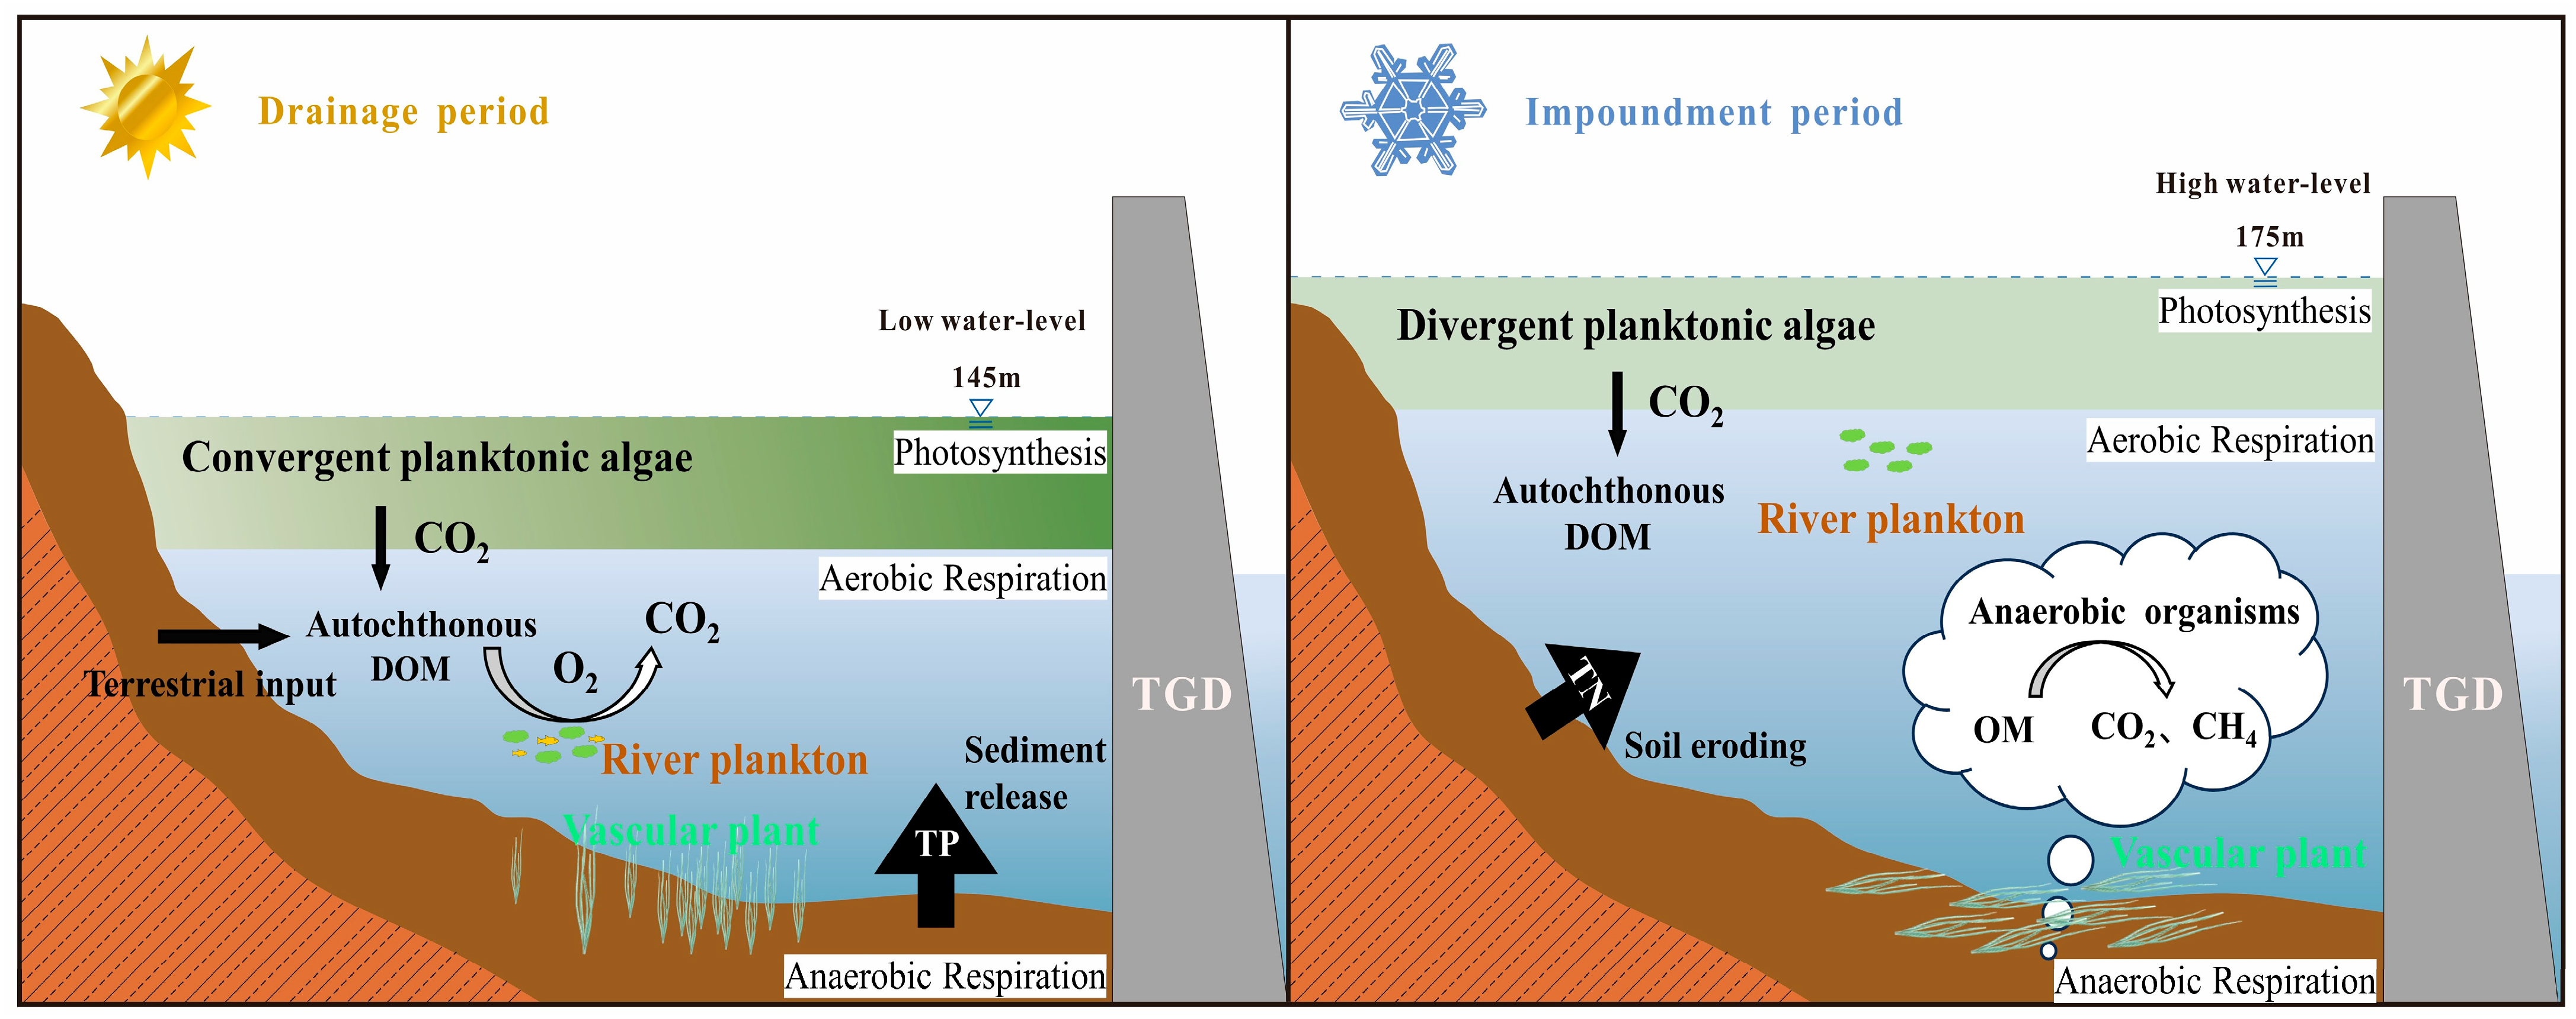
4.3. Exploration of the Mechanisms of Greenhouse Gas Emissions in Reservoirs

The main biogeochemical processes related to carbon cycling in the reservoir water involve aerobic respiration of animals, plants, and microorganisms, photosynthesis of green phytoplankton, and anaerobic respiration of microorganisms. Aerobic respiration involves the breakdown of carbohydrates and occurs primarily through glycolysis and the tricarboxylic acid cycle. The key enzymes involved in these reactions are glucokinase and phosphofructokinase [61]. In general, the optimal pH range for most microorganisms for these enzymes is between 6 and 8, and the suitable temperature is around 35 °C. The pH levels in the reservoir water during different periods are generally suitable for these enzymes. The higher temperature during the drainage period favors enzyme activity and promotes these reactions. The low water level and strong hydraulic conditions during the drainage period create a more aerobic environment for microorganisms in the water, leading to increased synthesis and activity in these enzymes. This, in turn, promotes cellular energy production and the respiratory chain process. Nitrogen (N) and phosphorous (P) in the water can facilitate microbial synthesis of cellular material, gene transcription, and protein synthesis, thereby promoting the decomposition of organic matter by microorganisms.
The process of photosynthesis involves two stages: the light reaction and the carbon fixation reaction [61]. Key elements in this process include pigment synthesis and CO2 fixation. The former requires light energy, nitrogen, phosphorous, and the participation of Mg2+, while the latter requires RuBP to fix CO2. The optimal temperature and pH for these reactions are between 15 °C and 35 °C and between 6 and 7.5, respectively. The higher pH during the drainage period has a relatively minor impact on these reactions. The higher temperature during the drainage period promotes photosynthesis, and sufficient light ensures chlorophyll synthesis, making photosynthesis stronger during this period compared to the impoundment period. During the impoundment period, low temperatures and insufficient light may lead to the death of phytoplankton in the water, turning them into organic matter for microbial decomposition and enhancing greenhouse gas emissions. Nitrogen (N) and phosphorous (P) in water can promote photosynthesis.
The anaerobic respiration process occurs in an anaerobic digestion system and involves a four-stage theory comprising fermentation bacteria, hydrogen and acetate-producing bacteria, homozygous acetogenic bacteria, and methane-producing bacteria [62]. This process relies on organic matter in the water as a substrate, thus highlighting the significant impact of dissolved organic carbon on CH4 production. During the drainage period, the higher pH of the water may partially inhibit the activity of methane-producing bacteria, but the elevated temperature easily promotes the aforementioned reactions. In contrast, during the impoundment period, the pH of the water is more suitable for the survival of methane-producing bacteria. The stable hydraulic conditions and slightly anaerobic environment during this period facilitate CH4 production. However, the low temperature during the impoundment period may partially inhibit CH4 production. Additionally, another important factor influencing CH4 flux is the hydrological management of the reservoir, which largely offsets the effects of temperature and DOC on the methane production process, resulting in relatively small fluctuations in CH4 flux during different periods.
The Three Gorges Dam utilizes a water management approach known as “storage and controlled discharge”, which leads to lower water levels and increased water flow during the drainage period. This dynamic flow condition during the drainage period accelerates the degradation of organic matter and suspended particles in the water. As a result, the pH of the water is relatively higher compared to the impoundment period. In contrast, during the impoundment period, the water flow in the reservoir is reduced, allowing substances to accumulate. This slower flow rate during the impoundment period leads to slower degradation of organic matter and suspended particles, potentially resulting in their accumulation in the water and promoting the generation of acidic substances, thereby lowering the pH of the water. Water management also affects the nutrient elements in the water. During the drainage period, phosphorus is more easily released from sediment, while nitrogen during the impoundment period originates from agricultural pollution to some extent within the reservoir area. Therefore, there are differences in the nutrient element content in the water during different periods. The external conditions during different periods also influence the growth of phytoplankton and other aquatic organisms, leading to significant differences in Chl_a concentration. Plant growth is more favorable during the drainage period, resulting in significantly higher Chl_a concentration compared to the impoundment period. In summary, during the drainage period, temperature, N, and P elements have a promoting effect on the involved biogeochemical processes in the water. Dissolved oxygen has opposite effects on aerobic and anaerobic respiration, and photosynthesis shows a certain degree of nitrogen limitation. Anaerobic respiration is also partially inhibited by pH. During the impoundment period, temperature restricts all biogeochemical processes in the water, while N and P elements promote these processes. Photosynthesis exhibits phosphorus limitation. DO continues to have opposite effects on aerobic and anaerobic respiration, and its low concentration promotes methane production. Dissolved organic carbon in the water serves as a substrate for both aerobic and anaerobic respiration, promoting these respiratory processes during both periods. Water management also influences methane production processes. Therefore, during the drainage period, photosynthesis and aerobic respiration are more active, while anaerobic respiration is less active compared to the impoundment period. Figure 7 illustrates the influencing mechanisms of greenhouse gas flux in the Three Gorges Reservoir area.

5. Conclusions

This study evaluates the distribution and spatiotemporal variations of environmental factors, carbon isotopes, and greenhouse gas fluxes in the Three Gorges Reservoir and explores the mechanisms by which water management and environmental factors affect greenhouse gas emissions. The organic matter in the reservoir mainly originates from phytoplankton and C3 plants, while inorganic carbon is primarily derived from carbonate minerals and soil CO2. Overall, the greenhouse gas fluxes in the reservoir exhibit a “carbon source” characteristic during both the drainage and impoundment periods. The main controlling factors of CO2 and CH4 fluxes in the reservoir vary between different periods. During the drainage period, the main controlling factors of CO2 flux are total phosphorus (TP) and chlorophyll-a (Chl_a), while during the impoundment period, the main controlling factor is total nitrogen (TN). For CH4 flux, the main controlling factor during both the drainage and impoundment periods is dissolved organic carbon (DOC), which is greatly influenced by water management. The different controlling factors are attributed to the changes in environmental factors that affect the biogeochemical processes in the water, thereby influencing greenhouse gas emissions in the reservoir. Therefore, it is necessary to strengthen anthropogenic water management in order to reduce greenhouse gas emissions. However, in the process of strengthening artificial hydrological management, the impact on the water supply network must be considered. By integrating the water network partitioning method used in the water supply network, the management of water reservoirs should also be carried out with a certain degree of partitioning. This can reduce the impact on domestic water use, hydropower generation from the reservoirs, and other aspects, while reducing carbon emissions, thereby achieving a dynamic balance. This study provides a better understanding of the environmental characteristics and biogeochemical processes in the Three Gorges Reservoir, which can serve as a valuable reference for achieving the goal of “reducing emissions and increasing carbon sequestration” in the reservoir.

Author Contributions

X.W.: Writing—original draft, Methodology, and Data curation. M.L.: Writing—review and editing, Project administration, Funding acquisition, and Supervision. H.P.: Methodology and Investigation. H.Y.: Methodology and Investigation. Y.R.: Conceptualization, Methodology, Investigation, and Writing—review and editing. All authors have read and agreed to the published version of the manuscript.

Funding

This work is supported by Open Research Fund of Key Laboratory of Construction and Safety of Water Engineering of the Ministry of Water Resources, China Institute of Water Resources and Hydropower Research (No.202208), Open Fund of Hubei Key Laboratory of Intelligent Yangtze and Hydroelectric Science (No. ZH2102000113), National Natural Science Foundation of China (No. 41902257).

Data Availability Statement

The datasets used and/or analyzed during the current study are available from the corresponding author on reasonable request.

Conflicts of Interest

Author Xing Wei was employed by the company Hubei Key Laboratory of Intelligent Yangtze and Hydroelectric Science, China Yangtze Power Co., Ltd. The remaining authors declare that the research was conducted in the absence of any commercial or financial relationships that could be construed as a potential conflict of interest.

References

  1. Li, S. Carbon Dioxide Exchange Flux in the Water- Air Interface and Its Mechanism in the Changjiang River Basin. Ph.D. Thesis, Shanghai University, Shanghai, China, 2018. (In Chinese with English Abstract). [Google Scholar]
  2. Levitus, S.; Antonov, J.I.; Wang, J.; Delworth, T.L.; Dixon, K.W.; Broccoli, A.J. Anthropogenic Warming of Earth’s Climate System. Science 2001, 292, 267–270. [Google Scholar] [CrossRef]
  3. Wang, W.; Guo, Q.; Du, C.; Deng, Y. Advances in water environmental carbon cycle in the Yangtze River Basin. Chin. J. Ecol. 2022, 42, 736–747, (In Chinese with English Abstract). [Google Scholar]
  4. Stanley, E.H.; Casson, N.J.; Christel, S.T.; Crawford, J.T.; Loken, L.C.; Oliver, S.K. The ecology of methane in streams and rivers: Patterns, controls, and global significance. Ecol. Monogr. 2015, 86, 146–171. [Google Scholar] [CrossRef]
  5. Raymond, P.A.; Hartmann, J.; Lauerwald, R.; Sobek, S.; McDonald, C.; Hoover, M.; Butman, D.; Striegl, R.; Mayorga, E.; Humborg, C.; et al. Global carbon dioxide emissions from inland waters. Nature 2013, 503, 335–359. [Google Scholar] [CrossRef]
  6. Holgerson, A.M.; Raymond, A.P. Large contribution to inland water CO2 and CH4 emissions from very small ponds. Nat. Geosci. 2016, 9, 222–226. [Google Scholar] [CrossRef]
  7. Stallard, R.F. Terrestrial sedimentation and the carbon cycle: Coupling weathering and erosion to carbon burial. Glob. Biogeochem. Cycles 1998, 12, 231–257. [Google Scholar] [CrossRef]
  8. Barros, N.; Cole, J.J.; Tranvik, L.J.; Prairie, Y.T.; Bastviken, D.; Huszar, V.L.M.; Giorgio, P.d.; Roland, F. Carbon emission from hydroelectric reservoirs linked to reservoir age and latitude. Nat. Geosci. 2011, 4, 593–596. [Google Scholar] [CrossRef]
  9. Regnier, P.; Friedlingstein, P.; Ciais, P.; Mackenzie, F.T.; Gruber, N.; Janssens, I.A.; Laruelle, G.G.; Lauerwald, R.; Luyssaert, S.; Andersson, A.J.; et al. Anthropogenic perturbation of the carbon fluxes from land to ocean. Nat. Geosci. 2013, 6, 597–607. [Google Scholar] [CrossRef]
  10. Maavara, T.; Lauerwald, R.; Regnier, P.; van Cappellen, P. Global perturbation of organic carbon cycling by river damming. Nat. Commun. 2017, 8, 15347. [Google Scholar] [CrossRef]
  11. Grill, G.; Lehner, B.; Lumsdon, A.E.; MacDonald, G.K.; Zarfl, C.; Liermann, C.R. An index-based framework for assessing patterns and trends in river fragmentation and flow regulation by global dams at multiple scales. Environ. Res. Lett. 2015, 10, 015001. [Google Scholar] [CrossRef]
  12. Borzì, I. Evaluating Sustainability Improvement of Pressure Regime in Water Distribution Systems Due to Network Partitioning. Water 2022, 14, 1787. [Google Scholar] [CrossRef]
  13. Fearnside, P.M. Hydroelectric Dams in the Brazilian Amazon as Sources of ‘Greenhouse’ Gases. Environ. Conserv. 1995, 22, 7–19. [Google Scholar] [CrossRef]
  14. Li, Z.; Zhang, L.; Wang, L.; Guo, J.; Gao, X.; Fang, F.; Jiang, T. Preliminary study of CO2 and CH4 fluxes at soil-air interface in drawdown area of the Pengxi River of the Three Gorges Reservoir. J. Lake Sci. 2013, 25, 674–680, (In Chinese with English Abstract). [Google Scholar]
  15. Jiang, T.; Guo, J.; Li, Z.; Fang, F.; Bai, L.; Liu, J. Air-water surface greenhouse gas flux in pengxi river at different operational stages of the Three Gorges Reservoir. Environ. Sci. 2012, 33, 1463–1470, (In Chinese with English Abstract). [Google Scholar] [CrossRef]
  16. Zhao, Y.; Wu, B.; Zeng, Y. Spatial and temporal patterns of greenhouse gas emissions from Three Gorges Reservoir of China. Biogeosciences 2013, 10, 1219–1230. [Google Scholar] [CrossRef]
  17. Fu, B.; Wu, B.; Lü, Y.; Xu, Z.; Cao, J.; Niu, D.; Yang, G.-S.; Zhou, Y.M. Three Gorges Project: Efforts and challenges for the environment. Prog. Phys. Geogr. Earth Environ. 2010, 34, 741–754. [Google Scholar] [CrossRef]
  18. Xu, D.; Zhang, J.; Rasul, G.; Liu, S.; Xie, F.; Cao, M.; Liu, E. Household livelihood strategies and dependence on agriculture in the mountainous settlements in the Three Gorges Reservoir Area, China. Sustainability 2015, 7, 4850–4869. [Google Scholar] [CrossRef]
  19. Bao, Y.; Gao, P.; He, X. The water-level fluctuation zone of Three Gorges Reservoir—A unique geomorphological unit. Earth-Sci. Rev. 2015, 150, 14–24. [Google Scholar] [CrossRef]
  20. Zhang, J.; Li, S.; Dong, R.; Jiang, C.; Ni, M. Influences of land use metrics at multi-spatial scales on seasonal water quality: A case study of river systems in the Three Gorges Reservoir Area, China. J. Clean. Prod. 2019, 206, 76–85. [Google Scholar] [CrossRef]
  21. Yang, S.; Milliman, J.D.; Xu, K.; Deng, B.; Zhang, X.; Luo, X. Downstream sedimentary and geomorphic impacts of the Three Gorges Dam on the Yangtze River. Earth-Sci. Rev. 2014, 138, 469–486. [Google Scholar] [CrossRef]
  22. Mao, R.; Chen, H.; Li, S. Phosphorus availability as a primary control of dissolved organic carbon biodegradation in the tributaries of the Yangtze River in the Three Gorges Reservoir Region. Sci. Total Environ. 2017, 574, 1472–1476. [Google Scholar] [CrossRef]
  23. Bao, H.; Niggemann, J.; Huang, D.; Dittmar, T.; Kao, S.J. Different Responses of Dissolved Black Carbon and Dissolved Lignin to Seasonal Hydrological Changes and an Extreme Rain Event. J. Geophys. Res. Biogeosciences 2019, 124, 479–493. [Google Scholar] [CrossRef]
  24. Høj, L.; Olsen, R.A.; Torsvik, V.L. Effects of temperature on the diversity and community structure of known methanogenic groups and other archaea in high Arctic peat. ISME J. 2008, 2, 37–48. [Google Scholar] [CrossRef] [PubMed]
  25. Mao, C.; Ji, J.; Luo, Y.; Yuan, X.; Yang, Z.; Song, Y.; Chen, J. Seasonal variation in the flux and isotopic composition of particulate organic carbon along the mainstream of the Changjiang River. Earth Sci. Front. 2011, 18, 161–168, (In Chinese with English Abstract). [Google Scholar]
  26. Crill, P.M.; Bartlett, K.B.; Wilson, J.O.; Sebacher, D.I.; Harriss, R.C.; Melack, J.M.; MacIntyre, S.; Lesack, L.; Smith-Morrill, L. Tropospheric methane from an Amazonian floodplain lake. J. Geophys. Res. Atmos. 1988, 93, 1564–1570. [Google Scholar] [CrossRef]
  27. Frolking, S.; Crill, P. Climate controls on temporal variability of methane flux from a poor fen in southeastern New Hampshire: Measurement and modeling. Glob. Biogeochem. Cycles 1994, 8, 385–397. [Google Scholar] [CrossRef]
  28. He, D.; Wang, K.; Pang, Y.; He, C.; Li, P.; Li, Y.; Xiao, S.; Shi, Q.; Sun, Y. Hydrological management constraints on the chemistry of dissolved organic matter in the Three Gorges Reservoir. Water Res. 2020, 187, 116413. [Google Scholar] [CrossRef]
  29. Wang, X.; Siciliano, S.; Helgason, B.; Bedard-Haughn, A. Responses of a mountain peatland to increasing temperature: A microcosm study of greenhouse gas emissions and microbial community dynamics. Soil Biol. Biochem. 2017, 110, 22–33. [Google Scholar] [CrossRef]
  30. Crawford, J.T.; Stanley, E.H.; Spawn, S.A.; Finlay, J.C.; Loken, L.C.; Striegl, R.G. Ebullitive methane emissions from oxygenated wetland streams. Glob. Change Biol. 2014, 20, 3408–3422. [Google Scholar] [CrossRef]
  31. Bastviken, D.; Tranvik, L.J.; Downing, J.A.; Crill, P.M.; Enrich-Prast, A. Freshwater Methane Emissions Offset the Continental Carbon Sink. Science 2011, 331, 50. [Google Scholar] [CrossRef]
  32. Larkum, A.; Mccomb, A.; Shepherd, S. Biology of Seagrasses; Elsevier: Amsterdam, The Netherlands, 1989. [Google Scholar]
  33. Garcia, J.L.; Patel, B.K.C.; Ollivier, B. Taxonomic, Phylogenetic, and Ecological Diversity of Methanogenic Archaea. Anaerobe 2000, 6, 205–226. [Google Scholar] [CrossRef] [PubMed]
  34. Cole, J.J.; Cole, J.J.; Caraco, N.F.; Caraco, N.F. Carbon in catchments: Connecting terrestrial carbon losses with aquatic metabolism. Mar. Freshw. Res. 2001, 52, 101–110. [Google Scholar] [CrossRef]
  35. Lohman, K.; Jones, J.R.; Baysinger-Daniel, C. Experimental evidence for nitrogen limitation in a northern Ozark stream. J. North Am. Benthol. Soc. 1991, 10, 14–23. [Google Scholar] [CrossRef]
  36. She, W.; Yang, J.; Wu, G.; Jiang, H. The synergy of environmental and microbial variations caused by hydrologic management affects the carbon emission in the Three Gorges Reservoir. Sci. Total Environ. 2022, 821, 153446. [Google Scholar] [CrossRef]
  37. Schwarz, J.I.; Eckert, W.; Conrad, R. Response of the methanogenic microbial community of a profundal lake sediment (Lake Kinneret, Israel) to algal deposition. Limnol. Oceanogr. 2008, 53, 113–121. [Google Scholar] [CrossRef]
  38. Tank, S.E.; Lesack, L.F.W.; Gareis, J.A.L.; Osburn, C.L.; Hesslein, R.H. Multiple tracers demonstrate distinct sources of dissolved organic matter to lakes of the Mackenzie Delta, western Canadian Arctic. Limnol. Oceanogr. 2011, 56, 1297–1309. [Google Scholar] [CrossRef]
  39. Li, X.; Liu, C.; Liu, X.; Bao, L. Identification of dissolved sulfate sources and the role of sulfuric acid in carbonate weathering using dual-isotopic data from the Jialing River, Southwest China. J. Asian Earth Sci. 2011, 42, 370–380. [Google Scholar] [CrossRef]
  40. Cerling, T.E.; Solomon, D.K.; Quade, J.; Bowman, J.R. On the isotopic composition of carbon in soil carbon dioxide. Geochim. Et Cosmochim. Acta 1991, 55, 3403–3405. [Google Scholar] [CrossRef]
  41. Wu, Y.; Zhang, J.; Liu, S.; Zhang, Z.; Yao, Q.; Hong, G.; Cooper, L. Sources and distribution of carbon within the Yangtze River system. Estuar. Coast. Shelf Sci. 2007, 71, 13–25. [Google Scholar] [CrossRef]
  42. Amiotte-Suchet, P.; Aubert, D.; Probst, J.-L.; Gauthier-Lafaye, F.; Probst, A.; Andreux, F.; Viville, D. δ13C pattern of dissolved inorganic carbon in a small granitic catchment: The Strengbach case study (Vosges mountains, France). Chem. Geol. 1999, 159, 129–145. [Google Scholar] [CrossRef]
  43. Telmer, K.; Veizer, J. Carbon fluxes, pCO2 and substrate weathering in a large northern river basin, Canada: Carbon isotope perspectives. Chem. Geol. 1999, 159, 61–86. [Google Scholar] [CrossRef]
  44. Aucour, A.-M.; Sheppard, S.M.; Guyomar, O.; Wattelet, J. Use of 13C to trace origin and cycling of inorganic carbon in the Rhône river system. Chem. Geol. 1999, 159, 87–105. [Google Scholar] [CrossRef]
  45. Galy, A.; France-Lanord, C. Weathering processes in the Ganges–Brahmaputra basin and the riverine alkalinity budget. Chem. Geol. 1999, 159, 31–60. [Google Scholar] [CrossRef]
  46. Xie, X.; Gan, Y.; Liu, Y.; Li, J.; Li, X.; Du, Y. The Principle and Application of Environmental Isotopes; China Science Publishing & Media Ltd.: Beijing, China, 2019; (In Chinese with English Abstract). [Google Scholar]
  47. Lu, F.; Liu, Z.; Ji, H. Carbon and nitrogen isotopes analysis and sources of organic matter in the upper reaches of the Chaobai River near Beijing, China. Sci. China Earth Sci. 2013, 56, 217–227. [Google Scholar] [CrossRef]
  48. Redfield, A.C. The influence of organisms on the composition of seawater. Sea 1963, 2, 26–77. [Google Scholar]
  49. Thorp, J.H.; Delong, M.D.; Greenwood, K.S.; Casper, A.F. Isotopic analysis of three food web theories in constricted and floodplain regions of a large river. Oecologia 1998, 117, 551–563. [Google Scholar] [CrossRef] [PubMed]
  50. Vander Zanden, M.J.; Rasmussen, J.B. Primary Consumer δ13C and δ15N and the Trophic Position of Aquatic Consumers. Ecology 1999, 80, 1395–1404. [Google Scholar] [CrossRef]
  51. Thornton, S.; McManus, J. Application of organic carbon and nitrogen stable isotope and C/N ratios as source indicators of organic matter provenance in estuarine systems: Evidence from the Tay Estuary, Scotland. Estuar. Coast. Shelf Sci. 1994, 38, 219–233. [Google Scholar] [CrossRef]
  52. Liu, K.; Kao, S.; Wen, L.; Chen, K. Carbon and nitrogen isotopic compositions of particulate organic matter and biogeochemical processes in the eutrophic Danshuei Estuary in northern Taiwan. Sci. Total Environ. 2007, 382, 103–120. [Google Scholar] [CrossRef]
  53. Andrews, J.E.; Greenaway, A.M.; Dennis, P.F. Combined Carbon Isotope and C/N Ratios as Indicators of Source and Fate of Organic Matter in a Poorly Flushed, Tropical Estuary: Hunts Bay, Kingston Harbour, Jamaica. Estuar. Coast. Shelf Sci. 1998, 46, 743–756. [Google Scholar] [CrossRef]
  54. Ogrinc, N.; Markovics, R.; Kanduč, T.; Walter, L.M.; Hamilton, S.K. Sources and transport of carbon and nitrogen in the River Sava watershed, a major tributary of the River Danube. Appl. Geochem. 2008, 23, 3685–3698. [Google Scholar] [CrossRef]
  55. Boutton, T. Stable carbon isotopes ratios of natural materials. In Carbon Isotopes Techniques; Academic Press: New York, NY, USA, 1991; p. 200. [Google Scholar]
  56. Qin, Y.; Ouyang, C.Y.; Wang, Y.X.; Fang, P. Comparison between tributary and main stream and preliminary influence mechanism of CO2 flux across water-air interface in Wanzhou in the Three Gorges reservoir area. Enviroment Sci. 2022, 43, 377–386, (In Chinese with English Abstract). [Google Scholar] [CrossRef]
  57. Wang, X.; Hua, Z.; Xu, L.; Zhao, C.; Wu, C. The effects of the environmental conditions on phosphorus release in lake sediments. Environ. Chem. 1996, 15, 15–19, (In Chinese with English Abstract). [Google Scholar]
  58. Xiao, H.; Mao, C.; Wang, S.; Jia, Z.; Rao, W. Seasonal variation and provenance of organic matter in the surface sediments of the three gorges reservoir: Stable isotope analysis and implications for agricultural management. Sci. Total Environ. 2023, 870, 161886. [Google Scholar] [CrossRef] [PubMed]
  59. He, X.; Ding, L.; Zhang, L.; Gu, Z.; Ren, H. Performance, Sludge Characteristics, and the Microbial Community Dynamics of Bulking Sludge Under Different Nitrogen and Phosphorus Imbalances. Enviroment Sci. 2018, 39, 1782–1793, (In Chinese with English Abstract). [Google Scholar] [CrossRef]
  60. Zhou, X.; Ren, N.; Chen, M.; Liu, Y.; Liu, S.; Zhang, Y. Control of sludge bulking during treatment of phosphorized wastewater with low organic loading. J. Harbin Univ. Civ. Eng. Archit. 2001, 34, 58–60, (In Chinese with English Abstract). [Google Scholar]
  61. Zheng, P. Environmental Microbiology; Zhejiang University Press: Hangzhou, China, 2012; (In Chinese with English Abstract). [Google Scholar]
  62. Weimer, P.J.; Zeikus, J.G. Acetate assimilation pathway of Methanosarcina barkeri. J. Bacteriol. 1979, 137, 332–339. [Google Scholar] [CrossRef]
Figure 1. Map showing the study area and sampling points, Zhutuo (ZT), Zhongxian Shibaozhai (ZX), Mudong (MD), Fuling (FL), Wanzhou (WZ), Fengjie (FJ), Wushan (WS), Badong (BD), Xiangxi River Mouth (XXHK), and Maoping (MP), respectively.
Water 16 01642 g001
Figure 2. Flowchart of the study.
Water 16 01642 g002
Figure 3. Distribution of environmental factors of the surface water in the Three Gorges Reservoir area, pH (a), T (b), EC (c), DO (d), TN (e), TP (f), DOC (g), DIC (h), and Chl_a (i), respectively.
Water 16 01642 g003
Figure 4. Spatial and temporal variation of CO2 flux (a) and CH4 flux (b) in the Three Gorges Reservoir area.
Water 16 01642 g004
Figure 5. Heat map of the correlation between the greenhouse gas fluxes and each indicator during the drainage period (a) and the impoundment period (b); the number marked in the figure represents the correlation coefficient; red symbolizes a positive correlation, while blue represents a negative correlation.
Water 16 01642 g005
Figure 6. The contribution rates of each influencing factor to greenhouse gas flux in the water of the Three Gorges Reservoir, (a) representing CO2 flux and (b) representing CH4 flux.
Water 16 01642 g006
Figure 7. The impact mechanism of hydrological management on greenhouse gas emissions in the Three Gorges Reservoir.
Water 16 01642 g007
Table 1. Specific information on sampling sites.
Sampling PointsAltitude (m)Distance from the Previous Sampling Site (Km)Maximum Annual RunoffMinimum Annual RunoffMean
ZT2050317919342591
ZX163166422124793375
MD17113.7---
FL171115.4---
WZ166165.1---
FJ124120.3---
WS13443.1---
BD14147.5---
XXHK11344.6---
MP12925.8544228484173
Notes: The annual runoff data covers the period from 2000 to 2022, with units of 100 million cubic meters; “-” indicates that the relevant data has not yet been obtained.
Table 2. Physiochemical parameters of the surface water in the Three Gorges Reservoir area in the drainage and impoundment periods.
ParameterDrainage PeriodImpoundment Period
RangeMeanRangeMean
pH8.21~8.678.34 ± 0.147.59~7.87.71 ± 0.05
T/°C23.75~25.3524.79 ± 0.4415.08~16.6915.7 ± 0.55
TN/mg·L−11.58~2.492.12 ± 0.261.26~1.561.41 ± 0.09
TP/mg·L−10.06~0.5040.20 ± 0.140.05~0.070.06 ± 0.007
DO/mg·L−15.78~8.386.64 ± 0.958.42~9.789.17 ± 0.41
DOC/mg·L−14.59~9.026.29 ± 1.541.63~2.942.16 ± 0.28
DIC/mg·L−12.77~6.764.96 ± 1.3512.04~27.8823.54 ± 5.39
Chl_a/μg·L−11.53~69.4114.13 ± 22.170.25~1.070.60 ± 0.24
EC/μs·cm−1304.5~381321.6 ± 23.13314.25~400.4339.53 ± 29.03
Table 3. Carbon isotope signatures of reservoir waters.
Sampling Pointsδ13CDOC/‰δ13CDIC/‰
ZT−31.80−4.89
ZX−30.86−6.01
MD−30.34−5.55
FL−32.57−7.25
WZ−32.61−7.96
FJ−30.84−7.56
WS−31.31−7.81
BD−31.02−7.44
XXHK−30.11−6.71
MP−32.06−6.01
Disclaimer/Publisher’s Note: The statements, opinions and data contained in all publications are solely those of the individual author(s) and contributor(s) and not of MDPI and/or the editor(s). MDPI and/or the editor(s) disclaim responsibility for any injury to people or property resulting from any ideas, methods, instructions or products referred to in the content.

