Article

A Comparative Study of Carbon Emissions from Industrial and Domestic Wastewater Treatment Plants under the Background of Carbon Neutralization

1
State Key Laboratory of Eco-Hydraulics in Northwest Arid Region of China, Xi’an University of Technology, Xi’an 710048, China
2
Key Laboratory of National Forestry Administration on Ecological Hydrology and Disaster Prevention in Arid Regions, Xi’an University of Technology, Xi’an 710048, China
3
Yulin High-Tech Zone Yuheng No. 1 Industrial Sewage Treatment Company, Yulin Coal Chemical Waste Resource Utilization and Low Carbon Environmental Protection Engineering Technology Research Center, Yulin 719000, China
4
Institute of Eco-Environmental Research, School of Environmental and Natural Resources, Zhejiang University of Science & Technology, Hangzhou 310023, China
5
Yulin Gaoxin Sewage Treatment Co., Ltd., Yulin 719000, China
6
National Supervision & Inspection Center of Environmental Protection Equipment Quality, Yixing 214205, China
*
Author to whom correspondence should be addressed.
Water 2024, 16(12), 1652; https://doi.org/10.3390/w16121652
Submission received: 21 April 2024 / Revised: 31 May 2024 / Accepted: 31 May 2024 / Published: 9 June 2024
(This article belongs to the Special Issue Desalination and Waste/Water Treatment)

Abstract

:
This paper studied the characteristics of the carbon emission of an industrial wastewater treatment plant (IWWTP) and a domestic WWTP (DWWTP) located in a high-tech industrial park of Shaanxi Province, China. The results showed that the total carbon emissions of the IWWTP and DWWTP were 10.13 kg/t and 1.84 kg/t in 2020, respectively. Indirect carbon emissions play a dominant role in the total carbon emission of the IWWTP, which accounts for about 97.6% of the total amount. The direct carbon emissions of greenhouse gases (e.g., CH4, N2O) account for about 62% of the total carbon emissions in the DWWTP, followed by the indirect carbon emissions generated by electricity consumption (31.06%) and chemical consumption (6.94%). Additionally, the centralized recycling and re-utilization of the wastewater could achieve 1.06 kg/t and 1.16 kg/t of carbon emission reduction in the IWWTP and DWWTP, respectively, while the carbon emissions of the DWWTP are inversely proportional to the treatment capacity. Therefore, it is of great value to collect and utilize intensively the recycled water to achieve the goal of regional carbon emission reduction and carbon neutralization of WWTPs in industrial parks.

1. Introduction

Wastewater treatment plants (WWTPs) have been identified as main emission sources of anthropogenic greenhouse gas (GHG) [1]. Domestic and industrial pollutants are usually transported into WWTPs during the processes of wastewater treatment [2], which need to consume a huge amount of electricity and chemicals to achieve good performance. Conventional WWTPs require significant energy inputs, making up 3% of the global consumption of electricity [3]. The biodegradation of organic matter contributes to 1.57% of global CO2-equivalent GHG emission and 5% of global non-carbon dioxide greenhouse gas (mainly CH4 and N2O) emission [4,5], which results in a critical impact on climate and the economy. Hence, the control strategies of GHG emission have gained more and more widespread attention, as a result of hard environmental regulations [6]. In 2020, President Xi Jinping proposed that China will further improve the country’s independent contribution, strive to achieve carbon peaks in 2030, and achieve carbon neutralization goals by 2060 and promote the high-quality development of social economy. To gain the reduction in effective carbon emissions produced during the processes of wastewater treatment, it is important to explore the origins of carbon emission under different conditions of influent (industrial and domestic) and treatment processes [4,7], which would be meaningful to guide sustainable GHG control strategies (IPCC 2019).
The Intergovernmental Panel on Climate Change (IPCC) has reported the total carbon emission of some domestic WWTPs (DWWTPs) [8,9]. For instance, in [10], Zhang et al. reported that the contribution of GHG from the anaerobic, anoxic, and aerobic units in a DWWTP was 29.7%, 32.5%, and 37.8% of the total carbon emission, respectively, in which the direct carbon emission of CH4 occupied 27.86% [11]; Nguyen et al. conducted a comparative analysis of the greenhouse gas emission of A2/O and an SBR (Sequencing Batch Reactor) and confirmed that carbon emission is mainly generated by aerobic processes [12]. Scholars also extracted organic energy and heat energy from DWWTPs and then achieved low carbon emission, e.g., incineration waste power generation [13,14,15], biological hydrogen production [2], and heat pump [16,17]. However, the data from DWWTPs are still invalid after integrating with membrane processes. For instance, the integration of an MBR (Membrane Biological Reactor) and A2O led to a 30.5% contribution of direct carbon emission, while the electricity consumption made up 68.35% of the indirect carbon emission [18]. Therefore, the integration of membrane and biological systems could increase energy consumption, which is disproportionate to the direct and indirect greenhouse emissions from the A2/O process. In addition, in comparison with the indirect and direct carbon emissions of DWWTPs, there are rare publications about industrial WWTPs (IWWTPs) which play an important role in the industrialization of China and other developing countries (IWWTPs contribute to about 50% of the global total greenhouse gas emission) [19]. Wastewater treatment processes for IWWTPs, containing pretreatment + reverse osmosis membrane separation + evaporation solvent crystallization, need to be specifically addressed, which are common treatment processes in handling industrial wastewater from coal industries [20]. Currently, little is known about GHG emission and distribution from typical IWWTPs which contain many more membrane processes and relevant pre/post-treatment procedures compared to domestic ones. In addition, there are increasing demands in the wastewater reclamation of both DWWTPs and IWWTPs, but as for how those reclamation processes would impact carbon emission, further investigations need to be carried out to answer those questions. Such information would be helpful for carbon reduction in the processes of wastewater treatment.
This study analyzed the characteristics of carbon emission produced from the IWWTP and the DWWTP in a high-tech industrial park in Shaanxi Province, China, which were based on the 2006 IPCC Guidelines for National Greenhouse Gas Inventories (https://www.ipcc-nggip.iges.or.jp/public/2006gl/index.html; accessed on 3 May 2024), its 2019 Refinement (https://www.ipcc-nggip.iges.or.jp/public/2019rf/; accessed on 3 May 2024), and the Provincial Greenhouse Gas Inventories and Greenhouse Gas Accounting Tool for Chinese Cities (https://ghgprotocol.org/chinese-city-tool; accessed on 3 May 2024, Greenhouse Gas Accounting Tool for Chinese Cities (Pilot Version 1.0), http://pdf.wri.org/ghg_accounting_tool_for_chinese_cities_guidance.pdf; accessed on 3 May 2024). This investigation focused on direct and indirect carbon emissions from different processes of IWWTPs and DWWTPs in 2020 and evaluated the benefits of carbon emission reduction after the centralized utilization of recycled water. In addition, strategies for the reduction in carbon emission, recycling crystalline miscellaneous salt in IWWTPs and re-utilizing biomass energy from the DWWTP, were also reported in this study.

2. Methods and Materials

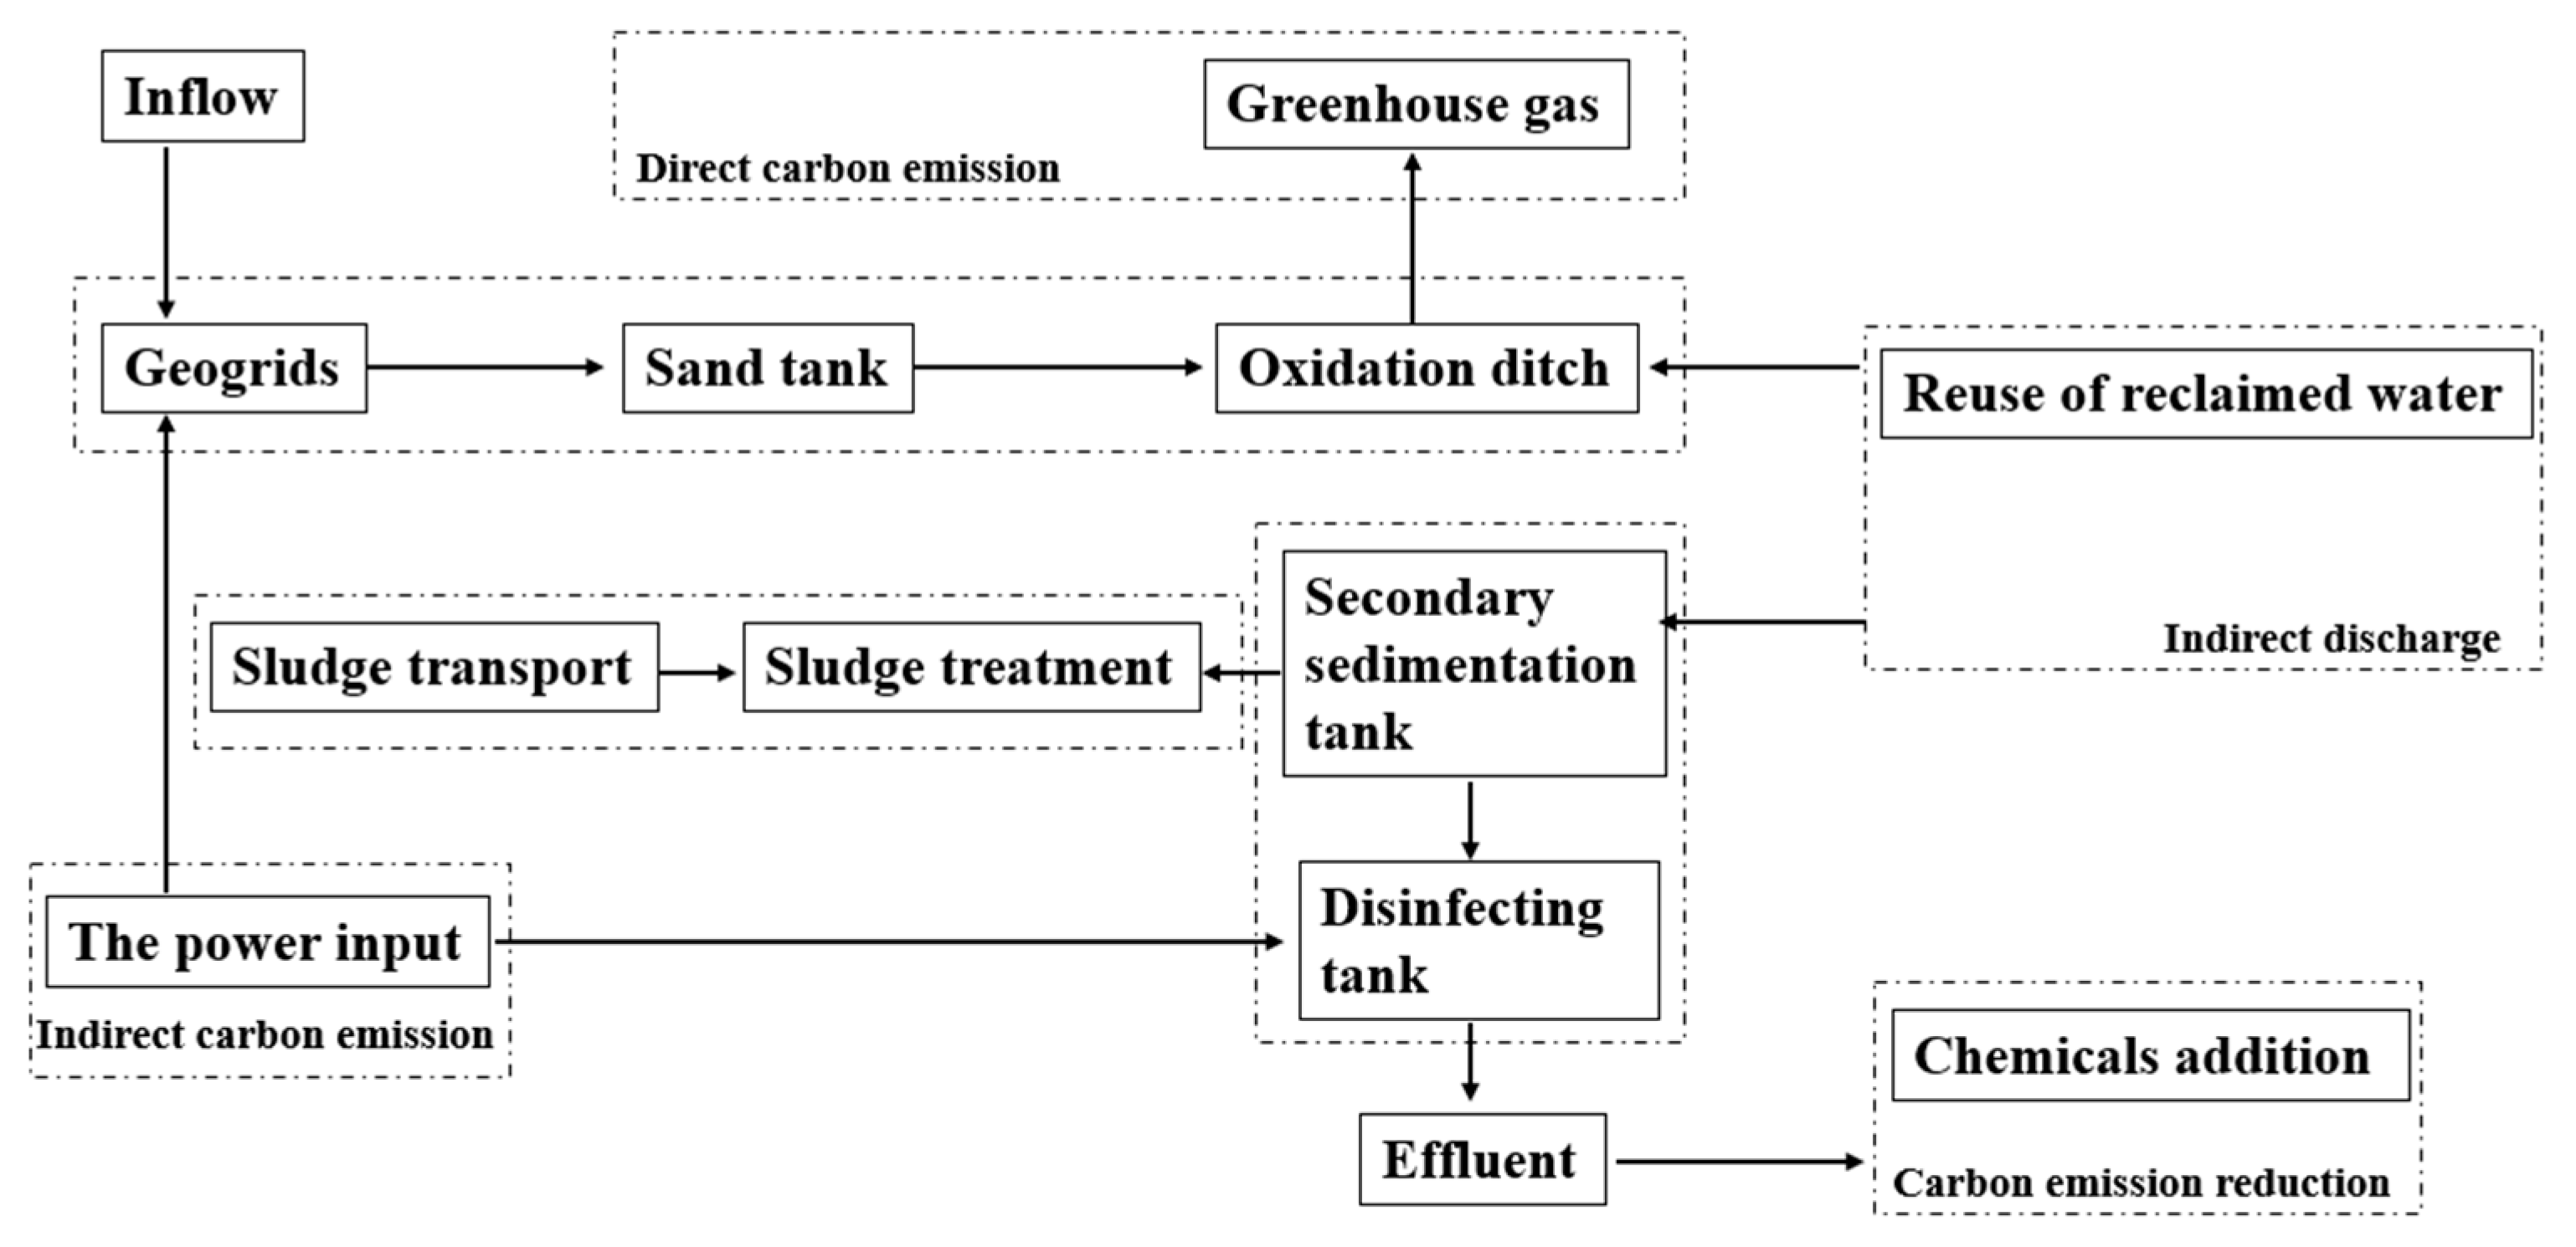
2.1. An Overview of the IWWTP

The IWWTP, located in an industrial park in Shaanxi Province, occupies 358,700 km2 and supports a 30,000 m3/d capacity of wastewater treatment and is devoted to treating the industrial wastewater from various chemical manufacturers (Table 1 and Table S1). The treatment processes included pretreatment, membrane concentration, and evaporation crystallization. The effluent of the IWWTP was recycled until meeting the criteria (T/CUWA 50055-2023; https://www.cuwa.org.cn/xianxingtuantibiaozhun.html, accessed on 3 May 2024), while the crystallized salt and sludge were transported to a landfill. These processes were typical industrial wastewater treatment process in northwest China. A flow chart of the IWWTP and carbon emission is illustrated in Figure 1.

2.2. An Overview of the DWWTP

The DWWTP, located in an industrial park in Shaanxi Province, occupies 73,000 km2 and supports a 30,000 m3/d capacity of wastewater treatment (Table 1 and Table S2). The major treatment processes of this DWWTP were the sand tank, anaerobic/anoxic/aerobic (A2/O) process, and sedimentation tank. The recycled water was treated by precipitation filtration and then discharged after meeting both the discharge standard for the WWTP and the reuse of urban recycling water—the water quality standard for industrial use. A flow chart of the DWWTP and carbon emission is presented in Figure 2.

2.3. Analytic Methods

The direct and indirect carbon emissions of both the IWWTP and DWWTP were calculated. The carbon emission reductions achieved by water and salt recycling were also analyzed.

2.3.1. Direct Carbon Discharge Calculation

Direct carbon emissions, in terms of CO2, CH4, and N2O, refer to the greenhouse gases that were directly discharged into the atmosphere during the treatment processes.
The carbon emission calculation formula of CH4 is shown as follows [18]:
C E E C H 4 = Q × β C H 4 × E B O D × ( C i , B O D C e , B O D )
In the formula, C E E C H 4 represents the CH4 emission (kg CO2e); Q indicates the inflow volume of the wastewater treatment plant, which is in the unit of m3 (month); β C H 4 represents the conversion coefficient of the CH4 emissions, taking the value of 28 (IPCC 2014 ) [21]; E B O D shows the CH4 emission factor for BOD (Biochemical Oxygen Demand) as 0.086 kg (CH4)/kg (BOD) (IPCC 2014); C i , B O D and C e , B O D indicate the influent and effluent concentrations in terms of BOD in kg/m3. For the treatment processes of industrial wastewater, the formula will be modified for wastewater containing high carbon loading, and organics in industrial wastewater are often expressed in terms of COD.
The formula for carbon emission caused by N2O is as follows:
C E E N 2 O = Q × β N 2 O × E N 2 O × ( C i , T N C e , T N )
In the formula, C E E N 2 O represents N2O carbon emission (kg CO2e); β N 2 O indicates the conversion coefficient of N2O emission, taking the value of 298 (IPCC 2014); E N 2 O represents the emission factor of 0.035 kg (N2O)/kg (TN) (IPCC 2014); C i , T N and C e , T N indicate the TN concentrations of the influent and effluent in kg/m3, respectively.
The formula for carbon emission caused by CO2 is as follows:
C E E C O 2 = Q × E C O 2 × ( C i , A L K C e , A L K )
In the formula, C E E C O 2 indicates the CO2 emission produced in the carbonate alkalinity decomposition from industrial wastewater treatment, presented in the unit of kg CO2e; E C O 2 represents the CO2 emission factor for alkalinity (ALK) of 0.7213 kg (CO2)/kg (ALK), respectively [22]; C i , A L K and C e , A L K indicate the concentration of the carbonate alkalinity of the inflow and effluent in unit Kg/m3, respectively (chemical transformation is HCO3 + H+ = H2O + CO2).

2.3.2. Indirect Carbon Discharge Calculation

Indirect carbon emissions are generated by electricity and reagent consumption, which are involved in aeration, water pump lifting, electrical equipment, sludge pressure filtration, air compressors, heat pumps, and the consumption of all kinds of reagents. Indirect carbon emissions are calculated by the following formula:
C E E i = j = 1 n E j W j
In the formula, C E E i represents indirect carbon emissions in terms of CO2 emission (kg CO2e); E j represents the CO2 emission factors of energy consumption and agent consumption. W j represents the level of energy consumption and reagent consumption in terms of kWh. And the energy consumption factor is 0.997 kg (CO2)/kW·h [23]. The agent consumption factors of sodium hydroxide, flocculant PAM (polyacrylamide), disinfectant (sodium chloride), and hydrochloric acid are 1.74, 25, 1.4, and 1.6 kg (CO2)/kg, respectively [24,25].

2.3.3. Carbon Emission Reduction Calculation

The value of carbon emission reduction is mainly evaluated in terms of the carbon emission reduction in electricity and chemical consumption from the decrease in the water and salt product demand for the reclaimed water and crystalline salt of sewage treatment plants; the formula is presented as follows:
T G W R = V × j = 1 n E j W j
In the formula, T G W R represents the extent of CO2 emission reduction, presented in the unit of kg CO2e; E j represents CO2 emission factors such as electricity consumption and flocculant PAM, while the emission factor of the basalt is 1.6 kg (CO2)/kg [26]; W j represents the energy consumption; V (m3) is the volume of reclaimed wastewater generated by the wastewater treatment plant.

3. Results

3.1. Direct Carbon Emission Accounting

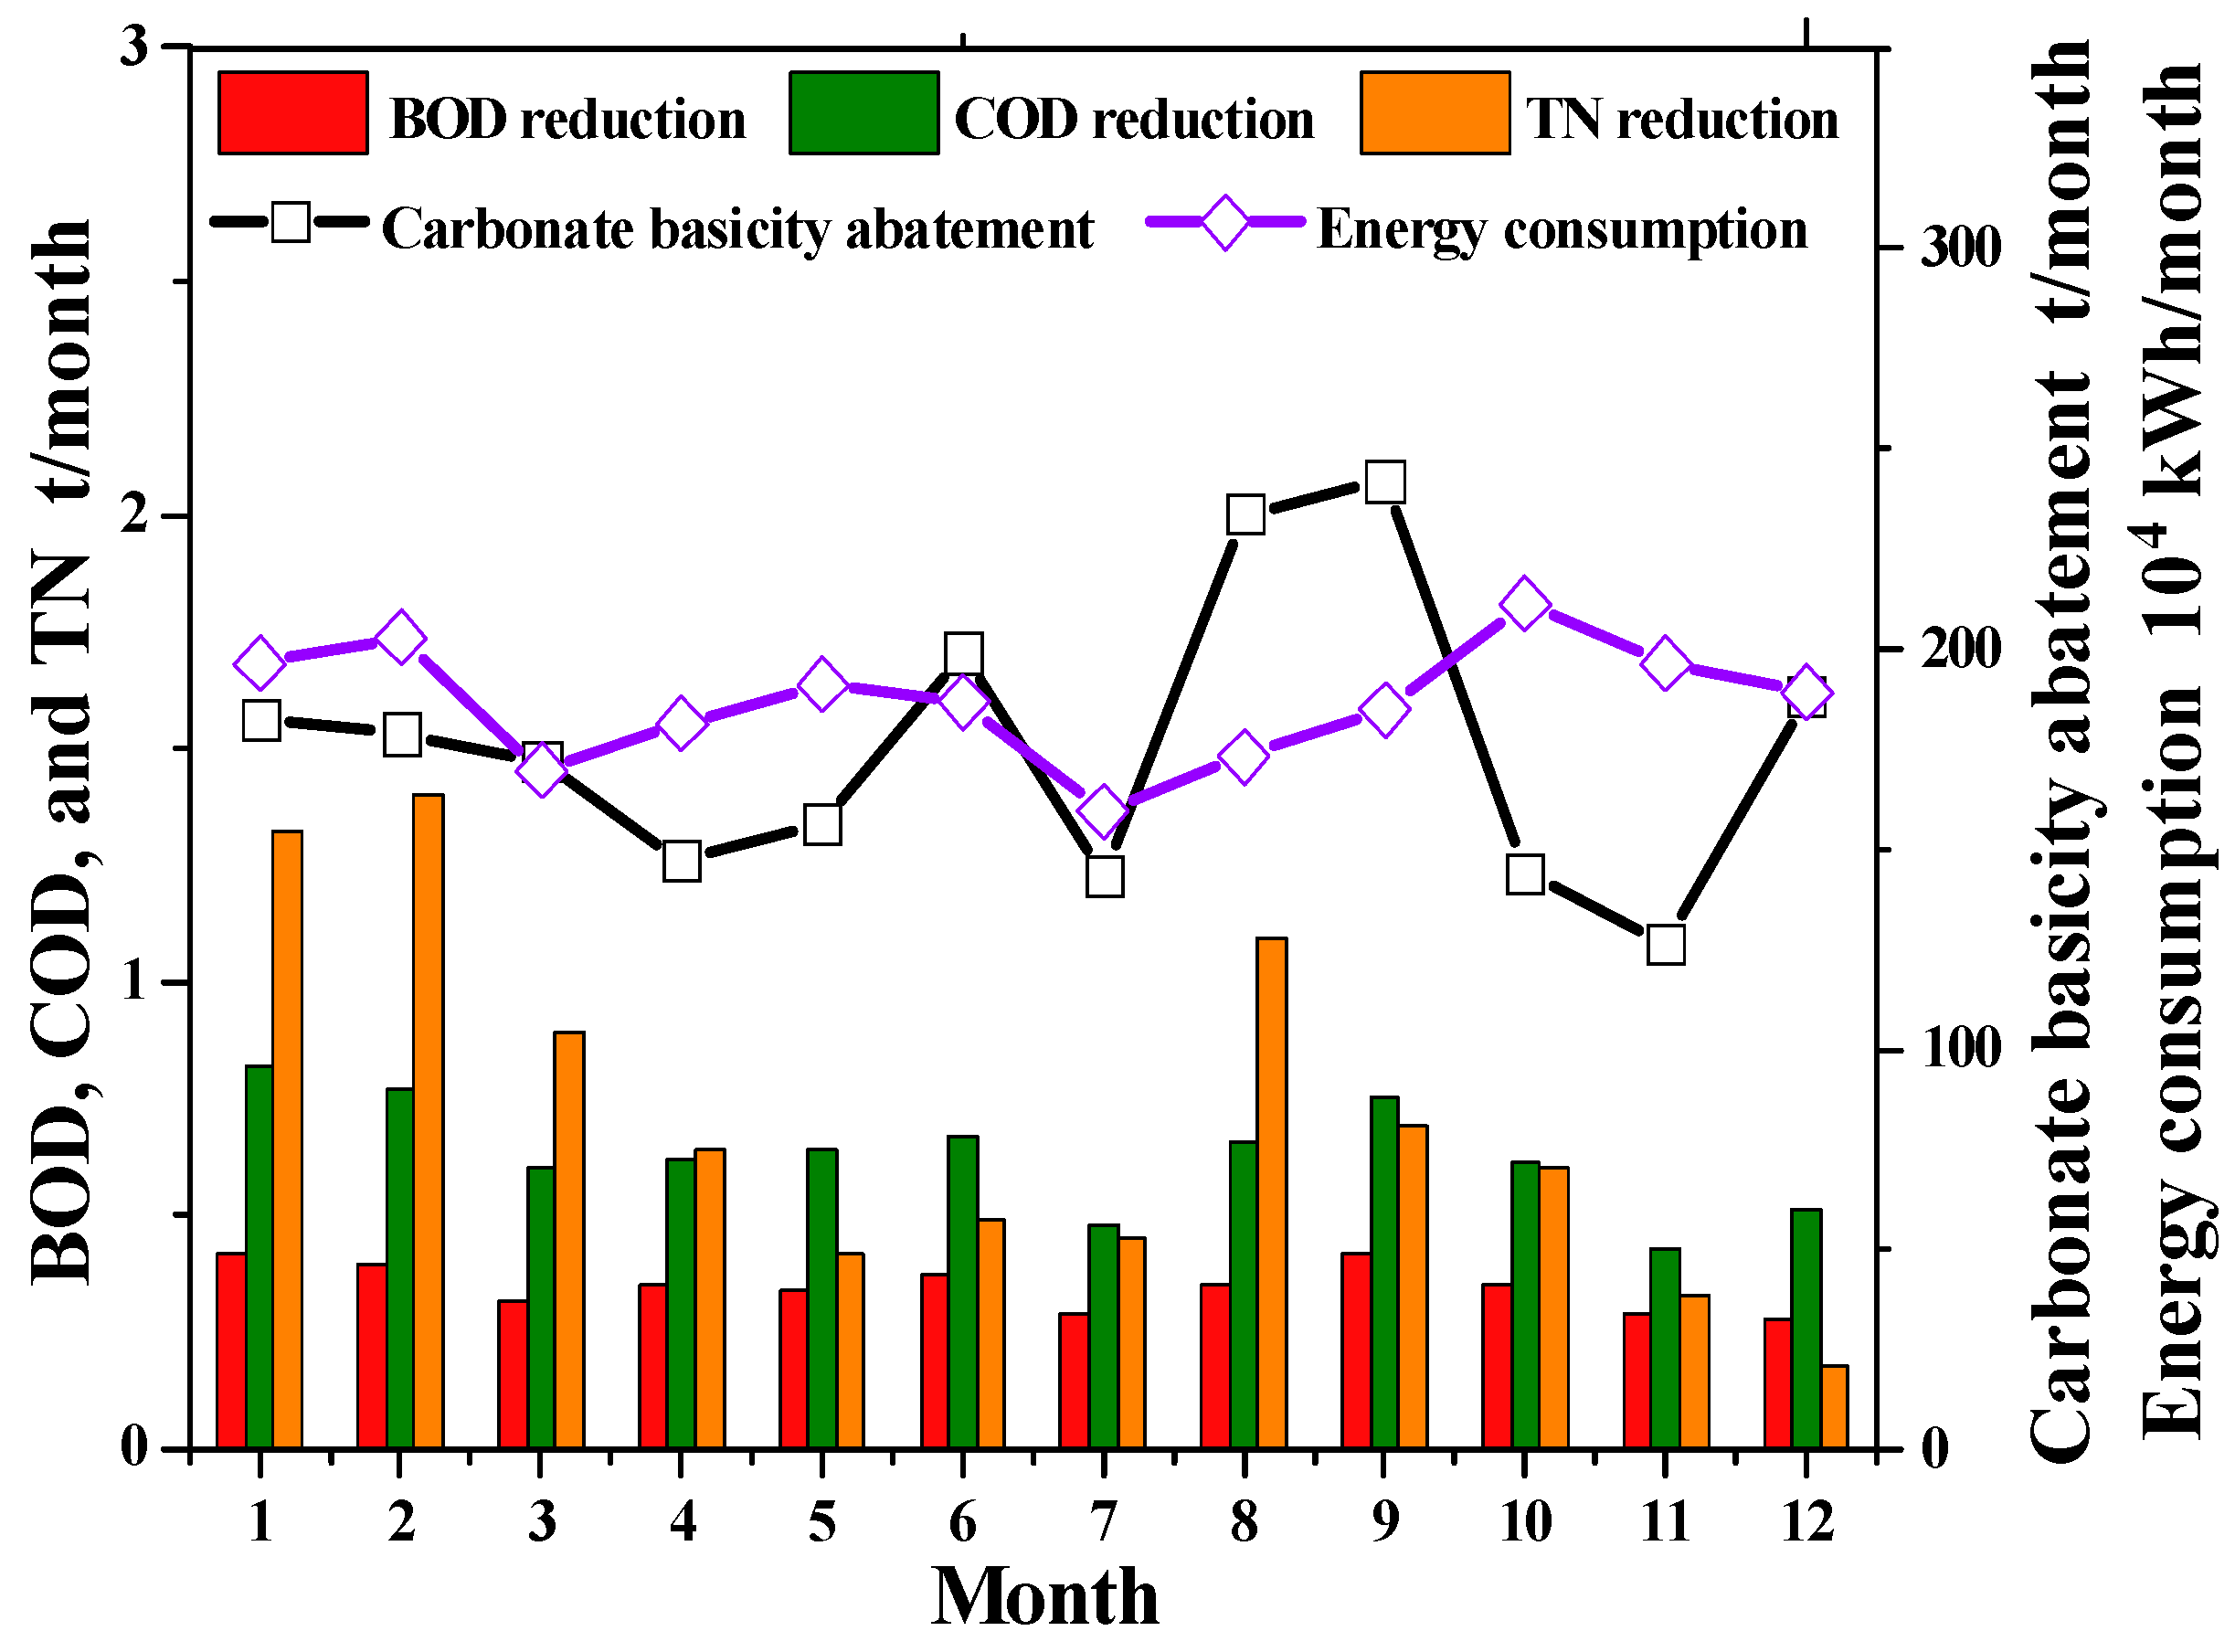
3.1.1. Analysis of Direct Carbon Emission Characteristics of IWWTP

The data of the chemical consumption, energy consumption, wastewater quality, and wastewater quantity of the IWWTP and DWWTP in the high-tech industrial park in 2020 are shown in Figure 3 and Figure 4.
The quality of the influent and effluent wastewater of the IWWTP are presented in Table 2, in terms of the average content of BOD, TN, and carbonate alkali in the influent and effluent of the IWWTP from January to December in 2020. The level of direct carbon emission was calculated by Formulas (1)–(3) and is shown in Table 3.
The direct carbon emissions of the IWWTP were 1621.51 tCO2e in 2020, which were mainly produced by the carbonate alkalinity and acid neutralization reaction and accounts for about 94% of the total carbon emissions (Table 3). Meanwhile, N2O emission made up 5.5% of the total carbon emission; the carbon emission caused by CH4 contributed to the smallest part (0.5%). With the season change, Q3 of the IWWTP contributed the largest portion to direct carbon emissions (471.98 tCO2e); Q4 (as the smallest contribution) only accounted for 244.31 tCO2e. CH4 and N2O emissions continued to decline with the season change.

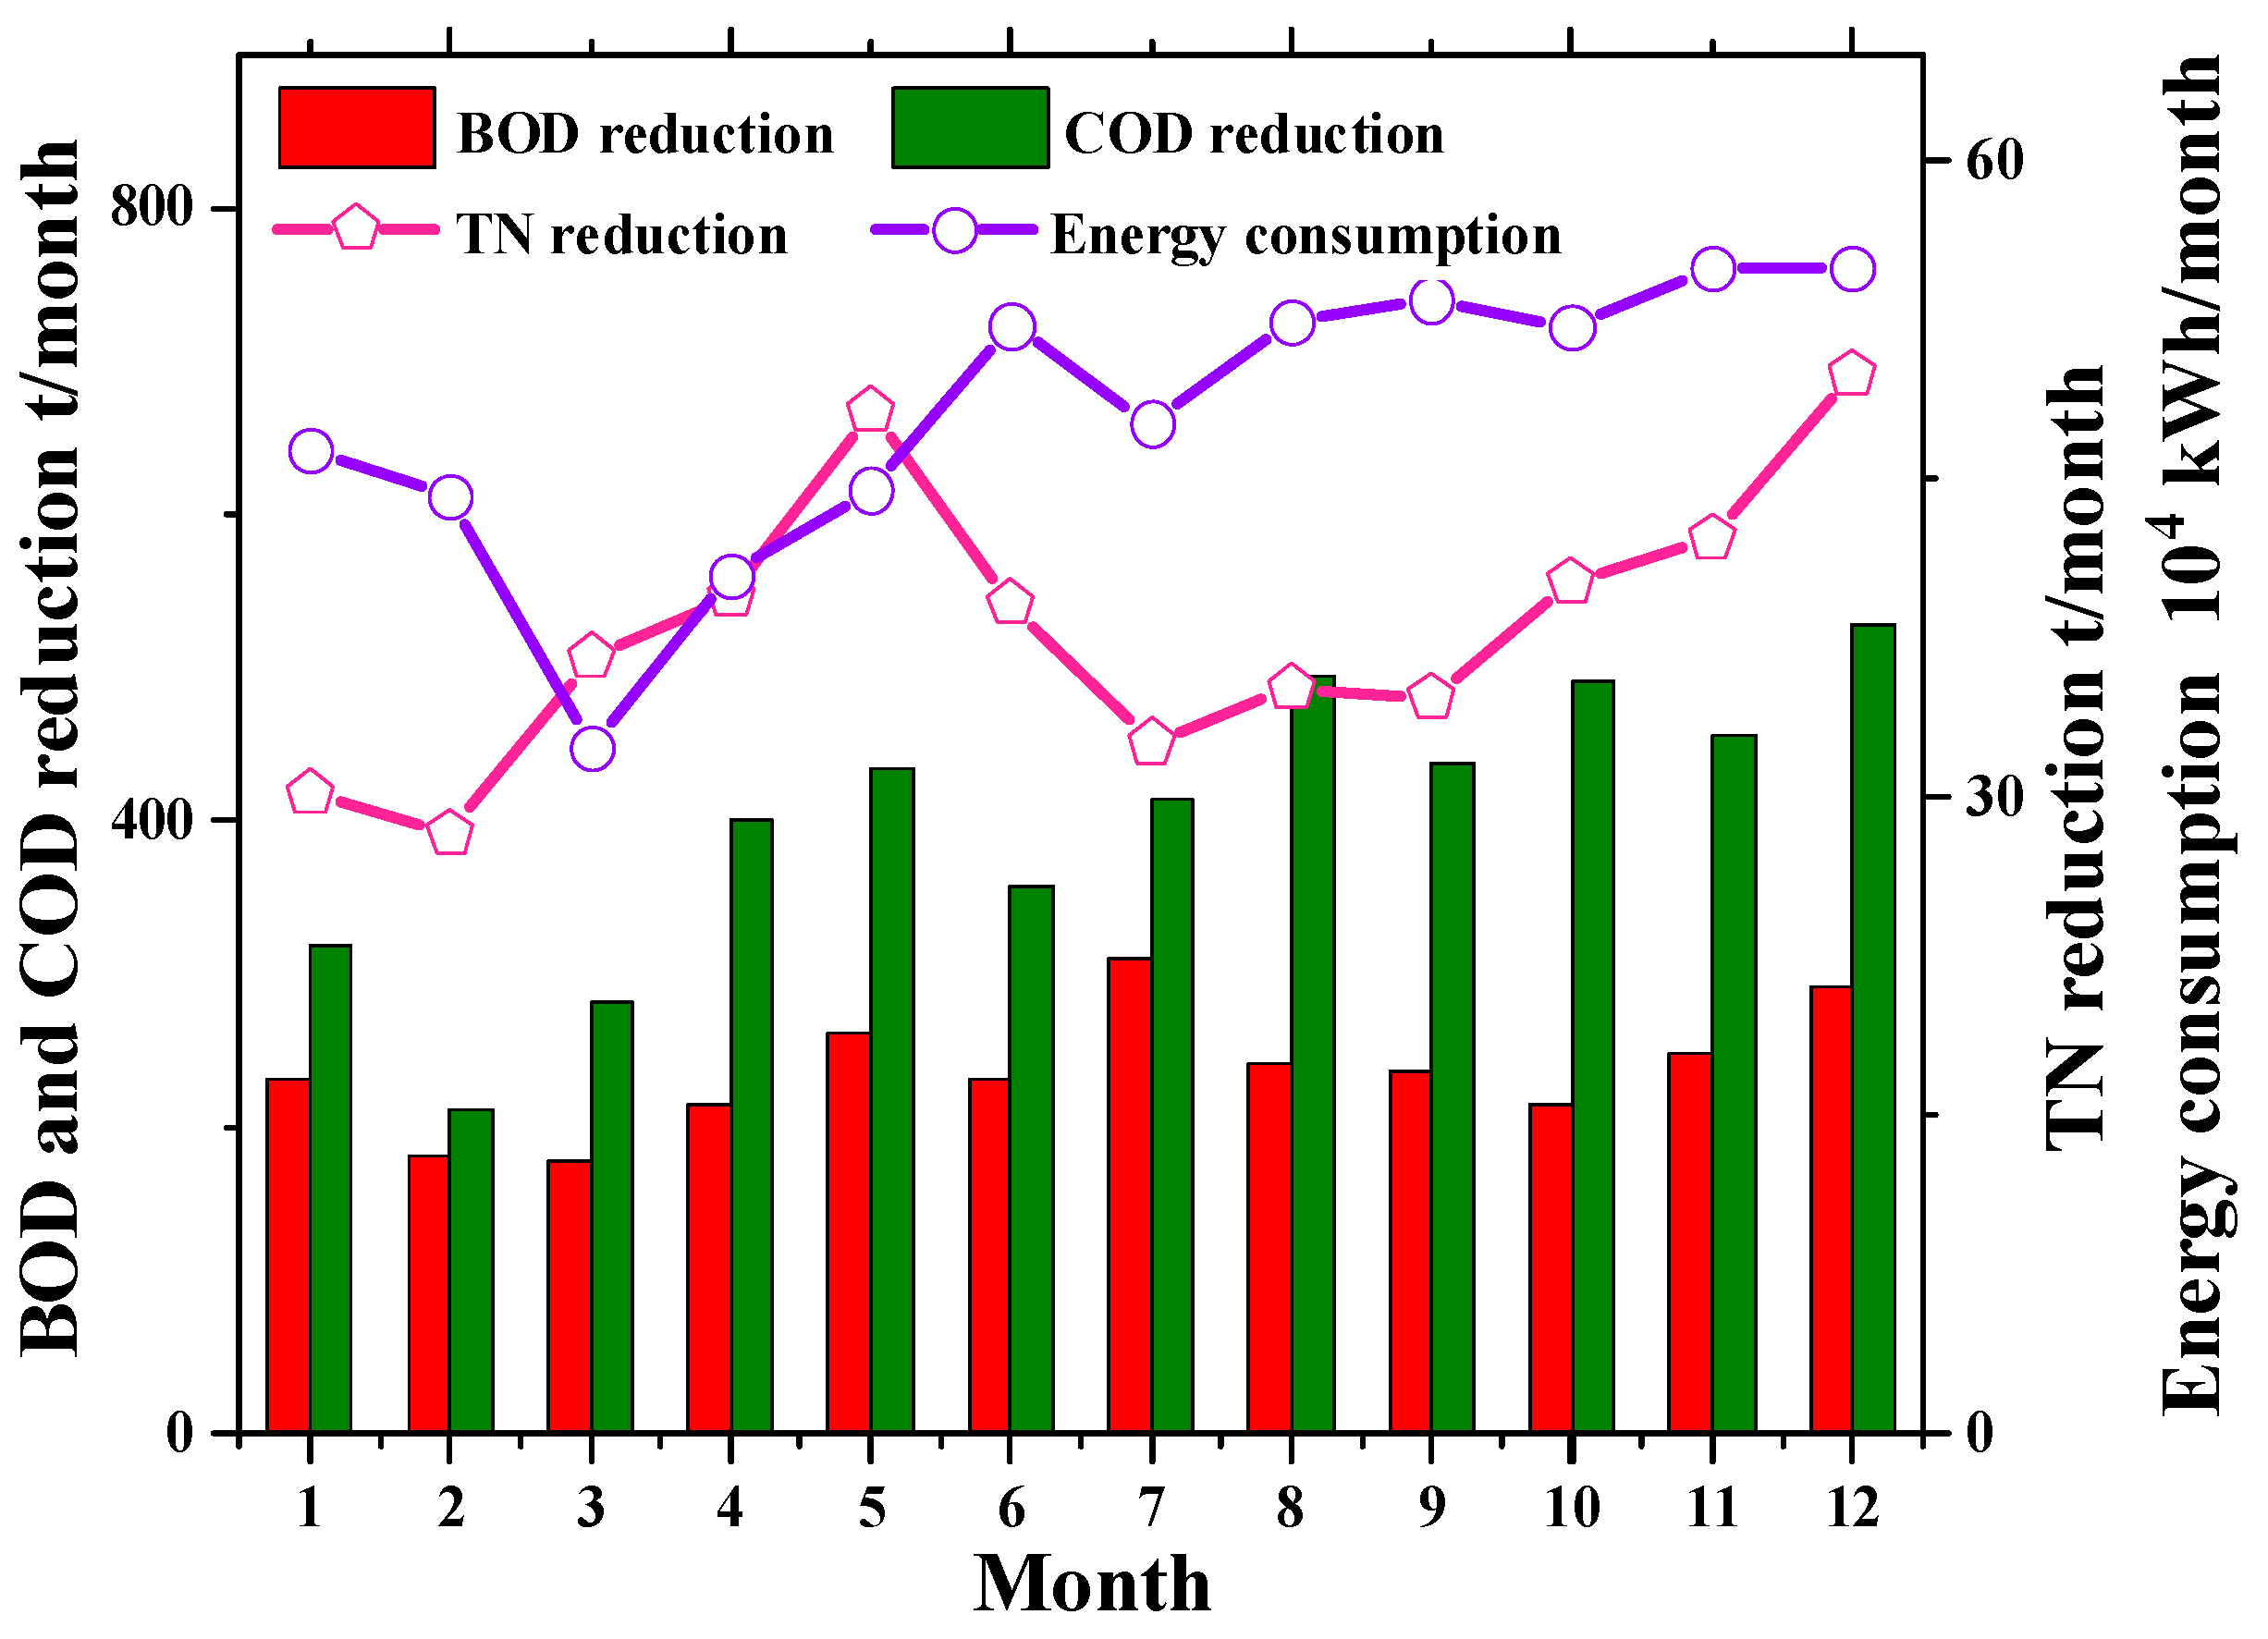
3.1.2. Analysis of Direct Carbon Emission Characteristics of DWWTP

The quality of the influent and effluent wastewater of the DWWTP are presented in Table 4, based on BOD and TN content in the influent and effluent of the DWWTP from January to December 2020. And the direct carbon emission data were calculated according to Formulas (1) and (2) and are shown in Table 5.
The direct carbon emission from the DWWTP was 10,871.94 tCO2e in 2020, which was mainly produced by CH4 carbon emission and accounts for about 56.18% of the direct carbon emission; CH4 carbon emissions were mainly generated by BOD reduction (Table 3). Meanwhile, N2O emission occupied 43.82% of the direct carbon emission. Additionally, the direct carbon emissions had a fluctuating upward trend quarterly, and the contribution of CH4 to carbon emission was higher than that of N2O, which was consistent with previous findings [11].

3.2. Indirect Carbon Emission Accounting

3.2.1. Analysis of Indirect Carbon Emission Characteristics of IWWTP

According to the consumption of electricity and chemicals of the IWWTP in 2020, the level of indirect carbon emission is calculated by Formula (4) and shown in Table 6 and Table S3.
Table 6 shows that the indirect carbon emission of the IWWTP was 65,458.95 tCO2e in 2020. The main contributor to carbon emission was from the consumption of chemicals, accounting for 67.61% of the total indirect carbon emission, and the rest of the indirect carbon emission depended on electricity consumption. In terms of the consumption of chemicals, the carbon emission of the consumption of liquid alkali accounts for the largest proportion of the total amount of indirect carbon emission, which was 46.17%, while hydrochloric acid consumption accounts for 21.05%, and PAM consumption occupies the smallest portion. With the seasons changing, the indirect carbon emissions show a gradual growth trend. Compared to Q3, Q4 was augmented by 2115.78 tCO2e, which is mainly related to the significant increase in liquid alkali and electricity consumption. In comparison, electricity consumption contributed the lowest carbon emissions in Q2 and Q3, which means that the variation in temperature led to a direct impact on electricity consumption.

3.2.2. Analysis of Indirect Carbon Emission Characteristics of DWWTP

Based on electricity and chemical consumption in the DWWTP in 2020, the level of the indirect carbon emission is calculated by Formula (4) and shown in Table 7 and Table S4.
Table 7 shows that the indirect carbon emission of the DWWTP was 6661.63 tCO2e in 2020. The main contributor to carbon emission is the consumption of electric energy, accounting for 81.73%, and the following ones are the consumption of disinfectant (sodium chlorate) and PAM. In the consumption of chemicals of carbon emission, disinfectant consumption accounts for 9.74% as the largest proportion, followed by PAM consumption. With the seasons changing, it can be concluded that Q4 had the largest indirect carbon emission, which was mainly related to the large consumption of electricity and chemicals.

3.3. Carbon Emission Calculation

3.3.1. Analysis of Total Carbon Emission Characteristics of IWWTP

The total carbon emission of 2020 is presented in Figure 5, and the total carbon emissions from the IWWTP were in a fluctuating growth trend from January to September. And the direct and indirect carbon emissions were in positive correlation during this period. However, from October to December, the total carbon emissions were proportional. The peak of both direct carbon emissions and indirect carbon emissions occurred in Nov, which were 6473.03 and 95.41 tCO2e, separately. This phenomenon was mainly related to temperature variation. With the quarterly changes, the direct carbon emissions of the IWWTP in Q4 were the lowest (about 344 tCO2e), while the indirect carbon emissions were the highest in Q4 (which were 18,335 tCO2e).
As presented in Table 2 and Table 3, the total carbon emission from the IWWTP was 67,080.46 tCO2e in 2020, and the carbon emission was 10.13 kg/t (per ton of water). The indirect carbon emission contributed to 97.6% of the total carbon emission.

3.3.2. Analysis of Total Carbon Emission Characteristics of DWWTP

Table 8 presents the total carbon emission of the DWWTP in 2020. The total carbon emission of the DWWTP was 17,533.57 tCO2e in 2020, and the carbon emission was 1.84 kg/t. This is consistent with the previous results (0.95-2.26 kg/t) [10,27]. The direct carbon emission accounts for 62% of the total carbon emission from the DWWTP. With the quarter changing, the total carbon emission shows a fluctuating growth trend. The carbon emission from the DWWTP is inversely proportional to the treated water volume.

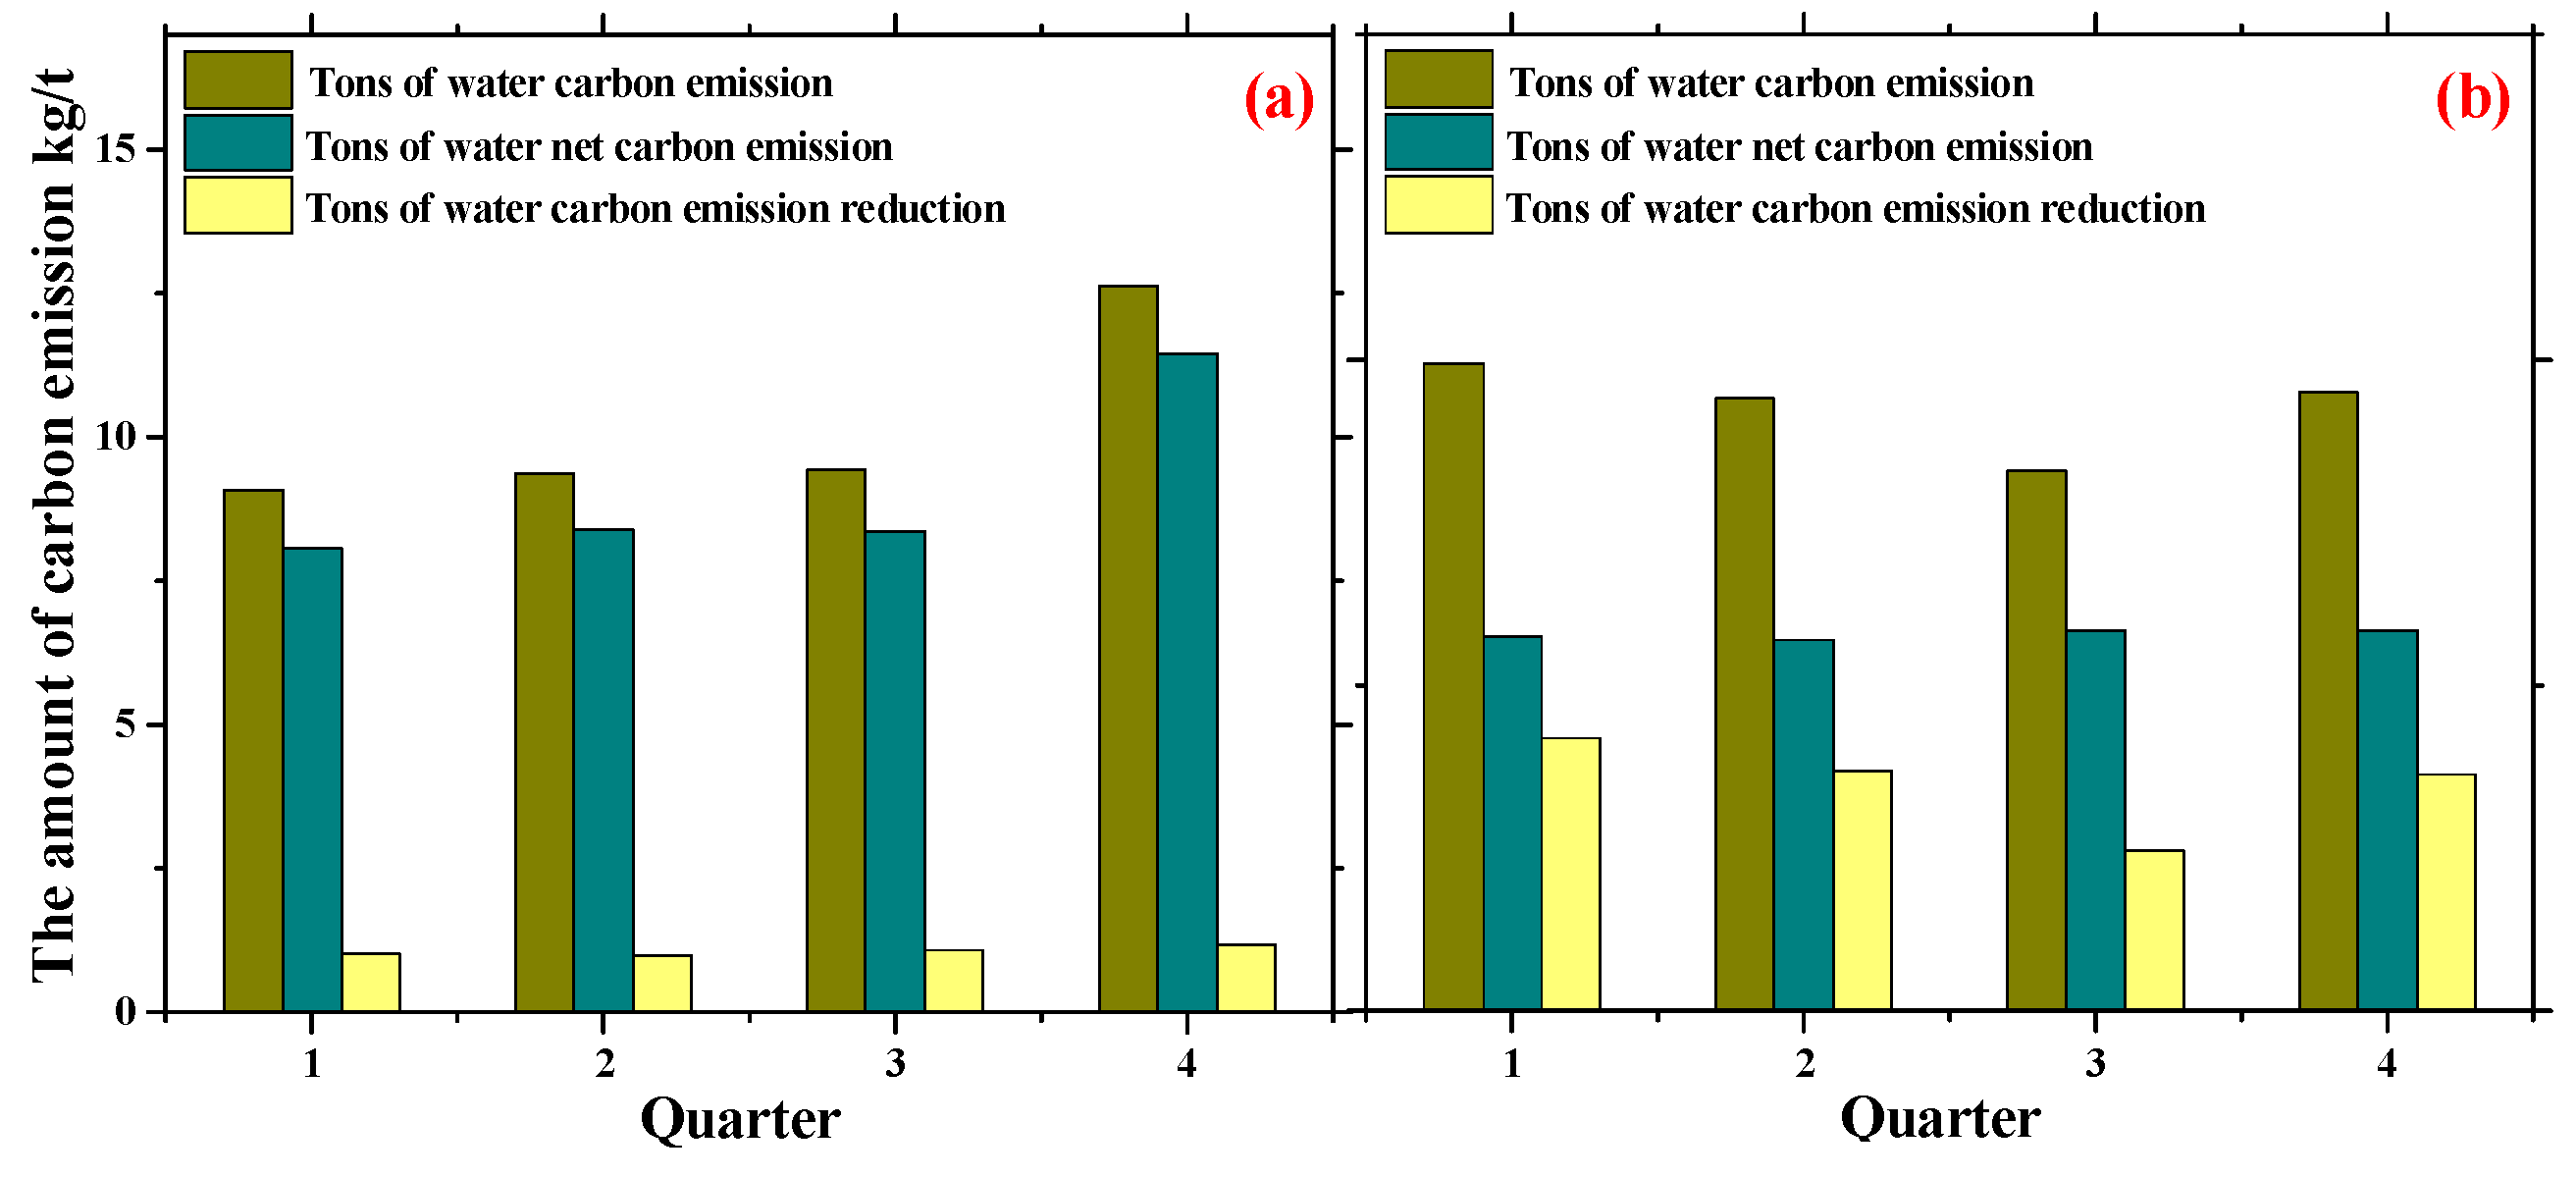
3.4. The Analysis of the Carbon Emission Reduction Effect

Based on the quarterly statistical data of recycled water from the IWWTP and DWWTP in 2020, the reductions in the carbon emission of the two investigated plants are calculated by Formula (5) and shown in Figure 6.
As shown in Figure 6, the carbon emission reduction from both the IWWTP and DWWTP is stable in different seasons, which are 1.06 kg/t and 1.16 kg/t, separately. The average carbon emission is 9.07 kg/t and 0.7 kg/t, respectively. And the carbon emission followed a trend of growth, which was mainly affected by the decline and rise in the quarterly treated water volume of the two plants.
The carbon emission reduction in the DWWTP accounted for about 62.45% of the total carbon emission, significantly 10.46% higher than that of the IWWTP in 2020, which is mainly related to the small carbon emission of the DWWTP. Therefore, reusing recycled water in the DWWTP could substantially reduce carbon emissions, and the extent of carbon emission reduction was significantly higher than that of the IWWTP.

4. Discussion

4.1. Analysis of Carbon Emission Characteristics of Industrial and Domestic Wastewater Treatment

As presented in Table 8, the direct carbon emission of the DWWTP is 4.7 times higher than that of the IWWTP in terms of carbon emission per cubic meter of wastewater in 2020. CH4 carbon emission produced by COD and BOD removal is the major contributing part of the DWWTP, while it only accounts for 0.5% of the IWWTP due to the low content of organic matter in industrial wastewater. Additionally, a large amount of CO2 is produced by the decomposition of carbonate alkalinity in the process of industrial wastewater treatment processes, which accounts for 94% of the total direct carbon emissions.
The indirect carbon emission from the IWWTP is 13.98 times higher than that from the DWWTP in terms of carbon emission per cubic meter of wastewater in 2020 (Table 7). The carbon emission of chemical consumption is the major contributor to carbon emission, followed by that of electricity consumption. In comparison, the carbon emission of electricity consumption from the DWWTP accounts for about 81.73% of the total carbon emission, followed by chemical consumption, which is similar to that reported by [28]. However, Gruber et al. [29] reported that the carbon emissions of electricity consumption account for 43.4% of the total carbon emission. Hence, the contribution of electricity to the carbon emission varies around the world.
In the present study, the chemical consumption of the IWWTP primarily comes from the application of sodium hydroxide and hydrochloric acid. A total of 22.9 thousand tons of chemicals was consumed in 2020, which is far more than the consumption of the DWWTP (7 thousand tons). Furthermore, the electricity consumption (3.5 kW·h/m3) of the IWWTP (75% is from reverse osmosis and evaporation solvent crystallization) was 3.7 times higher than that of the DWWTP, which indicates that high energy consumption and operational cost are the main reasons for the generation of the greenhouse gases of the IWWTP. In the IWWTP, the use of chemical agents accounted for 67.61% of indirect carbon emission. With the seasons changing, the indirect carbon emissions of these two WWTPs in Q4 were larger than those in other periods, which could be achieved by the lowered efficiency of chemicals at low temperature, decreased RO (reverse osmosis) recovery, and increased energy consumption of outdoor equipment in winter [30]. Considering the information in Figure 5 and Table 7, the carbon emission from the IWWTP (10.13 kg/t, indirect carbon emission is 9.79 kg/t) was 5.5 times higher than that from the DWWTP (1.84 kg/t) in 2020. The DWWTP degraded organic contaminants via oxidation, nitrification, and denitrification. Meanwhile, the IWWTP could neutralize and separate the inorganic ion from water via the consumption of chemicals and electricity [31,32]. In addition, the carbon emission of these two WWTPs is inversely proportional to the treated water volume, which is consistent with the results of the carbon emission of some WWTPs in the UK, India, and China [18,33]. This result reflects the importance of centralized wastewater treatment to achieve the reduction in regional carbon emission.

4.2. Benefit Analysis of Carbon Emission Reduction in Industrial and Domestic Wastewater Treatment

Both IWWTPs and DWWTPs have achieved carbon emission reduction after water reclamation and reuse (Figure 6). In 2020, the carbon emission reduction in IWWTPs and DWWTPs accounted for 10.46% and 62.45% of the total carbon emission, respectively. The percentage of carbon emission reduction in the DWWT was higher than that of the IWWTP. In addition, if the recycled water from the DWWTP in the industrial area was at the price of USD 0.7 per m3 (the price of tap water in this area), the DWWTP could earn USD 6 million per year. Hence, developing the recycled water technology of the DWWTP would be helpful to achieve the regional goal of carbon emission reduction and obtain economic benefit as well.

4.3. Strategy Analysis of Carbon Neutralization in Industrial and Domestic Wastewater Treatment

Carbon neutralization is defined as the absorption or neutralization of the total carbon emission in energy conservation and deduction in a specific period in order to balance the carbon emission and carbon absorption in the long term [27]. The recycling of industrial salt and chemical energy could achieve a carbon emission reduction of 4.79 kg/t and 0.12 kg/t, accounting for 52.81% and 17.14% of the net carbon emissions of industrial wastewater treatment plants and domestic wastewater treatment plants. And the transformation of operational processes would be one of the most efficient methods for the reduction in carbon emissions.
The net carbon emission of the IWWTP is 9.07 kg/t (Figure 6). To achieve the goal of carbon neutralization, the solid crystalline impurity salt (such as the sodium chloride and sodium sulfate preparation of industrial salts) produced by the IWWTP could be reduced and recycled by separation and purification; some of this salt could be sold as raw materials for cosmetics and textiles [34]. And then, some of this salt could be refined into industrial products, such as sodium hydroxide, sodium carbonate, and hydrochloric acid, which would be helpful to reduce the demand for external chemicals in WWTPs [20,35], realize self-sufficiency chemicals in the process of sewage treatment, and even transport and sell them. In addition, industrial sewage plants could produce about 20,000 tons of solid heteropoly salt every year. If this salt were separated and purified into industrial sodium chloride and sodium sulfate via the technology of fractional crystallization, then sold to chemical industrial companies at a price of USD 30/ton, the annual profit could be about USD 600,000. At the same time, if the carbon emission factor of the by-product of salt is calculated as 1.6 kg (CO2)/kg (salt), the carbon emission reduction can be 4.79 kg according to Formula (5). More than 52.81% of the carbon emission reduction in the existing IWWTP would be further reduced. Thus, the economic and environmental benefits are significant.
Compared to IWWTPs, the remaining net carbon emission of DWWTPs is small (about 0.7 kg/t), which facilitates the achievement of the carbon neutralization goal. Organic pollutants in DWWTPs contain a large amount of organic chemical energy (about 1.5–1.9 kW·h/m3) by using anaerobic digestion to transfer COD to CH4 and then recycling electricity through coupling heat and power technology [36]. This technology has been applied to WWTPs in Gaobeidian, Beijing. As a result, 14% of chemical energy can be recycled [16], which replaced 18–20% of electricity. H Gülen et al. (2019)’s research found that biogas recovery reduced greenhouse gas emissions, and their highest reduction in indirect carbon emissions was 97%. Therefore, if the chemical energy of the DWWTP can be recycled to replace 20% of the current electricity consumption, the indirect greenhouse emission per ton of water can be reduced by about 0.12 kg/t, and the net carbon emission of the DWWTP will also drop to 0.58 kg/t. Previous studies have shown that microalgae and cyanobacteria can recover nutrients from wastewater and then form biomass energy [2,33,37]. To alleviate the generation of greenhouse gases, biomass energy is used to produce cosmetics, feed, drugs, ethanol, lipids, polysaccharides, and other high-value products [38,39,40,41].

5. Conclusions

This paper calculates and compares the carbon emission characteristics of industrial and domestic WWTPs in a high-tech park in Shaanxi and the benefits of carbon emission reduction in recycled water utilization. The investigation also discusses and analyzes carbon emission reduction approaches (such as recycling industrial waste salt and organic chemical energy) and provides guidelines for realizing the low-carbon operation of WWTPs.
(1)
In the present work, the carbon emissions of the IWWTP and DWWTP were 10.13 kg/t and 1.84 kg/t in 2020, respectively, leading to a corresponding total carbon emission of 67,080.46 and 17,533.57 tCO2e. The huge difference is caused by their varied influent characteristics.
(2)
Indirect carbon emissions (chemical and energy consumption) play a dominant role in the total carbon emission of the IWWTP, which account for about 97.6% of the total amount. Meanwhile, direct carbon emissions account for about 62% of the total carbon emissions in the DWWTP, followed by indirect carbon emissions generated due to electricity consumption (31.06%) and chemical consumption (6.94%).
(3)
Wastewater reclamation and reuse from industrial and domestic WWTPs could reduce the carbon emission per ton of water by 1.06 kg/t and 1.16 kg/t, accounting for about 10.46% and 62.45% of the current emission, respectively. The carbon emission reduction efficiency of the DWWTP is significant. Recycling industrial waste salt and organic chemical energy can further reduce carbon emissions and achieve the goal of the carbon-neutral operation of WWTPs.

Supplementary Materials

The following are available online at https://www.mdpi.com/article/10.3390/w16121652/s1, Table S1. The properties of inflow and effluent in DWWTP; Table S2. The properties of inflow and effluent in IWWTP; Table S3. The factors involved in indirect carbon emissions in DWWTP; Table S4. The factors involved in indirect carbon emissions in IWWTP.

Author Contributions

Conceptualization, Z.L., P.L. and X.Z.; Methodology, X.L., W.X., T.L., S.C. and J.L.; Formal analysis, W.X., S.C., J.L., Z.M. and L.Z.; Investigation, X.L., Z.M. and L.Z.; Data curation, S.C., J.L., Z.M. and L.Z.; Writing—original draft, X.L.; Writing—review & editing, X.Z.; Funding acquisition, X.Z. All authors have read and agreed to the published version of the manuscript.

Funding

This study was financially supported by the National Natural Science Foundation of China (No. 52170053, 52179043) and the National Forestry and Grassland Administration independent research and development program of China (No. LC-6-06), Shaanxi key research plan (2023GXLH-047) and Yulin City Science and technology plan project (YF-2022-197) and Yulin High-tech Zone Science and technology plan project (ZD-2021-08, YGXKG-2022-107).

Data Availability Statement

The original contributions presented in this study are included in the article; further inquiries can be directed to the corresponding authors.

Acknowledgments

The research was conducted by the “Water Saving and Reuse Innovation Team” which is supported by the Educational Department of the Shaanxi Provincial Government under The Youth Innovation Team of Shaanxi Universities.

Conflicts of Interest

The present work has not been submitted elsewhere for publication, in whole or in part, and all the authors listed have approved the submission of the manuscript. Authors Jiajia Li and Ziyao Miao are employed by the company “Yulin High-tech Zone Yuheng No. 1 Industrial Sewage Treatment Company, Yulin coal chemical waste resource utilization and low carbon environmental protection engineering technology research center”. Author Lin Zhang is employed by the company “Yulin Gaoxin Sewage Treatment Co., LTD”. The remaining authors declare that the research was conducted in the absence of any commercial or financial relationships that could be construed as potential conflicts of interest. All the finance-supporting organizations and projects are acknowledged.

References

  1. Vymazal, J.; Zhao, Y.; Mander, Ü. Recent research challenges in constructed wetlands for wastewater treatment: A review. Ecol. Eng. 2021, 169, 106318. [Google Scholar] [CrossRef]
  2. Senatore, V.; Zarra, T.; Pahunang, R.; Oliva, G.; Belgiorno, V.; Ballesteros, F., Jr.; Naddeo, V. Sustainable Odour and Greenhouse Gas Emissions Control in Wastewater Treatment Plant by Advanced Biotechnology-based System. Chem. Eng. Trans. 2021, 85, 25–30. [Google Scholar]
  3. Li, W.-W.; Yu, H.-Q.; Rittmann, B.E. Chemistry: Reuse water pollutants. Nature 2015, 528, 29–31. [Google Scholar] [CrossRef] [PubMed]
  4. Duan, H.; van den Akker, B.; Thwaites, B.J.; Peng, L.; Herman, C.; Pan, Y.; Ni, B.-J.; Watt, S.; Yuan, Z.; Ye, L. Mitigating nitrous oxide emissions at a full-scale wastewater treatment plant. Water Res. 2020, 185, 116196. [Google Scholar] [CrossRef] [PubMed]
  5. Malila, R.; Lehtoranta, S.; Viskari, E.L. The role of source separation in nutrient recovery—Comparison of alternative wastewater treatment systems. J. Clean. Prod. 2019, 219, 350–358. [Google Scholar] [CrossRef]
  6. Pahunang, R.R.; Buonerba, A.; Senatore, V.; Oliva, G.; Ouda, M.; Zarra, T.; Muñoz, R.; Puig, S.; Ballesteros, F.C.; Li, C.-W.; et al. Advances in technological control of greenhouse gas emissions from wastewater in the context of circular economy. Sci. Total Environ. 2021, 792, 148479. [Google Scholar] [CrossRef] [PubMed]
  7. Velazquez Abad, A.; Dodds, P.E. Green hydrogen characterization initiatives: Definitions, standards, guarantees of origin, and challenges. Energy Policy 2020, 138, 111300. [Google Scholar] [CrossRef]
  8. Intergovernmental Panel on Climate Change; Kanagawa, H. 2006 IPCC Guidelines for National Greenhouse Gas Inventories; IPCC: Geneva, Switzerland, 2006. [Google Scholar]
  9. Xi, J.; Gong, H.; Zhang, Y.; Dai, X.; Chen, L. The evaluation of GHG emissions from Shanghai municipal wastewater treatment plants based on IPCC and operational data integrated methods (ODIM). Sci. Total Environ. 2021, 797, 148967. [Google Scholar] [CrossRef]
  10. Yu, J.; Zhao, R.; Xiao, L.; Zhang, L.; Wang, S.; Chuai, X.; Han, Y.; Jiao, S. Carbon emissions of urban wastewater treatment system based on the “water- energy-carbon” nexus. Resour. Sci. 2020, 42, 1052–1062. [Google Scholar] [CrossRef]
  11. Cheng, Z. The Study on Quantitative Evaluation of Carbon Emission in Sewage Treatment System. Master’s Thesis, Xi’an University of Technology, Xi’an, China, 2017. [Google Scholar]
  12. Nguyen, T.K.L.; Ngo, H.H.; Guo, W.; Chang, S.W.; Nguyen, D.D.; Nghiem, L.D.; Liu, Y.; Ni, B.; Hai, F.I. Insight into greenhouse gases emissions from the two popular treatment technologies in municipal wastewater treatment processes. Sci. Total Environ. 2019, 671, 1302–1313. [Google Scholar] [CrossRef]
  13. Dai, X.H. Current status and development trend of sludge treatment and disposal in China. Science 2020, 72, 30–34. [Google Scholar]
  14. Chen, G.; Zhang, R.; Guo, X.; Wu, W.; Guo, Q.; Zhang, Y.; Yan, B. Comparative evaluation on municipal sewage sludge utilization processes for sustainable management in Tibet. Sci. Total Environ. 2021, 765, 142676. [Google Scholar] [CrossRef] [PubMed]
  15. Wei, L.; Zhu, F.; Li, Q.; Xue, C.; Xia, X.; Yu, H.; Zhao, Q.; Jiang, J.; Bai, S. Development, current state and future trends of sludge management in China: Based on exploratory data and CO2-equivaient emissions analysis. Environ. Int. 2020, 144, 106093. [Google Scholar] [CrossRef] [PubMed]
  16. Hao, X.; Li, J.; Van Loosdrecht, M.C.M.; Jiang, H.; Liu, R. Energy recovery from wastewater: Heat over organics. Water Res. 2019, 161, 74–77. [Google Scholar] [CrossRef] [PubMed]
  17. Masłoń, A.; Czarnota, J.; Szczyrba, P.; Szaja, A.; Szulżyk-Cieplak, J.; Łagód, G. Assessment of Energy Self-Sufficiency of Wastewater Treatment Plants—A Case Study from Poland. Energies 2024, 17, 1164. [Google Scholar] [CrossRef]
  18. Hu, Y.; Liang, M.; Zhang, Y.; Wang, K. Study on operation efficiency and carbon emission characteristics of A2/O + MBR process. China Environ. Sci. 2021, 41, 4439–4446. [Google Scholar]
  19. Guo, Y.; Tian, J.; Chen, L. Managing energy infrastructure to decarbonize industrial parks in China. Nat. Commun. 2020, 11, 981. [Google Scholar] [CrossRef]
  20. Yang, Q.; Wang, Y.X.; Cao, X.X.; Liu, X.H.; Zhang, S.Y. Research Progress of Carbon-neutral Operation Technology in Sewage Treatment. J. Beijing Univ. Technol. 2022, 48, 292–305. [Google Scholar]
  21. Demir, Z.; Yapcolu, P. Investigation of GHG emission sources and reducing GHG emissions in a municipal wastewater treatment plan. Greenh. Gases Sci. Technol. 2019, 9, 948–964. [Google Scholar] [CrossRef]
  22. Kang, Z.; Ye, Z.; Hsu, S.-C. Developing an hourly-resolution well-to-wheel carbon dioxide emission inventory of electric vehicles. Resour. Conserv. Recycl. 2023, 190, 106819. [Google Scholar] [CrossRef]
  23. Zhai, G.H.; Zuo, X.F. Spatial differences and influencing factors of carbon emissions from urban wastewater treatment in China. J. Shijiazhuang Tiedao Univ. 2020, 14, 1–10+24. [Google Scholar]
  24. Song, B.M.; Qin, H.P.; Ma, G.Q. Analysis for dynamic changes of wastewater treatment plant carbon emissions in operation phase: With a wastewater treatment plant in Shenzhen as an example. Environ. Sci. Technol. 2015, 38, 204–209. [Google Scholar]
  25. Chen, K.; Wang, H.; Valverde-Pérez, B.; Zhai, S.; Vezzaro, L.; Wang, A. Optimal control towards sustainable wastewater treatment plants based on multi-agent reinforcement learning. Chemosphere 2021, 279, 130498. [Google Scholar] [CrossRef] [PubMed]
  26. Zhang, Z.Y. Engineering design and carbon emission analysis of municipal WWTP under stricter discharge criteria—Case of a WWTP in Ningbo. Water Purif. Technol. 2023, 42, 158–163. [Google Scholar]
  27. Wang, F.; Harindintwali, J.D.; Yuan, Z.; Wang, M.; Wang, F.; Li, S.; Yin, Z.; Huang, L.; Fu, Y.; Li, L.; et al. Technologies and perspectives for achieving carbon neutrality. Innovation 2021, 2, 100180. [Google Scholar] [CrossRef] [PubMed]
  28. Yapcolu, P. Minimization of greenhouse gas emissions from extended aeration activated sludge process. Water Pract. Technol. 2021, 16, 96–107. [Google Scholar]
  29. Gruber, W.; Niederdorfer, R.; Ringwald, J.; Morgenroth, E.; Bürgmann, H.; Joss, A. Linking seasonal N2O emissions and nitrification failures to microbial dynamics in a SBR wastewater treatment plant. Water Res. X 2021, 11, 100098. [Google Scholar] [CrossRef] [PubMed]
  30. Jing, B.Y.; Shi, Y.T.; Chen, Z. Application of Membrane Separation Technology in Advanced Treatment of High Salt Mine Water. Coal Eng. 2019, 51, 47–51. [Google Scholar]
  31. Suo, Y.; Ren, Y.J. Research on the mechanism of nanofiltration membrane fouling in zero discharge process of high salty wastewater from coal chemical industry. Chem. Eng. Sci. 2021, 245, 116810. [Google Scholar] [CrossRef]
  32. Guo, L.; Xie, Y.; Sun, W.; Xu, Y.; Sun, Y. Research Progress of High-Salinity Wastewater Treatment Technology. Water 2023, 15, 684. [Google Scholar] [CrossRef]
  33. Singh, J.; Dhar, D.W. Overview of Carbon Capture Technology: Microalgal Biorefinery Concept and State-of-the-Art. Front. Matine Sci. 2019, 6, 29. [Google Scholar] [CrossRef]
  34. Shtull-Trauring, E.; Cohen, A.; Ben-Hur, M.; Tanny, J.; Bernstein, N. Reducing salinity of treated waste water with large scale desalination. Water Res. 2020, 186, 116322. [Google Scholar] [CrossRef] [PubMed]
  35. Kang, B.L.; Kang, D.X.; Rong, Z.Y.; Zhang, R.M.; Sui, B.J. Separation of Lithium Sulfate and Recovery of Acid and Base by Three-compartment Membrane Electrodialysis. Technol. Water Treat. 2022, 10, 72–76+81. [Google Scholar]
  36. Sarpong, G.; Gude, V.G.; Magbanua, B.S.; Truax, D.D. Evaluation of energy recovery potential in wastewater treatment based on codigestion and combined heat and power schemes. Energy Convers. Manag. 2020, 222, 113147. [Google Scholar] [CrossRef]
  37. Rueda, E.; García-Galán, M.J.; Díez-Montero, R.; Vila, J.; Grifoll, M.; García, J. Polyhydroxybutyrate and glycogen production in photobioreactors inoculated with wastewater borne cyanobacteria monocultures. Bioresour. Technol. 2020, 295, 122233. [Google Scholar] [CrossRef] [PubMed]
  38. Almomani, F.; Al Ketife, A.; Judd, S.; Shurair, M.; Bhosale, R.R.; Znad, H.; Tawalbeh, M. Impact of CO2 concentration and ambient conditions on microalgal growth and nutrient removal from wastewater by a photobioreactor. Sci. Total Environ. 2019, 662, 662–671. [Google Scholar] [CrossRef] [PubMed]
  39. Barboríková, J.; Šutovská, M.; Kazimierová, I.; Jošková, M.; Fraňová, S.; Kopecký, J.; Capek, P. Extracellular polysaccharide produced by Chlorella vulgaris—Chemical characterization and anti-asthmatic profile. Int. J. Biol. Macromol. 2019, 135, 1–11. [Google Scholar] [CrossRef]
  40. Molazadeh, M.; Ahmadzadeh, H.; Pourianfar, H.R.; Lyon, S.; Rampelotto, P.H. The Use of Microalgae for Coupling Wastewater Treatment with CO2 Biofixation. Front. Bioeng. Biotechnol. 2019, 7, 42. [Google Scholar] [CrossRef]
  41. Yadav, G.; Dash, S.K.; Sen, R. A biorefinery for valorization of industrial waste-water and flue gas by microalgae for waste mitigation, carbon-dioxide sequestration and algal biomass production. Sci. Total Environ. 2019, 688, 129–135. [Google Scholar] [CrossRef]
Figure 1. The operational processes of the IWWTP.
Water 16 01652 g001
Figure 2. The operational processes of the DWWTP.
Water 16 01652 g002
Figure 3. Variation in TN, BOD, COD, alkalinity, and electricity consumption in IWWTP from January to December.
Water 16 01652 g003
Figure 4. The change in TN, BOD, COD, and electricity consumption in the DWWTP from January to December.
Water 16 01652 g004
Figure 5. The variation in the total amount of carbon emission in the IWWTP in 2020.
Water 16 01652 g005
Figure 6. Variation in carbon emission and reduction with quarter: (a) IWWTP and (b) DWWTP.
Water 16 01652 g006
Table 1. Wastewater capacity for IWWTP and DWWTP in 2020.
MonthIWWTP (×104 m3)DWWTP (×104 m3)
166.713968.485
258.385350.443
354.245364.163
458.895673.127
550.838481.678
654.850183.109
746.573291.719
862.41992.397
967.907188.735
1054.146486.85
1146.66684.894
1246.91385.535
Table 2. Quality of influent and effluent wastewater of IWWTP in 2020 (mg/L).
CODHCO3BOD5TN
InfluentEffluentInfluentEffluentInfluentEffluentInfluentEffluent
30.43 ± 5.52.22 ±1.6328.29 ± 60.112.26 ± 4.06.05 ± 2.45.49 ± 2.2438.50 ± 83.672.00 ± 13.7
Table 3. The data of direct carbon emission in the IWWTP in 2020 (t CO2e).
QuarterCH4N2OCO2Direct Carbon Emission
12.4237.66384.34424.42
22.2816.25362.27380.80
32.2823.19446.51471.98
41.9711.57330.78344.31
Sum8.9588.671523.901621.51
Table 4. Quality of influent and effluent wastewater of DWWTP in 2020 (mg/L).
CODBOD5TN
InfluentEffluentInfluentEffluentInfluentEffluent
523.80 ± 10321.13 ± 3.9271.44 ± 563.13 ± 1.961.93 ± 2413.22 ± 2.7
Table 5. Direct carbon emission in the DWWTP in 2020 (t CO2e).
QuarterCH4N2ODirect Carbon Emission
11268.62992.152260.77
21521.121323.732844.85
31693.361068.542761.91
41624.541379.883004.42
Sum6107.644764.3010,871.94
Table 6. The date of indirect carbon emission in the IWWTP in 2020 (t CO2e).
QuarterElectricityChemical AdditionIndirect Carbon Emission
NaOHCoagulationHClSum
15378.597029.9359.383396.0110,485.3115,863.90
25286.076830.9665.632858.479755.0615,041.14
34893.977729.5671.883523.6611,325.0916,219.06
45643.348630.7861.253999.4812,691.5118,334.84
Sum21,201.9730,221.24258.1313,777.6244,256.9865,458.95
Table 7. Indirect carbon emission in the DWWTP in 2020 (t CO2e).
QuarterElectricityChemical AdditionIndirect Carbon Emission
PAMDisinfectantSum
11162.62101.88110.61212.491375.11
21297.45157.25175.59332.841630.29
31451.76125.00184.44309.441761.20
41532.62184.50177.91362.411895.03
sum5444.45568.63648.551217.186661.63
Table 8. The total amount of carbon emission in 2020.
QuarterDirect Carbon Emission/tIndirect Carbon Emission/tTreated Volume/10,000 m3Carbon Emission per Ton Water kg/t
IWWTPDWWTPIWWTPDWWTPIWWTPDWWTPIWWTPDWWTP
1424.422260.7715,863.901375.11179.34183.099.081.99
2380.802844.8515,041.141630.29164.58237.919.371.88
3471.982761.9116,219.061761.20176.90272.859.441.66
4344.313004.4218,334.841895.03147.73257.2812.641.90
Sum1621.5110,871.9465,458.956661.63668.55951.1410.131.84
Disclaimer/Publisher’s Note: The statements, opinions and data contained in all publications are solely those of the individual author(s) and contributor(s) and not of MDPI and/or the editor(s). MDPI and/or the editor(s) disclaim responsibility for any injury to people or property resulting from any ideas, methods, instructions or products referred to in the content.

