Abstract
The breakdown of dyes, which are environmentally hazardous substances and notoriously difficult to degrade, presents the main treatment challenge for wastewater from textile industries. Most advanced oxidation processes (AOPs) for dye degradation usually use costly decolorizing agents, whose residue from Wastewater Treatment Plants may be hazardous to the environment. The present study aimed to apply ultrafine bubbles (UFBs) for water AOPs to degrade textile dyes. Our most recent innovation, ultrafine bubbles, enables the production of reactive oxygen species recently introduced as oxidants in AOPs. First, the disc diffuser was optimized by introducing various flow rates of 1–5 L Per Minute (LPM) to generate UFBs with unique characteristics observed from Zeta Potential, pH, Dissolved Oxygen (DO), and Oxidation–Reduction Potential (ORP). The air UFBs using a disc diffuser with 3 LPM were selected to degrade the Navacron Ruby S-3B dye solution (1000 Pt-Co). The treatment was optimized on the coagulant dosage (0.25, 0.5, 0.75, and 1 ppm) and bubbling times (0–120 min). As a result, the UFBs were successful in degrading the Navacron Ruby S-3B dye solution, resulting in a 45% reduction in Pt-Co color scale with a bubbling time of only 120 min and minimal coagulant dosage (0.5 ppm) compared to the Navacron Ruby S-3B dye solution treatment commonly using a coagulant dosage of 1.5 ppm without UFBs. Based on FTIR, XRF, and PL analysis, we propose the AOP mechanism of hydroxyl radicals for the Navacron Ruby S-3B dye solution. It is emphasized that UFB water AOPs (UFBs–WAOPs) represent a promising alternative technology for treating textile wastewater without chemicals or decolorizing agents. Thus, the UFBs-WAOPs are economical and environmentally benign textile wastewater treatment methods.
1. Introduction
The textile industry is believed to be the second biggest global polluter of water. The textile industry is one of the most valuable industries because it employs a significant portion of the labor force, especially in developing countries. Nevertheless, the expansion of the textile industry is a result of growing environmental concerns [1]. Dyes known to be challenging to degrade are typically handled in the Fenton Process using Advanced Oxidation Processes (AOPs) [2]. AOPs refer to various technical procedures that produce OH radicals to sufficiently oxidize wastewater, organic pollutant streams, and toxic effluents from industrial, hospital, pharmaceutical, and municipal wastes [3]. Ozone, radiation, photolysis, photocatalysis, sonolysis, and electrochemical oxidation technologies are the foundations of water AOPs [4]. However, there is a risk to human health and the environment when chemical degradation and ozone oxidation are utilized in AOPs. Furthermore, the costly and ineffective production process of oxidation with ozone limits its application in industries [5]. Therefore, an alternative, more efficient, affordable, and environmentally friendly technological approach is needed to degrade dyes and textile waste.
Textile waste has high levels of alkalinity, TDSs (Total Dissolved Solids), BOD (Bio-chemical Oxygen Demand), and dyes. Liquid textile waste is highly toxic due to the presence of heavy metals (copper, arsenic, lead, cadmium, mercury, nickel, and cobalt), sulfur, naphthol, dyes, nitrates, acetic acid, soap, and chromium compounds. Hydro-carbon-based softeners, dyes with a low decomposition rate, and formaldehyde dye binders are some other hazardous substances that may be present in the water. Aside from that, the most challenging kind of waste to handle is the dye content because it is hard to break down [6]. The primary source of color in textile wastewater is the dyes used in the printing or dyeing process [1]. As a result, dyes from waste from the textile industry pose a significant issue for textile Wastewater Treatment Plants (WWTPs) [6], typically resolved using chemicals known as decolorizing agents (DCAs). DCA residual from WWTPs is costly and harmful to the environment. The efficient and effective removal of dyes from textile industry waste remains a significant environmental challenge. Therefore, to overcome these obstacles, advanced technology must be introduced [7].
Due to their broad color spectrum, increased fastness (i.e., resistance to color fading), and application versatility, reactive dyes are the most widely used dyes in the textile industry [1]. Several conventional physical, chemical, and biological treatments are used to speed up dye breakdown and reduce sludge [8]. The textile industry’s liquid waste processing technology has advanced since 1995, starting with conventional chemical oxidation, activated carbon, coagulation–flocculation, and other decolorization methods. The DAF (Dissolve Air Flotation) system is the result of ongoing research and development on microbubble flotation technology. It was first introduced in 2010 and is currently being used to process liquid waste from the textile industry. According to research on microbubble flotation with coagulation for wastewater dyeing, microbubbles can significantly increase coagulants’ effectiveness [9].
Recent developments in AOP technology utilize microbubbles (MBs) and nanobubbles (NBs) to enable the generation of reactive oxygen species. Microbubbles and nanobubbles (MNBs) are tiny bubbles with a respective diameter of 10–50 µm and <200 nm [10]. Ultrafine bubbles (UFBs), sometimes called nanobubbles, are defined as gas bubbles with a volume-equivalent diameter of less than 1 µm in ISO 20480-1:2017 [11]. Ultrafine bubble-based water AOPs (UFBs–WAOPs) are capable of sufficiently producing OH radicals to oxidize dyes in textile wastewater [5,12,13].
In 2019, the waste processing industry started utilizing nanotechnology, specifically nanobubble technology, as an alternative to water AOPs. According to research by Nikolay et al. (2019), dye adsorption was at the water air interface. This adsorption was significantly influenced by the difference between the potentials of H+ and OH− and the pH, which substantially influenced the affinity of HO− and H+ consequently affecting the dye’s ionization [8]. The potential to exploit the unique properties of NBs for improving water treatment is their ability to produce quasi-stable reactive oxygen species (ROS) on the surface of NBs to oxidize pollutants and pathogens in water. ROS production by NBs may hold tremendous promise for water treatment because it allows movement away from chemical-based oxidants (chlorine, ozone) that are costly, dangerous to handle, and produce harmful byproducts while helping achieve important treatment goals [14].
Furthermore, NB-enriched water has unique physicochemical properties compared to water without NBs [15]. Nanobubbles present high mass transfer efficiency and oxidation ability because of the increased gas–liquid contact area and the generation of hydroxyl radicals when collapsing [16,17,18]. Well-known properties of fine bubbles include the following: extremely slow rise velocity, large surface area, fine bubbles (micro/nanobubbles) are electrostatically charged, surface adsorption, acoustic properties (sono–chemistry), radical formation induced by bubble collapse, and long life of nanobubbles. However, to the authors’ best knowledge, there is no study investigating the application of ultrafine bubbles in AOPs for textile wastewater treatment in combination with well-known flotation technology or the fundamental mechanisms of the decolorization of dyes in textiles. Therefore, the present study aimed to investigate hydroxyl radical-based advanced water oxidation processes of red reactive dyes by UFBs using a disc diffuser generator. The characteristics of the disc diffuser were evaluated during the generation of UFBs. The performance of UFBs was deeply investigated on the degradation of red reactive dyes at various flowrates of air inflow to the disc diffuser, coagulant dosage, and bubbling times.
2. Materials and Methods
2.1. Materials
The following commercially available chemicals were used to test color: Navacron Ruby S-3B or IUPAC nomenclature 4-(4-chloro-6(ethyl- [3-2(2-sulfooxy-ethane sulfonyl)-amino]-(1,2,3)triazin-2@(amino)-5-hydroxy-7-sulfino-6-(1-sulfo-naphthalene-2@(azo)-naphthalene-2-sulfonic acid sodium salt sodium chloride) from PT. Huntsman Indonesia, Jakarta Timur, Indonesia, coagulant Al2(SO4)3·18H2O (Alum), and distilled water purchased from CV. Dwilab Indonesia, Bandung, Indonesia.
2.2. Methods
2.2.1. Diffuser Performance Test
The air flow rate produced by the compressor was regulated using a flow meter before entering the disc diffuser (Figure 1). After installing the flow meter, a pressure gauge was established in the inlet of the disc diffuser. The disc diffuser was tested by varying the air flow rate: 1, 2, 3, 4, and 5 LPM. Each flow rate indicated a specific pressure, and the plume characteristic created by the disc diffuser was investigated [19].
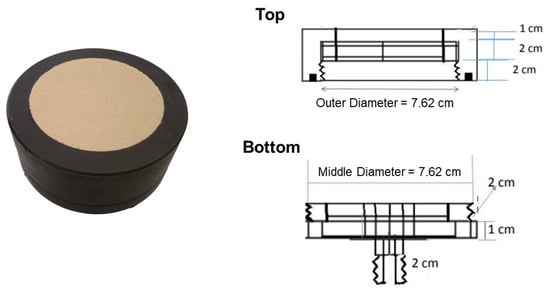
Figure 1.
The picture and corresponding diagram of the disc diffuser.
2.2.2. Bubble Test with Distilled Water
The goal of this bubbling test was to produce the UFBs. At this point, the distilled water was subjected to bubbling with a disc diffuser by varying the air flow rate for two hours. Every thirty minutes, a sample was recorded to analyze the size and distribution of the UFBs using PSA and Zeta Potential (SZ-100 Horiba, Kyoto, Japan), air quality using DO parameters (DO meter Milwaukee MW600, Milwaukee Instruments, Inc., Rocky Mount, NC, USA), pH (Milwaukee MW101, Milwaukee Instruments, Inc., Rocky Mount, NC, USA), ORP (Lutron Water Quality meter WA-2017SD), and TDS (Milwaukee MW802, Milwaukee Instruments, Inc., Rocky Mount, NC, USA).
The basic method for measuring ultrafine bubbles by dynamic light scattering on the SZ-100 Horiba is as follows. In a sample (ultrafine bubbles), particles move in a Brownian motion (random motion). When laser light enters the sample (ultrafine bubbles), the light is scattered by the particles. When the phases of the light scattered by each particle are the same, the intensity of the detected scattered light becomes strong. When the phases are opposite, they cancel each other out. Then, the scattered light intensity fluctuates. For particles, the speed depends on the particle size (diffusion constant) due to the Brownian motion, so the size can be calculated using the autocorrelation function. By analyzing the measurement data, the particle size distribution in the sample can be determined. As a calculation method, the cumulant method is the most common and only method recommended in ISO. It is a moment expansion method. The second method is the histogram method. It simply slices the distribution into small histogram elements to reconstruct it and gives the mean and standard deviation of the distribution [20].
2.2.3. Properties of Dyes and Coagulants
The properties of dyes and coagulants were analyzed using FTIR (iD5 ATR, Nicolet iS5, Thermo Scientific, Waltham, MA, USA) and XRF (Rigaku NeX CG, Tokyo, Japan). The dye concentration was measured using the calibrated Pt-Co Scale (Platinum Cobalt Scale). Moreover, the solutions under investigation were measured for their pH and ORP.
2.2.4. Determination of the Optimal Coagulation Dosage
The ideal coagulant dosage was determined for with and without bubbling dye solutions. The coagulant concentration was varied in the case of dye solutions without bubbling: 0, 0.25, 0.5, 0.75, 1, 1.25, 1.5, 1.75, 2, 2.25, and 2.50 ppm. The coagulant concentration was varied for dye solutions with bubbling: 0, 0.25, 0.5, and 1 ppm. After adding the coagulant, the solution was stirred for 1 min at 200 rpm using a magnetic stirrer and then for 30 min at 80 rpm. The measurements were conducted for various waste parameters: Pt-Co (HACH DR900 colorimetry), TSS (Total Suspended Solid) (HACH DR900 colorimetry), TDS (Milwaukee MW802), ORP (Lutron Water Quality meter WA-2017SD), and pH (Milwaukee MW101).
2.2.5. Treatment of Dyes
The treatment variants in this experiment were a solution of dyes without treatment as a standard or control representing the initial textile waste under investigation, dye solution with an additional coagulant, dye solution treated with air bubbling, and, finally, dye solution treated with both coagulant and air bubbling. Sampling was conducted every 30 min over 2 h with three sampling points at heights 10, 18, and 26 cm from the bottom of the reactor (named level throughout the manuscript). The parameters for the wastewater analysis were water quality (Pt-Co, TSS, ORP, TDS), particle size and distribution using PSA (SZ-100 Horiba, Kyoto, Japan), FTIR spectrometry (iD5 ATR, Nicolet iS5, Thermo Scientific, Waltham, MA, USA) in the wave number range of 2500–500 cm−1 at room temperature, and X-ray fluorescence (XRF, Rigaku NeX CG, Tokyo, Japan).
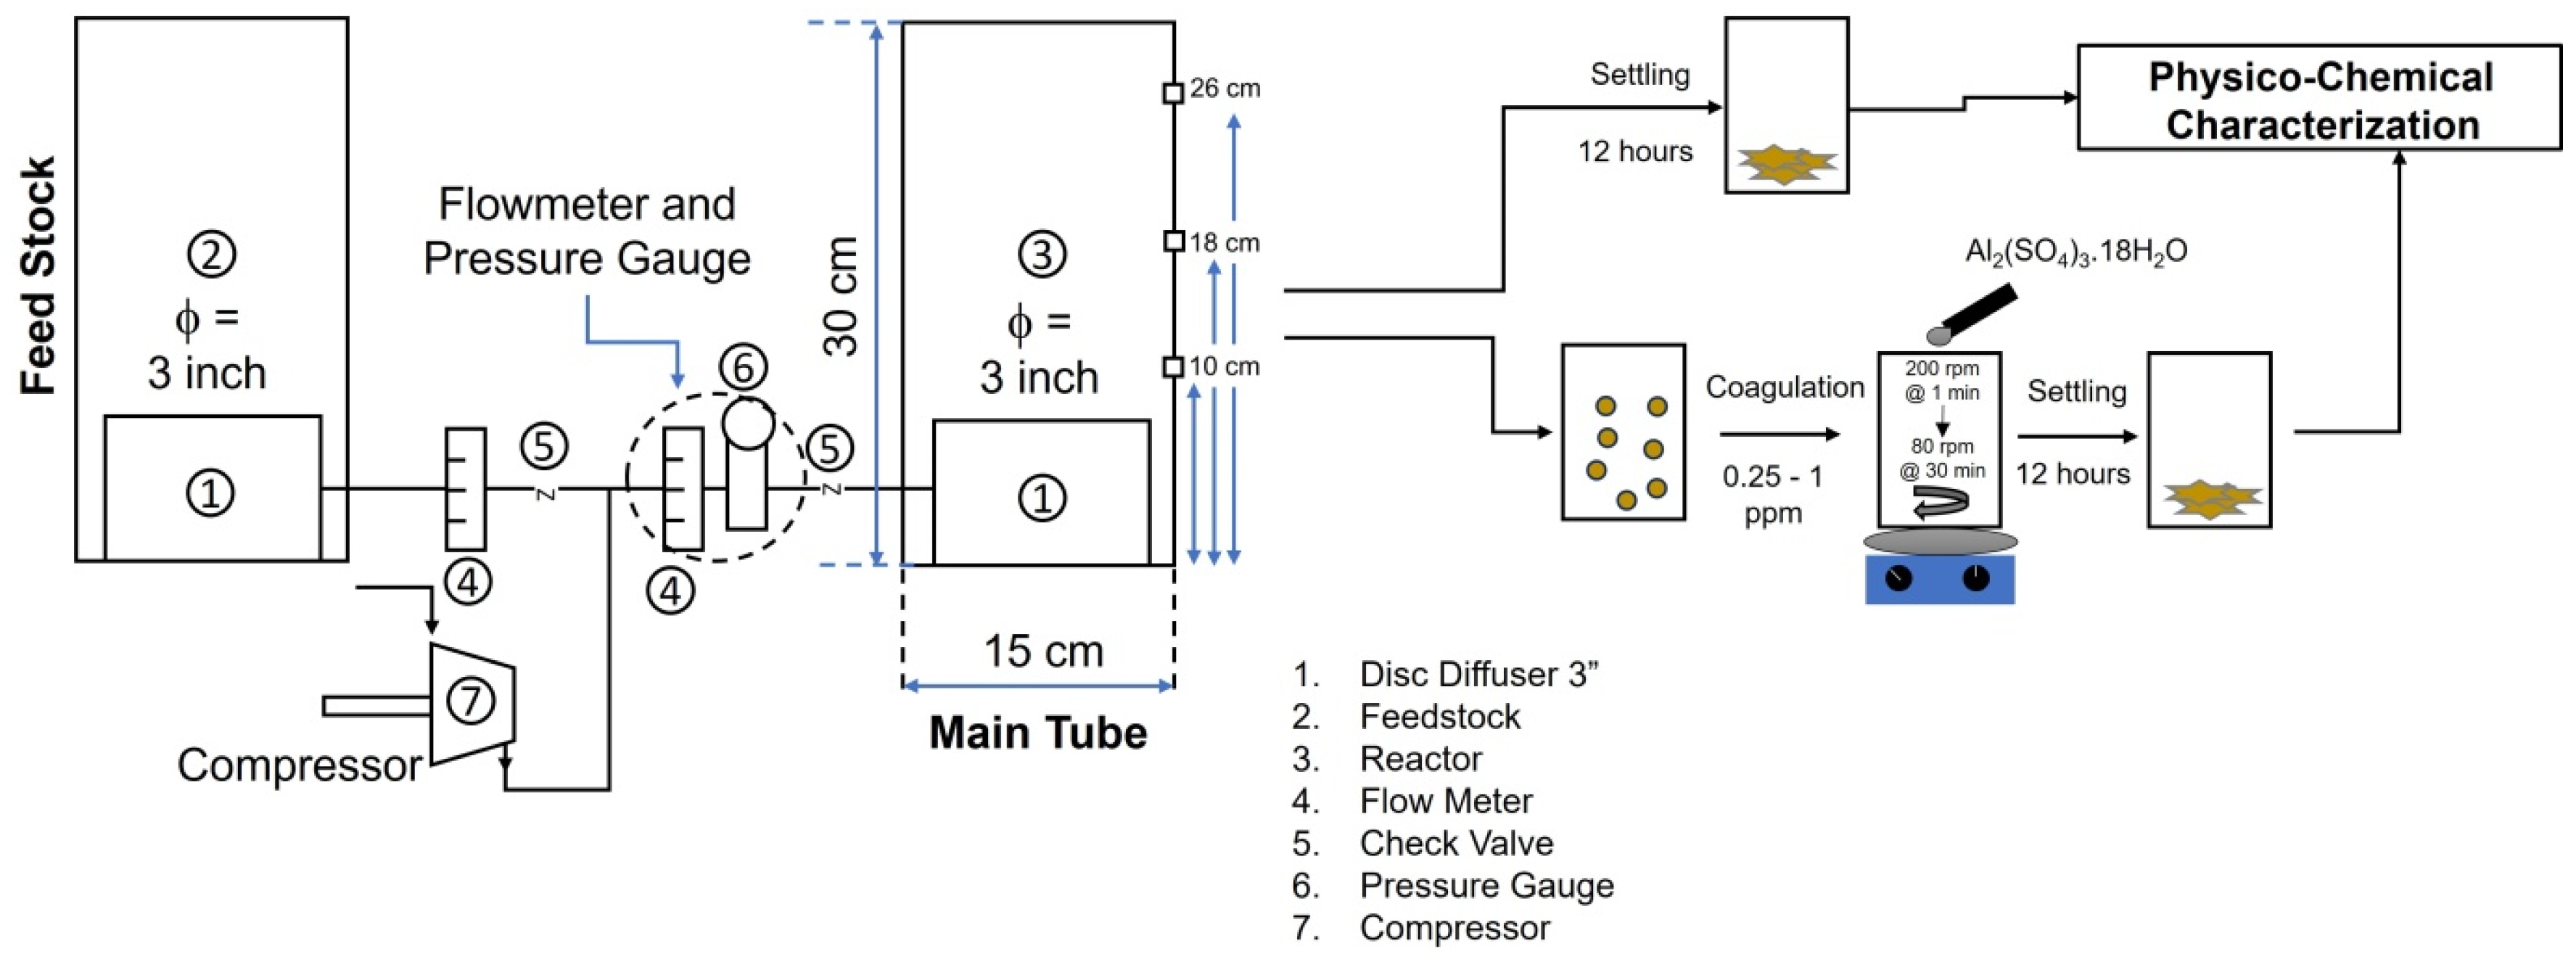
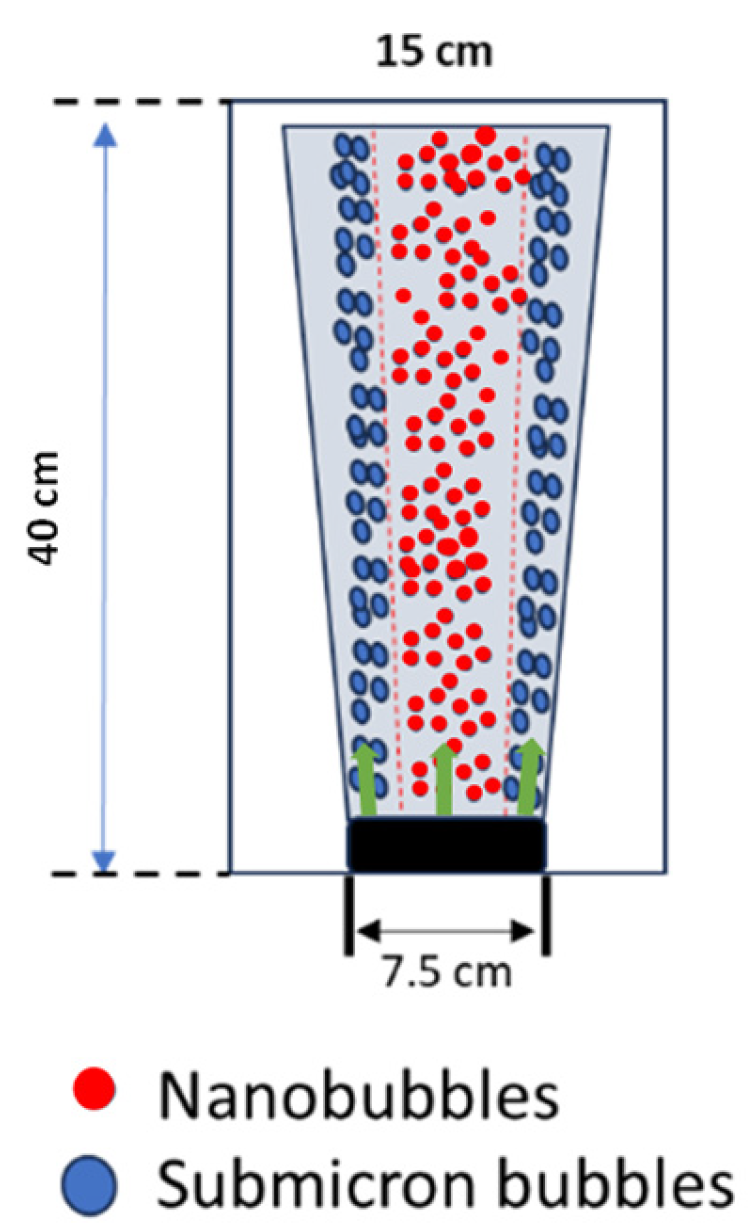
Figure 2 is the setup of the Ultrafine Bubbles Advanced Oxidative Process (UFBs-AOP), which consisted of a reactor chamber, disc diffuser, feedstock, flowmeter, check valve, pressure gauge, and compressor. The reactor was made of glass, with a diameter of 15 cm, a height of 30 cm, and a volume of 4 L. A disc diffuser with a 7.5 cm diameter was inserted into the bottom of the reactor with a 3-inch diameter. The air was supplied to the disc diffuser via a compressor to create UFBs with a capacity of 195 L/Minutes (LPM). Initially, to investigate the bubble characteristics of the diffuser, the inlet air flow rate was regulated at various rates. The volume of the dye waste solution in the reactor chamber was reduced due to a continuous sampling process. Thus, the same amount of dye solution with the same volume was added from the feedstock with a similar treatment. Samples with various setups and treatments are coded and tabulated in Table S1 (Supplementary Materials).
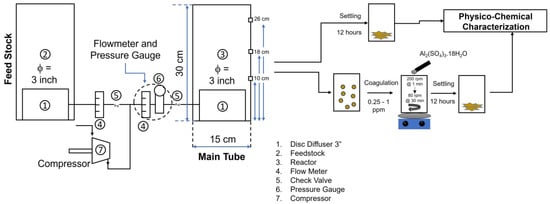
Figure 2.
The setup of Ultrafine Bubbles Advanced Oxidative Process (UFBs-AOP).
3. Results and Discussion
3.1. Characteristics of Disc Diffuser as UFB Generator
The performance of wastewater treatments utilizing water Advanced Oxidation Processes depends strongly on the size of generated bubbles. Here, the characteristics of the disc diffuser were first investigated, including the effect of air flow rate on the pressure generated at the entrance of the disc diffuser. This information is helpful if multiple diffusers must be utilized to meet the scale-up process when dealing with a higher effluent. The result showed that the pressure increased exponentially when their flow increased, as shown in Figure 3 and Table S2 (Supplementary Materials).
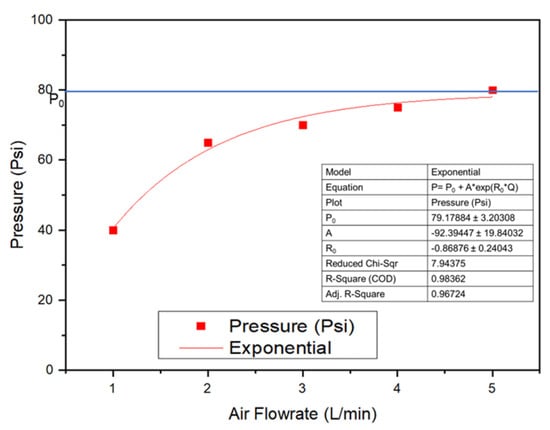
Figure 3.
The effect of air flow rate on the pressure of the disc diffuser as UFBs generator.
The pressure power consumption (Power) used to operate the air compressor was determined using the air flow rate (Qg) and total pressure drop (∆PTotal) of static liquid height and air spargers, as expressed in Equation (1) [21,22].
Power = Qg × ∆PTotal
∆PTotal (Qg) = P0 + A × exp(R0 × Qg)
When the data of pressure at different air flow rates (Qg) were fitted, the exponential model of the equation was obtained as in Equation (2). Po is the obtained initial pressure, A is the amplitude, and Ro is the exponential function of the drop, both of which contribute to reducing pressure factors. For example, for Qg = 1 L/min, the pressure drop was 40.4 Psi and continued to decrease as the air flow rate (Qg) increased.
The effect of air flow rate on bubble size illustrated the performance of the disc diffuser. The size and size distribution of bubbles of the water containing bubbles (WCBs) generated from the disc diffuser at various air flow rates are shown in the Figure 4: (a) 1 LPM, (b) 2 LPM, (c) 3 LPM, (d) 4 LPM, (e) 5 LPM, and (f) comparison of the average size of bubbles. The results show that the smallest bubbles were generated at Q = 3 L/min with a size distribution around 300–570 nm. At bubbling times of 60 min, the smallest and very stable size distributions were obtained compared to other flow rates as time elapsed (Figure 4c). It was also observed that an increase in the air flow rate resulted in a significant rise in the bubble generation frequency. However, the frequency increase also increased the obtained bubble size. Thus, a flow rate of 3 LPM gave the smallest size distribution as time elapsed. Hence, bubble generation frequency in combination with bubble size was important to provide affective surface area available for oxygen mass transfer and the generation of reactive oxygen species (ROS) [23]. Furthermore, we observed a significant decrease in pressure drop with increasing air flow rates, which was crucial for estimating the energy required to operate the disc diffuser for optimal performance in generating UFBs and for the frequency of bubble generation [24].
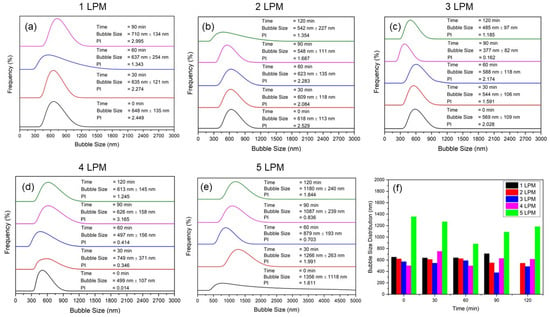
Figure 4.
Size and size distribution bubbles of the water containing bubbles (WCBs) generated from the disc diffuser at various air flow rates: (a) 1 LPM, (b) 2 LPM, (c) 3 LPM, (d) 4 LPM, (e) 5 LPM, and (f) comparison of their average size of bubbles.
Disc diffuser applications to generate bubbles for dye waste treatment depend not only on bubble size and bubble generation frequency but also on the spread of the plume within the reactor highlighted in green arrow. A picture depicting the plume spread is shown in Figure 5. A visualization of the plume is provided to illustrate the distribution of bubble sizes within the plume. Bubble size appears to be an essential parameter in bubble plumes. First, it governs the magnitude of the driving forces, i.e., Buoyancy, Lift, Drag, Virtual Mass, and Fluid Stress. Second, it affects the dynamics of the plume, e.g., if the air flow rate is kept constant, it can be argued that a plume with fewer giant bubbles would behave differently than a plume composed of many smaller bubbles. Moreover, the parameter bubble size was observed because it determined the dynamic behavior of the plume since many applications in water and wastewater treatment expect an unstratified flow of plume. In this study, however, the disc diffuser generated micro and nanobubble size distributions for bubble plumes in stratified bodies of water.

Figure 5.
Representation of plume spreading.
This observation is in agreement with the model proposed by [23] and developed by [24] to simulate bubble generation by micro-orifice disc diffusers [21]. The proposed models have successfully provided accurate predictions of a plume’s integral properties, such as the centerline velocity, width, and volume flux. They are based on integrating the fundamental mass and momentum conservation laws, with assumptions mainly regarding the entrainment and recirculation processes. The derivation of empirical parameters and constants requires adequate scaling. The characteristic velocity in the plume is usually the slip velocity, wslip, i.e., the difference between gas and liquid velocities at a particular location. The characteristic length, D [25], can be obtained as follows:
where g is the gravity acceleration, α is the entrainment coefficient, and Qg is the gas flow rate. Another relevant parameter is the densimetric bubble Froude number F [26]:
where is the density of the air, the density of the air–water mixture, establishes the width of the velocity plume, and w is the characteristic plume velocity.
Given a diffuser width bw = 7.5 cm and empirical values of the densimetric bubble Froude number measured at the diffuser (F0), Equation (4) provides the initial velocity w0 for integral models. In this study, based on the scaling relations (D and F), regions in the plume were considered the “adjustment zone”, i.e., characterized by a constant F [25], which means bubble plumes in stratified bodies of water with different size distributions within the regions (Figure 5). The zeta potential observation also showed that the obtained ultrafine bubbles were stable within the bubble plume region, as shown in Figure 5. Thus, to avoid the stratification of the bubble plume, the ultrafine bubbles were continuously applied during the treatment of dyes to provide unstratified bodies of water.
3.2. ROS Formation from UFBs Generator
This study became very fascinating since UFBs are capable of creating ROS, which play a crucial role in the process of the degradation and mineralization of dyes and, at the same time, are also important in the flotation process. Zeta potential is an indicative measure of the stability of a dispersion that is crucial in the degradation process and also in the flotation [27]. The surface chemistry of the bubbles influences the zeta potential of any dispersion, including pH, surfactant concentrations, salt concentrations, and other formulation options. Hence, it is important to determine how pH affects the zeta potential of dispersion. Also, by studying the isoelectric point, one can determine how pH affects zeta potential and at which pH the zeta potential is zero. Thus, the existence of •OH radicals in the acidic medium could be explained by the zeta potential properties of UFBs. UFBs have a negative zeta potential because of the accumulation of OH− ions at their interface. In this study, UFBs were negatively charged in the pH range of 5–7. At a neutral pH, the negativity of the zeta potential was shown at approximately −5 to −25 mV.
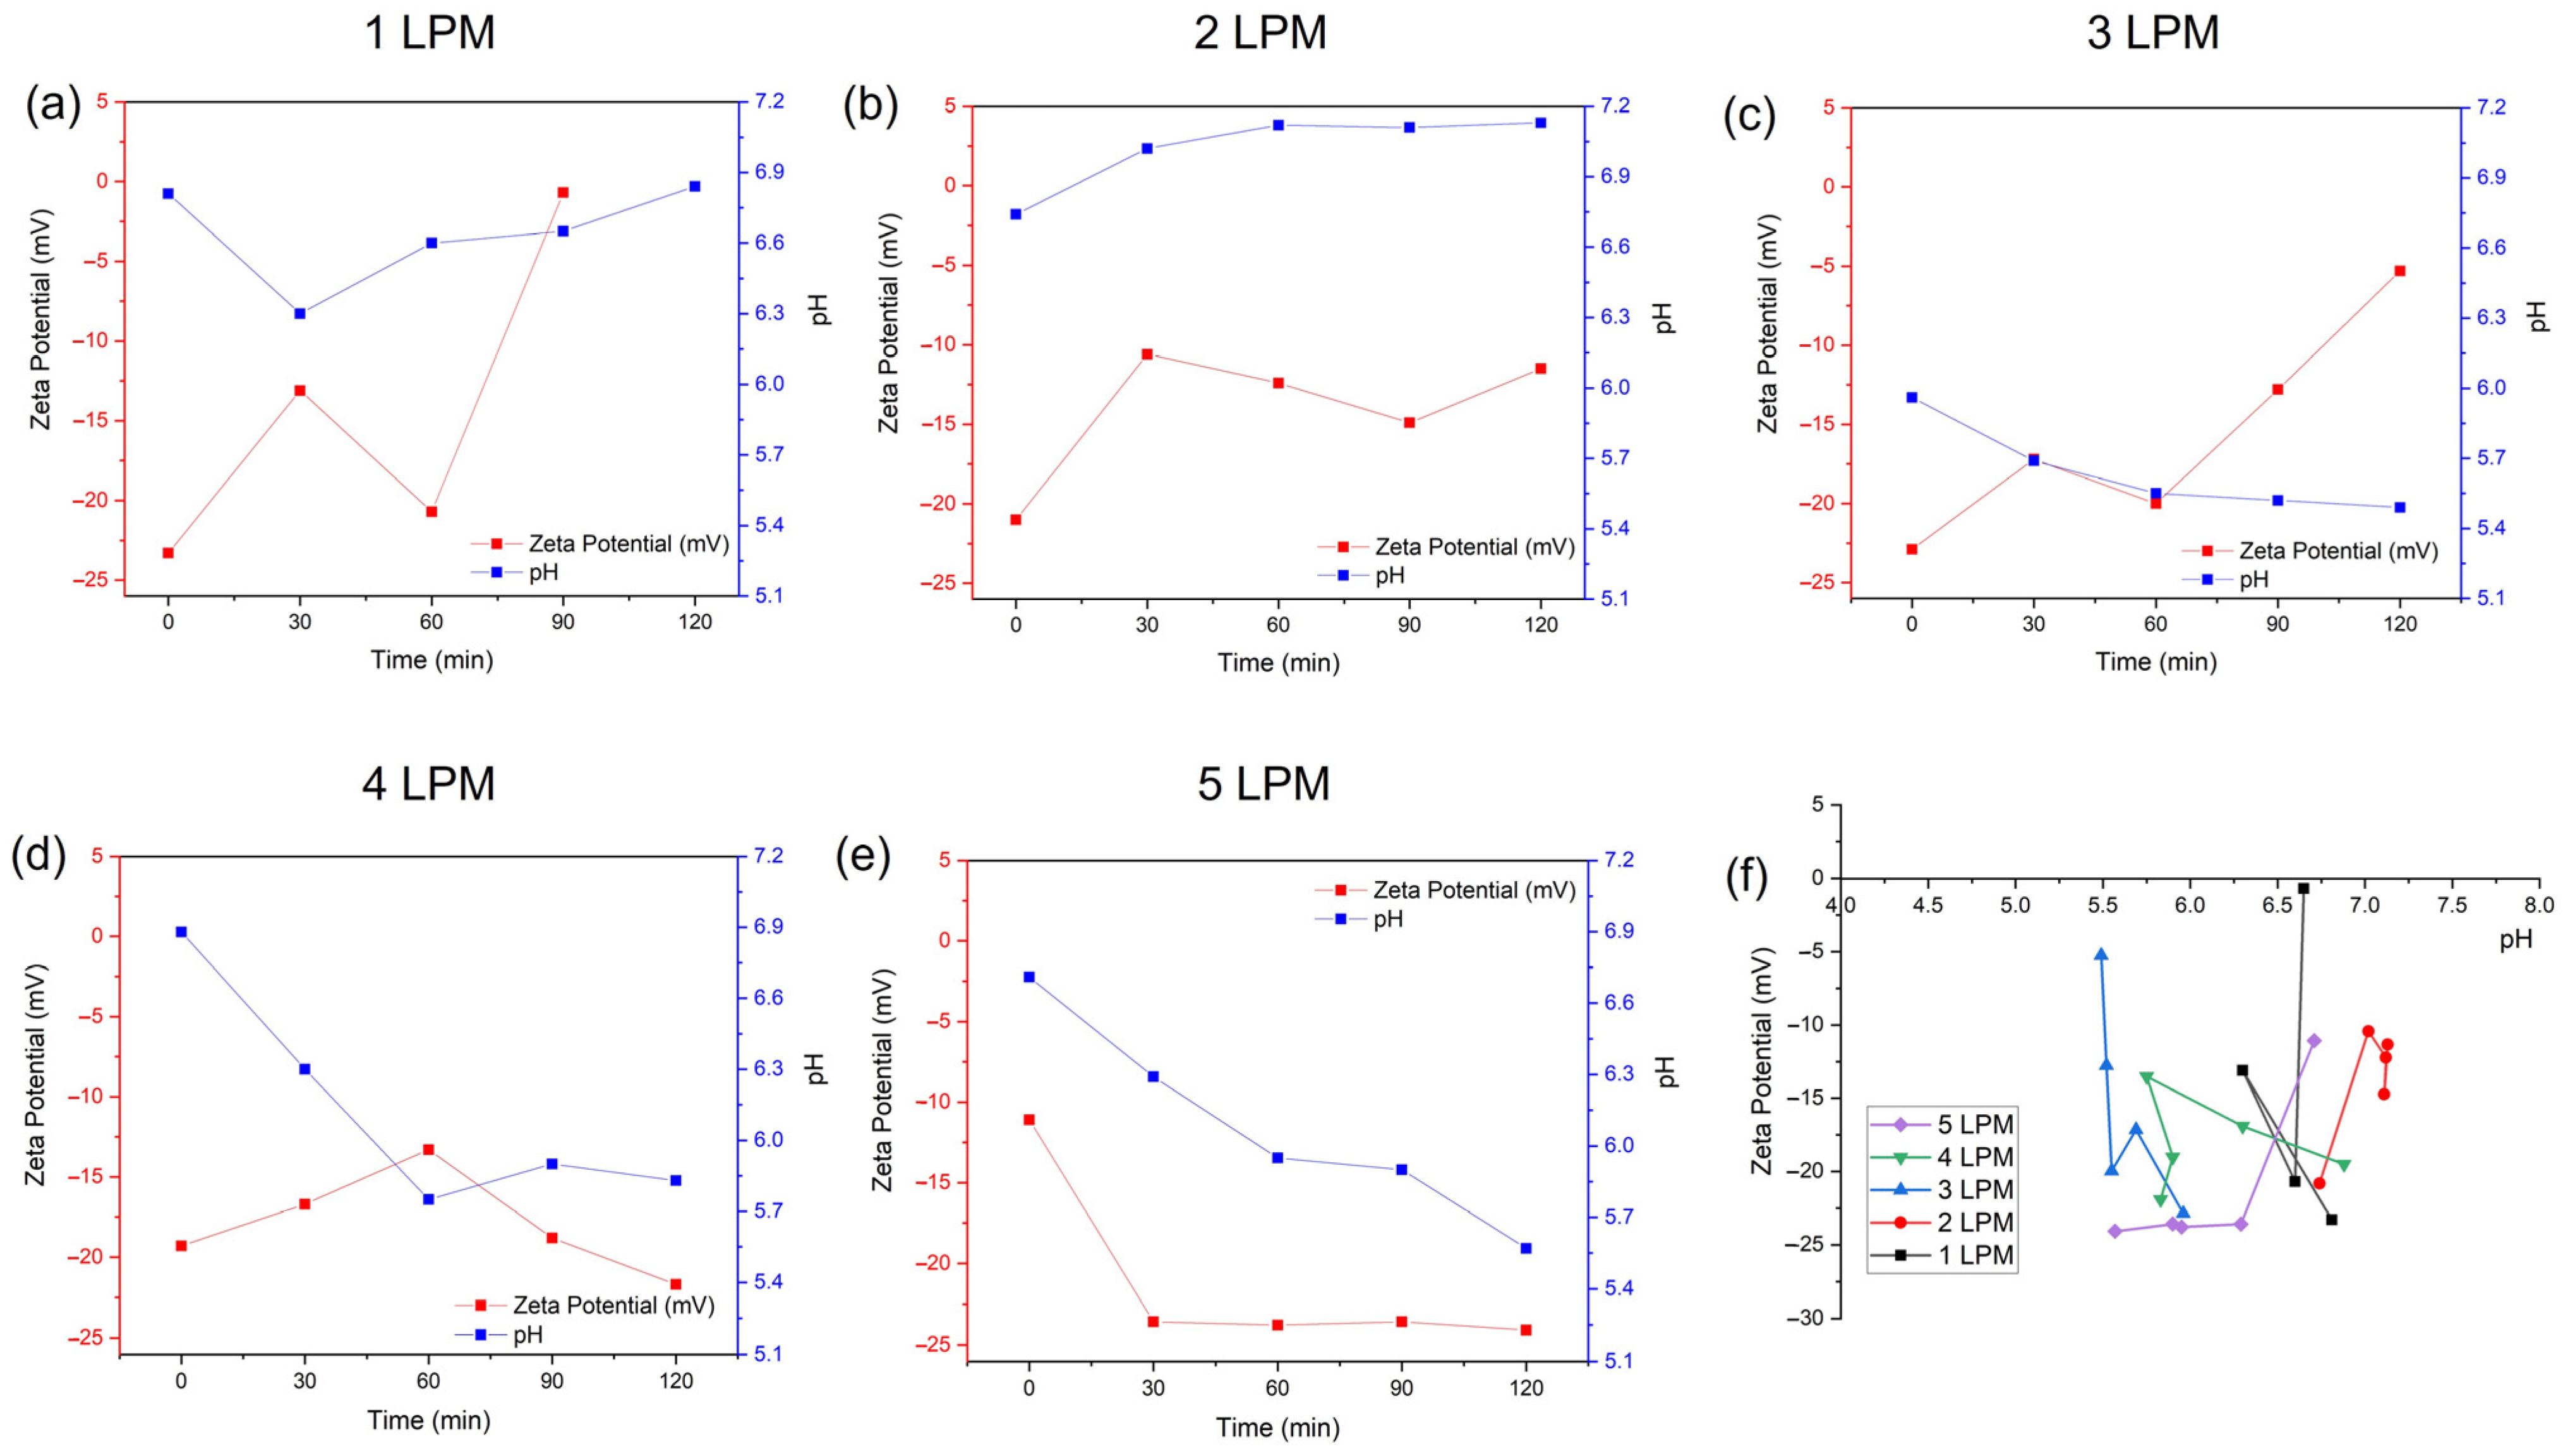
Figure 6 shows the zeta potentials of the water-containing bubbles (WCBs) generated by the disc diffuser at various air flow rates of 1, 2, 3, 4, and 5 LPM and compares their average bubble size. At flow rates of 1, 2, and 3 LPM, the zeta potential of generated bubbles was very unstable as time elapsed (Figure 6a–c). In contrast, the zeta potentials obtained at 4 and 5 LPM were relatively stable (Figure 6d,e). The lowest zeta potential was obtained for 5 LPM; however, the average size of the bubbles was larger compared to 3 LPM as time elapsed. Thus, a small size distribution and stable WCBs were generated by the disc diffuser at an air flow rate of 3 LPM (Figure 4f). The pH of the WCBs at 1 and 2 LPM tended to increased, while, for 3, 4, and 5 LPM, it tended to decrease.
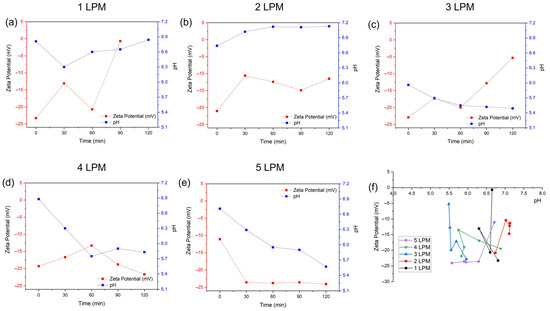
Figure 6.
The zeta potentials of water–containing bubbles (WCBs) generated by the disc diffuser at various air flow rates: (a) 1 LPM, (b) 2 LPM, (c) 3 LPM, (d) 4 LPM, (e) 5 LPM, and (f) comparison of their average zeta potential.
In addition, the zeta potential and isoelectric points analysis could be used to analyze their roles in AOPs and flotations. UFBs represent a special colloidal system with high stability and large specific surface areas [27]. Unlike conventional bubbles, nanobubbles are tiny, often less than 100 nm in diameter. Their small size allows them to remain suspended in liquid for extended periods, making them ideal for various applications. Zeta potential is a critical factor in UFB stability. It refers to the electric charge at the surface of a particle or bubble in a liquid medium. UFBs with a high zeta potential exhibit greater stability. However, over time, the zeta potential of UFBs tends to decrease [27]. Despite the expectation that gas diffusion would lead to smaller bubble sizes, research indicates that UFBs actually increase in size over time. The isoelectric point (IEP) is the pH at which a particle or bubble has zero net charge. Below the IEP, the surface becomes positively charged, and above the IEP, it becomes negatively charged. For bubbles, the IEP is crucial because it affects the coagulation interaction with other particles, surfaces, and solutes or, in this case, dye in the liquid medium, i.e., the flotation process. At the IEP, bubbles tend to aggregate due to van der Waals forces, which can impact their stability and behavior. Thus, nanobubbles play a significant role in the degradation and mineralization of dyes. UFBs can directly interact by Advanced Oxidation Processes in the presence of ROS with dye molecules, breaking down their chemical structures [28,29]. This process leads to decolorization and the breakdown of chromophoric groups. On the other hand, nanobubbles enhance the absorption capacity of bubbles to minerals. By promoting interactions between bubbles and dye molecules, they contribute to efficient mineral flotation recovery rates, where flotation is a separation process where degraded dyes attach to bubbles, forming aggregates that rise to the liquid surface and create a froth layer [30]. Thus, in wastewater treatment, UFBs improve flotation efficiency by enhancing the absorption capacity of bubbles to pollutants, including dyes. When coagulation is included in the process, this aids in particle aggregation, making them more amenable to attachment by bubbles during flotation.
It was observed that the pH tended to be acidic at an air flow rate of 3 LPM compared to other flow rates, indicating the addition of H+ (Hydrogen ions) in the solution (Table 1). Hydrogen ions interact with partially reduced oxygen to produce superoxide, a form of ROS. This is also supported by the TDS observation, which tended to increase as time elapsed, except at a flow rate of 5 LPM. However, the average TDS for 3 LPM was quite large (14.8 ± 3.83) mg/L. This ROS acts as an oxidizer, which was observed at the lowest ORP at an air flow rate of 3 LPM. Because hydrogen ions interact with oxygen, the DO at an air flow rate of 3 LPM was not the highest. The best ORP test was received for an air flow rate of 3 LPM, with the smallest minus value of −23.0 mV compared to the others (Figure 7 and Table 1). This meant that there was a more oxidizing environment. ORP measurements are influenced by the activity of oxidizing (oxygen) and reducing (oxygen, hydrogen) species in the water [31]. The ORP of each oxidant system increased with increasing oxidant concentration to a maximum. ORP also decreased with increasing pH [32]. Thus, as the dose of oxidant increased, the ORP increased, affecting the pH, whereas, at a more alkaline pH, the ORP decreased [33]. Therefore, in this study, the flow rate used for the following process in color testing was 3 LPM.

Table 1.
The characteristic of oxidative Water Containing Ultrafine Bubbles (WC-UFBs) generated by the disc diffuser at various air flow rates.
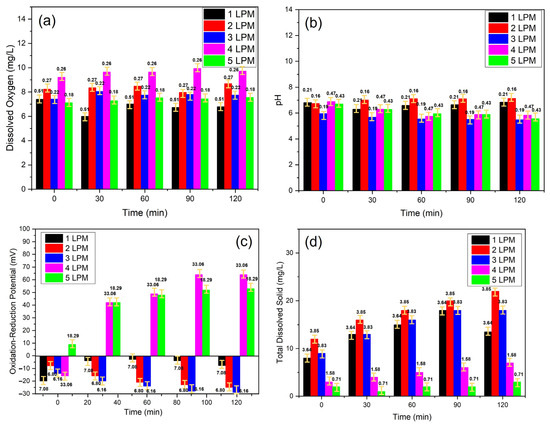
Figure 7.
The physiochemical characteristics of oxidative WCBs generated by the disc diffuser at various air flow rates: (a) DO, (b) pH, (c) ORP, and (d) TDS.
ORP is a measurement of the net voltage potential of excess oxidizers or reducers present in a liquid. Based on this description, it was helpful to investigate the chemistry behind these UFBs. An oxidizer is a molecule with an excess of electrons and a negative charge. A reducer is a molecule with a deficit of electrons and a positive charge. Any aqueous solution that has an excess of either oxidizers or reducers will have a voltage potential. An excess of reducers will have a net negative charge, while an excess of oxidizers will have a net positive charge. A neutral liquid will have no charge.
As shown in Figure 7a and Table 1, the DO at 0 s had a water body in saturation conditions and then continuous UFBs application for 120 min. The lowest oxygen saturation conditions were obtained with the disc diffuser with a flow rate of 5 LPM. In contrast, the highest oxygen saturation was obtained with the disc diffuser with a flow rate of 4 LPM. However, high oxygen saturation resulted in a water pH of 6.13 and a low Total Dissolved Solid. In this condition, the ORP had a positive value, namely, 40.6 mV, which indicated that oxygen was not used to produce H+ ions. On the other hand, water containing UFBs (WC-UFBs) with a flow rate of 3 LPM produced more H+ ions, as evidenced by the smallest pH value and the most negative ORP. When ORP was positive, this signified that the solution had a surplus of oxidizing agents, an indication of an excess of either oxidizer. In contrast, at a flow rate of 3 LPM, ORP was negative, suggesting an excess of •OH radicals oxidizing water into H2O2. The reaction of •OH with water can be represented as follows:
•OH + H2O → H2O2 + H
In this reaction, •OH reacted with water to produce hydrogen peroxide (H2O2) and a hydrogen atom (H). Therefore, the oxygen saturation in the WC-UFBs made from the disc diffuser with a flow rate of 3 LPM was used to produce ROS in the form of H2O2 with the following reaction [34,35,36].
The production of H2O2 was possible because WC-UFBs at 3 LPM generated the ultrafine bubbles, which allowed for the production of H2O2 due to the higher internal pressure bubble, as explained in the Laplace equation [37,38]. The ROS was formed in the presence of oxygen in the inside bubble and pressurized at the interface of bubbles–water based on reactions:
Figure 8 shows the physiochemical characteristics of oxidative WCBs generated by the disc diffuser with various air flows: ORP, pH, and Time. A positive ORP indicated a greater potential for oxidation, which aligned with the presence of •OH radicals. The concentration of •OH radicals was closely related to pH. Lower pH values enhanced •OH production. ORP was also influenced by the presence of H2O2, which contributed to oxidation, since H2O2 can alter pH due to its acidic nature.
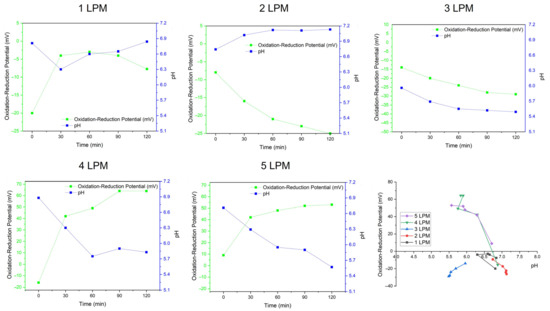
Figure 8.
The physiochemical characteristics of oxidative WCBs generated by the disc diffuser at various air flows: ORP, pH, and Time.
3.3. Characteristics of Red Dye Navacron Ruby S-3B and Coagulants
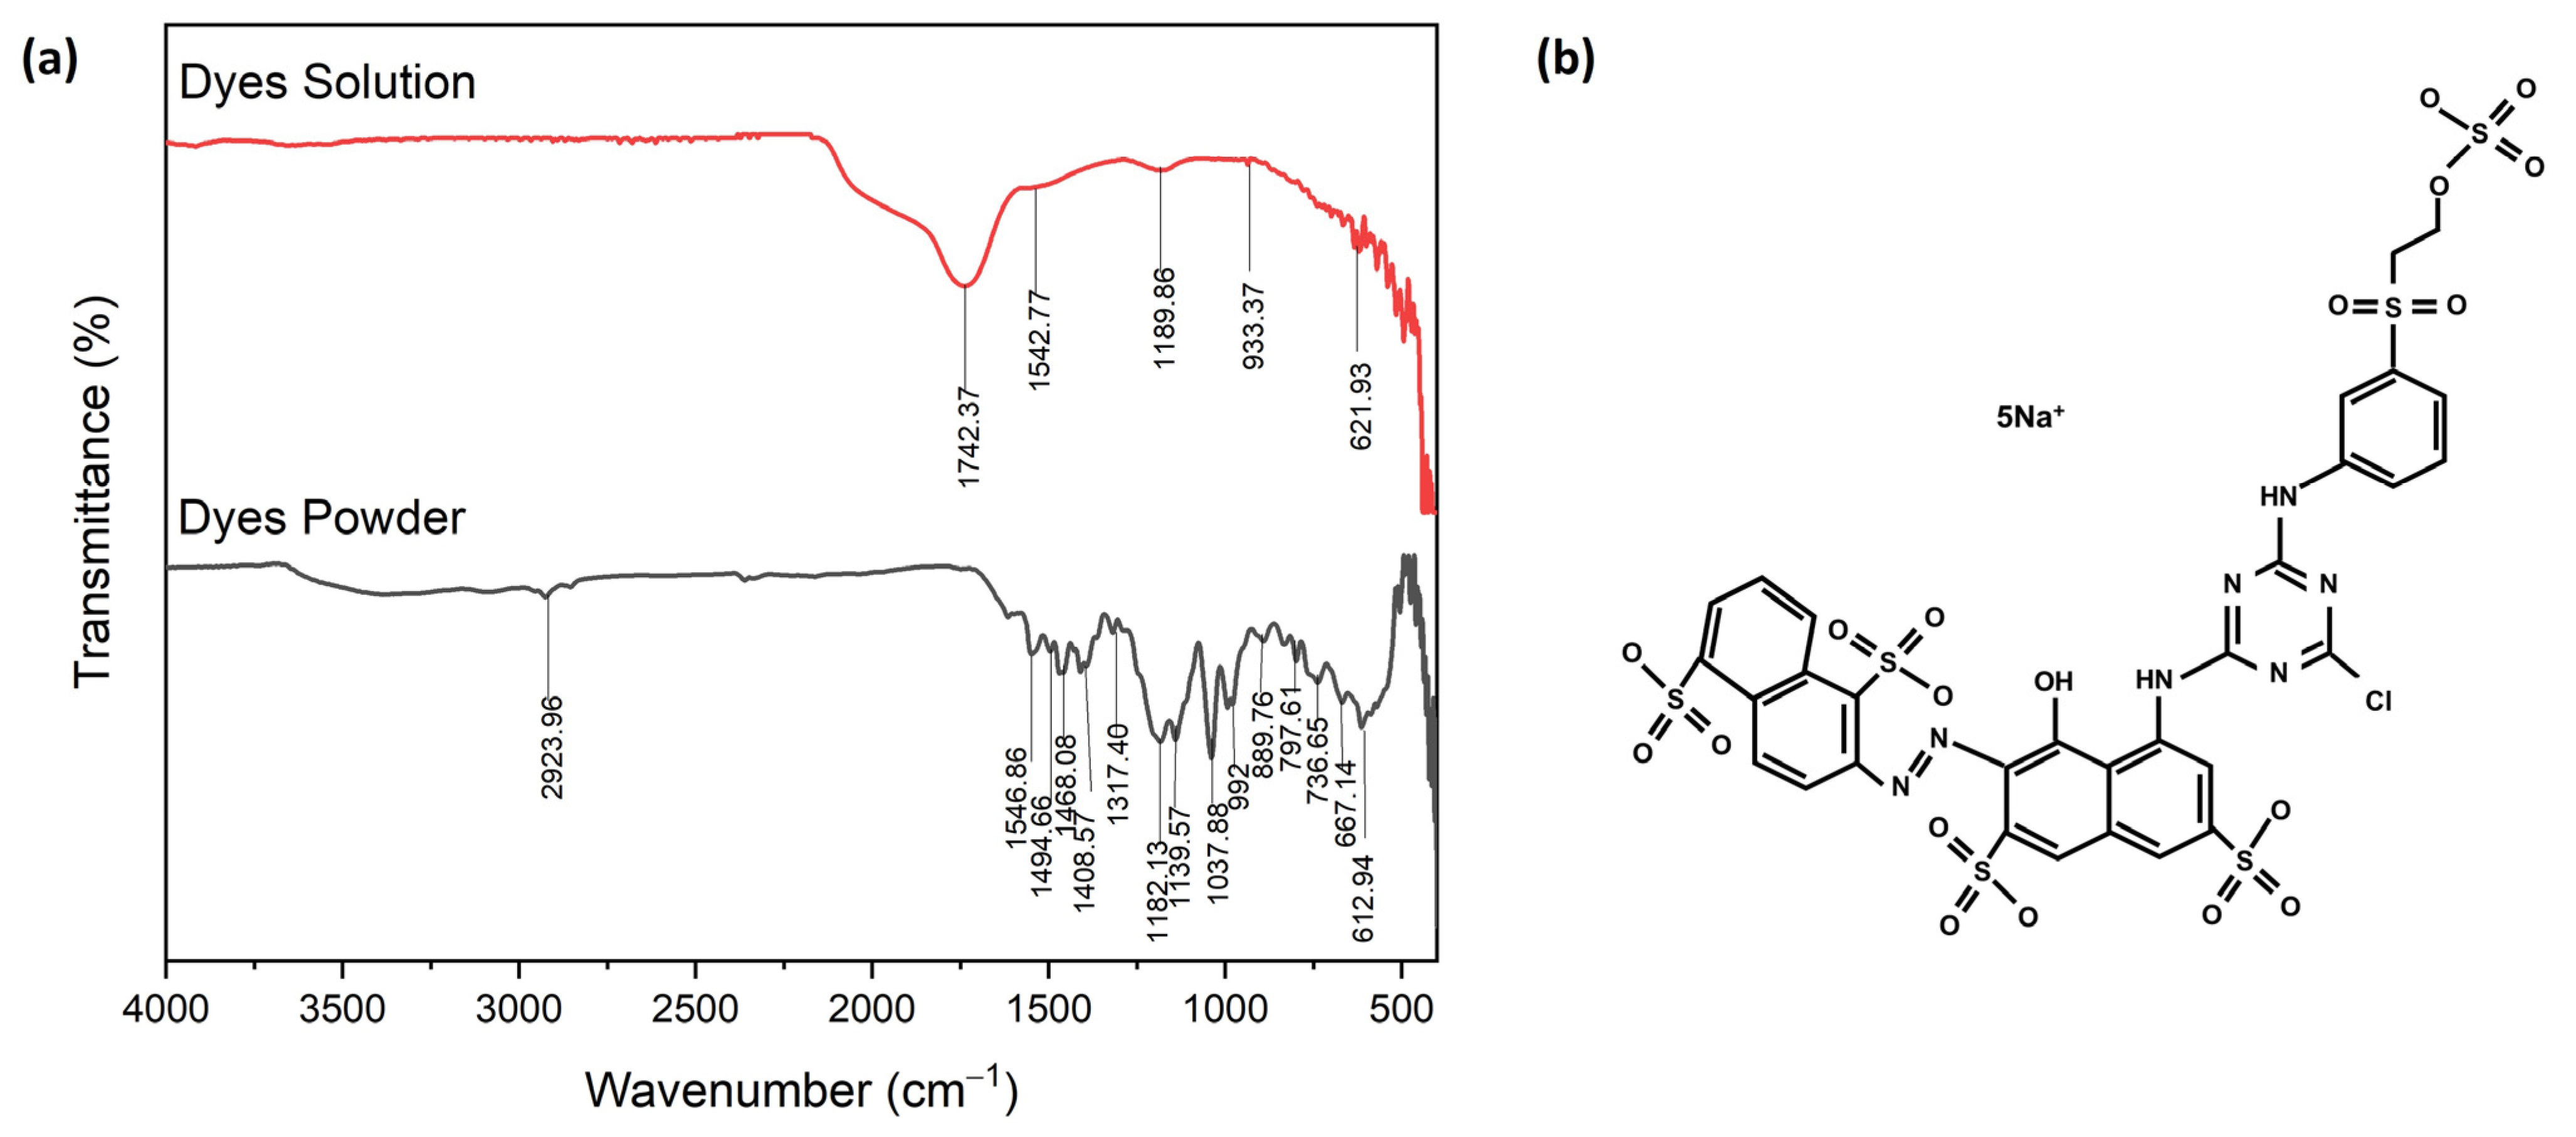
Figure 9 shows the FTIR spectroscopy of the corresponding molecular structure of red dye Navacron Ruby S-3B in solution and powder [39]. The result showed the presence of thiocyanate, acknowledged as a toxic chemical, in the solution [40,41]. The detailed chemical composition of red dye Navacron Ruby S-3B in the form of solution and powder is shown in Table S3. The elemental analysis of XRF clearly showed the presence of Na, S, and Cl elements (Table S4), in agreement with their chemical structure, as shown in Figure 9b.

Figure 9.
The FTIR spectroscopy of red dye Navacron Ruby S-3B: (a) solution and powder and (b) molecular structure.
An aqueous solution containing Fe3+ (more precisely, [Fe(H2O)6]3+) appeared to be light yellow. Moreover, thiocyanate was added to the solution containing Fe3+, and the color of the solution turned blood-red due to the formation of a complex between iron and thiocyanate. The general equation below describes the formation of the complex of iron (III) with thiocyanate [42]:
[Fe(H2O)6]3+ + nSCN− = [Fe(SCN)n(H2O)6−n](3−n)
Thus, the degradation of complex formation between iron and thiocyanate is the main challenge in treatment when the aim is to reduce the Pt-Co of the solution. Unfortunately, thiocyanate has a reversible reaction, making it challenging to handle during treatment to maintain its separation within the solution. The following is the equation for the more familiar ferric thiocyanate, showing forward and reverse arrows to indicate the reversibility of the reaction [43]:
FeCl3 + 3KCNS ↔ Fe(CNS)3 + 3KCl
Figure 10 shows the FTIR spectroscopy of Alum as a coagulant (a) and its chemical structure (b). The FTIR spectra ascribed OH stretching and bending at wave numbers 3250.44 and 1633.33 cm−1, respectively. The peaks at 1092.27 and 596.11 cm−1 were each attributed to the vibration of SO4 and Al-O. These elements are the main components of Alum, as shown in Figure 10b. These elements were also clearly observed in the presence of Al and S in the elemental analysis using XRF (Table S4).
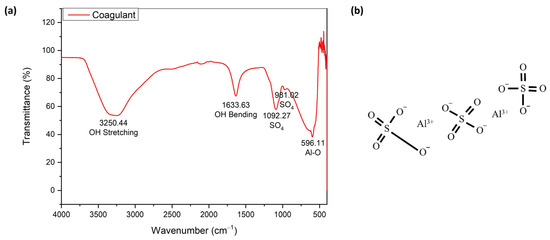
Figure 10.
The FTIR spectroscopy of Alum as a coagulant (a) and its chemical structure (b).
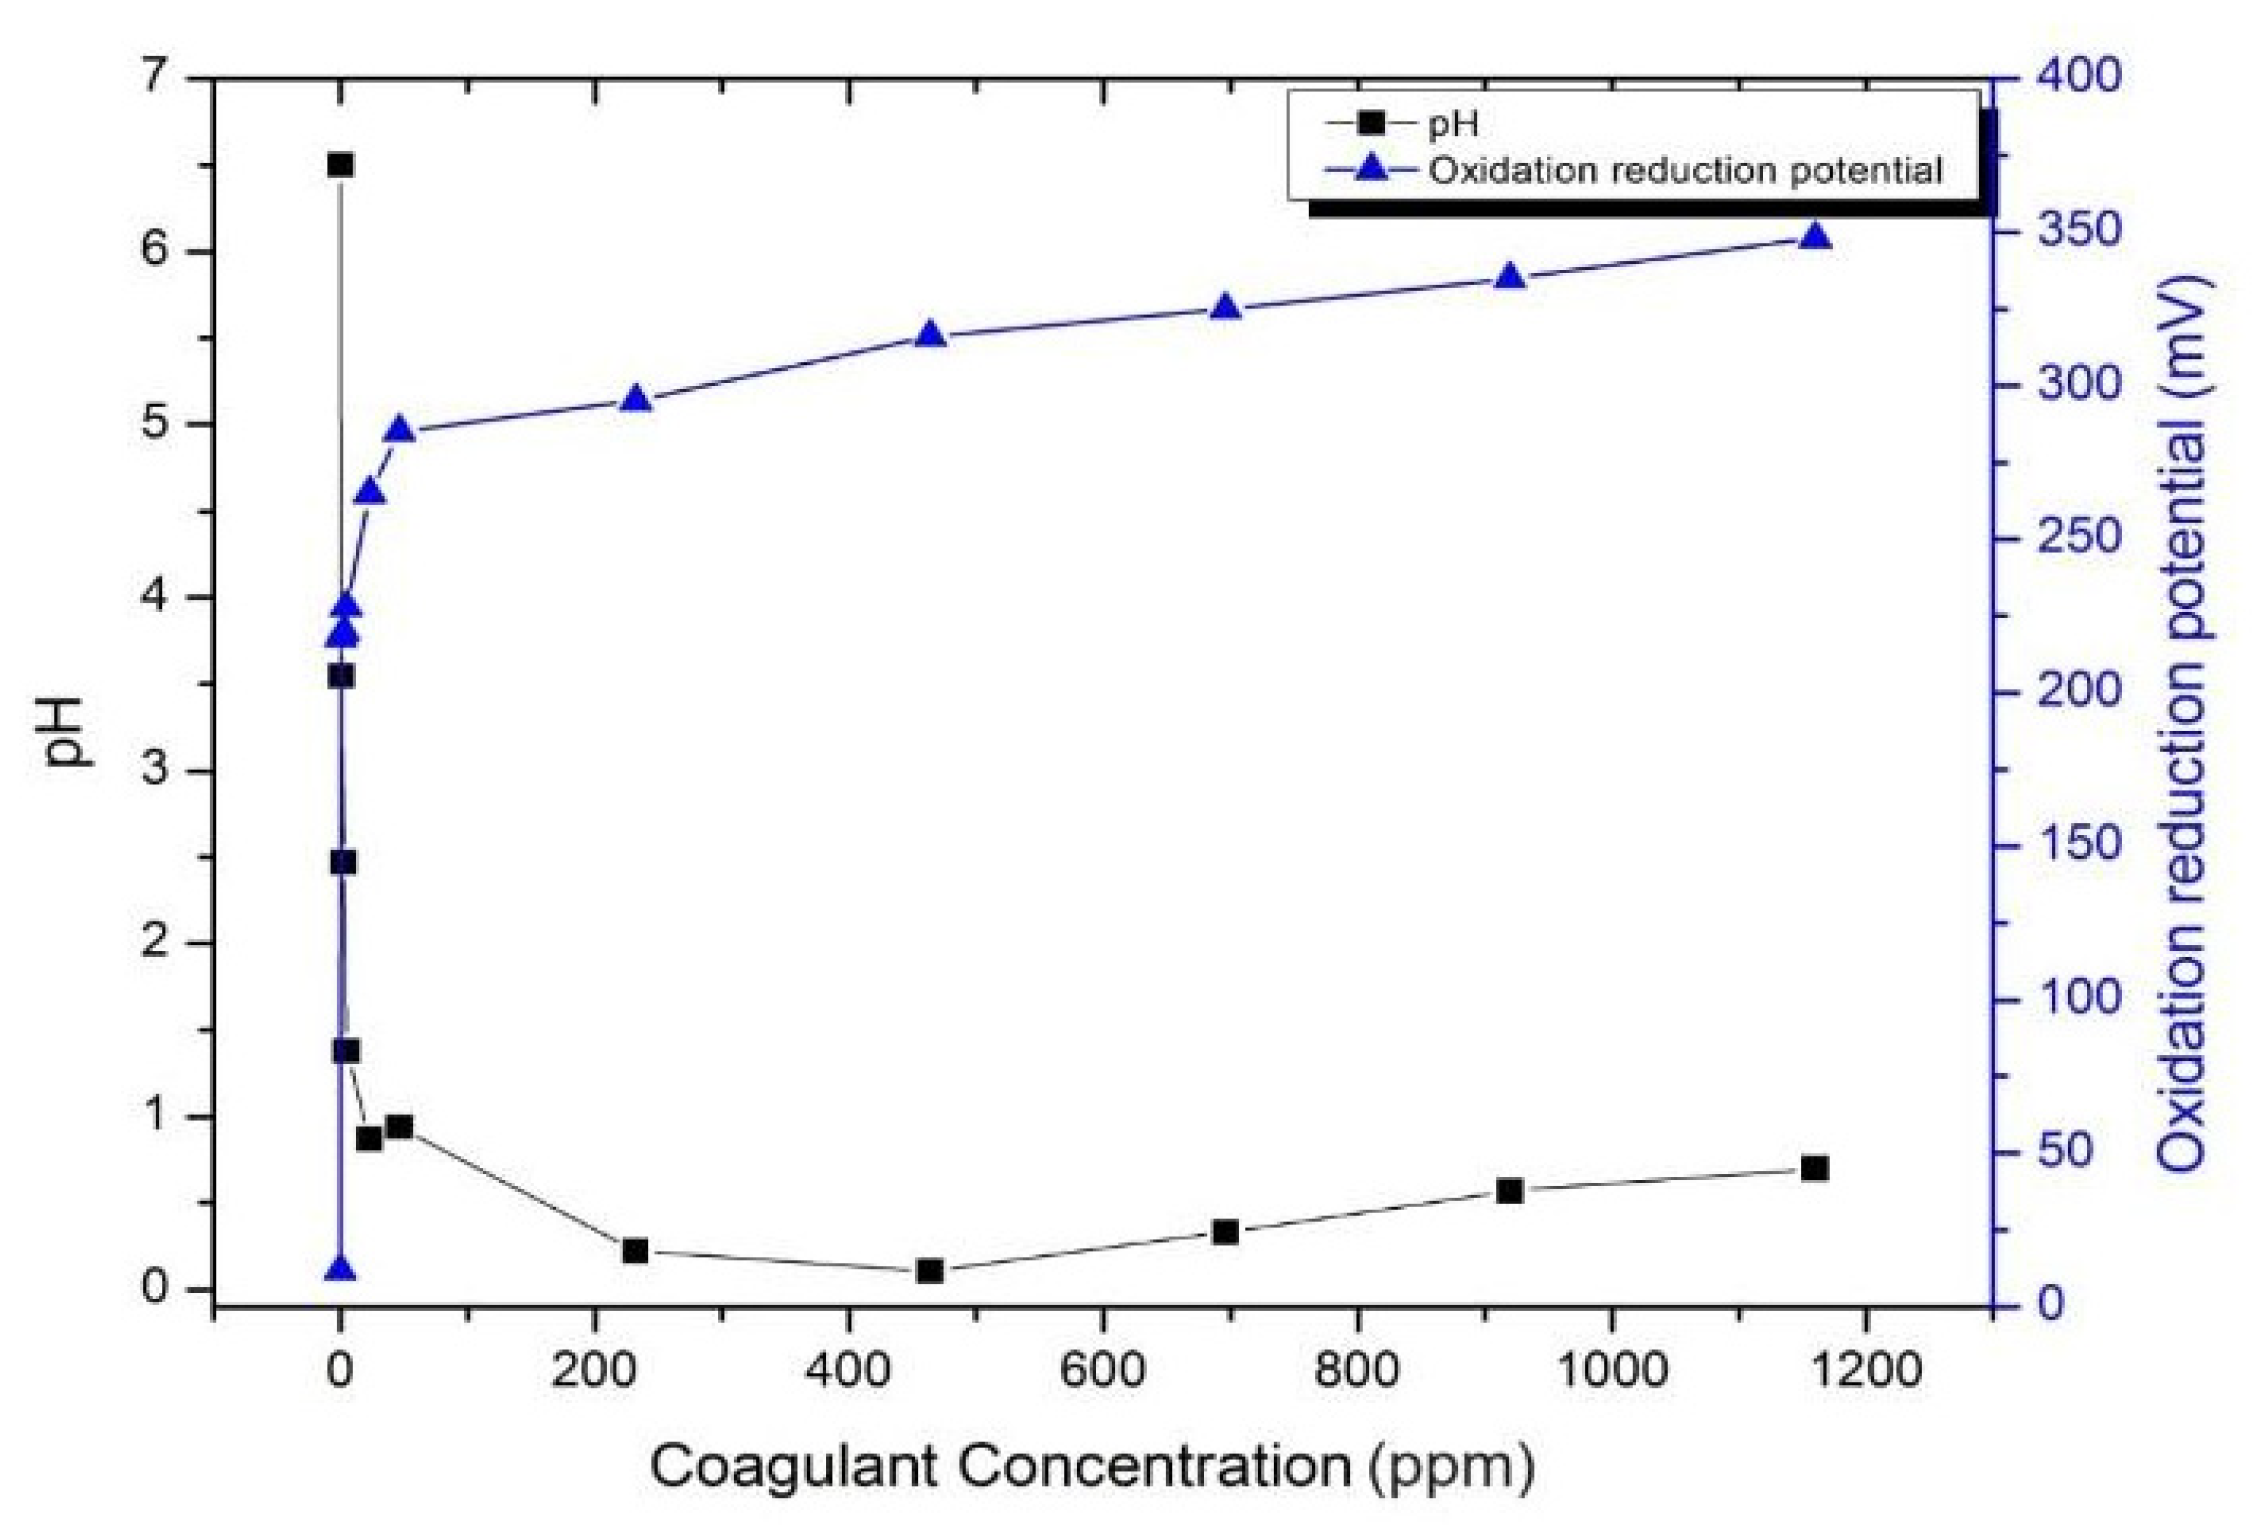
The effect of additional Alum in wastewater treatment is critical. Thus, its dosage must be optimized before applying it to textile wastewater treatment. Figure 11 shows the effect of Alum at various concentrations (ppm) on the pH and ORP of the water. The additional coagulant significantly reduced the pH of the solution; however, at concentrations higher than 500 ppm, the pH of the solution increased. In contrast, the ORP was constantly increased upon the increase of the coagulant. This result indicated that the proper amount of coagulant needs to be adjusted for application in textile WWTPs to obtain the lowest amount of coagulant with the highest ORP values, which depends on the nature of the wastewater solution.
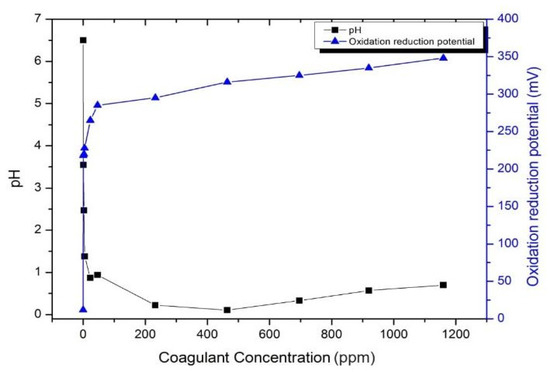
Figure 11.
The pH and ORP of the Alum.
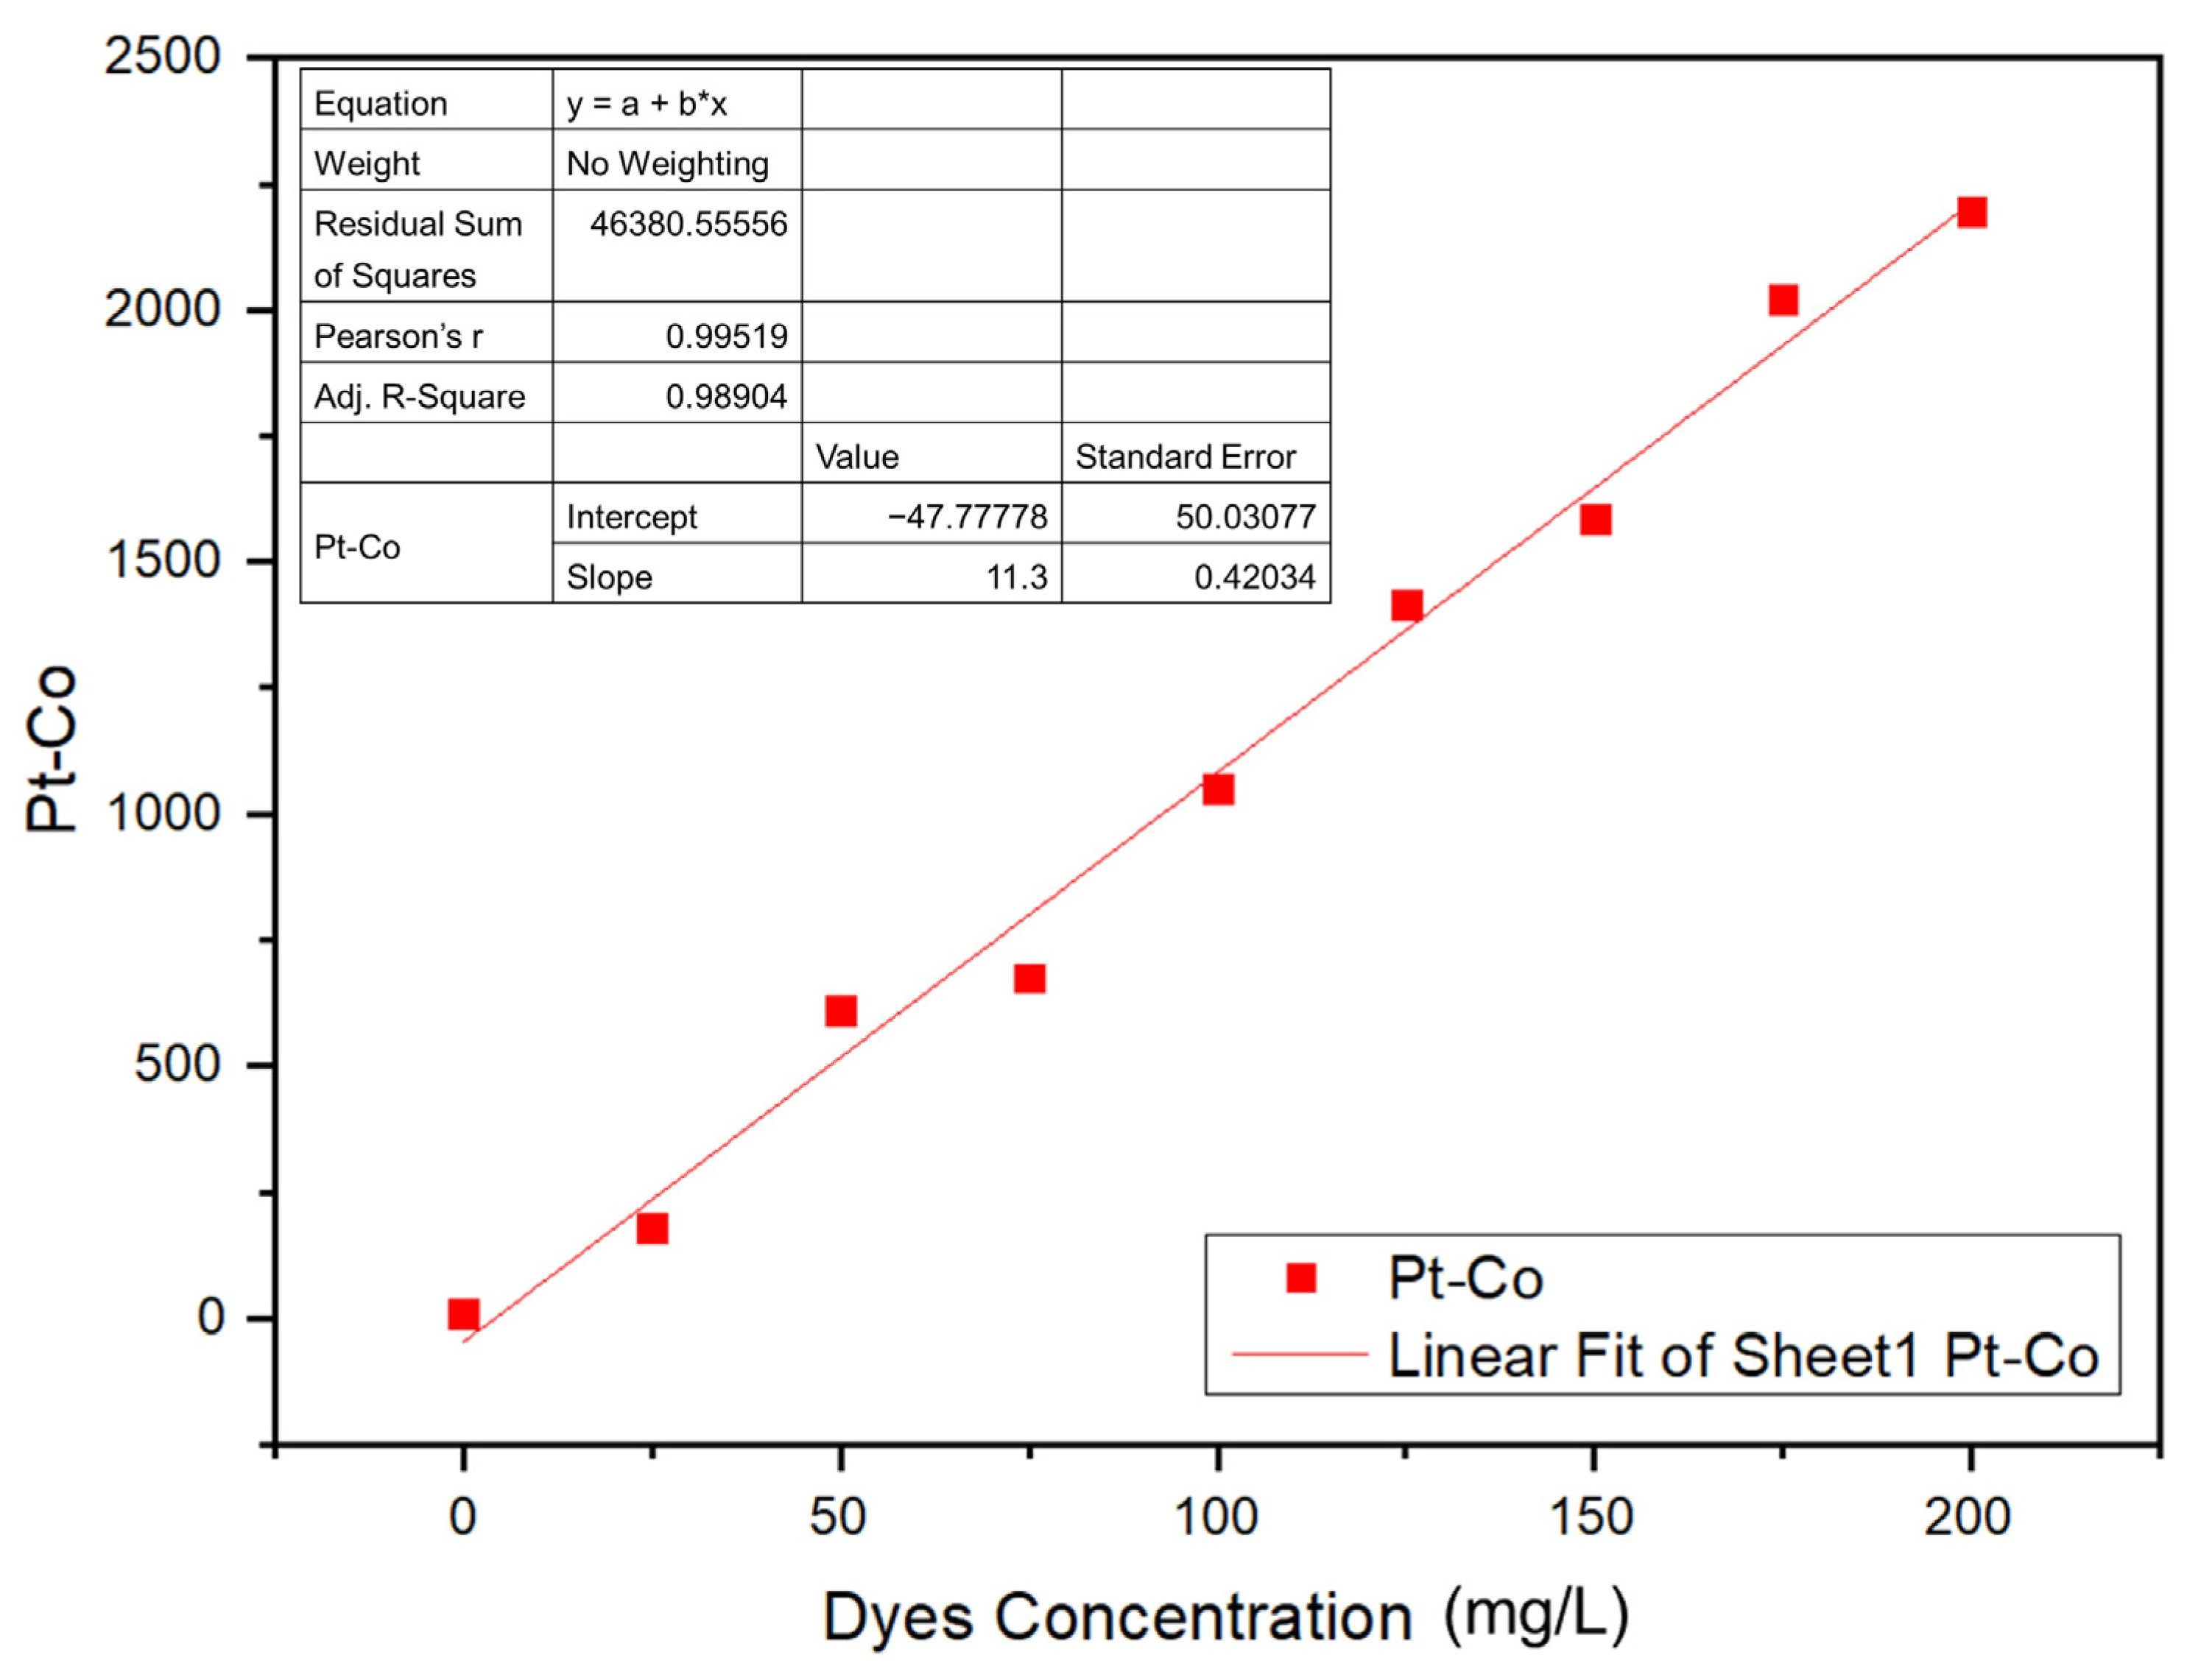
A calibration curve was prepared for the Navacron Ruby S-3B at various concentrations to obtain the corresponding color scale (Pt-Co), as shown in Figure 12. The residual sum of squares of the curve was 98.9%, and the accepted mathematical model was applied in the estimation of the color scale (Pt-Co) of the solution under investigation [44].
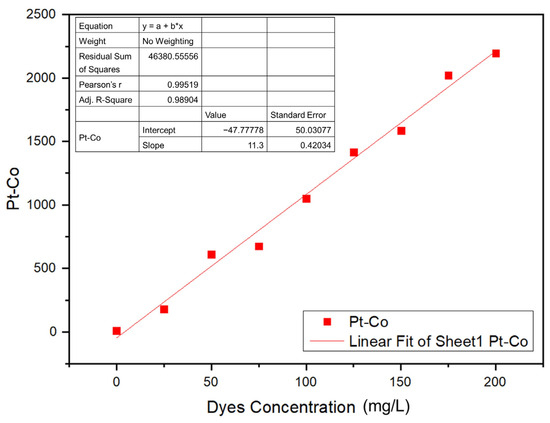
Figure 12.
Calibration curve of the color scale (Pt-Co) against dye concentration.
3.4. Determination of the Optimal Coagulation Dosage
Applying the microbubble technology in coagulation processes may provide an efficient and cost-effective approach to wastewater treatment. Microbubbles could generate free radicals without ozone; thus, the coagulation microbubble flotation process could enhance the biodegradability of dye wastewater. Moreover, the coagulation micro–bubble flotation process can increase the biodegradability index in either COD or Pt-Co and the removal of color efficiencies. This technique of radical generation from collapsing micro-nano bubbles could be applied to wastewater pretreatment. The smaller the bubble sizes, the more pollutants are removed and the less time the process takes. It is also possible that the coagulation micro-bubble flotation process saves coagulant usage and improves the effectiveness and efficiency of the pretreatment [9]. Thus, in this study, the representative physicochemical parameters at various chamber heights representing various reaction column occurrences were observed.
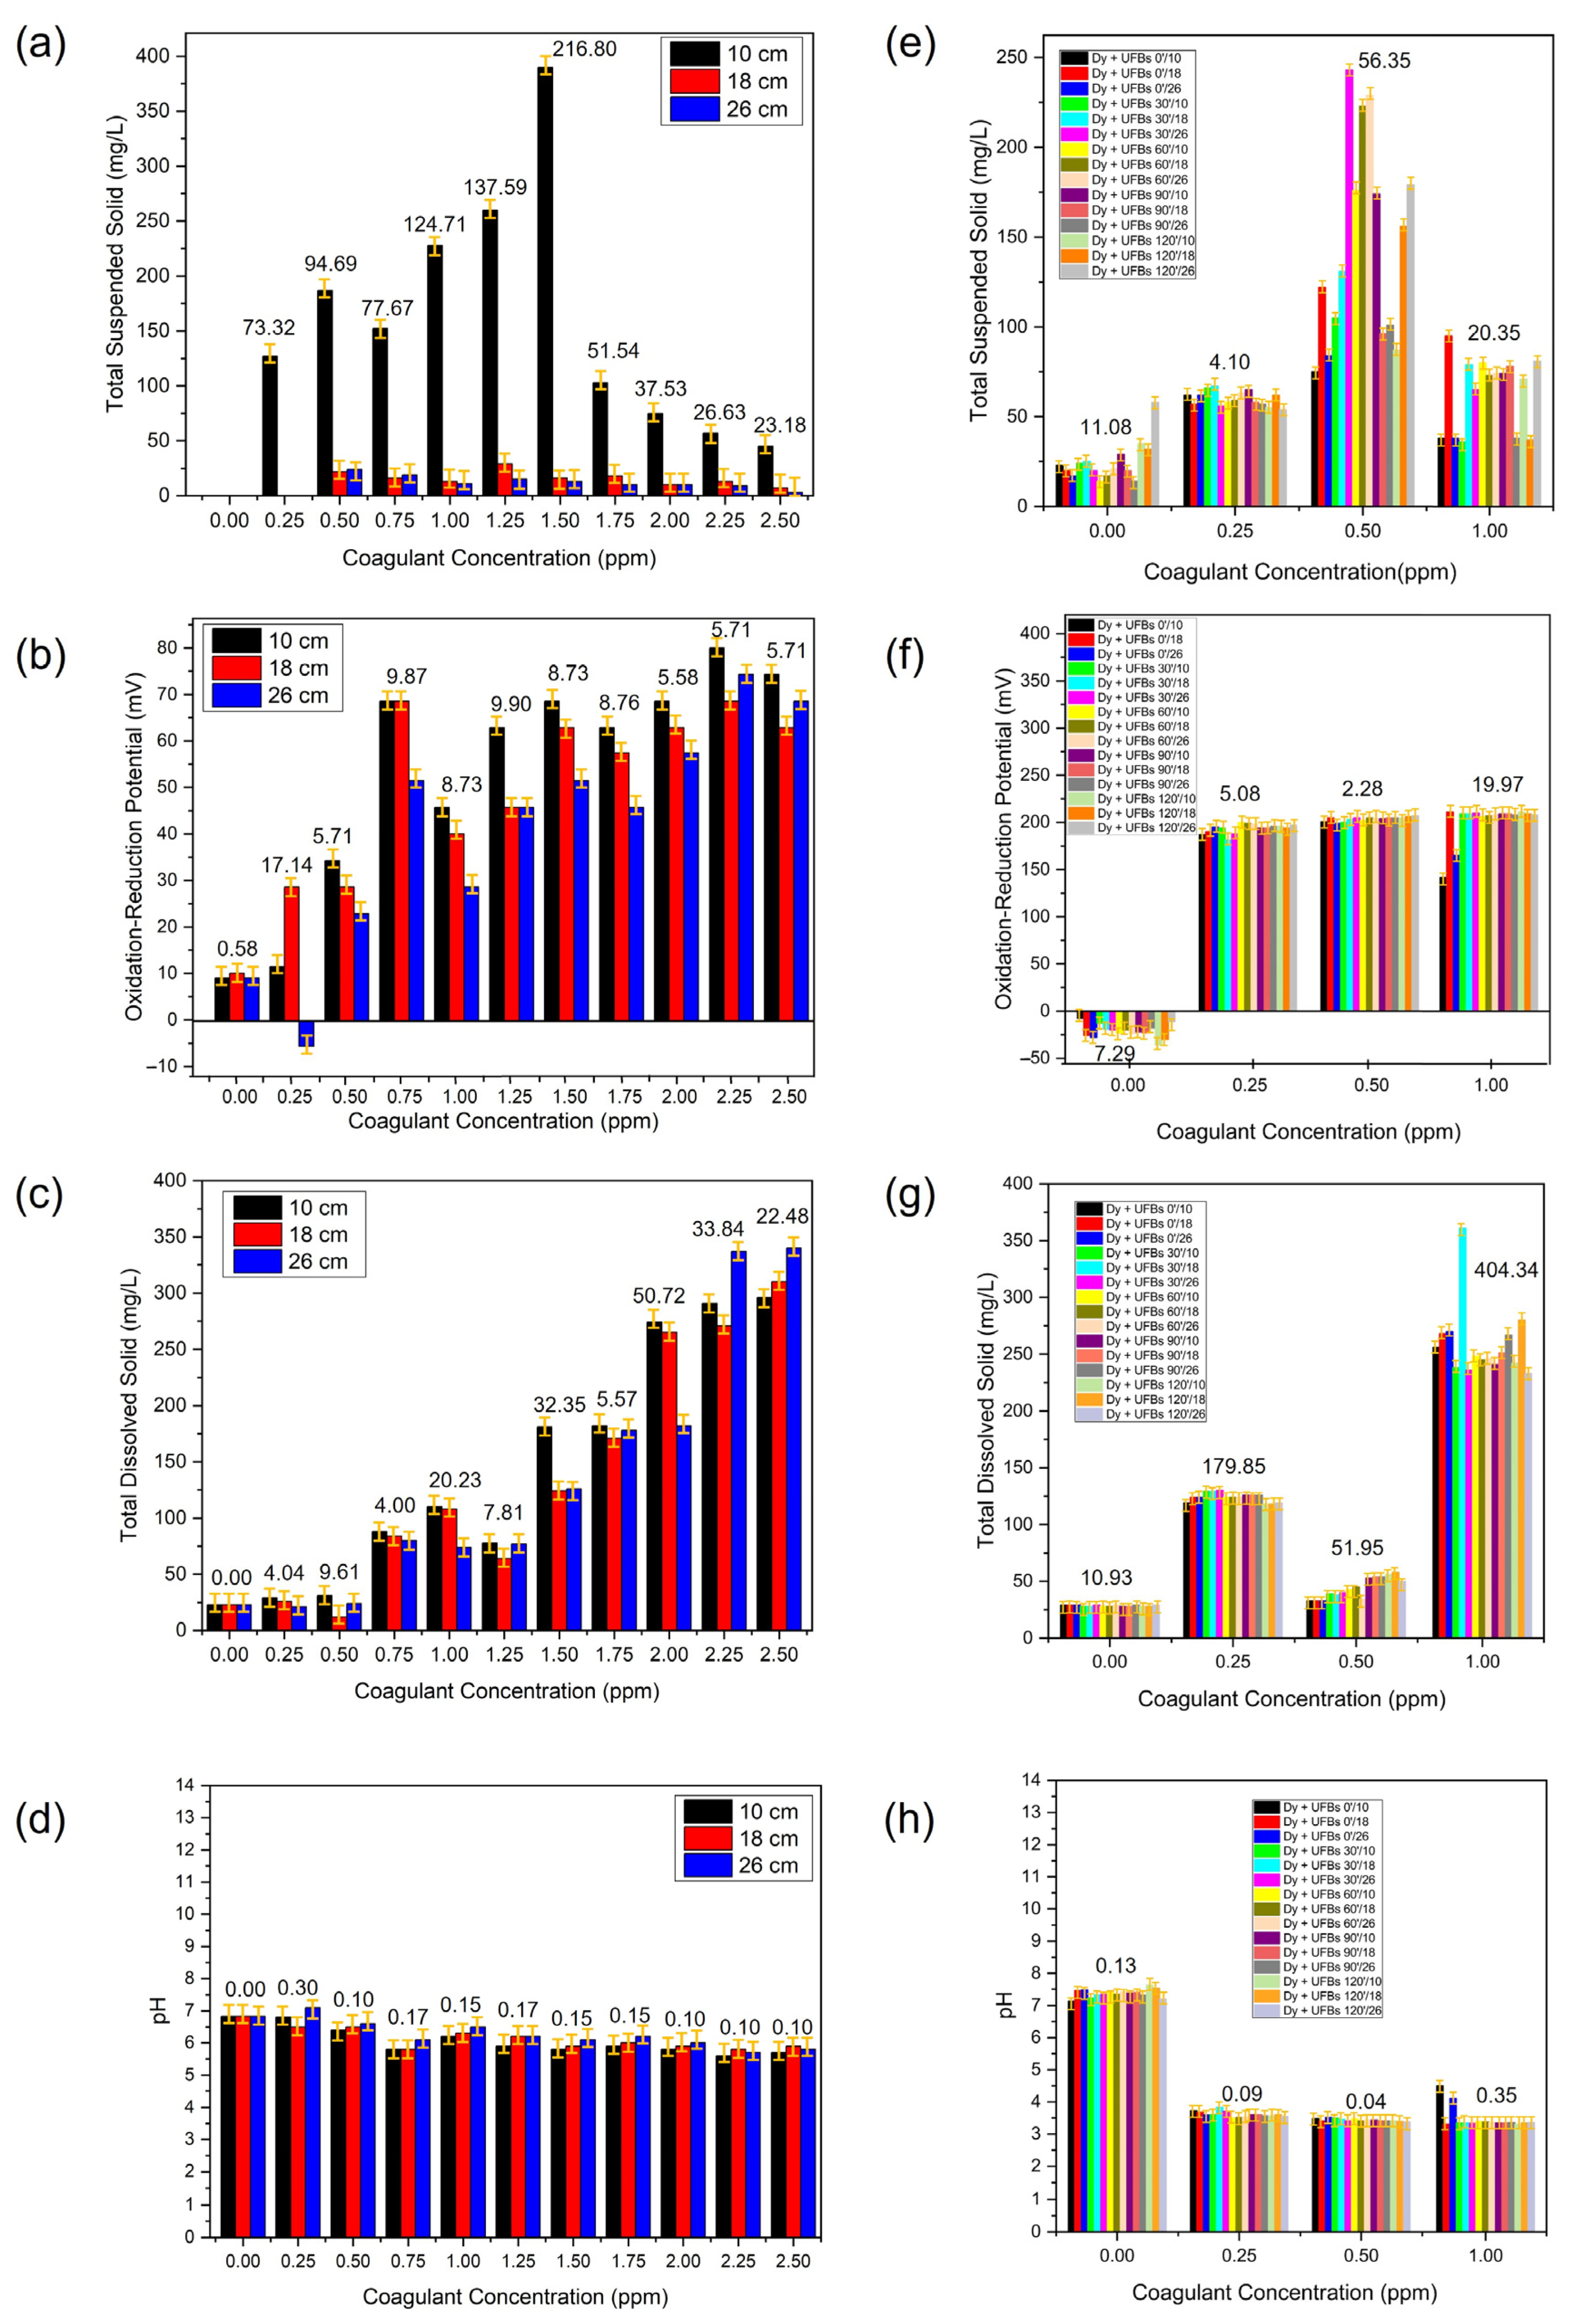
Figure 13 shows the TSS, TDS, ORP, and pH during coagulant optimization without (a–d) and with UFBs (e–h). TSS is usually the most representative physicochemical parameter for calculating the optimal coagulant dosage. The TSS represents the interaction of the coagulant with the colloidal particles or suspended material, such as dyes that affect the degree of transparency of the water due to the coagulation of suspended particles. As previously observed in Figure 11, the optimal coagulant dose resulted in an optimal pH range because if the water had a high degree of alkalinity, the reaction of the coagulant was affected [45].
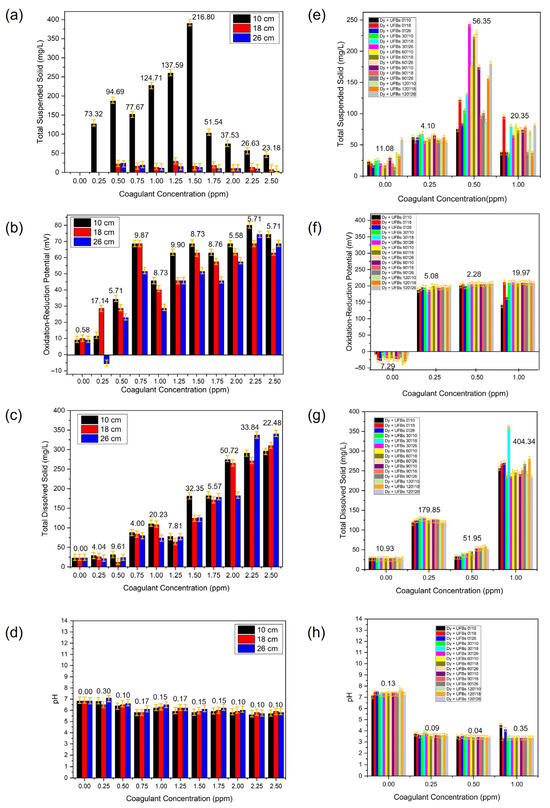
Figure 13.
The TSS, TDS, ORP, and pH during the process of coagulant optimization without (a–d) and with (e–h) UFBs.
Coagulation, the primary step in conventional treatment, must be properly and effectively controlled in wastewater treatment. Coagulation in water treatment is defined as the process of adding a chemical coagulant or coagulants to suspended, with colloidal, and dissolved matter for subsequent processing by flocculation or to produce conditions that allow the particulate and dissolved matter to be removed later. The coagulation dosage is one of the most significant factors to consider when determining the best conditions for the coagulation–flocculation process [46]. The optimal coagulant dosage is the least number of coagulants necessary to achieve the desired treated water quality. Generally, this process involves three reaction stages: (1) destabilization of small suspended and colloidal particulate matter, (2) adsorption of the colloidal and dissolved dyes to particles, and (3) forming flocculant precipitate that sweeps through the water, entangling tiny suspended, colloidal, and dissolved particles as they settle or float. Furthermore, during coagulation, factors such as raw wastewater parameters, coagulant type, coagulation pH, and dose of coagulation affect the coagulation performance. The optimum combination of these parameters can produce a high-efficiency treatment process [47]. Thus, in this study, during the determination of coagulant dosage (Alum), all possible factors affecting the coagulant performance were observed, as shown in Figure 13a–d and Table 2. In the context of using UFBs, we also observed the optimum coagulant in the presence of UFBs during treatment, as shown in Figure 13e–h and Table 3.
Table 2.
The TSS, TDS, pH, and ORP at various coagulant concentrations without UFBs.
Table 3.
The TSS, TDS, pH, and ORP at various coagulant concentrations with UFBs.
Figure 13a shows that the optimum coagulant dosage was 1.5 ppm, as indicated by the lowest TSS at a height of 10 cm. This result indicated that an insoluble precipitate formed at a 1.5 ppm dosage of coagulants and a dissolved dye colloid became enmeshed in the amorphous precipitates. This is one of the most common methods to destabilize a turbid suspension and is usually called sweep coagulation. Theoretically, sweep floc is a non-selective process that aggregates colloidal-size particles [48]. With this characteristic, adding many precipitate particles can improve the likelihood of colloidal interaction with dye wastewater colloid and promote floc formation. This is particularly advantageous in low-turbidity water [49]. The presence of Alum coagulant increased the waste–water’s ORP and TDS, as shown in Figure 13b,c and Table 2. Moreover, this sweep floc mechanism is most prevalent in wastewater treatment applications where the pH is around 6–7 (Figure 13d), which leads to amorphous precipitates.
Figure 13e describes the TSS of wastewater at various coagulant dosages when UFBs were present. The result showed that at dosage of 0.5 ppm, the TSS was highest compared to others at all levels of height (10, 18, and 26 cm). Thus, when UFBs were present in the dye wastewater containing coagulant, the obtained optimum dosage was reduced significantly to 0.5 ppm compared to 1.5 without UFBs, a three–fold reduction compared to with and without bubbling, as shown in Figure 13e and Table 3. If only UFBs were present, the ORF would be negative (−21 mV); this meant that reduction dominated the reaction, as shown in Figure 13f. In contrast, the ORP of the wastewater was very high (200 mV) and stable at all levels, as shown in Figure 13f. A higher positive ORP indicated that the presence of UFBs was probably dominated by an oxidative reaction. This process implied the generation and subsequent reaction of hydroxyl radicals. This mechanism led to a lower optimum coagulant dosage obtained in the presence of UFBs, indicating a synergetic mechanism between coagulant and UFBs. This was also proven by the lowest TDS (50 mg/L) and pH (3–4) obtained a dosage of 0.5 ppm, as shown in Figure 13g,h. This finding indicated that an advanced oxidation process occurred due to UFBs, showing potential alternatives to decolorizing and reducing recalcitrant wastewater loads from textile dyeing and finishing effluents [50].
3.5. Test Treatment of Dyes
In the testing of the performance of WWTPs using UFBs, a scenario was created with textile waste with a Pt-Co of 1000. The value of Pt-Co, by considering the color scale of the effluent from the biological process in the WWTP industry, generally ranges between 700 and 1000 Pt-Co. Thus, this test scenario represented a treatment model that can be applied in industry to obtain WWTP system performance with UFBs that can be compared with DCAs (decoloring agents), which are very expensive and not environmentally friendly.
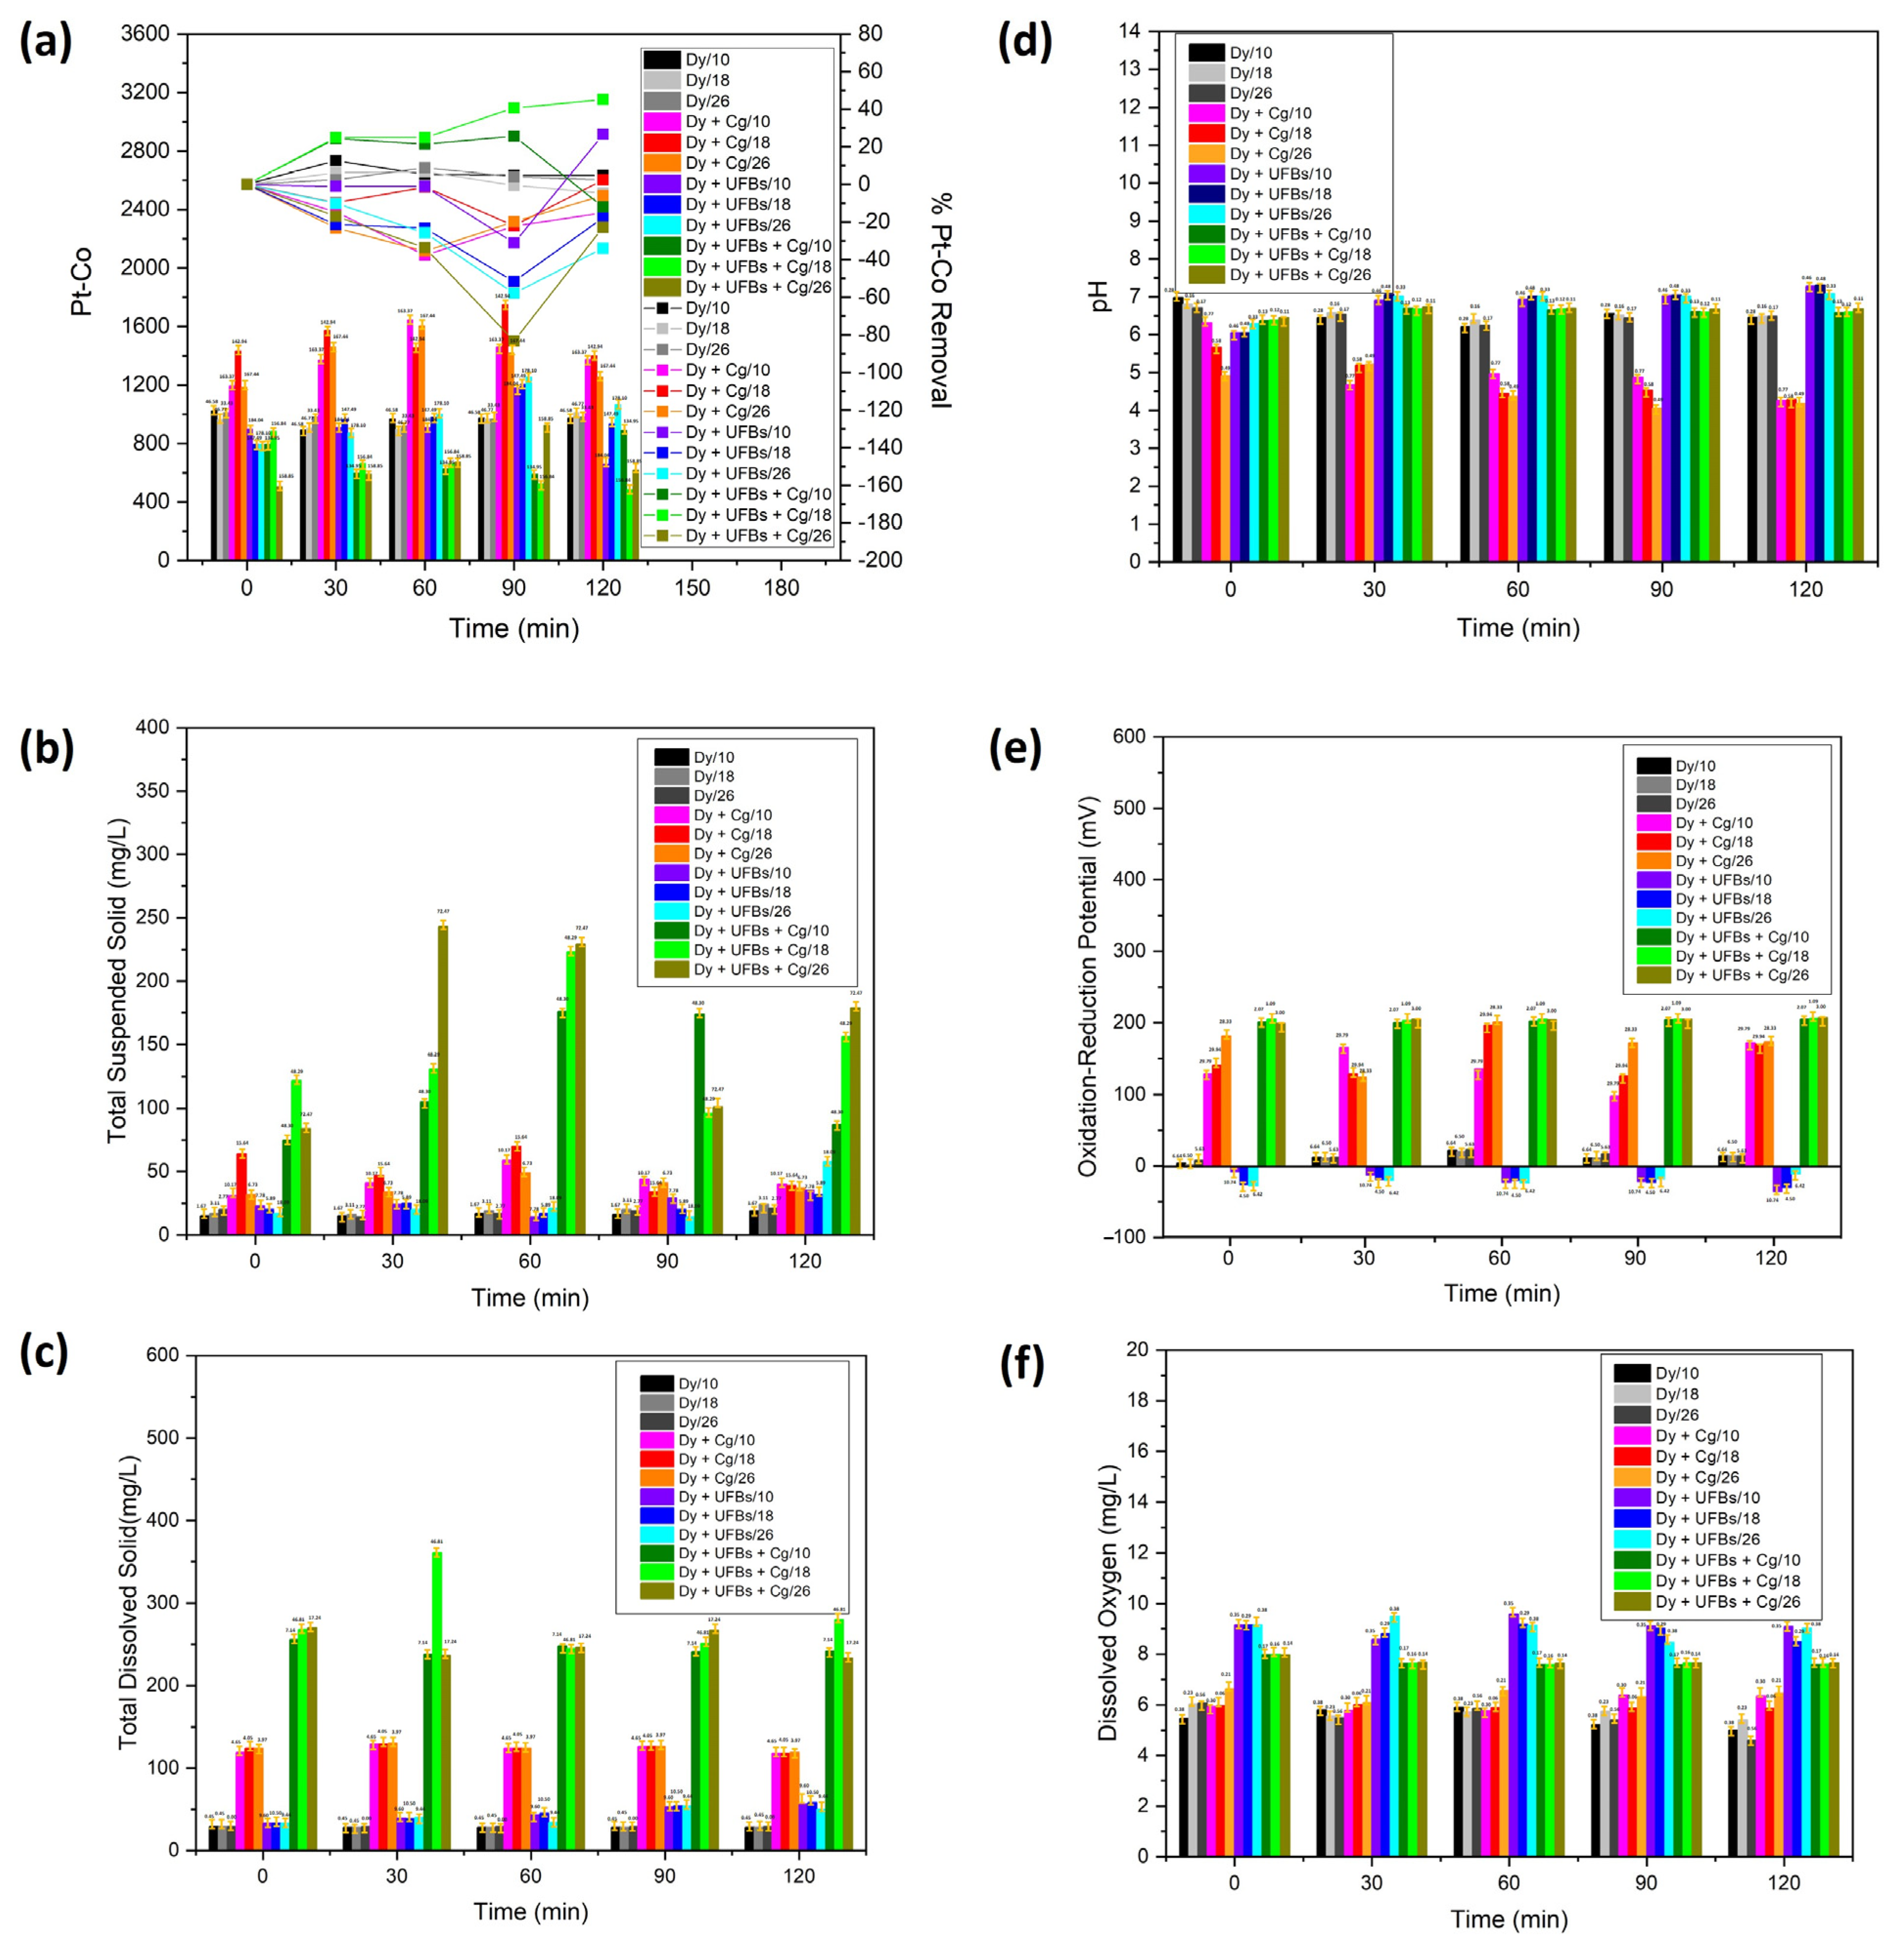
Figure 14a shows the Pt-Co scale (left y-axis) and the efficiency of removing dye waste (right y-axis) as time elapsed from 0 to 120 min. The initial value of Pt-Co at all levels (10, 18, and 26 cm) was relatively similar at 1000. Figure 14a and Table 4 show that treatment using only coagulant resulted in the Pt-Co scale rising above 1000 at all bubbling times (0, 30, 60, 90, and 120 min) and heights (10, 18, and 26 cm). The increase in Pt-Co in the chamber was due to adding a coagulant. In the treatment using only UFBs without coagulant, the effect of the UFBs bubbling treatment at 120 min was visible, while, at heights of 10 and 18 cm, the Pt-Co scale decreased. This showed that there was a degradation process of the thiocyanate compound at this level, while, at the height of 26 cm, there was a process of agglomeration of the thiocyanate compound, indicating the effectiveness of flotation, and, as a result, the Pt-Co scale increased. The results of the Pt-Co measurements for various treatment variations (dye + UFBs + coagulant) showed the highest decrease in the Pt-Co scale at 120 min and a height of 18 cm compared to other levels due to the degradation of the thiocyanate compound, with a removal efficiency of 45%. However, a lower degradation process was obtained because, at the level of 10 cm, the residence time was insufficient compared to that at 18 cm. In contrast, at 26 cm, the thiocyanate compound and the coagulant were agglomerated and floated by UFBs’ movement to the surface. Therefore, the Pt-Co increased significantly due to the rebounding of the degraded thiocyanate compound on the surface [40].
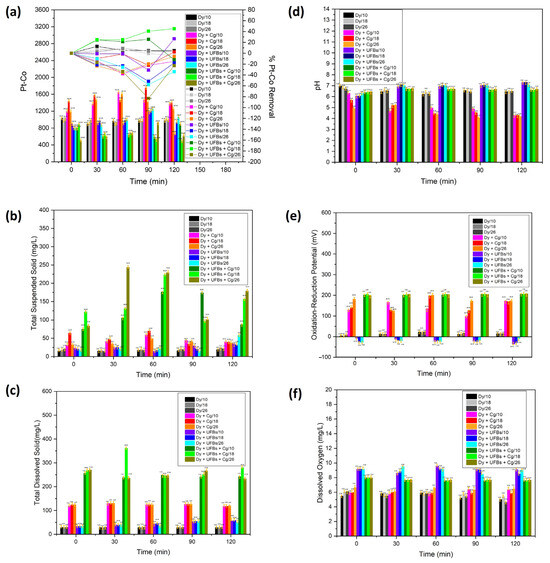
Figure 14.
The textile wastewater quality with various bubbling times, treatments, and height levels: (a) Pt-Co, (b) TSS, (c) TDS, (d) pH, (e) ORP, and (f) DO.
Table 4.
The textile wastewater quality with various bubbling times, treatments, and height levels.
The TSS was the highest at 50 mg/L at 18 cm and 60 min (Figure 14b,c and Table 4). The TDS was stable as time elapsed (124 mg/L). In contrast, when only UFBs were used, the highest TSS was 26 mg/L at 26 cm and 120 min. The TDS was 45 mg/L at 18 cm and 120 min. In contrast, the results of the TSS measurements for various treatment variations (dye + UFBs + coagulant) for WC-UFBs at 120 min and a height of 26 cm showed the highest TSS value of 167 mg/L. The highest TDS value at 120 min and a height of 18 cm reached 281 mg/L. This result designated that the degradation occurred at 18 cm and 120 min, while the agglomeration and flotation occurred at 26 cm; this result was consistent with the observed Pt-Co in Figure 14a. Also note that the highest removal efficiency results occurred for a height of 18 cm with a bubbling time of 120 min, as in Figure 14a. Therefore, the synergy between the degradation and coagulation processes was sequentially optimal.
Figure 14d,e and Table 4 show that by only using a coagulant, the pH reduced as time elapsed. On the contrary, the ORP tended to increase as time elapsed, which indicated that it could not improve the likelihood of colloidal interaction with dye wastewater colloid and promoted floc formation. When only UFBs were applied, the highest pH (5) was obtained at 10 cm and 120 min. The highest ORP (−23 mV) was observed at 18 cm and 120 min. Thus, the negative value of ORP directed reduction activities to increase [31]. The pH and ORP were stable at correspondingly 6.5 and 200 mV for various treatment variations (dye + UFBs + coagulant). Remarkably, in this scenario, the positive ORP ascribed to the oxidation process increased [31], probably due to the continuously generated oxygen. The ORP drop was involved in consuming the strong oxidant, H2O2 [49]. The ORP of the water was significantly improved and the water became more oxidant with the addition of a coagulant (Alum). The other important parameter was pH reduction by adding Alum, which created a more acidic environment [50].
Figure 14f shows that the DO was stable at 5 mg/L when only a coagulant was used; no additional oxygen was dissolved in the chamber. In contrast, when only UFBs were used, the DO was high and stable at 9 mg/L due to the addition of oxygen to the chamber by fine bubbles. Moreover, the DO was steady but tended to occur at a lower level of 7.7 mg/L for the various treatments (dye + UFBs + coagulant) since oxygen could be used in the degradation process. The stability of the DO properties attributed to UFBs continuously produced ROS, which was utilized for degradation [36,37,38].
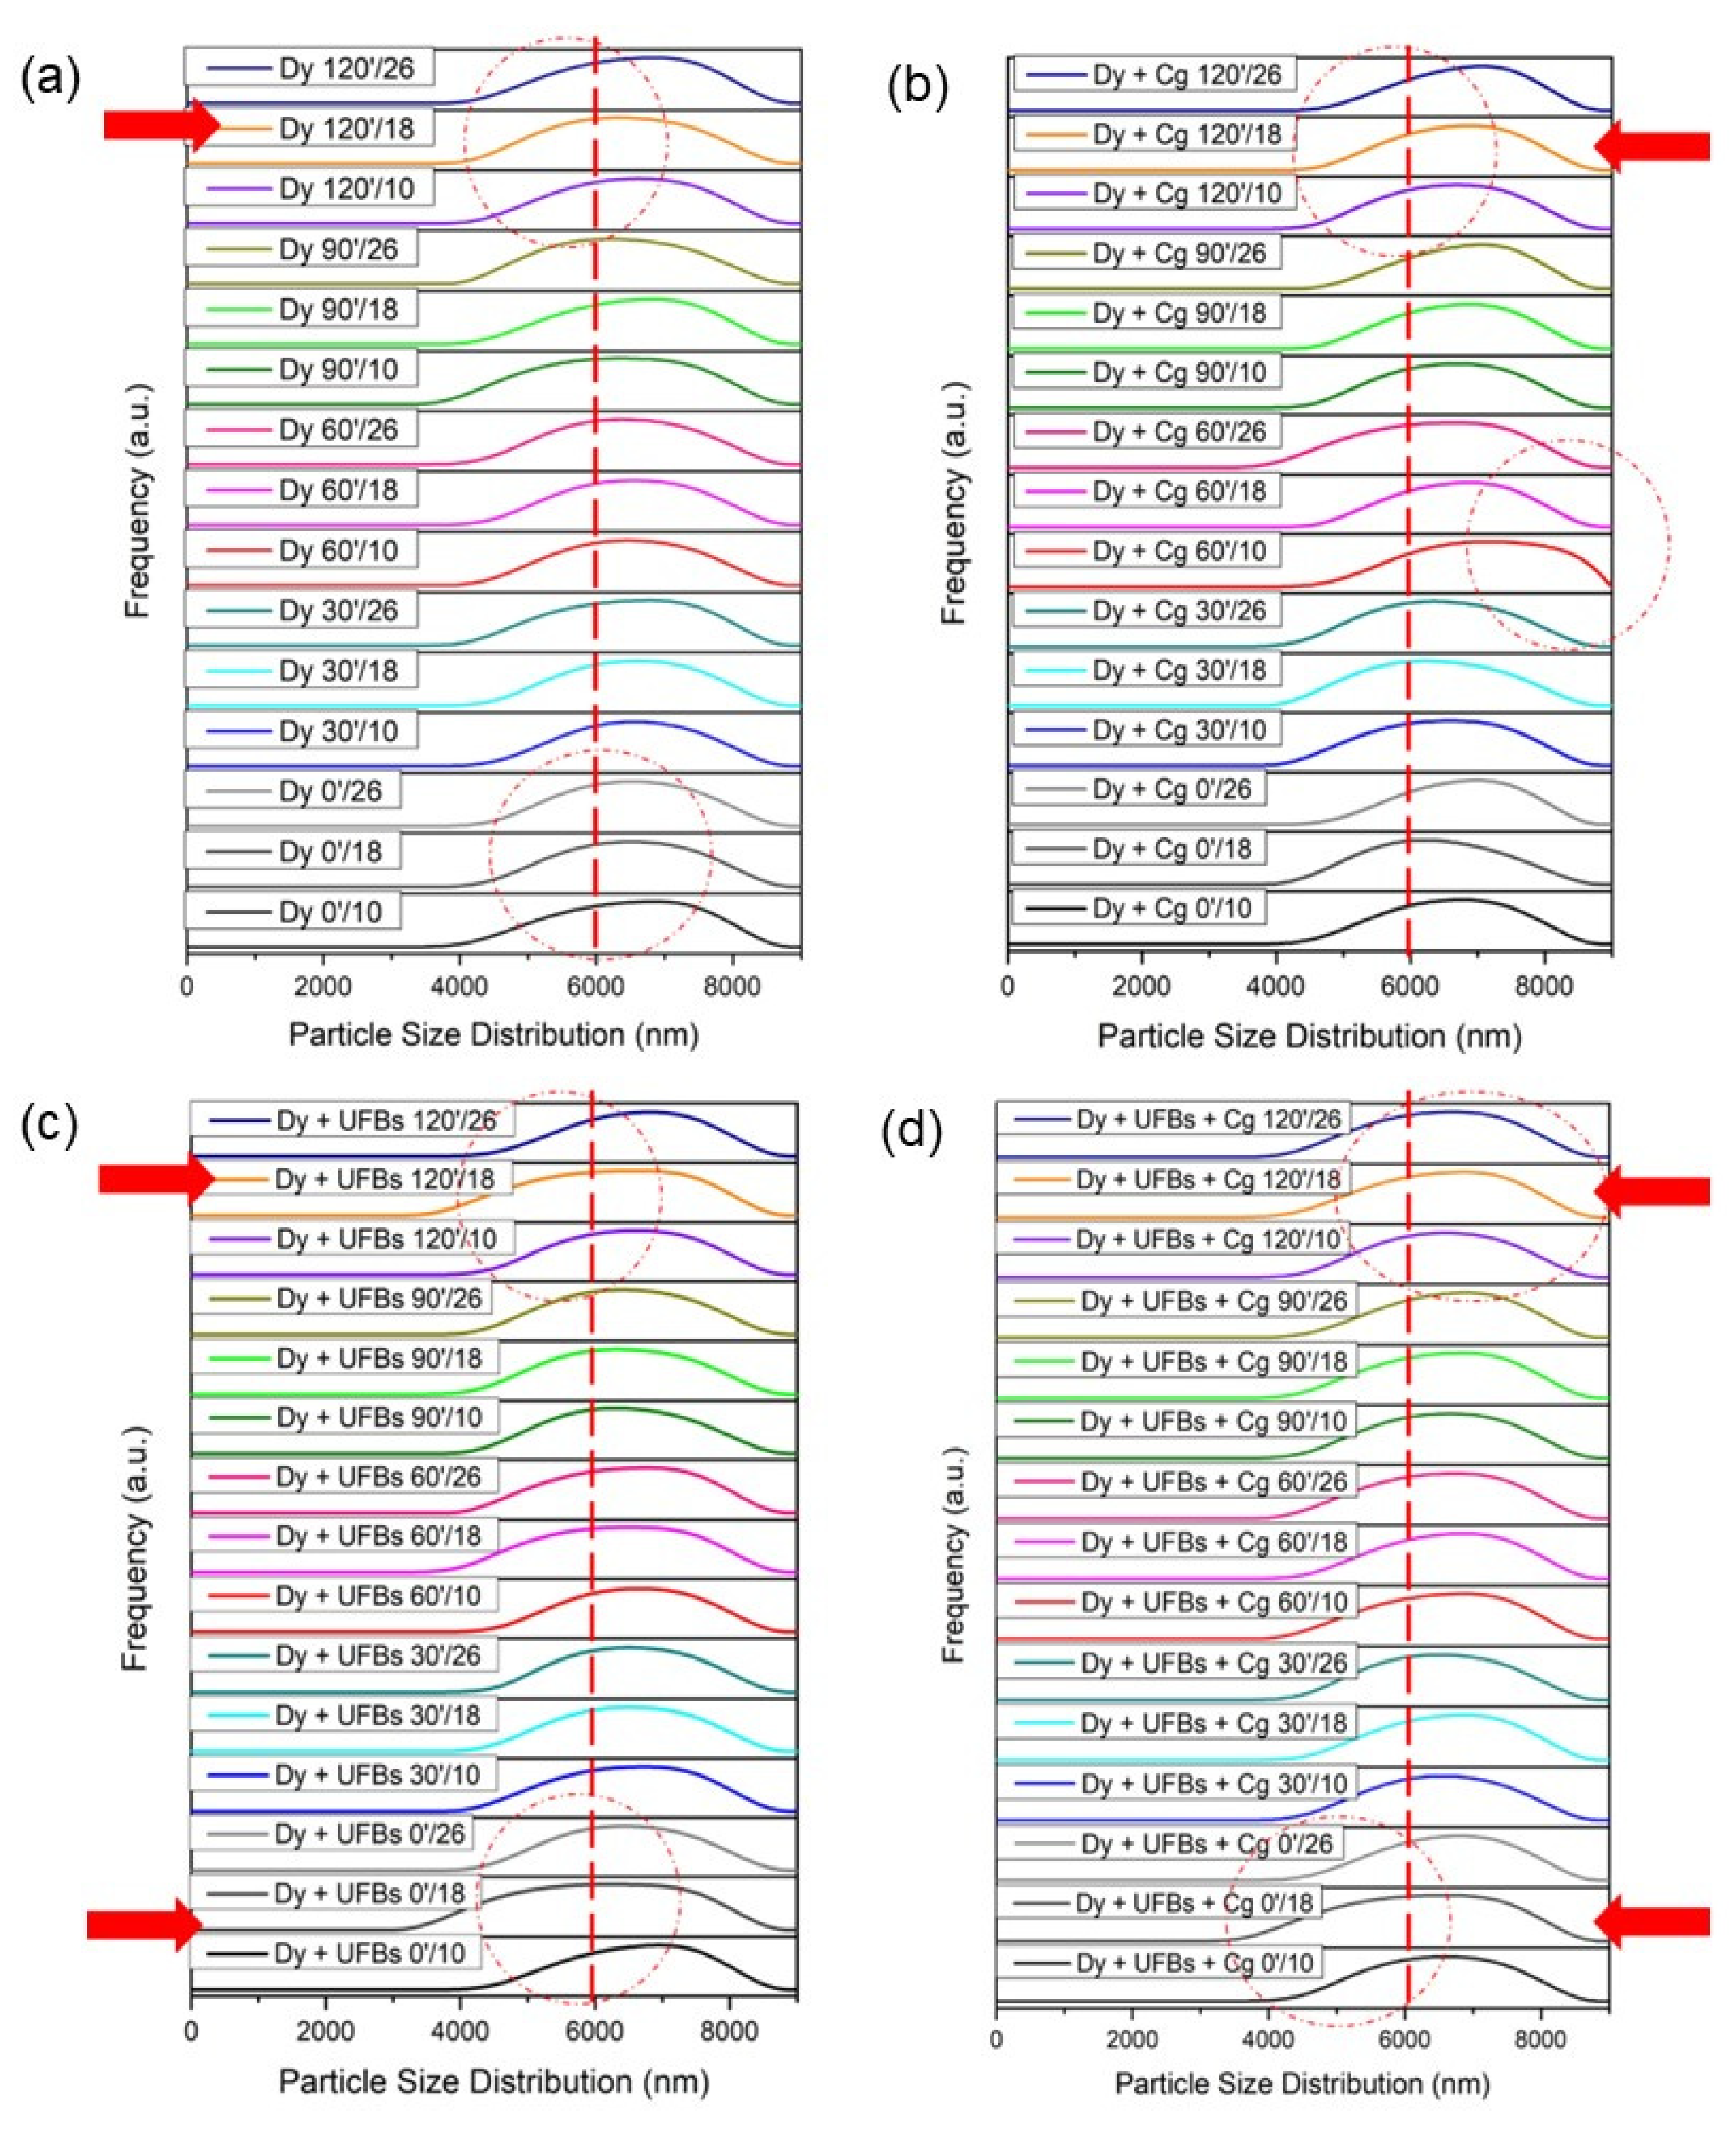
Figure 15a shows that the initial condition for the particle size of the dye was around 6000 nm or 6 microns, with various heights and processing times (Table S5). When the coagulant was added, it can be seen that the particle size of the dye increased to more than 6000 nm (Figure 15b). In the Dy + Cg 60′/10 treatment process, the particle size distribution increased, and some distribution shifted away from the 6000 nm point. This condition may have occurred because the dye experienced aggregation. Figure 15c shows that when the UFB process was added, the particle size of the dye decreased; this can be seen from several graphs that shift toward the left which is highlighted in red arrow, and dash line-circle (Table S6). This occurred due to the reaction or degradation of dyes/pigments due to ROS. Figure 15d shows that the use of UFBs and coagulants caused some particles to become smaller and some particles to enlarge compared to the initial size of the dye, meaning that UFBs and coagulants worked together in the process of dye degradation and aggregation in the coagulation process. Other researchers have reported that possible mechanisms for the formation of aggregates of particles and bubbles in micro–bubble flotation technology are owing to the following: (1) the entrapment of preformed bubbles in large floc structures and (2) particle collision and adhesion with preformed bubbles [9].
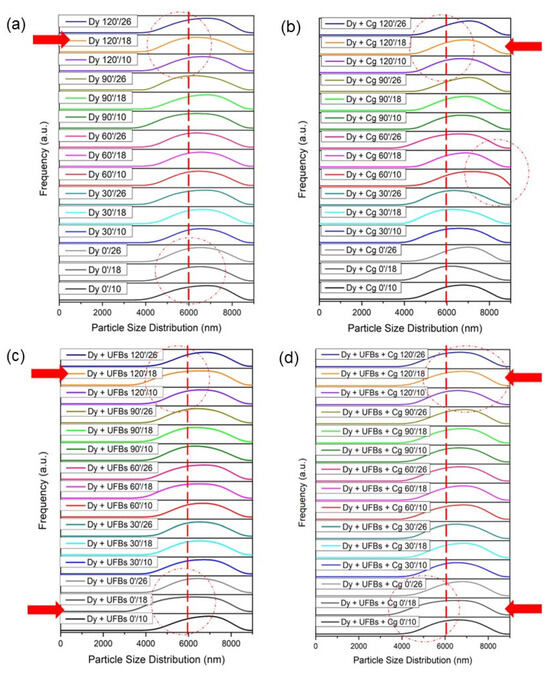
Figure 15.
Size distribution: (a) dye, (b) dye + coagulant, (c) dye + UFBs, and (d) dye + UFBs + coagulant.
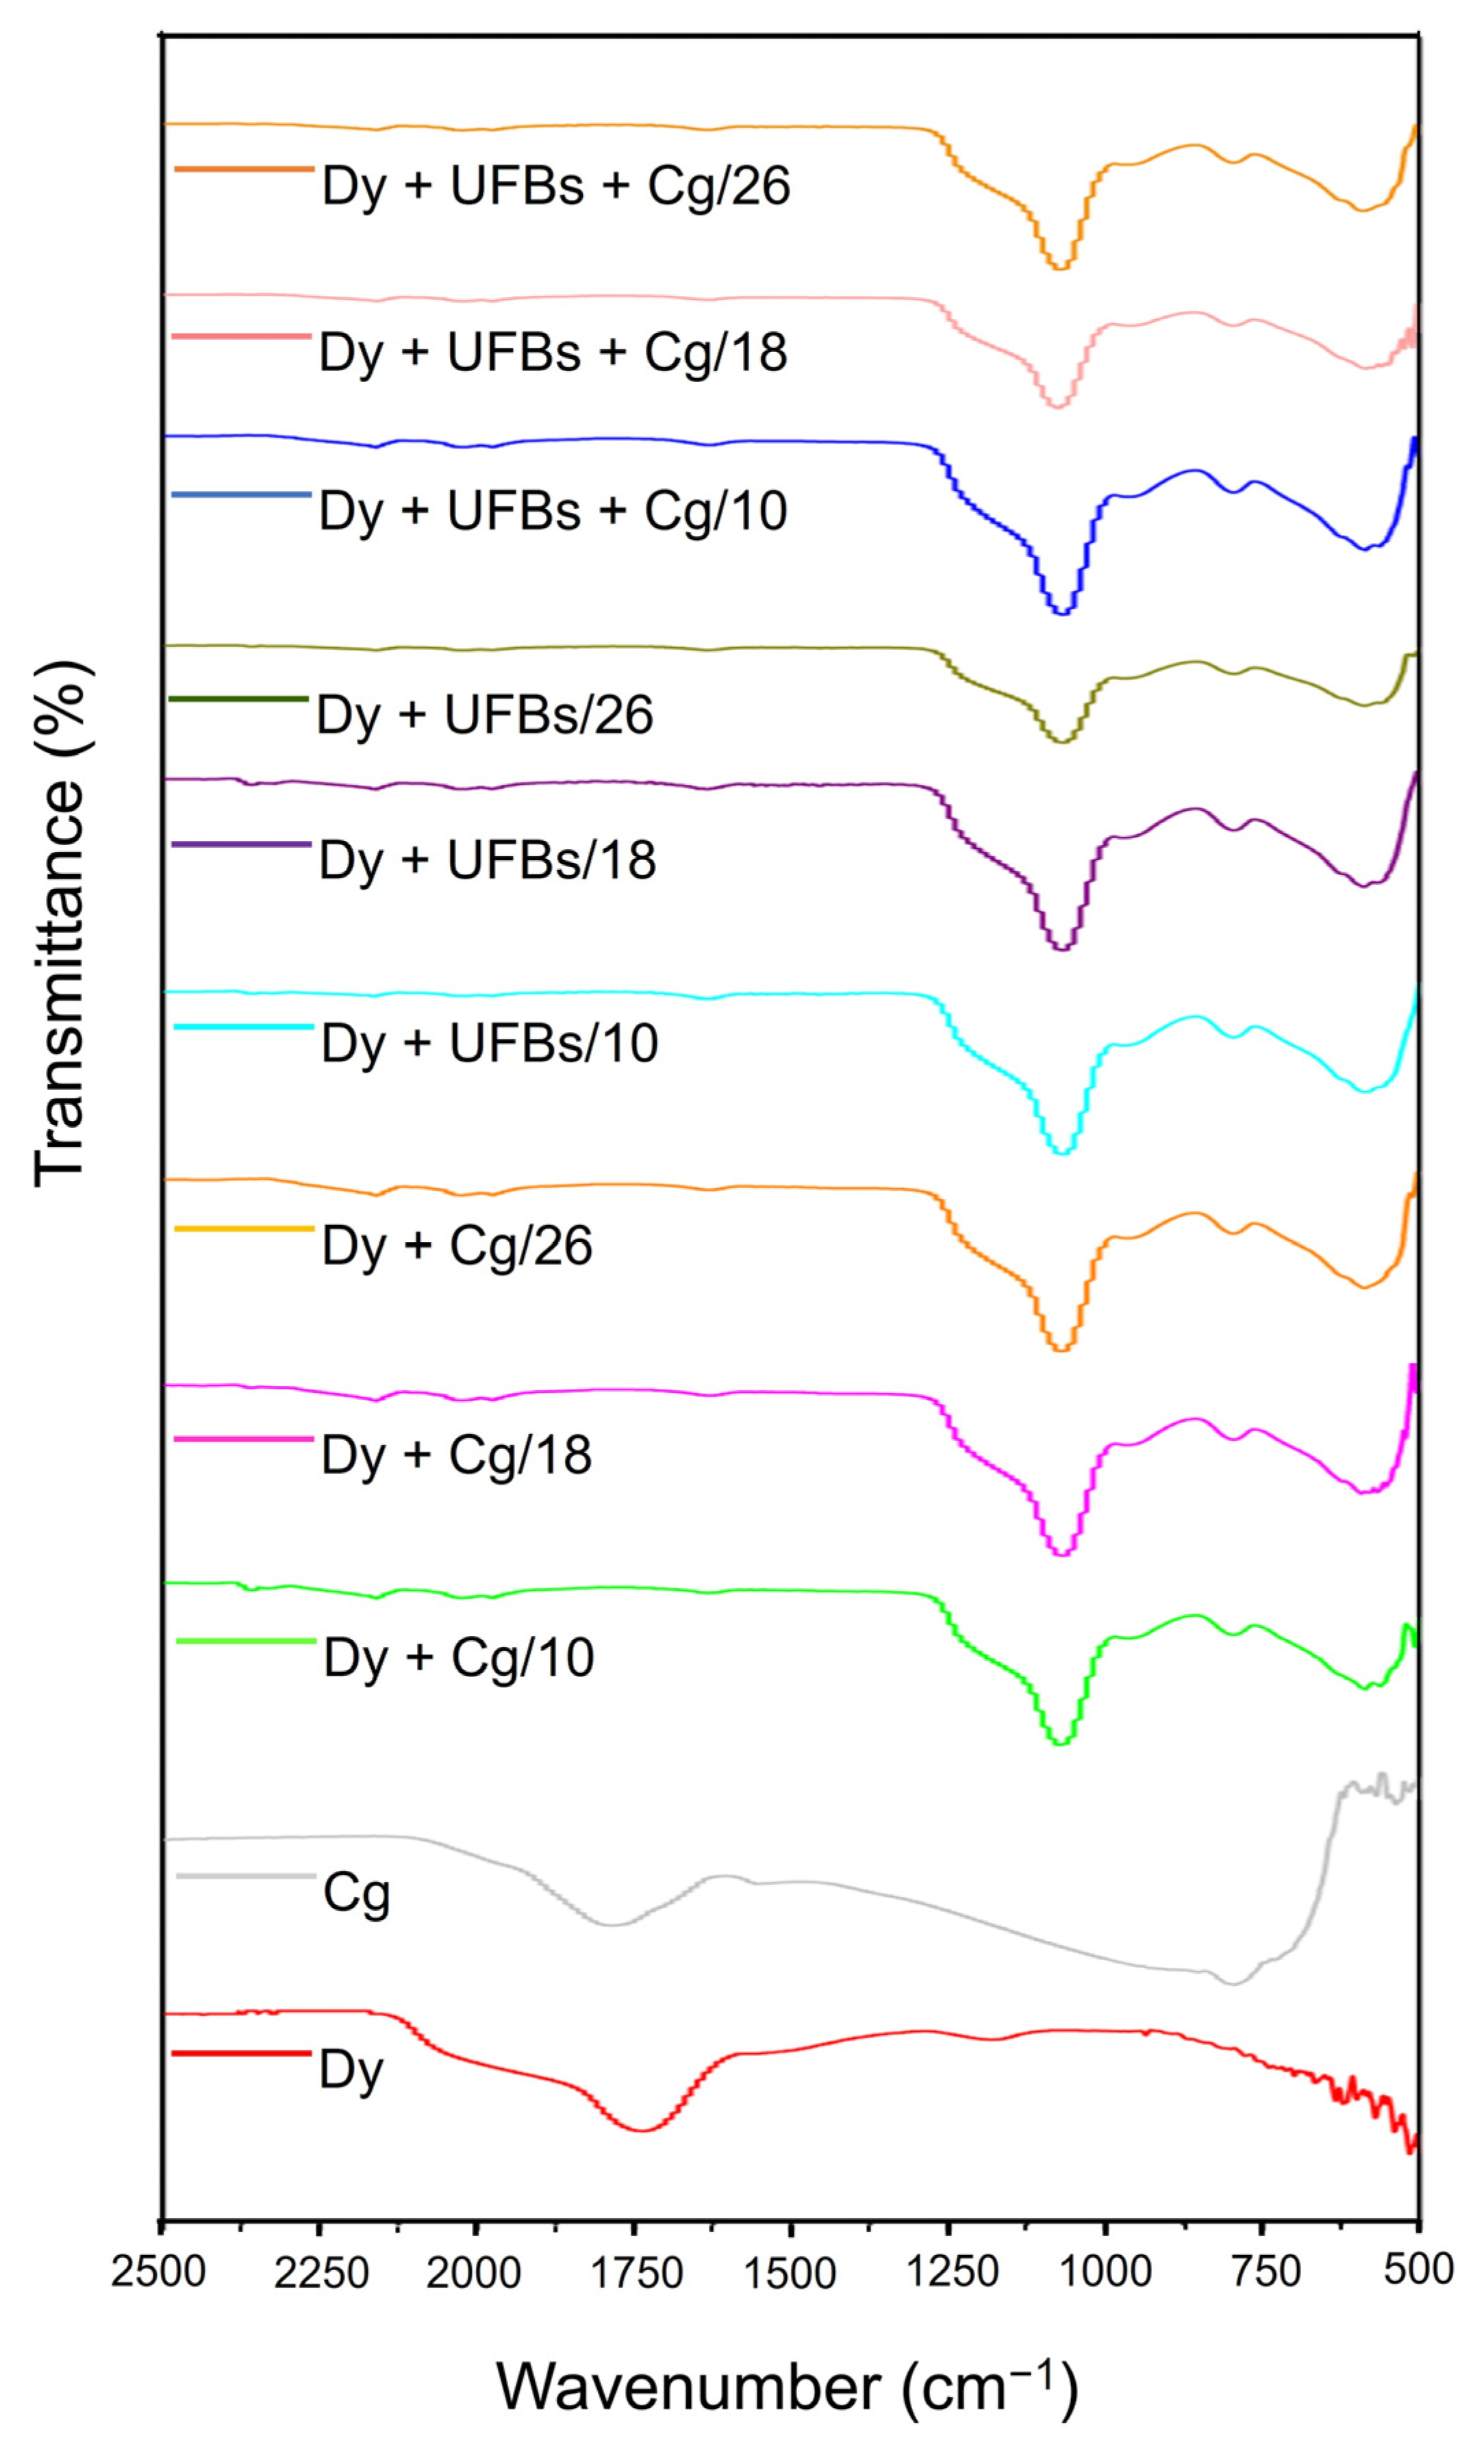
Referring to the FTIR results in Figure 16 and characteristic peaks in Table 5, several functional groups were formed and disappeared. When adding coagulant to the dye solution, the Allene compound C=C=C was not observed at any level (10, 18, and 26 cm). Likewise, when adding the dye + UFBs and dye + UFBs + coagulant treatments, the Allene compound C=C=C was also not observed. The thiocyanate S-C≡N and iso thiocyanate N=C=S groups were detected in all samples before treatment and after treatment at 18 cm; however, in the dye + UFBs treatment at a height of 10 and 26, these two groups were not detected. Thus, it was concluded that the degradation process of dyes occurred at a height of 18 cm.
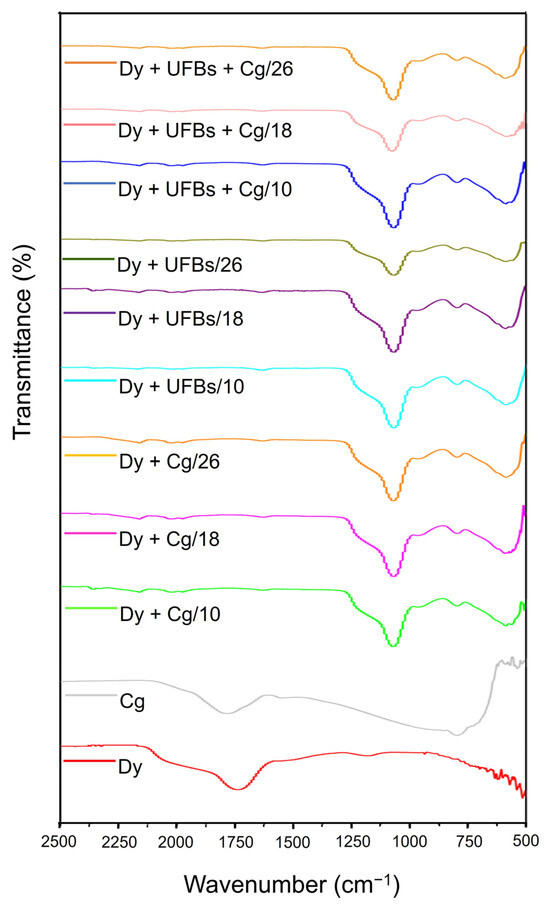
Figure 16.
The FTIR at various treatments in comparison to coagulants and dyes.
Table 5.
FTIR characteristic peaks.
The XRF results in Table 6 indicate that several elements were detected in all treatments. The dominant coagulants were Al and S, indicating the presence of Alum. The Fe element was seen in the dye solution, but the Fe concentration decreased when treated with dye + coagulant and dye + UFBs. The Fe concentration increased again in the dye + UFBs + coagulant treatment because the degraded Fe was trapped and settled by the coagulant during the process.
Table 6.
The elemental composition of samples in different experimental scenarios from XRF measurements.
Based on Figure 17, the dye sample with UFBs at a height of 18 cm had the highest intensity compared to the others at a wavelength of 413 nm. This shows that the PL test results showed degradation occurrence. It is well reported that emissions due to sulfur vacancies are around 420 nm [51].
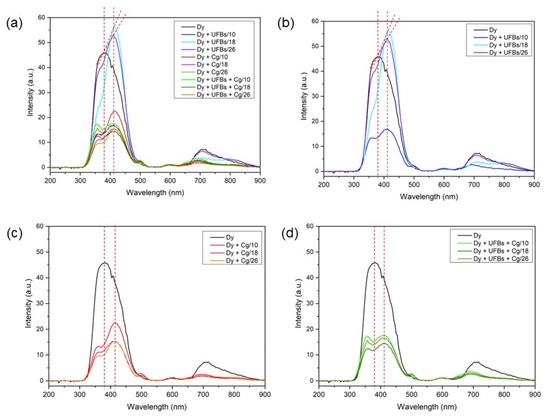
Figure 17.
Photo Luminesce (PL): (a) all samples, (b) dye + UFBs, (c) dye + coagulant, and (d) dye + UFBs + coagulant.
3.6. Proposed Mechanism of Dye Degradation, Mineralization, and Flotation
The subject of AOPs using UFBs capable of generating ROS presents a fascinating investigation that questions ROS roles in the oxidation, degradation, and mineralization of dyes and flotation. Hydroxyl radicals (•OH) are highly reactive and considered one of the strongest oxidizing agents. They have an unpaired electron, making them extremely reactive and capable of initiating radical chain reactions. Hydroxyl radicals play a crucial role in the oxidative degradation of dyes. When •OH reacts with dye molecules, it breaks down their chemical structure, leading to decolorization. Additionally, •OH can attack organic dyes, by abstracting hydrogen atoms or adding oxygen atoms. This process ultimately leads to the mineralization of dyes into simpler, non-colored compounds. The hydroxyl radical’s ability to attack various functional groups within dye molecules contributes to their efficient degradation. On the other hand, Superoxide anions (O2−) are less potent oxidizing agents compared to hydroxyl radicals. They are formed during the incomplete reduction of molecular oxygen (O2). Superoxide anions are involved in the initial steps of ROS-mediated degradation. They can react with dyes, leading to the formation of other ROS. However, their direct role in dye mineralization is limited. Instead, they serve as precursors for other more potent ROS, such as hydroxyl radicals, which actively participate in dye degradation [52]. In contrast, hydrogen peroxide (H2O2) is a relatively weak oxidizing agent compared to hydroxyl radicals. It is a stable compound and serves as an intermediate in ROS-mediated reactions [53]. H2O2 plays a dual role and can directly oxidize dye molecules, leading to partial degradation.
Thiocyanate degradation has been previously shown [54,55] to be associated with stimulation in the cyanase activity of this organism, suggesting that the degradation pathway is via cyanate (Figure 18). Thiocyanate is hydrolyzed to cyanate and sulfide. The cyanate then undergoes hydrolysis to form ammonia and carbon dioxide. The sulfide is oxidized to produce tetrathionate via thiosulfate. Hydrogen cyanide is a toxic gas that may enter the environment from both natural processes and human industrial activities. It may exist in polymeric forms. The cyanide compounds in which cyanide can be obtained as CN– are classified as simple and complex cyanides. Cyanide is toxic to many biological systems and is well known to be poisonous to humans and animals [37]. Thiocyanate biodegradation [54] processes occur as follows:
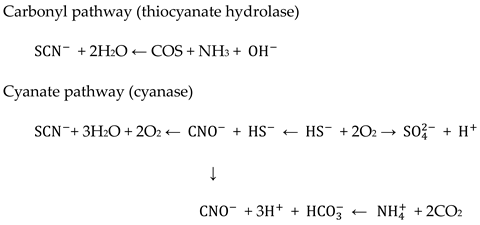
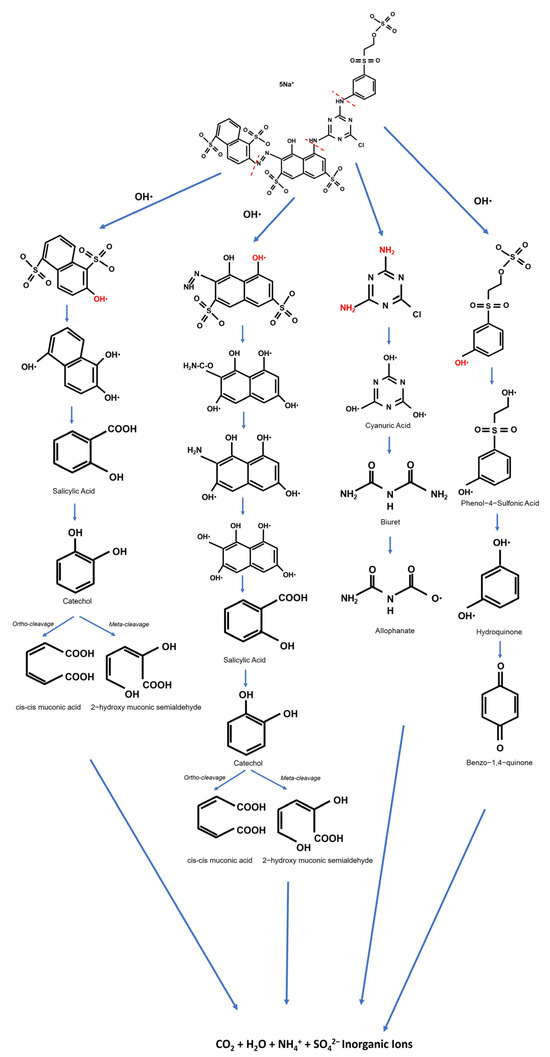
Figure 18.
The possible degradation pathways of Navacron Ruby S-3B at a level of 18 cm with the involvement of ultrafine bubbles.
Figure 18.
The possible degradation pathways of Navacron Ruby S-3B at a level of 18 cm with the involvement of ultrafine bubbles.
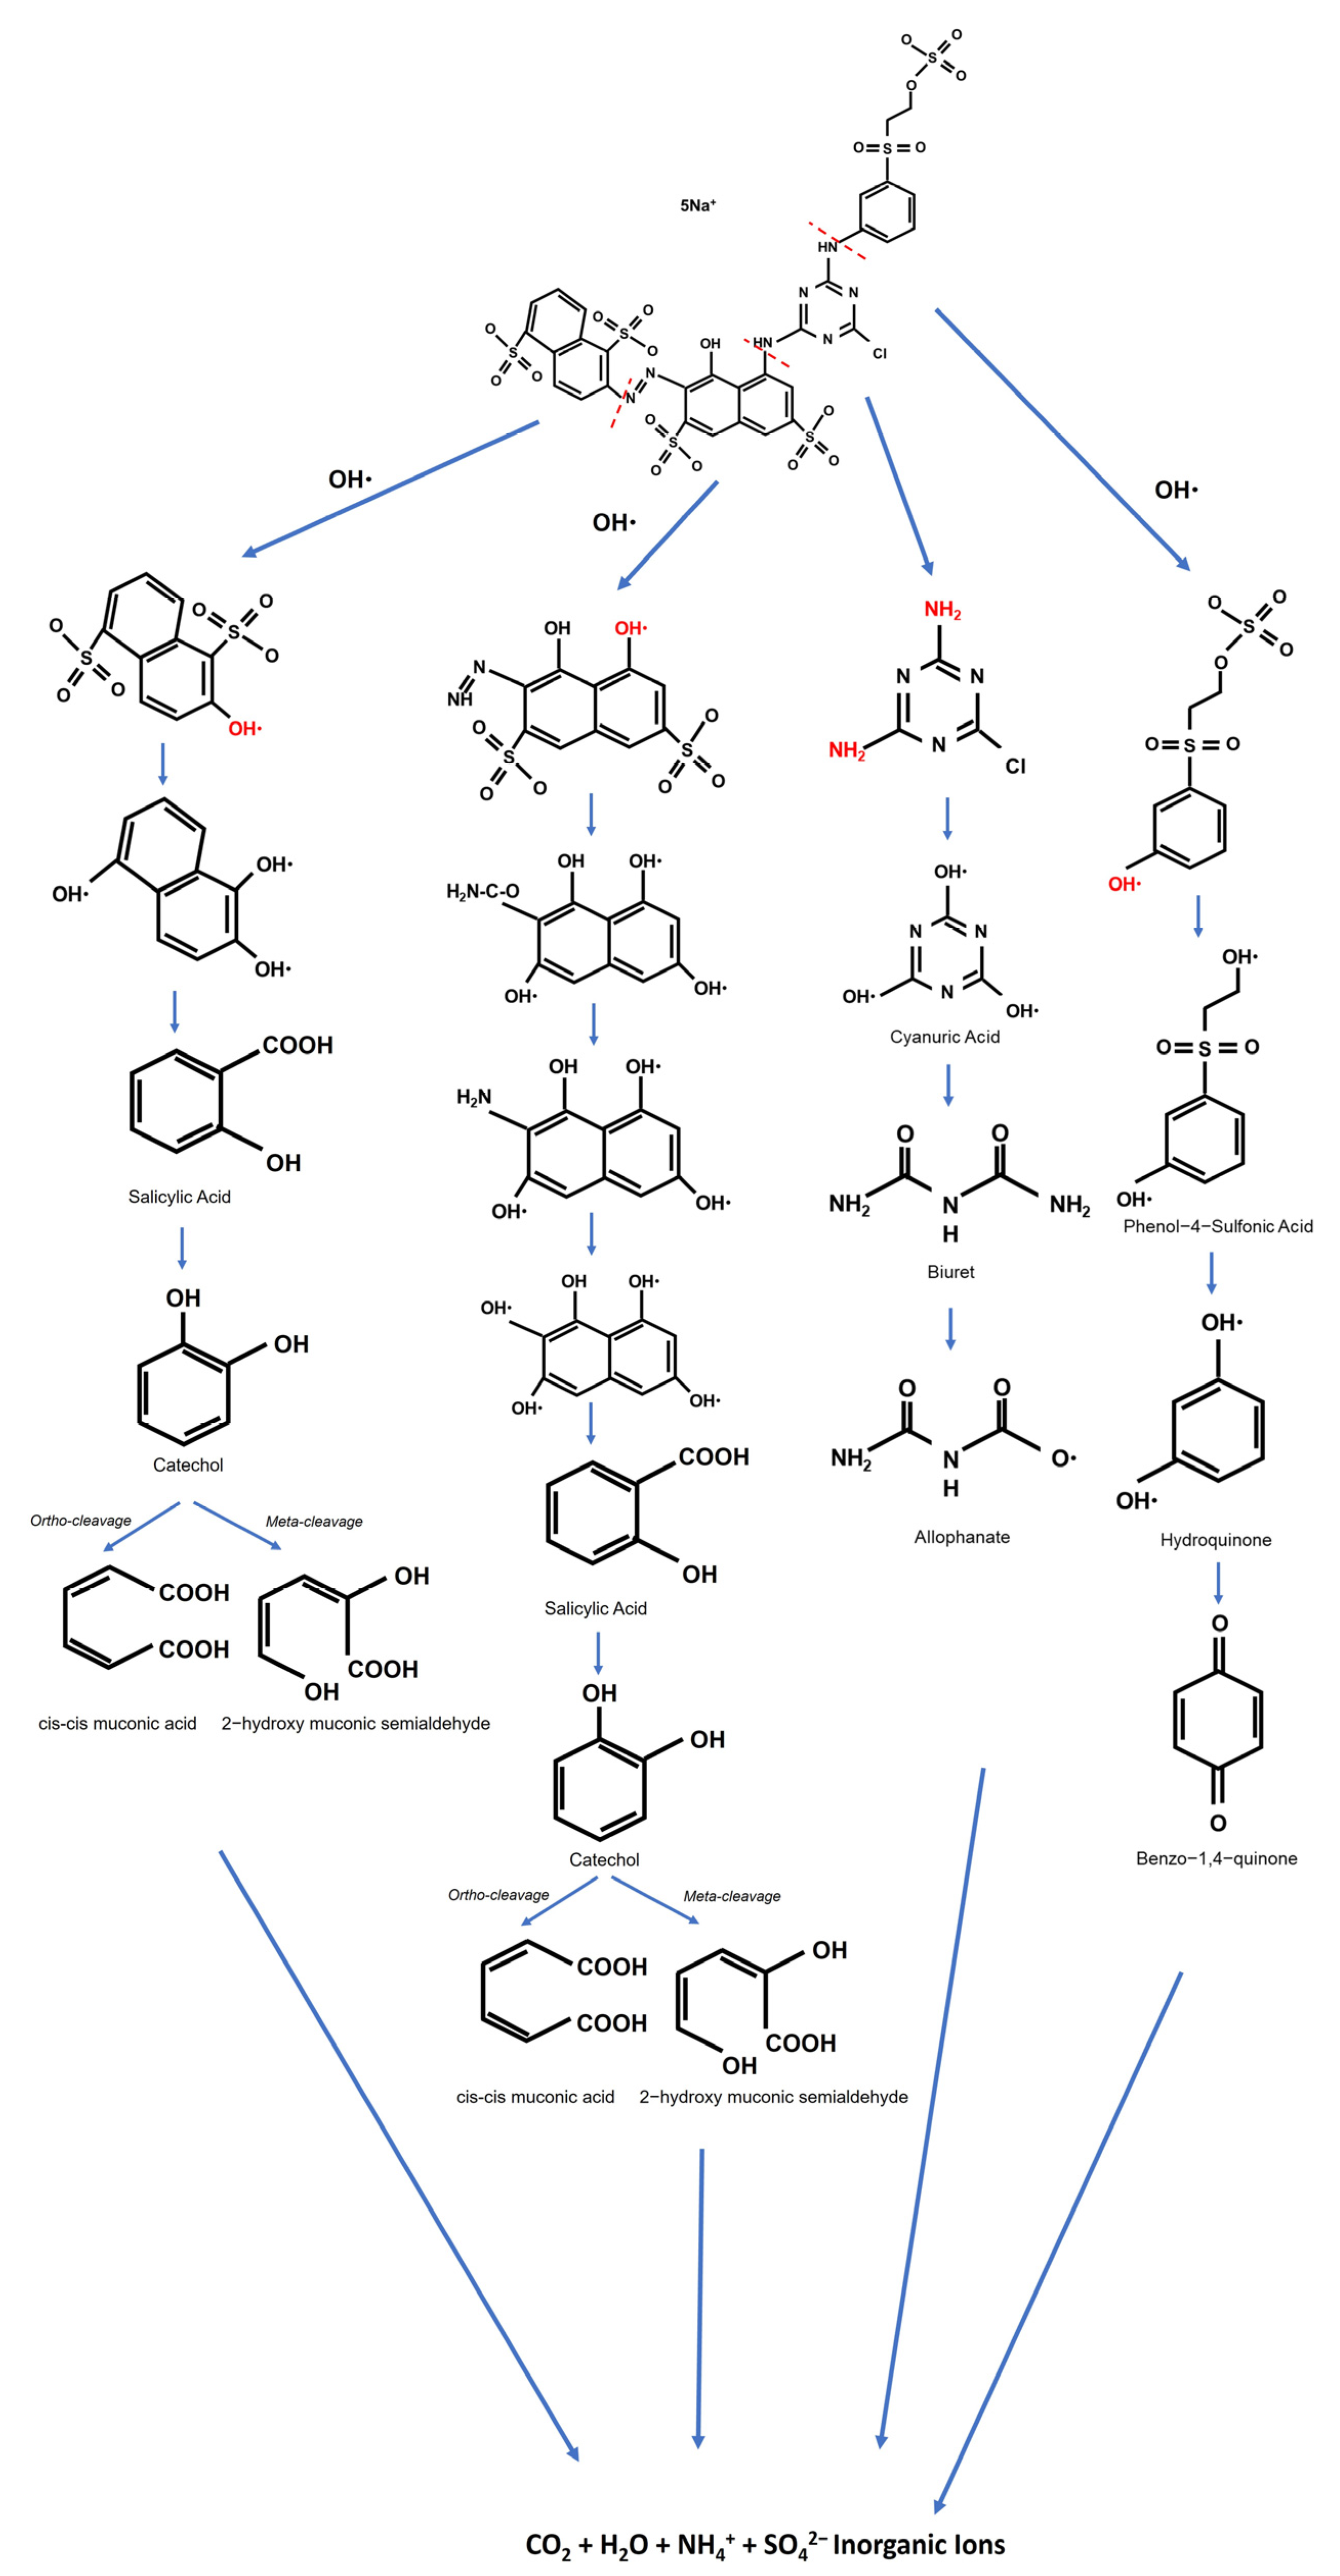
The direct oxidation of by hydrogen peroxide proceeds rather slowly. To accelerate the production of HCN, a catalyst should be added to the reactive mixture. It is known that nonselective and highly oxidative hydroxyl radicals are formed in the presence of hydrogen peroxide and ferrous or ferric salts. The process is based on electron transfer reactions between hydrogen peroxide and ferrous ions (Fe2+), the combination of which makes what is called Fenton’s reagent. When the catalyst is other than Fe2+ (e.g., ferric ions (Fe3+)), the reaction proceeds similarly but is known as the Fenton-like process.
Moreover, the Navacron Ruby S-3B dye solution contained thiocyanate, resulting in iron ions (Fe3+) indicated by the color of the solution turning blood-red due to the formation of a complex between iron and thiocyanate. Then, the H2O2 reacted with Fe3+, according to the Fenton reaction [56,57] shown in Equations (12) and (13), generating hydroxyl radicals and enhancing the overall degradation process. According to the Fenton reaction, ferrous iron(II) is oxidized by H2O2 into ferric iron(III), a hydroxyl anion, and a hydroxyl radical. The concentration of ferrous iron is equal to the concentration of the hydroxyl radical.
The Fenton and Fenton-like systems can be described by the following reactions
Thus, H2O2 is also involved in the mineralization of dyes by breaking down their chromophoric structures into simpler compounds [53]. Thus, hydroxyl radicals are the most powerful oxidizing agents among the three, followed by superoxide anions and hydrogen peroxide.
Mordechai L. Kremer criticized reactions with Fe2+ ions at high concentrations of H2O2, where O2 evolution reaches a limit, and this limit is not foreseen by the free radical model [58]. At lower [H2O2], because of a disallowed substitution in the equation used, the interpretation is not valid. It proposed that the reactions can proceed through non-radical intermediates of the type FeO2+ and FeO3+. However, in this study, the solution was in saturated oxygen (rich oxygen) by applying UFBs continuously, and the free radical model may be applied in this context.
Considering the pathways and various interactions observed in the previous characterization, we proposed a mechanism for how the degradation process was formed. It was illustrated that at the beginning, the colloidal dyes were precipitated by coagulant. However, this mechanism did not significantly reduce the color of the textile waste (Figure 19a). Remarkably, as illustrated in Figure 19b, when UFBs were introduced, the dyes were degraded due to the presence of ROS created by UFBs following the pathways explained in Figure 18, and the free radical model of the Fenton-like reaction occurred. Finally, the fragmented dyes were trapped and settled by the coagulant during the bubbling process, and the precipitated particle floated to the surface of the chamber. Hence, the interaction of coagulants and UFBs synergistically enabled the degradation process to occur for the colloidal dye of textile waste.
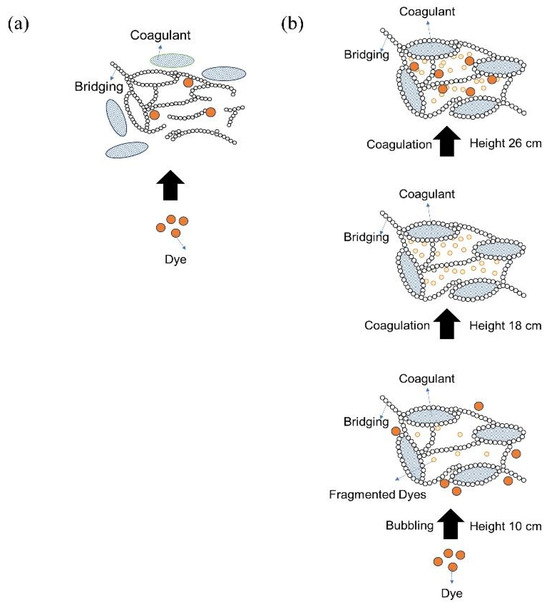
Figure 19.
The mechanism of the dye–coagulant–UFBs interaction: (a) interaction of dye + coagulant and (b) interaction of dye + coagulant + UFBs.
4. Conclusions
It was discovered that the ideal coagulant dose (Alum) in the treatment of the Navacron Ruby S-3B dye solution without bubbling was 1.5 ppm; in comparison, the proper coagulant dose in the dye solution using ultrafine bubbles (UFBs) was 0.5 ppm. Therefore, Alum could be used more efficiently and reduced to a lower dose—66 percent—when UFB was used at 3 LPM. The Navacron Ruby S-3B dye solution was successfully degraded by the UFBs up to a 45 percent reduction in the Pt-Co color scale with only a 120 min bubbling time and a minimal dosage of coagulant (0.5% ppm), as opposed to the 1.5 ppm commonly used for Navacron Ruby S-3B dye solution treatment without UFBs. The hydroxyl radical that UFBs generate facilitates the oxidation process of Navacron Ruby S-3B dye, which breaks chemical bonds, as confirmed by FTIR, XRF, and PL spectroscopy results.
H2O2 plays a dual role, directly oxidizing dye molecules and partially degrading dyes through Fenton-like reactions with free radical models in the presence of high concentrations of oxygen due to the continuous application of UFBs. Moreover, the water AOP mechanism based on UFBs was proposed. Therefore, the use of UFBs water AOPs (UFBs–WAOPs) is emphasized as an affordable and environmentally safe alternative to chemicals or decolorizing agents for the treatment of textile wastewater.
Supplementary Materials
The following supporting information can be downloaded at https://www.mdpi.com/article/10.3390/w16121678/s1: Table S1: The sample code at various setups coagulant concentrations with different reactor levels; Table S2: The calibration of pressure in terms of air flowrate; Table S3: FTIR characteristic peaks of red dyes Navacron Ruby S-3B; Table S4: XRF result showing elemental composition; Table S5: The size distribution of the colloidal particle at various treatments without bubbling; Table S6: The size distribution of the colloidal particle at various treatments without bubbling.
Author Contributions
Conceptualization, D.R.S., S.S., D.S. and I.M.J.; methodology, D.R.S.; formal analysis, D.R.S. and E.S.H.; investigation, D.R.S.; resources, I.M.J.; data curation, D.R.S. and E.S.H.; writing—original draft preparation, D.R.S.; writing—review and editing, D.R.S. and I.M.J.; visualization, D.R.S.; supervision, S.S., D.S. and I.M.J.; project administration, E.S.H.; funding acquisition, I.M.J. All authors have read and agreed to the published version of the manuscript.
Funding
This research was funded by PROGRAM DISERTASI DOKTOR (PDD), grant number 1207/UN6.3.1/PT.00/2021, and ACADEMIC LEADERSHIP GRANT (ALG), grant number 1549/UN6.3.1/PT.00/2023”. The APC was funded by Universitas Padjadjaran.
Data Availability Statement
The data are contained within this paper.
Conflicts of Interest
The authors declare no conflicts of interest.
References
- Ismail, G.A.; Sakai, H. Review on effect of different type of dyes on advanced oxidation processes (AOPs) for textile color removal. Chemosphere 2022, 291, 132906. [Google Scholar] [CrossRef] [PubMed]
- Kumari, P.; Kumar, A. Advanced Oxidation Process: A remediation technique for organic and non-biodegradable pollutant. Res. Surf. Interfaces 2023, 11, 100122. [Google Scholar] [CrossRef]
- Pandis, P.K.; Kalogirou, C.; Kanellou, E.; Vaitsis, C.; Savvidou, M.G.; Sourkouni, G.; Zorpas, A.A.; Argirusis, C. Key Points of Advanced Oxidation Processes (AOPs) for Wastewater, Organic Pollutants and Pharmaceutical Waste Treatment: A Mini Review. Chem. Eng. 2022, 6, 8. [Google Scholar] [CrossRef]
- Wang, J.L.; Xu, L.J. Advanced oxidation processes for wastewater treatment: Formation of hydroxyl radical and application. Crit. Rev. Environ. Sci. Technol. 2012, 42, 251–325. [Google Scholar] [CrossRef]
- Guo, W.; Yang, Z.; Zhou, X.; Wu, Q. Degradation and mineralization of dyes with advanced oxidation processes (AOPs): A brief review. In Proceedings of the 2015 International Forum on Energy, Environment Science and Materials (IFEESM 2015), Shenzhen, China, 25–26 September 2015. [Google Scholar] [CrossRef]
- Sivaram, N.M.; Gopal, P.M.; Barik, D. Toxic waste from textile industries. In Woodhead Publishing Series in Energy, Energy from Toxic Organic Waste for Heat and Power Generation, 1st ed.; Barik, D., Ed.; Elsevier Ltd.: Amsterdam, The Netherlands, 2018; pp. 43–54. [Google Scholar] [CrossRef]
- Azanaw, A.; Birlie, B.; Teshome, B.; Jemberie, M. Textile effluent treatment methods and eco-friendly resolution of textile wastewater. Case Stud. Chem. Environ. Eng. 2022, 6, 100230. [Google Scholar] [CrossRef]
- Mchedlov-Petrossyan, N.O.; Kharchenko, A.Y.; Marfunin, M.O.; Klochaniuk, O.R. Nano-sized bubbles in solution of hydrophobic dyes and the properties of the water/air interface. J. Mol. Liq. 2019, 275, 384–393. [Google Scholar] [CrossRef]
- Liu, S.; Wang, Q.; Ma, H.; Huang, P.; Li, J.; Kikuchi, T. Effect of micro-bubbles on coagulation flotation process of dyeing wastewater. Sep. Purif. Technol. 2010, 71, 337–346. [Google Scholar] [CrossRef]
- Agarwal, A.; Ng, W.J.; Liu, Y. Principle and applications of microbubble and nanobubble technology for water treatment. Chemosphere 2011, 84, 1175–1180. [Google Scholar] [CrossRef]
- Oshita, S.; Boerzhijin, S.; Kameya, H.; Yoshimura, M.; Sotome, I. Promotion Effects of Ultrafine Bubbles/Nanobubbles on Seed Germination. Nanomaterials 2023, 13, 1677. [Google Scholar] [CrossRef]
- Hassaan, M.A.; Nemr, A.E. Advanced Oxidation Processes for Textile Wastewater Treatment. Int. J. Photochem. Photobiol. 2017, 2, 85–93. [Google Scholar]
- Temesgen, T.; Han, M. Ultrafine bubbles as an augmenting agent for ozone-based advanced oxidation. Water Sci. Technol. 2021, 84, 3705–3715. [Google Scholar] [CrossRef] [PubMed]
- Atkinson, A.J.; Apul, O.G.; Schneider, O.; Garcia-Segura, S.; Westerhoff, P. Nanobubble Technologies Offer Opportunities to Improve Water Treatment. Acc. Chem. Res. 2019, 52, 1196–1205. [Google Scholar] [CrossRef] [PubMed]
- Subhan, U.; Muthukannan, V.; Azhary, S.Y.; Mulhadi, M.F.; Rochima, E.; Panatarani, C.; Joni, I.M. Development and performance evaluation of air fine bubbles on water quality of thai catfish rearing. AIP Conf. Proc. 2018, 1927, 30043. [Google Scholar] [CrossRef]
- Han, Z.; Kurokawa, H.; Matsui, H.; He, C.; Wang, K.; Wei, Y.; Dodbiba, G.; Otsuki, A.; Fujita, T. Stability and Free Radical Production for CO2 and H2 in Air Nanobubbles in Ethanol Aqueous Solution. Nanomaterials 2022, 12, 237. [Google Scholar] [CrossRef]
- Takahashi, M.; Chiba, K.; Li, P. Free-Radical Generation from Collapsing Microbubbles in the Absence of a Dynamic Stimulus. J. Phys. Chem. B 2007, 111, 1343–1347. [Google Scholar] [CrossRef]
- Joni, I.M.; Azhary, S.Y.; Ridha, M.; Sulistio, E.; Lukito, H.P.; Wawan, H.; Mia, M.; Panatarani, C. Degradation of methylene blue using bubbles treatment. AIP Conf. Proc. 2020, 2219, 090004. [Google Scholar] [CrossRef]
- Bouaifi, M.; Hebrard, G.; Bastoul, D.; Roustan, M. A comparative study of gas hold-up, bubble size, interfacial area and mass transfer coefficients in stirred gas–liquid reactors and bubble columns. Chem. Eng. Process. Process Intensif. 2011, 40, 97–111. [Google Scholar] [CrossRef]
- Han, Z.; Chen, H.; He, C.; Dodbiba, G.; Otsuki, A.; Wei, Y.; Fujita, T. Nanobubble size distribution measurement by interactive force apparatus under an electric field. Sci. Rep. 2023, 13, 3663. [Google Scholar] [CrossRef] [PubMed]
- Mohseni, E.; Herrmann-Heber, R.; Reinecke, S.F.; Hampel, U. Bubble generation by micro-orifices with application on activated sludge wastewater treatment. Chem. Eng. Process.–Process Intensif. 2019, 143, 107511. [Google Scholar] [CrossRef]
- Fraga, B.; Stoesser, T. Influence of bubble size, diffuser width, and flow rate on the integral behavior of bubble plumes. J. Geophys. Res. Ocean. 2016, 121, 3887–3904. [Google Scholar] [CrossRef]
- Turner, J.S. Turbulent entrainment: The development of the entrainment assumption, and its application to geophysical flows. J. Fluid Mech. 1986, 173, 431–471. [Google Scholar] [CrossRef]
- Eskanlou, A.; Hemmati, M.; Reza, M.; Abdollahy, M. Modeling the bubble loading based on force balance on the particles attached to the bubble. Coll. Surf. A. 2019, 582, 123892. [Google Scholar] [CrossRef]
- Bombardelli, F.A.; Buscaglia, G.C.; Rehmann, C.R.; Rincón, L.E.; García, M.H. Modeling and scaling of aeration bubble plumes: A two-phase flow analysis. J. Hydraul. Res. 2010, 45, 617–630. [Google Scholar] [CrossRef]
- Wüest, A.; Brooks, N.H.; Imboden, D.M. Bubble plume modeling for lake restoration. Water Resour. Res. 1992, 28, 3235–3250. [Google Scholar] [CrossRef]
- Hunter, R.J. Zeta Potential in Colloid Science: Principles and Applications; Academic Press: Cambridge, MA, USA, 1981; ISBN 978-0123619504. [Google Scholar]
- Chen, Y.; Pignatello, J.J. Role of Quinone Intermediates as Electron Shuttles in Hydroxyl Radical Formation during Reductive Transformations of Aromatic Hydroquinones by Iron(III) in Aquatic Solutions. Environ. Sci. Technol. 1997, 31, 2399–2406. [Google Scholar] [CrossRef]
- Ohgaki, S.; Matsumoto, S. Nanobubbles: Generation Using a Multiporous Membrane and Application to Environmental Remediation. J. Environ. Sci. Health Part A 2015, 50, 1–7. [Google Scholar]
- Jameson, G.J. A New Paradigm for Flotation of Sulphide Minerals. J. Phys. Conf. Ser. 2010, 285, 012001. [Google Scholar] [CrossRef]
- Wang, X.; Wu, Y.; Chen, N.; Piao, H.; Sun, D.; Ratnaweera, H.; Maletskyi, Z.; Bi, X. Characterization of Oxidation-Reduction Potential Variations in Biological Wastewater Treatment Processes: A Study from Mechanism to Application. Processes 2022, 10, 2607. [Google Scholar] [CrossRef]
- Copeland, A.; Lytle, D.A. Measuring the oxidation–reduction potential of important oxidants in drinking water. J. AWWA 2014, 106, E10–E20. [Google Scholar] [CrossRef]
- James, C.; Copeland, R.; Lytle, D. Relationships between Oxidation-Reduction Potential, Oxidant, and pH in Drinking Water. In Proceedings of the AWWA Water Quality Technology Conference, San Antonio, TX, USA, 2004; Available online: https://api.semanticscholar.org/CorpusID:51135998 (accessed on 31 May 2024).
- Lyu, T.; Wu, S.; Mortimer, R.J.G.; Pan, G. Nanobubble Technology in Environmental Engineering: Revolutionization Potential and Challenges. Environ. Sci. Technol. 2019, 53, 7175–7176. [Google Scholar] [CrossRef]
- Fujita, T.; Kurokawa, H.; Han, Z.; Zhou, Y.; He, C.; Wei, Y.; Kurokawa, H.; Matsui, H.; Ponou, J.; Dodbiba, G. Free radical degradation in aqueous solution by blowing hydrogen and carbon dioxide nanobubbles. Sci. Rep. 2021, 11, 3068. [Google Scholar] [CrossRef] [PubMed]
- Liu, S.; Oshita, S.; Kawabata, S.; Makino, Y.; Yoshimoto, T. Identification of ROS Produced by Nanobubbles and Their Positive and Negative Effects on Vegetable Seed Germination. Langmuir 2016, 32, 11295–11302. [Google Scholar] [CrossRef]
- Harris, R.E.; Bunch, A.W.; Knowles, C.J. Microbial cyanide and nitrile metabolism. Sci. Prog. 1987, 71, 293–304. [Google Scholar]
- Favvas, E.P.; Kyzas, G.Z.; Efthimiadou, E.K.; Mitropoulos, A.C. Bulk nanobubbles, generation methods and potential applications. Curr. Opin. Colloid Interface Sci. 2021, 54, 101455. [Google Scholar] [CrossRef]
- Papapetros, K.; Sygellou, L.; Anastasopoulos, C.; Andrikopoulos, K.S.; Bokias, G.; Voyiatzis, G.A. Spectroscopic Study of the Interaction of Reactive Dyes with Polymeric Cationic Modifiers of Cotton Fabrics. Appl. Sci. 2023, 13, 5530. [Google Scholar] [CrossRef]
- de-Berg, K.C. The Iron(III) Thiocyanate Reaction: Research History and Role in Chemical Analysis. In SpringerBriefs in Molecular Science, 1st ed.; Rasmussen, S.C., Ed.; Springer: Cham, Switzerland, 2019; pp. 19–24, 2191–5415. [Google Scholar] [CrossRef]
- Budaev, S.L.; Batoeva, A.A.; Tsybikova, B.A. Degradation of thiocyanate in aqueous solution by persulfate activated ferric ion. Miner. Eng. 2015, 81, 88–95. [Google Scholar] [CrossRef]
- Galan, J.; Trilleras, J.; Zapata, P.A.; Arana, V.A.; Grande-Tovar, C.D. Optimization of Chitosan Glutaraldehyde-Crosslinked Beads for Reactive Blue 4 Anionic Dye Removal Using a Surface Response Methodology. Life 2021, 11, 85. [Google Scholar] [CrossRef] [PubMed]
- León-Luque, A.J.; Barajas, C.L.; Peña-Guzmán, C.A. Determination of the Optimal Dosage of Aluminum Sulfate in the Coagulation-Flocculation Process Using an Artificial Neural Network. Int. J. Environ. Sci. Dev. 2016, 7, 346–350. [Google Scholar] [CrossRef]
- Cui, H.; Huang, X.; Yu, Z.; Chen, P.; Cao, X. Application progress of enhanced coagulation in water treatment. RSC Adv. 2020, 10, 20231–20244. [Google Scholar] [CrossRef]
- El-taweel, R.M.; Mohamed, N.; Alrefaey, K.A.; Husien, S.; Abdel-Aziz, A.B.; Salim, A.I.; Mostafa, N.G.; Said, L.A.; Fahim, I.S.; Radwan, A.G. A review of coagulation explaining its definition, mechanism, coagulant types, and optimization models; RSM, and ANN. Curr. Res. Green Sustain. Chem. 2023, 6, 100358. [Google Scholar] [CrossRef]
- Sheng, D.P.W.; Bilad, M.R.; Shamsuddin, N. Assessment and Optimization of Coagulation Process in Water Treatment Plant: A Review. ASEAN J. Sci. Eng. 2023, 3, 79–100. [Google Scholar] [CrossRef]
- Koul, B.; Bhat, N.; Abubakar, M.; Mishra, M.; Arukha, A.P.; Yadav, D. Application of Natural Coagulants in Water Treatment: A Sustainable Alternative to Chemicals. Water 2022, 14, 3751. [Google Scholar] [CrossRef]
- Bouznif, S.; Bali, M. Coupling of the coagulation/flocculation and the anodic oxidation processes for the treatment of textile wastewater. AQUA- Water Infrastruct. Ecosyst. Soc. 2021, 70, 587–599. [Google Scholar] [CrossRef]
- Kang, Y.G.; Yoon, H.; Lee, C.S.; Kim, E.J.; Chang, Y.S. Advanced oxidation and adsorptive bubble separation of dyes using MnO2-coated Fe3O4 nanocomposite. Water Res. 2019, 151, 413–422. [Google Scholar] [CrossRef] [PubMed]
- Sadeghi, F.; Vissers, A.J.W.H. Experimental Investigation of Bubble Size in Flotation: Effect of Salt, Coagulant, Temperature, and Organic Compound. SPE Prod. Oper. 2020, 35, 384–392. [Google Scholar] [CrossRef]
- Sharma, M.; Jain, T.; Singh, S.; Pandey, O.P. Photocatalytic degradation of organic dyes under UV-Visible light using capped ZnS nanoparticles. Sol. Energy 2012, 86, 626–633. [Google Scholar] [CrossRef]
- Krumova, K.; Cosa, G. Singlet Oxygen: Applications in Biosciences and Nanosciences; Nonell, S., Flors, C., Nonell, S., Flors, C., Eds.; The Royal Society of Chemistry: London, UK, 2016; Chapter 1; pp. 1–21. [Google Scholar] [CrossRef]
- Jomova, K.; Alomar, S.Y.; Alwasel, S.H.; Eugenie, N.; Kamil, K.; Marian, V. Several lines of antioxidant defense against oxidative stress: Antioxidant enzymes, nanomaterials with multiple enzyme-mimicking activities, and low-molecular-weight antioxidants. Arch. Toxicol. 2024, 98, 1323–1367. [Google Scholar] [CrossRef] [PubMed]
- Stratford, J.; Dias, A.E.X.O.; Knowles, C.J. The utilization of thiocyanate as a nitrogen source by a heterotrophic bacterium: The degradative pathway involves formation of ammonia and tetrathionate. Microbiology 1994, 140, 2657–2662. [Google Scholar] [CrossRef] [PubMed]
- Ebbs, S. Biological degradation of cyanide compounds. Curr. Opin. Biotechnol. 2004, 15, 231–236. [Google Scholar] [CrossRef]
- Sayan, L.B.; Agnes, A.B.; Belegma, A.T. Effect of Fenton-like reactions on the degradation of thiocyanate in water treatment. J. Environ. Chem. Eng. 2014, 2, 1907–1911. [Google Scholar] [CrossRef]
- Kremer, M.L. Mechanism of the Fenton reaction. Evidence for a new intermediate. Phys. Chem. Chem. Phys. 1999, 1, 3595–3605. [Google Scholar] [CrossRef]
- Kremer, M.L. Initial Steps in the Reaction of H2O2 with Fe2+ and Fe3+ Ions: Inconsistency in the Free Radical Theory. Reactions 2023, 4, 171–175. [Google Scholar] [CrossRef]


Disclaimer/Publisher’s Note: The statements, opinions and data contained in all publications are solely those of the individual author(s) and contributor(s) and not of MDPI and/or the editor(s). MDPI and/or the editor(s) disclaim responsibility for any injury to people or property resulting from any ideas, methods, instructions or products referred to in the content. |
© 2024 by the authors. Licensee MDPI, Basel, Switzerland. This article is an open access article distributed under the terms and conditions of the Creative Commons Attribution (CC BY) license (https://creativecommons.org/licenses/by/4.0/).