Article

Analysis of Two-Dimensional Hydraulic Characteristics of Vertical-Slot, Double-Pool Fishway Based on Fluent

1
School of Energy and Power Engineering, Xihua University, Chengdu 610039, China
2
Key Laboratory of Fluid and Power Machinery, Ministry of Education, Xihua University, Chengdu 610039, China
3
Key Laboratory of Fluid Machinery and Engineering, Xihua University, Chengdu 610039, China
*
Author to whom correspondence should be addressed.
Water 2024, 16(12), 1695; https://doi.org/10.3390/w16121695
Submission received: 25 April 2024 / Revised: 5 June 2024 / Accepted: 7 June 2024 / Published: 14 June 2024
(This article belongs to the Special Issue The Application of Numerical Modeling in Fluid Dynamics)

Abstract

:
Research shows that the novel vertical-slot, double-pool fishway can reduce the flow velocity at the vertical slots of the fishway, enhance the efficiency of the water flow in the chambers, and increase the fish passage area and migratory corridor for fish. Utilizing Fluent, two-dimensional and three-dimensional models of the novel fishway were established, and numerical simulation analysis was conducted on their hydraulic characteristics. The results indicate that the flow velocity at the cross-section of the middle vertical slot in the fishway pool decreases horizontally from left to right and increases vertically from top to bottom, with similar water flow distribution patterns on different vertical lines. The flow conditions and hydraulic characteristics of the surface, middle, and bottom layers in the pool are similar, mainly characterized by planar, two-dimensional flow. The error between the trajectory of the water flow in the main flow area and the maximum velocity value is within 10%. The novel vertical-slot, double-pool fishway retains the planar binary characteristics of traditional vertical-slot fishways. The results of the two-dimensional numerical simulation can be analogized to the vertical uniformization of the three-dimensional numerical simulation, providing support for the study of its two-dimensional numerical simulation of hydraulic characteristics and presenting a theoretical basis for the structural design and construction of fishways.

1. Introduction

Dams play an important role in flood control, increasing flow during the dry season, enabling irrigation and navigation, and promoting the harmonious development of economic society and the ecological environment [1,2,3]. However, the increasing stress on river ecosystems caused by the construction and development of water conservancy projects may lead to a decline in fish species richness and biodiversity, causing a blow to river ecosystems [4,5,6]. Therefore, fishways, which are complementary water conservancy structures, emerged. Fishways are artificial channels for fish to migrate upstream through structures such as gates and dams or natural obstacles. They can utilize the internal structure of the fishway (such as baffles and vertical slits) to improve the flow pattern and enable fish to migrate upstream smoothly [7,8,9]. Among them, the vertical-slot fishway (VSF) is widely used in fishway engineering due to its structural characteristics, such as relatively uniform vertical velocity distribution, adaptability to large water level variations upstream and downstream, and suitability for fish migrating upstream with different preferences for water depth [10,11]. In comparison to the traditional VSF, the vertical-slot, double-pool fishway offers more diverse velocity information within the vertical slot, superior energy dissipation, enhanced adaptability to high water levels, and a favorable impact on the upstream migration behavior of fish.
With the development of technology in recent years, the analysis of hydraulic characteristics of fishways is usually conducted using computer numerical simulations to improve the efficiency of fishway design and optimization. Among them, the Volume of Fluid (VOF) model is a frequently used method, which is a surface tracking method under fixed Eulerian grid conditions. Barton and Keller [12] studied the VSF using three-dimensional (3D) numerical simulations and compared the flow velocity components and water depth changes with the data from corresponding physical model experiments. They concluded that the RNG κ-ε turbulence model in the gas–liquid, two-phase flow VOF can accurately obtain the flow field information of the vertical slot fishway.
Domestic and international scholars have conducted extensive physical model experiments and numerical simulation studies to demonstrate that the flow pattern in the pool of the traditional vertical-slot fishway (VSF) exhibits dual characteristics. Wu S. [13] and others found, through experimental research, that there was no significant difference in the flow pattern between the upper and lower layers when the slope of the fishway was below 5%, showing a clear two-dimensional (2D) characteristic. However, when the slope was 10% and 20%, there were more significant differences in the flow pattern between the upper and lower layers, exhibiting 3D characteristics. Bian Yonghuan [14] conducted several hydraulics studies on the traditional VSF and found that, within the pool of the VSF, the vertical velocity component was significantly smaller compared to the horizontal velocity component and could be ignored, indicating strong planar dual characteristics of the flow within the pool. The 2D numerical simulation of the flow pattern in a conventional pool was similar to the flow situation in the surface, middle, and bottom planes of the 3D mathematical model, indicating that the results of the two-dimensional numerical simulation were a uniform representation of the 3D numerical simulation in the vertical direction. In practical applications, the design slope values for fishway projects are usually less than 5%. Therefore, researchers often adopt a planar 2D mathematical model for numerical simulation studies of the VSF fishway. Most of the novel VSF designs proposed by scholars at home and abroad based on the traditional VSF retain their dual characteristics. For example, Wang Xinlei [15] and others proposed a novel spiral fishway where the flow pattern in the mid-water-depth plane of the fishway at different water depths was approximately the same. The velocity distribution in the main flow area and recirculation area was consistent, and the water depth had little effect on the flow pattern and velocity distribution in the pool and gap. However, some novel VSF designs do not exhibit dual characteristics. For instance, Li Heng [16] and others used a 3D mathematical model to numerically simulate and analyze the flow pattern within the pool of a VSF with a trapezoidal cross-section. The study revealed that the flow within the trapezoidal fishway exhibited significant 3D characteristics. Ma Weizhong [17] and others pointed out in their study of a combined vertical-slot and surface-outlet fishway that the flow pattern within the pool exhibited distinct 3D flow field characteristics. Based on the above research, this paper takes the novel double-pool, vertical-slot fishway as the research object and comprehensively carries out 3D numerical simulations and 2D numerical simulations to investigate and analyze whether the novel double-pool, vertical-slot fishway exhibits dual characteristics. This study aims to provide a reference for subsequent fishway engineering design and research.

2. Materials and Methods

2.1. Numerical Framework

In this study, the Volume of Fluid (VOF) multiphase flow method was adopted to track the free liquid surface. In the numerical experiment, due to the open-channel design of the fishway, the VOF model was widely applied to accurately simulate the dynamic changes of the free surface flow; its governing equations are as follows:
a w + a a = 1
a w t + a w x a = 0
where aa represents the volume fraction of gas and aw represents the volume fraction of the water.
In terms of turbulence, the improved and optimized RNG k-ε model and the velocity-pressure coupling SIMPLE algorithm are adopted for numerical simulation calculations of the fishway. The RNG k-ε model can correct the turbulent viscosity and possesses high computational accuracy, enabling a better simulation and calculation of transient flow or swirling flow [12,18]. The expressions of each equation are as follows:
The k -equation is
( ρ k ) t + ( ρ u a k ) x a = x b [ ( α k μ e f f ) k x b ] + G k + G b ρ ε γ M + S k .
The ε -equation is
( ρ ε ) t + ( ρ u a ε ) x b = x b [ ( α ε μ e f f ) ε x b ] + C 1 ε ε k ( G k + C 3 ε G b ) C 2 ε ρ ε 2 k R ε + S ε .
In this formula, aa is the volume fraction of gas; aw is the volume fraction of water; ρ is the fluid density; k is the turbulent kinetic energy; u a is the velocity tensor; ε is the turbulent dissipation rate; μ is the hydrodynamic viscosity; μ e f f is the corrected dynamic viscosity; x a and x b are coordinate tensors; G k is the generation phase of turbulent kinetic energy caused by average velocity; G b is the generation phase of turbulent kinetic energy caused by floating; γ M is the contribution of pulsation expansion to the overall turbulent dissipation rate in compressible turbulence; C 1 ε , C 2 ε , and C 3 ε are empirical constants C 1 ε = 1.42, C 2 ε = 1.68, and C 3 ε = 1.72; α k , α ε = 1.393; R ε is an additional item; S k , S ε is a custom source phase; η is the ratio of turbulence time scale to the average time scale: η = S k ε ; C μ and β are constants: C μ = 8.54 × 10⁻², β = 0.012; and η 0 is the ratio of the turbulence time scale to the mean flow time scale: η 0 = 4.38.

2.2. Mathematical Model

2.2.1. Model Development

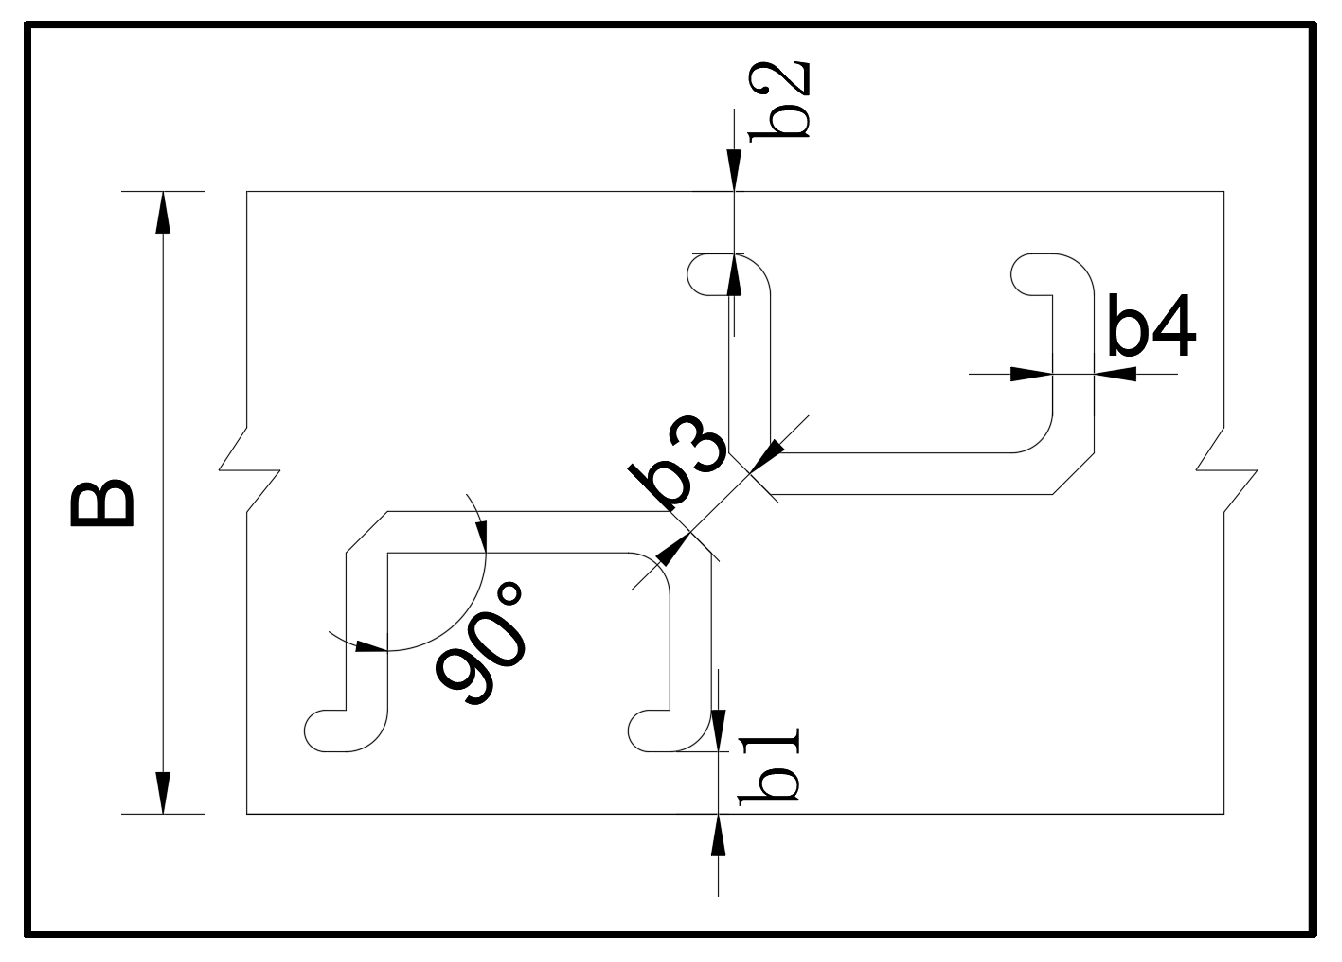
To establish a 3D model of the vertical-slot, double-pool fishway, each unit of the fishway with vertical slots and double-pool structure was composed of a new multi-stage, U-shaped baffle; base plate; and side wall. When the fishway was operating, the side vertical slots were set between each stage of the U-shaped baffle and the side wall, and intermediate vertical slots were set between the U-shaped baffles of each stage [19]. The U-shaped baffles divided the fishway into multiple unit pools, as shown in Figure 1. A detailed diagram is shown in Figure 2. The arrow direction in the figure represents the direction of water flow. The total length of the fishway was initially proposed to be L = 25.54 m, and the width of the fishway pool was B = 3.00 m. The length of the unit composed of two U-shaped baffles was l = 3.60 m, and it was proposed to set up a total of 5 stages of fishway pools. The inlet boundary was 3.60 m away from the first stage of U-shaped baffle, and the 10th stage of U-shaped baffle was 3.60 m away from the outlet boundary. The thickness of the U-shaped baffle was 0.20 m, the baffle elbow was 90°, and the outer edge was circular. The side vertical slots of the fishway were b1 = b2 = 0.20 m, and the intermediate vertical slot was b3 = 0.40 m. The dimensions of each part are presented in Table 1. Considering boundary effects, etc., the structural dimensions of the proposed vertical-slot, double-pool fishway are outlined in this paper. In practical engineering applications, the design can be referenced based on the actual conditions of the project, the body shape, and the swimming ability of migratory fish, etc.

2.2.2. Meshing and Boundary Conditions

To enhance the accuracy of the numerical simulation, the residual value was set to 1 × 10⁻⁵, the total number of time steps was set to 3000, the time step size was set to 0.01 s, and the maximum number of iterations within each time step was set to 20. To achieve a water flow velocity ranging from 0.8 m/s to 1.2 m/s at the central vertical slot of pool 3#, the inlet velocity was set to 0.45 m/s, and the outlet was configured as a free outflow.
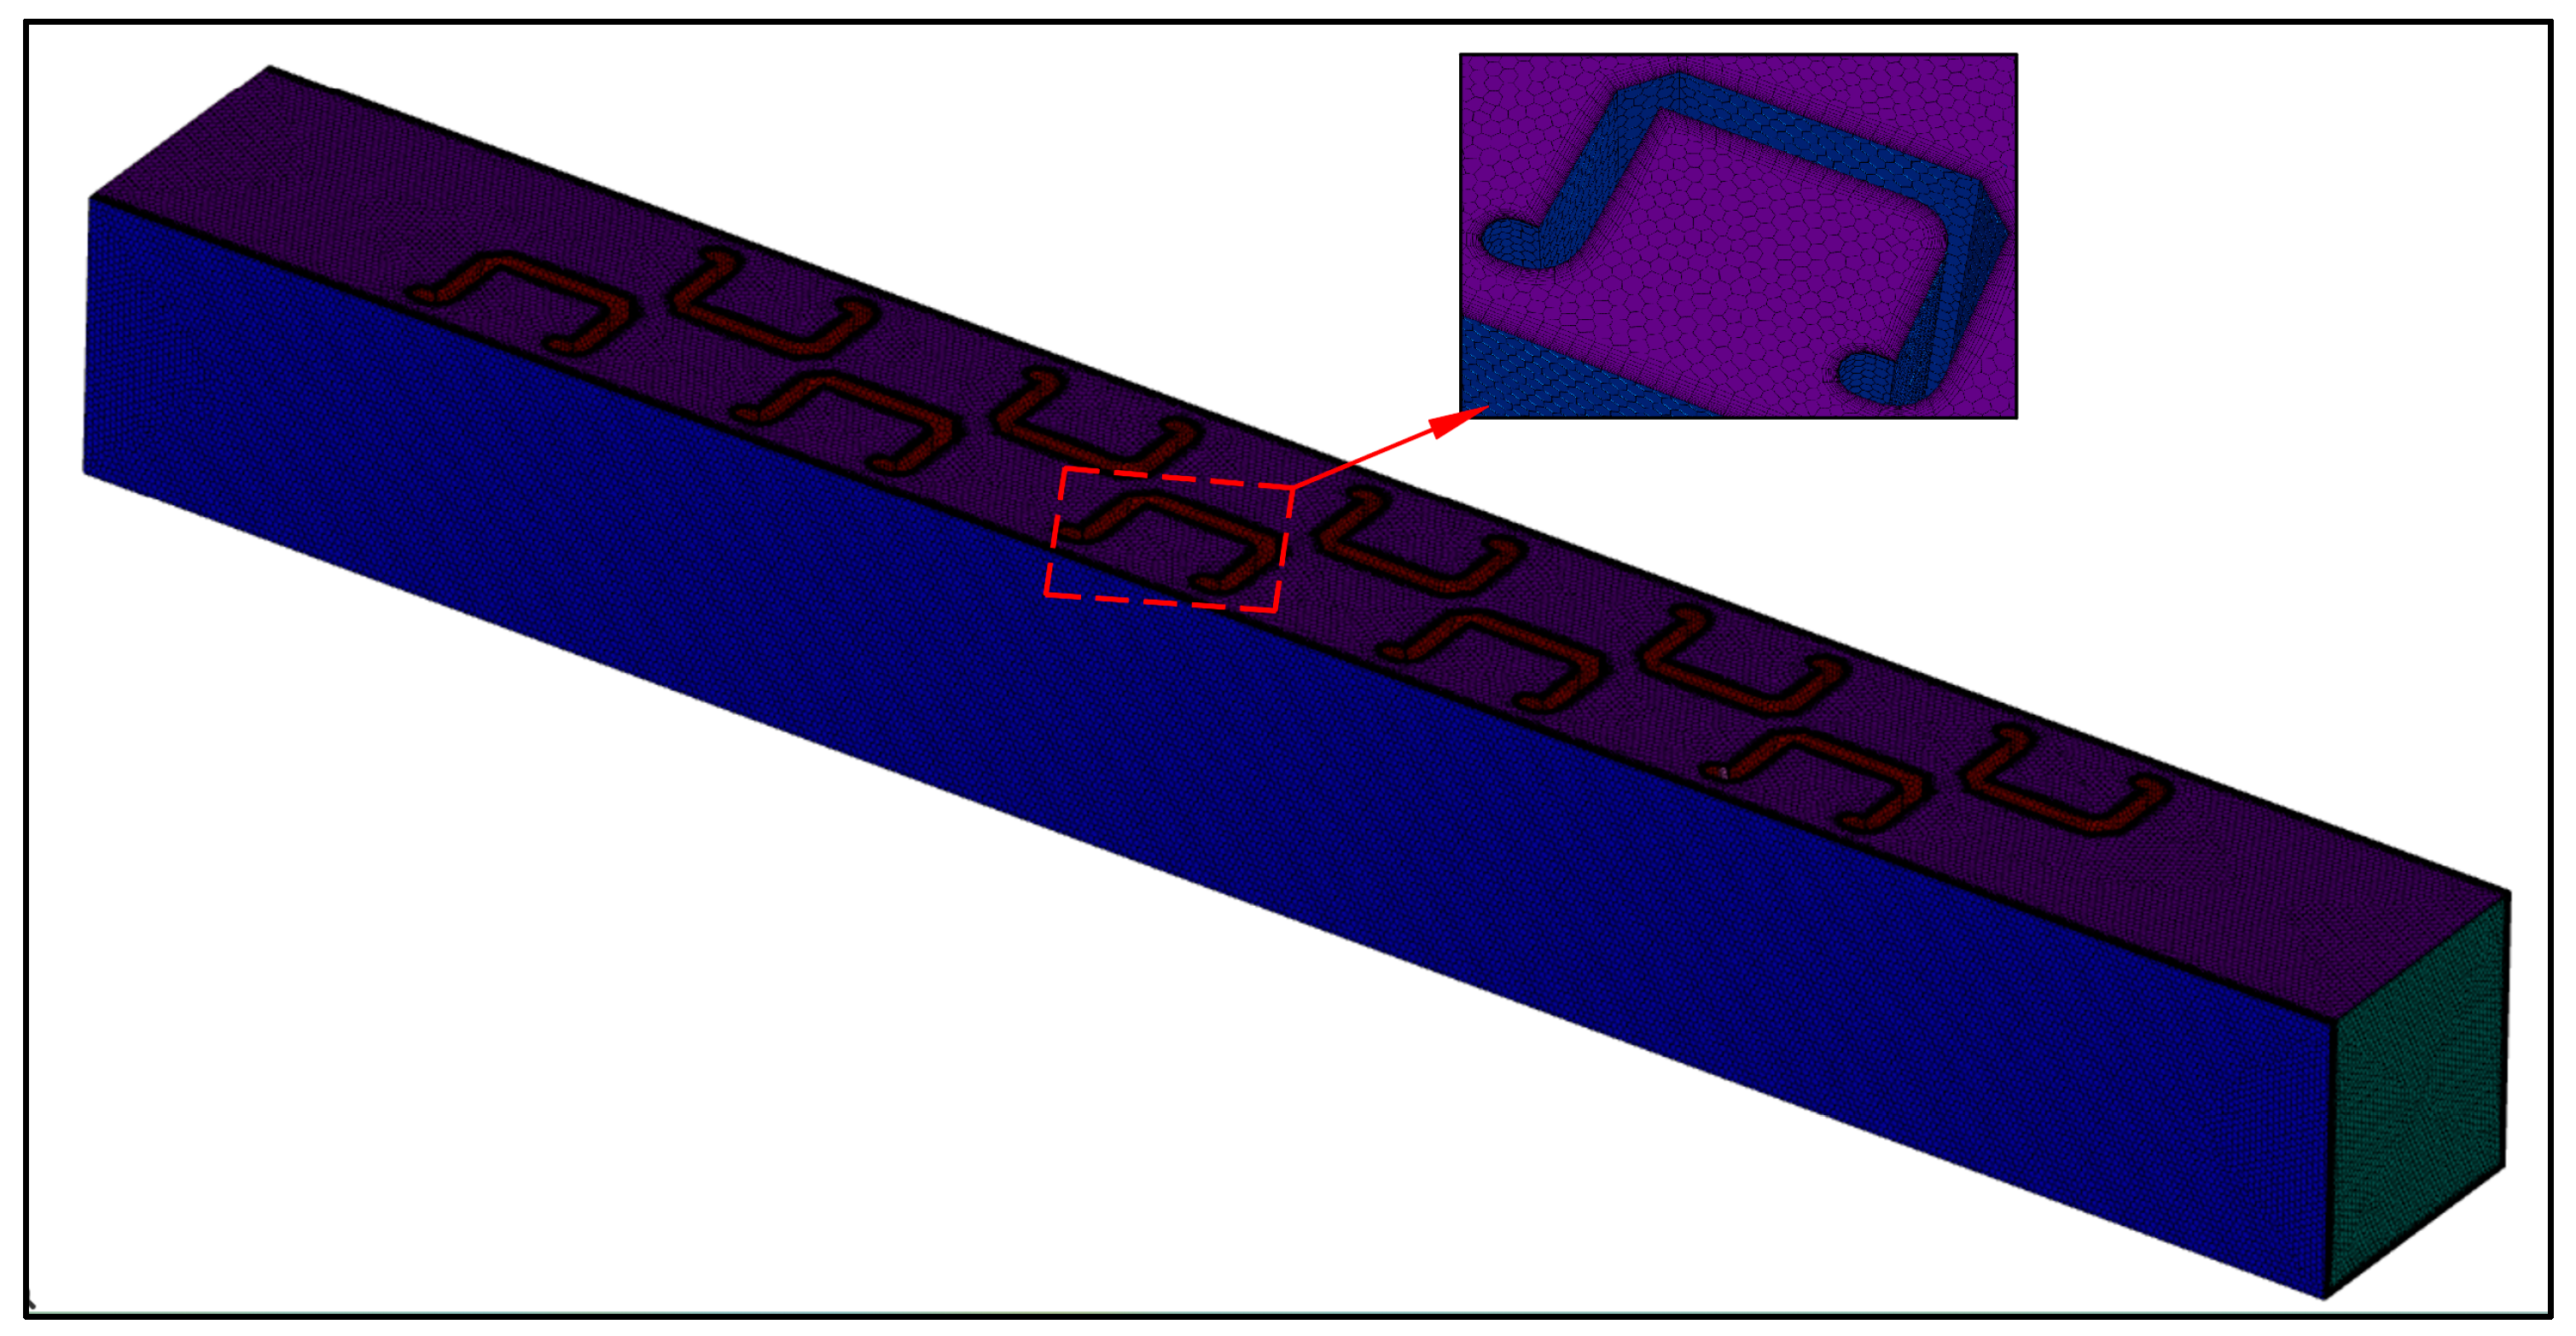
The internal structure of this fishway was relatively regular, and a hexahedral grid was adopted for meshing. Local elbow sections were refined for increased accuracy, resulting in approximately 1.77 million grid cells. After grid independence verification, it was confirmed that the grid quality met the required standards. The grid model is depicted in Figure 3.

2.3. Model Validation

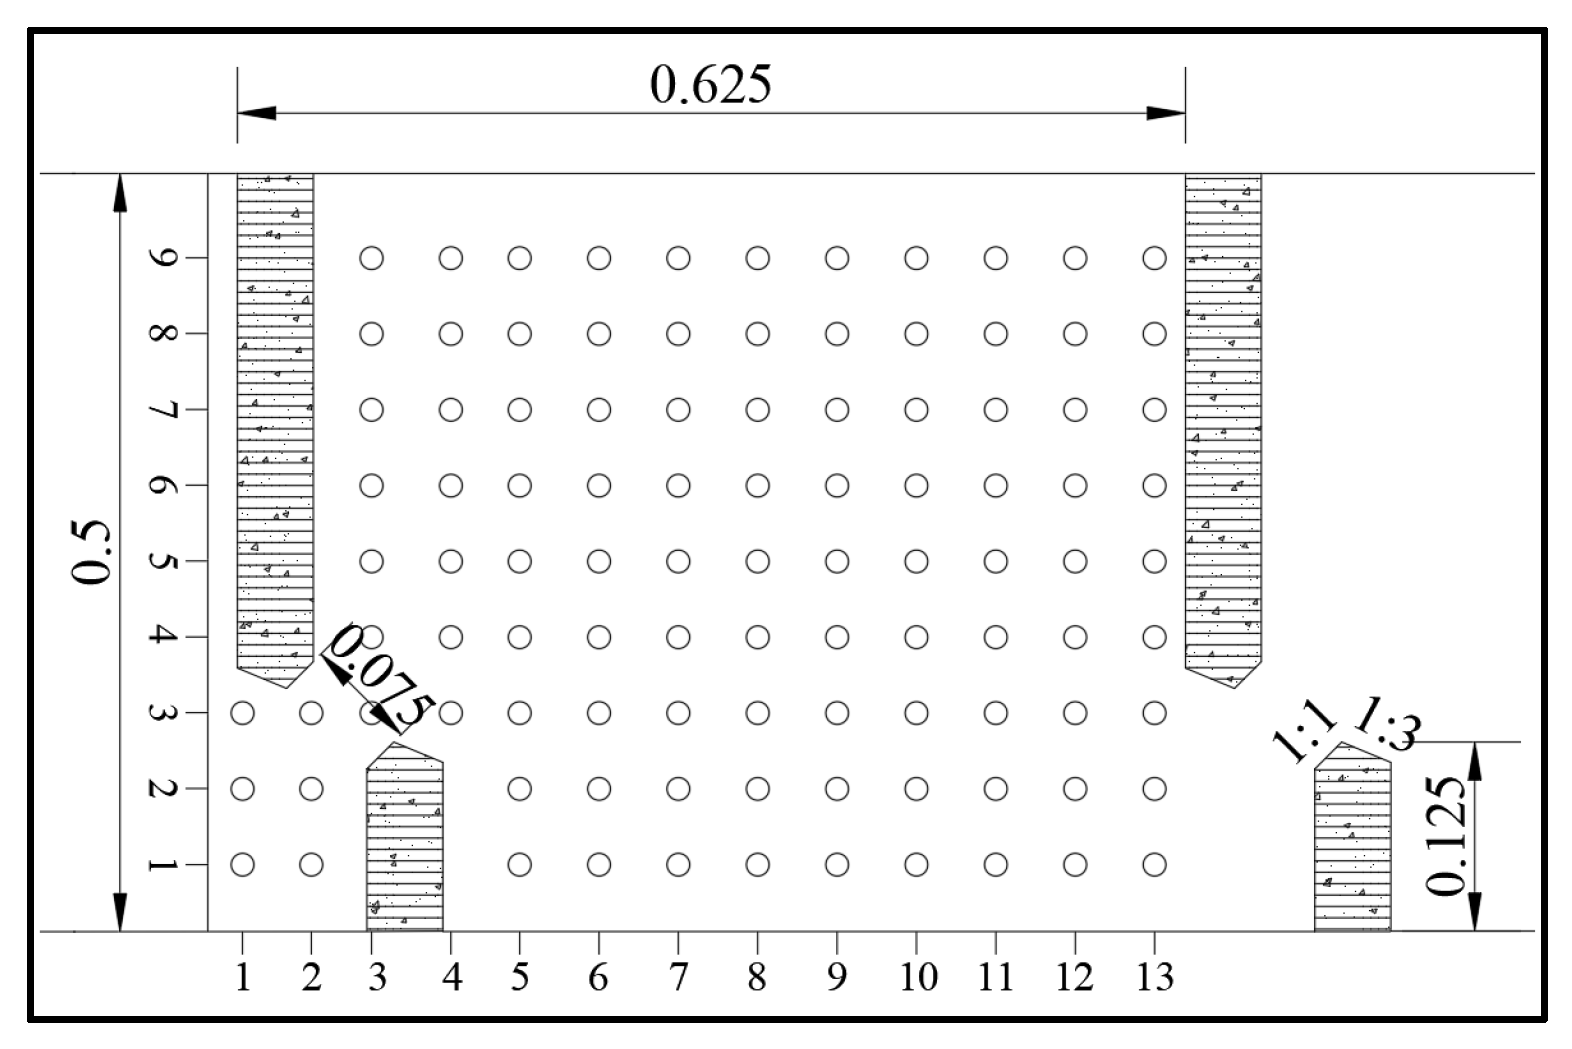
Taking the traditional vertical-slot fishway (VSF) as the research object, this study aims to compare and verify the rationality and feasibility of the numerical model through physical modeling and numerical simulation experiments on the traditional VSF. The experimental fishway model consists of an organic glass tank and a water circulation supply system, with a total length of 17 m, a width of 0.5 m, a depth of 0.4 m, and a slope of 0.1%. The leftmost part of the fishway is the inflow section where the water enters the pool. The middle section is the pool section of the fishway, which comprises 11 identical pools labeled from upstream to downstream as pool 1# to pool 11#. The rightmost part is the outflow section. The average experimental water depth in the pools was 0.1 m, and pool 6# was selected as the research object for verification. Each pool measured 0.625 m in length and 0.5 m in width, with a vertical slot width of 0.075 m and a guide plate length of 0.125 m. Representative flow conditions were considered at a water depth of 0.05 m. The origin was set at the intersection of the upstream baffle’s backwater surface and the right side in pool 6#. The downstream direction was designated as the positive direction of the x-axis, and the direction towards the left sidewall was designated as the y-axis direction. Monitoring points was selected every 5 cm along the x-axis and y-axis. The structural dimensions of the pool and the plan distribution of the monitoring points are shown in Figure 4.
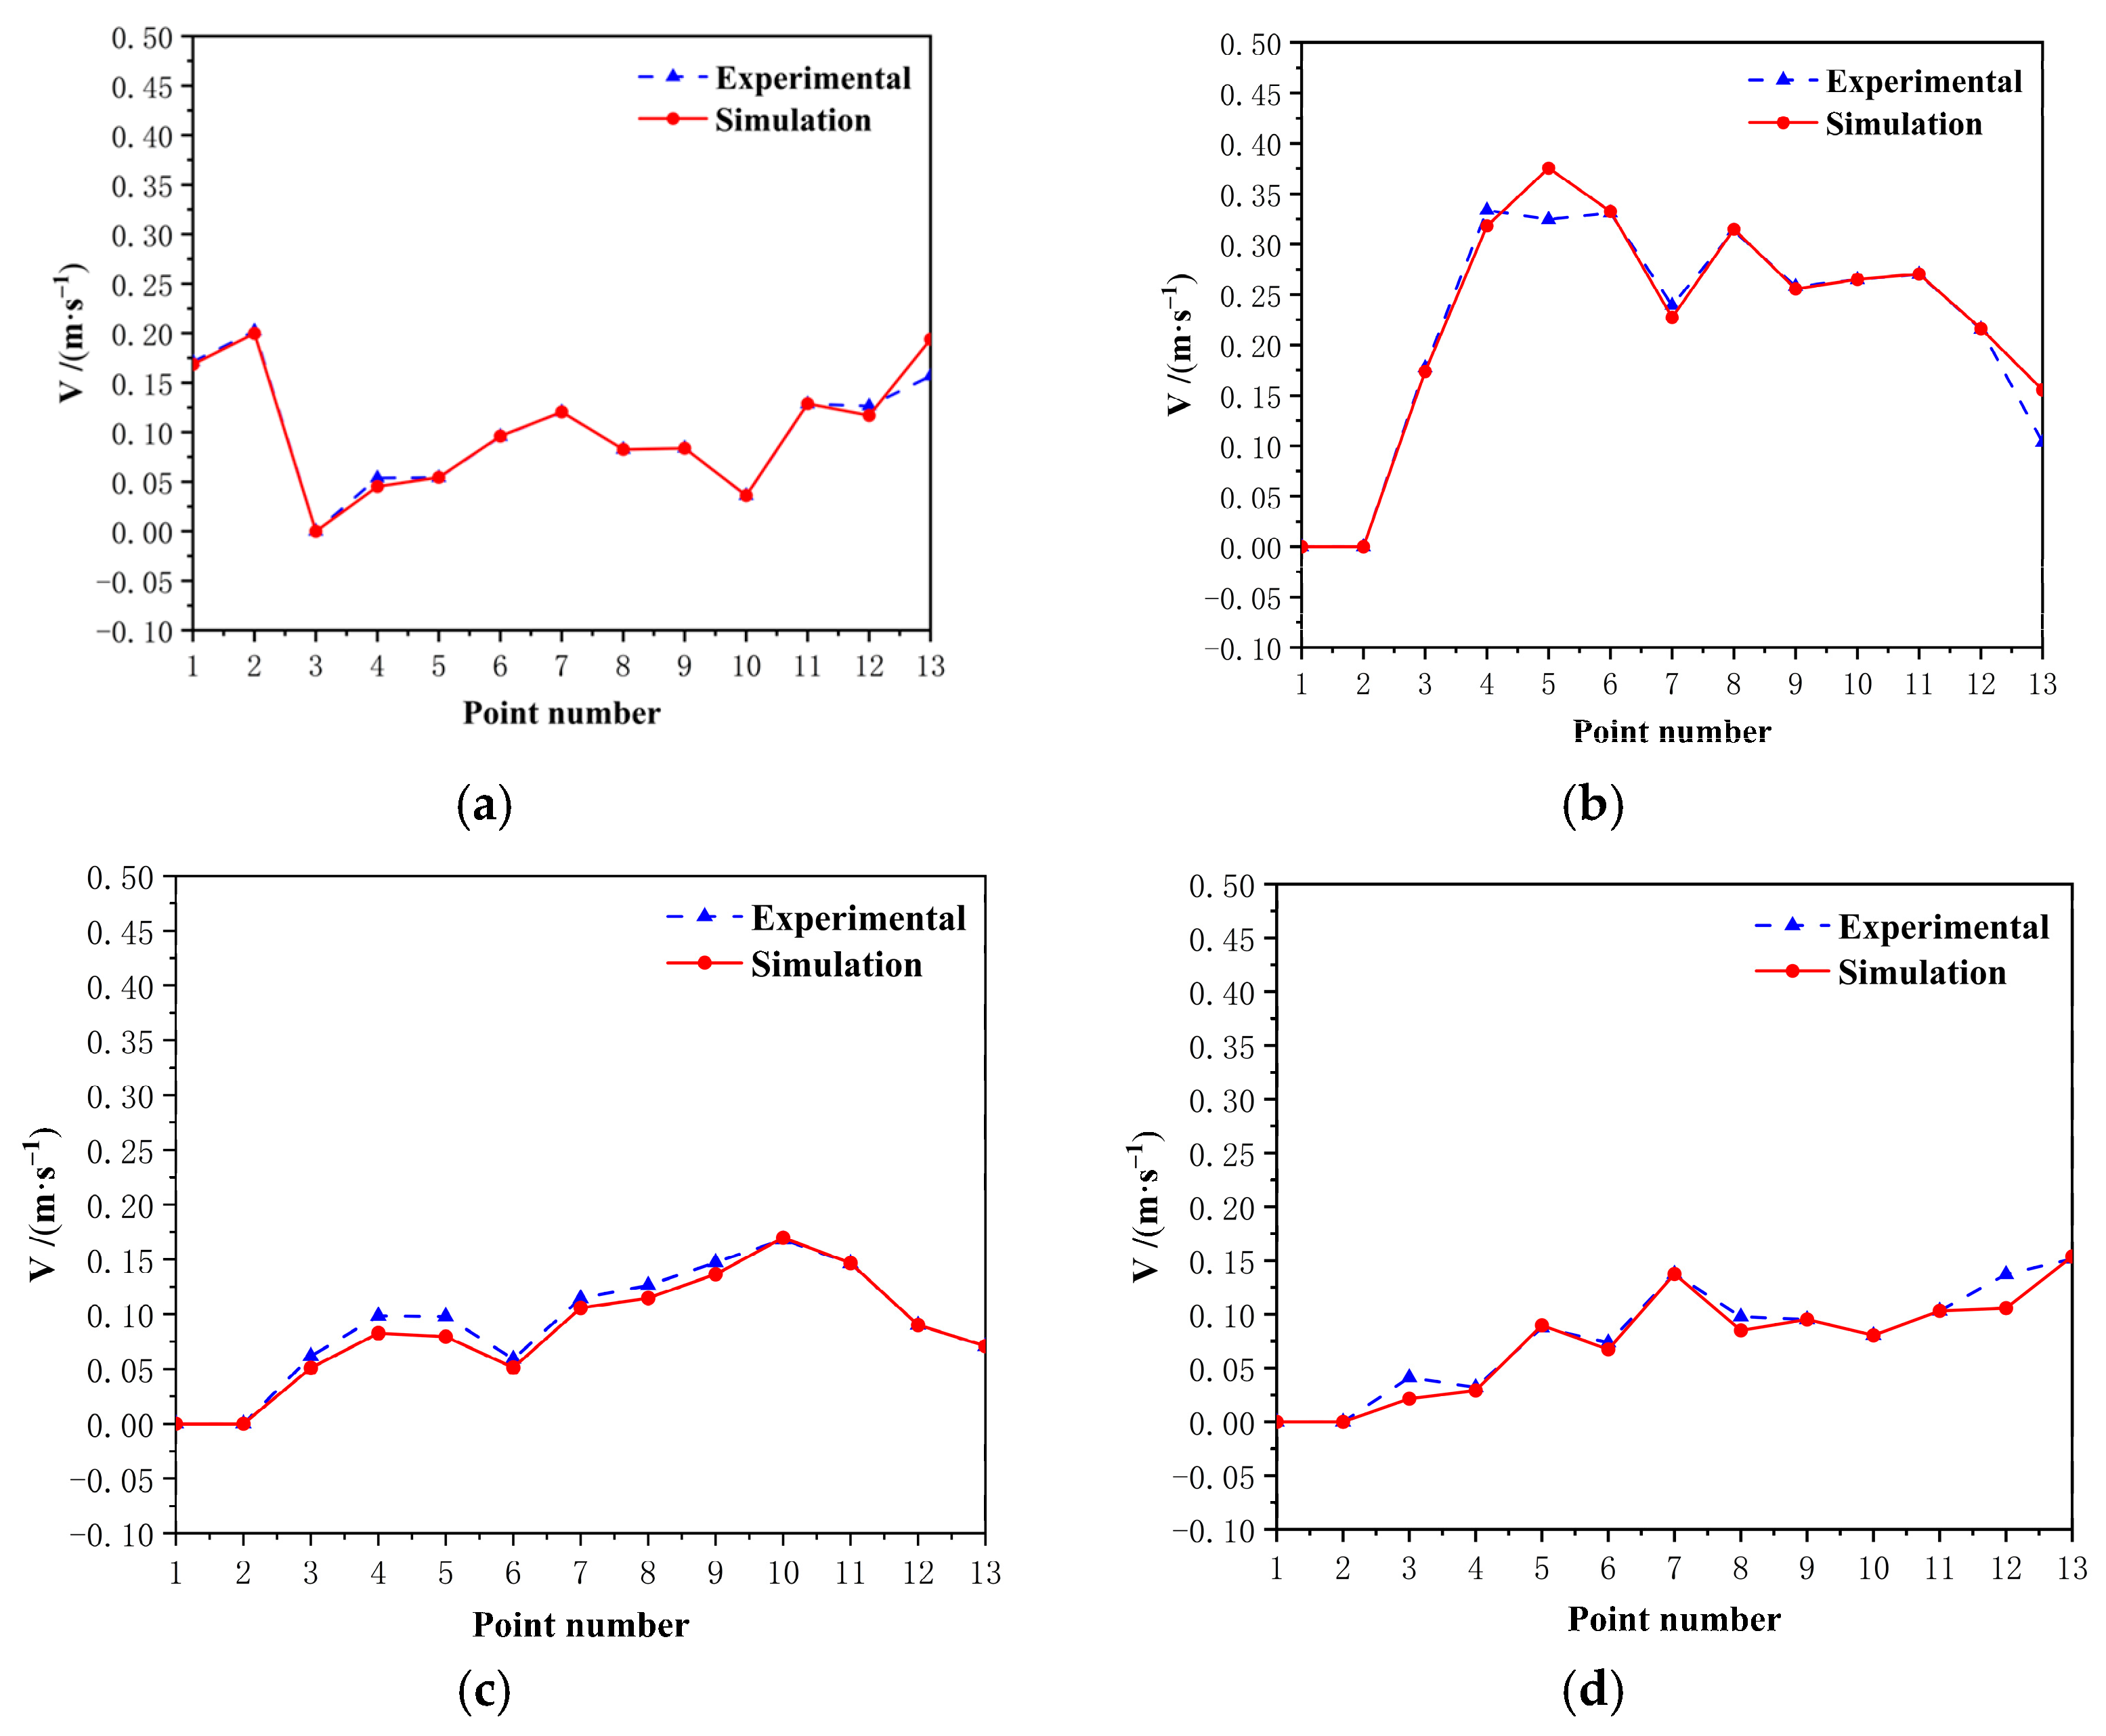
The velocity distribution at a water depth of 0.05 m in pool 6# of the physical model was measured using a velocimeter. Four longitudinal profiles were extracted along the y-axis direction in the representative flow field. A comparison of water flow velocities between the numerical simulation and the physical model along each longitudinal profile is shown in Figure 5.
As can be seen from Figure 5, the flow field distribution patterns at a water depth of 0.05 m in pool 6# are generally consistent between the numerical simulation and the physical model experiments. The velocities are relatively close except for individual points, indicating that the numerical simulation can accurately reflect the flow field distribution within the vertical slot fishway pool and can be used for subsequent research and analysis of the hydraulic characteristics of the double-pool, vertical-slot fishway.

3. Results and Discussion

3.1. Flow Field Distribution at the Vertical Slot

The simulation fishway in this study consisted of five sets of pools. To avoid the influence of upstream and downstream boundary conditions on the vertical slot section at the entrance or exit, the vertical slot section between the middle pool (3#) was selected for analysis.
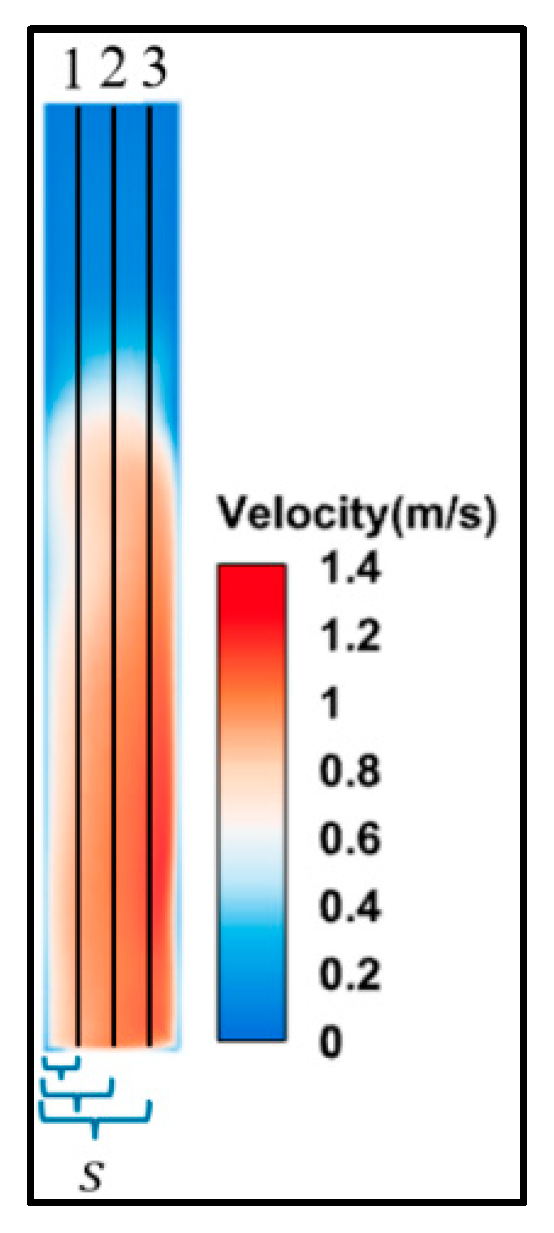
On the vertical slot section of pool 3#, three vertical lines were intercepted along the width direction of the middle vertical slot, labeled as 1, 2, and 3, from left to right. The velocity distribution along these three vertical lines on the vertical slot section is shown in Figure 6.
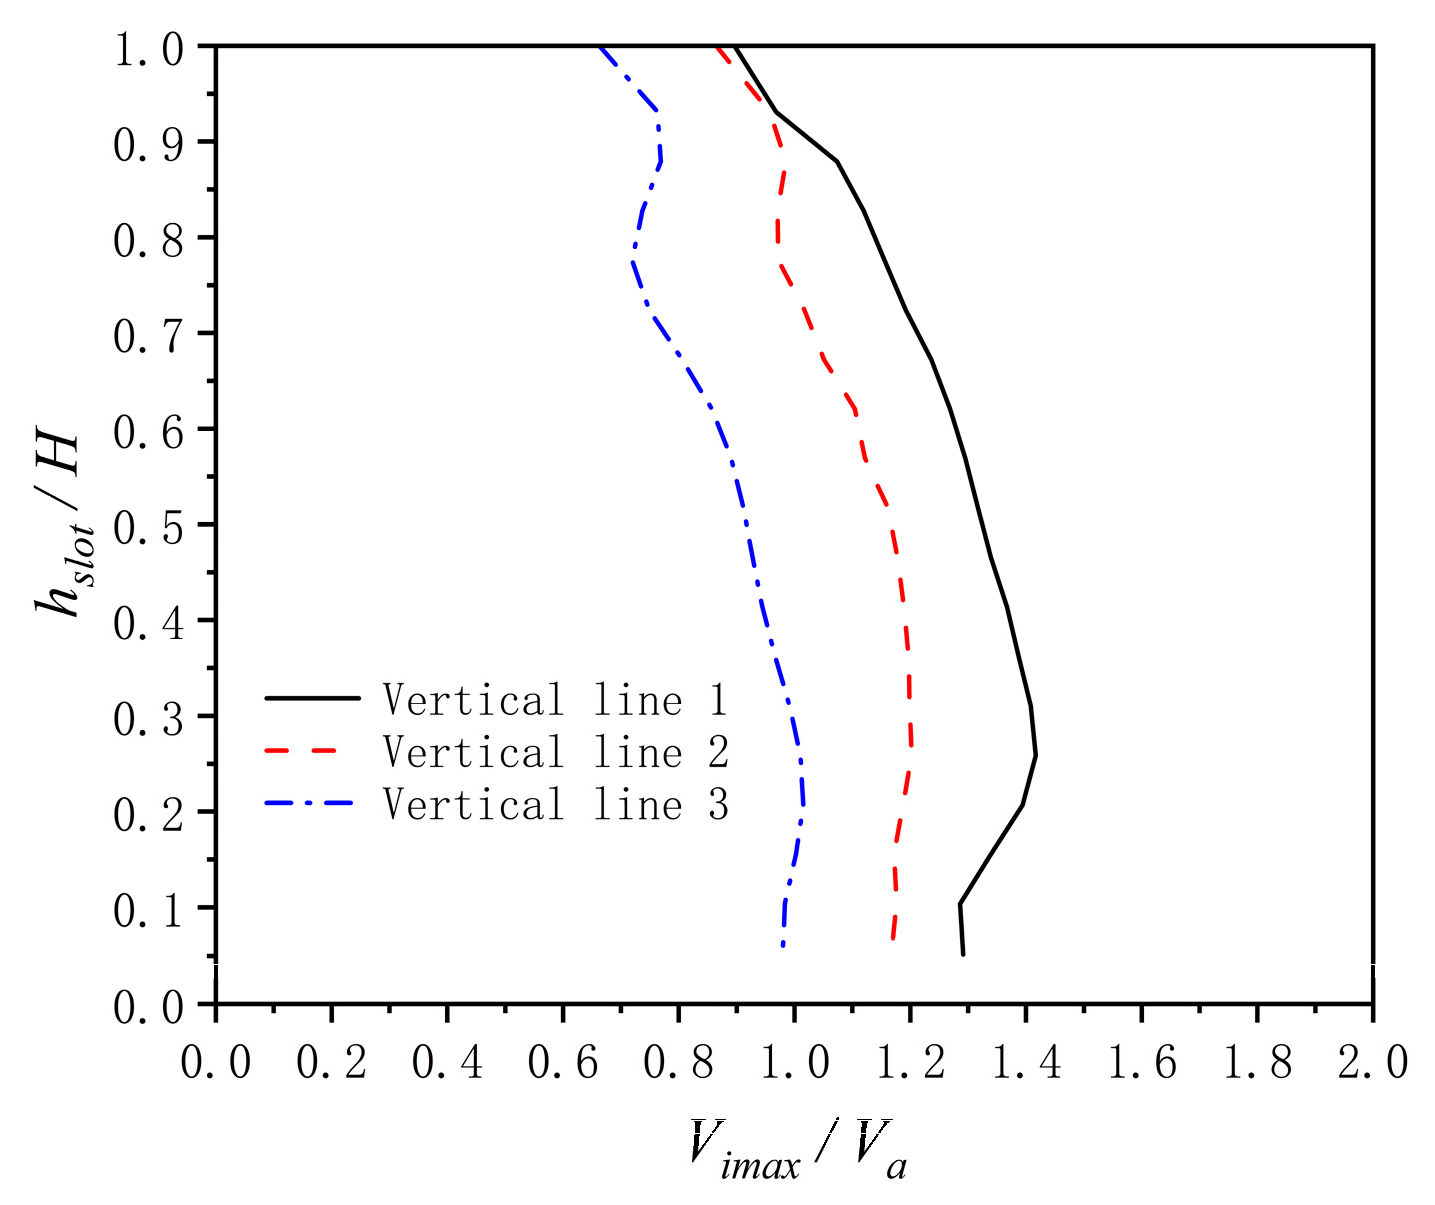
The relative distances of vertical lines 1, 2, and 3 from the left edge along the width direction of the vertical slot are S = 0.2, 0.5, and 0.8. By extracting the water flow velocity values at vertical lines 1, 2, and 3 from the numerical simulation results, we obtained the vertical distribution line of flow velocity at the center section of the vertical slot, Vi/Va~hslot/H, where Vi is the flow velocity value on vertical line I; Va is the average flow velocity of the vertical slot section, which is 0.85 m/s; hslot is the height from the bottom plate; and H is the designed water depth of 1.8 m. The vertical distribution line at the center section of the vertical slot is detailed in Figure 7.
It can be seen that the flow velocity at the cross-section of the vertical slot decreases gradually from left to right in the horizontal direction, while it increases gradually from surface to bottom in the vertical direction. The distribution pattern of water flow on different vertical lines is similar. The dimensionless flow velocities on vertical lines 1, 2, and 3 range from 0.6 to 1.1, 0.9 to 1.2, and 0.9 to 1.5, respectively. The flow velocity at the cross-section of the vertical slot increases gradually from surface to bottom in the vertical direction, and the gradient of increase on vertical line 1 is greater than that on vertical line 3. The minimum and maximum flow velocities at the vertical slot are approximately 0.56 m/s and 1.2 m/s, respectively, and the average flow velocity at the vertical slot is approximately 0.85 m/s.

3.2. Calculation Results of the Mainstream Flow Field

Three planes with relative water depths of hslot/H = 0.2 (bottom layer), 0.5 (middle layer), and 0.8 (surface layer) were extracted from the 3D model of pool 3#. The corresponding velocity contours of water flow for these planes are shown in Figure 8.
Based on Figure 8, it can be observed that the flow patterns in the bottom, middle, and surface layers of the conventional water tank are similar. The main flow area is located approximately in the middle part of the pool, horizontally and along the left and right side walls. Two recirculation zones with similar sizes are distributed in the resting room. The flow velocity in the main flow area gradually decreases from the center to the sides, while the flow velocity in the recirculation zone gradually decreases from the edges to the center, approaching zero at the center position. Most of the flow velocities in the main flow area range from 0.6 to 1.2 m/s, while the flow velocities in the recirculation zone are below 0.5 m/s.
Moreover, as can be seen from Figure 8, the main flow trajectory in the middle of the fishpond exhibits a distinct “S-shaped curve”. Except for the area near the free surface, the circulation pattern inside the fishpond is primarily composed of vortices dispersed on both sides of the jet flow and vortices within the pool. Typically, the vortices on both sides of the jet flow are located close to the partition, while the vortices in the pool are situated in the middle. Near the free surface, the vortices are relatively weak, but as the water depth gradually increases, the vortex strength gradually intensifies and becomes more concentrated towards the center.
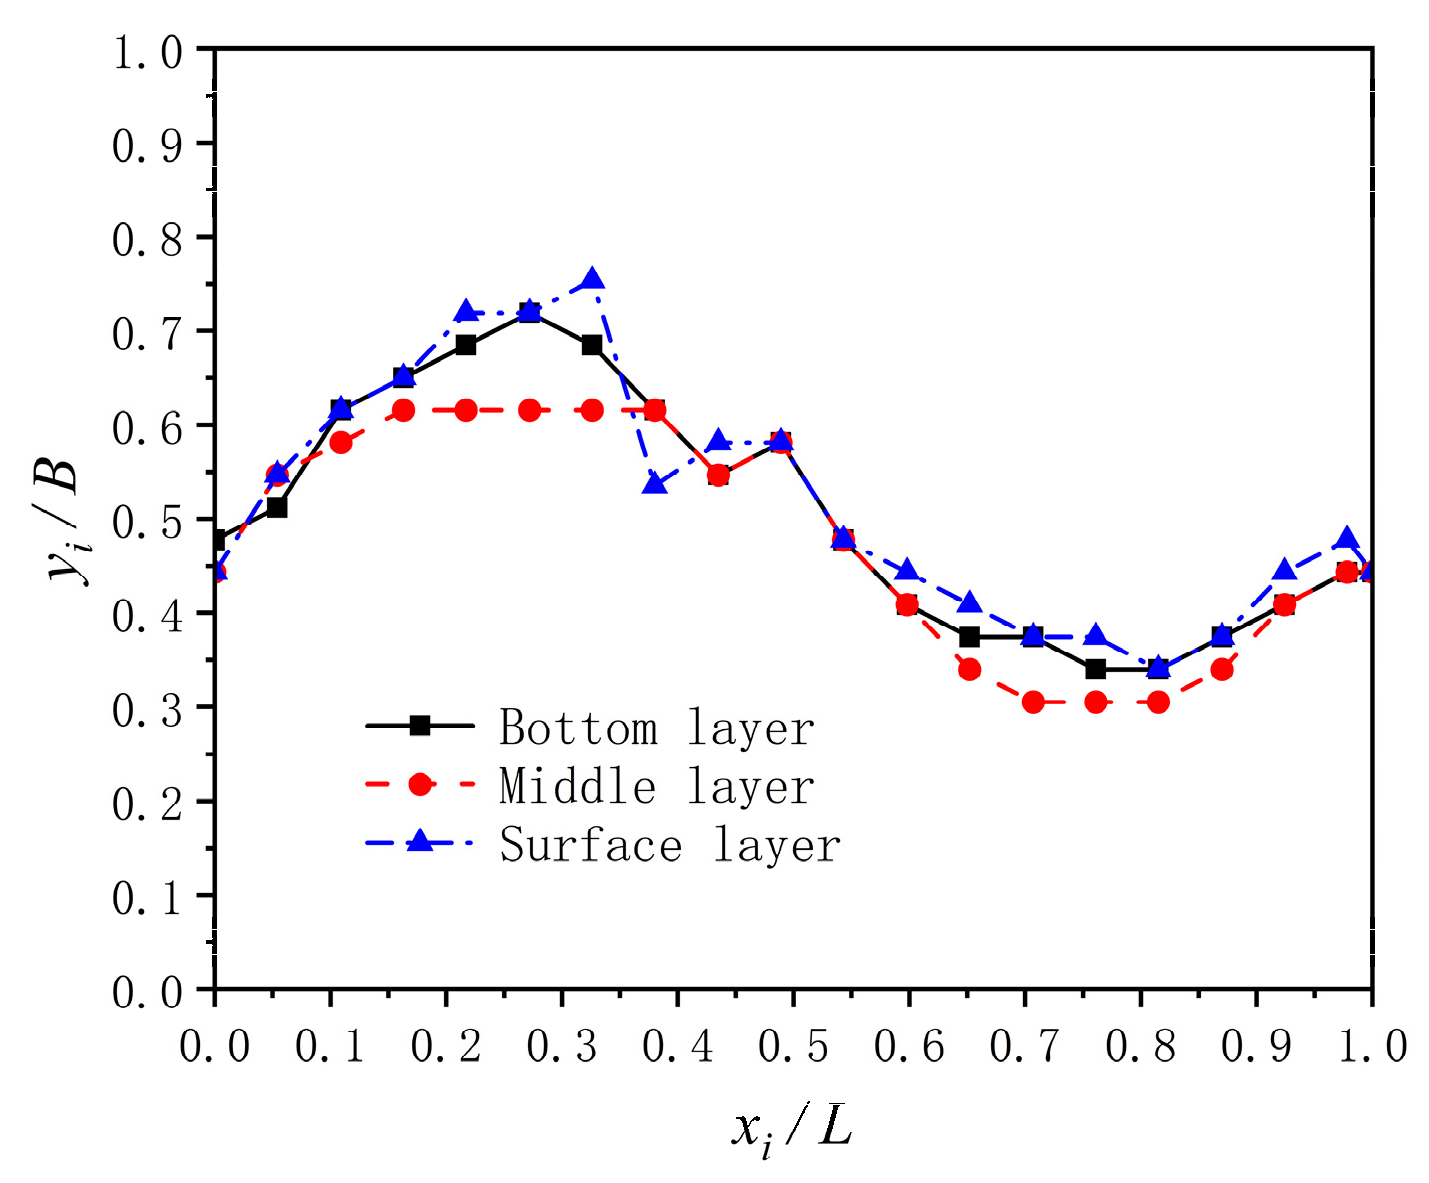
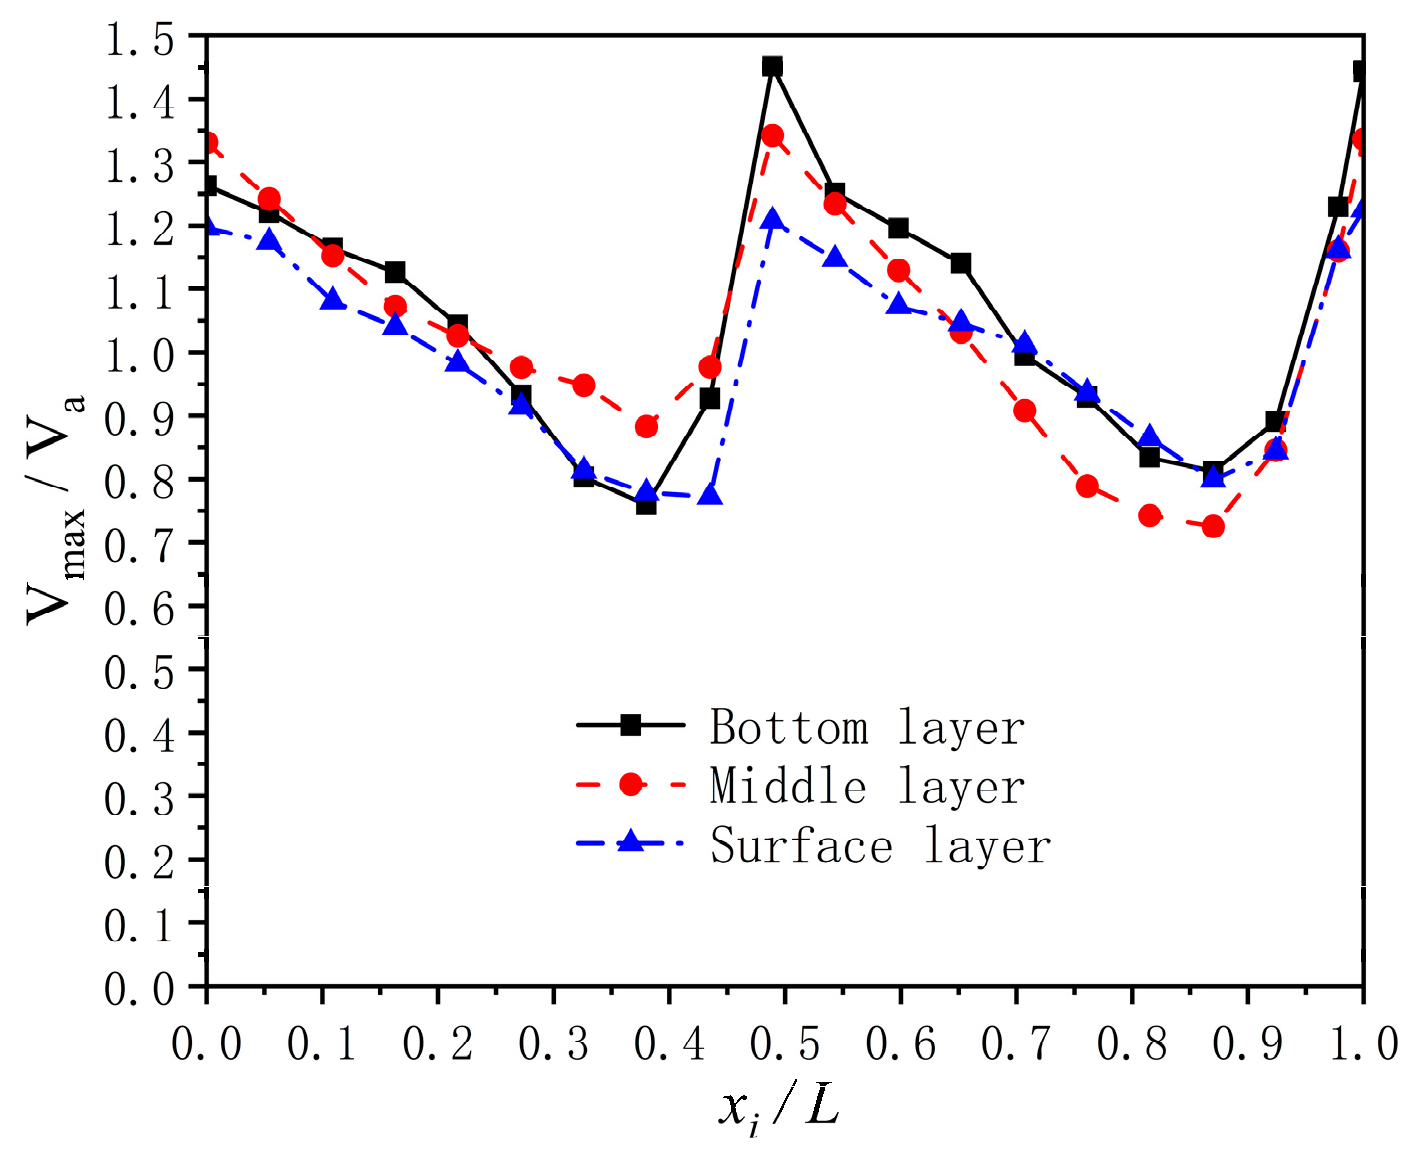
On the bottom, middle, and surface planes of the established 3D model, horizontal lines were established every 0.2 m, starting from the leftmost end of the upstream baffle and ending at the leftmost end of the downstream pool baffle, resulting in 20 horizontal lines for each plane. The maximum flow velocity Vimax and the corresponding horizontal and vertical coordinates xi and yi were extracted from the numerical results for each horizontal line. These values were then converted into dimensionless values Vimax/Va, xi/L, and yi/B, where L and B represent the length and width of each pool, respectively. The distribution curves of the maximum flow velocity positions on the bottom, middle, and surface planes were obtained based on the dimensionless values of the horizontal and vertical coordinates where the maximum flow velocities occurred on the pool’s horizontal lines.
As shown in Figure 9, the distribution curves of maximum flow velocity positions in the bottom, middle, and surface layers are similar. As the value of xi/L increases from 0 to 0.3, the value of yi/B gradually increases from 0.35 to 0.75. When the value of xi/L is within the range of 0.2 to 0.6, the value of yi/B remains around 0.6. As the value of xi/L increases from 0.6 to 1.0, the value of yi/B gradually decreases from 0.5 to 0.3. It can be concluded from the distribution curve of maximum flow velocity positions that the main flow area in the middle enters the pool as a jet from the upstream vertical slot and gradually moves horizontally towards the middle position within the upstream 30% of the monitored cross-section length. It remains horizontally in the middle part of the pool for the middle 50% and flows from the middle position towards the downstream vertical slot for the downstream 20%.
Figure 10 shows that the distribution curves of maximum flow velocity along the path in the bottom, middle, and surface layers are similar. When the value of xi/L is within 0.55, the value of Vimax/Va gradually decreases from 1.2 to 1.4, 0.6, and then 0.8. When the value of xi/L is between 0.6 and 1.0, the value of Vimax/Va exhibits a trend of first increasing and then decreasing, finally returning to a value close to the initial state of 0.9 to 1.1. Comparative analysis of the distribution curves of maximum flow velocity along the path in the bottom, middle, and surface layers indicates that the flow velocity in the main flow area of the fishway pool gradually decreases along the path from the middle area behind the upstream baffle, with a significant effect.
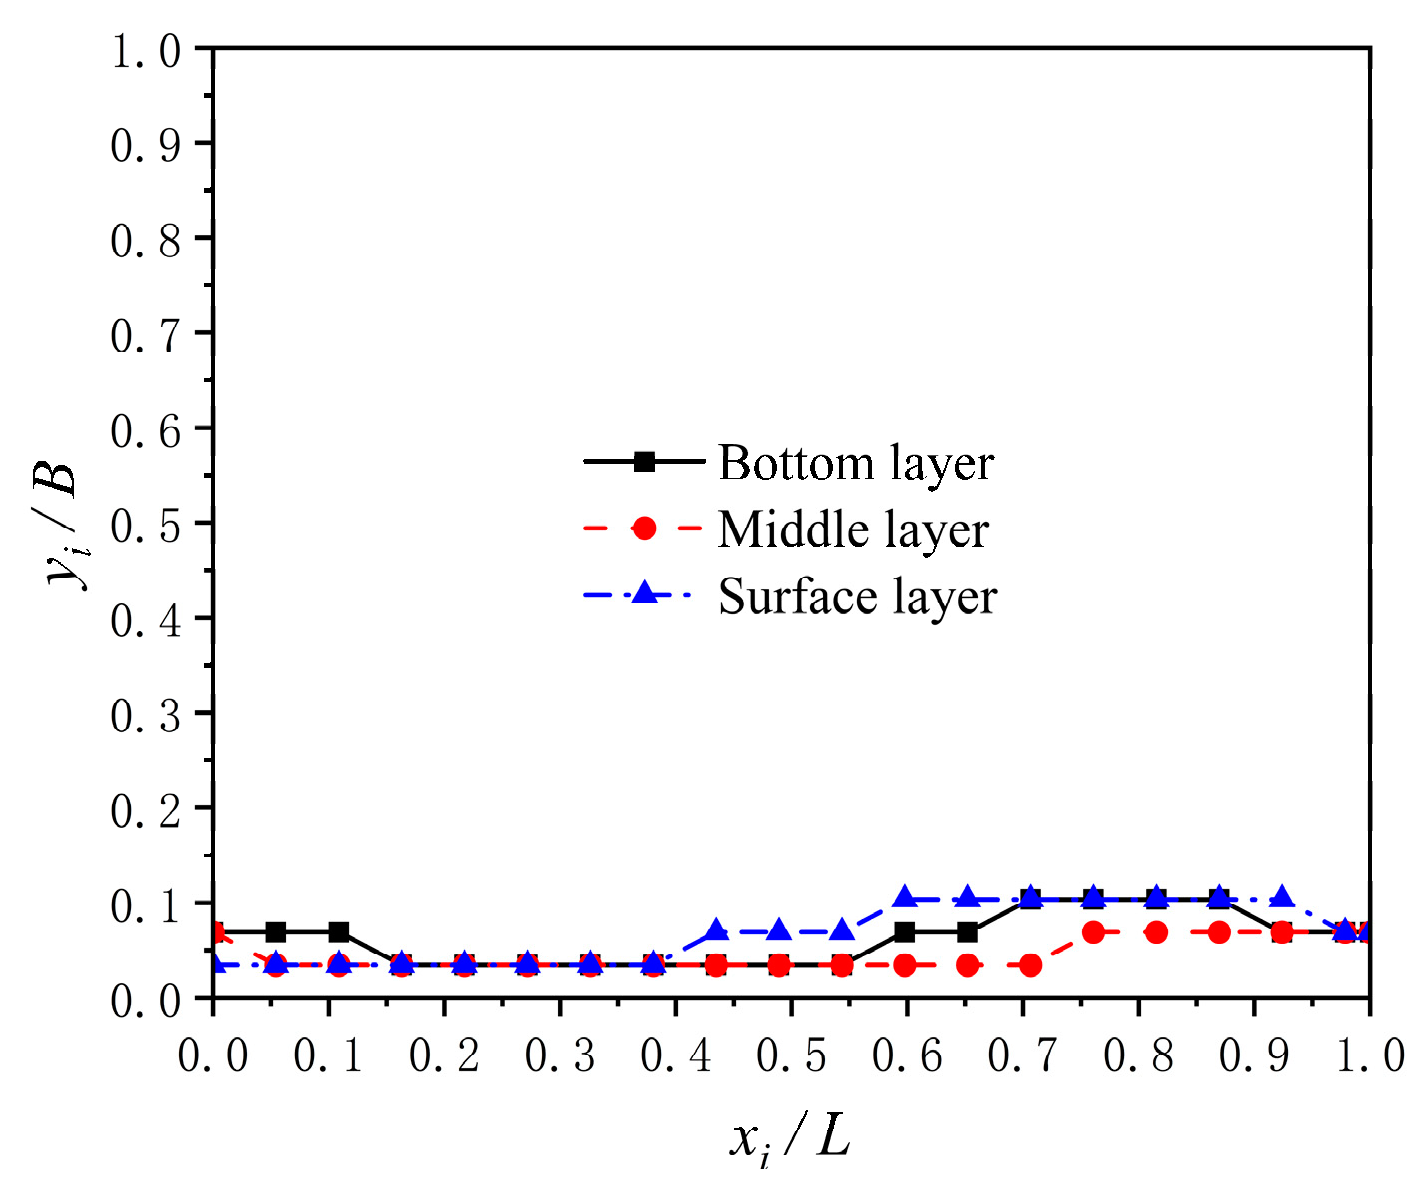
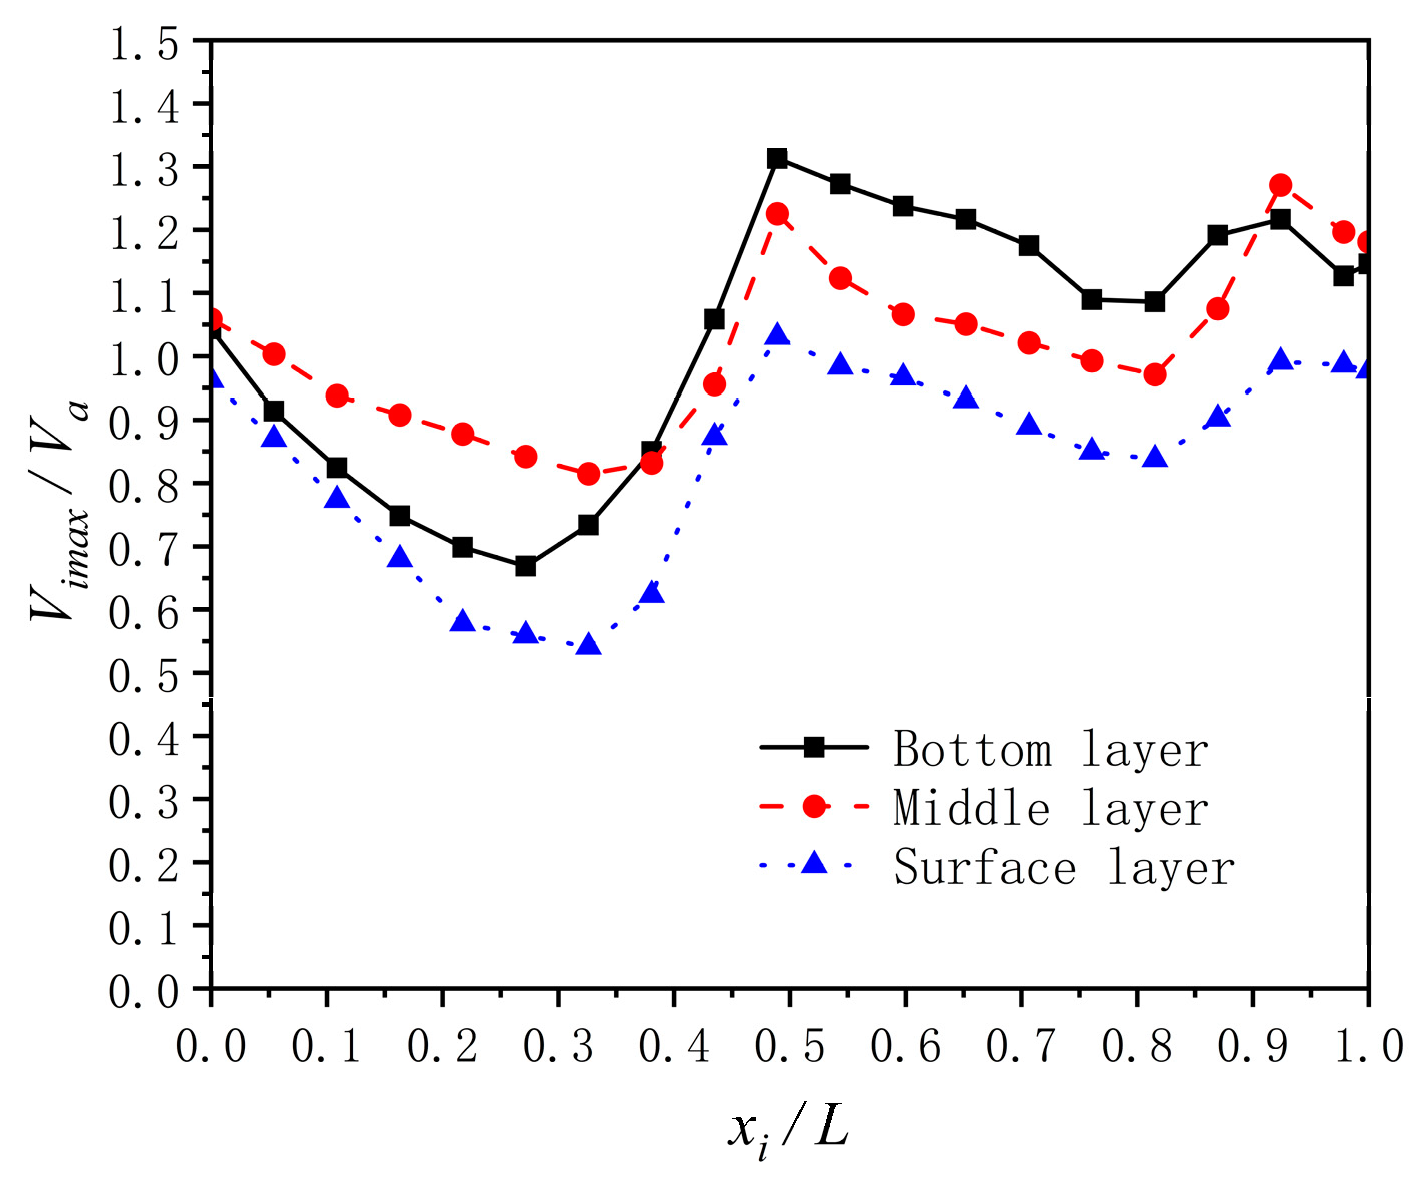
As seen in Figure 11, as the value of xi/L increases from 0 to 0.2, the value of yi/B gradually decreases from 0.08 to 0.03. When the value of xi/L is within 0.2 to 0.4, the value of yi/B remains around 0.03. As the value of xi/L increases from 0.4 to 1.0, the value of yi/B gradually increases from 0.03 to 0.1. It can be concluded from the distribution curve of maximum flow velocity positions that the flow state in the main flow area on the right side is approximately linear. Figure 12 shows that within a value of xi/L of 0.3, the value of Vimax/Va gradually decreases from 1.0 to 1.2, 1.05, and then 0.85. When the value of xi/L is between 0.3 and 0.8, the value of Vimax/Va exhibits a trend of first increasing and then decreasing. Finally, when the value of xi/L is between 0.8 and 1.0, the value of Vimax/Va rises sharply, returning to a value close to the initial state of 0.9 to 1.2. As can be seen in Figure 13, when the value of xi/L is within 0 to 0.5, the value of yi/B remains around 0.92. As the value of xi/L increases from 0.5 to 1.0, the value of yi/B gradually increases from 0.92 to 0.98. From the maximum flow velocity position distribution line, it can be observed that the variation in the position of the maximum water flow distribution across different layers in the main flow areas on both sides is minimal, resembling a straight line. This phenomenon can provide favorable conditions for the migration of certain fish species that prefer swimming upstream close to the walls by matching their preferred flow velocity. Furthermore, if the flow velocity in the marginal main flow area coincides with the preferred flow velocity of certain fish species, it can help to enhance their migration efficiency. Figure 14 reveals that within a value of xi/L of 0.3, the value of Vimax/Va gradually decreases from 1.1 to 0.9 to 0.4 to 0.8. When the value of xi/L is between 0.3 and 0.8, the value of Vimax/Va exhibits a trend of first increasing and then decreasing. Finally, when the value of xi/L is between 0.8 and 1.0, the value of Vimax/Va rises sharply, returning to a value close to the initial state of 0.9 to 1.2.
By focusing on the maximum flow velocity positions, flow velocity distribution along the path, and attenuation in the main flow area of the vertical slots, it was found that the hydraulic characteristics of the flow field in the pool of the vertical-slot, double-pool fishway exhibit similar patterns vertically.

3.3. Analysis of Vertical Flow Field Hydraulic Characteristics

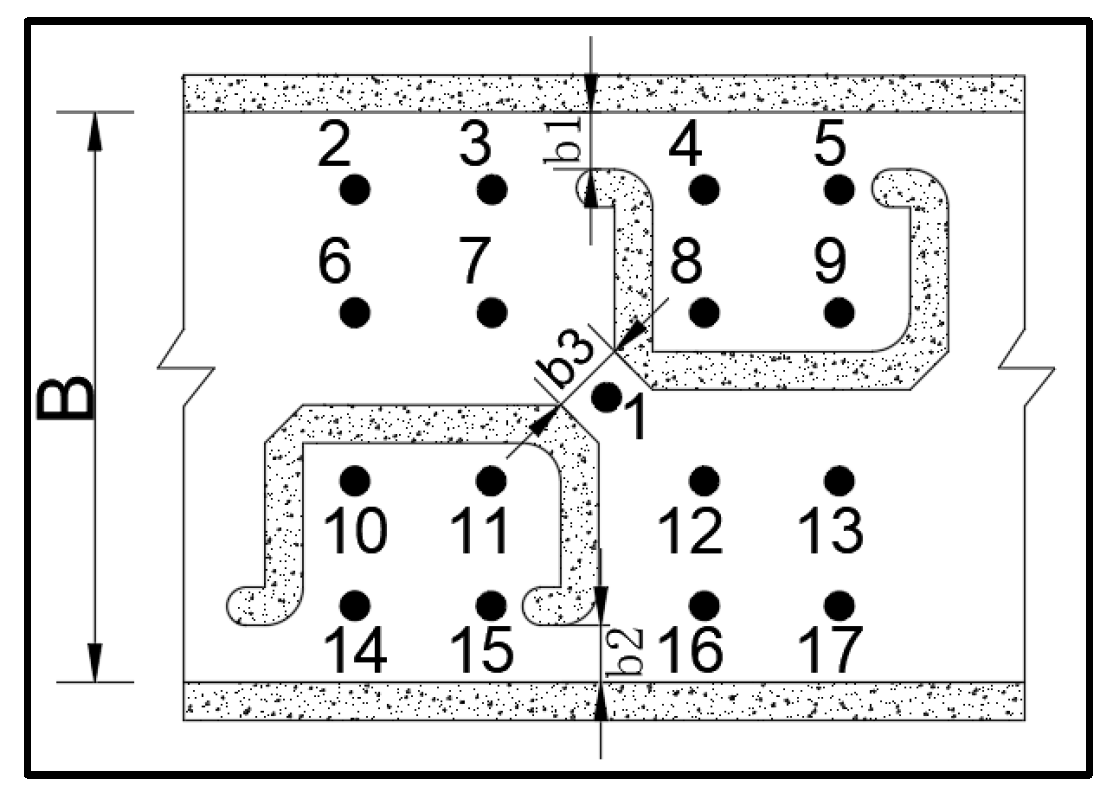
In order to more systematically study the characteristics of the vertical flow field of the pool water flow, especially its specific performance at the three key levels of the surface, middle, and bottom, we conducted an in-depth discussion. Given the vast amount of data from numerical simulation results, it is difficult to fully present them. Therefore, this article only selects some representative nodes and presents, in detail, the data on the velocity components of these nodes, so as to more accurately reveal the flow characteristics of the pool water flow at different levels. Seventeen representative monitoring points were selected on three planes with relative water depths of hslot/H equal to 0.2, 0.5, and 0.8 (corresponding to the bottom, middle, and surface layers, respectively), totaling 51 monitoring points for the three layers, as shown in Figure 15.
By inputting the horizontal coordinate X and vertical coordinate Y of the monitoring points at different depth layers into the three-dimensional numerical simulation results, the vertical flow velocity W of the monitoring points was extracted. The results are shown in Table 2.
As can be seen from Table 2, the vertical velocity of the water flow in the tank chamber is below 0.1 m/s, and the vertical velocity at the surface layer of the vertical slit cross-section is 0.04 m/s, which is very small compared to the horizontal velocity at that point. The vertical flow field characteristics of the tank chamber show that the vertical velocity of most of the water flow in the pool is very small and can be neglected. This is also consistent with the trend of the maximum water flow distribution along different levels, indicating the similarity in water flow at different levels. This suggests that the internal water flow in the pool is mainly 2D planar flow.
The distribution of turbulent kinetic energy (TKE) at different levels in the fishway pool is shown in Figure 16 below, and a comparison of the maximum and average turbulent kinetic energy on each plane is shown in Table 3.
The results show that under the action of the fishway pool structure, the turbulent kinetic energy at the vertical slot and in the resting pool is effectively controlled [20,21,22,23], with an average turbulent kinetic energy not exceeding 0.05 m2/s2. The differences in turbulent kinetic energy among water flows at different depths are relatively small, with the turbulent kinetic energy of the surface water flow being slightly higher than that of the middle and bottom layers. At the same depth level, the turbulent kinetic energy of the water flow is greater at the vertical slot.

3.4. Comparative Analysis of 3D and 2D Hydraulic Characteristics

Studying the vertical velocity distribution pattern of water flow within the pool has revealed that it primarily exhibits a planar 2D flow characteristic. To further explore the binary characteristics of the vertical-slot, double-pool fishway, we vertically average the results of the 3D numerical simulation and conduct a comparative analysis using the 2D results. For the 2D numerical simulation of the vertical-slot, double-pool fishway, the RNG κ-ε model and the velocity–pressure coupling SIMPLE algorithm in Fluent software were used for the numerical simulation of the fishway. The calculation parameters and model structure data are consistent with those used in the 3D calculation. The average velocity of the water flow in the middle vertical-slot cross-section of the 3# fishway pool in the 2D calculation results was controlled to be 0.85 m/s, which is the same as the 3D calculation results.
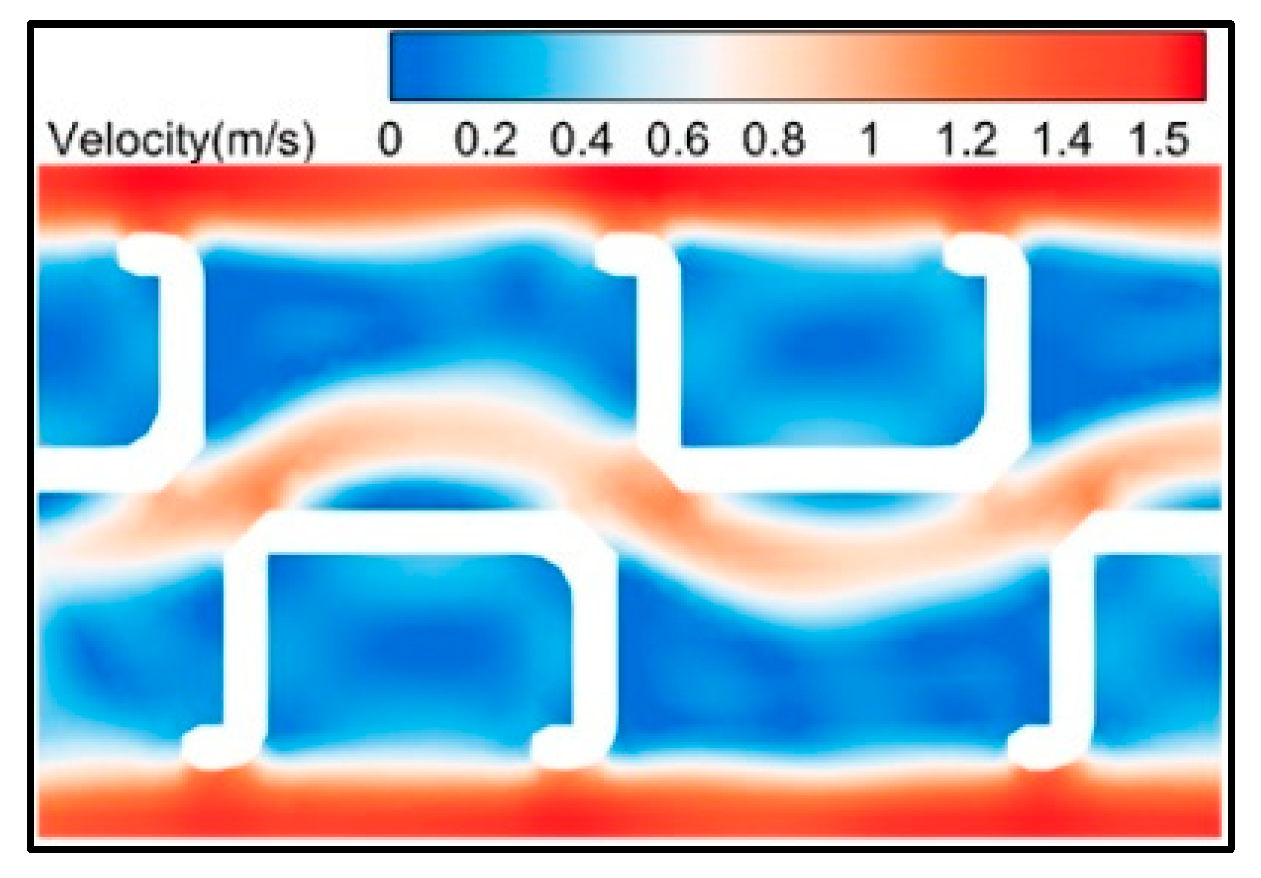
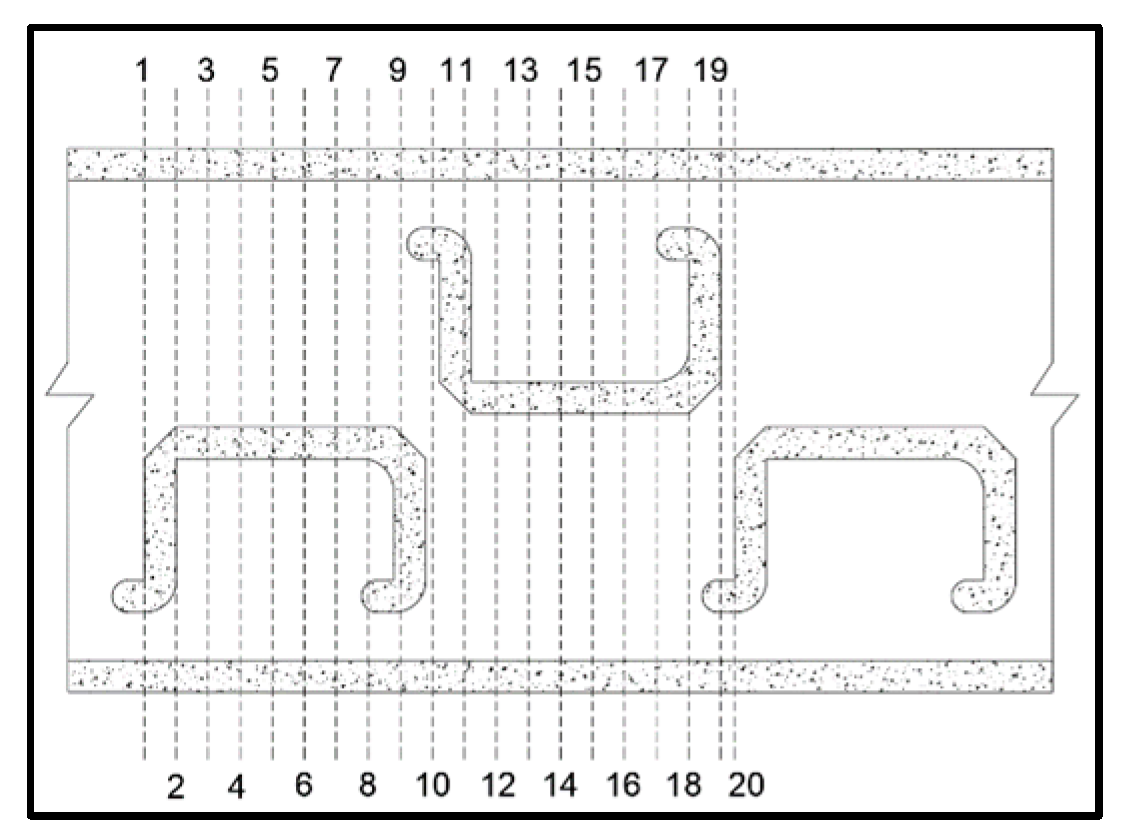
The flow pattern of the water in the 3# fishway pool in the 2D numerical simulation results of the vertical-slot, double-pool fishway is shown in Figure 17. In the 2D mathematical model, a cross-section line was established every 0.2 m from the leftmost end of the upstream baffle of the 3# pool to the leftmost end of the downstream pool baffle. A total of 20 cross-section lines were intercepted on each layer plane, and the distribution of the cross-section lines is shown in Figure 18. From the numerical calculation results, the maximum velocity value Vimax and the corresponding horizontal coordinate xi and vertical coordinate yi at the main flow area of the middle vertical slot on each cross-section line are selected and converted into dimensionless values Vimax/Va, xi/L, and yi/B. These values are listed in Table 4 together with the data obtained from the vertical averaging treatment of the 3D numerical simulation.
By comparing and analyzing the 3D and 2D hydraulic characteristics of the vertical-slot, double-pool fishway, it was found that the distribution of flow fields in the upper, middle, and lower planes of the pool in the 3D numerical simulation was the same as that in the 2D numerical simulation. The study also revealed that the maximum velocity point in the main flow area of the vertical slit in both simulations was located at the same coordinate position. The maximum relative error of yi/B occurred at xi/L = 0.82, with a relative error of 23.53%, while the minimum relative error occurred at xi/L = 0.54, with a relative error of 0.00%. The average relative error of the coordinate position yi/B was 9.84%. The maximum relative error of the ratio of maximum velocity to average velocity (Vimax/Va) occurred at xi/L = 0.87, with a relative error of 11.25%, while the minimum relative error occurred at xi/L = 0.27, with a relative error of 0.00%. The average relative error of Vimax/Va was 5.38%. Both the average relative errors of the coordinate position yi/B and the ratio of maximum velocity to average velocity (Vimax/Va) in the 3D numerical simulation results were within 10% of the 2D results, indicating a small error. This reveals that the water flow trajectory and velocity conditions simulated by the two models for the new fishway are similar. The water flow velocity/flow pattern information obtained from the 2D numerical simulation is approximately equal to the vertically averaged values obtained from the 3D numerical simulation.
The flow field of the vertical-slot, double-pool fishway exhibits significant planar 2D hydraulic characteristics, with negligible vertical velocity components that can be disregarded. Based on this characteristic, the flow structure of the double-pool, vertical-slot fishway can be treated as a 2D planar flow for analysis.

4. Conclusions

This study conducted a numerical simulation of the vertical-slot, double-pool fishway using the VOF model, analyzing the vertical velocity component and horizontal flow field characteristics of the fishway. The main conclusions are as follows:
(1) By studying and analyzing the location of the maximum velocity in the main flow area of the middle vertical slot and the distribution and attenuation of velocity values along the path, it was found that the hydraulic characteristics of the flow field in the pool of the vertical-slot, double-pool fishway exhibited similar patterns in the vertical direction.
(2) An analysis of the vertical hydraulic characteristics of the vertical-slot, double-pool fishway revealed that the vertical velocity of the water flow within the pool was predominantly below 0.1 m/s. This relatively insignificant value can be neglected, indicating that the water flow within the pool primarily exhibits characteristics of horizontal 2D flow.
(3) Through a comparative analysis of the numerical simulation results of the 3D and 2D hydraulic characteristics of the vertical-slot, double-pool fishway, it is found that there were no significant differences in the plane flow field distribution, flow pattern, and turbulence kinetic energy distribution of the pool between the two models. Especially in the main flow area of the central vertical slot, the relative errors of the position of the maximum velocity point and the ratio of the maximum velocity to the average velocity between the 3D and 2D numerical simulations were both less than 10%, indicating a high degree of similarity in terms of movement trajectory and flow velocity.
In summary, the novel vertical-slot, double-pool fishway retains the planar binary characteristics of the traditional VSF. The results of the 2D numerical simulation can be analogized as a uniform treatment in the vertical direction of the 3D numerical simulation, providing support for the study of its hydraulic characteristics through 2D numerical simulation. This research provides a theoretical basis for the structural design of fishways and engineering construction.

Author Contributions

Conceptualization, S.Q. and M.X.; methodology, S.Q.; software, S.Q. and M.X.; validation, M.X.; formal analysis, S.Q.; data curation, S.Q.; writing—original draft preparation, S.Q.; writing review and editing, M.X.; supervision, C.F. All authors have read and agreed to the published version of the manuscript.

Funding

This research received no external funding.

Data Availability Statement

The data used in this study are available on request from the corresponding author.

Conflicts of Interest

The authors declare no conflicts of interest.

Abbreviations

The following abbreviations are used in this manuscript:
CThe total length of the fishway
BThe total width of the fishway
LThe length of the unit pool
b1, b2The side vertical slots of the fishway
b3The intermediate vertical slot
b4Width of the partition in the fishway
SThe relative distances of the vertical lines from the left edge along the width direction of the vertical slot
VaAverage flow velocity of the vertical slot section
VimaxThe maximum flow velocity value on the cross-sectional line
hslotThe height of the target from the bottom plate
HDesigned water depth
WVertical flow velocity at the monitoring point

References

  1. Chen, S.; Chen, B.; Fath, D.B. Assessing the cumulative environmental impact of hydropower construction on river systems based on energy network model. Renew. Sustain. Energy Rev. 2015, 42, 78–92. [Google Scholar] [CrossRef]
  2. Kuriqi, A.; Pinheiro, N.A.; Sordo-Ward, A.; Garrote, L. Influence of hydrologically based environmental flow methods on flow alteration and energy production in a run-of-river hydropower plant. J. Clean. Prod. 2019, 232, 1028–1042. [Google Scholar] [CrossRef]
  3. Ward, J.V. The Four-Dimensional Nature of Lotic Ecosystems. J. N. Am. Benthol. Soc. 1989, 8, 2–8. [Google Scholar] [CrossRef]
  4. Wang, H.; Wang, C.; Liu, D.; Li, W.; Tong, D. Numerical Simulation Study on Hydraulic Characteristics of Fishway with Cross Partition. Water Resour. Power 2012, 30, 65–68. [Google Scholar]
  5. Shi, K.; Li, G.; Liu, S.; Sun, S. Experimental study on the passage behavior of juvenile Schizothorax prenanti by configuring local colors in the vertical slot fishways. Sci. Total Environ. 2022, 843, 156989. [Google Scholar] [CrossRef]
  6. Ahmadi, M.; Kuriqi, A.; Nezhad, H.M.; Ghaderi, A.; Mohammadi, M. Innovative configuration of vertical slot fishway to enhance fish swimming conditions. J. Hydrodyn. 2022, 34, 917–933. [Google Scholar] [CrossRef]
  7. Santos, J.M.; Silva, A.; Katopodis, C.; Pinheiro, P.; Pinheiro, A.; Bochechas, J.; Ferreira, M.T. Ecohydraulics of pool-type fishways: Getting past the barriers. Ecol. Eng. 2011, 48, 38–50. [Google Scholar] [CrossRef]
  8. Zheng, T.; Niu, Z.; Sun, S.; Shi, J.; Liu, H.; Li, G. Comparative Study on the Hydraulic Characteristics of Nature-Like Fishways. Water 2020, 12, 955. [Google Scholar] [CrossRef]
  9. Shen, C.; Yang, R.; Wang, M.; He, S.; Qing, S. Application of Vortex Identification Methods in Vertical Slit Fishways. Water 2023, 15, 2053. [Google Scholar] [CrossRef]
  10. Ahmadi, M.; Ghaderi, A.; MohammadNezhad, H.; Kuriqi, A.; Di Francesco, S. Numerical investigation of hydraulics in a vertical slot fishway with upgraded configurations. Water 2021, 13, 2711. [Google Scholar] [CrossRef]
  11. Bombač, M.; Četina, M.; Novak, G. Study on flow characteristics in vertical slot fishways regarding slot layout optimization. Ecol. Eng. 2017, 107, 126–136. [Google Scholar] [CrossRef]
  12. Barton, A.F.; Keller, R.J. 3D Free surface model for a vertical slot fishway. In Land Waters: Research, Engineering and Man-Agement v.2. Department of Civil Engineering; Monash University: Clayton, Australia, 2003. [Google Scholar]
  13. Wu, S.; Rajaratnam, N.; Katopodis, C. Structure of flow in vertical slot fishway. J. Hydraul. Eng. 1999, 125, 351–360. [Google Scholar] [CrossRef]
  14. Bian, Y.; Sun, S. Study on Hydraulic Characteristics of Vertical Slot Fishway. J. Hydraul. Eng. 2013, 44, 1462–1467. [Google Scholar]
  15. Wang, X.; Zhang, G.; Gao, M.; Ji, X. Numerical Simulation of Hydraulic Characteristics of a New Type of Spiral Fishway. Yellow River 2014, 36, 118–121. [Google Scholar]
  16. Li, H.; Wang, X.; Zheng, F. Analysis of Three-Dimensional Flow Characteristics in Trapezoidal Fishway. J. Hohai Univ. 2023, 51, 61–65+76. [Google Scholar]
  17. Ma, W.; Liang, Y.; Wang, M.; Feng, M. Study on hydraulic characteristics of vertical slot-surface orifice combined ecological fishway. Water Resour. Hydropower Eng. 2020, 51, 122–129. [Google Scholar] [CrossRef]
  18. Nassiraei, H.; Heidarzadeh, M.; Shafieefar, M. Numerical simulation of long waves (tsunami) forces on caisson breakwaters. Sharif Civil Eng. 2016, 32, 3–12. [Google Scholar]
  19. Xie, M.; Fu, C.; Wu, Y. Design and Hydraulic Characteristic Analysis of a New Type of Vertical Slot Double pool Fishway. Pearl River 2023, 44, 129–133. [Google Scholar]
  20. Marriner, B.A.; Baki, A.B.; Zhu, D.Z.; Cooke, S.J.; Katopodis, C. The hydraulics of avertical slot fishway: A case study on the multi-species VianneyLegendre fishway in Quebec, Canada. Ecol. Eng. 2016, 90, 190–202. [Google Scholar] [CrossRef]
  21. Puzdrowska, M.; Heese, T. Detailed Research on the Turbulent Kinetic Energy’s Distribution in Fishways in Reference to the Bolt Fishway. Fluids 2019, 4, 64. [Google Scholar] [CrossRef]
  22. Tarrade, L.; Texier, A.; David, L.; Larinier, M. Topologies and measurements of turbulent flow in vertical slot fishways. Hydrobiologia 2008, 609, 177–188. [Google Scholar] [CrossRef]
  23. Pena, L.; Puertas, J.; Bermúdez, M.; Cea, L.; Peña, E. Conversion of Vertical Slot Fishways to Deep Slot Fishways to Maintain Operation during Low Flows: Implications for Hydrodynamics. Sustainability 2018, 10, 2406. [Google Scholar] [CrossRef]
Figure 1. Sketch of the vertical-slot, double-pool fishway structure.
Water 16 01695 g001
Figure 2. The partially detailed drawing of 3# pool.
Water 16 01695 g002
Figure 3. Grid division diagram of fishway experimental model.
Water 16 01695 g003
Figure 4. Structural dimensions and planar distribution of monitoring points for the traditional VSF 6# pool (unit: m).
Water 16 01695 g004
Figure 5. Comparison of water flow velocity values between traditional VSF numerical simulation and physical model: (a) y = 2; (b) y = 4; (c) y = 6; and (d) y = 8.
Water 16 01695 g005
Figure 6. Flow velocity distribution diagram of the vertical slot section in the middle.
Water 16 01695 g006
Figure 7. Vertical distribution diagram of the center cross-section of the vertical slot.
Water 16 01695 g007
Figure 8. Streamline distribution diagram at different depths of the fishway: (a) bottom layer; (b) middle layer; and (c) surface layer.
Water 16 01695 g008
Figure 9. Distribution diagram of the locations with maximum flow velocity in the middle vertical slot.
Water 16 01695 g009
Figure 10. Longitudinal distribution diagram of maximum flow velocity in the middle vertical slot.
Water 16 01695 g010
Figure 11. Distribution diagram of the locations with maximum flow velocity in the right vertical slot.
Water 16 01695 g011
Figure 12. Longitudinal distribution diagram of maximum flow velocity in the right vertical slot.
Water 16 01695 g012
Figure 13. Distribution diagram of the locations with maximum flow velocity in the left vertical slot.
Water 16 01695 g013
Figure 14. Longitudinal distribution diagram of maximum flow velocity in the left vertical slot.
Water 16 01695 g014
Figure 15. Layout of monitoring points in pool 3#.
Water 16 01695 g015
Figure 16. Distribution of turbulence kinetic energy at different depth layers in fishway: (a) bottom layer; (b) middle layer; (c) surface layer.
Water 16 01695 g016
Figure 17. The numerical simulation results of 2D water flow velocity in pool 3#.
Water 16 01695 g017
Figure 18. Layout diagram of monitoring cross-section lines in pool 3#.
Water 16 01695 g018
Table 1. Detailed structural dimensions of fishway.
Name of StructureDimension Value
The total length of the fishway (C)25.54
The total width of the fishway (B)3
The side vertical slots of the fishway (b1, b2)0.4
The intermediate vertical slot (b3)0.2
Width of the partition in the fishway (b4)0.2
The length of the unit pool (L)3.6
Note: unit = m.
Table 2. List of vertical velocity components at monitoring points in the pool.
hslot/H0.20.50.8
Monitoring PointX (m)Y (m)W (m/s)X (m)Y (m)W (m/s)X (m)Y (m)W (m/s)
112.753.420.0112.753.420.0212.753.420.01
211.404.500.0111.404.50−0.0411.404.500.01
312.202.59−0.0212.202.59−0.0212.202.590.02
413.302.590.0313.302.590.0313.302.590.00
514.002.59−0.0414.002.590.0314.002.590.04
611.403.800.0211.401.890.0111.401.89−0.03
712.201.89−0.0312.201.89−0.0312.201.890.00
813.301.89−0.0313.301.89−0.0213.301.89−0.04
914.001.89−0.0114.001.89−0.0114.001.890.04
1011.403.00−0.0111.401.090.0011.401.090.00
1112.201.09−0.0212.201.09−0.0212.201.090.03
1213.301.09−0.0113.301.090.0113.301.090.00
1314.001.09−0.0114.001.09−0.0314.001.090.01
1411.402.30−0.0211.400.390.0011.400.39−0.02
1512.200.39−0.0612.200.390.0512.200.390.02
1613.300.39−0.0113.300.39−0.0113.300.39−0.03
1714.000.390.0214.000.39−0.0214.000.390.00
Note: Negative values indicate that the direction of the velocity component at the monitoring point is opposite to the negative direction of the corresponding coordinate axis. Taking the lower left corner of the fishway structure in Figure 1 as the origin of the coordinate axis, X and Y represent the positional coordinates of the monitoring points, while hslot/H represents different depth layers.
Table 3. Comparison of maximum turbulence kinetic energy and average turbulence kinetic energy in the pool.
hslot/HMaximum TKE (m²/s²)Average TKE (m²/s²)
0.2 (bottom layer)0.070.01
0.5 (middle layer)0.070.01
0.8 (surface layer)0.080.01
Table 4. Comparison table of 3D and 2D flow field numerical simulation results.
No.xi/L(yi/B) 2(yi/B) 3(Vimax/Va) 2(Vimax/Va) 3yi/B
Relative Error
Vimax/Va
Relative Error
10.000.500.461.151.238.70%−6.50%
20.050.520.541.251.21−3.70%3.31%
30.110.580.601.101.13−3.33%−2.65%
40.160.600.641.021.08−6.25%−5.56%
50.220.600.670.981.02−10.45%−3.92%
60.270.610.690.940.94−11.59%0.00%
70.330.600.680.920.86−11.76%6.98%
80.380.570.490.880.8116.33%8.64%
90.440.550.560.950.89−1.79%6.74%
100.490.520.581.141.23−10.34%−7.32%
110.540.480.481.221.210.00%0.83%
120.600.430.421.091.132.38%−3.54%
130.650.420.371.041.0713.51%−2.80%
140.710.400.350.980.9714.29%1.03%
150.760.400.340.920.8917.65%3.37%
160.820.420.340.900.8123.53%11.11%
170.870.430.360.890.8019.44%11.25%
180.920.460.420.980.899.52%10.11%
190.980.490.461.081.156.52%−6.09%
201.000.490.441.121.1911.36%−5.88%
Note: The subscript “2” in bracket indicates 2D and “3” indicates 3D.
Disclaimer/Publisher’s Note: The statements, opinions and data contained in all publications are solely those of the individual author(s) and contributor(s) and not of MDPI and/or the editor(s). MDPI and/or the editor(s) disclaim responsibility for any injury to people or property resulting from any ideas, methods, instructions or products referred to in the content.