Article

Optimal Allocation of Water Resources in Ordos City Based on the General Water Allocation and Simulation Model

1
College of Water Conservancy and Civil Engineering, Inner Mongolia Agricultural University, Hohhot 010018, China
2
Key Laboratory of Water Resources Protection and Utilization of Inner Mongolia Autonomous Region, Hohhot 010018, China
3
Collaborative Innovation Center for Comprehensive Management of Water Resources and Water Environment in the Inner Mongolia Section of the Yellow River Basin, Hohhot 010018, China
4
Ordos Dalad Banner Water Conservancy Bureau, Ordos 014300, China
5
Ordos Water Utility Development Center, Ordos 017010, China
6
Ordos Hydrological Survey Bureau, Ordos 017010, China
7
Ordos River and Lake Protection Center, Ordos 017010, China
8
State Key Laboratory of Water Cycle Simulation and Regulation, China Institute of Water Resources and Hydropower, Beijing 100038, China
*
Authors to whom correspondence should be addressed.
Water 2024, 16(12), 1711; https://doi.org/10.3390/w16121711
Submission received: 10 May 2024 / Revised: 8 June 2024 / Accepted: 14 June 2024 / Published: 16 June 2024
(This article belongs to the Section Water Use and Scarcity)

Abstract

:
This study aims to achieve coordination between regional economic development and ecological environmental protection and to mitigate issues such as competition for water use among industries and significant disparities between water supply and demand. A multi-water-source, multi-user, and multi-objective optimal water resource allocation model was developed for Ordos City using general water allocation and simulation (GWAS). This model was applied to optimize water resource allocation on a monthly scale for various users across different administrative units (banners) in both short- and long-term planning periods. The results indicate that Ordos City’s allocated water volume for 2025 and 2030 is projected to be 1833.36 × 106 m3 and 1963.44 × 106 m3, respectively, with an overall water shortage rate of 5.46% and 5.67%, respectively. Water shortages are predicted in Dongsheng District, Dalad Banner, Etuoke Banner, Hangjin Banner, and Wushen Banner, primarily during the agricultural water usage period from March to November. The regional water supply structure was notably optimized, with a gradual decrease in the proportion of groundwater in the total water supply and a corresponding increase in the supply of surface water and unconventional water. These changes effectively improve local groundwater overexploitation and enhance the water supply efficiency. The research findings could offer valuable theoretical and technical support for the development and utilization of water resources, as well as for adjustments in the population–economic–industrial structure of Ordos City. Additionally, this study could provide scientific references for optimizing water resource allocation in other water-deficient cities in arid and semi-arid areas of the Yellow River Basin.

1. Introduction

The Yellow River, the mother river of the Chinese nation, serves as a critical ecological barrier in China [1]. The promotion of ecological protection and high-quality development strategies in the Yellow River Basin presents a unique historical opportunity for this region [2,3]. However, the ecological environment of the Yellow River Basin is fragile and characterized by frequent natural disasters and severe water scarcity. This poses a significant challenge for sustainable development [4,5,6]. In this context, strengthening the strict control of water resources, adhering to the principle of “four waters and four determinations”, and optimizing the allocation of limited water resources to various users are essential steps for overcoming the bottleneck of water shortage constraints [7,8].
The optimal allocation of water resources involves considering multiple normative requirements and devising a water allocation plan that maximizes comprehensive benefits, including socio-economic and ecological factors, under various constraints, such as natural conditions, engineering requirements, and user demand characteristics [9,10]. Configuration typically involves multiple water sources, users, and targets. Traditional operational research methods, including dynamic programming, system analysis, and large system theory, face challenges when applied to the current problem due to the complex and inefficient solutions [11,12,13]. With the advancement of computer technology, intelligent optimization algorithms, such as the particle swarm algorithm, ant colony algorithm, genetic algorithm, and neural network model, are increasingly being used to address practical water resource optimization allocation plans [14,15,16,17]. Among these methods, the second-generation non-dominated sorting genetic algorithm (NSGA-II-S) is the most commonly used genetic algorithm. It can conduct large-scale calculations and parallel searches, yielding more Pareto solution sets during problem-solving [18,19]. Some researchers have also utilized models such as MIKE BASIN (MIKE Basin-Integrated Catchment Modelling System), WEAP (Water Evaluation and Planning System), WROOM (Water Resources Optimal Operation Model), and WATERWARE (Water Resources Management Planning and Economic Analysis Tool) for tasks such as river network simulations, surface production and confluence calculations, optimal water volume allocation, and reservoir dispatch rules [20,21,22,23]. Although these models can effectively simulate natural water cycle processes, they struggle to incorporate the impact of human activities on the water cycle [24]. To address this challenge, Sang et al. [25,26] developed a general water allocation and simulation model (GWAS) based on the natural–society dual water cycle theory. This model dynamically links natural and social water cycle processes and analyzes their mutual feedback to significantly enhance the shortcomings of previous models and achieve the coordinated development of water resources, the economy, society, and the ecological environment. GWAS models are widely applied to study water resource allocation in various regions or basins because of their visual processing capabilities, rapid calculations, and user-friendliness. For example, Luan et al. [27], Ma et al. [28], and Huang et al. [29] utilized this model to optimize water resource allocation in Wu’an City, Handan City, and the Pishihang Irrigation District, respectively, and all achieved favorable allocation results. In addition, the GWAS model can flexibly adjust its priorities to different objectives based on varying water resource management needs, thereby ensuring optimal water use.
When the GWAS model is applied in regions with different emphases, it achieves to significantly different allocation results [30,31]. Currently, the existing research on optimal water resource allocation mainly formulates water resource allocation schemes by analyzing results across different years. However, as water resource networks become increasingly complex and water supply relationships more diverse, annual-scale schemes are inadequate for refined water resource management, often necessitating optimal allocation on a monthly scale [32,33,34].
Ordos City, situated at the northernmost end of the Yellow River Basin, is a typical city in arid and semi-arid regions. As a crucial link in promoting high-quality development upstream and downstream, it plays a pivotal role in safeguarding the health and security of the Yellow River. In recent years, with the rapid industrialization and urbanization of cities, escalating water demand creates a significant imbalance among water resource limitations, economic growth, and ecological preservation [35,36,37]. To address these issues, Ordos City urgently requires a targeted and viable water resource allocation scheme. Against this background, this study focused on Ordos City, using 2021 as the base year, which marked the beginning of the “14th Five-Year Plan” and aligned with the 2035 Vision Goal Outline. The short- and long-term planning periods were set to 2025 and 2030, respectively. Based on the GWAS model, this study conducted a refined monthly water resource allocation for various users across different administrative units (banners) in Ordos City, aiming to address the water resource management issues in the new era. The analysis included the spatiotemporal distribution of regional water shortages and the monthly water supply (demand) status of each administrative division. This study not only provides a scientific foundation for the development, utilization, and refined management of regional water resources but also offers a reference for optimizing the allocation of water resources in other water-deficient cities in the Yellow River Basin.

2. Materials and Methods
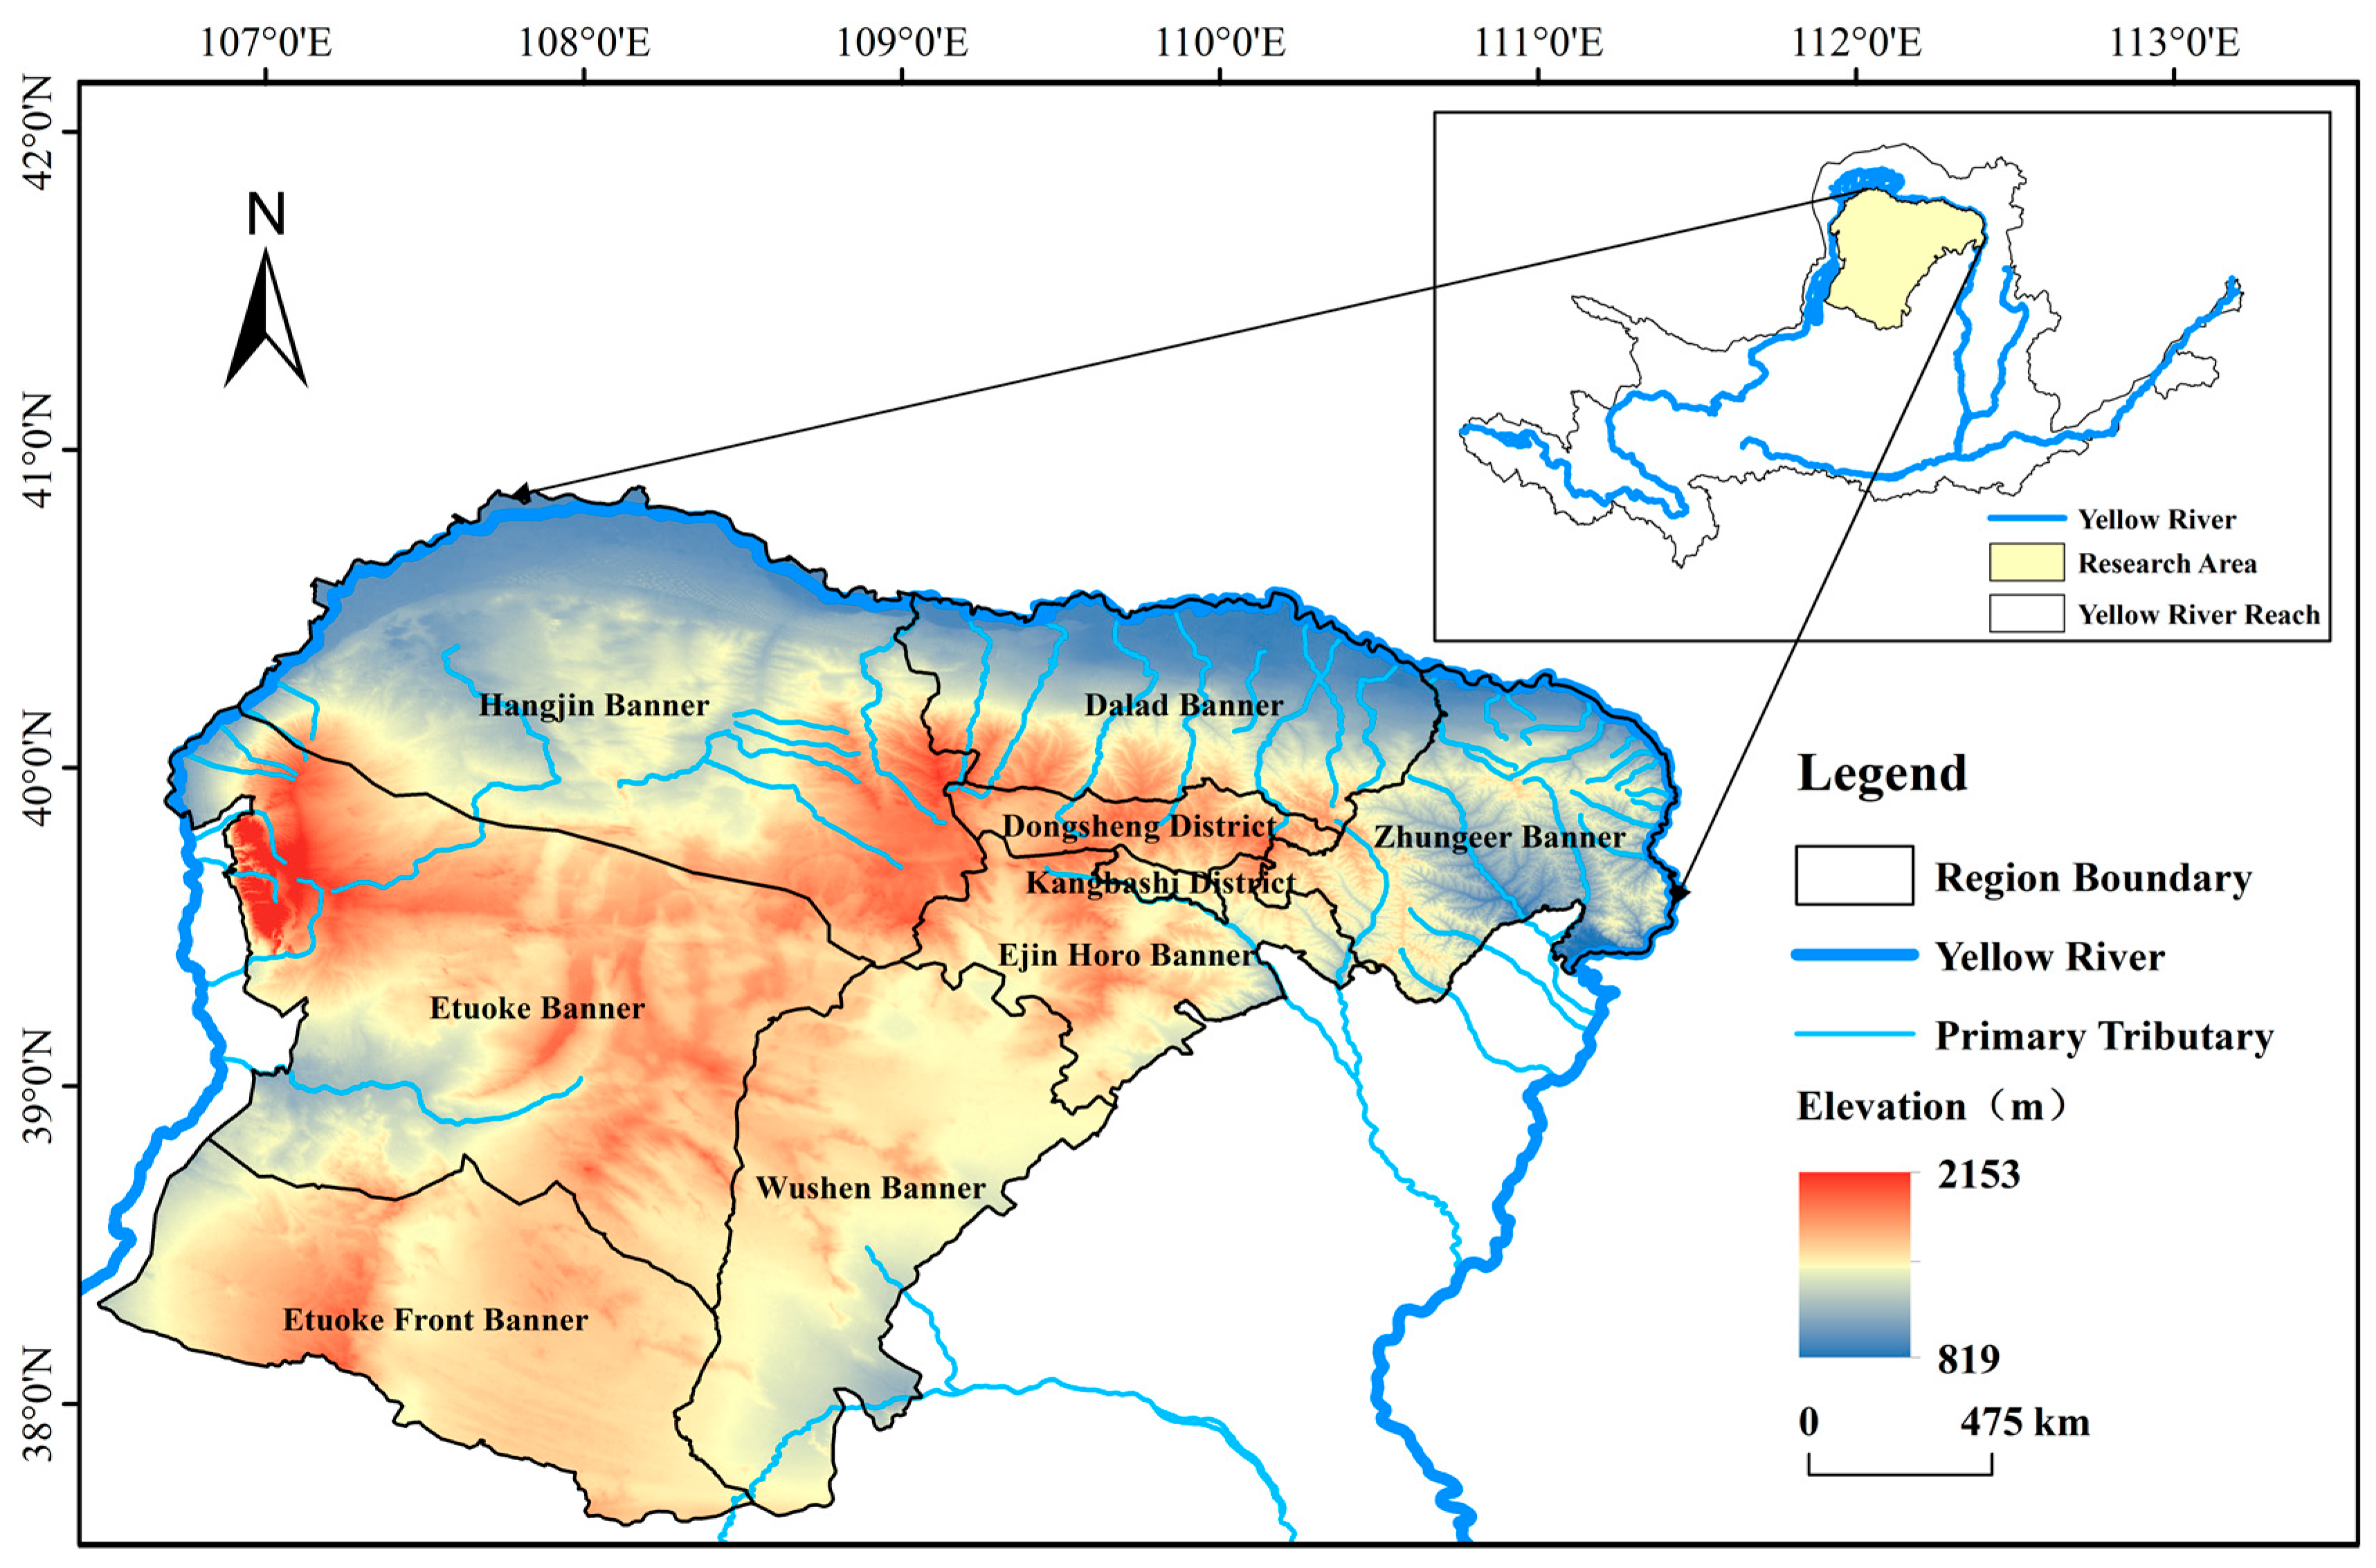
2.1. Study Area

Ordos City, located at N 37°35′24″–40°51′20″ and E 106°42′40″–111°27′20″, is the provincial sub-central city of the Inner Mongolia Autonomous Region [38], which governs seven banners and two districts (Figure 1). With an undulating terrain, the region is higher in the northwest and lower in the southeast, covering a total area of approximately 87,000 km2. The Yellow River enters from Mengxi Town, Etuoke Banner, flows through Hangjin Banner and Dalad Banner, and exits from Longkou Town, Zhungeer Banner. Most rivers in the area are seasonally sediment-laden and serve as significant sources of sediment for the Yellow River. In 2021, the city’s total water consumption reached 1678.61 × 106 m3, with agriculture accounting for 68.8%, industry for 20.6%, and ecological water for only 4.6%. This imbalance has led to issues such as excessive agricultural water use and ecological water scarcity. Surface water, groundwater, and unconventional water supplies accounted for 38.4%, 49.9%, and 11.7%, respectively, highlighting the challenges in water resource utilization efficiency and local groundwater overexploitation. The total available water resources in the city were 2017.32 × 106 m3, including 1317.32 × 106 m3 of available surface water and groundwater, with an additional 700 × 106 m3 permitted for withdrawal from the Yellow River. The per capita water resource of 1406 m3 was lower than the provincial average of 2155 m3 and the national average of 2038 m3, indicating water scarcity in the region. This area has faced shortages in engineering, resources, and structural water. There is an urgent need to optimize water allocation to enhance the quality and efficiency of a city’s economic and social development.

2.2. Data Preparation

The data for this study included the 2010–2021 “Ordos City Statistical Yearbook”, “Ordos City Water Resources Bulletin”, “Ordos City Water Resources Sustainable Utilization Plan”, “Ordos City Four Waters and Four Determinations Plan”, as well as the “Statistical Yearbook”, “Water Resources Bulletin”, “The Fourteenth Five-Year Plan for National Economic and Social Development and Outline of Long-term Goals for 2035”, and “Statistical Bulletin of National Economic and Social Development” in each banner area.

2.3. Water Supply and Demand Prediction

The indicator analysis method was utilized to predict water demand and analyze water supply across the nine banner districts of Ordos City [39,40]. This analysis integrated the predicted annual population, industry planning indicators, planned areas, and industry water quotas [41]. Additionally, it considered future regional long-term plans, such as industrial structure optimization and water conservancy project layout, to predict five types of water demand for city life, rural life, industry, agriculture, and ecology in different planning years. Notably, the city life comprised both city residents’ lives and public lives, with the latter encompassing the service and construction industries. The prediction of domestic water demand in urban and rural areas was based on per capita quotas, whereas industrial water demand was estimated using the industrial added value per CNY 10,000. Agricultural water demand, including agriculture, forestry, animal husbandry, and fisheries, was predicted using certain factors, such as irrigation area, water use quota, and irrigation water utilization coefficient for the planning year. Ecological water demand was predicted based on per-acre quotas for greening, roads, squares, and landscape water bodies. After the calculation, the total water demand for the region in 2025 and 2030 is predicted to be 1939.31 × 106 m3 and 2081.47 × 106 m3, respectively (Figure 2a,b).
The analysis of water availability considered both conventional (surface water and groundwater) and unconventional sources (dredging water, reclaimed water, irrigation area drainage, and rainwater) [42,43]. The refinements in the allocable water volume of surface water and groundwater were based on the “Third Water Resources Survey and Evaluation of the Inner Mongolia Autonomous Region” findings and Ordos City’s dual control targets for the total annual water consumption and intensity. Unconventional water sources were also included in the unified allocation of water resources. The reclaimed water was categorized into urban and industrial park sewage regeneration, and the prediction of dredging water availability was based on the water enrichment coefficient method. The irrigation area drainage volume was calculated based on the allowable water volume for the irrigation area’s drainage resources. Rainwater collection and utilization amounts were determined by the “Ordos City Water Resources Sustainable Utilization Plan”. Consequently, the projected regional water supply for 2025 and 2030 is 1935.30 × 106 m3 and 2077.37 × 106 m3, respectively (Figure 2c,d).

2.4. GWAS Model Configuration Method

2.4.1. Objective Function

(1) The fairness optimal objective function aims to express the relative differences in water shortage rates among various banners in the region within the year [29]. A smaller value of the objective function indicates a smaller degree of difference and a fairer allocation across each banner. Its expression is as follows:
M i n F x = y = 1 m y r n = 1 12 h = 1 m h q h · G P ( X h ) ,
G P X h = 1 m u 1 · u = 1 m u ( x h u X h ¯ ) 2 ,
where F(x) is the fairness target; G P ( X h ) is the fairness function; q h is the penalty function of industry users; x h u is the water shortage rate of industry user h in unit u of the flag area; X h ¯ is the average water shortage rate of industry user h in district unit u; myr is the number of years in the calculation period; n is the monthly value in the year; mh is the number of regional industrial water use types; and mu is the number of regional units.
(2) The minimum objective of water shortage rate aims to quantify the satisfaction level regarding water demand across various industries in the region throughout the year [25]. A smaller value of the objective function indicates a lower water shortage rate and a higher satisfaction level regarding water demand for various industries in the region. Its expression is as follows:
M i n Y x = y = 1 m y r n = 1 12 h = 1 m h q h · S W ( X h ) ,
S W X h = 1 m u · u = 1 m u ( x h u s o b h n ) ,
where Y x is the water supply stress target; S W ( X h ) is the water supply stress function; q h is the penalty function of industry users; x h u is the water shortage rate of industry user h in unit u of the flag area; s o b h n is the ideal value of the monthly water supply stress target for regional industry user h; myr is the number of years in the calculation period; n is the monthly value in the year; mh is the number of regional industrial water use types; and mu is the number of regional units.
(3) The overall objective function is the weighted sum of the equity and water shortage rate goals [28]. A smaller value of the objective function indicates a more optimal allocation of the regional water resources. Its expression is as follows:
T = F × K f + Y × K y ,
where T is the total objective function; F is the fairness objective function; Y is the water shortage rate objective function; and K f and K y are the proportional weights of each objective.

2.4.2. Constraints

(1) Water resource-carrying capacity constraints [44]: The total water supply to different industries from each water source should not exceed the maximum capacity of the water source, that is:
h = 1 u X i h u P i u ,
where X i h u is the water supply volume of each water source i to each industry h in banner unit u; and P i u is the total water supply volume of the water source i to banner unit u, 104 m3.
(2) Water demand constraints [44]: The total water demand of different industries in each banner area was within the range of the corresponding minimum and maximum water demands, that is:
D h m i n u h = 1 u X i h u D h m a x u ,
where D h m i n u and D h m a x u are, respectively, the minimum and maximum water demand of unit u in each industry h in the flag area; and X i h u is the water supply volume of each water source i to each industry h in banner unit u, 104 m3.
(3) Total water consumption constraints [29]: The total water supply from all sources should not exceed the regional total water consumption containment red line, that is:
h = 1 u P i h u W ,
where W is the total water consumption control index; and P i u is the total water supply volume of the water source i to banner unit u, 104 m3.
(4) Water delivery capacity constraints [25]: The water supply volume of each source should not exceed its maximum delivery capacity, that is:
X i h u Q i u ,
where Q i u is the upper limit of the water delivery capacity of water source i to unit u in the flag area; and X i h u is the water supply volume of each water source i to each industry h in the banner unit u, 104 m3.
(5) Variable non-negative constraints [28]: The water supply volume of each source should be equal to or greater than zero, that is:
X i h u 0 ,
where X i h u is the water supply volume of each water source i to each industry h in the banner unit u, 104 m3.

2.4.3. Solution Method

The GWAS model was solved using the NSGA-II-S algorithm with an elite strategy. The water allocation to different industries in each banner area from each source is a decision variable. These variables were encoded into a feasible solution set. The survival of the fittest was determined by judging the individual degree of satisfaction and generating a new generation of feasible solutions. This process was iterated to achieve the optimal allocation of water resources [45].

3. Regional Model Construction

3.1. Computational Unit Division

To effectively construct a GWAS model, it is crucial to first partition the computing units. The division method can directly affect the simulation efficacy of the deployment model. As water resource management predominantly relies on administrative divisions, this approach involves nesting administrative divisions with water resource divisions to delineate regional calculation units [46]. The input layers of the model encompassed reservoirs, river systems, administrative divisions, and water resource divisions. It is essential to maintain consistency in the attributes of these layers throughout the process. Additionally, specific projects, such as the Yellow River diversion project, sand blocking and water exchange projects, water diversion projects, industrial water intake, and water storage projects in each banner unit, were summarized into virtual reservoirs. By leveraging the superposition subdivision principle of GIS, the city was divided into nine calculation units.

3.2. Determination of Water Supply and Consumption Relationship

A network depicting regional water resource utilization and transformation was developed based on the current state of Ordos City’s water resource system. This network integrated certain factors, such as water inflow, water demand, the current status of water supply projects, and the scale and layout of planned projects (Figure 3). Considering water use across industries in the different banners of Ordos City, the order of priority for water use was established as domestic, ecological, industrial, and agricultural. The water supply priorities were structured as follows. First, unconventional water sources were prioritized for industrial and ecological purposes. Second, the surface water was reasonably developed to serve as a stable water source for industrial and agricultural development. Utilizing water diversion, water storage, and water lifting projects, efforts were made to fully allocate the exchanged water volume in sand retention and water exchange projects. Finally, exploitable groundwater was utilized as the primary source, with centralized sources that prioritized domestic supply. The remaining water supplemented industrial needs, and the decentralized groundwater was used for agricultural irrigation. The remaining available water was distributed among users based on maximum efficiency, ensuring that water resources could support regional, economic, social, and ecological development. These principles established the water supply relationships between various sources and industries within the banner area, forming topological connections in the GWAS model across reservoirs, banners, and banner reservoirs in three dimensions.

3.3. Parameter Setting and Verification

In the GWAS model, the parameters of the water resource allocation module were categorized into water supply and demand parameters along with optimized allocation parameters [44]. The water demand parameters represent the water demands of various industries in each banner area over time. The water supply parameters included the reservoir characteristics and the volume of water supplied by each source over time. The optimized allocation parameters included the water source industry water distribution ratio, industry weight parameters, water shortage rate weight parameters, and fairness weight parameters. The water distribution by the water source industry was the ratio of water supplied by the water source to the industry’s water demand, indicating the proportion of the total industrial water demand supplied by this type of water source. To maintain a balanced coordination among banners and emphasize fair water resource allocation, the water shortage rate and equity weight were set to 0.5 and 1.0, respectively. Considering Ordos City’s ecological priority and green development focus, ecological weight was maximized. The weight ratio of urban life, rural life, ecology, industry, and agriculture was set at 10:10:10:9:8. Default values were used to optimize the simulation parameters: population size (50), crossover probability (0.3), mutation probability (0.05), and maximum number of generations (1000).
To verify the configuration parameter settings and accuracy of the simulation data, the actual water consumption by different industries in each banner area and the actual water supply from different sources in 2021 were adopted as the basis, with the relative error rate as the evaluation index. The actual water supply volume in 2021 was 1678.61 × 106 m3, the model-configured volume was 1643.17 × 106 m3, and the overall regional error rate was 2.13%. Regarding banner fit, each banner area primarily relied on self-supplied water, with a minimal supply to other banners, resulting in relatively low error rates. Regarding industrial fit, apart from agriculture, which had a high simulation error rate of 3.09%, the other industries exhibited relatively small errors. Overall, the analysis of the relative error rates between the actual and simulated water volumes indicated that the GWAS model had a strong simulation effect in Ordos City.

4. Results and Analysis

4.1. Configuration Optimization Analysis

The GWAS model in this study was utilized to allocate water resources in Ordos City, and optimized allocation results for 2025 and 2030 were obtained. To illustrate the allocation volumes and corresponding relationships among water sources, industries, and banner areas, the optimized allocation results for different planning years are shown (Figure 4). Referring to Figure 4, one can discern the types of water sources present in the nine banner areas, alongside their respective volumes and how these volumes are apportioned among the diverse water-utilizing industries within each banner area. This fosters a deeper comprehension of the origins, destinations, and transitions implicated in optimizing water resource allocation in Ordos City.
From the perspective of the water supply–demand relationship between the industries and water sources, regional agricultural water use relied mainly on groundwater, and the downstream plain Yellow River diversion irrigation areas primarily utilized surface water. The industrial water supply primarily depended on surface water sourced from the Yellow River’s mainstream water intake, with additional contributions from groundwater, reclaimed water, and dredging water, facilitating industrial growth. Nearly all domestic water was sourced from groundwater, which ensured the well-being of the local residents. Ecological water use was dominated by unconventional water sources followed by groundwater, which facilitated the improvement in the human settlement environment and helped to strike a balance between production and ecological water use.
From the perspective of the water supply–demand relationship between the water sources and banner areas, both surface water and groundwater supply were widely distributed, often requiring the coordinated scheduling of multiple water sources to meet the demand in each banner area. Ordos City has essentially formed a pattern of joint water supply security that incorporates local water sources, external water transfers, unconventional water sources, and emergency backup water [47].
From the perspective of the water supply–demand relationship between the banner areas and industries, Dalad Banner, Hangjin Banner, and Wushen Banner receive the largest water allocations due to their proximity to the Yellow River and adjacency to the Kuye River. These areas primarily use water for agriculture, significantly straining the water supply, which, in turn, greatly reduces water availability for other industries, leading to high water allocation. Etuoke Banner, Etuoke Front Banner, Ejin Horo Banner, and Zhungeer Banner, with moderate water allocations, host water-intensive enterprises such as mining, manufacturing, and thermal power, alongside balanced agricultural development. Dongsheng District and Kangbashi District, serving as urban hubs with dense populations and industries but possessing limited water resources, consistently received the lowest water allocations. Overall, water resource allocation in Ordos exhibited significant spatial and temporal variations. Optimal water resource allocation would achieve spatial–temporal coupling with the population, economy, and industry.

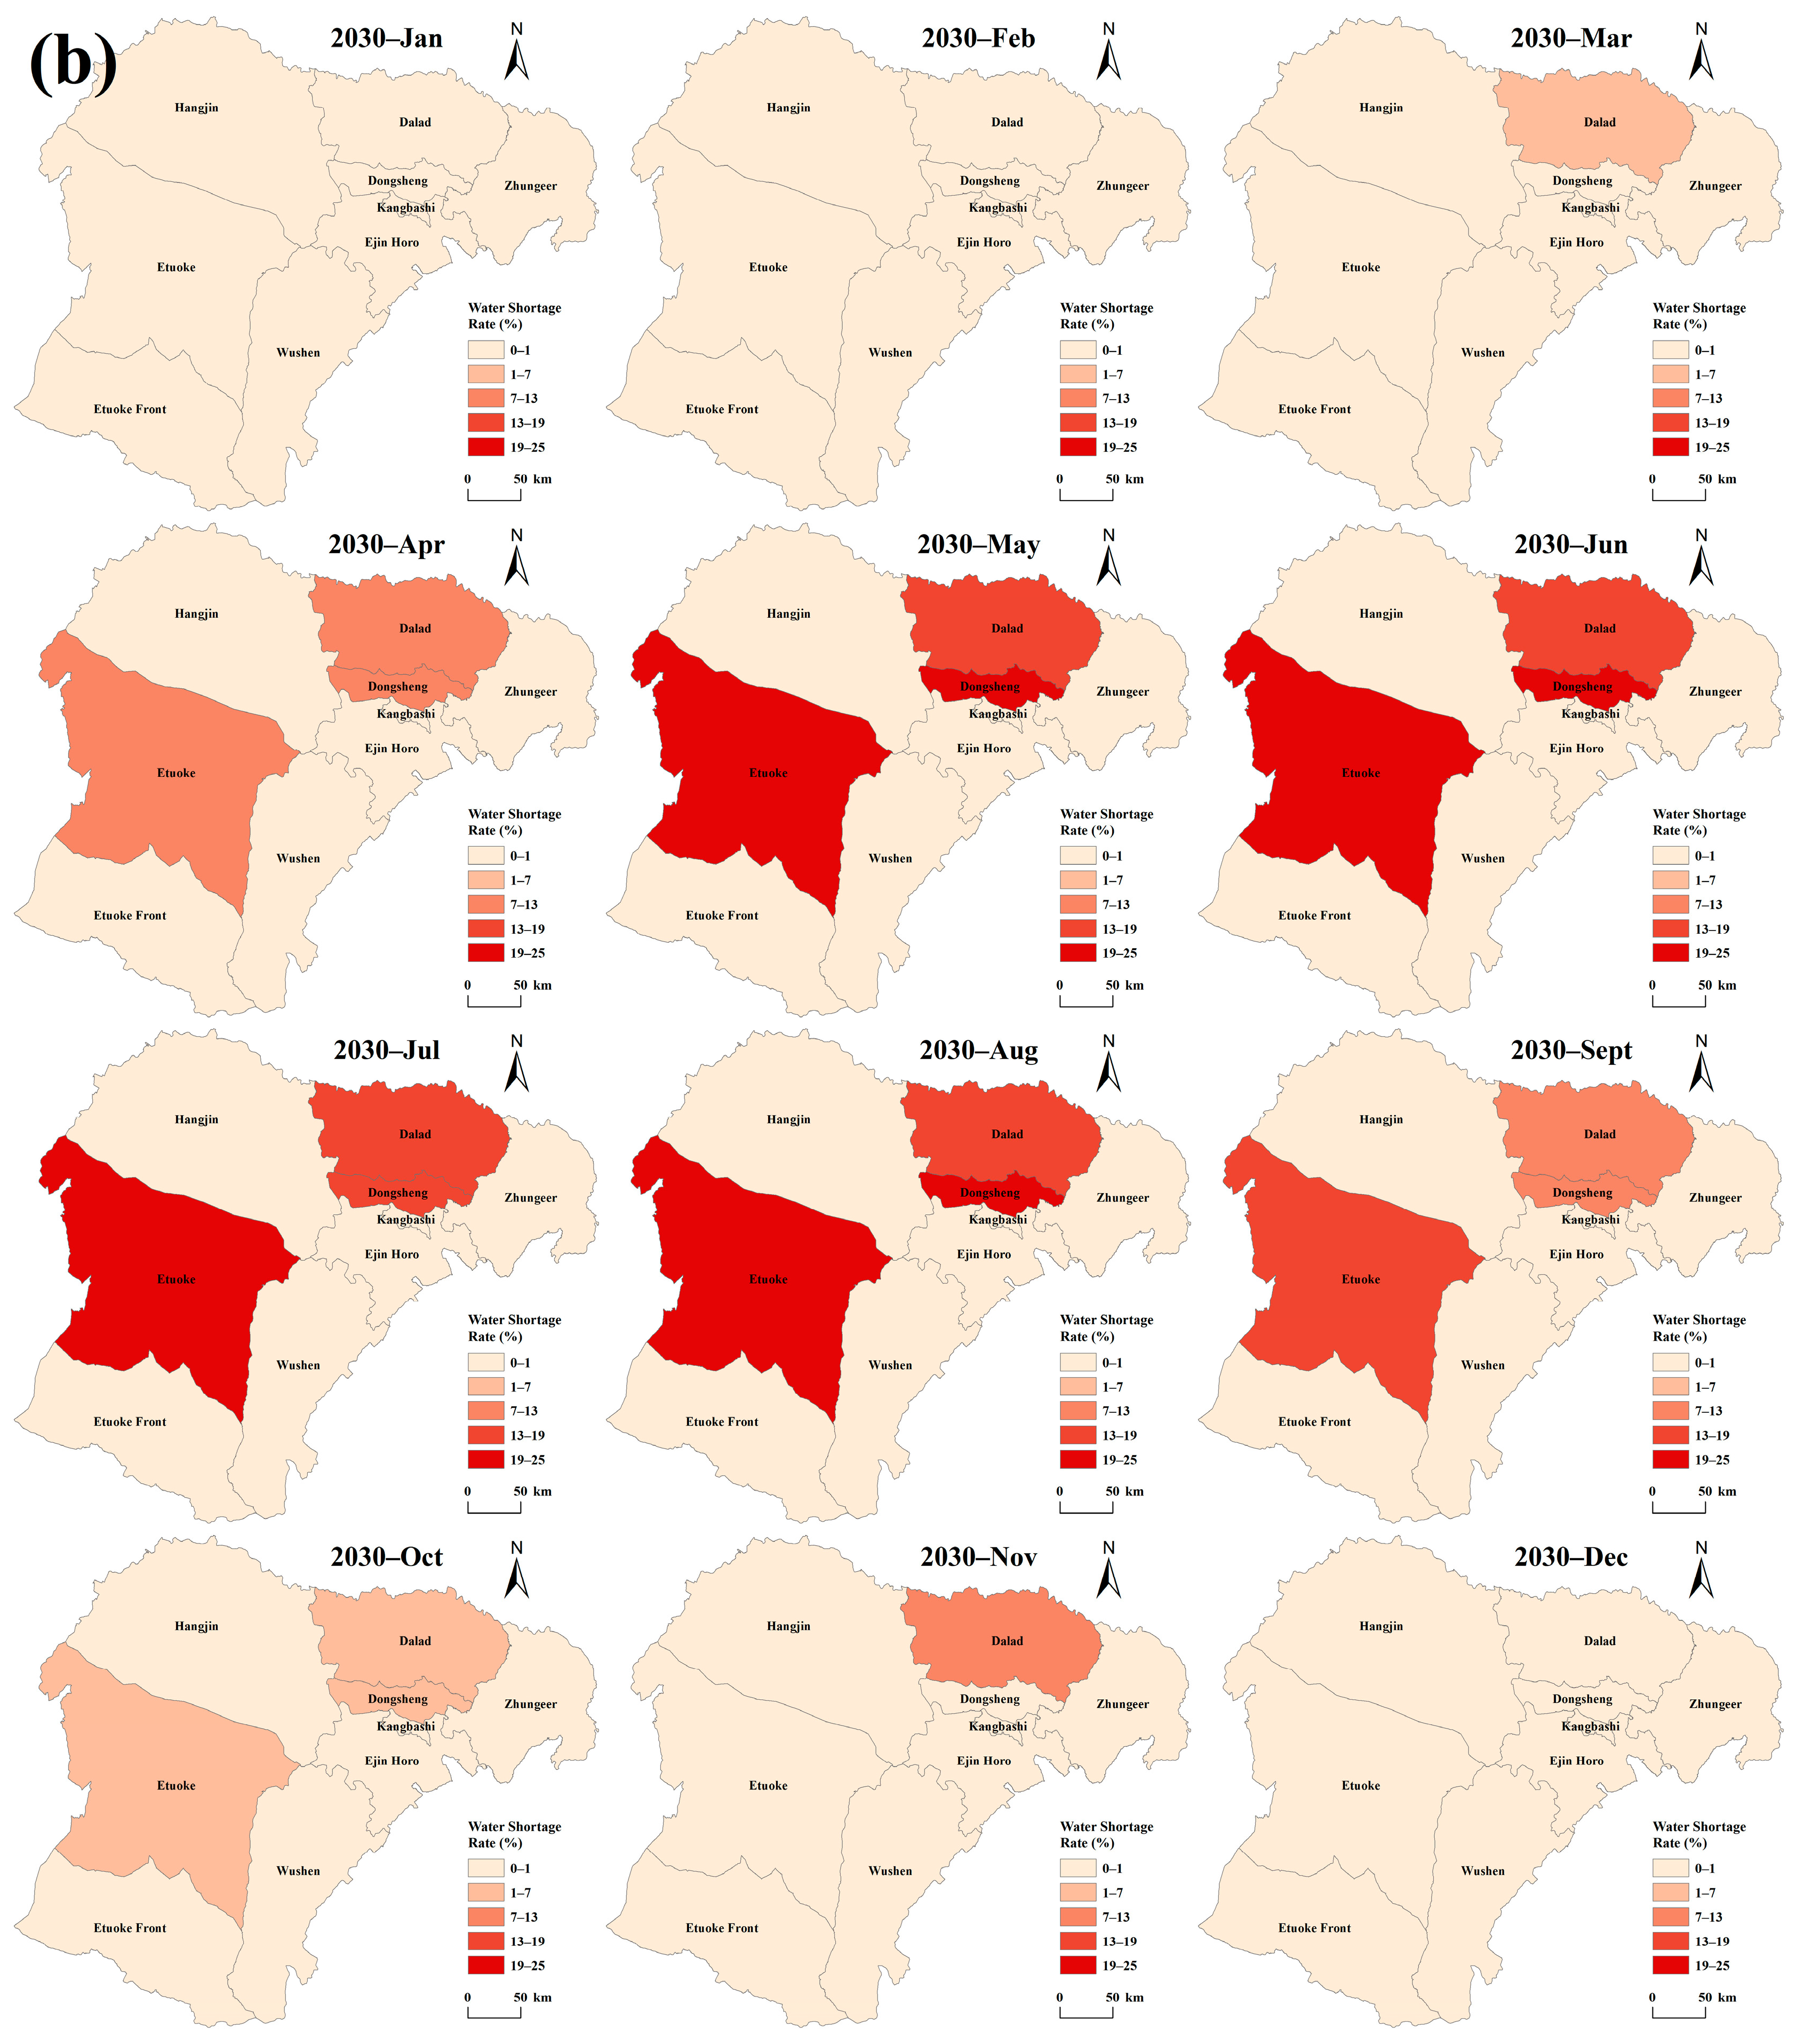
4.2. Analysis of Regional Water Shortage Rate

After optimizing water resource allocation, a detailed analysis was conducted of the water scarcity levels in each banner area for different planning years. Based on the annual spatial distribution (Figure 5), the overall water shortage rates for 2025 and 2030 are 5.46% and 5.67%, respectively. Most banner areas can meet their water demands, with unmet areas experiencing a water shortage rate below 20%, which indicated sustainable development in the region. In 2025, five banner areas, including Dongsheng District, Hangjin Banner, Wushen Banner, Dalad Banner, and Etuoke Banner, will face water shortages. In 2030, this number will decrease to three banner areas: Dongsheng District, Dalad Banner, and Etuoke Banner. This improvement suggests that the distribution of regional water resources can be planned effectively by increasing the efficiency and intensity of water resource utilization.
A further analysis based on geographical location was conducted to reveal the main reasons for water scarcity in the aforementioned five banner areas. Among them, the irrigation areas on the south bank of the Yellow River downstream of Hangjin Banner and Dalad Banner relied on gravity diversion irrigation or pumping water irrigation from the Yellow River. However, the inadequate construction standards for irrigation projects and insufficient supporting infrastructure result in an inadequate water supply for regional agricultural needs. In contrast, Dongsheng District, situated in a hilly and ravine area, experiences severe water and soil erosion. With no surface water supply for agriculture and minimal groundwater available for irrigation, water scarcity in the region is a significant issue. Wushen Banner, situated in the Mu Us Desert, is known for its traditional agriculture and animal husbandry. However, its heavy reliance on the Wuding River for surface water poses challenges for adequately meeting the needs of agriculture, forestry, animal husbandry, and fisheries throughout the entire banner. Adjacent to the western slope plateau area, the Etuoke Banner faces a limited runoff depth. Although the Yellow River entered the area through the Alatantu Gorge, its water was primarily designated for industrial purposes, and groundwater was insufficient to support agricultural water needs.
The monthly spatial distribution depicted in Figure 6 indicates that, by 2030, water scarcity in the Hangjin Banner and Wushen Banner will be completely alleviated, achieving a balance between water supply and demand each month. This improvement is attributed to the future water projects planned in these banners, which will augment their water supply, a unique advantage not shared by the other three banner areas. Despite enhancements in agricultural irrigation efficiency, the challenge of balancing rapid industrial development and population growth with water resources remains. Consequently, the water shortage rates in these three banner areas will exhibit varying degrees of increase from April to October in 2030 compared to 2025. Among them, Dalad Banner, with the highest agricultural water usage and slow industrial development, will experience only a modest increase in water shortage rates. Conversely, industrial water usage in the Etuoke Banner is projected to increase by nearly 40% from 2025 to 2030. This rapid industrial expansion will diminish the available water for agriculture, resulting in the largest increase in water shortage rates. During the same period in Dongsheng District, the dominant factor is the synergistic effect of population growth, leading to an increased demand for water resources.
From a monthly perspective, in 2025 and 2030, a relatively high water shortage rate can be seen in the region from May to September. This is primarily due to the peak in agricultural water demand for crop growth and development during these months, coupled with an insufficient water supply. During this period, Dongsheng District, Dalad Banner, and Etuoke Banner are expected to experience the most significant exacerbation of water shortages in 2030. In winter, the extraction of groundwater for crop irrigation is challenging, and reliance on surface water alone is insufficient to meet agricultural water demands, leading to some degree of water shortage in March and November. Notably, only Wushen Banner, Hangjin Banner, and Dalad Banner, which excessively rely on water diversion projects for irrigation, would experience water scarcity during this period.
In general, the water resources in Ordos City exhibited an uneven spatial and temporal distribution, declining from the southeast to northwest. The optimal allocation of water resources has enhanced joint regulation and control capabilities, thus alleviating the insufficient water resource endowment. This reflects the significant effect of the fairness objective in balancing water quantity among different banner areas [48]. In the future, the region should continue planning water conservancy projects and constructing a modern water resource allocation network engineering system.

4.3. Analysis of Industry Water Shortage Rate

Table 1 indicates that the domestic, industrial, and ecological water needs of each banner area can be met in different planning years, with only agriculture experiencing a water shortage. The coordination and optimization of water use for life, production, and ecology significantly reduced the impact of construction water on ecological water. The agricultural water shortage rates for 2025 and 2030 are 8.29% and 9.46%, respectively. A detailed analysis revealed varying causes of water shortages in the five banner areas. Dongsheng District, Etuoke Banner, and Wushen Banner are characterized by industrial development. Faced with limited water resources, priority is given to ensuring a domestic water supply, followed by efforts to meet ecological needs and industrial usage, leaving agricultural needs neglected. These three banner areas are distant from the Yellow River Diversion Project, which makes it challenging to coordinate the allocation of significant surface water resources. Therefore, they suffer from both structural and engineering water shortages. Dalad Banner and Hangjin Banner, despite their proximity to water sources, cannot fulfill the agricultural water demand due to the focus on balanced regional development. This structural water shortage resulted from an unreasonable industrial layout.
Comparing agricultural water shortages in different planning years revealed that despite the lower demand in 2030 compared to 2025, the shortage rate remains higher in 2030. This highlights the potential for agricultural water conservation and efficiency improvements to alleviate the water supply–demand imbalance. Areas facing severe shortages are the most challenging to address. Therefore, water resource management should prioritize efficient water conservation in agriculture. This could include optimizing crop structures, enhancing anti-seepage measures, and implementing water-saving projects in the irrigation canal systems. A comprehensive approach to promoting efficient and intensive water and soil resource management is crucial [49].

4.4. Analysis of Water Supply Structure

Figure 7a,b demonstrate a notable optimization effect in the regional water supply structure for 2025 and 2030. The proportion of groundwater supply decreased, whereas the proportions of surface and unconventional water increased. Specifically, the share of groundwater is expected to decline from 49% in 2025 to 43% in 2030, while that of surface water is projected to increase from 35% to nearly 39% during the same period. The overall proportion of unconventional water is shown to increase by approximately 3%. Additionally, the distribution of water supply among the banner areas is similar between 2025 and 2030 at a monthly scale. The water supply structures in January, February, March, and December remain consistent across most areas. However, except for the Dongsheng District and Kangbashi District, where groundwater is the primary source, the other seven banners are supplied through joint allocation from multiple water sources. From April to October, groundwater dominates the supply in each banner, leading to current extraction volumes near or exceeding the control indicators in some areas. To mitigate soil salinity, crops require irrigation during November. Surface water is predominantly used during this period to maintain a balanced relationship between autumn and spring irrigation.
A detailed analysis of each banner area’s water supply structure (Figure 8a,b) revealed that, with the exception of Kangbashi District, which lacked a dewatering water supply, most banners had a combination of surface water, groundwater, reclaimed water, and dredging water. Irrigation drainage was limited to the southern bank of the Yellow River in Dalad Banner and Hangjin Banner. Ejin Horo Banner, Zhungeer Banner, and Wushen Banner utilized a small amount of rainwater. Etuoke Front Banner and Wushen Banner had higher groundwater supply levels, exceeding 60%. Zhungeer Banner and Hangjin Banner had the lowest groundwater dependency, while other banners exhibited a more balanced mix of surface and groundwater sources. Dongsheng District and Kangbashi District exhibited the highest sewage reuse rates, with Ejin Horo Banner leading to dredging water utilization.
In the future, with the active promotion of water rights transfer transactions and the accelerated construction of unconventional water source utilization projects, the proportion of surface water and unconventional water supply in the region will gradually increase. This shift facilitates a deeper engagement of the region in groundwater protection. Through measures such as water conservation and source substitution, the comprehensive management of overexploited areas will be enhanced. Simultaneously, the dynamic monitoring and analysis of groundwater will be strengthened, and regulatory policies will be scientifically formulated and implemented to effectively reduce groundwater extraction [50]. Additionally, a water pricing mechanism reflecting water scarcity, the promotion of conservation, and optimal allocation should be established. These efforts could address water shortages, replenish water resources, and promote their protection and rational use.

4.5. Analysis of Water Structure

Figure 7c,d show the water usage structure of the region. Although agriculture has historically been the largest water consumer, future adjustments to the industrial structure, improved water conservation measures, and enhanced efficiency could lead to significant changes in the water use structure. The proportion of agricultural water use is projected to decrease from 65% by 2025 to 59% by 2030. Conversely, industrial water usage is expected to gradually increase to 28%, along with growing proportions for domestic and ecological purposes. The allocation of water to agriculture is shown to decrease, which will facilitate redistribution among various industries. This transfer leads to increased efficiency and security in water usage for industries, households, and other high-priority users. Simultaneously, the ecological water situation is projected to increase. At a monthly scale, domestic and industrial water is predominant in each banner area during January, February, and December, with similar proportions across these months. Agricultural water usage is concentrated between March and November. Ecological water is only found in the urban areas of each banner, with distribution occurring from May to October, constituting a relatively low proportion.
Figure 8c,d indicate that the proportion of water consumption across different industries remains consistent annually. Further analyses of each banner area’s water use structure were conducted, along with the proposed development suggestions. The Dalad Banner, Etuoke Front Banner, Hangjin Banner, and Wushen Banner were key agricultural and pastoral areas where water was primarily used for agriculture. Future strategies should focus on integrating and improving cultivated land resources to facilitate land reclamation for farming, thus enabling a three-dimensional circulation. Additionally, efforts should prioritize integrating crop cultivation with animal husbandry to promote the development of efficient and water-saving agriculture. The Zhungeer Banner, Etuoke Banner, and Ejin Horo Banner primarily utilized industrial water. In the future, it will be imperative to enhance production water management by actively promoting the construction of water-saving industrial parks and enterprises and implementing cascade water use and water recycling. Dongsheng District and Kangbashi District, characterized by a high population density and developed service industries, primarily utilize water for daily life. They should leverage their location advantages to focus on developing cultural tourism, commercial circulation, and other service industries to foster cluster-scale development.
An analysis of the regional water use structure revealed that agriculture exhibited both the highest water demand and the greatest water shortage rate. Therefore, maximizing water resource utilization is crucial [51]. Future efforts in the region should focus on enhancing the urban and rural safe water supply guarantee system, upgrading and expanding existing water sources, strategically planning new water sources, improving inter-banner water diversion capabilities, and facilitating cross-city water rights transfers to address urban water scarcity.

4.6. Analysis of Government Policy Impact

Government policies play a crucial role in optimizing the allocation of water resources, covering aspects such as management, utilization, development, and protection [52,53]. In terms of management, Ordos City has implemented strict regulations governing the extraction of surface water and groundwater, ensuring that their total allocation does not exceed prescribed limits. From a utilization perspective, the city has implemented efficient water conservation measures for agriculture, industry, and urban areas. Consequently, it is expected that the water resource utilization efficiency per user will exceed the levels of 2021 by 2025, and these levels will further increase by 2030. In terms of development, Ordos City has invested heavily in water infrastructure, especially in unconventional water sources. This strategic move has increased the supply of unconventional water sources, partially alleviating the city’s overall water supply shortage. From a protection perspective, the city has launched ecological and water source protection projects and implemented water price control policies. These measures ensure that the water quality needs of different users are met during allocation and effectively promote the sustainable utilization of water resources.
The results regarding optimizing water resource allocation will also influence policy direction [54]. This study can provide technical support to Ordos City in developing a scientific indicator system known as “four waters and four determinations”. By imposing rigid constraints on water resources as limiting conditions, this system can promote economic structural adjustments and optimize industrial structure layout. Consequently, it will drive the protection and efficient utilization of water resources, ensuring sustainable and high-quality development in the region.

5. Conclusions

With the goal of alleviating the contradiction between water supply and demand and achieving spatially balanced and coordinated development, this study constructed a multi-source, multi-user, and multi-objective water resource optimization allocation model for Ordos City based on the GWAS model. This study conducted a monthly water resource optimization allocation analysis of nine banner areas.
The results show that, in 2025, Ordos City’s total water demand is expected to be 1939.31 × 106 m3, with an optimized allocation of 1833.36 × 106 m3, as well as an overall water shortage rate of 5.46%. By 2030, the total water demand is projected to increase to 2081.47 × 106 m3, with an optimized allocation of 1963.44 × 106 m3, exhibiting an overall water shortage rate of 5.67%. Dalad Banner and Etuoke Banner have the highest water shortage rates, while Kangbashi District, Ejin Horo Banner, Etuoke Front Banner, and Zhungeer Banner consistently meet their water needs. Water shortages can occur from March to November and primarily occur from May to September.
All water-use sectors, except agriculture, were adequately allocated in different planning years. The regional agricultural water shortage rates in 2025 and 2030 were 8.30% and 9.47%, respectively. Agricultural water consistently accounted for the highest proportion in each planning year, attributed to imperfect water supply project construction and an unreasonable industrial structure layout. Future adjustments should focus on balancing agricultural water allocation with irrigation scale by modifying the planting structure.
The optimization of the regional water supply structure was evident, with groundwater decreasing from 49.08% in 2025 to 43.35% in 2030, while surface water and unconventional water proportions increased. This shift effectively mitigated the local groundwater overexploitation. Future efforts to promote the transfer of water rights and enhance the utilization of drained water, as well as sewage regeneration and reuse, will further reduce the groundwater supply. These initiatives can provide technical support for the sustainable development of Ordos City and for efficient water resource management.

Author Contributions

Conceptualization, Q.S., C.C. and L.Y.; methodology, Q.S., L.D. and Y.L.; software, Q.S. and X.S.; validation, Q.S. and X.S.; formal analysis, Q.S., L.D. and C.C.; investigation, R.H. and R.W.; resources, X.L. (Xiaoyan Lu), P.M. and X.L. (Xiaomin Liu); data curation, L.Y. and P.M.; writing—original draft preparation, Q.S.; writing—review and editing, Q.S., L.D. and Y.L.; visualization, C.C. and L.Y.; supervision, L.D.; project administration, Q.S., C.C. and L.Y.; funding acquisition, L.D. and Y.L. All authors have read and agreed to the published version of the manuscript.

Funding

This work was supported by the Major Science and Technology Projects of Inner Mongolia Autonomous Region (2022EEDSKJXM005), National Natural Science Foundation of China (the Yellow River Water Science Research Joint Fund U2243234), Natural Science Foundation of Inner Mongolia Autonomous Region of China (2022MS05055 and 2020JQ06), Ordos Science and Technology Major Project (ZD20232303), Inner Mongolia Autonomous Region Science and Technology Leading Talent Team (2022LJRC0007), and Inner Mongolia Agricultural University Basic Research Business Expenses Project (BR221012 and BR221204).

Data Availability Statement

The data presented in this study are available upon request from the corresponding author.

Acknowledgments

The authors would like to thank all the reviewers who participated in the review and the support from the Inner Mongolia Agricultural University.

Conflicts of Interest

The authors declare no conflicts of interest.

References

  1. Li, L.Q.; Jiang, E.H.; Liu, C.; Xu, C.Y. How does top-down water unified allocation and regulation decelerate water utilization? Insights from the Yellow River, China. J. Clean. Prod. 2024, 447, 141402. [Google Scholar] [CrossRef]
  2. Wei, J.X.; Lei, Y.L.; Liu, L.N.; Yao, H.J. Water scarcity risk through trade of the Yellow River Basin in China. Ecol. Indic. 2023, 154, 110893. [Google Scholar] [CrossRef]
  3. Wang, H.; Ma, T. Optimal water resource allocation considering virtual water trade in the Yellow River Basin. Sci. Rep. 2024, 14, 79. [Google Scholar] [CrossRef]
  4. Zhao, M.M.; Wang, S.M.; Chen, Y.P.; Wu, J.H.; Xue, L.G.; Fan, T.T. Pollution status of the Yellow River tributaries in middle and lower reaches. Sci. Total Environ. 2020, 722, 137861. [Google Scholar] [CrossRef] [PubMed]
  5. Niu, C.; Chang, J.X.; Wang, Y.M.; Shi, X.G.; Wang, X.B.; Guo, A.J.; Jin, W.T.; Zhou, S. A water resource equilibrium regulation model under water resource utilization conflict: A case study in the Yellow River Basin. Water Resour. Res. 2022, 58, e2021WR030779. [Google Scholar] [CrossRef]
  6. Niu, C.; Wang, X.B.; Chang, J.X.; Wang, Y.M.; Guo, A.J.; Ye, X.M.; Wang, Q.W.; Li, Z.H. Integrated model for optimal scheduling and allocation of water resources considering fairness and efficiency: A case study of the Yellow River Basin. J. Hydrol. 2023, 626, 130236. [Google Scholar] [CrossRef]
  7. Ye, Q.L.; Li, Y.; Zhou, L.; Zhang, W.L.; Xiong, W.; Wang, C.T.; Wang, P.F. Optimal allocation of physical water resources integrated with virtual water trade in water scarce regions: A case study for Beijing, China. Water Res. 2018, 129, 264–276. [Google Scholar] [CrossRef]
  8. Zeng, Y.J.; Liu, D.D.; Guo, S.L.; Xiong, L.H.; Liu, P.; Chen, J.; Chen, H.; Yin, J.B.; Wu, Z.H.; Wan, Z. Assessment of the impacts of water resources allocation on the reliability, resilience and vulnerability of the water-energy-food-society (WEFS) nexus system. Argic. Water Manag. 2024, 295, 108780. [Google Scholar] [CrossRef]
  9. Wei, F.L.; Zhang, X.; Xu, J.; Bing, J.P.; Pan, G.Y. Simulation of water resource allocation for sustainable urban development: An integrated optimization approach. J. Clean. Prod. 2020, 273, 122537. [Google Scholar] [CrossRef]
  10. Feng, J.H. Optimal allocation of regional water resources based on multi-objective dynamic equilibrium strategy. Appl. Math. Model. 2021, 90, 1183–1203. [Google Scholar] [CrossRef]
  11. Cervellera, C.; Chen, V.C.P.; Wen, A. Optimization of a large-scale water reservoir network by stochastic dynamic programming with efficient state space discretization. Eur. J. Oper. Res. 2006, 171, 1139–1151. [Google Scholar] [CrossRef]
  12. Devi, S.; Srivastava, D.K.; Mohan, C. Optimal water allocation for the transboundary Subernarekha River, India. J. Water Resour. Plan. Manag. 2005, 131, 253–269. [Google Scholar] [CrossRef]
  13. Zhao, J.S.; Wang, Z.J.; Weng, W.B. Theory and model of water resources complex adaptive allocation system. J. Geogr. Sci. 2003, 13, 112–122. [Google Scholar] [CrossRef]
  14. He, Y.R.; Tu, Y.; Liu, J.; Shi, H.W.; Lev, B. Quartet trade-off for regional water resources allocation optimization with multiple water sources: A decentralized bi-level multi-objective model under hybrid uncertainty. J. Hydrol. 2023, 619, 129341. [Google Scholar] [CrossRef]
  15. Nguyen, D.C.H.; Dandy, G.C.; Maier, H.R.; Ascough, J. Improved ant colony optimization for optimal crop and irrigation water allocation by incorporating domain knowledge. J. Water Resour. Plan. Manag. 2016, 142, 04016025. [Google Scholar] [CrossRef]
  16. Qi, S.Q.; Wan, L.H.; Fu, B.L. Multisource and multiuser water resources allocation based on genetic algorithm. J. Supercomput. 2018, 76, 3222–3230. [Google Scholar] [CrossRef]
  17. Cai, Y.P.; Li, T.; Zhang, Y.; Zhang, X.D. A simulation-optimization approach for supporting conservative water allocation under uncertainties. J. Environ. Manag. 2022, 315, 115073. [Google Scholar] [CrossRef] [PubMed]
  18. Liu, D.; Huang, Q.; Yang, Y.Y.; Liu, D.F.; Wei, X.T. Bi-objective algorithm based on NSGA-II framework to optimize reservoirs operation. J. Hydrol. 2020, 585, 124830. [Google Scholar] [CrossRef]
  19. Ma, H.P.; Zhang, Y.J.; Sun, S.Y.; Liu, T.; Shan, Y. A comprehensive survey on NSGA-II for multi-objective optimization and applications. Artif. Intell. Rev. 2023, 56, 15217–15270. [Google Scholar] [CrossRef]
  20. Tra, V.T.; Thinh, X.N.; Greiving, S. Combined top-down and bottom-up climate change impact assessment for the hydrological system in the Vu Gia-Thu Bon River Basin. Sci. Total Environ. 2018, 630, 718–727. [Google Scholar] [CrossRef]
  21. Abdi, D.A.; Ayenew, T. Evaluation of the WEAP model in simulating subbasin hydrology in the Central Rift Valley basin, Ethiopia. Ecol. Process. 2021, 10, 41. [Google Scholar] [CrossRef]
  22. Paparrizos, S.; Maris, F.P. Hydrological simulation of Sperchios River Basin in Central Greece using the MIKE SHE model and geographic information systems. Appl. Water Sci. 2017, 7, 591–599. [Google Scholar] [CrossRef]
  23. Rousta, B.A.; Araghinejad, S. Development of a multi criteria decision making tool for a water resources decision support system. Water Resour. Manag. 2015, 29, 5713–5727. [Google Scholar] [CrossRef]
  24. Zhang, S.H.; Fan, W.W.; Yi, Y.J.; Zhao, Y.; Liu, J.H. Evaluation method for regional water cycle health based on nature-society water cycle theory. J. Hydrol. 2017, 551, 352–364. [Google Scholar] [CrossRef]
  25. Sang, X.F.; Wang, H.; Wang, J.H.; Zhao, Y.; Zhou, Z.H. Water resources comprehensive allocation and simulation model (WAS), part I: Theory and development. J. Hydraul. Eng. 2018, 49, 1259–1451. (In Chinese) [Google Scholar]
  26. Sang, X.F.; Zhao, Y.; Zhai, Z.L.; Chang, H.Y. Water resources comprehensive allocation and simulation model (WAS), part II: Application. J. Hydraul. Eng. 2019, 50, 201–208. (In Chinese) [Google Scholar]
  27. Luan, Q.H.; Gao, H.Y.; Liu, H.L.; He, L.X.; Ma, J.; Wang, C.S. Optimal allocation of water resources in Wu’an County based on GWAS model. Water Resour. Prot. 2022, 39, 32–42. (In Chinese) [Google Scholar]
  28. Ma, J.; Liu, H.L.; Wu, W.F.; Zhang, Y.Q.; Dong, S. Research on optimal allocation of water resources in Handan City based on the refined water resource allocation model. Water 2023, 15, 154. [Google Scholar] [CrossRef]
  29. Huang, R.R.; Ni, H.Z.; Chen, G.F.; Du, L.J.; Zhou, Y.P. Refined allocation of water resources in Pishihang Irrigation Area by joint utilization of multiple water sources. Sustainability 2022, 14, 13343. [Google Scholar] [CrossRef]
  30. Yan, Z.Q.; Zhou, Z.H.; Sang, X.F.; Wang, H. Water replenishment for ecological flow with an improved water resources allocation model. Sci. Total Environ. 2018, 643, 1152–1165. [Google Scholar] [CrossRef]
  31. Yan, Z.Q.; Zhou, Z.H.; Liu, J.J.; Wen, T.F.; Sang, X.F.; Zhang, F.P. Multi objective optimal operation of reservoirs based on water supply, power generation, and river ecosystem with a new water resource allocation model. J. Water Resour. Plan. Manag. 2020, 146, 05020024. [Google Scholar] [CrossRef]
  32. Matrosov, E.S.; Harou, J.J.; Loucks, D.P. A computationally efficient open-source water resource system simulator-Application to London and the Thames Basin. Environ. Model. Softw. 2011, 26, 1599–1610. [Google Scholar] [CrossRef]
  33. Sivapalan, M.; Blöschl, G. Time scale interactions and the coevolution of humans and water. Water Resour. Res. 2015, 51, 6988–7022. [Google Scholar] [CrossRef]
  34. Janjua, S.; Hassan, I.; Ali, M.U.; Ibrahim, M.M.; Zafar, A.; Kim, S. Addressing social inequality and improper water distribution in cities: A case study of Karachi, Pakistan. Land 2021, 10, 1278. [Google Scholar] [CrossRef]
  35. Cheng, C.; Gao, D.; Zhang, H.; Xu, Z.P.; Huang, J.G. Superstructure optimization models for regional coal industry development considering water resources constraints-A case study of Ordos, China. Comput. Chem. Eng. 2023, 178, 108384. [Google Scholar] [CrossRef]
  36. Liu, J.Y.; Qin, K.Y.; Zhen, L.; Xiao, Y.; Xie, G.D. How to allocate interbasin water resources? A method based on water flow in water-deficient areas. Environ. Dev. 2020, 34, 100460. [Google Scholar] [CrossRef]
  37. Mekonnen, M.M.; Hoekstra, A.Y. Four billion people facing severe water scarcity. Sci. Adv. 2016, 2, e1500323. [Google Scholar] [CrossRef] [PubMed]
  38. Zhou, L.M.; Xie, X.H.; Wu, S.Q. Use of the life cycle methodology to calculate energy consumption of urban water cycle: A case study of Ordos City. Water 2020, 12, 2393. [Google Scholar] [CrossRef]
  39. Yan, J.C. Research on the Carrying Capacity and Optimal Allocation of Water Resources in Ordos City. Master’s Thesis, China University of Geosciences, Beijing, China, 2021. (In Chinese). [Google Scholar]
  40. Wang, H.; Wang, W.J.; Cui, Z.H.; Zhou, X.Y.; Zhao, J.; Li, Y. A new dynamic firefly algorithm for demand estimation of water resources. Inf. Sci. 2018, 438, 95–106. [Google Scholar] [CrossRef]
  41. Inner Mongolia Autonomous Region Market Supervision Administration. Inner Mongolia Autonomous Region’s Local Standard "Industry Water Use Quota" (DB15/T385-2020); Inner Mongolia Autonomous Region Market Supervision Administration: Hohhot, China, 2020; pp. 5–44. (In Chinese) [Google Scholar]
  42. Cheng, D.L. Comprehensive Evaluation and Sustainable Utilization Analysis of Water Resources Carrying Capacity in Ordos City. Master’s Thesis, Northwest A & F University, Yangling, China, 2022. (In Chinese). [Google Scholar]
  43. Zhang, W.D. Research on Optimal Allocation of Urban Water Resources in Arid Areas. Master’s Thesis, Hebei Engineering University, Handan, China, 2021. (In Chinese). [Google Scholar]
  44. Luo, Y.; Sha, J.X.; Liu, B.; Zhang, Y.Q.; Yang, J. Optimal allocation of water resources based on GWAS model in Handan, China. Water 2023, 15, 1090. [Google Scholar] [CrossRef]
  45. Zheng, Y.; Sang, X.F.; Liu, Z.W.; Zhang, S.Q.; Liu, P. Water allocation management under scarcity: A bankruptcy approach. Water Resour. Manag. 2022, 36, 2891–2912. [Google Scholar] [CrossRef]
  46. Chang, H.Y.; Sang, X.F.; He, G.H.; Wang, Q.M.; Chang, J.X.; Liu, R.; Li, H.H.; Zhao, Y. A socio-hydrological unit division and confluence relationship generation method for human-water systems. Water 2022, 14, 2074. [Google Scholar] [CrossRef]
  47. Zheng, F.F.; Simpson, A.R.; Zecchin, A.C. A decomposition and multistage optimization approach applied to the optimization of water distribution systems with multiple supply sources. Water Resour. Res. 2013, 49, 380–399. [Google Scholar] [CrossRef]
  48. Xu, J.P.; Lv, C.L.; Yao, L.M.; Hou, S.H. Intergenerational equity based optimal water allocation for sustainable development: A case study on the upper reaches of Minjiang River, China. J. Hydrol. 2018, 568, 835–848. [Google Scholar] [CrossRef]
  49. Xu, H.; Yang, R. Does agricultural water conservation policy necessarily reduce agricultural water extraction? Evidence from China. Argic. Water Manag. 2022, 274, 107987. [Google Scholar] [CrossRef]
  50. Wang, K.R.; Chen, H.W.; Fu, S.D.; Li, F.L.; Wu, Z.; Xu, D.D. Analysis of exploitation control in typical groundwater over-exploited area in North China Plain. Hydrol. Sci. J. 2021, 66, 851–861. [Google Scholar] [CrossRef]
  51. He, C.Y.; Liu, Z.F.; Wu, J.G.; Pan, X.H.; Fang, Z.H.; Li, J.W.; Bryan, B.A. Future global urban water scarcity and potential solutions. Nat Commun. 2021, 12, 4667. [Google Scholar] [CrossRef] [PubMed]
  52. Makanda, K.; Nzama, S.; Kanyerere, T. Assessing the role of water resources protection practice for sustainable water resources management: A review. Water 2022, 14, 3153. [Google Scholar] [CrossRef]
  53. Luo, P.; Sun, Y.; Wang, S.; Wang, S.; Lyu, J.; Zhou, M.; Nakagami, K.; Takara, K.; Nover, D. Historical assessment and future sustainability challenges of Egyptian water resources management. J. Clean. Prod. 2020, 263, 121154. [Google Scholar] [CrossRef]
  54. Yang, T.; Zhu, Y.; Li, Y.; Zhou, B. Achieving win-win policy outcomes for water resource management and economic development: The experience of Chinese cities. Sustain. Prod. Consum. 2021, 27, 873–888. [Google Scholar] [CrossRef]
Figure 1. Overview of the study area.
Water 16 01711 g001
Figure 2. Water demand forecast in (a) 2025 and (b) 2030; water supply forecast in (c) 2025 and (d) 2030.
Water 16 01711 g002
Figure 3. Water resource utilization and conversion relationship networks in Ordos City.
Water 16 01711 g003
Figure 4. Water supply–demand relationships of the water source–industry–banner area in (a) 2025 and (b) 2030.
Water 16 01711 g004
Figure 5. Regional water shortage rates in (a) 2025 and (b) 2030.
Water 16 01711 g005
Figure 6. Regional water shortage rates from January to December in (a) 2025 and (b) 2030.
Water 16 01711 g006aWater 16 01711 g006b
Figure 7. Proportion of water supply sources in (a) 2025 and (b) 2030; proportion of water consumption by users in (c) 2025 and (d) 2030.
Water 16 01711 g007
Figure 8. Water supply structure in (a) 2025 and (b) 2030; water consumption structure in (c) 2025 and (d) 2030.
Water 16 01711 g008
Table 1. Industrial water shortage rates in 2025 and 2030.
YearIndustryCity LifeRural LifeIndustryAgricultureEcologyTotal
2025Water Demand (106 m3)112.9115.17445.021276.8389.381939.31
Configure Water Quantity (106 m3)112.9115.17445.021170.8889.381833.36
Water Shortage Rate (%)0008.2905.46
2030Water Demand (106 m3)131.5414.46596.691246.3792.412081.47
Configure Water Quantity (106 m3)131.5414.46596.691128.3492.411963.44
Water Shortage Rate (%)0009.4605.67
Disclaimer/Publisher’s Note: The statements, opinions and data contained in all publications are solely those of the individual author(s) and contributor(s) and not of MDPI and/or the editor(s). MDPI and/or the editor(s) disclaim responsibility for any injury to people or property resulting from any ideas, methods, instructions or products referred to in the content.

