Article

Water Footprint and Water Sustainability of Agroindustrial Avocado Production in a Warm Tropical Climate Municipality: A Case Study in the Michoacan Avocado Belt in Central México

by
Diana J. Fuerte-Velázquez
1 and
Alberto Gómez-Tagle
2,*
1
Postdoctoral Researcher CONAHCYT, Natural Resources Institute (INIRENA), Universidad Michoacana de San Nicolas de Hidalgo, Morelia 58330, Mexico
2
Ecohydrology and Soil Laboratory, Natural Resources Institute (INIRENA), Universidad Michoacana de San Nicolas de Hidalgo, Morelia 58330, Mexico
*
Author to whom correspondence should be addressed.
Water 2024, 16(12), 1719; https://doi.org/10.3390/w16121719
Submission received: 16 May 2024 / Revised: 2 June 2024 / Accepted: 6 June 2024 / Published: 17 June 2024
(This article belongs to the Special Issue Studies on Water Resource and Environmental Policies)

Abstract

:
Water is a fundamental resource for ecosystems, humans, and the development of all economic sectors; it is necessary to identify and evaluate its environmental pressures and impacts. The water footprint (WF) is an appropriate indicator for the consumption of water used to produce a product. The present study uses this tool to evaluate the green and blue water requirements and the sustainability of irrigation water use for agroindustrial avocado production in Ziracuaretiro, Michoacán (2012–2021). Our analysis was based on aggregating weather and soil data at the municipal level and official government databases of avocado cultivated surface, fruit production, and water rights concessions. The analysis considers the homogeneity of information throughout the study area. We estimated that rainfed plantations require 839.03 m3/ton, and irrigated plantations require 2355.80 m3/ton, with an average of 1597.47 m3/ton. In addition, we determined that avocado cultivation can demand up to 124.3% of agricultural water concessions in this municipality. Moreover, the WF estimates and the analysis indicate that such studies are fundamental for decision-makers to develop and implement water use efficiency strategies and shows the need for further research related to the water consumption of avocado as a crop at more detailed scales.

1. Introduction

Avocado is a tropical fruit from Central America that indigenous populations have consumed for at least 10,000 years [1]. The word avocado has its etymology in the Aztec language word ahuacatl, meaning testicle, and is related to this fruit’s particular shape [2]. In recent decades, the international demand for this fruit has increased, and it is considered a superfood and, therefore, widely recommended for a healthy lifestyle [3]. The ongoing international demand has caused an increase in the planted surface of this fruit in regions with adequate conditions for its development. In many cases, the expansion of the planted area has been linked to deforestation and land use change processes in different countries, mainly in Latin America [4]. Mexico is the leading country in producing, consuming, and exporting this fruit, with nearly 30% of the global production and around 45% of the global export volume [5]. A flourishing avocado agroindustry in Michoacan state (central west Mexico) generates nearly USD 2400 million in annual income, and the United States market is nowadays the largest market and importer of this fruit. Due to its proximity, Mexico is its main provider, and eight out of ten avocados consumed in the US come from Mexico. However, the expansion of this fruit crop has generated social, environmental, and political backfire situations [5,6]. On 12 February 2024, a group of US senators issued a request letter to the current US federal administration to work with Mexican authorities in order to regulate the avocado industry and prevent avocados from illegal deforestation from being marketed in the US [7]. The senator’s request letter cited the NGO Climate Rights International report “Mexico: Avocados for Export Fueling Deforestation and Abuse” [8] and the New York Times article “Americans Love Avocados. It’s Killing Mexico’s Forests” [9], which points out that agroindustrial avocado production in Mexico is linked to the loss of forests and the depletion of water resources. Furthermore, on 26 February 2024 the US ambassador to Mexico (Ken Salazar) visited Michoacan state and declared that Mexican avocados grown illegally should not be exported to the US [10].
Recent research indicates that the agroindustrial production of avocados in the past decades has been related to the increase in violence linked to organized crime cartels that infiltrated the avocado business due to its high profitability. This situation has led to this fruit being currently named the “blood diamonds of Mexico”, and recent estimates indicate that nearly 5% of the avocado agroindustry in Mexico, mainly in Michoacan and Jalisco states, are controlled by organized crime cartels and used, among other things, for money laundering [3,11,12]. Further, recent studies in the main avocado-producing region in the world report forest loss, several impacts on biodiversity, soil degradation, and water pollution, as well as illegal water appropriation [6,13,14,15].
Illegal water appropriation has led to social discontent and protests, and during the 2024 dry season (April 2024), local farmers, indigenous peasants, and environmentalists dismantled several illegally established water containment ponds that served as water reservoirs for avocado plantations in rural locations in Villa Madero and Zirahuen, in Michoacan, opposing water shortage in rural communities and its large impact on the environment [16].
On a global scale, agriculture production is considered the leading water consumption sector [17]. Estimates indicate that nearly 70% of world freshwater use is directly linked to agricultural activities [18]. Several studies also indicate that the ongoing global water scarcity and access crisis can be a systemic risk, fueled by climate change and weather pattern modification [19,20]. However, as of 2024, the water crisis has reached a critical point in the avocado-producing region in Mexico.
The ongoing situation makes it necessary to evaluate the sustainability of water use in the agricultural sector and agroindustrial avocado production from an academic and sound technical perspective. To do so, several methods have been proposed, like ISO 14046:2014 [21], which considers the Life Cycle Analysis method to quantify environmental impacts from the beginning of the process flow to the end [22,23]. Another method is described by Deurer et al. [24], which considers the evaluation of water based on the net water balance, considering the inputs and outputs of water [23]; however, water footprint is among the most widely used and accepted indicators [25].
The water footprint is an environmental impact indicator introduced in 2002 by Hoekstra [25]. The WF is defined as the volume of freshwater used to produce a product [25,26]. This indicator comprises three components: green, blue, and gray water footprints; the green WF corresponds to the rainfall absorbed by the soil in the unsaturated zone and consumed by vegetation in order to generate biomass [27]. The blue WF is the volume of fresh water extracted from a surface or underground source to produce goods. In the case of agricultural products, it includes irrigation water, whatever the source [28]. The gray WF is the freshwater required to assimilate the pollutant load given the natural base concentrations and environmental quality standards [25,27,29,30].
Water footprint studies in the agricultural sector have increased rapidly, and the method has allowed the quantification of the global average water consumption of various fruits, cereals, vegetables, and derivatives. The most relevant study in this is that of Mekonnen and Hoekstra [31], where they estimated the water requirement of more than 126 crops, including corn 1222 m3/ton, wheat 1827 m3/ton, orange 560 m3/ton, and avocado 1981 m3/ton.
The present contribution focuses on analyzing the water footprint and evaluating the sustainability of water use in agroindustrial avocado production in one avocado-producing municipality in the state of Michoacán in western central Mexico, Ziracuaretiro.
To carry out the sustainability of water use analysis, we incorporated the Russo et al. perspective [32], in which the sustainability of water use is the satisfaction of current water demands for all users without harming future supply while contributing to the objectives of society and the maintenance of the environment [32]. In such a way, the sustainability of irrigation water (SUIW) use in a particular region is determined by the relationship between the agricultural blue WF of a crop and the availability of water in that region.
Consequently, water sustainability and the WF allow quantitative evaluations of the water resource in terms of current resources and potential demands that may affect availability over time [32].
To carry out this analysis, we considered weather variables, soil characteristics, crop characteristics, crop yield, production, and availability of water aggregated at a municipal level. [We therefore assumed that the entire municipality studied has uniform characteristics. These considerations have already been used in other studies, such as De Miguel et al. [33] and Gómez-Tagle et al. [15]. It is essential to clarify that the WF results of this study represent an approximation of water consumption [34]; in this situation, the challenge is to expand the WF studies to the orchard or single plantation scale and contrast the results with those generated at the municipal scale. Even though we recognize limitations due to the level of data aggregation, the study represents an opportunity to guide water policy-making in a region with the largest contribution to the avocado agroindustry and international markets.

2. Materials and Methods
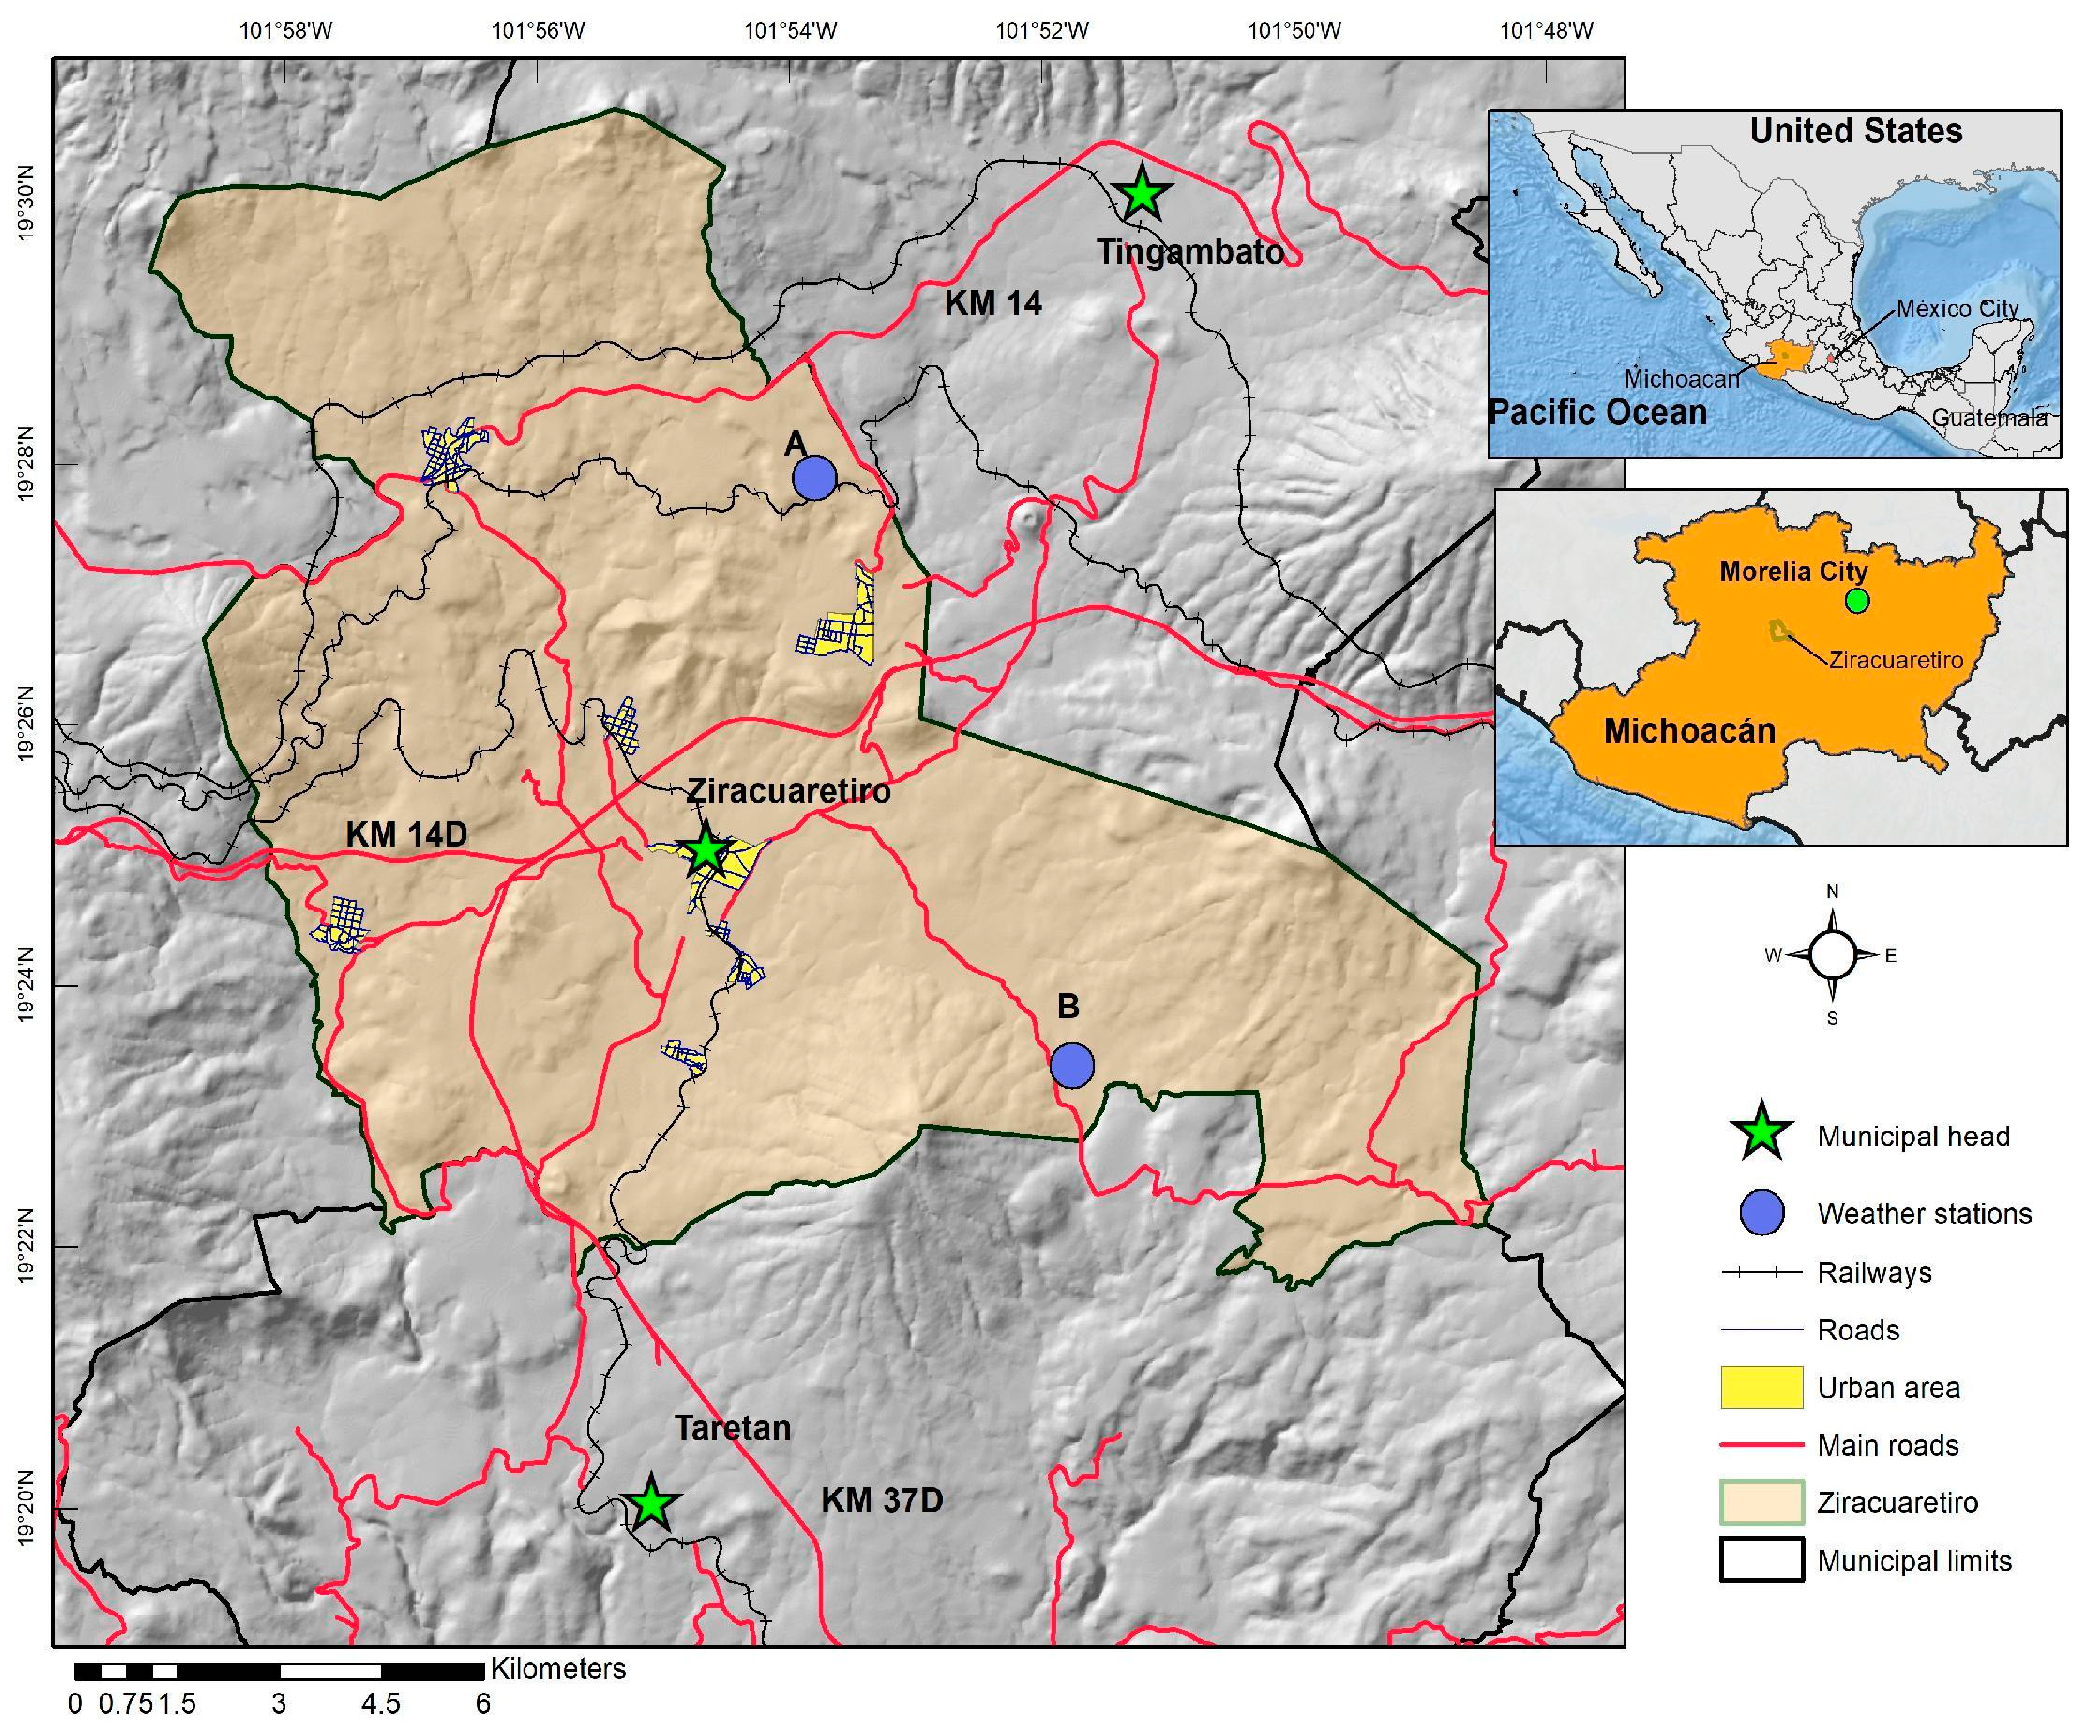
2.1. Study Area

The municipality of Ziracuaretiro is located in the center of the state of Michoacan in the hydrological region of the Balsas River, in central Mexico, between the coordinates 19°21′ and 19°31′ N and 101°48′ and 102°00′ W (Figure 1), with an area of 15,995 ha [35]. It includes altitudes ranging from 1200 to 2400 m.a.s.l.
In this municipality, avocado production records date back to 2003 [36]. Back then, this crop covered 1428 ha, and by 2021, its planted surface reached 5225 ha (32% of the municipality’s surface), representing a 366% net crop surface growth in 18 years [36].

Climatic Conditions of the Municipality of Ziracuaretiro

The municipality of Ziracuaretiro is located in the region known as the Michoacan Avocado Belt (MAB), which comprises a group of municipalities and represents an area of ecological uniformity in terms of temperature, precipitation, biogeography, types of vegetation, soil groups, and terrain [37]. These conditions facilitate avocado cultivation under optimal conditions and position this region as the largest in the world in avocado production. In this region, according to the Köppen climatic classification adapted to Mexico by Garcia [38], in Ziracuaretiro, there are three climate groups and four subgroups [39] (Figure 2). The description of each one is given in Table 1.
The climate group with the largest extension in the municipality is the subtropical one, which covers 79.18% (12,667.38 ha). In this climate group, the most significant proportion of avocado plantations, 92.58% (4834 ha), is concentrated, according to Morales-Manilla et al. [40]. The tropical climate group covers 12.19% of the municipality (1950.21 ha). And it has less than four percent (3.77%, 196.8 ha) of the municipality’s avocado plantation surface. At higher elevations and under a temperate climate covering 8.6% (1379.75 ha) of the municipality, only 3.66% (191.1 ha) of the avocado plantations are found. Therefore, for this investigation, we assumed homogeneous climate conditions throughout the municipality according to climate group presence (Table 1).
Figure 2. Climate groups in the municipality of Ziracuaretiro. Cartographical data source [41]. (A) The Packing and Exporting Association of Avocado Producers of Mexico (APEAM) weather station and (B) the private owner (Vizcaino family plantation) weather station.
Water 16 01719 g002
Table 1. Climate group and subgroups and their characteristics in the municipality of Ziracuaretiro. Source: [41].
GroupSubgroupMAT
(°C)
Tmin (°C)Tmax
(°C)
MAP
(mm)
SubtropicalHumid subtropical
Semi-humid subtropical
>1815271000
TropicalSemi-humid tropical>2215301000
TemperateHumid temperate−1812241200
Notes: Mean annual temperature (MAT), minimum temperature (Tmin), maximum temperature (Tmax), and mean annual precipitation (MAP).
According to information from INEGI [42], in the subtropical climate in the municipality, the mean annual temperature is over 18 °C. In contrast, the minimum temperature is 15 °C, the monthly maximum reaches 27 °C, and the mean annual precipitation is 1000 mm. However, for tropical climate conditions, the mean annual temperature is higher than 22 °C, while the minimum temperature is 15 °C, the maximum reaches up to 30 °C, and the mean annual precipitation is 1000 mm. In the temperate climate area, the mean annual temperature ranges between 12 °C and 18 °C, the minimum temperature is 12 °C, and the maximum is 24 °C, with a mean annual precipitation of 1200 mm (Table 1).

2.2. Water Consumption Analysis by the Water Footprint Method

To determine the amount of water required by avocado as a crop in the studied municipality, we followed the water footprint methodology developed by Hoekstra et al. [25] and recommended by the Water Footprint Network [43]. This method is based on the crop water requirement (CWR) perspective, which determines the amount of water that is incorporated into the crop through rainfall (green WF) and the irrigation demand that is added (blue WF component) to fulfill the total crop requirement [26].

2.2.1. Estimation of Crop Water Requirement (CWR)

According to Ewaid et al. [44], the CWR is the volume of water that a crop needs to perform its metabolic functions and grow optimally. The authors state that this will vary spatially and temporally depending on the crop type. In this sense, the CWR will be equal to the evapotranspiration of the crop (ETc) expressed in (mm) per unit of time [45]. For its calculation, we multiplied the study area’s reference evapotranspiration (ETo) by the crop coefficients (Kc) at different stages of the crop production cycle. The Kc values used for avocado were 0.60 Kc for the initial phase (from anthesis to end of flowering; 90 days), 0.85 Kc for the middle phase (from the end of flowering to the end of fruit filling; 215 days), and 0.75 Kc for the final phase (maturation and harvesting; 60 days), according to the FAO 56 manual ([45], Table 12, p. 113). ETo was estimated using the Penman–Monteith equation, considering the atmospheric and physiological factors (stomatal resistance) governing direct soil evaporation and vegetation transpiration processes. In this case, we assumed the occurrence of ideal conditions for the crop. The former assumption means that there is no water, pest, or nutrient-related stress that could restrain the development of the crop [45,46].
C W R c p = E T c p
C W R c p = E T o p x K c
where the C W R c p is the water requirement of a crop c in a region p (mm/day); la E T o p is the potential or reference evapotranspiration in a region p (mm/day); and K c is the coefficient of a crop c, which describes the variations in the amount of water that plants extract from the soil as they grow.

2.2.2. Determination of Green and Blue Water Requirement

The green water requirement for a crop ( C W R g r e e n c p ) represents the total rainwater evaporated from the field during the growth period; in the CROPWAT v 8.0 software, it is called effective precipitation (peff) [47]. The method applied to calculate the peff was the USDA Soil Conservation Service method. For its estimation, monthly precipitation depth is required (Pmonth), and the following equations are applied [47]:
peff = Pmonth × (125 − 0.2 × Pmonth)/125 when Pmonth <= 250 mm
Peff = 125 − 0.1 × Pmonth when Pmonth > 250 mm
The blue water requirement in a crop C W R b l u e c p corresponds to the irrigation requirement (IR). Irrigation is necessary when rainfall is insufficient to compensate for the loss of water by evapotranspiration; that is, if the effective rainfall does not cover all the crop’s water needs, then more water is required, and this is assumed to be covered by irrigation water [47]. Therefore, the IR represents the amount of water resources added from surface water or groundwater as the source.
C W R green c p = 10 × D l g E T c green
C W R blue c p = 10 × D l g E T c blue
where D l g E T c green is the sum of the green water evapotranspiration throughout the growth period of the crop that spans from the day of planting (day 1) to the day of harvest. D l g E T c blue is the sum of the evapotranspiration of irrigation water and is determined by the difference between the ETc and the effective precipitation. In this case, ten is the factor to transform water depth units (mm) into the water volume per surface (m3/ha), since a depth of 1 mm in a 1 ha surface equals 10,000 L. Finally, the water depth value in mm is multiplied by 10 to express it in m3/ha [15,25].

2.2.3. Green and Blue Water Footprint of the Avocado Crop

To calculate the green WF and blue WF, we split the water requirement of a crop c in a region p ( C W R g r e e n and C W R g r e e n ) (m3/ha) by the R c crop yield in units of mass per area unit (ton/ha) of an interest crop c, in a specific period. This calculation is expressed in m3/ton.
W F g r e e n c p = C W R g r e e n c p R c
W F b l u e c p = C W R b l u e c p R c
To calculate the annual green and blue water consumption, we multiplied the W F g r e e n c p and the W F g b l u e c p (m3/ha) of crop c in a region p by the annual crop (avocado) production P r o c p expressed in mass per time unit (ton/year) and considered irrigated for the blue WF and temporary for the green WF in a crop c in a region p.
G r e e n w a t e r c o n s u m p t i o n c p = W F g r e e n c p × P r o c p
B l u e w a t e r c o n s u m p t i o n c p = W F g b l u e c p × P r o c p

2.2.4. Irrigation Water Sustainability Estimation

The sustainability of irrigation water S U I W was evaluated by the relationship between crop c in a region p and the volume of water granted for agricultural use in a particular year for a region [48].
S U I W = B l u e w a t e r c o n s u m p t i o n A n n u a l c p V C

2.3. Data Sources

We used monthly time series as source data for the CROPWAT v 8.0 software, including maximum temperature (°C), minimum temperature (°C), precipitation (mm), relative humidity (%), and wind speed (m/s). These data were collected from two meteorological stations: (A) the automated meteorological station part of the weather monitoring network of the Packing and Exporting Association of Avocado Producers of Mexico located at coordinates 19°27′ N and 101°53′ W [49] and (B) the automated private meteorological station (Vizcaino family plantation) of the municipality of Ziracuaretiro located at the coordinates 19°23′ N and 101°51′ W at 1467.10 m.a.s.l (Figure 1). The study period for the analysis runs between 2012 and 2021. However, due to database inconsistencies, 2018 was omitted from the analysis.
Since the finest level of crop production information available corresponds to the municipality, in this study, we work at the municipal scale and assume homogeneity of the meteorological variables. Therefore, the information from the weather stations is considered representative of the municipality’s total area.
Regarding soil information, we used previously derived data from field sampling in representative orchards in the municipality (2017–2018). We included laboratory analysis-derived data of soil samples as well as key hydrophysical properties estimated using the Soil Water Characteristics pedotransfer model of Saxton and Rawls [50] and the 1:50,000 scale soil unit cartographic information from INEGI [51] (Table 2).
The Saxton and Rawls Soil Water Characteristics pedotransfer model allows the estimation of various hydrophysical properties using texture data or particle size ratios, stoniness, and organic matter content as input data [50,52].
For the analysis of the water requirement for the crop, a maximum infiltration rate of 300 mm/day was considered (maximum value admitted by the CROPWAT program), which is similar to the hydraulic conductivity of the region with the lowest conductivity (20–40 cm; 315.96 mm/day) (Table 2). We considered a maximum soil moisture of 268 mm/m, including the percentages of available water for the different depths, assuming that between a 0.6 and 1.0 m depth, the usable water corresponded to a value of 9.3% (Table 3).
Regarding crop information, the following parameters were considered: root depth from 0.40 to 0.60 m, critical exhaustion 0.45%, yield response factor from 1.10 to 1.30, and crop height 8.2 m, derived from 2017 to 2019 field campaigns measurements.
Regarding the phenology of avocado as a crop, Rocha-Arroyo et al. [53,54] report the occurrence of three types of climates (warm, semi-warm, and temperate) in the MAB, which favors anthesis in winter, spring, and summer and, therefore, crop cycle production is asynchronous between plantations at different altitudes within the MAB. Further, Salazar Garcia et al. [55] established that altitude is a determinant of phenology and divided the MAB into three zones: high, where the altitude is (>2000 m.a.s.l), intermediate (1500 to 2000 m.a.s.l), and low (<1500 m.a.s.l).
The agroindustrial production of avocado in the municipality of Ziracuaretiro can be considered as part of the lower zone since the avocado orchards in this municipality are located between 1226 m.a.s.l. and 2273 m.a.s.l, according to Morales-Manilla’s avocado plantation polygons [40]. Nevertheless, the mean altitude of avocado plantations in the municipality is 1527 m.a.s.l., and nearly 55% of the plantations are located at altitudes between 1226 and 1446 m.a.s.l.
Taking into account the information provided by local producers and plantation managers and that reported by Rocha-Arroyo et al. [53,54] and Vizcaino [56] and the altitudinal range of avocado plantations in the municipality, we considered summer anthesis. We assumed the vegetative flow in September as the beginning of the crop cycle.
The data on the planted surface of the avocado crop (ha), production (ton/year), and yield (ton/ha) of the agricultural cycles of 2012–2017 and 2019–2021 were obtained from the Agro-Food and Fisheries Information Service [36] available online https://www.gob.mx/siap accessed on 24 March 2024. The information on annual agricultural production at the municipal level was considered, considering the modality of production. The SIAP distinguishes two modes of production: temporary and irrigated. In the case of the first, only rainwater is considered, while irrigation infrastructure is also considered in the second modality.
Finally, data from the Public Registry of Water Rights (REPDA) (from its acronym in Spanish), for agricultural use and available online, were used to estimate the volumes of surface and groundwater concessioned for the period [48].

3. Results

3.1. Meteorological Variables

The estimated mean maximum temperature was 26.91 °C (±3.45), and the mean minimum temperature was 7.08 °C (±3.10); we determined that the hottest month was May, with a mean temperature of 30.17 °C, and the coldest month was January, with a mean minimum temperature of 3.16 °C. The mean relative humidity (RH) was 73.93% (±14.09); April was the driest month, with a mean value of 47.41%, and the month with the highest humidity was September, with an average of 89.80%. Regarding the mean wind speed, it was 8.30 m/s (±1.08), and the month with the strongest winds was April, with 9.70 m/s, and the one with the least wind was September, with 6.79 m/s (Figure 3).
In Ziracuaretiro, we obtained a monthly mean ETo of 176.80 mm (±55.74), a mean monthly maximum in April (276.86 mm), and a minimum of 126.73 mm in September. In addition, we calculated the annual mean ETo of 2121.63 mm/year (±244.63), with a maximum of 2487.33 mm/year in 2020 and a minimum of 1840.40 mm/year in 2015 (Figure 3). Finally, according to the meteorological data, in this municipality, we found a mean annual precipitation of 1253.20 mm (±263.23). The year with the highest rainfall depth was 2021 (1708.20 mm), and the year with the lowest was 2020 (963.00 mm).

3.2. Avocado Crop Production

The panorama of avocado cultivation in the municipality of Ziracuaretiro showed a progressive behavior, as shown in Table 4, for rainfed and irrigated production. Official data report that for rainfed production, the planted area increased from 750.0 ha in 2012 to 1825.0 ha in 2021, with a mean of 1347.00 ha (±346.48). These figures correspond to a total increase of 59% in 9 years. Regarding the production volume, we estimated a mean of 12,370.82 ton/year, and production volume rose from 7312.50 ton/year in 2012 to 16,940.00 ton/year in 2021, a net increase of 57%.
For irrigated production, the SIAP reports [18] a mean planted surface of 2840.22 (±614.29), which increased from 1620.00 ha in 2012 to 3400.00 ha in 2021, an increment of 52%. Under irrigation conditions, the mean production volume was 30,424.81 ton/year, and increased from 16,443.00 ton/year in 2012 to 41,140.00 ton/year in 2021, representing an increase of 60%.

3.3. Avocado Crop Water Requirement (CWR)

From the analysis of the meteorological information, we estimated a mean annual (ETc) depth of 2440.03 mm/year and a mean annual precipitation depth of 1253.21 mm/year. We calculated a mean irrigation requirement of 1726.54 mm/year and a mean effective rainfall (peff) of 771.22 mm/year (Table 5). The analysis indicates that 30.87% of rainwater and 69.12% of irrigation water are used.

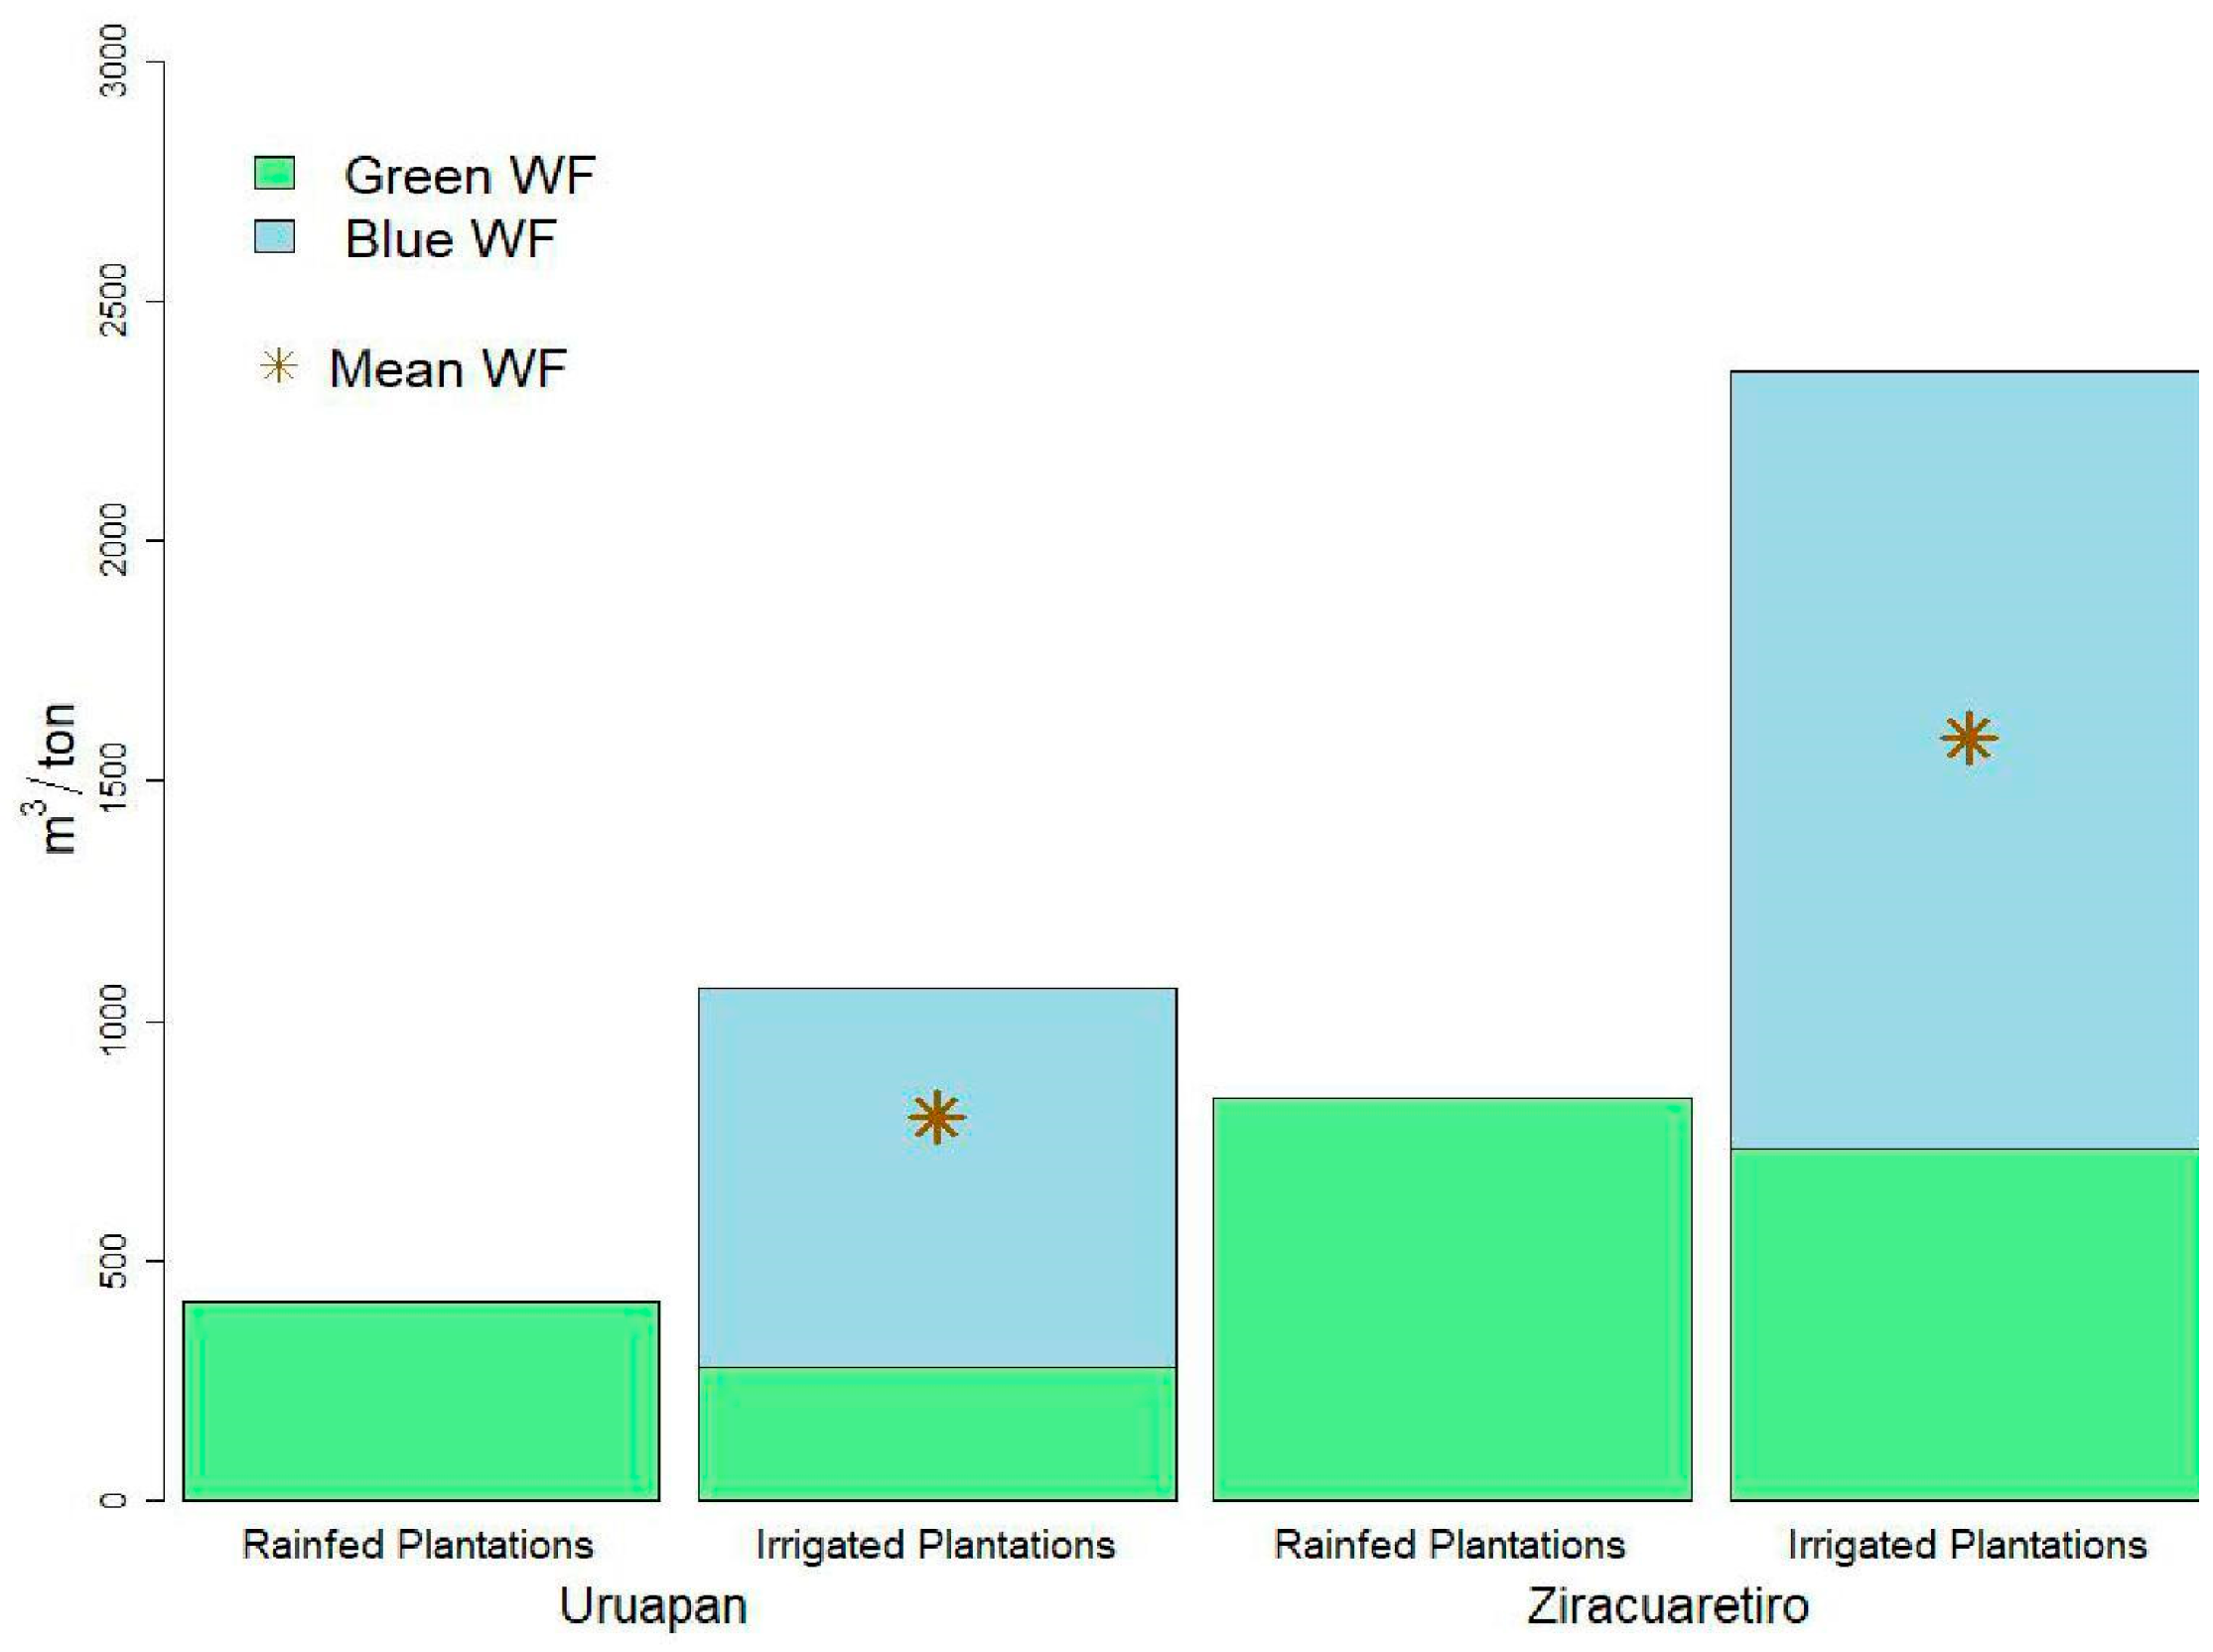
3.4. Green and Blue Water Footprint of the Avocado Crop

For the rainfed avocado production, we estimated a mean WF of 839.03 m3/ton (±82.44) for the studied municipality for a mean crop yield of 9.20 ton/ha (±0.51). Within the analyzed period, the maximum WF occurred in 2016 (957.02 m3/ton) and the minimum in 2020 (676.91 m3/ton).
Regarding irrigated avocado production, we determined a mean WF of 2355.79 m3/ton (±157.45) for a mean crop yield of 10.60 ton/ha (±0.93), with a maximum in 2014 (2514.62 m3/ton) and minimum in 2015 (1991.16 m3/ton). Finally, we calculated a mean WF for rainfed and irrigated production of 1597.41 m3/ton (±81.09), with a maximum in 2014 (1688.89 m3/ton) and a minimum in 2015 (1443.66 m3/ton) (Table 6).

3.5. Annual Green and Blue Water Consumption of the Agroindustrial Cultivation of Avocado

Concerning the mean annual water consumption of rainfed production, we obtained a mean of 10.31 hm3 (±2.46) for a production volume of 12,370.82 ton/year, with a maximum in 2021 (14.55 hm3) and a minimum in 2012 (5.51 hm3).
However, considering irrigated production, mean annual consumption was 75.69 hm3 (±24.77), considering an average production volume of 30,424.81 ton/year, with a maximum in 2021 (107.59 hm3) and a minimum in 2012 (38.18 hm3). Finally, the mean total water consumption for rainfed and irrigated production was 86.01 hm3 (±26.60), with a maximum in 2021 (122.13 hm3) and a minimum in 2012 (43.69 hm3) (Table 7).

3.6. Irrigation Water Sustainability Analysis

For the Ziracuaretiro municipality, the REDPA database indicates a mean water volume concession of 39.84 hm3 (±2.76) for agriculture. The information indicates that water volume concessions have increased from 37.64 hm3/year in 2012 to 43.68 hm3/year in 2021. Likewise, we determined the annual water consumption for irrigated production at 50.27 hm3 (±18.81), reaching a maximum in 2020 (75.54 hm3) and a minimum in 2012 (25.78 hm3). These figures correspond to a mean consumption of 124.29% (±39.67%) of the rightful and legally concessioned water volumes by the avocado crop, ranging from 68.48% as the minimum in 2012 to 172.95% as the maximum in 2020.
The analysis of the sustainability of irrigation water use in the municipality of Ziracuaretiro shows that the avocado crop consumes, for certain years, the whole amount of concessioned water and even more. The excess water volume use, which reaches nearly 24.3% on average, seems to be appropriated and used without proper legally established rights of use (Table 8).

4. Discussion

4.1. Water Footprint of Agroindustrial Avocado Production

The study of the water footprint of agroindustrial avocado production in the municipality of Ziracuaretiro incorporates two elements for the analysis of water consumption: spatial variation and temporal variation reported by Hoekstra [57] and the phenology of the avocado crop according to Rocha-Arroyo et al. [53,54] are elements that determine the demand for irrigation water for crops [58]. The WF analysis of the municipality studied showed a greater demand for water related to two elements: the phenology of the crop and the existing meteorological conditions in the different phases of the productive cycle. Previous local studies have reported the water required to sustain the avocado crop, between 180 and 652 m3/ton [59], while Gomez-Tagle et al. [15] reported that in one of the main municipalities in avocado production in the avocado strip of Michoacan (Uruapan), the WF for rainfed production was 417.10 m3/ton. It was 1071.40 m3/ton for irrigation, with a total mean WF of 744.30 m3/ton. According to this information, the municipality of Ziracuaretiro would require 50% more water for rainfed production and 54% more for irrigation (Figure 4).

4.2. Meteorological Conditions and Phenology

The difference in water consumption by the agroindustrial production of avocado between the municipalities of Uruapan and Ziracuaretiro can be attributed to the following: First, the weather conditions are different. In Uruapan, Gomez-Tagle et al. [15] report a maximum temperature of 20.59 °C (±2.35) and a minimum temperature of 9.34 °C (±2.34), with a relative humidity of 80.1% (±15.33) and an average wind speed of 4.15 m/s (±1.24). In Ziracuaretiro, the temperature is higher. The average maximum is 26.91 °C (±3.45), almost 6.3 °C higher. The winds are more intense, reaching an average of 8.30 m/s (±1.08), approximately twice as fast as in Uruapan, but also it is a fact that in Ziracuaretiro, a lower average relative humidity is observed (73.93%) (±14.09) (Figure 3); all this is reflected in the increase in the evapotranspiration demand of the same crop [45,47].
On the other hand, another factor that influences the difference in water consumption of the agroindustrial cultivation of avocado in these two municipalities is the phenology of the crop itself. In this sense, Rocha-Arroyo et al. [53,54] reported that in semi-warm climates, the summer vegetative flow begins in June at the end of the spring vegetative flow. Such is the case in Ziracuaretiro, where pre-flowering occurs in June, and it is not until September that the fruit growth period begins, which lasts ten months. This condition differs from that reported by Cossio-Vargas [60] in sites with warm climates in the state of Nayarit in western Mexico, which can last up to 7.5 months. In the municipality of Uruapan, Gomez-Tagle et al. [15] considered winter flowering (January) as the main kind for avocado production. In this regard, Rocha-Arroyo et al. [53,54] mention that this flowering is considered the most productive and is associated with a productive cycle duration of 8 to 9 months.
When comparing the blue and green WF obtained in the present study with other published results, we found that in the municipality of Ziracuaretiro the agroindustrial avocado production requires up to 1.5 times more water than the global average (1132 m3/ton) [31].
In other avocado-producing regions, such as the Dominican Republic, Peru, Colombia, Indonesia, the whole of Mexico, Michoacan State [31], and Uruapan municipality [15], the WF was lower. Moreover, it is evident how the water consumption of this tropical fruit’s agroindustrial production is similar in regions under similar climatic conditions, e.g., Canary Islands [61] (Figure 5).

4.3. Sustainability of the Water Resource

Throughout the world water use sustaniability is considered an important research line, because the long-term availability of the water resources may be compromised due to the growing water crisis [62].
The sustainability of water use is an important research line throughout the world, and it is the case that in the face of the growing water crisis caused mainly by the increase in demand, the long-term availability of water resources may be compromised (Orlove and Caton [61]). In this context, we found situations similar to those of Ziracuaretiro at the international level, where the water demand is increasing due to greater production of crops. Liu and Yang [63] reported that the expansion of irrigation in China depletes the surface and groundwater resources. A more recent study in this same country is that of Jiang et al. [64], which shows serious problems with water availability in the northeast region of China because this region is an exporter of agricultural crops towards the southern part, which has caused increased pressure on water and limits the resource for other sites.
Regarding avocado cultivation and water resources, Budds [65] provides an analysis of the hydrological evaluation in Valparaiso, Chile, where she documented that since the beginning of the 21st century in this region, there has been a change in cultivation for exports and in this case, avocado plantations have proliferated, a situation that has caused an increase in the need for groundwater and the illegal extraction of this resource. The international press has widely documented and disseminated the situation [66,67]. In this same scenario, Novoa et al. [26] reports the unsustainability of water use in the Cachapoal River Basin in Chile. The water used for avocado production through water rights concessions generated a water crisis and conflicts between avocado producers and local farmers due to decreased surface water availability [68].
In Mexico, Gomez-Tagle et al. [15] showed that in the municipality of Uruapan avocado cultivation demands an average of 89.86% of the total volume of concessioned water in an agricultural year under irrigation conditions, reaching up to 120% in dry years. The present contribution shows that in the municipality of Ziracuaretiro, the average annual demand in irrigation conditions is approximately 27.70% higher than in the neighboring municipality (Uruapan) studied by these authors.
Our results point out the occurrence of unauthorized appropriation of water for cultivating avocados in Ziracuaretiro, a situation that can cause the water available for irrigation to decrease due to overexploitation [69]. This situation is not only experienced in this municipality. The Climate Rights International NGO (2023) report indicates that avocado producers in this region extract water from streams, rivers, springs, and wells without the mandatory water rights concession issued by the federal government (CONAGUA), which results in water theft [8].
In addition to the above, developing other crops may be limited. Avocado is not the only agricultural crop in this municipality. In the year 2020, estimated irrigation water appropriation reached up to 172.95% of the concessioned water to agriculture. That year, 92,977 tons of other crops were registered. In this context, avocado represented only 35.44%. The remaining 64.54% was distributed among the decorative flowers (Strelitzia reginae; Ave del paraiso) (29,400 tons), blackberry (13,600 tons), sugar cane (7268 tons), edible cactus leaves (nopales) (6300 tons), and guava (900 tons), among others [36].
This water appropriation influences a water rights system that strongly affects the indigenous communities and their territories and protects the economic interests of political and economic elites that control agroindustrial production of this crop [70]. A similar situation has been reported to occur in Valparaiso, Chile, where the expansion of avocado has caused water scarcity in Chilean rural communities (70,4).
It is also important to consider that this appropriation of water by agroindustrial production of this crop has the United States as its main driving force, since more than 70% of the region’s avocado production is exported to this country [71]. This situation does not only occur with this tropical fruit and it has been documented for other goods such as Mexican tequila, where its main international buyer is the United States. The tequila production system also appropriates natural resources and generates environmental impacts on ecosystems [72].

4.4. What to Expect under Climate Change?

The results of the present investigation show that under warm weather conditions, the WF is higher, which allows us to visualize those climatic factors as determinants for water consumption. That is, an increase in temperature and a decrease in rainfall can increase water demand. This situation would affect the sustainability of the water resource. This scenario highlights the urgency of carrying out research considering the possible effects of climate change on the WF, since it is predicted that agricultural production is the most vulnerable to the increase in temperature. This condition can cause a decrease in crop yield and a greater water demand that will directly impact the sustainability of the water resource to maintain productivity and ensure food security [73,74]. In this context, Olesen et al. [75] evidenced a reduction in the yield of certain crops in Southern Europe due to increased heat waves and droughts, since the hot climate in this region requires more water due to high evapotranspiration and limited rainfall. However, similar situations are expected in different parts of the world. Ochieng et al. [76] reports a similar situation in Southern Africa, where it is predicted that in hot and dry climates, crops will be affected by the temperature component and the persistence of dry periods. In Turkey, Pilevneli et al. [58] predicts that the greatest impact of climate change on crops in this area is expected to be between 2015 and 2040, specifically in water availability. This research adds an important element to income from agricultural production. According to the scenarios of these authors, this will decrease drastically for those crops with greater irrigation requirements.
At the local level, Alvarez-Bravo et al. [77] predict climate change will affect the avocado-producing region in Michoacan, mainly in warm sub-humid and semi-warm sub-humid climates. According to the scenarios proposed by this author, the horizon for 2070 in these climates would be an increase of 2.41 °C in the maximum temperature and 2.02 °C the minimum situation, which would negatively impact the phenological stages of the avocado crop. This would cause an increase in evapotranspiration demand and a possible decrease in soil moisture, reflected in a greater demand for water to maintain crop yield [78].
Finally, Charre-Medellin [79,80] states that avocado cultivation in Michoacan may be displaced due to climate change to higher altitude areas where the climate that currently prevails is temperate, in places that are currently covered with forest. This can cause ecological impacts, including biodiversity loss, soil erosion and degradation, and adverse effects on hydrological processes [14,81].
We consider highly relevant to conduct research that supports the development of strategies for the efficiency of crop management, especially related to irrigation management, in order to reduce water volumes and make water use as efficient as possible.

4.5. Method Limitations, Drawbacks, and Final Considerations

The water footprint is an indicator of environmental impact and is a useful tool to assess a product’s water use and identify and claim the use of this limited resource [17]. Although the WF is a valuable indicator, it has its limitations. First, it is considered a partial indicator that must be combined with other tools because it does not address other environmental issues, such as climate change [25]. Second, the results’ reliability depends on data, information quality, and availability. Northey et al. [82] suggest carefully interpreting the results since they are based on crop agronomical modeling with several assumptions that sometimes cannot be met. While et al. [74] and Lovarelli et al. [83] state that although the data can be somehow adapted when not available, it is possible that they may not be completely representative of the real processes in the study region, and this may generate some level of uncertainty about the calculations.
In the study case presented herewith, homogeneity is assumed throughout the municipality. This means the entire study region is assumed to present uniform soil properties, depth, hydraulic parameters, and crop plantation ages. This means that all plantations in the municipality are of the same age and have the same spacing, tree size, and crop management, which is not the case. During field campaigns, we document different plantation ages, sizes, and management. But we tried to use representative crop, soil, and weather information for the entire municipality.
Furthermore, the calculation of the crop requirement estimated with the CROPWAT software is based on the fact that the crop is under optimal soil and water conditions and that it reaches maximum production according to the weather and climate situations; that is, the model assumes equilibrium state [25,45]. It is well known that in the case of fruit crops and working on a fine scale (orchard or plantation), not all trees behave in the same way, and the variation within the plantation may generate considerably large differences in water consumption and fruit production. It is unrealistic to consider that the assumption was completely met throughout the whole study period at the municipal scale since it means the inexistence of stress and pests for the target crop for at least nine years throughout the municipality’s territory.
Nonetheless, the crop production information available from the government agencies (SIAP) and water concessions information (REDPA) could only be found at the municipality scale. Therefore, it was impossible to analyze at a finer scale in this study, as Naranjo and Reyes did in Quindío, Colombia [84]. There, single plantation productivity data were used. Working at such a scale, it could be possible to encompass meteorological, soil, and plantation heterogeneity, but at the same time, it would be challenging to upscale to the municipal level.
We therefore recognize the need for research at a finer scale considering production data from local orchards and plantations together with in situ crop water consumption estimates obtained from direct measurements, e.g., using sap flow or eddy covariance approaches to tackle uncertainty, but also to contrast and evaluate WF estimates against hard data. In addition, performing in situ measurements could help reduce possible errors in the data, thus providing a more precise reference for water use estimations [25,43].
Finally, from a wider perspective, we concur with Salmoral et al. [34], who state that it is necessary to clarify that in this type of study, the final results are only an approximation of water use.

5. Conclusions

In the municipality of Ziracuaretiro, part of the Michoacan Avocado Belt in central Mexico, the estimated water footprint for avocado cultivation in rainfed conditions was 839.03 m3/ton and 2355.80 m3/ton for irrigation, with a mean of 1597.41 m3/ton, which means that in this site consumption is 1.5 times greater than the global green and blue WF (1132 m3/ton) and two times greater than in the main avocado region of Michoacan. The greater water footprint of this municipality can be explained by the fact that the climatic conditions of Ziracuaretiro are generally warmer, the orchards are located at a lower altitude (1226 m.a.s.l. and 2273 m.a.s.l.), and around 55% of the plantations are located between 1226 and 1446 m.a.s.l. These lower altitudes are related to higher air temperatures, as well as less annual precipitation compared to higher altitudes. On the other hand, the start and duration of the production cycle are other factors that influence increased water consumption. In this study, the beginning of the production cycle was considered in September. This means that the growth and filling of the fruit occurs during the time of the year with less rainfall. In addition, with the analysis of the water footprint, it was estimated that in Ziracuaretiro, an average of 124.29% of the total volume of water granted for agricultural use is required, a situation that puts the sustainability of the use of irrigation water in this municipality at risk. And it is this appropriation, without the legal rights of use, which puts at risk the acquisition of water for other users and agricultural crops.
Finally, future work is needed to estimate the water consumption of this crop in the producing region of Michoacan, considering that it is the leading avocado-producing state; added to the above, subsequent studies should focus on the effects of climate change on avocado water consumption and its productivity. Concerning climate change, there is a risk of an increase in water demand, and the supply of water for other uses can be at risk. Last but not least, work on schemes that seek to reduce the amount of irrigation water used in this agroindustrial crop as part of the adaptation measures to climate change is urgently needed.

Author Contributions

Conceptualization, D.J.F.-V. and A.G.-T.; methodology, D.J.F.-V. and A.G.-T.; software, D.J.F.-V.; validation, A.G.-T.; formal analysis, D.J.F.-V. and A.G.-T.; investigation, D.J.F.-V. and A.G.-T.; resources, D.J.F.-V.; data curation, D.J.F.-V.; writing—original draft preparation, D.J.F.-V. and A.G.-T.; writing—review and editing, D.J.F.-V. and A.G.-T.; visualization, D.J.F.-V. and A.G.-T.; supervision, A.G.-T.; project administration, A.G.-T.; funding acquisition, A.G.-T. and D.J.F.-V. All authors have read and agreed to the published version of the manuscript.

Funding

This work was funded by grants of the Instituto de Ciencia Tecnología e Innovación del estado de Michoacán [ICTI-PICIR23-071]; “Consumo y apropiación hídrica en territorios indígenas: el caso del aguacate en la Meseta P’urhépecha”. [PFCTI/ICTI/2019/A/315]; “Aplicación del conocimiento ecológico para favorecer la sustentabilidad del cultivo de aguacate en el estado de Michoacán: Aspectos de suelo, hidrológicos e interacciones bióticas”, the Coordinación de la Investigación Científica of Universidad Michoacana de San Nicolás de Hidalgo grant [UMSNH-CIC.2022-2023]; “Cuantificación del consumo hídrico en cultivo de aguacate y bosques nativos de la franja aguacatera de Michoacán” and the CONAHCyT postdoctoral 2023–2025 grant [CVU:630822].

Data Availability Statement

Data will be made available on request.

Acknowledgments

We are very grateful to the plantation owners who allowed us to access their properties and register field information on the municipality’s representative orchards and M.C. Elizeth Vizcaino for meteorological data access. We also thank two anonymous reviewers for the comments on the manuscript.

Conflicts of Interest

The authors declare no conflicts of interest.

References

  1. Gutierrez-Contreras, M.; Lara-Chávez, M.; Guillén-Andrade, H.; Chávez-Bárcenas, A.T. Agroecology of the avocado-producing belt area in Michoacan, Mexico. Interciencia 2010, 35, 647–653. [Google Scholar]
  2. Araújo, R.G.; Rodriguez-Jasso, R.M.; Ruiz, H.A.; Pintado, M.M.E.; Aguilar, C.N. Avocado by-products: Nutritional and functional properties. Trends Food Sci. Technol. 2018, 80, 51–60. [Google Scholar] [CrossRef]
  3. Rudo, J.L. Beyond the Guacamole: How Drug Organizations Became Involved in the Avocado Industry. Master’s Thesis, The University of West Florida, Pensacola, FL, USA, 2021. [Google Scholar]
  4. Anticoli, A. Exploring Power Dynamics in the Water Sector in Chile: A Focus on Avocado Plantations and Water Resources in Three Municipalities. Master’s Thesis, University, Disciplinary Domain of Science and Technology, Earth Sciences, Uppsala, Sweden, 2022. [Google Scholar]
  5. Wagner, C. Are Mexican Avocados the Next ‘Conflict Commodity’? Retrieved from Verisk Maplecroft. Available online: https://www.maplecroft.com/insights/analysis/are-mexican-avocados-the-next-conflict-commodity/ (accessed on 15 February 2024).
  6. De la Vega-Rivera, A.; Merino-Pérez, L. Socio-environmental impacts of the avocado boom in the Meseta Purepecha, Michoacan, Mexico. Sustainability 2021, 13, 7247. [Google Scholar] [CrossRef]
  7. Climate Rights International (CRI). US/Mexico: U.S. Senators Urge Action on Mexican Avocados. 8 February 2024. Available online: https://cri.org/us-senators-urge-action-on-mexican-avocados/ (accessed on 16 February 2024).
  8. Climate Rights International (CRI). Mexico: Avocados for Export Fueling Deforestation and Abuse. 28 November 2023. Available online: https://cri.org/mexico-avocados-export-fueling-deforstation-abuse/ (accessed on 17 February 2024).
  9. Romero, S.; Rodríguez, E. Americans Love Avocados. It’s Killing Mexico’s Forests. 2023. Available online: https://www.nytimes.com/2023/11/28/us/mexico-avocado-deforestation.html (accessed on 17 February 2024).
  10. Peter Welch U.S Senator for Vermont. Available online: https://www.welch.senate.gov/u-s-ambassador-to-mexico-salazar-says-mexican-avocados-grown-illegally-shouldnt-be-exported-to-u-s-comes-after-welch-led-letter-to-administration-urging-action-to-address-illegal-deforesta/ (accessed on 17 April 2024).
  11. Madslien, S. Are Avocado the Blood Diamonds of México? An Empirical Study on How Increasing Demand for Mexican Avocados Is Related to Cartel Violence. Master’s Thesis, Norwegian School of Economics, Bergen, Norway, 2020. [Google Scholar]
  12. Ornelas, R.G. Organized crime in Michoacán: Rent-seeking activities in the avocado export market. Politics Policy 2018, 46, 759–789. [Google Scholar] [CrossRef]
  13. Bocco, G.; Mendoza, M.; Masera, O.R. La dinámica del cambio del uso del suelo en Michoacán: Una propuesta metodológica para el estudio de los procesos de deforestación. Investig. Geográficas 2001, 44, 18–36. [Google Scholar] [CrossRef]
  14. Latorre-Cárdenas, M.C.; González-Rodríguez, A.; Godínez-Gómez, O.; Arima, E.Y.; Young, K.R.; Denvir, A.; García-Oliva, F.; Ghilardi, A. Estimating Fragmentation and Connectivity Patterns of the Temperate Forest in an avocado-Dominated Landscape to Propose Conservation Strategies. Land 2023, 12, 631. [Google Scholar] [CrossRef]
  15. Gómez-Tagle, A.F.; Gómez-Tagle, A.; Fuerte-Velázquez, D.J.; Barajas-Alcalá, A.G.; Quiroz-Rivera, F.; Alarcón-Chaires, P.E.; Guerrero-García-Rojas, H. Blue and Green Water Footprint of Agro-Industrial Avocado Production in Central Mexico. Sustainability 2022, 14, 9664. [Google Scholar] [CrossRef]
  16. AP. Available online: https://apnews.com/article/mexico-drought-avocados-dried-up-lakes-faaad63fdf0d3f3cba7b33fb0456c053 (accessed on 26 April 2024).
  17. Xinchun, C.; Mengyang, W.; Xiangping, G.; Yalian, Z.; Yan, G.; Nan, W.; Weiguang, W. Assessing water scarcity in agricultural production system based on the generalized water resources and water footprint framework. Sci. Total Environ. 2017, 609, 587–597. [Google Scholar] [CrossRef] [PubMed]
  18. Huang, Z.; Hejazi, M.; Tang, Q.; Vernon, C.R.; Liu, Y.; Chen, M.; Calvin, K. Global agricultural green and blue water consumption under future climate and land use changes. J. Hydrol. 2019, 574, 242–256. [Google Scholar] [CrossRef]
  19. Vörösmarty, C.J.; McIntyre, P.B.; Gessner, M.O.; Dudgeon, D.; Prusevich, A.; Green, P.; Glidden, S.S.; Bunn, E.; Sullivan, C.A.; Reidy Liermann, C.; et al. Global threats to human water security and river biodiversity. Nature 2010, 467, 555–561. [Google Scholar] [CrossRef]
  20. Bakker, K. Water security: Research challenges and opportunities. Science 2012, 337, 914–915. [Google Scholar] [CrossRef]
  21. ISO 14046:2014; Environmental Management Water Footprint Principles, Requirements and Guidelines. International Organization for Standardization: Geneva, Switzerland, 2014.
  22. Deepa, R.; Anandhi, A.; Alhashim, R. Volumetric and impact-oriented water footprint of agricultural crops: A review. Ecol. Indic. 2021, 130, 108093. [Google Scholar] [CrossRef]
  23. Sabli, N.S.M.; Noor, Z.Z.; Kamaruddin, S.N.; Rusli, N.M. Developing a methodology for water footprint of palm oil based on a methodological review. J. Clean. Prod. 2017, 146, 173–180. [Google Scholar] [CrossRef]
  24. Deurer, M.; Green, S.R.; Clothier, B.E.; Mowat, A. Can product water footprints indicate the hydrological impact of primary production? A case study of New Zealand kiwifruit. J. Hydrol. 2011, 408, 246–256. [Google Scholar] [CrossRef]
  25. Hoekstra, A.Y.; Chapagain, A.K.; Aldaya, M.M.; Mekonnen, M.M. The Water Footprint Assessment Manual: Setting the Global Standard; Earthscan: London, UK, 2011; ISBN 978-1-84971.279-8. [Google Scholar]
  26. Novoa, V.; Ahumada-Rudolph, R.; Rojas, O.; Munizaga, J.; Sáez, K.; Arumí, J.L. Sustainability assessment of the agricultural water footprint in the Cachapoal River basin, Chile. Ecol. Indic. 2019, 98, 19–28. [Google Scholar] [CrossRef]
  27. Vanham, D.; Mekonnen, M.M. The scarcity-weighted water footprint provides unreliable water sustainability scoring. Sci. Total Environ. 2021, 756, 143992. [Google Scholar] [CrossRef] [PubMed]
  28. Lala-Ayo, H.D.; Fernández-Quintana, M.D.C. Análisis de la sostenibilidad media huella hídrica de la microcuenca del Río Pita, Ecuador. Tecnol. Y Cienc. Del Agua 2020, 11, 169–234. [Google Scholar] [CrossRef]
  29. Cao, X.; Bao, Y.; Li, Y.; Li, J.; Wu, M. Unravelling the effects of crop blue, green and grey virtual water flows on regional agricultural water footprint and scarcity. Agric. Water Manag. 2023, 278, 108165. [Google Scholar] [CrossRef]
  30. Cheng, P.; Sun, M. Calculation of seasonal agricultural grey water footprint in monsoon region based on river reference conditions. Ecol. Indic. 2022, 145, 109638. [Google Scholar] [CrossRef]
  31. Mekonnen, M.M.; Hoekstra, A.Y. The green, blue and grey water footprint of crops and derived crop products. Hydrol. Earth Syst. Sci. 2011, 15, 1577–1600. [Google Scholar] [CrossRef]
  32. Russo, T.; Alfredo, K.; Fisher, J. Sustainable water management in urban, agricultural, and natural systems. Water 2014, 6, 3934–3956. [Google Scholar] [CrossRef]
  33. De Miguel, Á.; Kallache, M.; García-Calvo, E. The water footprint of agriculture in Duero River Basin. Sustainability 2015, 7, 6759–6780. [Google Scholar] [CrossRef]
  34. Salmoral, G.; Dumont, A.; Aldaya, M.M.; Rodríguez-Casado, R.; Garrido, A.; Llamas, M.R. Análisis de la Huella Hídrica Extendida de la Cuenca del Guadalquivir; Fundación Marcelino Botín: Madrid, Spain, 2012. [Google Scholar]
  35. Instituto Nacional de Estadística y Geografía (INEGI) Geography Information. Available online: https://www.inegi.org.mx/app/biblioteca/ficha.html?upc=702825293048 (accessed on 28 April 2023).
  36. Servicio de Información Agroalimentaria y Pesquera (SIAP). Available online: https://nube.siap.gob.mx/cierreagricola/ (accessed on 30 May 2023).
  37. Arima, E.Y.; Denvir, A.; Young, K.R.; González-Rodríguez, A.; García-Oliva, F. Modelling avocado-driven deforestation in Michoacán, Mexico. Environ. Res. Lett. 2022, 17, 034015. [Google Scholar] [CrossRef]
  38. García, E. Modificaciones al Sistema de Clasificación Climática Köppen; Instituto de Geografía de la Universidad Autónoma: Ciudad de México, Mexico, 2004. [Google Scholar]
  39. Olivares-Martinez, L.D.; Gomez-Tagle, A.; Pérez-Salicrup, D.R. Regional Drivers behind the Burning of Remanent Forests in Michoacán Avocado Belt, Central Mexico. Fire 2023, 6, 81. [Google Scholar] [CrossRef]
  40. Morales-Manilla, L.M.; Reyes González, A.; Cuevas García, G.; Ramuco, M.O. Inventario del Cultivo de Aguacate y Evaluación del Impacto Ambiental Forestal en el Estado de Michoacán; Centro de Investigaciones en Geografía Ambiental: Morelia, México, 2011. [Google Scholar]
  41. Instituto Nacional de Estadística y Geografía (INEGI) Climatology Information. Available online: https://www.inegi.org.mx/temas/climatologia/ (accessed on 23 August 2023).
  42. Instituto Nacional de Estadística y Geografía. Available online: https://www.inegi.org.mx/contenidos/productos/prod_serv/contenidos/espanol/bvinegi/productos/historicos/1329/702825231781/702825231781_1.pdf (accessed on 23 September 2023).
  43. Water Footprint Network (WFN). Simulating Impacts of Climate Change on Crop Production. Field Crops Research. Available online: https://www.waterfootprint.org/ (accessed on 14 May 2023).
  44. Ewaid, S.H.; Abed, S.A.; Al-Ansari, N. Water footprint of wheat in Iraq. Water 2019, 11, 535. [Google Scholar] [CrossRef]
  45. Allen, R.G.; Pereira, L.S.; Raes, D.; Smith, M. Crop Evapotranspiration-Guidelines for Computing Crop Water Requirements FAO Irrigation and Drainage Paper 56; Food and Agriculture Organization of the United Nations: Rome, Italy, 1998. [Google Scholar]
  46. Rezaei Kalvani, S.; Sharaai, A.; Manaf, L.; Hamidian, A. Assessing ground and surface water scarcity indices using ground and surface water footprints in the Tehran province of Iran. Appl. Ecol. Environ. Res. 2019, 17, 4985–4997. [Google Scholar] [CrossRef]
  47. Smith, M.; Muñoz, G.; Van, H.G. CROPWAT: A Computer Program for Irrigation Planning Management (No. 46) Version 8.0; Food and Agriculture Organization of the United Nations (FAO): Rome, Italy, 1992; Available online: https://www.fao.org/land-water/databases-and-software/cropwat/es/ (accessed on 20 August 2023).
  48. Registro Público de Derechos de Agua (REPDA). Available online: https://app.conagua.gob.mx/consultarepda.aspx (accessed on 28 June 2023).
  49. Asociación de Productores y Empacadores de Aguacate en México (APEAM). Available online: http://www.apeamclima.org/index.html?fbclid=IwAR3POX_hvYXrh3FuVdG0UEoDg7-CkUXA2kwhB0FFfWhbsk6quDhOgnR279E (accessed on 10 May 2023).
  50. Saxton, K.E.; Rawls, W.J. “Soil Water Properties Characteristics” Hydraulic Properties Calculator; Universidad Nacional de la Plata: Buenos Aires, Argentina, 2009. [Google Scholar]
  51. Instituto Nacional de Estadística y Geografía (INEGI) Pedological Information. Available online: https://www.inegi.org.mx (accessed on 2 May 2023).
  52. Saxton, K.E.; Rawls, W.J. Soil Water Characteristic Estimates by Texture and Organic Matter for Hydrologic Solutions. Soil Sci. Soc. Am. J. 2006, 70, 1569–1578. [Google Scholar] [CrossRef]
  53. Rocha-Arroyo, J.L.; Salazar-García, S.; Bárcenas-Ortega, A.E.; González-Durán, I.J.; Cossio-Vargas, L.E. Fenología del aguacate “Hass” en Michoacán. Rev. Mex. De Cienc. Agrícolas 2011, 2, 303–316. [Google Scholar]
  54. Rocha-Arroyo, J.L.; Salazar-García, S.; Bárcenas-Ortega, A.E. Determinación irreversible a la floración del aguacate “Hass” en Michoacán. Rev. Mex. De Cienc. Agrícolas 2010, 1, 469–478. [Google Scholar]
  55. Salazar-García, S.; Zamora-Cuevas, L.; Vega-López, R.J. Actualización sobre la industria del aguacate en Michoacán, México. Calif. Avocado Soc. Yearb. 2005, 87, 45–54. [Google Scholar]
  56. Vizcaíno Ríos, E. Prebiótico, Bacillus Subtilis y Fosfito de Potasio Para el Control de Antracnosis y Calidad Postcosecha del Aguacate “Méndez”. Ph.D. Thesis, Colegio de Posgraduados, Montecillo, Mexico, 2021. [Google Scholar]
  57. Hoekstra, A.Y. A critique on the water-scarcity weighted water footprint in LCA. Ecol. Indic. 2016, 66, 564–573. [Google Scholar] [CrossRef]
  58. Pilevneli, T.; Capar, G.; Sánchez-Cerda, C. Investigation of climate change impacts on agricultural production in Turkey using volumetric water footprint approach. Sustain. Prod. Consum. 2023, 35, 605–623. [Google Scholar] [CrossRef]
  59. Burgos, A.L.; Anaya, C.; Solorio, I. Impacto Ecológico del Cultivo de Aguacate a Nivel Regional y de Parcela en el Estado de Michoacán: Definición de una Tipología de Productores; Centro de Investigaciones en Geografía Ambiental: Morelia, Mexico, 2011. [Google Scholar]
  60. Cossio-Vargas, L.E.; Salazar-García, S.; González-Durán, I.J.L.; Medina-Torres, R. Fenología del aguacate “Hass” en el clima semicálido de Nayarit, México. Rev. Chapingo Ser. Hortic. 2008, 14, 319–324. [Google Scholar] [CrossRef]
  61. Cruz-Pérez, N.; Santamarta, J.C.; Álvarez-Acosta, C. Water footprint of representative agricultural crops on volcanic islands: The case of the Canary Islands. Renew. Agric. Food Syst. 2023, 38, e36. [Google Scholar] [CrossRef]
  62. Orlove, B.; Caton, S.C. Water Sustainability: Anthropological Approaches and Prospects. Annu. Rev. Anthropol. 2010, 39, 401–415. [Google Scholar] [CrossRef]
  63. Liu, J.; Yang, W. Water sustainability for China and beyond. Science 2012, 337, 649–650. [Google Scholar] [CrossRef] [PubMed]
  64. Jiang, L.; Wu, Y.; Wang, J.; Wang, Z.; Jiang, Q. Scenario simulation and comprehensive assessment of water footprint sustainability system in Heilongjiang Province, China: A model combining system dynamics with improved radar chart approach. Ecol. Indic. 2023, 154, 110527. [Google Scholar] [CrossRef]
  65. Budds, J. Contested H2O: Science, policy and politics in water resources management in Chile. Geoforum 2009, 40, 418–430. [Google Scholar] [CrossRef]
  66. Aitken, D.; Rivera, D.; Godoy-Faúndez, A.; Holzapfel, E. Water scarcity and the impact of the mining and agricultural sectors in Chile. Sustainability 2016, 8, 128. [Google Scholar] [CrossRef]
  67. Danwatch, Reportaje Palta y Agua Robada. Fundación Heinrich Böll. Available online: https://cl.boell.org/es/2017/05/11/palta-y-agua-robada-reportaje-de-danwatch/ (accessed on 31 May 2023).
  68. Sánchez, M.M.; Carvacho, B.L. Aproximación a la determinación del déficit hídrico en la Región del Libertador General Bernardo O′Higgins, Chile, a partir de imágenes MODIS y datos meteorológicos. Rev. De Geogr. Norte Gd. 2013, 55, 109–124. [Google Scholar] [CrossRef]
  69. Wada, Y.; Van Beek, L.P.; Van Kempen, C.M.; Reckman, J.W.; Vasak, S.; Bierkens, M.F. Global depletion of groundwater resources. Geophys. Res. Lett. 2010, 37, L20402. [Google Scholar] [CrossRef]
  70. Budds, J. Securing the market: Water security and the internal contradictions of Chile’s Water Code. Geoforum 2020, 113, 165–175. [Google Scholar] [CrossRef]
  71. Caro, D.; Alessandrini, A.; Sporchia, F.; Borghesi, S. Global virtual water trade of avocado. J. Clean. Prod. 2021, 285, 124917. [Google Scholar] [CrossRef]
  72. Tetreault, D.; McCulligh, C.; Lucio, C. Distilling agro-extractivism: Agave and tequila production in Mexico. J. Agrar. Change 2021, 21, 219–241. [Google Scholar] [CrossRef]
  73. Papadopoulou, M.P.; Charchousi, D.; Tsoukala, V.K.; Giannakopoulos, C.; Petrakis, M. Water footprint assessment considering climate change effects on future agricultural production in Mediterranean region. Desalination Water Treat. 2016, 57, 2232–2242. [Google Scholar] [CrossRef]
  74. White, J.W.; Hoogenboom, G.; Kimball, B.A.; Wall, G.W. Methodologies for simulating impacts of climate change on crop production. Field Crops Res. 2011, 124, 357–368. [Google Scholar] [CrossRef]
  75. Olesen, J.E.; Trnka, M.; Kersebaum, K.C.; Skjelvåg, A.O.; Seguin, B.; Peltonen-Sainio, P.; Rossi, F.; Micale, F. Impacts and adaptation of European crop production systems to climate change. Eur. J. Agron. 2011, 34, 96–112. [Google Scholar] [CrossRef]
  76. Ochieng, J.; Kirimi, L.; Mathenge, M. Effects of climate variability and change on agricultural production: The case of small scale farmers in Kenya. J. Life Sci. 2016, 77, 71–78. [Google Scholar] [CrossRef]
  77. Álvarez-Bravo, A.; Salazar-García, S.; Ruiz-Corral, J.A.; Medina-García, G. Escenarios de cómo el cambio climático modificará las zonas productoras de aguacate “Hass” en Michoacán. Rev. Mex. De Cienc. Agrícolas 2017, 8, 4035–4048. [Google Scholar] [CrossRef]
  78. Jiang, T.; Sun, S.; Li, Z.; Li, Q.; Lu, Y.; Li, C.; Wu, P. Vulnerability of crop water footprint in rain-fed and irrigation agricultural production system under future climate scenarios. Agric. For. Meteorol. 2022, 326, 109164. [Google Scholar] [CrossRef]
  79. Charre-Medellín, J.F.; Mas, J.F.; Chang-Martínez, L.A. Potential expansion of Hass avocado cultivation under climate change scenarios threatens Mexican mountain ecosystems. Crop Pasture Sci. 2021, 72, 291–301. [Google Scholar] [CrossRef]
  80. Charre-Medellín, J.F.; Mas, J.F.; Chang-Martínez, L.A. Áreas potenciales actuales y futuras de los cultivos de aguacate Hass en México utilizando el modelo Maxent en escenarios de cambio climático. UD Y La Geomática 2019, 14, 26–33. [Google Scholar]
  81. Bravo, E.M.; de la Luz Sánchez, P.J.; Vidales, J.; Sáenz, J.; Chávez, J.; Madrigal, S.; Muñoz, H.; Tapia, L.; Orozco, G.; Alcantar, J.; et al. Impactos Ambientales y Socioeconómicos del Cambio de Uso de Suelo Forestal a Huertos de Aguacate; Instituto Nacional de Investigaciones Forestales, Agrícolas y Pecuarias (INIFAP) Centro de Investigación Regional Pacífico Centro: Uruapan, Mexico, 2009. [Google Scholar]
  82. Northey, S.A.; Mudd, G.M.; Saarivuori, E.; Wessman-Jääskeläinen, H.; Haque, N. Water footprinting and mining: Where are the limitations and opportunities? J. Clean. Prod. 2016, 135, 1098–1116. [Google Scholar] [CrossRef]
  83. Lovarelli, D.; Bacenetti, J.; Fiala, M. Water Footprint of crop productions: A review. Sci. Total Environ. 2016, 548, 236–251. [Google Scholar] [CrossRef]
  84. Naranjo, J.F.; Reyes, H. Huella hídrica del cultivo de aguacate cv. Hass (Persea americana Mill), en el Distrito de Conservación de Suelos Barbas-Bremen, Quindío, Colombia. Entre Cienc. E Ing. 2021, 15, 63–70. [Google Scholar] [CrossRef]
Figure 1. Location of the municipality of Ziracuaretiro. (A) The Packing and Exporting Association of Avocado Producers of Mexico (APEAM) weather station and (B) the private owner (Vizcaino family plantation) weather station.
Water 16 01719 g001
Figure 3. Monthly series of meteorological variables in the municipality of Ziracuaretiro (2012–2021). The 2018 data were omitted from the analysis due to the malfunction of the weather stations. For the temperature (top panel), mean monthly maximum temperature (red), mean monthly temperature (black), mean monthly minimum temperature (blue).
Water 16 01719 g003
Figure 4. Comparison of the WF of the municipalities of Ziracuaretiro and Uruapan according to the data presented in this communication and those reported by Gomez-Tagle et al. [15].
Water 16 01719 g004
Figure 5. Average blue and green water footprints (m3/ton) and standard error bar of the mean of the main avocado-producing countries and Michoacán [31], * Canary Islands [61], ** Uruapan municipality [15], and Ziracuaretiro municipality (this study). The global average blue and green water footprints are depicted as a red horizontal line.
Water 16 01719 g005
Table 2. Mean representative values of key physicochemical soil properties in avocado plantations in Ziracuaretiro municipality; soil organic carbon (SOC) and soil organic matter (SOM).
Depth
(cm)
Sand
(%)
Silt
(%)
Clay
(%)
Texture ClassBulk Density
(g/cm)
SOC
(%)
SOM (%)
0–2054.035.710.2sandy loam1.93.45.9
20–4070.014.815.2sandy loam1.61.11.9
40–6063.622.214.2sandy loam1.70.50.8
Table 3. Soil hydrophysical properties were estimated using the pedotransfer model [52] for different depths in representative soil of the avocado plantations in Ziracuaretiro municipality: permanent wilting point (PWP) and saturated hydraulic conductivity (Ks).
Depth
(cm)
Field Capacity
(vol/vol)
PWP
(vol/vol)
Saturation (vol/vol)Ks
(mm/day)
Available Water (%)
0–200.2170.0910.420633.512.6
20–400.2020.1090.431315.99.3
40–600.2090.1050.433366.910.4
Table 4. Avocado production in the municipality of Ziracuaretiro (2012–2021).
Rainfed ProductionIrrigated Production
YearPlanted Surface
(ha)
Production Volume (ton/Year)Crop Yield
(ton/ha)
Planted Surface
(ha)
Production Volume (ton)Crop Yield
(ton/Year)
2012750.007312.509.751620.0016,443.0010.15
20131195.0011,942.009.992395.0023,969.1610.01
20141255.0011,546.009.202515.0023,389.509.30
20151263.0011,872.209.402517.0025,894.1510.29
20161160.009744.008.403165.0031,818.0010.05
20171250.0010,625.008.503200.0033,498.0010.47
20191600.0014,597.509.123350.0036,871.5011.01
20201825.0016,758.159.183400.0040,800.0012.00
20211825.0016,940.009.283400.0041,140.0012.10
Mean1347.00
(±346.48)
12,370.82
(±3196.32)
9.20
(±0.51)
2840.22
(±614.29)
30,424.81
(±8533.73)
10.60
(±0.93)
Notes: Each municipality’s mean and total columns are presented, with the standard deviation in parentheses.
Table 5. Water requirement of avocado production in Ziracuaretiro (2012–2021); reference annual evapotranspiration (ETo), evapotranspiration of the crop (ETc), and irrigation requirement (IR).
YearTotal Rainfall
(mm/Year)
ETo
(mm/Year)
ETc
(mm/Year)
Effective Rainfall
(mm/Year)
IR
(mm/Year)
20121069.802017.282272.00735.201591.30
20131686.001865.572108.80887.901475.80
20141171.001980.712227.10794.101544.50
20151192.601840.402008.00842.401206.50
20161096.601979.582310.70803.901511.10
20171182.802134.402472.40706.601885.30
20191208.902387.562851.70752.701977.20
2020963.002487.332884.30621.402221.80
20211708.202401.902825.30796.802125.40
Mean1253.21
(±263.16)
2121.63
(±244.63)
2440.03
(±335.96)
771.22
(±78.41)
1726.54
(±339.77)
Notes: The mean values, and the standard deviation is in parentheses.
Table 6. Water footprint for rainfed production and irrigation in the municipality of Ziracuaretiro (2012–2021).
YearRainfed PlantationsIrrigated PlantationsMean WF for Rainfed and Irrigated Plantations
(m3/ton)
Green WF
(m3/ton)
Green WF
(m3/ton)
Blue WF
(m3/ton)
Total WF
(m3/ton)
2012754.05724.331567.782292.121523.08
2013888.79887.011474.332361.341625.06
2014863.15853.871660.752514.621688.89
2015896.17818.661172.501991.161443.66
2016957.02799.901503.582303.481630.25
2017831.29674.881800.672475.551653.42
2019825.33683.651795.822479.471652.40
2020676.91517.831851.502369.331523.12
2021858.62658.511756.532415.041636.83
Mean839.03
(±82.44)
735.40
(±116.09)
1620.40
(±216.56)
2355.80
(±157.45)
1597.41
(±81.09)
Notes: The mean values are presented, and the standard deviation is in parentheses.
Table 7. Annual water consumption for rainfed and irrigation avocado in the municipality of Ziracuaretiro (2012–2021).
YearRainfed PlantationsIrrigated PlantationsTotal Rainfed and Irrigated Plantations
(hm3)
Rainfall
(hm3)
Rainfall
(hm3)
Irrigation
(hm3)
Total
(hm3)
20125.5112.4025.7838.1843.69
201310.6121.3035.3456.6467.26
20149.9720.1938.8459.0369.00
201510.6423.2130.3653.5764.21
20169.3330.4547.8478.2987.62
20178.8327.8560.3288.1797.00
201912.0530.4366.2196.65108.69
202011.3427.6275.54103.16114.50
202114.5535.3272.26107.59122.13
Mean10.31
(±2.46)
25.42
(±6.87)
50.27
(±18.81)
75.69
(±24.77)
86.01
(±26.60)
Notes: The mean values are given, and the standard deviation is in parentheses.
Table 8. Irrigation water sustainability in the municipality of Ziracuaretiro (2012–2021).
YearTotal Blue WF
(hm3)
Surface Water Concession for Agricultural Use
(hm3)
Groundwater Concession for Agricultural Use
(hm3)
Total Concession
Water for Agricultural Use
(hm3)
Appropriation of Concessioned Water for Irrigated Avocado Production
(%)
201225.7836.571.0837.6468.48
201335.3436.881.1238.0092.99
201438.8436.881.1538.03102.15
201530.3636.881.1638.0479.82
201647.8436.881.2038.08125.64
201760.3236.881.3238.20157.92
201966.2141.671.5443.21153.23
202075.5441.871.8143.68172.95
202172.2641.871.8143.68165.45
Mean50.27
(±18.81)
38.49
(±2.49)
1.35
(±0.29)
39.84
(±2.76)
124.29
(±39.67)
Notes: The mean values are presented, and the standard deviation is in parentheses.
Disclaimer/Publisher’s Note: The statements, opinions and data contained in all publications are solely those of the individual author(s) and contributor(s) and not of MDPI and/or the editor(s). MDPI and/or the editor(s) disclaim responsibility for any injury to people or property resulting from any ideas, methods, instructions or products referred to in the content.

