Article

Carbon Emission Reduction of Reclaimed Water Use Substitution for Inter-Basin Water Transfer and Sustainability of Urban Water Supply in Valley Area

1
Faculty of Natural Sciences, University of the Western Cape, Cape Town 7535, South Africa
2
T.Y.Lin International Engineering Consulting (China) Co., Ltd., Chongqing 401121, China
*
Author to whom correspondence should be addressed.
Water 2024, 16(12), 1733; https://doi.org/10.3390/w16121733
Submission received: 30 May 2024 / Revised: 16 June 2024 / Accepted: 17 June 2024 / Published: 19 June 2024
(This article belongs to the Section Urban Water Management)

Abstract

:
Urbanization confronts the dual challenges of water scarcity and environmental degradation, prompting the exploration of diverse water sources for mitigating these impacts. Inter-basin water transfer (IBWT) has emerged as a solution to balance urban water demand and supply in areas with local water shortages. While IBWT can deliver high-quality water over long distances, it is costly, often contributing significantly to carbon emissions. Reclaimed water use (RWU) presents a promising alternative to address this dilemma. In this paper, a valley region of Chongqing municipality in Southwest China, which is confronted with water and environmental risks resulting from rapid urbanization, was explored and discussed as a case study to assess the potential impact of RWU on reducing carbon emissions as compared to IBWT. A method of accumulative accounting was adapted to calculate and sum up carbon emission intensities at various stages, revealing that the operational carbon emission intensities of IBWT and RWU are 0.7447 KgCO2/m3 and 0.1880 KgCO2/m3, respectively. This indicates that RWU substitution can reduce carbon emissions by 0.5567 KgCO2/m3 or 75%. This paper further elucidates the mechanism behind carbon emission reduction, highlighting the energy-saving benefits of using reclaimed water locally without recourse to extensive transportation or elevation changes. Additionally, this result presents three scenarios of reclaimed water use, including urban miscellaneous water, river flow replenishment, and agricultural irrigation in relation to their substitution effects and environmental impacts. Estimates of carbon emission reductions from reclaimed water use were projected at the planned scale, with the maximum potential of reclaimed water utilization predicted. Finally, this paper proposes an enhanced strategy to identify and prioritize factors affecting reclaimed water utilization and the effect of carbon emission reduction. This paper aims to facilitate the establishment of a robust legal, institutional, and managerial framework while fostering interdisciplinary and cross-sectoral cooperation mechanisms in valley urban areas. The methodology employed can be universally applied to other regions grappling with severe water stress, thereby facilitating endeavors toward carbon reduction and contributing significantly to the attainment of water sustainability.

1. Introduction

According to the World Cities Report 2020, 56.2% of the global population resides in cities, and this number is projected to surge to nearly 70% by 2050 [1]. This urban expansion, coupled with population growth and industrialization, is forecasted to drive a 55% increase in global water demand between 2000 and 2050 [2]. China, as a rapidly developing nation, exemplifies this phenomenon, experiencing a remarkable urbanization rate surge from 17.9% to 59.6% between 1978 and 2018. By 2030, it is anticipated that 70% of China’s population will reside in urban areas [3]. With a burgeoning population and industrial development, the demand for vital resources such as water has skyrocketed, exacerbating resource strains and water environmental pressures [4,5]. The surge in urban water consumption, coupled with the uneven spatial and temporal distribution of water, has accentuated a regional imbalance between water demand and supply, raising concerns about urban water security. Global climate change further exacerbates these disparities and heightens environmental governance uncertainties, prompting a critical reassessment of urban water supply sustainability and the exploration of alternative water sources to reconcile the supply–demand balance. Non-conventional water resources such as inter-basin water transfer, desalination, and reclaimed wastewater reuse have emerged as alternatives to or supplementary solutions for urban water supply augmentation.
Inter-basin water transfer (IBWT) infrastructure plays a crucial role in ensuring access to water by artificially transporting it across basin boundaries to areas of need [6,7]. This transfer involves moving water from one geographically distinct area within a river catchment or basin to another, or from one river reach to another, including intra-basin transfers [8]. IBWT serves as a mechanism for inter-regional water resource management, offering engineering solutions to reconcile conflicts between water demand and availability [6,8]. The United States has undertaken numerous IBWT projects since 1985, with a total of approximately 1905 projects having been established by 2017 [7], wherein the water conveyance system in the arid Las Vegas Valley (LVV), situated in Nevada, involves pumping water from a distant location 421 km away to alleviate water scarcity [9]. Similarly, China’s ambitious South-to-North Water Diversion Project, one of the largest IBWT initiatives globally, aims to address water shortages in the northern regions [8], marking a significant milestone in water resource management efforts. In addition to these large, inter-provincial water transfers, inter-regional water transfers in China are common in water-scarce areas.
Another alternative water resources solution is wastewater reclamation (WWR). Urban wastewater, a blend of water and residual materials from residential, commercial, and industrial sources connected to the collection system [10], serves as a carrier of materials and energy, especially as a “nutrient carrier” [11,12]. The separation of materials from wastewater presents an opportunity for resource recovery, enabling water reuse. Urban wastewater is increasingly recognized as a valuable resource by professionals [13], with reclaimed water use (RWU) emerging as a promising strategy to address water scarcity and enhance urban water-use efficiency, ensuring fresh water availability across various applications [14]. Among the factors driving RWU adoption [15], challenges stemming from water scarcity due to arid climate [16] or spatial and temporal water availability disparities are particularly pronounced [16,17,18]. Reclaimed water finds diverse applications [19], including urban miscellaneous water, agricultural irrigation, aquifer recharge, refrigeration in industrial processes, and even potable water supply [11,20]. In regions like Europe, Australia, and Taiwan, reclaimed water has become an alternative water resource, supplying non-potable water to commercial or industrial users, partially replacing drinking water, and enhancing water supply diversity [13,14,21]. In Singapore, reclaimed water ranks as the second urban water resource after primary freshwater [22]. Furthermore, wastewater treatment can be tailored to various standards to meet diverse urban needs. Consequently, substituting some potable water supplies with reclaimed water for non-potable purposes is a strategy to enhance urban water efficiency, reduce freshwater consumption, and significantly enhance water availability and sustainability. The future application scenarios of reclaimed water are expected to expand, provided that it is incorporated into urban planning from the outset of urbanization and corresponding strategies are formulated. Undoubtedly, this will significantly enhance the sustainability of urban water systems.
Water sustainability depends not only on availability but also on accessibility costs, encompassing both economic and environmental considerations. Enhancing a city’s environmental performance can significantly contribute to its sustainability [23]. Among environmental factors, the energy consumption of urban water systems has garnered increasing attention [24,25,26]. Economic costs of urban water systems arise mainly from energy consumption or the indirect energy consumption of materials used. Energy-intensive processes involved in the anthropogenic water cycle in an urban water system, encompassing water sourcing, transportation, purification, distribution, wastewater collection, treatment, and disposal, significantly contribute to greenhouse gas (GHG) emissions [9]. Understanding carbon emissions from urban water systems predominantly focuses on the water supply side, emphasizing water conveyance and treatment technologies [27]. Supply-side approaches prioritize options for reducing energy and material consumption to mitigate carbon emissions. For example, comparative studies of carbon emissions from IBWT versus desalination as water supply alternatives in the case of the Las Vegas Valley rendered the conclusion that, under specific energy mix conditions, IBWT presents a lower carbon solution [9]. Wastewater treatment plants (WWTPs), traditionally deemed as an environmental security provision, have been designed as final barriers to protect urban water against pollution [28]. The focus of addressing carbon reduction in wastewater treatment lies primarily in achieving the “net zero carbon” goal through process optimization and the utilization of renewable energy sources [29,30,31,32]. The reclamation and reuse of wastewater, often considered as an additional process in WWTPs [28], are perceived to potentially contribute to increased carbon emissions due to heightened energy consumption and emissions during tertiary treatment [33]. Moreover, the uncertainty surrounding the carbon offset potential of water reuse further complicates the situation [32]. From a supply perspective, once water from various sources is introduced into the urban water cycle, it makes little difference in the subsequent phases from the water in the traditional water supply model in terms of water property and usage. Thus, few studies have looked at the follow-up impact and changes brought by the urban water use regime. However, supply is required to satisfy certain demands. On the demand side, considering water use purposes and their mix is essential in managing carbon emissions, as different water systems yield varying emission effects [27]. As a decision-making process regarding water supply and system configuration is affected by the footprints of urban water systems, there exist trade-offs between the different water sources and the relationship between water, energy, and GHG emissions when choosing supply from multiple water sources in a given area [9]. Some researchers have found that wastewater reclamation may offer significant carbon emission reductions, but the magnitude of benefits varies across contextual scenarios [34]. Studies suggest that maximizing water reclamation may be preferable to desalination in coastal areas, considering energy consumption, GHG emissions, and energy costs [33]. Notably, the energy requirements and environmental impacts of urban water systems, as well as individual stages within them, are often site-specific [25,26,33], influenced by factors such as technology, treatment levels, transport distances, local geography, system efficiency, and water loss [26]. The utilization of adaptive methods to calculate the carbon emissions of a specific water system and develop a corresponding management strategy is an issue that warrants further discussion.
The selection of water resources and utilization patterns, along with the assessment of their environmental impacts, especially regarding carbon emissions, necessitates context-specific analysis based on individual cases. Traditionally, a focus of water resources management is often placed on resolving the conflict between water supply and demand by considering the water balance between “donor” and “recipient” basins [35]. This typically involves evaluating construction capital, operation, and maintenance (O&M) costs, and adjusting actual supply and demand through water pricing mechanisms. Additionally, societal and economic influences on water supply models play a significant role in water resource management and policy making [6,36,37]. Therefore, decision making in water resource projects has been dominated by considerations of capital and O&M costs, with little attention paid to environmental costs [9]. However, urbanization has escalated regional resource consumption and exacerbated water-related environmental pressures on natural ecosystems [5]. While the pollution and biodiversity aspects of environmental impact have received considerable attention [6,8], the challenges posed by global climate change to human society have increasingly brought carbon emission issues to the forefront of concern. As urbanization and climate change drive greater water demand, the choice of water resources becomes increasingly complex, particularly considering the accessibility of source waters that have an even stronger impact on its energy demand [33]. Proposed new water sources often entail higher energy requirements compared to traditional ones [38], thus exacerbating the energy–water dilemma [24]. Higher energy consumption leads to increased carbon emissions, while extreme weather events further intensify water stress, prompting the need for water acquisition over significant elevation drops and long distances [24,39], using more energy. A comprehensive analysis of the problem from both the supply and demand perspectives is essential in order to establish a closed-loop water cycle management system, which can provide more favorable support for strategy formulation.
The sustainability of urban water management encompasses several critical factors, including the availability and quality of water, as well as the overall sustainability of water utilization practices, which have been extensively explored. The substitution of freshwater resources with reclaimed water has garnered considerable attention from researchers recently [14], but studies primarily focus on water resource availability and the effectiveness and efficiency of water use [40]. However, few studies have delved into reclaimed water as an alternative to inter-basin transferred water (IBTW), particularly from the perspective of carbon emissions. This paper hypothesizes that substituting IBTW with reclaimed water could enhance urban water-use efficiency and mitigate adverse environmental impacts by reducing carbon emissions. The present paper investigates the benefits of carbon emission reduction (CER) of reclaimed water substitution for IBTW as an urban water supply source in a valley region undergoing urbanization. Employing a specific methodology, this paper evaluates the carbon reduction effect of reclaimed water substituting IBTW and analyzes the underlying carbon reduction mechanism. To identify the most environmentally favorable options for simultaneously mitigating water stress and reducing carbon emissions [41], three scenarios based on the multipurpose use of reclaimed water—urban miscellaneous water (UMW), river flow replenishment (RFR), and agricultural irrigation (AGI), and different levels of planned and potential scale of reclaimed water use are evaluated and compared. The paper reveals the carbon emission characteristics of the valley urban water system, and identifies site-specific factors influencing reclaimed water substitution (RWS) and carbon emission reduction, laying the foundation for proposing improvement strategies for the valley area. The methodology employed can be universally applied to other regions grappling with severe water stress, thereby facilitating endeavors toward carbon reduction and contributing significantly to the attainment of water sustainability.

2. Materials and Methods
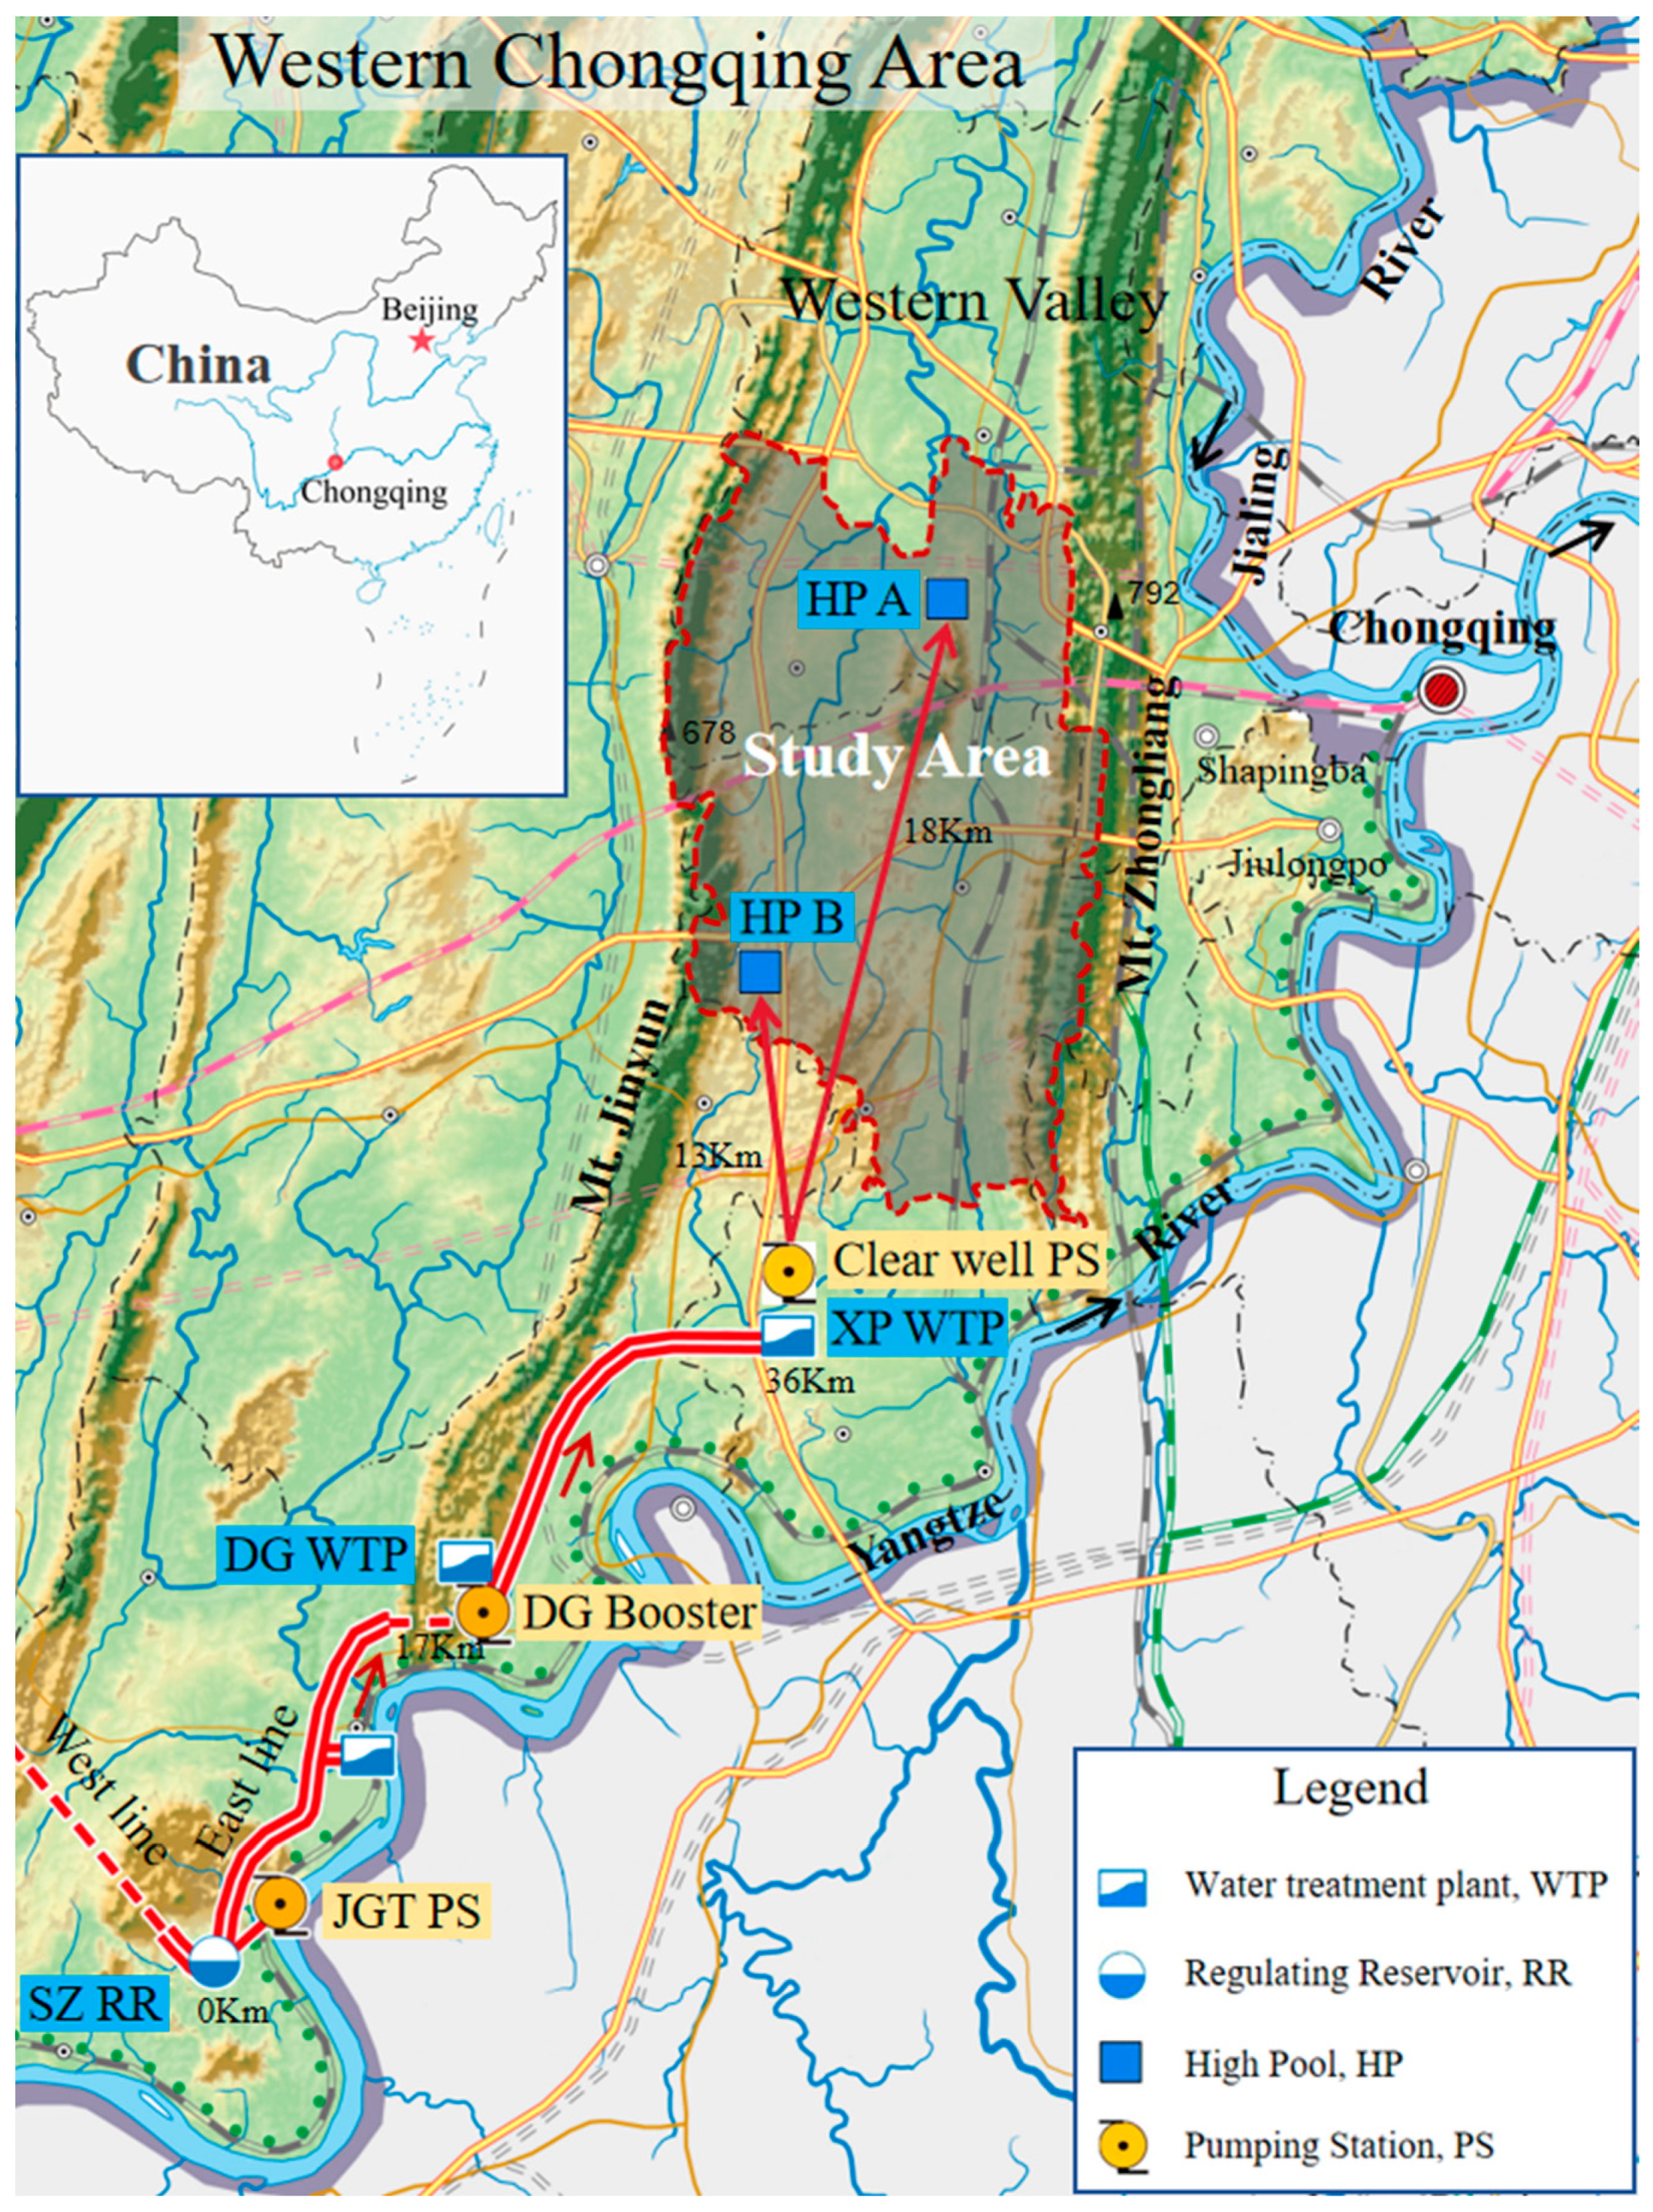
2.1. Study Area

The selected study area is situated in the Western Valley of Chongqing, proposed as a new site for urban development (Figure 1). Chongqing municipality, a prominent mega-city in southwestern China, boasts a distinctive mountainous landscape, which is globally recognized. It comprises several satellite city regions located along north–south valleys, with the confluence of the Yangtze River and the Jialing River at its core center. The study area, nestled between Mt. Zhongliang and Mt. Jinyun on a plain land, is earmarked for the establishment of a new type of urban infrastructure tailored to accommodate high-technology industries. Numerous valley cities worldwide encounter challenges of water scarcity [9,42,43]. Characterized by karst landforms and hydrological settings, the local water resources within the catchment of the Western Valley are insufficient to meet the future urban water demands required by such a development. Moreover, in mountainous urban regions like this, land resources are exceptionally scarce and valuable compared to water resources. Thus, a strategy of constructing highly concentrated urban industrial and residential areas sandwiched in between the mountains is chosen to optimize land-use efficiency. The envisioned urban area, as per the Urban Master Planning, is anticipated to be densely populated, with an average population density exceeding 10,000 persons per square kilometer. Such a high population density will substantially escalate water usage intensity, exacerbating pressure on already limited water resources. The selection of this area is based on the following considerations:
  • The Western Valley is emblematic of the severe water scarcity challenges facing many urban valley regions in Chongqing. The average annual water resource per capita in Chongqing stands at 1882 m3/cap·a, below the national average of 2187 m3/cap·a. In the western Chongqing region, which includes the Western Valley, this figure further plummets to 581 m3/cap·a. This places the region just above the absolute water scarcity threshold, as defined by the indicator proposed by Falkenmark and widely adopted worldwide [44,45,46,47].
  • To meet the challenge of water scarcity, multiple water sources have been planned for the area. However, during urbanization, significant portions of local water resources intended for agricultural and ecological purposes were diverted for urban water consumption, posing risks to the aquatic environment. Inter-basin water transfer has been identified as the primary alternative water source solution for urban water supply in this region according to the Master Planning. This initiative is estimated to restore over 1.8 billion cubic meters of water annually for agricultural and ecological purposes, as per the Environmental Impact Assessment (EIA) estimates. Additionally, reclaimed water has been designated as an additional water source in the region in the planning. Reclaimed water of varying quality is planned to serve multiple purposes, and exploring diversified application scenarios can provide valuable decision-making insights for policymakers, although the specific amount or proportion of each use is not specified in the planning.
  • In a developing urban area, ample opportunities exist to explore innovative solutions to alleviate urban water pressure and mitigate environmental impacts. Importantly for this research, abundant data and information are available from documents such as relevant Planning Reports, associated Feasibility Study Reports (FSR), or EIA reports. Furthermore, in the context of a planned future town, numerous scenarios with their parameters can be reasonably assumed to support comprehensive analysis and decision-making processes.

2.2. Calculation Model

2.2.1. System Description, Study Boundaries, and Scenarios

The IBWT system implemented in the study area is a crucial component of Chongqing’s extensive long-distance water diversion project, designed to convey raw water from the Yangtze River to the Western Chongqing region. The JGT pumping station (PS) serves as the initial abstraction point, drawing raw water from the Yangtze River and diverting it to the SZ reservoir for storage and capacity adjustment. From the SZ reservoir, a portion of the water is diverted to the DG booster pumping station via the East line through gravity flow. Subsequently, it is pumped to the XP water treatment plant (WTP) for purification processes. Once purified, the water is lifted by pumping stations from the water plant clear well to high water pools termed A and B. From there, it is distributed to urban consumers for various urban uses through reticulation systems (Figure 1 and Figure 2). In the urban water cycle, used water, commonly known as sewage or urban wastewater, is collected by municipal sewer networks and directed to the urban wastewater treatment plant (WWTP). Typically, the effluent out of secondary treatment can be discharged directly into the watercourse, Liangtan River. However, for reuse purposes, the treated wastewater requires further treatment through tertiary treatment before it can be pumped to the city’s water users. The entire urban water cycle is depicted in Figure 2.
Figure 2. Functional flow chart of inter-basin water transfer and urban water supply/wastewater reclamation system.
Water 16 01733 g002
To study the substitution effect of RWU on IBWT, it is essential to delineate the calculation boundaries of the two subsystems to ensure equivalence of the carbon counting. For the IBWT system, all stages from water abstraction to the high pools are encompassed. Conversely, even in the absence of reclaimed water use, it is mandatory for all urban wastewater in Chongqing to undergo secondary treatment to meet a specific standard, typically Grade I-A, before being discharged into the watercourse. Therefore, the recognized boundary of the RWU system includes stages after secondary treatment, specifically tertiary treatment and reclaimed water supply pumping stations. The energy consumption in these processes is considered as the incremental part for utilization of reclaimed water substituting inter-basin transferred water. Notably, the energy consumption associated with secondary treatment and sewage collection and transportation before tertiary treatment is regarded as “sunk costs”, and these are excluded from the calculation boundary (Figure 2). In addition, energy consumption at the water supply or reclaimed water end-use stages is also excluded from the analysis, as it is primarily influenced by water-use behavior and knowledge [33], or it can be assumed to have similar energy consumption in both subsystems, thus exerting no discernible influence on the analysis results.
Notably, reclaimed water can serve multiple purposes [15,19,20,48,49], which aligns with the “fit-for-purpose” advantage of reclaimed water utilization [21,50]. Due to diverse water quality requirements based on urban management needs [22], treatment processes, energy consumption, and consequent carbon emissions vary accordingly [27,33]. Three scenarios of reclaimed water use for different purposes are considered: urban miscellaneous water (UMW, scenario 1), river flow replenishment (RFR, scenario 2), and agricultural irrigation (AGI, scenario 3). The river in the basin might serve as the ultimate discharge channel of the urban water cycle. However, augmentation of environmental flow is necessary in the dry seasons, while receiving treated municipal sewage is the year-round function of the valley river. Therefore, RFR serves as a controlled reuse of reclaimed water to augment river flow, addressing the uneven spatial and temporal flow of a valley river, particularly crucial during dry seasons. The water resource effect and environmental impact of the two purposes of RWU, effluent discharge and RFR, are dissimilar. UMW usually has a perennial urban demand. As a new urban water source, reclaimed water can be used for various purposes, especially when water is not of potable quality. UMW is cost-effective and consumes less energy as compared to potable water, and has a significant impact on the urban water cycle [51]. The environmental impacts of reclaimed water utilization substituting IBWT in the Western Valley concern us the most in the present assessment. To make the study more comprehensive, AGI is also taken as a scenario. This hypothesis would be reasonable if considering that a lot of farmland should be reserved for future urban agriculture in the valley as per the Master Planning. Reclaimed water for AGI has long been recognized as a sustainable means of recycling resources from urban wastewater [51,52,53], requiring minimal treatment to meet AGI water quality standards than river recharge [51] or urban miscellaneous use. The study scenarios are depicted in Figure 2, and the water quality requirements for various reclaimed water uses are outlined in Table 1. Notably, Grade I-A as S2 in Table 1, the common standards of effluent discharge, is included as a comparison scenario to compare to S2*, the latest requirement for effluent standards discharge into Liangtan River. The design configurations and main components of the IBWT subsystem are detailed in Table 2, and those of the RWU subsystem are elaborated in Table 3. In Table 3, the stages in brackets, namely, secondary treatment and preceding stages, are excluded from the energy consumption and carbon emission calculation.
Table 1. Water quality standards for different uses of reclaimed water.
CategoriesBOD
(mg/L)
COD
(mg/L)
NH3-N
(mg/L)
TN
(mg/L)
TP
(mg/L)
Fecal ColiformScenarios
UMW ab10/5///
c8 S1
RFR for Liangtan Riverd10301.5 (3 e)150.31000S2*
AGI fg60150///40,000S3
h100200
i4010020,000
j156010,000
Grade I-Ak10505 (8 m)150.51000S2
Notes: a, Urban wastewater reclamation and utilization of urban miscellaneous water quality; b, Toilet flushing, vehicle washing; c, Road cleaning, urban greening, firefighting, construction; d, Discharge standard of main water pollutants of urban wastewater treatment plant in LT River basin, DB50/963-2020, local standard; e, The value in parentheses is for lake and reservoir; f, Water quality standard for agricultural irrigation, GB5084-2021, national standard; g, Wet crop; h, Dry crop; i, Processing, cooking, and peeling vegetables; j, Raw eaten vegetables, melons, and herbal fruits; k, Pollutant discharge standards for urban wastewater treatment plants, GB18918-2002, national standard; m, The value outside parentheses is water temperature > 12 °C, the value in parentheses is the control index when the water temperature is ≤12 °C. Abbreviations. BOD: Biological oxygen demand; COD: Chemical oxygen demand; TN: Total nitrogen; TP: Total phosphorus; UMW: Urban miscellaneous water; RFR: River flow replenishment; AGI: Agricultural irrigation. S2*, Represents the same process as S2 but with different standards. The Standards presented here are available on request from the corresponding author due to all of them are in Chinese.
Table 2. Design configuration and the main components of the IBWT system.
Facilities or UnitsUnit FunctionCE Source Type
JGT pumping stationWater intake from Yangtze RiverEnergy (Table 4)
SZ ReservoirWater regulation and storage-
DG BoosterWater lifting and transferEnergy (Table 4)
XP Water Treatment PlantWater purificationChemical and Energy (Table 4)
Clear well pumping stationWater distribution to urban consumerEnergy (Table 4)
High Pool AWater storage and pressure stabilization-
High Pool BWater storage and pressure stabilization-
Table 3. Design configuration and the main components of the RWU system.
Facilities or UnitsUnit FunctionScenarioCE Source Type
Sewage collectionSewage collection and transportation(S1, S2, S3) aEnergy (Table 5)
Primary treatmentPhysical treatment(S1, S2, S3) bEnergy (Table 5)
Secondary treatmentBiological, chemical, and physical treatment(S1, S2, S3) cChemical and Energy (Table 5)
Tertiary treatmentBiological or chemical and physical treatmentS1, S2*Chemical and Energy (Table 5)
Reclaimed water PSReclaimed water supplyS1, S3Energy (Table 5)
Note: a,b,c The stages in brackets are not included in excluded from the energy consumption and carbon emission calculation, as discussed earlier; S2*, Represents the same process as S2 but with different standards.
Table 4. Energy and Carbon emission intensity of IBWT and its distribution in each stage.
StageJGT PSDG BoosterXP WTP Elec. & Chem.Clear Well PSTotal CEIIBWT
EI
(kW∙h/m3)
0.43280.4221 To high pool A: 0.4451
To high pool B: 0.2182
CEI
(KgCO2/m3)
0.22730.22190.1727To high pool A: 0.23400.8559
To high pool B: 0.11470.7336
Note. EI: Energy intensity; CEI: Carbon emission intensity.
Table 5. Carbon emission intensity of RWU and its distribution.
StagePrimary TreatmentSecondary TreatmentElectricityChemicalsRW Supply PSTotal CEIRW
CEI
(KgCO2/m3)
S1--0.04300.0764BH: 0.04930.1687
JF: 0.10820.2276
XY: 0.05130.1707
BSY: 0.05910.1785
S2--0.0430 *0.0764 *
S3-- *--Not calculated
Note. CEI: Carbon emission intensity; Figures with “ *” are for scenario S2*.
According to the life cycle assessment (LCA) method, the direct and indirect energy, chemicals, and material consumption across all processes and life cycle stages within the study boundary should be included, from construction to operation, and finally dismantlement [10,26,33,54]. However, our study is primarily focused on the operational phase of the two subsystems. This includes operational energy consumption, as well as chemical and material consumption during operation. Existing studies suggest that operational energy often outweighs embodied energy [24], and for both energy consumption and carbon footprint, the contribution from the operation phase (90%) is significantly higher than the construction phase (10%) from a life cycle perspective [29]. Given the predominance of operational energy consumption and associated carbon emissions, focusing on this phase allows for a meaningful comparison between the two subsystems. Moreover, data availability for operational energy consumption are more accessible, simplifying the assessment. The energy and material consumption in the other stages are also considered “sunk costs.”

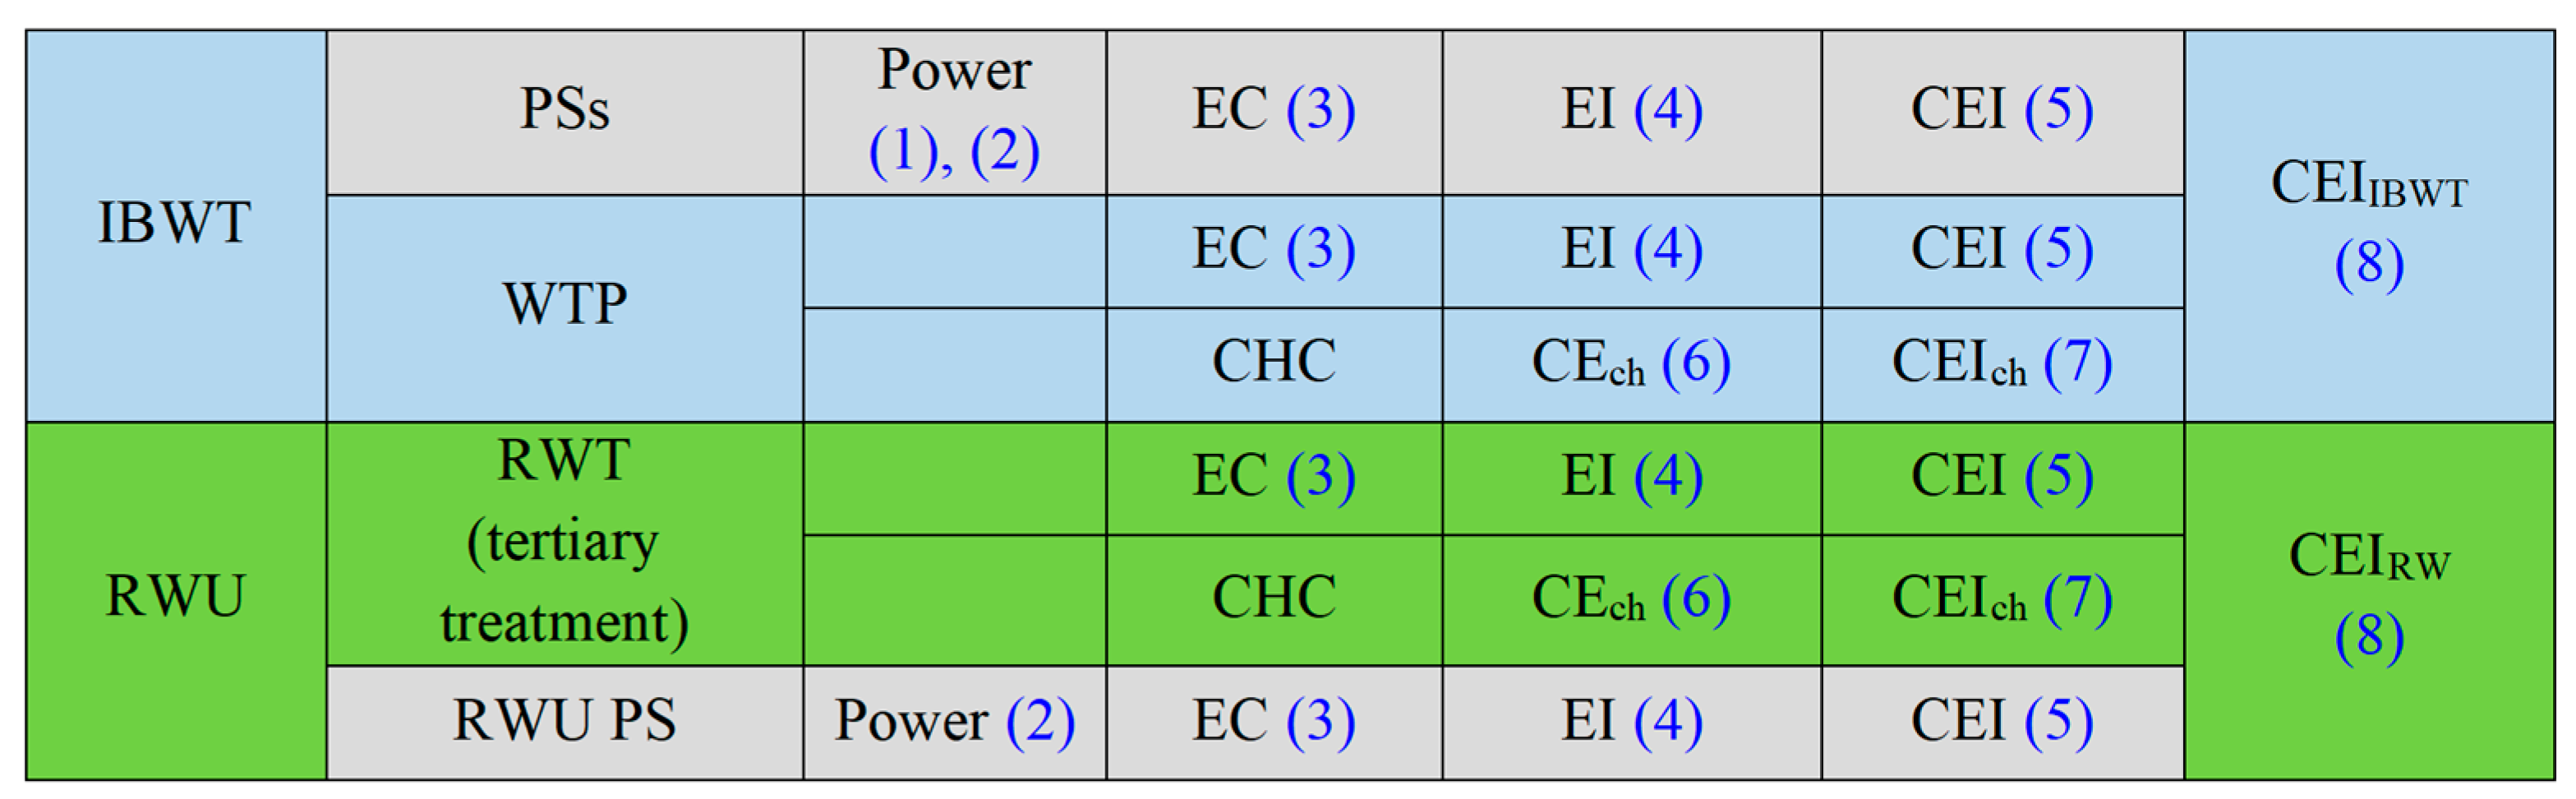
2.2.2. General Description of Accumulative Accounting for Carbon Emission

In assessing the carbon emissions of the urban water cycle, energy and chemical consumption during the operational phase play a significant role. Carbon emission intensity (CEI) is selected as an indicator for scenario analysis. Given that the scope of facility services varies across different stages of IBWT, in the case at hand, the calculated flow rates in each stage also differ. In this paper, the total energy consumption and carbon emissions will be determined based on the total capacity or flow rate of facilities in each stage. These values will then be divided by the calculated flow rates or the capacity or total amount of water to allocate them to each cubic meter of water, yielding energy or carbon emission intensities for each stage [23]. Subsequently, the energy or carbon emission intensities of each stage will be summed to obtain the unit operational energy or carbon footprints for the entire IBWT project [55,56]. Similarly, the energy and chemical consumption of RWU and associated CEI can be evaluated using the same approach. The difference between CEIs of RWU and IBWT represents the amount of carbon reduction achieved by one cubic meter of assumed RWU substituting for IBWT water. This carbon reduction can then be utilized in scenario comparison.

2.2.3. Computational Formulae

In this paper, the calculation of carbon emissions primarily revolves around two main factors: energy consumption and chemical consumption. The availability and granularity of data play a crucial role in determining how these factors are calculated.
(i).
Energy and carbon emission intensities of pumping station
In this paper, the power data of pumping stations can be obtained through three different methods, depending on data availability. If the power is directly provided, the energy consumption (EC) of a pumping station can be straightforwardly calculated based on its given power (Ps). Alternatively, when the design flow and pump head of the pumping station are accessible, the power can be directly calculated according to the flow and head parameters, as specified by Equation (1). However, in cases where the design data of the pumping station are unavailable, another method is utilized. This method involves calculating the power based on the flow rate, total dynamic head, and the efficiency of the pumping station [9], as described in Equation (2).
Ps = γgQHp
where Q is the designed flow rate of the current stage (m3/s); Hp is the designed pump head (m), while pump station efficiency is already included in the pump head.
P s = γ g Q H 1000 η
where E is the energy consumption (Kw·hr); γ is the specific weight of water (9.8 Kg/m3); g is the acceleration of gravity (9.8 N/Kg); Q is the flow rate (m3/s); H is the total dynamic head (m) including the static head and pipe head loss, while pipe head loss includes frictional head loss and local head loss, which can be calculated with pipe/channel length; and η is the overall pumping station efficiency, including pump efficiency and motor efficiency. An overall efficiency of 70% is assumed in the present paper.
Subsequently, energy consumption (EC, Kw∙h/d) can be calculated directly with the pump station power and operating hours as shown in Equation (3).
EC = PsTop
where Ps is the total power of the pumping station (Kw); Top is operating hours (hr/d).
Here, the common formulae for calculating the energy consumption of the pumping station are given, which can be referenced for similar research.
Energy intensity (EI, Kw∙h/m3) is the energy consumed per cubic meter of water in a pumping station, calculated by dividing the energy consumption by the water flow of the pumping station, as shown in Equation (4). Finally, the carbon emission intensity (CEI, KgCO2/m3) of the pumping station is the product of EI and the carbon emission factor, as shown in Equation (5).
EI = EC/Q
CEI = EI·e
where Q is the total amount of water flow at a certain process or stage in a certain period, that is, a pumping station (m3/d), for example; and e is the carbon emission factor (KgCO2∙kW−1∙h−1), representing the amount of carbon emitted per unit of energy consumption. Carbon emission factor is a region-specific parameter, determined by the local energy mix.
(ii).
Energy and carbon emission intensity of treatment, in WTP or RWT
The carbon emissions in WTP and reclaimed water treatment (RWT) primarily mainly stem from energy consumption, specifically electricity consumption and chemical consumption. The energy consumption and consequent carbon emissions in the water treatment processes are derived from the power consumption of various water treatment facilities, including aeration, stirring, lifting, etc. These can be calculated based on the designed power and operation time of the facilities, as outlined in Equations (3)–(5). Carbon emission from chemical consumption (CEch, KgCO2/d) in the treatment process is determined by the product of the specific chemical consumption (CHC, t/a) over a certain period and the carbon emission factor (ech) associated with the chemical. For a specific process, the carbon emissions can be calculated as the sum of all emissions from the chemicals consumed in that process, computed using Equation (6).
CEch = ∑CHCi·ech i
where CHCi is the consumption of a chemical i (Kg), depending on the processes and the technology used, usually designed; ech i is the carbon emission factor of this chemical, usually based on the official recommended value (KgCO2/Kg); and CEch is the total carbon emission of chemical consumption of the treatment process in which these chemicals are used (KgCO2).
Therefore, the carbon emission intensity of chemical consumption can be calculated with
CEIch = CEch/Q
where Q is the total amount of water flow in a certain process or stage.
Finally, the total carbon emission intensity of IBWT or reclaimed water system is the sum of energy and chemical carbon emission intensities in all the stages or facilities in the calculation boundary.
CEIIBWT or CEIRW = ∑(CEI + CEIch)
Based on the actual consumption of water or the amount of reclaimed water used, the carbon emissions of water consumption or reclaimed water utilization can be calculated.

2.3. Data Sources and Inventory Analysis

The above assessment is based on valid data and inventory information, which mainly come from officially approved documents at various levels, as well as related technical standards.
  • Data such as the size of the study area, population, scales of water consumption, and WWTPs are sourced from planning reports, such as the Master Planning and Specialized Planning for Water Environment Control.
  • The configuration and main components of the IBWT system, urban water supply system, and related parameters were extracted from the EIA Report of the Water Resources Allocation Project in West Chongqing and the EIA Report of XP Water Treatment Plant, which are publicly disclosed on the government website.
  • The parameters of the secondary and tertiary treatment processes of the WWTPs were obtained from the Feasibility Study Report (FSR) of the WWTPs. For the UMW supply pump, as it was not included in the report, parameters were estimated based on the planned treatment scale, serving area, and elevation range of the reclaimed water supply.
  • Water quality parameters are sourced from national or local standards, documented in the notes of Table 1.
  • Carbon emission calculation methods and carbon emission factors are derived from the “Guidelines for Carbon Accounting and Emission Reduction in the Urban Water Sector”, organized by the China Urban Water Association and published by IWA in 2024 [57].
  • The remaining data were gathered from publicly available information on government websites, including news reports.

3. Results and Discussions

The carbon emissions of the IBWT and RWU subsystems in the selected area are calculated based on the processes and boundaries presented in Figure 2, using the methods outlined in Figure 3, respectively. A comparative analysis is then conducted. Building upon these findings, we investigate the mechanisms for reducing carbon emissions through reclaimed water substitution and examine the impact of different levels and applications of reclaimed water utilization. Furthermore, this section delves into prioritizing various uses for reclaimed water while identifying factors that influence its utilization.

3.1. Carbon Emission Reduction of Reclaimed Water Substitution for Inter-Basin Water Transfer

Using the data and formulae in Section 2, we calculated the individual CEI of each stage and the total CEI of the IBWT and RWU subsystems (Table 4 and Table 5).
The results reveal that the carbon emission intensities of water from the IBWT system are 0.8559 and 0.7336 KgCO2/m3, respectively depending on whether the water is transferred to high pool A or high pool B to supply water to area A or B of the study area (Table 4). The weighted average is calculated to be 0.7447 KgCO2/m3. This indicates that for every 1 m3 of urban water consumption, there would be 0.7447 Kg equivalent of CO2 emissions, or expressed as “CO2-e.” This value is notably higher than that of the potable water provision as in the case of eThekwini Municipality (Durban), South Africa [23]. Table 4 also illustrates the distribution of carbon emissions in stages of IBWT. Approximately 78% of CEI is attributed to water abstraction, transport, and lifting, which are the main energy consumption processes. Meanwhile, water purification in WTP accounts for 22% of CEI, which is relatively low for a water treatment system [58].
In the study area, there are planned to be four water reclamation plants, namely, BH, JF, XY, and BSY, each serving a different area with its own reclaimed water supply pumping station. The calculated carbon emission intensities of the reclaimed water supply range from 0.1687 to 0.2276 KgCO2/m3 (Table 5), with a weighted average of 0.1880 KgCO2/m3. This value is significantly lower than that of IBWT, approximately equivalent to 25% of the carbon emission intensity of the water supply from IBWT. It indicates that for the study area, the use of reclaimed water to substitute water from IBWT would be a carbon reduction process. The unit carbon emission reduction of reclaimed water substitution for IBTW is
CER unit = CEI IBWT CEI RW = 0.7447 0.1880 = 0.5567 KgCO 2 / m 3 .
This means that for every 1 m3 of reclaimed water substitution for water from IBTW, there would be about 0.5567 KgCO2/m3 or 75% less in carbon emissions, showing a significant carbon reduction effect.

3.2. Mechanism of Carbon Reduction Effect of Reclaimed Water Utilization

The result of the carbon emission composition analysis highlights that the carbon emissions of the IBWT system primarily stem from the energy consumption of pumping stations along the water path, which are mainly used for water lifting and overcoming water head loss along the route. This is because, from the intake point, raw water has to undergo a significant elevation lift of about 228 m and be transferred over 36 km to WTP and an additional 13 or 18 km to the high pools. The carbon intensity of the water purification process within the IBWT subsystem, or when compared to other water treatment systems [58], is comparatively low. This could be attributed to the relatively high quality of the raw water sourced from the Yangtze River, which typically meets or exceeds the national surface water standard Class II. Consequently, the treatment requirements and associated energy consumption and costs for water purification are relatively low. This underscores the advantage of utilizing Yangtze River water as raw water for urban potable water supply.
RWU processes reveal that the primary sources of carbon emissions stem from energy and chemical consumption during the tertiary treatment of wastewater. This is particularly evident when considering only the tertiary treatment phase, as previous stages are regarded as “sunk costs”. The distributed layout of the reclaimed water plants makes them much closer to reclaimed water users [24]. The energy consumption of the UMW supply pumping station is much lower than that of the water supply pumping station. Even though the tertiary treatment for wastewater reclamation is always considered to have high energy consumption and subsequent carbon emissions [24,33], the overall energy consumption and carbon emissions associated with RWU remain significantly lower compared to those of IBWT in this case.
The water conveyed through the IBWT system undergoes multiple stages of extraction, transportation, and processing, and accumulates potential energy. Releasing this water hurriedly back into the Yangtze River through its tributaries without maximizing its utility results in significant energy dissipation and wastage, leading to heightened carbon emissions. In contrast, reclaimed water utilization reintegrates water with inherent energy back into the urban water cycle, forming a closed loop (Figure 2). This approach enables water to be reused iteratively [14], thereby conserving energy and reducing the need for additional chemicals required to supply water from a raw water source [29]. By facilitating resource reuse, energy conservation, and carbon reduction simultaneously, reclaimed water serves as a sustainable alternative. It can effectively replace a comparable volume of fresh potable water sourced from IBWT for various advantageous purposes [14,17], showing the highest sustainability [8,33].
The result seems to be tailored to a specific site [34]; however, the high energy consumption associated with water supply is already a common phenomenon influenced by factors such as the distance of water abstraction, local topography, and urban characteristics [26,59]. Despite its site-specific nature, the findings could universally offer valuable insights for informing local policy-making decisions.

3.3. Reclaimed Water Substitution Effects and Environmental Impacts of Different Scenarios

Urbanization cements the pressing need for a reliable, high-quality water supply that can sustain economic activities, support societal needs, and safeguard ecological systems simultaneously [60]. Urban areas generate a substantial volume of wastewater, which can serve as a valuable resource for recycling. Reclaimed water, available in varying qualities, opens up diverse application possibilities and enhances the efficiency and sustainability of urban water resources. By substituting reclaimed water for IBWT water, cities can allocate fresh water resources to more beneficial uses, thereby optimizing resource utilization [14,17]. The mode of reclaimed water use, along with the intended purposes and respective proportions, significantly influences the substitution effects and, in turn, carbon emission reductions. These dynamics are captured in the three possible scenarios S1, S2, and S3—as outlined for the study area.
(i) Substitution effects of UMW: Reclaimed water can be integrated into the supply system, typically through separate distribution lines [61] or dual-pipe systems [15,21], and utilized as UMW. In the study area, UMW is intended for various purposes such as toilet flushing, street cleaning, car washing, gardening, irrigation for afforestation, construction, and industrial activities. Without reclaimed water, these uses would necessitate potable water from IBWT. Therefore, reclaimed water used for UMW will fully substitute an equivalent amount of inter-basin transferred water (IBTW).
(ii) Substitution effects of RFR: In mountainous urban areas, the seasonal distribution of river flow can be highly uneven, necessitating additional water replenishment during dry months (typically from November to April) to maintain the environmental flow of the Liangtan River, ensuring its dynamic conditions and self-purification capacity. Effluent from WWTPs in the valley could serve as a stable source for replenishing river flow. If the WWTP effluent meets national discharge standards (Grade I-A), requiring no additional treatment beyond secondary treatment and no extra energy for pumping, this represents scenario 2. However, the latest Discharge Standards of Main Water Pollutants of Urban Wastewater Treatment Plant in Liangtan River Basin, DB50/963-2020, elevate water quality higher than Grade I-A, necessitating additional energy and chemicals for treatment to meet higher standards for RFR, as in scenario 2* (Table 1), thereby increasing carbon emissions. Both scenarios 2 and 2* do not involve the substitution of IBWT, instead, the energy contained in the water is dissipated in the river. Moreover, high return flow ratios (>40% [33], can significantly impact river environments [60] and pose higher risks [33]. Nevertheless, river replenishment remains necessary for ecological restoration during dry seasons, albeit without affecting IBWT substitution. Additionally, Table 1 reveals that the quality indexes of reclaimed water for RFR are slightly superior to those for UMW, allowing direct use for miscellaneous urban purposes without further treatment. Even the energy and chemical consumption involved in tertiary treatment can be considered as “sunk costs” in this scenario, thereby further emphasizing the advantages of utilizing recycled water.
(iii) Substitution effects of AGI: In the vision of creating a garden-city in the valley area, a significant portion of farmland will be preserved in peri-urban areas as part of the future urban ecological landscape. Reclaimed water for AGI capitalizes on the proximity of urban sewage production to rural treated wastewater consumption for AGI [61]. The quality of reclaimed water for AGI only needs to meet the national Water quality standard for AGI (Table 1), which is significantly lower than those for UMW and RFR. This reduces both energy and chemical consumption in water treatment, only necessitating disinfection, with minimal pumping energy consumption, if required. The organics and nutrients, such as nitrogen and phosphorus, present in the reclaimed water are assumed to be decomposed or absorbed harmlessly by crops and soil. Additionally, using reclaimed water for AGI can substitute some high-quality rainwater stored in upstream reservoirs planned for irrigation purposes to replenish river flow. Therefore, reclaimed water use for AGI represents a low-carbon process with integrated environmental and ecological benefits.

3.4. Reclaimed Water Substitution Levels and Its Potential for Carbon Emission Reduction

It appears from the preceding analysis that increased utilization of reclaimed water leads to greater substitution of IBWT water, resulting in a corresponding increase in carbon emission reduction. To assess the overall carbon reduction impact of reclaimed water substitution, we conducted estimations across various substitution levels, considering both short-term and long-term planning scales for reclaimed water use in the study area. Additionally, we examined the maximum potential of reclaimed water utilization. The study area encompasses 313 km2, inclusive of surrounding farmlands and forest reserves, with a current population of 610,000. By 2035, the population is projected to reach 750,000. As reclaimed water replaces IBTW, the carbon emission reduction is determined by multiplying the unit carbon emission reduction by the volume of reclaimed water use, QRWU.
CER = CERunit·QRWU
(i) Planned levels of reclaimed water use. Given the estimates for urbanization based on short-term and long-term planning, the urban domestic wastewater treatment capacity is projected to reach 211,000 m3/d in 2025, with 65,000 m3/d of reclaimed water reuse. By 2035, the water supply scale is expected to increase to 570,000 m3/d, while the urban wastewater treatment capacity would be 361,000 m3/d, with 160,000 m3/d of reclaimed water (equivalent to 28% of the water supply) being reused. This translates to a utilization rate of reclaimed water of about 30.8% in 2025 and approximately 44.3% in 2035, both surpassing the predicted value of 25% as per the EIA for Western Chongqing. This raises questions regarding the potential for reclaimed water reuse and the maximum possible supply of reclaimed water in the area, particularly in terms of its potential for carbon emission reduction.
(ii) Potential of reclaimed water use. The production facilities for reclaimed water in the study area are primarily based on conventional secondary sewage treatment, supplemented by tertiary treatments integrated into existing WWTPs. This configuration, typical in current practices [28], means that the scale of sewage treatment directly impacts the available volume of reclaimed water. To estimate the available scale of reclaimed water, the water loss in the processes of sewage treatment and reclamation needs to be calculated. However, there is limited research on water loss in the overall processes of sewage treatment and reclamation. Existing literature provides some estimates for wastewater treatment loss, ranging from approximately 3.6% [60] or 3% [22]. Additionally, the rate of wastewater treatment and reclamation is estimated to be between 17.2% and 18.8%, depending on the utilization rate of reclaimed water [22]. Despite WWTP capacity being measured by water intake volume in China, few WWTPs simultaneously monitor the flow of influent, effluent, and water consumption in the treatment processes. Typically, only effluent volume is recorded as a performance indicator, so water loss data of WWTPs are difficult to acquire in most cases. Consequently, a preliminary survey was conducted with WWTP managers in Chongqing. The results indicate that water loss during the secondary treatment process of wastewater ranges from 3% to 10%. With the addition of tertiary treatment, water loss may increase from 10% to 20%. The actual amount of water loss depends on treatment process flow and technology [26]. For example, based on a long-term planned WWTP capacity of 361,000 m3/d, the potential volume of reclaimed water could range from 288,800 m3/d to 324,900 m3/d. This represents approximately 50.7% to 57.0% of the water supply, serving as the theoretical maximum utilizable limit or the infrastructural capacities of urban wastewater treatment and reclamation [22] for reclaimed water supply.
(iii) Reclaimed water-use levels and carbon emission reduction. The substitution of IBWT water by reclaimed water is calculated based on the short-term and long-term planning levels and potential levels. We also account for the carbon emission reduction effects (Table 6 and Figure 4).
Based on Table 6 and Figure 4, it is evident that the CERs associated with reclaimed water utilization for short-term and long-term plannings are calculated to be 13,208 and 32,511 t CO2-e/a, respectively. These figures represent 38.5% and 55.4% of the potential CERs. Apparently, there exists a significant gap between the planned and potential scales. Because of the advantages of reclaimed water in carbon reduction, by increasing the utilization rate of reclaimed water, cities could fully leverage its advantages in carbon reduction, effectively substituting raw water resources and reducing carbon emissions simultaneously. Thus, it is both necessary and feasible to work toward a maximized utilization rate of reclaimed water to approach the theoretical water production rate of urban wastewater treatment and reclamation.

3.5. Priority of Reclaimed Water Use and Carbon Reduction Strategies in Valley City

Considering that the sustainability of urban water systems requires a holistic approach that balances societal benefits with ecological, environmental, and hydrological integrity [6]. In the context of water shortage in the new valley area, utilizing IBWT becomes essential, mirroring strategies employed in similar valley cities in China [54]. The overarching goal of this paper is to reduce carbon emissions by optimizing the use of reclaimed water across three key scenarios, ultimately achieving sustainability through the integration of multiple water resources. To facilitate this objective, the demand for reclaimed water is categorized into three distinct categories: basic demand, perennial demand, and optimized demand.
(i) Priority of RWU for RFR. RFR can be categorized into dry season replenishment and perennial replenishment. Dry season replenishment is a basic demand for maintaining river environmental flow to address the temporal uneven of channel runoff. Whereas perennial replenishment typically involves the discharge of effluent from WWTP into the river. If WWTP effluent discharged only meets common standards, such as Grade I-A, it would still pose environmental risks [33,60]. Conversely, adhering to higher local standards necessitates additional treatment processes, leading to increased energy and chemical consumption and consequent carbon emissions. Therefore, perennial replenishment is not considered a priority option.
(ii) Priority of RWU for UMW. UMW represents a perennial demand in urban areas for multiple needs with the largest contribution to carbon reduction through the substitution of inter-basin transferred water (IBTW). When reclaimed water is utilized for outdoor purposes like afforestation watering and road flushing, it can directly replace IBTW on a one-to-one basis, contributing substantially. Moreover, when UMW is employed for indoor uses such as toilet flushing and car washing, a closed water loop is established, enabling the water to be reused multiple times [14]. Thus, prioritizing the indoor use of UMW is crucial for maximizing its effectiveness in carbon reduction efforts, although the feasibility of this approach depends on the specific reclaimed water needs of the city. However, the utilization of reclaimed water for miscellaneous purposes typically requires the establishment of a separate pipe network. This is easier for newly developing cities compared to older ones with established systems.
(iii) Priority of RWU for AGI. Using reclaimed water for AGI offers significant carbon reduction benefits by conserving energy and chemicals typically used in water treatment processes, while also facilitating the recovery of nutrients present in the effluent. Additionally, AGI provides the opportunity to directly substitute irrigation water sourced from upstream reservoirs, which may have been obtained from rainwater collection or IBWT. This allows the high-quality water stored in reservoirs to be redirected for RFR, further contributing to sustainability efforts. However, implementing reclaimed water usage for AGI may necessitate the development of a separate pipe network and storage facilities such as ponds to regulate water volume and enable the polishing treatment of reclaimed water [51]. Reclaimed water for AGI represents a promising option for future water management strategies. If we were to qualitatively prioritize reclaimed water usage into five grades from low to high (G1–G5), the priority of scenarios would be summarized as shown in Table 7.

3.6. Influencing Factors of Reclaimed Water Use and Carbon Emission Reduction and Strategies

Equation (10) illustrates that the carbon emission reduction resulting from substituting inter-basin transferred water with reclaimed water is related to two key parameters: the amount of reclaimed water used QRWU, and the unit carbon emission reduction (CERunit). The latter is primarily influenced by the energy intensity, EI, and the carbon emission factor of energy consumption, e, as delineated in Equation (5). Several factors affect these parameters.
(i) Influencing factors of reclaimed water use. In the study area, the use of reclaimed water is influenced by several factors: (i) Insufficient difference between the price of reclaimed and potable water. As the mechanism of pricing for IBWT is not standard, the water supply price usually cannot reflect the cost and value of water resources [62,63,64]. The pricing model for reclaimed water has not yet been established, which poses a challenge to the utilization of reclaimed water [65]. Although the cost of IBWT in the study area is much higher than that of ordinary water supply, a unified potable water price across the city, subsidized by the government, will be used. Relatively low potable water prices would distort the water demand–supply relationship, masking the actual shortage of water resources and hindering the promotion of reclaimed water use [13]. (ii) Social acceptance of reclaimed water. Despite stringent quality and safety measures for reclaimed water through the multi-barrier approach [66], public acceptance of reclaimed water remains suboptimal. The biggest concern being the potential health risks of reclaimed water use [67,68], as well as water conservation [67,68,69] and environmental responsibility [68,69]. While water conservation may be an obvious response to water stress in the Western Valley region, the environmental problems related to carbon emissions may still be abstract for most public and not easily recognized. Similar to health risks, this requires publicizing and information disclosure to increase public awareness and acceptance [67,68]. (iii) Cost of construction. Although construction costs, as sunk costs, are usually excluded during operation in this study, the huge one-time investment would typically affect the government’s budget decisions [22,49].
(ii) Influencing factors of energy intensity. To reduce the study area’s energy intensity, the energy consumption of both IBWT and RWU processes should be considered simultaneously. For the study area, large elevation differences and long conveying distances make water abstraction, transport, and elevation in the course of IBWT the main energy consumption processes, which should be the main concern from the perspective of carbon reduction. In addition to improving the efficiency of each pumping station through management strengthening to achieve energy consumption reduction, optimizing the operational model would also be an effective approach [9]. For example, as the seasonal variation in the abstraction water level of the Yangtze River is 22.67 m, more water can be abstracted and stored in reservoirs during high water levels, which will effectively reduce energy consumption. Regarding energy saving and consumption reduction through management improvement and technological innovation in the water treatment process, please refer to Venkatesan et al., 2011 [70], which will not be repeated here.
(iii) Influencing factors of carbon emission factor. In addition to energy and chemical consumption, the amount of carbon emissions is also influenced by respective carbon emission factors, as depicted in Equations (5) and (6). The carbon emission factor represents the indirect emissions stemming from unit electricity consumption or chemical usage and serves as a fundamental parameter in carbon emission calculations. As a secondary energy source, the carbon emission factor for electricity is contingent upon primary energy consumption during electricity production. This factor is subject to adjustment and publication on an annual basis, reflecting changes in primary energy utilization within the regional power grid. The Chongqing Municipal government’s relevant planning also includes the proposition of enhancing Chongqing’s energy structure through the integration of renewable energy sources, such as hydropower from Sichuan Province, in order to mitigate carbon emissions. In scenarios where the proportion of renewable energy in the energy mix is substantial, inter-basin water transfer may emerge as a viable low-carbon alternative [9]. Notably, the energy consumption of reclaimed water treatment varies for different uses; therefore, changes in the energy mix may also impact the prioritization of recycled water use across different applications. To fundamentally reduce carbon emissions, optimizing the energy mix at the urban level is imperative. Within the study area’s system, improvements to the energy mix can be achieved through enhanced utilization of internal energy sources [24]. For instance, implementing combined heat and power systems [29,71], and harnessing hydro-power generation from WWTP tailwater/effluent [72,73,74] are viable strategies for energy recovery and carbon emission reduction [32].
Notably, strategies must be formulated to encourage the widespread adoption of reclaimed water in the Western Valley and across the broader western Chongqing region. Given that the utilization of reclaimed water brings about project externalities [10], effective implementation requires interdisciplinary collaboration and a robust legal, institutional, and managerial framework [19]. In particular, the integration of reclaimed water into the Western Valley’s water management involves coordination across municipal administration, river management, water conservancy, and agriculture management, which necessitates extensive cross-sectoral cooperation. The emergence of the problems we have studied during the process of urbanization implies that there will be numerous future changes and uncertainties in terms of water supply and demand, population growth, technological advancements, etc. It is important to note that these uncertainties will be further exacerbated by climate change. Additionally, alterations in the energy mix will significantly impact decision-making processes through changes in carbon emission factors. The enhancement of water system sustainability can only be achieved through dynamic and constant adjustment of strategies over time.

4. Conclusions

Because valley areas in mountainous cities are often not self-sufficient in water resources, there are always challenges associated with the mismatch of supply and demand of water use. To address these challenges, IBWT and RWU are adopted in the study area for future urban water use in the relevant planning. Long-distance water transfer not only adds to the cost of water supply, but it also greatly increases the carbon emission intensity of the water system. Therefore, exploring efficient and sustainable ways is necessary to optimize water systems for carbon emission reduction. This paper evaluated the carbon reduction effect of RWU as a substitute for IBWT water. The following conclusions are drawn as follows:
The operational carbon emissions of both IBWT and RWU were calculated using the cumulative accounting method to obtain carbon emission intensities. The carbon emission intensity of water supplied through IBWT is 0.7447 KgCO2/m3, while the increased carbon emission intensity on the basis of traditional secondary treatment is 0.1880 KgCO2/m3. For every 1 m3 of reclaimed water substituted for water from IBWT, there would be approximately 0.5567 KgCO2/m3, representing a significant carbon emission reduction of 75%.
In the urban water supply system including IBWT, raw water is transferred approximately 50 km from the water source and lifted about 228 m in elevation to high pools, endowing it with potential energy. In contrast, due to the dispersed distribution and nearby supply of the RWU system, the energy consumption is comparatively low. RWU can retain that energy within the water system to a large extent through multiple water utilization, thus saving a significant amount of operational energy consumption. This mechanism underscores the carbon reduction potential of RWU substitution for IBWT.
Based on the carbon emission calculations and the planned scale of reclaimed water use, the CER resulting from the substitution of IBWT by RWU is estimated to be 13,208 t CO2-e/a for the short-term planning scale and 32,511 tCO2-e/a for the long-term planning scale. Furthermore, if calculated according to the maximum available reclaimed water, the potential carbon reduction for near-term planning and long-term planning can reach 34,300 tCO2-e/a and 58,683 tCO2-e/a, respectively. Utilizing reclaimed water to its fullest extent presents significant potential for carbon emission reduction.
Among the three scenarios of reclaimed water use, UMW has the most significant effect on substitution for inter-basin transferred water, leading to the greatest carbon emission reduction and should therefore be prioritized for promotion. Although RFR does not directly substitute IBWT, ensuring environmental flow during dry seasons is essential for the health of the river ecosystem and should be prioritized. However, outside of dry seasons, RFR may not offer significant environmental benefits and could even increase energy consumption and carbon emissions, making it a lower priority for reclaimed water use. Reclaimed water for AGI, with its environmental benefits, resource recovery potential, and carbon reduction advantages, may be a valuable option for the future, particularly in the context of urban agricultural development.
The scale of reclaimed water utilization is influenced by factors such as water and reclaimed water pricing, social acceptance, and construction costs. Additionally, the carbon emission reduction effect of reclaimed water substitution is affected by energy consumption intensity and carbon emission factors. While energy consumption can be optimized through system energy-saving measures and innovative operational modes, fundamental improvements in carbon emission factors require regional energy mix optimization, necessitating a shift toward greater use of renewable energy sources.
Increasing the use of reclaimed water can facilitate the substitution of more inter-basin transferred water for higher-quality and more beneficial uses, leading to greater carbon reduction. The management of uncertainties from the treatment of reclaimed water to its use needs to be strengthened, employing approaches such as the implementation of the “multi-barriers” setting. Strategies should be devised to promote reclaimed water utilization not only in the Western Valley but also across the Western Chongqing region. Establishing a robust legal, institutional, and managerial framework is crucial to support reclaimed water initiatives. This paper can serve as a valuable reference for addressing water resource and carbon emission challenges not only in Chongqing but also in other valley cities or water-scarce regions globally.

Author Contributions

Conceptualization, N.M. and Y.X.; methodology, N.M.; software, N.M.; validation, Y.X.; formal analysis, N.M.; investigation, N.M.; resources, N.M.; data curation, N.M.; writing—original draft preparation, N.M.; writing—review and editing, N.M. and Y.X.; visualization, N.M.; supervision, Y.X.; project administration, N.M. and Y.X.; funding acquisition, N.M. All authors have read and agreed to the published version of the manuscript.

Funding

This research received no external funding.

Data Availability Statement

The data presented in this study are available on request from the corresponding author due to specify the reason for the restriction.

Conflicts of Interest

Author Nian Ma was employed by the company T.Y.Lin International Engineering Consulting (China) Co., Ltd. The remaining authors declare that the research was conducted in the absence of any commercial or financial relationships that could be construed as a potential conflict of interest.

References

  1. UN-HABITAT. World Cities Report 2020: The Value of Sustainable Urbanization; UN-HABITAT: New York, NY, USA, 2020. [Google Scholar]
  2. OECD. OECD Environmental Outlook to 2050: The Consequences of Inaction; OECD Publishing: Paris, France, 2012. [Google Scholar]
  3. Wishart, M.J.; Wong, T.; Furmage, B.; Liao, B.; Pannell, D.; Wang, J. The Gray, Green, Blue Continuum: Valuing the Benefits of Nature-Based Solutions for Integrated Urban Flood Management in China; World Bank: Washington, DC, USA, 2021. [Google Scholar]
  4. Yan, G.; He, Y.; Zhang, X.; Yang, Y. Industrial Agglomeration and Urban Water Intensity: Inhibition or Promotion—Based on the Experience Analysis of 285 Prefecture level Cities or Above in China. Resour. Environ. Yangtze Basin 2020, 29, 785–798. [Google Scholar]
  5. Jeong, S.; Park, J. Evaluating urban water management using a water metabolism framework: A comparative analysis of three regions in Korea. Resour. Conserv. Recycl. 2020, 155, 104597. [Google Scholar] [CrossRef]
  6. Gupta, J.; van der Zaag, P. Interbasin water transfers and integrated water resources management: Where engineering, science and politics interlock. Phys. Chem. Earth 2008, 33, 28–40. [Google Scholar] [CrossRef]
  7. Dickson, K.E.; David, A.D. Inventory of Interbasin Transfers in the United States. J. Am. Water Resour. Assoc. 2017, 53, 1121–1132. [Google Scholar] [CrossRef]
  8. Yan, H.; Lin, Y.; Chen, Q.; Zhang, J.; He, S.; Feng, T.; Wang, Z.; Chen, C.; Ding, J. A Review of the Eco-Environmental Impacts of the South-to-North Water Diversion: Implications for Interbasin Water Transfers. Engineering 2023, 30, 161–169. [Google Scholar] [CrossRef]
  9. Shrestha, E.; Ahmad, S.; Johnson, W.; Shrestha, P.; Batista, J.R. Carbon footprint of water conveyance versus desalination as alternatives to expand water supply. Desalination 2011, 280, 33–43. [Google Scholar] [CrossRef]
  10. Keng, H.T.; Conna, L.; Greg, L. Industrial Water Recycling in Australia’s Circular Economy//UNESCO and UNESCO i-WSSM. Water Reuse within a Circular Economy Context (Series II). Global Water Security Issues (GWSI) Series—No.2; UNESCO Publishing: Paris, France, 2020; pp. 85–103. [Google Scholar]
  11. Hong, Y.; Park, J. Exploring circular water options for a water-stressed city: Water metabolism analysis for Paju City, South Korea. Sustain. Cities Soc. 2023, 89, 104355. [Google Scholar] [CrossRef]
  12. Pearce, B.J.; Chertow, M. Scenarios for achieving absolute reductions in phosphorus consumption in Singapore. J. Clean. Prod. 2017, 140, 1587–1601. [Google Scholar] [CrossRef]
  13. Chen, Y.; Chen, C. The Optimal Reuse of Reclaimed Water: A Mathematical Model Analysis. Water Resour. Manag. 2014, 28, 2035–2048. [Google Scholar] [CrossRef]
  14. Angelakis, A.N.; Durham, B. Water recycling and reuse in EUREAU countries: Trends and challenges. Desalination 2008, 218, 3–12. [Google Scholar] [CrossRef]
  15. Olivieri, A.W.; Seto, E.; Cooper, R.C.; Cahn, M.D.; Colford, J.; Crook, J.; Debroux, J.-F.; Mandrell, R.; Suslow, T.; Tchobanoglous, G.; et al. Risk-Based Review of California’s Water-Recycling Criteria for Agricultural Irrigation. J. Environ. Eng. 2014, 140, 04014015. [Google Scholar] [CrossRef]
  16. Tallou, A.; Belabhir, A.; Salcedo, F.P.; El Ghadraoui, A.; Aziz, F. Wastewater Treatment and Reuse Best Practices in Morocco: Targeting Circular Economy//UNESCO and UNESCO i-WSSM. Water Reuse within a Circular Economy Context (Series II). Global Water Security Issues (GWSI) Series—No.2; UNESCO Publishing: Paris, France, 2020; pp. 105–123. [Google Scholar]
  17. Rodriguez, D.J.; Serrano, H.A.; Delgado, A.; Nolasco, D.; Saltiel, G. From Waste to Resource: Shifting Paradigms for Smarter Wastewater Interventions in Latin America and the Caribbean//UNESCO and UNESCO i-WSSM. Water Reuse within a Circular Economy Context (Series II). Global Water Security Issues (GWSI) Series–No.2; UNESCO Publishing: Paris, France, 2020; pp. 37–53. [Google Scholar]
  18. Takeuchi, H.; Tanaka, H. Water reuse and recycling in Japan—History, current situation, and future perspectives. Water Cycle 2020, 1, 1–12. [Google Scholar] [CrossRef]
  19. Tortajada, C.; Bindal, I. Water Reuse in Singapore: The New Frontier in a Framework of a Circular Economy?//UNESCO and UNESCO i-WSSM. Water Reuse within a Circular Economy Context (Series II). Global Water Security Issues (GWSI) Series–No.2; UNESCO Publishing: Paris, France, 2020; pp. 55–67. [Google Scholar]
  20. Romano, O.; Cecchi, L. Water and the Circular Economy in Cities: Observations and Ways Forward[C]//UNESCO and UNESCO i-WSSM. Water Reuse within a Circular Economy Context (Series II). Global Water Security Issues (GWSI) Series–No.2; UNESCO Publishing: Paris, France, 2020; pp. 27–35. [Google Scholar]
  21. Radcliffe, J.C.; Page, D. Water reuse and recycling in Australia- history, current situation and future perspectives. Water Cycle 2020, 1, 19–40. [Google Scholar] [CrossRef]
  22. Arora, M.; Yeow, L.W.; Cheah, L.; Derrible, S. Assessing water circularity in cities: Methodological framework with a case study. Resour. Conserv. Recycl. 2022, 178, 106042. [Google Scholar] [CrossRef]
  23. Friedrich, E.; Pillay, S.; Buckley, C.A. Carbon footprint analysis for increasing water supply and sanitation in South Africa: A case study. J. Clean. Prod. 2009, 17, 1–12. [Google Scholar] [CrossRef]
  24. Kenway, S.J.; Priestley, A.; Cook, S.; Seo, S.; Inman, M.; Gregory, A.; Hall, M. Energy Use in the Provision and Consumption of Urban Water in Australia and New Zealand; Water Services Association of Australia (WSAA): Sydney, Australia, 2008. [Google Scholar]
  25. Mo, W.; Wang, R.; Zimmerman, J.B. Energy-water nexus analysis of enhanced water supply scenarios: A regional comparison of Tampa Bay Florida, and San Diego, California. Environ. Sci. Technol. 2014, 48, 5883–5891. [Google Scholar] [CrossRef]
  26. Lemos, D.; Dias, A.C.; Gabarrell, X.; Arroja, L. Environmental assessment of an urban water system. J. Clean. Prod. 2013, 54, 157–165. [Google Scholar] [CrossRef]
  27. Shrestha, E.; Ahmad, S.; Johnson, W.; Batista, J.R. The carbon footprint of water management policy options. Energy Policy 2012, 42, 201–212. [Google Scholar] [CrossRef]
  28. Foglia, A.; González-Camejo, J.; Radini, S.; Sgroi, M.; Li, K.; Eusebi, A.; Fatone, F. Transforming wastewater treatment plants into reclaimed water facilities in water-unbalanced regions: An overview of possibilities and recommendations focusing on the Italian case. J. Clean. Prod. 2023, 410, 137264. [Google Scholar] [CrossRef]
  29. Mo, W.; Zhang, Q. Can municipal wastewater treatment systems be carbon neutral? J. Environ. Manag. 2012, 112, 360–367. [Google Scholar] [CrossRef]
  30. Hao, X.; Liu, R.; Huang, X. Evaluation of the potential for operating carbon neutral WWTPs in China. Water Res. 2015, 87, 424–431. [Google Scholar] [CrossRef]
  31. Sancho, I.; Lopez-Palau, S.; Arespacochaga, N.; Cortina, J. New concepts on carbon redirection in wastewater treatment plants: A review. Sci. Total Environ. 2019, 647, 1373–1384. [Google Scholar] [CrossRef]
  32. Li, L.; Wang, X.; Miao, J.; Abulimiti, A.; Jing, X.; Ren, N. Carbon neutrality of wastewater treatment—A systematic concept beyond the plant boundary. Environ. Sci. Ecotechnol. 2022, 11, 100180. [Google Scholar] [CrossRef]
  33. Lee, M.; Keller, A.A.; Chiang, P.; Den, W.; Wang, H.; Hou, C.-H.; Wu, J.; Wang, X.; Yan, J. Water-energy nexus for urban water systems: A comparative review on energy intensity and environmental impacts in relation to global water risks. Appl. Energy 2017, 205, 589–601. [Google Scholar] [CrossRef]
  34. Luo, Y.; Pan, Y.; Ma, J.; Wang, J.; Li, C.; Chen, Z.; Wang, X. Research advances on carbon emission of wastewater resource recovery and valorization. Environ. Eng. 2022, 40, 83–91. (In Chinese) [Google Scholar]
  35. Bourblanc, M.; Blanchon, D. The challenges of rescaling South African water resources management: Catchment Management Agencies and interbasin transfers. J. Hydrol. 2014, 519, 2381–2391. [Google Scholar] [CrossRef]
  36. Lopez, J.C. Interbasin water transfers and the size of regions: An economic geography example. Water Resour. Econ. 2018, 21, 40–54. [Google Scholar] [CrossRef]
  37. Valerio, C.; Giuliani, M.; Castelletti, A.; Garrido, A.; De Stefano, L. Multi-objective optimal design of interbasin water transfers: The Tagus-Segura aqueduct (Spain). J. Hydrol. Reg. Stud. 2023, 46, 101339. [Google Scholar] [CrossRef]
  38. von Medeazza, G.M.; Moreau, V. Modelling of water–energy systems: The case of desalination. Energy 2007, 32, 1024–1031. [Google Scholar] [CrossRef]
  39. Wakeel, M.; Chen, B.; Hayat, T.; Alsaedi, A.; Ahmad, B. Energy consumption for water use cycles in different countries: A review. Appl. Energy 2016, 178, 868–885. [Google Scholar] [CrossRef]
  40. Maier, J.; Palazzo, J.; Geyer, R.; Steigerwald, D.G. How much potable water is saved by wastewater recycling? Quasi-experimental evidence from California. Resour. Conserv. Recycl. 2022, 176, 105948. [Google Scholar] [CrossRef]
  41. Tan, S.; Yao, L. Managing and optimizing urban water supply system for sustainable development: Perspectives from water-energy-carbon nexus. Sustain. Prod. Consum. 2023, 37, 39–52. [Google Scholar] [CrossRef]
  42. Spring, Ú.O. Aquatic systems and water security in the Metropolitan Valley of Mexico City. Curr. Opin. Environ. Sustain. 2011, 3, 497–505. [Google Scholar] [CrossRef]
  43. Farooqui, T.A.; Renouf, M.A.; Kenway, S.J. A metabolism perspective on alternative urban water servicing options using water mass balance. Water Res. 2016, 106, 415–428. [Google Scholar] [CrossRef]
  44. Falkenmark, M.; Lundqvist, J.; Widstrand, C. Macro-scale water scarcity requires micro-scale approaches. Nat. Resour. Forum 1989, 13, 258–267. [Google Scholar] [CrossRef]
  45. Ayoub, J.; Alward, R. Water requirements and remote arid areas: The need for small-scale desalination. Desalination 1996, 107, 131–147. [Google Scholar] [CrossRef]
  46. Rijsberman, F.R. Water scarcity: Fact or fiction? Agric. Water Manag. 2006, 80, 5–22. [Google Scholar] [CrossRef]
  47. Veettil, A.V.; Mishra, A.K. Potential influence of climate and anthropogenic variables on water security using blue and green water scarcity, Falkenmark index, and freshwater provision indicator. J. Environ. Manag. 2018, 228, 346–362. [Google Scholar] [CrossRef]
  48. Yi, L.; Jiao, W.; Chen, X.; Chen, W. An overview of reclaimed water reuse in China. J. Environ. Sci. 2011, 23, 1585–1593. [Google Scholar] [CrossRef]
  49. IWA. Towards the New Era of Water Reuse in China. Available online: https://www.thesourcemagazine.org/towards-the-new-era-of-water-reuse-in-china/ (accessed on 16 December 2021).
  50. Renouf, M.A.; Serrao-Neumann, S.; Kenway, S.J.; Morgan, E.A.; Choy, D.L. Urban water metabolism indicators derived from a water mass balance e Bridging the gap between visions and performance assessment of urban water resource management. Water Res. 2017, 122, 669–677. [Google Scholar] [CrossRef]
  51. Friedler, E. Water reuse—An integral part of water resources management: Israel as a case study. Water Policy 2001, 3, 29–39. [Google Scholar] [CrossRef]
  52. Alon, T. Rethinking the sustainability of Israel’s irrigation practices in the Drylands. Water Res. 2016, 90, 387–394. [Google Scholar]
  53. Salmoral, G.; Carbó, A.V.; Zegarra, E.; Knox, J.W.; Rey, D. Reconciling irrigation demands for agricultural expansion with environmental sustainability—A preliminary assessment for the Ica Valley, Peru. J. Clean. Prod. 2020, 276, 123544. [Google Scholar] [CrossRef]
  54. Li, Y.; Xiong, W.; Zhang, W.; Wang, C.; Wang, P. Life cycle assessment of water supply alternatives in water-receiving areas of the South-to-North Water Diversion Project in China. Water Res. 2016, 89, 9–19. [Google Scholar] [CrossRef]
  55. Venkatesh, G.; Brattebø, H. Energy consumption, costs and environmental impacts for urban water cycle services: Case study of Oslo (Norway). Energy 2011, 36, 792–800. [Google Scholar] [CrossRef]
  56. Liu, J.; Chen, S.; Wang, H.; Chen, X. Calculation of carbon footprints for water diversion and desalination projects. Energy Procedia 2015, 75, 2483–2494. [Google Scholar] [CrossRef]
  57. Hao, X.; Liu, R. Guidelines for Carbon Accounting and Emission Reduction in the Urban Water Sector; Organized by the China Urban Water Association; International Water Association: London, UK, 2024. [Google Scholar]
  58. Wang, H.; Yang, Y.; Keller, A.A.; Li, X.; Feng, S.; Dong, Y.-N.; Li, F. Comparative analysis of energy intensity and carbon emissions in wastewater treatment in USA, Germany, China and South Africa. Appl. Energy 2016, 184, 873–881. [Google Scholar] [CrossRef]
  59. Huang, C.; Li, Y.; Li, X.; Wang, H.; Yan, J.; Wang, X.; Wu, J.; Li, F. Understanding the water-energy nexus in urban water supply systems with city features. Energy Procedia 2018, 152, 265–270. [Google Scholar] [CrossRef]
  60. Furumai, H. Rainwater and reclaimed wastewater for sustainable urban water use. Phys. Chem. Earth 2008, 33, 340–346. [Google Scholar] [CrossRef]
  61. Friedler, E. The Jeezrael valley project for wastewater reclamation and reuse, Israel. Water Sci. Technol. 1999, 40, 347–354. [Google Scholar] [CrossRef]
  62. Ye, X.; Jia, R.; Jiang, W.; Sheng, D. Study on Water Price of Interbasin Diversion. Yellow River 2005, 27, 62–63, 67. (In Chinese) [Google Scholar]
  63. Wang, M. Influencing factors for water price in inter-basin water transfer. J. Econ. Water Resour. 2009, 27, 38–41. (In Chinese) [Google Scholar]
  64. Sun, J.; Shen, B.F.; Zhao, J.X. Trade price of water volume for inter-basin water transfer project based on marginal cost: Case of Phase I of Middle Route of South-to-North Water Diversion Project. Yangtze River 2022, 53, 113–118. (In Chinese) [Google Scholar]
  65. Wang, L.; Jiang, X.P. Research on the utilization and price policy of reclaimed water in Chinese cities. Water Wastewater Eng. 2021, 47, 48–53, 59. (In Chinese) [Google Scholar]
  66. Lahnsteiner, J.; van Rensburg, P.; Esterhuizen, J. Direct potable reuse-a feasible water management option. J. Water Reuse Desalination 2018, 8, 14–28. [Google Scholar] [CrossRef]
  67. Friedler, E.; Lahav, O.; Jizhaki, H.; Lahav, T. Study of urban population attitudes towards various wastewater reuse options: Israel as a case study. J. Environ. Manag. 2006, 81, 360–370. [Google Scholar] [CrossRef]
  68. Hou, C.; Fu, H.; Liu, X.; Wen, Y. The effect of recycled water information disclosure on public acceptance of recycled water—Evidence from residents of Xi’an, China. Sustain. Cities Soc. 2020, 61, 102351. [Google Scholar] [CrossRef]
  69. Li, T.; Roy, D. “Choosing not to choose”: Preferences for various uses of recycled water. Ecol. Econ. 2021, 184, 106992. [Google Scholar] [CrossRef]
  70. Venkatesan, A.K.; Ahmad, S.; Johnson, W.; Batista, J.R. Salinity reduction and energy conservation in direct and indirect potable water reuse. Desalination 2011, 272, 120–127. [Google Scholar] [CrossRef]
  71. Sanaye, S.; Yazdani, M. Energy, exergy, economic and environmental analysis of a running integrated anaerobic digester-combined heat and power system in a municipal wastewater treatment plant. Energy Rep. 2022, 8, 9724–9741. [Google Scholar] [CrossRef]
  72. Wang, P. Application of tailwater power generation technology in Chongqing Jiguanshi wastewater treatment Plant. China Water Wastewater 2010, 26, 69–71, 84. (In Chinese) [Google Scholar]
  73. Chae, K.-J.; Kim, I.-S.; Ren, X.; Cheon, K.-H. Reliable energy recovery in an existing municipal wastewater treatment plant with a flow-variable micro-hydropower system. Energy Convers. Manag. 2015, 101, 681–688. [Google Scholar] [CrossRef]
  74. Li, H.; Dong, L.; Li, Q.; Huang, D.; Lv, L. Case of tailwater power generation project in a WWTP for enhancing energy recovery. China Water Wastewater 2023, 39, 122–126. (In Chinese) [Google Scholar]
Figure 1. Schematic map of the Inter-basin Water Transfer project (edited from EIA Report of the Water Resources Allocation Project in West Chongqing). Note. Different colors represent different types of facilities, consistent with Figure 2; Arrows represent the direction of water flow.
Water 16 01733 g001
Figure 3. Matrix diagram of carbon emission accounting of IBWT and RWU and equations. Note. The bracketed numbers represent the equations in the text.
Water 16 01733 g003
Figure 4. Reclaimed water substitution levels and carbon emission reduction potential.
Water 16 01733 g004
Table 6. Reclaimed water substitution levels and carbon emission reduction potential.
Planning Target YearCapacity of WWTPs
(m3/d)
RWU as Planned
(m3/d)
CER b as Planned
(t CO2-e/a)
Potential of RWU a
(m3/d)
Potential of CER b
(t CO2-e/a)
2025211,00065,00013,208168,80034,300
2035361,000160,00032,511288,80058,683
Note: where, a, the output of reclaimed water is calculated prudently as approximately 80% of the wastewater treatment capacity; b is the weighted average value of carbon emission intensity of IBWT and RWU, the CER difference, 0.5567 KgCO2/m3, is used for calculation.
Table 7. Priority Grades of reclaimed water utilization.
G1G2G3G4G5
UMWIndoor use
Outdoor use
RFRDry season
Perennial use
AGISeasonal use
Note: UMW: Urban miscellaneous water; RFR: River flow replenishment; AGI: Agricultural irrigation.
Disclaimer/Publisher’s Note: The statements, opinions and data contained in all publications are solely those of the individual author(s) and contributor(s) and not of MDPI and/or the editor(s). MDPI and/or the editor(s) disclaim responsibility for any injury to people or property resulting from any ideas, methods, instructions or products referred to in the content.

