Article

Changing Soil Water Content: Main Trigger of the Multi-Phase Mobilization and Transformation of Petroleum Pollution Components—Insights from the Batch Experiments

1
School of Resource and Environment Engineering, Guizhou Institute of Technology, Guiyang 550003, China
2
Tianjin Geothermal Exploration and Development Design Institute, Tianjin 300250, China
3
Tianjin Center (North China Center for Geoscience Innovation), China Geological Survey, Tianjin 300170, China
4
No.111 Gecological Party, Guizhou Bureau of Geology and Mineral Exploration & Development, Guiyang 550081, China
*
Author to whom correspondence should be addressed.
Water 2024, 16(13), 1775; https://doi.org/10.3390/w16131775
Submission received: 3 June 2024 / Revised: 17 June 2024 / Accepted: 20 June 2024 / Published: 22 June 2024
(This article belongs to the Special Issue Soil and Groundwater Quality and Resources Assessment)

Abstract

:
Soil moisture content continuously alters the types and forms of petroleum organic pollutants in the soil through processes such as dissolution, convection, and dilution, forming complex migration and transformation in a water–air–soil–NAPL system. Field investigations and traditional indoor simulation experiments have difficulty in terms of accurately diagnosing the state of different petroleum pollutants due to the influence of environmental factors and the difficulty of controlling single factors. Batch experiments were conducted to simulate the mobilization and differentiation processes of petroleum pollutants under the influence of soil water content. The results show that (1) the residual content of components is the lowest in coarse sand and the highest in clay, which is mainly affected by soil particles; meanwhile, the residual saturation value of octanoic acid is the largest, and that of toluene is the smallest, as determined in terms of their viscosity and volatility. (2) The infiltration processes of the components are affected by their properties and medium characteristics. Due to its small particle size and strong adsorption, clay has the highest residual saturation of petroleum pollutants (28.8%). This can even be more than twice that of coarse sand (13.3%). For different components, the residual saturations of octanoic acid and toluene are the highest and lowest, respectively (taking fine sand as an example: 25.3% and 13.2%), with a relatively large difference, as determined in terms of viscosity and solubility. (3) As the free phase can migrate freely, it is transformed most rapidly in the pores. The changes in the dissolved phase of each component are relatively small and tend to be gentle. The changes in the residual phase are mainly affected by volatility, viscosity, soil particles, and pore and cosmid content; the degree of change is ordered as follows: toluene > cyclohexane > hexadecane > octanoic acid.

Graphical Abstract

1. Introduction

In oil spilling, extraction, refining, and transportation, the leakage of underground storage tanks and the rupture of oil pipelines will inevitably cause soil and groundwater contamination, posing serious environmental threats [1,2,3,4]. Petroleum organic components have become an important pollutant in groundwater systems, and various oil pollution incidents and their impacts on soil and groundwater have been reported worldwide [5,6,7,8]. Due to the carcinogenic and teratogenic nature of petroleum pollutants, they pose significant threats to human health and ecology [9,10,11]. Petroleum is a complex mixture composed of a variety of organic substances with very low solubility, usually existing in soil and groundwater aquifers in the form of non-aqueous-phase liquids (NAPLs) [12,13]. When petroleum pollutants are discharged to the surface through various channels, they will continue to penetrate into the vadose zone and aquifers. The vadose zone is a key area where the atmosphere, surface water, and groundwater are connected and exchange water. It forms a complex system where rock and soil particles, water, and air coexist, which has the ability to absorb, retain, and transmit water, resulting in a changeable environment with complex hydrogeochemistry. More specifically, petroleum organic pollutants continuously migrate downward in the subsurface environment, undergoing various phase transitions such as volatilization, adsorption, degradation, and dissolution, forming a complex system with multiple phases and components [14,15,16]. Upon infiltration into the subsurface environment, organic pollutants in the NAPL phase migrate downward, with some being retained in soil pores through adsorption or capillary action—referred to as the residual phase [17,18,19]—while others continue to migrate in a fluid form under the influence of gravity—referred to as the free phase [20,21,22]. Additionally, NAPLs can also enter the air and water through volatilization and dissolution processes, forming gas and liquid phases (i.e., dissolved phase). Qi et al. showed that benzene was likely residual at the water–NAPL interface in fine-to-medium sand aquifers [23]. Mohamed et al. concluded that long-term mass removal for a glop of NAPL located close to an air channel was dependent on the aqueous diffusion of the dissolved phase towards the air–water interface, which, in turn, increases with the increase in the mean particle size of the contaminated soil [24]. Petri et al. conducted an experiment to show that the morphology of vadose-zone NAPL strongly controls mass transfer, with occluded NAPL sources emitting considerably lower mass flux than exposed NAPL sources [25]. In reality, influenced by the properties of the subsurface medium, biochemical conditions, and environmental factors, continuous transformations occur throughout the NAPL phase, gas phase, and liquid phase, as depicted in Figure 1 [26]. During the movement of groundwater, hydrodynamic dispersion and convection will cause free NAPLs to continue to migrate and, at the same time, cause NAPLs to continue to dissolve into groundwater, eventually forming a soluble plume hydrocarbon zone [27]. Podgorski et al. found that the upward flow of groundwater forms a dissolved pollution plume, and with the movement of groundwater and microorganisms, the pollutant components will shift low-molecular-weight (MW) aliphatic, reduced compounds to high-MW unsaturated (alicyclic/aromatic), which are high-oxygen compounds that are consistent with carboxyl-rich alicyclic molecules [28]. When there is a saturated lens of free NAPLs in a body of groundwater, it will rise or fall with the same trend as the phreatic surface of the groundwater, and some free NAPLs will migrate downward into the saturated zone, leading to contamination of the soil and groundwater [29].
During these processes, changes in water content caused by fluctuations in groundwater levels control the redistribution processes that affect petroleum components [30,31,32]. First of all, oil is a mixed liquid substance with high viscosity and low solubility. Although it is affected by gravity after leakage, its contact with soil particles generates a strong viscous force, thus blocking downward penetration [33,34,35]. Fluctuations in groundwater levels caused by rainfall can cause water to mix with components and change their viscosity. Therefore, changes in soil moisture content caused by rainfall leaching or large-scale intermittent irrigation are the main forces that cause pollutants to enter the underground environment, directly affecting the mobilization process of pollutants [36,37,38]. Moreover, due to the spatial differences in soil mediums in the vadose zone, different pore sizes, soil compositions, and initial water contents will lead to differences in the rate, content, and transformation of pollutants during mobilization and will ultimately affect their distribution and complicate the mobilization of pollutant components [39,40,41].
In summary, the changing patterns of NAPL substances in relation to fluctuations in groundwater levels determine the content and type of pollutants entering the groundwater [42,43,44]. This is also a key component of a final pollution risk assessment and the formulation of corresponding remediation plans. For example, An et al. showed that sandy soil contaminated with a higher petroleum concentration showed markedly higher potential risk than sandy loam in relation to frequently fluctuating groundwater levels [40]. The importance of groundwater resources, the hazards posed by oil pollutants, the complexity of changes in organic components, physical–chemical–biological reaction systems, and the mutual transformation systems between substances during water level fluctuation processes that affect pollution components are important prerequisites for remediating groundwater oil pollution reasonably, efficiently, and economically. For example, Teramoto et al. showed that mass transfer is governed by both LNAPL saturation and seasonal water table fluctuations within the LNAPL smear zone [45]. Zhao et al. pointed out that the capillary fringe boundary (the interface between an aquifer and an unsaturated water zone), due to its constantly changing moisture content, is a major zone involved in the transport and transformation of contaminants [46]. Sakr et al. emphasized that before selecting PRB technology to remediate BTEX contamination, it is important to determine the migration trend of the groundwater contaminants at the site [47]. However, existing studies still lack details on the mobilization differences between different types and phases of petroleum pollutants due to the impacts of changing soil water content. Traditional research methods are based on actual field measurements or indoor simulation experiments, which can simulate and reflect real pollution in an environment. However, field conditions are very complex and the mobilization and transformation processes between different components are difficult to analyze individually due to their different characteristics; therefore, it is especially difficult to accurately study and evaluate the influence of a single factor [48,49,50]. Batch experiments are a commonly used experimental method when conducting small-scale experimental studies. They usually involve processing multiple samples or test conditions simultaneously in a relatively short period of time in order to obtain more data and compare the obtained results. Batch experiments can better control experimental conditions, reduce interference factors, and provide important information about reaction kinetics, material transformation processes, biological activities, and so on; therefore, they are widely used in fields such as chemistry, biology, and environmental sciences [51,52,53].
Based on a detailed investigation (pollution sources, pollutant types, pollutant migration, soil media, groundwater level fluctuations, and moisture content variation characteristics) of a site in northeast China that has experienced long-term pollution due to petroleum leakage, and combined with the need to address the bottleneck arising from the unclear role of soil moisture content on the complex migration and transformation system of petroleum organic pollutants and analyze the challenges that face field investigations and traditional indoor simulation experiments (such as numerous environmental influencing factors and difficulty in controlling single factors), this study innovatively employed batch experiments to simulate the mobilization and differentiation processes of multi-phase pollutants in an underground environment under the influence of these factors. The main aims of this study are as follows: (1) to determine the influencing mechanisms of different soil water contents on the mobilization and differentiation of pollution components; (2) to obtain the residual saturation of different pollution components in different soil media and discuss the change processes; and (3) to elucidate the relationship between the changes in the saturation of water, oil, and gas in soil pores. This study provides a theoretical basis for the design of reasonable and efficient restoration plans; therefore, it has very important practical significance and scientific value.

2. Materials and Methods

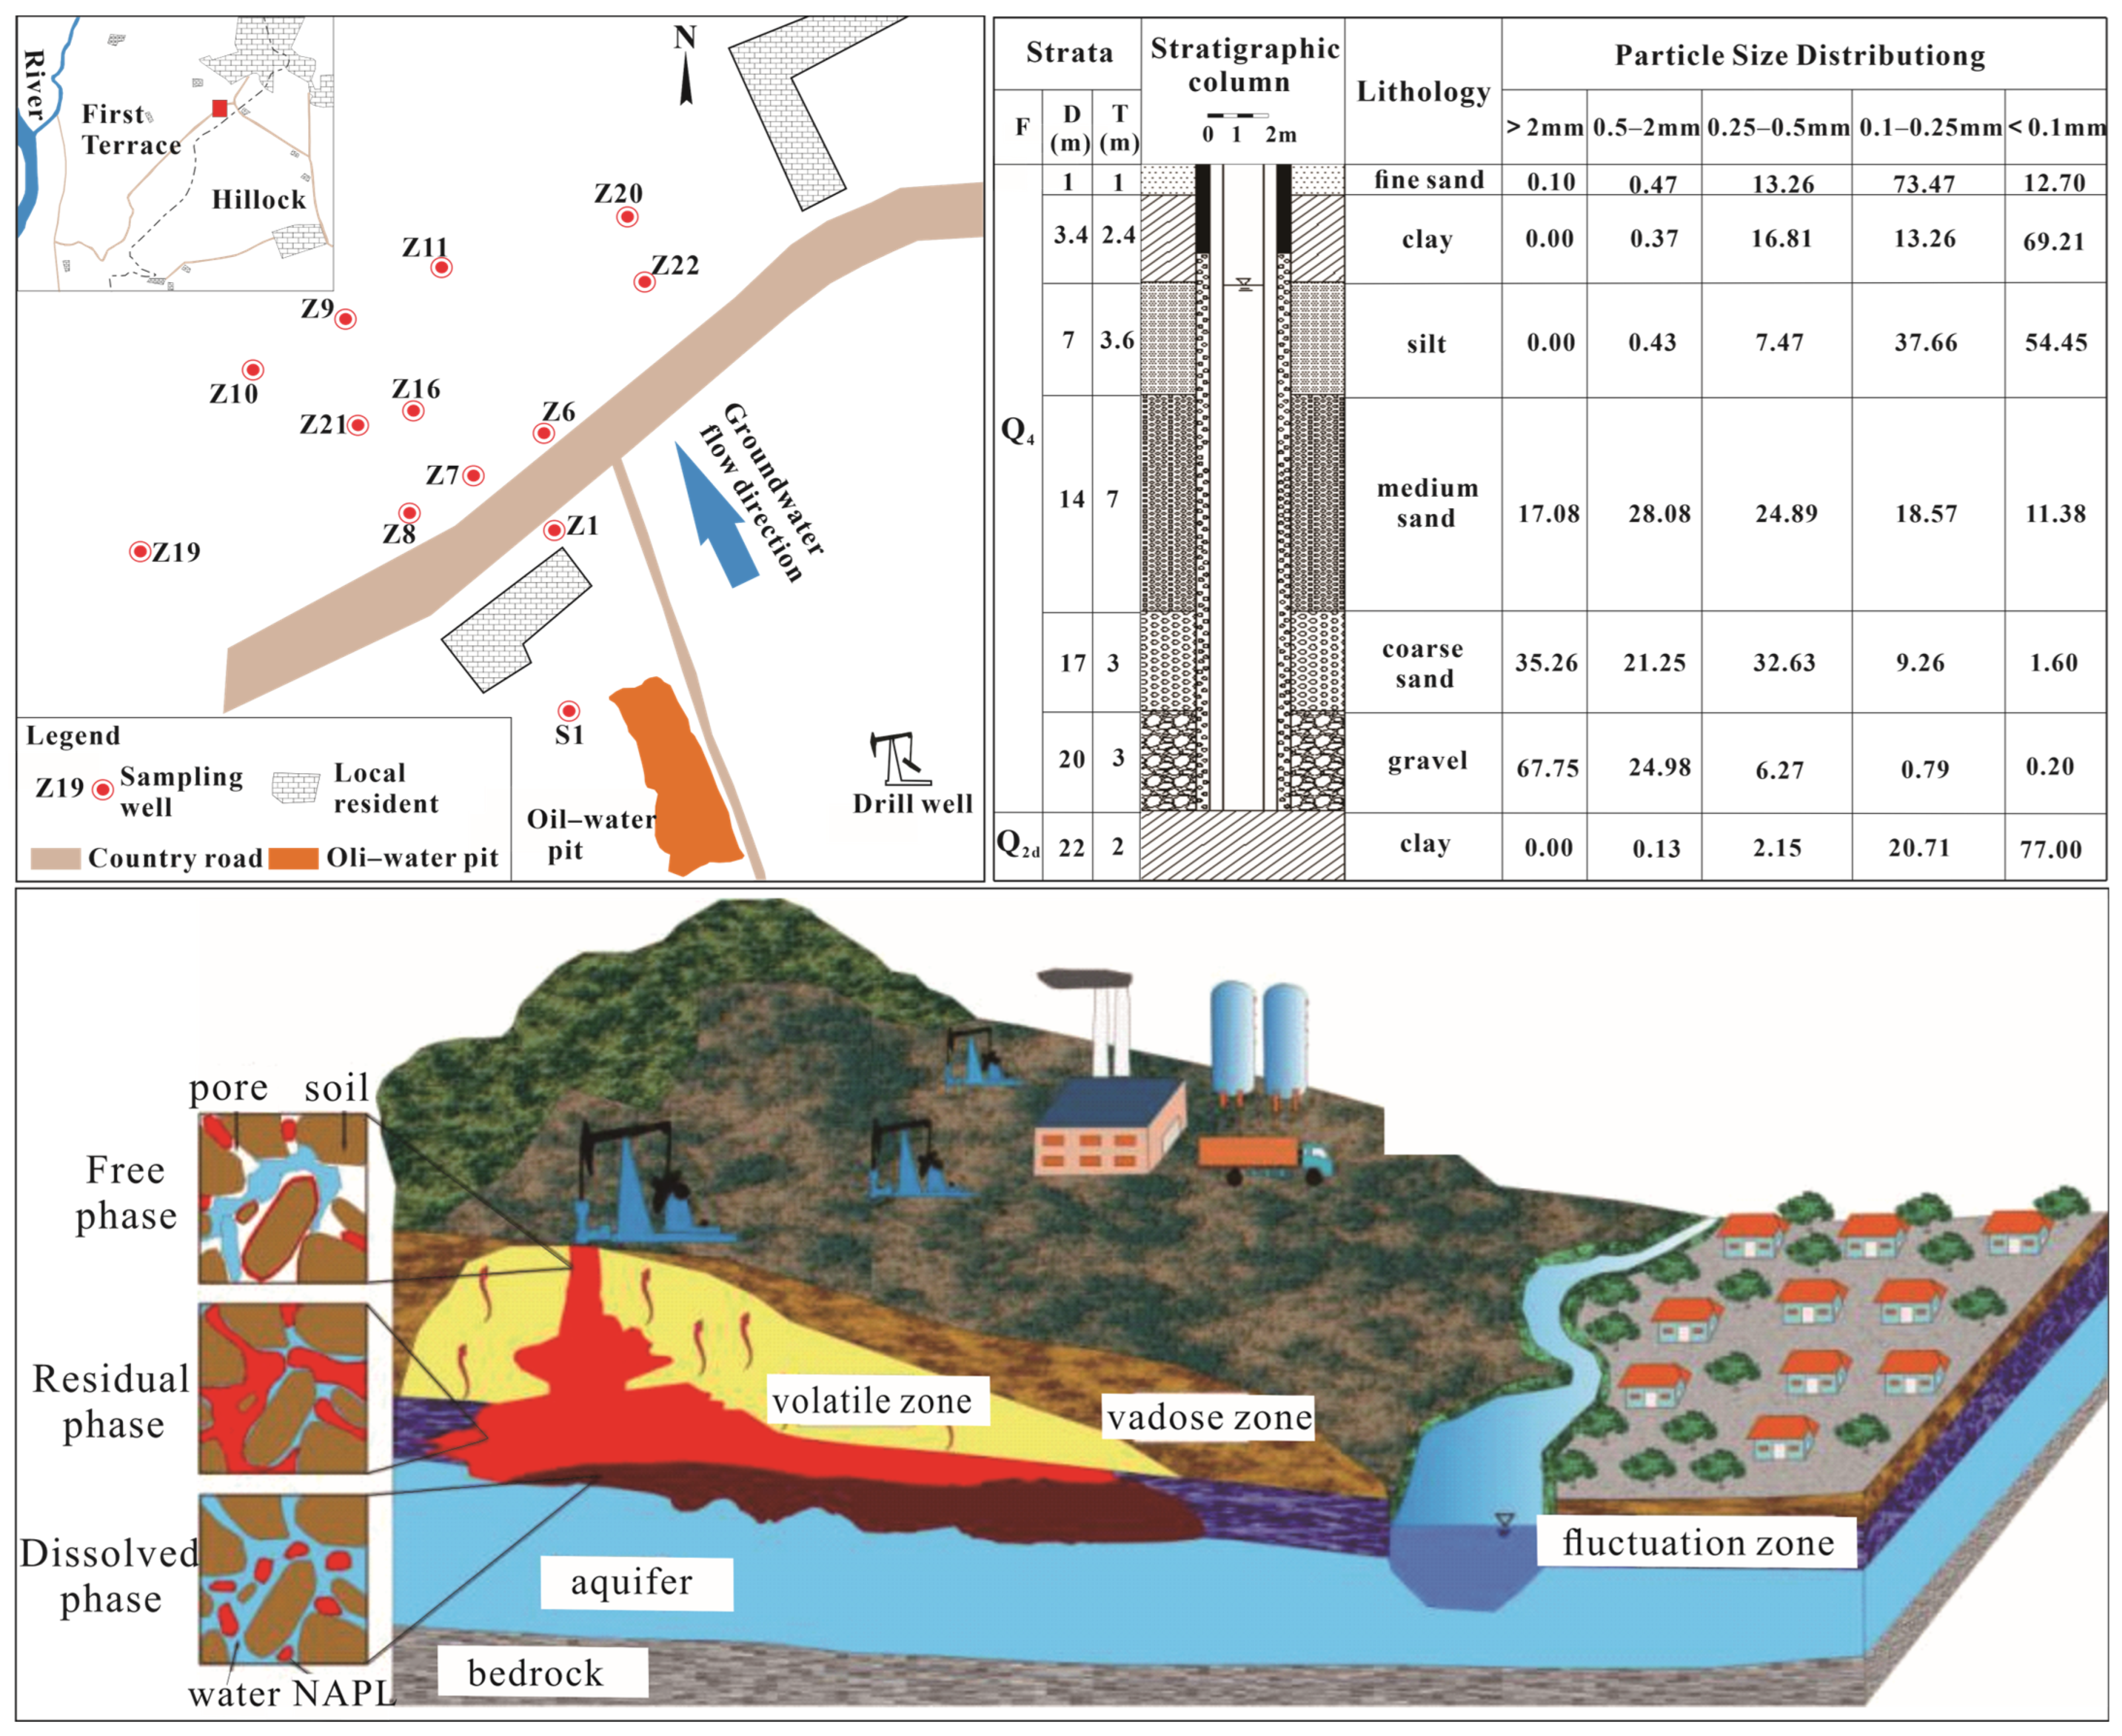
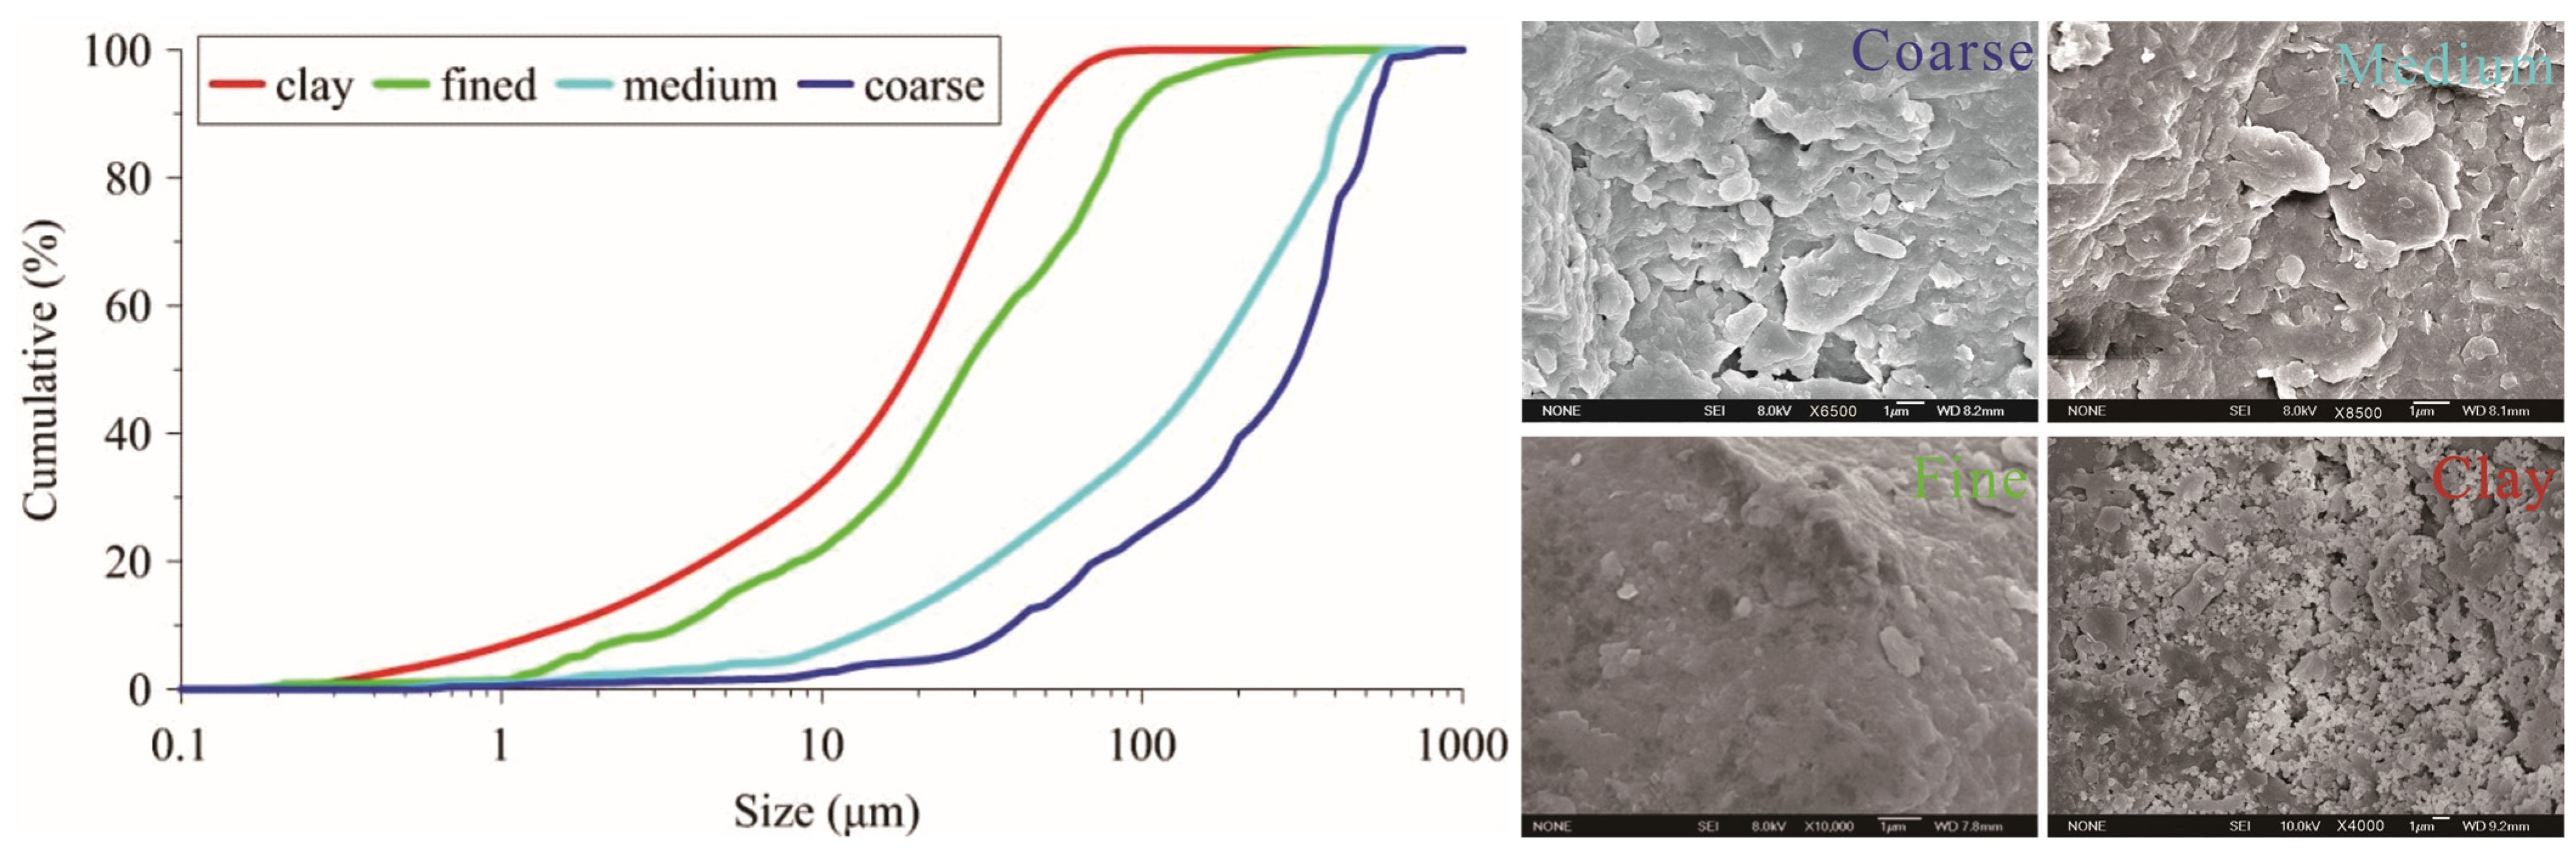
2.1. Experimental Pollutants and Media

This study was carried out based on an actual site investigation of a petroleum-contaminated area in an oil field in northeast China. An oily water pit located at a higher elevation was identified as a significant source of contamination at the site under investigation. Site assessments revealed that the shallow aquifer consisted of fine-to-coarse sands/gravels with a thickness of 15–20 m, overlaying Pleistocene silty clay acting as an aquitard in the area. The groundwater level was observed to be 2.0–4.0 m below the ground surface, with fluctuations of up to 0.5 m annually. The flow direction of the groundwater was predominantly from southeast to northwest. The spillage of various petroleum hydrocarbons (PHCs) from this pit resulted in severe pollution of both soil and groundwater (Figure 1). In order to better simulate the actual pollution situation, soil samples from different depths of the oil field pollution site were collected for this experiment. More specifically, in order to obtain uncontaminated original soils corresponding to the stratigraphic column at the site, we collected soil from a natural profile adjacent to the site layer by layer and then sieved and processed these soils in the laboratory to obtain clay and fine, medium, and coarse sand from the respective layers for the batch experiment. When investigating the contaminated groundwater and soil sites in the oil field, it was found that the lithology of the vadose zone was mainly composed of coarse, medium, and fine sand and clay. Therefore, these soils were used as the experimental media; their particle size distribution and main properties are shown in Figure 2 and Table 1. The petroleum components in the groundwater at the site mainly included alkanes, cycloalkanes, aromatic hydrocarbons, and some non-hydrocarbon substances. Based on the differences in their functional groups, hexadecane, cyclohexane, toluene, and octanoic acid were utilized as representatives. Their properties are shown in Figure 3 and Table 2 [54].

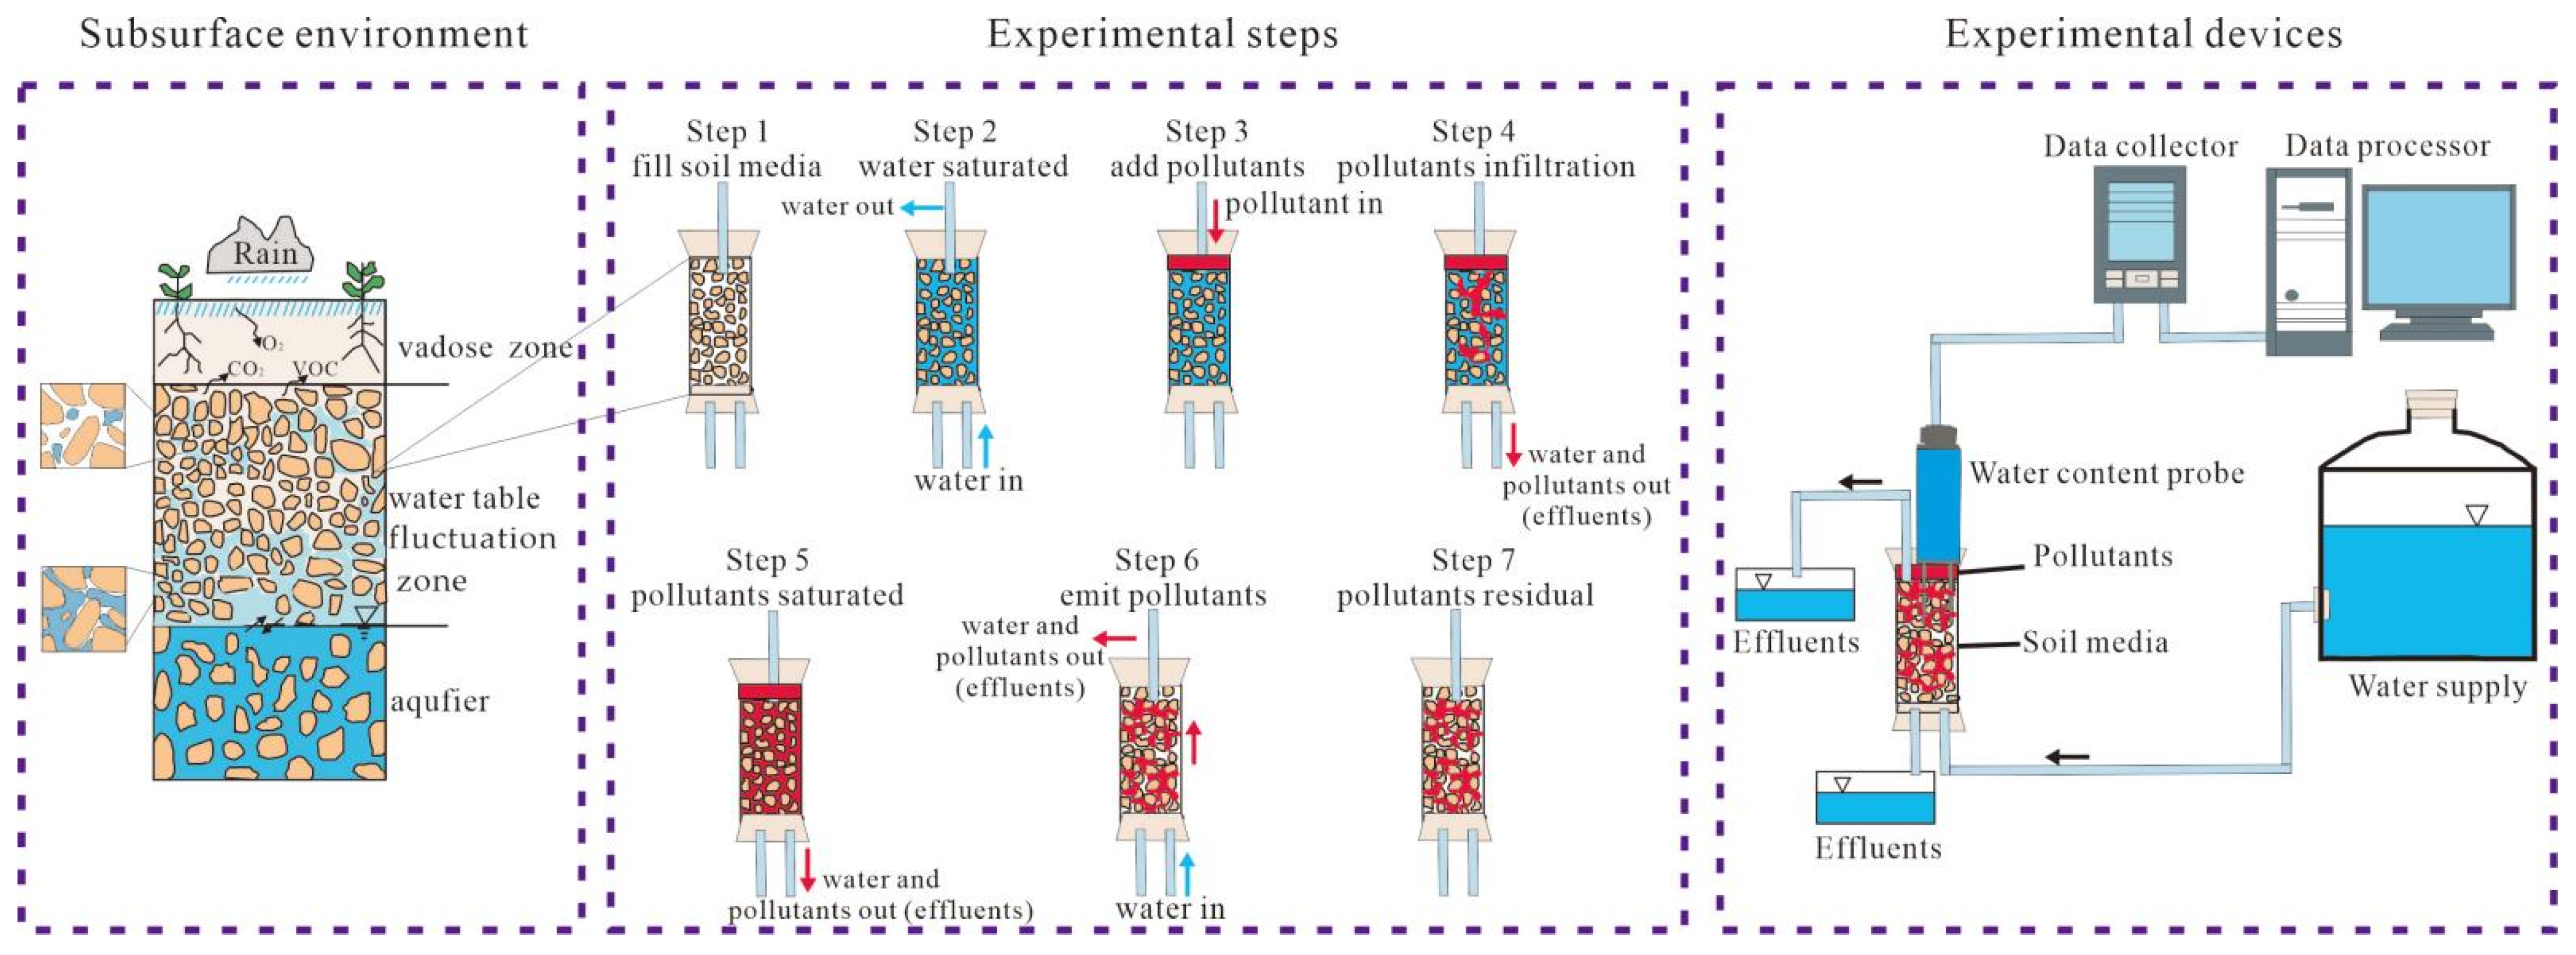
2.2. Experimental Devices and Processes

2.2.1. Experimental Aims

Two batch experiments were designed to simulate the multi-phase flow of different petroleum organic pollutants in soil and groundwater under the influence of different soil water content factors, as well as the mobilization and mutual transformation processes between different phases. Batch experiment 1 (i.e., the experiment on changes in mobilization morphological characteristics of pollution components) was conducted to obtain the residual saturation of different pollution components in different soil media in order to explore the change processes of pollution components under different water content conditions and to study the relationship between the saturation changes of water, oil, and gas in soil pores. Batch experiment 2 (i.e., the experiment on the influence of different water contents on changes in pollution components) was conducted based on batch experiment 1 (using the same experimental device, experimental materials, and pollution components), observing the changes in moisture content, the diffusion pattern of the tracer dyeing area, and the change process of gas phase saturation with the aim of exploring the changing mobilization characteristics of different components under different water contents and studying the influencing mechanisms of water content on the morphological changes of three NAPL phases. The batch experiments emphasized the highly consistent initial conditions, but differences in pollutant distribution, soil filling, and moisture content control may lead to variations in terms of the experimental conditions, ultimately affecting the precision of the experiments. To address this, the experiments were conducted in small batches, and the total number of batch experiments was divided into several sessions. With a smaller experiment volume, there is relatively sufficient operation time, which can help avoid many errors that may occur during batch experiments.

2.2.2. Experimental Devices and Steps

Batch experiment 1: A diagram of the experimental device is shown in Figure 4. The specific steps used are as follows: (1) First, fill the soil medium. A glass tube with an inner diameter of 4 cm and a length of 12 cm was filled with soil medium in order to simulate the soil conditions in the vadose zone. The upper and lower ports of the experimental device were blocked with rubber plugs and wrapped with gauze to prevent the loss of soil medium particles. The soil was filled layer by layer and tamped down continuously to ensure uniform filling. In addition, before filling the soil, we calculated the total weight of soil required based on the soil density measured in the field and the dimensions of the experimental setup. Then, we filled each layer uniformly according to the corresponding filling height per volume, ensuring that the filling density matched that of natural soil. (2) Water was injected into the tube from the bottom to the top, which was stopped when a stable liquid level appeared on the upper surface of the soil. The volume of water entering was measured to calculate the porosity of the soil. In this process, a TRIME PICO-32 (Germany IMKO; this instrument was linked to the computer via a probe. It automatically reads soil moisture content; it has a data monitoring frequency of 2 min) meter was used to measure the water content of the soil. (3) After achieving water saturation, a syringe was used to continuously inject the petroleum component, dyed with Sudan IV (mass ratio 1:10,000), into the upper port of the tube. (4) In order to allow the components to fill the entire soil layer to achieve saturation, drainage was performed from the lower port after water saturation. Therefore, when the water in the soil pores was drained, the components also seeped downward into the pores. (5) When the entire soil column was filled with red-stained contaminating components, it was considered that the NAPL in the pores had reached saturation (refer to Stafford’s method) [55]. (6) Then, water was injected from the lower port of the soil column, the upper port was opened, and the NAPL filled with pores was discharged from the upper port; here, the remaining NAPL that was not discharged formed a residual phase. (7) In terms of water injection and the discharge of NAPL, when the measured moisture content value had almost no change, a balance between the phases was reached. At this time, the components in the soil formed a residual phase and were difficult to discharge. During the experiment, the moisture content instrument continuously sampled the tube to measure the moisture content, and the discharged liquid was collected. Then, GC-MS, infrared spectrophotometer, and liquid viscometer instruments were utilized to measure the type and content of organic matter, functional group composition, and viscosity of the discharged liquid, respectively.
Batch experiment 2: The change processes of different petroleum pollution components in soil and groundwater can be summarized into the gas phase formed via volatilization, the dissolved and free phases of the liquid phase, and the residual phase confined to soil pores and adsorbed by soil particles. These three types coexist in soil pores, transforming and influencing each other. When the soil moisture content changes, the mobilization patterns of the components of NAPL pollution will also change accordingly. The multi-phase mobilization process was also studied based on Si = Vi/Vpore = θi/n (where i indexes water, NAPL, and air) and Swater + SNAPL + Sair = 1. Swater = θwater/n, Sair = Sair-initial (Pmeasured/Pinitial), Sair-initial and Pinitial are the gas saturation and pressure at the initial moment, respectively; Pmeasured is the gas pressure measured during the experiment. The saturation relationship at the initial moment is Sair-initial = 1 − Swater-initial. According to the pore properties of different media, four moisture content conditions of 25%, 20%, 10%, and 5% were set for comparison when different soil moisture contents were simulated in the experiment. During the soil media filling process, the specific steps involved (1) evenly mixing a certain weight of soil and water, according to the required moisture content ratio, and (2) then adding it layer by layer while continuously tamping it to ensure the uniformity of filling (Figure 5). (3) After filling, a syringe was used to inject 15 mL of the petroleum component (with Sudan IV) into the upper port of the glass tube. (4) The dyed contamination components located on the surface began to slowly penetrate the soil pores due to gravity. However, due to the different moisture contents in the soil and different properties of the medium, there were obvious differences in the infiltration process. In order to reflect these differences, the soil moisture content and gas pressure were monitored in real time during the infiltration process, and the corresponding saturation was calculated to explore the change patterns of the three phases. (5) When the measured soil moisture content reached equilibrium, it was considered that the mutual transformation between the three phases reached equilibrium, and the experiment was stopped. (6) In addition, in order to obtain the change pattern relating to the concentration of the components in the three phases, a parallel experiment method was used; that is, four sets of experiments were set up under the same conditions. When the mobilization reached a certain time, the samples were taken out and the component concentrations were measured. The time series for hexadecane and octanoic acid were 0.5, 1.5, 2.5, and 3.5 h, while the time series for toluene and cyclohexane were 0.5, 1, 1.5, and 2 h.

2.3. Sample Analysis

In the experiment, GC-MS (Agilent, 6890N-5975, Santa Clara, CA, USA) was used to qualitatively and quantitatively test the organic components, including petroleum organic components in water and soil. Organic components in the water were sampled and dichloromethane was added for liquid–liquid extraction. After extracting the organic components from the water sample, a sampling rotary evaporator was used for a concentration of 1 mL, and the resulting sample was then subjected to GC-MS for measurement. The organic components in the soil were measured using a Soxhlet drawer instrument. After the separation treatment, a rotary evaporation instrument was also used for a concentration of 1 mL, followed by measurement with GC-MS. The specific GC-MS measurement process and conditions are as follows: During the test process, the gas sample was collected using a 15 mL Agilent vial. The injection needle was inserted to take 10 μL for measurement. The GC-MS test conditions were as follows: (1) Concerning the chromatographic conditions, a capillary chromatography column (30 m × 0.25 mm × 0.25 μm) was used, and the gas chromatography inlet temperature was 250 °C; split injection was performed with a split ratio of 10:1; high-purity helium was used as the carrier gas with a purity of 99.999% in a constant-flow mode with a column flow of 10 mL/min. Regarding the programmed temperature rise, the initial column oven temperature was 35 °C, which was maintained for 3 min and then increased in 10 ℃/min increments to 150 °C and held for 2 min before finally being increased to 200 °C at 20 °C/min and held for 2 min. (2) The conditions used for mass spectrometry are as follows: An electron multiplier voltage of 2108 eV was used with a GC-MS interface temperature of 250 °C and an ion source temperature of 230 °C in a quadrupole configuration. The rod temperature was 150 °C and the electron energy was 70 eV. The full scan mass range was 50–400 m/z. (3) Purge and trap: The OI4560 instrument was used (HP), and the purge time of the purge and trap concentrator was 11 min, the temperature was 34 °C, the desorption time was 2 min, the desorption temperature was 180 °C, the baking time was 10 min, and the baking temperature was 200 °C. The purge gas was high-purity nitrogen with a purity of 99.999% at a purge flow of 40 mL/min, with Tenax used as the adsorbent. The quantitative method used for this measurement adopted the internal standard method; that is, a solution of known concentration was prepared in advance and, after being subjected to GC-MS, a standard curve of concentration and peak area was developed. Then, the peak area of the test sample was compared with the standard curve for quantification. The functional group characteristics of the organic components in the soil and water were measured using a Shimadzu Fourier transform infrared spectrophotometer (Shimadzu, IRPrestige-21, Tokyo, Japan); the specific steps were to take a 5 mL liquid sample for measurement. The soil sample was extracted using the Soxhlet extraction method, using methylene chloride to extract the organic components from the soil for measurement. The moisture content in the soil was measured in real time using a moisture content meter (IMKO, TRIME-PICO32, Ettlingen, Germany). At the same time, a laser particle size distribution analyzer (Better, BT-9300H, Dandong, China), a viscometer (Brookfield, DV-I, Middleboro, MA, USA), and a specific surface meter (Builder, SSA-4000, Beijing, China) were used to measure the size of the soil particles, clay content, liquid viscosity, and specific surface area of the soil. The experimental materials used in this experiment included hexadecane, cyclohexane, toluene, octanoic acid, methylene chloride, carbon tetrachloride (all chromatographically pure), and Sudan IV stain.

2.4. Saturation of Multi-Phase Pollutants

The transport and transformation of pollutants in the underground environment can be attributed to the interactions resulting from different substances in the soil pore space. Underground soil pores contain three types of substances—water, organic pollutants (NAPLs), and air—which together fill the entire pore space. According to the ratio of the soil pore space they occupy to the entire soil pore volume, their saturation in the underground environment can be described; that is, when the soil pores are filled with two or more immiscible fluids (liquid or gas), the saturation Si of a certain phase fluid (i) at a certain point is defined as the characteristic unit around that point in terms of the ratio of the volume of fluid (Vi) occupied by the volume of soil pores (Vpores). In particular, Si = Vi/Vpores = θi/n, where i indicates water, NAPL, and air (where the sum of the three is 1; that is, Swater + SNAPL + Sair = 1); θi represents the moisture content; and n represents the porosity. Therefore, to calculate the residual phase saturation of NAPLs, it is necessary to obtain the saturation of water and air. Based on this principle, the soil column was first completely filled with NAPL to form residual saturation, after which water was injected to discharge the free NAPL while ensuring that the entire pore only contained water and NAPL; that is, there was no gas in the pore (Sair = 0). Then, SNAPL = 1 − Swater, and Swater = θwater/n (where θwater represents the moisture content). After measuring the moisture content with a moisture content meter, the residual saturation of the component in the soil medium can be calculated. In addition, during the experiment, the interconversion mechanism between the three phases was also studied based on the relationship between moisture content and changes in component concentration.

3. Results and Discussions

3.1. Analysis of Mobilization Morphology Characteristics of Pollution Components

3.1.1. Component Mobilization Morphology Formation Process

The mobilization of pollution components requires power and space. Water is the main carrier of pollution components. Its content in the pores seriously affects the mobilization and fate of components; meanwhile, the interaction between the viscosity of components and soil particles is another major factor. In the experiments, a soil moisture content meter was used to monitor the change processes relating to the moisture content in the soil column in real time for 2 min each time, and the concentration, viscosity, and functional groups of the liquid during the discharge of NAPL were analyzed. The results are shown in Figure 6.
As can be seen in Figure 6, the moisture content mainly presented three stages—decreasing, balancing, and increasing—which correspond to the infiltration, saturation, and discharge of NAPL in the soil, respectively, indicating that changes in moisture content are closely related to component concentrations and soil properties, and there are differences between different components and different media. First, this is due to the large differences in pore size, soil particle size, and adsorption performance in different media. The particle size of coarse sand is larger, with an average particle size (d50) of 653.55 μm. During the drainage stage, the time for the moisture content to reach equilibrium is the shortest (average 173 min), while, in clay (d50 is 45.53 μm), the time was the longest (average 312 min)—about 1.8 times that of coarse sand. In the NAPL saturation stage, due to the different clay particles contained in the medium, the adsorption capacity for components also differed. The clay content in coarse sand was only 1.01%, and the components moved faster in it; thus, it took the shortest time to fill the entire soil column. Meanwhile, when the clay content was 11.82%, it had the strongest ability to block the components. In addition, the differences between components are also obvious. The viscosity of hexadecane is relatively high (3.34 mPa·s), but its solubility is extremely low, and it is difficult to volatilize. Therefore, water is mainly displaced slowly during the mobilization process, and it takes a long time for the moisture content to reach equilibrium—about 338 min. The change process relating to moisture content for octanoic acid (viscosity 5.83 mPa·s) is similar to that of hexadecane, and the time required to reach equilibrium is 420 min. The viscosity of naphthenic hydrocarbon is 0.98 mPa·s, which is close to that of water. Therefore, it was less hindered during the infiltration process, and the time to reach final equilibrium was faster—about 262 min. Relatively speaking, toluene has the lowest viscosity, the strongest volatility, and the highest solubility; therefore, it mainly tends towards the water and gas phases and its residence time in the soil was the shortest—about 226 min. The moisture content in the soil after finally reaching equilibrium can be calculated as S residual = (n − θw)/n (where S residual represents the soil residual saturation, n represents soil porosity, and θw represents the final soil column moisture content). The residual phase saturation values of each component in different media are provided in Table 3.
It can be seen in Table 3 that the residual phase of the components was the lowest in coarse sand and the highest in clay, which is mainly related to soil particles, porosity, clay content, and other factors; meanwhile, the residual saturation value of octanoic acid was the largest and that of toluene was the smallest, as determined in terms of viscosity and solubility.

3.1.2. Hysteresis Effect Analysis

When the NAPL in the soil column became residually saturated, water was injected from the bottom to the top to discharge the NAPL, and the viscosity and infrared functional group absorbance values of the discharged liquid were measured at the same time. The results indicate that the change in moisture content is caused by the mutual displacement between water and NAPL. However, this displacement did not occur instantaneously. Instead, the obviously dyed NAPL flowed out after water was injected for a period of time. This phenomenon is called the material hysteresis effect of inter-transportation. Observing the material properties revealed that the main cause of hysteresis was the difference in viscosity between the components. Taking the mobilization of hexadecane in coarse sand as an example, in the initial stage, the change in the moisture content was low, with a rate of about 0.09%/min (increasing from 9.5% to 12.2% in 30 min), but the viscosity changed drastically during this time—increasing from 1.15 mPa·s to 2.44 mPa·s in 30 min. This result demonstrates that the water in the outflow liquid decreased while NAPL increased. The water mixed with NAPL, thus changing the viscosity of the components. The rate in the middle section increased to 0.26%/min (from 12.7% to 25.8% in 50 min), but the viscosity remained at a stable level with little change, showing that the oil–water mixture tended to become stable at this time, and NAPL entered the water from the residual phase and floated on the surface of the water. When NAPL was discharged in large quantities in the later period, the outflowing liquid was mainly water, with its viscosity tending towards 1 mPa·s. In addition, the infrared absorption wavelengths of different components corresponding to the characteristic functional groups showed a trend of first increasing and then decreasing, further indicating that water displaced the residual NAPL trapped in the pores and then carried it out of the soil column.

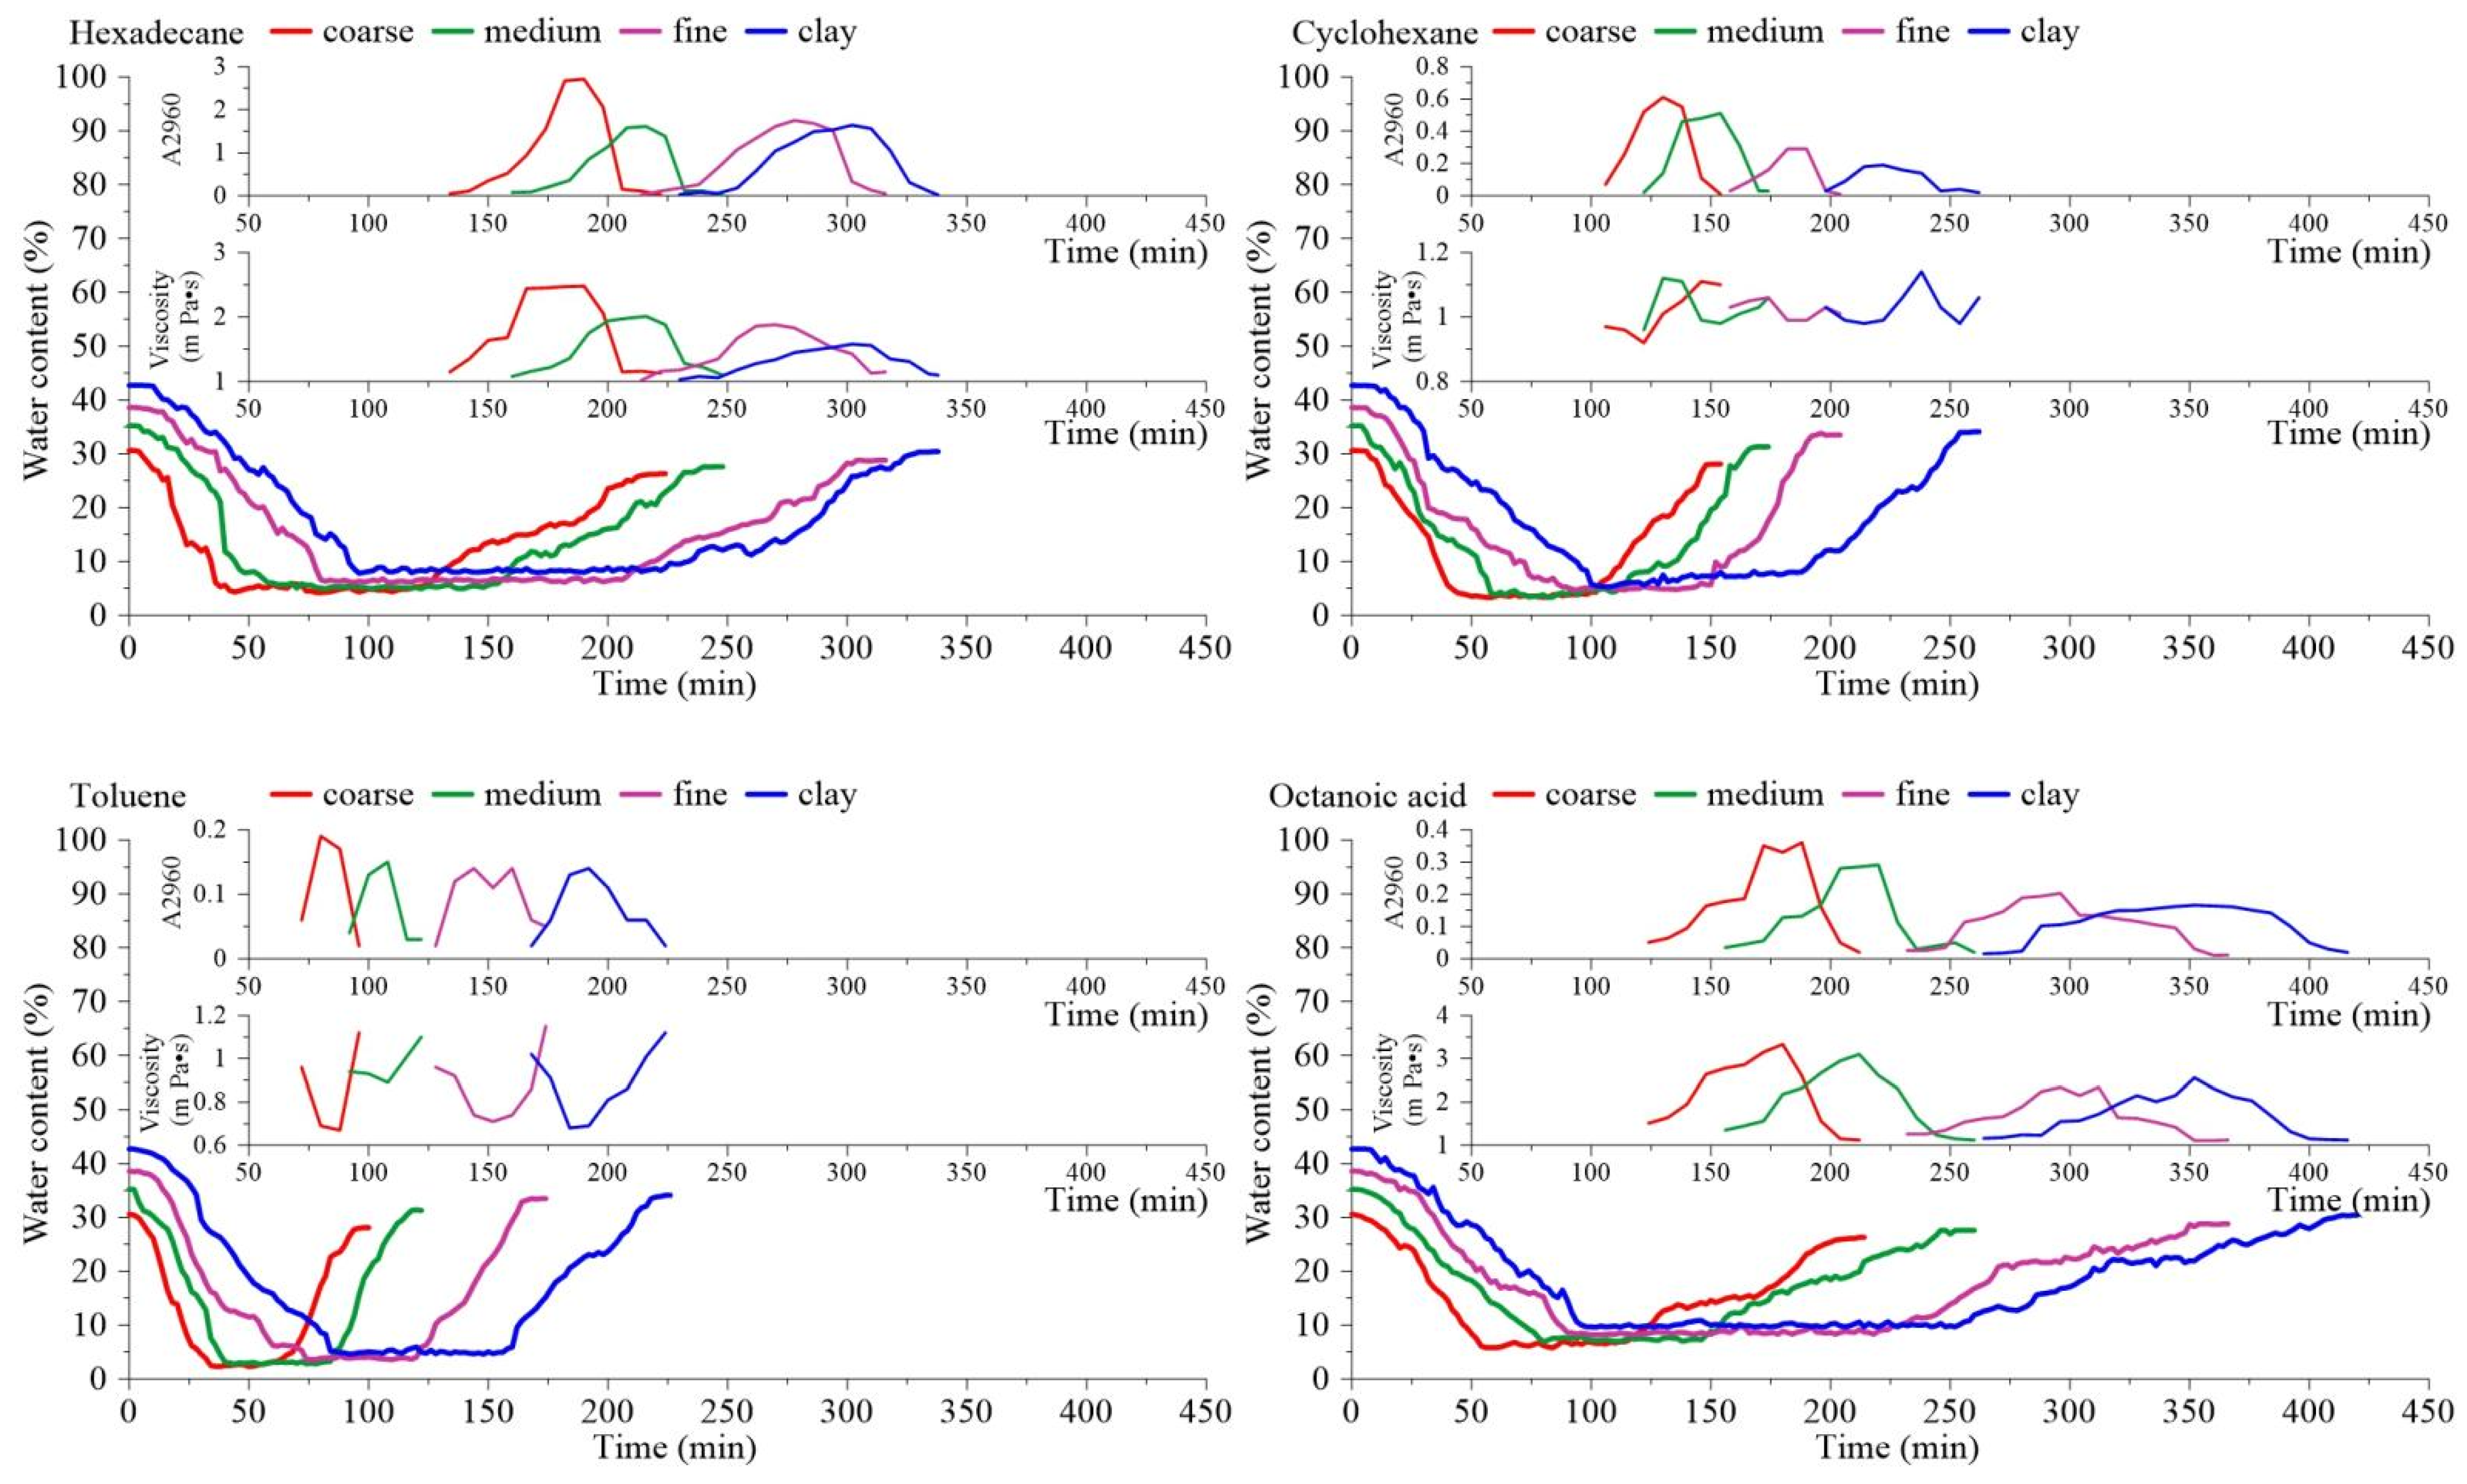
3.2. Mobilization Characteristics of Each Component

In the experiment, a digital camera was used to record the mobilization of the dyeing components, and image processing software was used to extract the RGB values in the picture, allowing for a comparison of the dyed area (Figure 7) in order to clarify the change rules relating to the pollution halo. Figure 7 shows that the processes relating to oil components infiltrating from surface leakage through the vadose zone into groundwater can be summarized into three stages: (1) Free-phase infiltration—a large amount of pollutants leak due to gravity and dispersion. As a result, components migrate to the lower layers and continuously fill the pores. At the same time, free components continue to come into contact with water and soil and begin to displace water in the pores, causing the moisture content to change greatly (Figure 6). (2) The formation of residual phases—during the mobilization of a large number of free components, as soil particles contain a large number of clay particles that can adsorb components, the components are retained on the surfaces of these clay particles. In addition, there are dead-end pores in the pores and, when components enter these, they are difficult to discharge. This part of the component is not easily soluble in water, has difficulty moving freely, and will exist in the soil pores for a long time. (3) A continuous but slow dissolution process—due to constant contact with water, the component is continuously dissolved in the water. As shown in the figure, it can be seen that the red color in the middle area gradually fades; however, as the solubility is low and it is in a flowing phase, this change occurs relatively slowly.
There were obvious differences in the infiltration processes relating to organic components in different media. When NAPL was injected in the case of coarse sand, it was found that NAPL quickly penetrated into the soil; however, its red color did not appear as a whole but, instead, as sparse red spots. This is because the coarse sand particles are large and the pores formed are wide. When NAPL migrates, it first enters along the large pores and then spreads to the entire soil column. The most obvious is toluene, which had the fastest diffusion rate and filled the entire soil column within 30 min (Figure 7). This is mainly because toluene has strong volatility and its viscosity is much lower than that of the other components, so its transportation occurs faster. This infiltration method can be summarized as a convective influx, which quickly spreads along the large pores; however, the process differs in clay. When NAPL is injected into the clay, it remains on the surface for a long time, resulting in fewer red contaminated areas in the soil. After about 30 min, the overall penetration of the red area was only 1.0 cm. This indicates that the penetration of NAPL into clay is very slow and difficult to detect. Therefore, the mobilization characteristics of this NAPL in low-permeability media can be summarized as slow infiltration as a whole and gradual dispersion among soil particle sizes. NAPL enters the pores and displaces water. At the same time, it continuously interacts with water and soil, causing the three forms to continuously transform into each other.

3.3. Different Transformation Processes

As petroleum components mainly exist in three forms when migrating in pores, in order to grasp the component concentration distribution, the content and type of the three forms must first be clarified. During the experiment, the discharged liquid was continuously collected, taking a sample every 8 min, which was put into a 10 mL centrifuge tube and centrifuged for 3 min at 10,000 rpm in a Sigma3-18K high-speed centrifuge. As the density of the component is less than that of water, free components will remain in the upper layer in an undissolved free phase; meanwhile, the stained component in the lower layer will be in a dissolved phase. GC-MS scanning analysis was performed on the two forms of samples, where the liquid in the lower layer was the dissolved phase concentration, and the upper layer was the free phase concentration. The components in the soil are in a residual phase. The relationships between the three-phase concentration changes with time are shown in Figure 8.
It can be seen in Figure 8 that the largest change among the three phases was presented by the free phase, and the free phases of the four components in different media almost all showed a rapidly decreasing trend. This is mainly due to the fact that during the water injection and NAPL drainage process, the freely moving components in the soil column are continuously washed out; however, with time, the content of the free phase decreases, and the discharged concentration also decreases. The concentration comparison of the dissolved phase curve tends to be flat, the change amplitude is relatively small, and the dissolved phase of hexadecane presents almost no change. This is mainly determined by the solubility of the components; the changes in the residual phase mainly reflect the differences between the components. Among them, the change in the residual phase of toluene was the largest. This is because toluene is highly volatile and has a relatively low viscosity. In the soil column, internal mobilization is less hindered; thus, most of it is expelled and the residual phase changes greatly. The residual phases of the other three components also decreased with time but were significantly slower than toluene.

3.4. Effect of Soil Moisture Content on the Mobilization and Distribution of Pollution Components

3.4.1. Mobilization Characteristic Analysis

During the experiment, a high-definition digital camera was used to record the mobilization process of the dyed pollutants, and image processing software was used to analyze the changes in the red area in the images, allowing for comparison and determination of the mobilization rules relating to the pollutant components. The obtained results are provided in Figure 9.
As can be seen in Figure 9, the differences in mobilization under different moisture contents are relatively obvious, which is consistent with the previous mechanism analysis. After entering the soil, the pollutant components continue to displace water and are gradually distributed to different locations. Therefore, the moisture content in the soil controls the mobilization of pollutant components. As the pollutant components are all substances with densities lower than that of water, with a high water content, the NAPLs mainly tend to float in the water, making penetration difficult. From the figure, the change observed when the moisture content is 25% illustrates this mechanism well. The red contaminated area was mainly concentrated on the surface of the soil for a long time (about 1.5 h), then began to slowly expand under the action of gravity, penetrating deep into the soil. Even at about 150 min, the entire soil column was not completely filled. On the contrary, the red area in the low-moisture-content experiment almost filled the soil column within 10 min.
In addition, when the contaminated components fill the soil column, the red-stained area will decline to varying degrees. The decline that occurs with a low moisture content is less obvious, while the decline observed with a high moisture content is more obvious. This is due to the fact that when the moisture content is low, the mixing of the two after injection of NAPLs is poor and, so, the ability of NAPL to flow with water is weak, resulting in a large amount of residue in the soil. Meanwhile, when NAPL is in an environment with a high moisture content, it is constantly mixed with water and migrates to the lower layer, eventually causing a large amount of NAPL in the soil column to be discharged, while the remaining part is relatively small.
Therefore, pollution components in underground environments tend to be stored in areas that have a low moisture content. This also explains why the pollution concentration in the water-saturated zone of actual contaminated sites is often smaller, while the vadose zone is where the main pollution components accumulate. Therefore, in actual remediation processes, more emphasis should be placed on considering the contaminated components in the soil.

3.4.2. Differences in Component Mobilization under Different Moisture

Content Conditions

When components of pollutants migrate into an underground environment, they are mainly affected by environmental media, such as soil, moisture, and gases. Therefore, the properties of the environmental medium determine the mobilization process and final fate of the components. As the most active medium, water plays a key role in the interactions between substances. Therefore, the relationship between the saturation of different forms with time was measured and calculated in the experiment, and the results are shown in Figure 10.
Figure 10 demonstrates that when components migrate into soil media with different moisture contents, there are large differences in the mutual changes between water, NAPL, and air. When the soil medium and components change, there are also varying degrees of differences. The specific discussion can be divided into the following:
(1) Effect of soil medium: When the moisture content is very small, the components entering the pores will change the saturation of gas and water, mainly manifesting as a decrease in the gas saturation of the pores. This is mainly due to the low moisture content, the large remaining pore space in the soil, and the small infiltration resistance of the components, which can discharge gas, thus resulting in a phenomenon of reduced gas saturation. However, there are large differences between different media. In coarse sand, the mobilization of components, water, and gas is relatively smooth and changes rapidly. In clay, due to the small pore space and strong adsorption capacity, the components can only seep underground slowly.
During this process, NAPL gradually accumulates on the surface layer and, when it reaches a certain amount, begins to accelerate downward. If NAPL is highly volatile, the remaining components will gradually decrease and turn into gas. For example, toluene has a special three-phase change curve, in which the gas first decreases, then increases, and then maintains equilibrium. This is because the gas is first discharged during early infiltration and displaces water, allowing toluene to penetrate downward into the pores. As toluene continues to accumulate in the pores, significant volatilization begins to occur, forming gas-phase toluene in the pores, leading to increased gas saturation in the pores. At the same time, the residual saturation first increases and then decreases. This is also caused by the fact that the toluene that enters first remains in the pores and then volatilizes. When the water content is very high, as the components are less dense than water, they will float on the water surface at the beginning and cannot penetrate quickly. At this time, the water and components are continuously mixed and enter the soil pores under the influence of gravity. However, as the components are not easily soluble in water, and it is difficult to drain water in a short period of time, the pore space can only be obtained by exhausting gas, reducing the gas saturation. When a large number of components enter, an equilibrium phase is gradually reached. Likewise, the rate of change is faster in coarse sand and lower in clay. Therefore, the influence of the medium is mainly reflected in the following: NAPL displacement is smoother in coarse-grained soil but more difficult in fine-grained soil; that is, low permeability makes it difficult for NAPL to penetrate the soil layer. Furthermore, when the soil is filled with water, NAPL mainly floats on the surface layer.
(2) Component type: Another factor that affects component mobilization is the physical and chemical properties of the component. The biggest difference between petroleum pollution components and other pollutants is that they have lower water solubility and stronger volatility. Therefore, clarifying the mobilization differences between different components is also a prerequisite for studying and analyzing pollutant distributions. Taking toluene as an example, when it migrates into soil with a moisture content of 25% due to its low viscosity (0.59 mPa·s), the adsorption capacity of the soil is weak, and it migrates quickly. It continuously displaces water, causing the moisture content to decrease at the fastest rate; when toluene migrates into soil with a low moisture content due to its strong volatility, it will gradually volatilize after entering the soil pores, resulting in the evaporation of the components that have remained in the pores, forming gases that escape from the soil. Therefore, the amount of residual toluene in the soil decreased in the later period. Both hexadecane and octanoic acid have high viscosity and can only displace water slowly, slowly increasing NAPL and gas saturation in the pores.

3.4.3. Phase Transformation Analysis

During the experiment, parallel batch experiments were conducted to assess the processes relating to concentration change in soil over time. The gas sample was collected from the gas sampler at the upper port of the soil column, with a sampling volume of 5 mL. After reaching the specified time, as there was still free NAPL in the soil migrating in the pores, part of the NAPL entered the pores at this time, and a residual phase was formed. In order to distinguish between the two, referring to Rhee’s method [56], water with five times the pore volume was injected into the soil column from the top to the bottom, and the NAPL that was still in the free phase was washed out and designated as the water phase until the flushed liquid was no longer red. Meanwhile, the NAPL that was difficult to wash out remained in the soil. The data relating to the three phases were compared, and the effects of moisture content on the mutual transformation between component forms were further determined. The experimental results are shown in Figure 11.
As can be seen in Figure 11, only toluene had a higher concentration in the gas samples obtained (with an average value of 1597.3 mg/L), which gradually increased with time; furthermore, volatilization at a low moisture content was stronger than at a high moisture content. This is mainly because, when the moisture content is high, the pore space is smaller, the volatilization is lower, and the components are mainly miscible with water; meanwhile, when the moisture content in the soil is low, the components tend to enter the soil pores, where the large pore space results in greater volatilization. However, after entering the soil pores, the volatilized toluene cannot escape from the soil column immediately. Instead, it is still imprisoned in the soil pores, causing the gas phase concentration in the pores to increase. The concentrations of hexadecane, cyclohexane, and octanoic acid were maintained at very low levels, with average values of 334.4, 868.3, and 502.6 mg/L, respectively. Similarly, hexadecane and octanoic acid remained in the soil in the highest amounts due to their strong viscosity, while toluene and cyclohexane left fewer residues. As the water solubility of petroleum components is low, their dissolved concentration in water is very low, and they are mainly free in water.

4. Conclusions

According to the results of the batch experiments, the existence and mobilization of petroleum components in the water–soil–NAPL–gas complex system were determined to possess the following main characteristics: (1) The residual content of components is the lowest in coarse sand and the highest in clay, which is mainly affected by the soil particles; meanwhile, the residual saturation value of octanoic acid is the largest, and that of toluene is the smallest, as determined by their viscosity and volatility. (2) The infiltration processes of the components are affected by their properties and medium characteristics. Due to its small particle size and strong adsorption, clay has the highest residual saturation of petroleum pollutants (28.8%). This can even be more than twice that of coarse sand (13.3%). For different components, the residual saturations of octanoic acid and toluene are the highest and lowest, respectively (taking fine sand as an example: 25.3% and 13.2%), with a relatively large difference, as determined in terms of viscosity and solubility. (3) As the free phase can migrate freely, it is transformed most rapidly in the pores. The changes in the dissolved phase of each component are relatively small and tend to be gentle. The changes in the residual phase are mainly affected by volatility, viscosity, soil particles, and pore and cosmid content, and the degree of change is ordered as follows: toluene > cyclohexane > hexadecane > octanoic acid. According to Sun et al., the total saturation of benzene decreased from 71.9% to 10.1% under a controlled system as the soil moisture content increased from 6.4% to 25.4% [57]. Similarly, we observed that the volatilization of toluene decreased from 68.2% to 49.0% as the water saturation increased from 5% to 25% (Figure 10). The results obtained from the two analyses are similar, with the difference relating to the petroleum components (benzene and toluene). Considering a residual concentration of approximately 7700 mg/kg for diesel and sandy soil proposed by Brost and De Vaull, the final residual concentrations of toluene in our experiment were as follows: 5.471, 10.407, 12.244625, and 13.74625 mg/kg when the soil water contents were 25%, 20%, 10%, and 5%, respectively, and with an average value of 10,467.2 mg/kg [58]. Therefore, whether using residual saturation or the residual concentration values, our experiments are comparable.
In summary, the influence of the medium is mainly reflected in the following: NAPL displacement is smoother in coarse-grained soil and more difficult in fine-grained soil; that is, low permeability makes it difficult for NAPL to penetrate the soil layer. When the soil is filled with water, NAPL mainly floats on the surface layer. Volatilization at a low moisture content is stronger than that at a high moisture content; this is mainly because, when the moisture content is higher, the pore space is smaller, volatilization is lower, and the components are mainly miscible with water. Meanwhile, when the moisture content in the soil is low, volatilization is stronger, the components tend to enter the soil pores, and the soil pore space is large and, therefore, facilitates volatilization. However, after entering the soil pores, the volatilized toluene cannot escape from the soil column immediately. Instead, it is still imprisoned in the soil pores, increasing the gas phase concentration in the pores. The concentrations of hexadecane, cyclohexane, and octanoic acid were maintained at very low levels, with average values of 334.4, 868.3, and 502.6 mg/L, respectively. Similarly, hexadecane and octanoic acid remained in the soil in the highest amounts due to their strong viscosity, while toluene and cyclohexane left fewer residues. Due to the low water solubility of petroleum components, their dissolved concentrations in water are very low, and they are mainly free in water.
This experiment systematically studied the saturation and transformation processes relating to NAPL (non-aqueous phase liquid) petroleum pollutants in water–air–soil–NAPL systems. However, there are still some challenges and development trends that need to be addressed. Firstly, the conditions at actual contaminated field sites are extremely complex, making it difficult to accurately predict and control the migration and transformation characteristics of different types of pollutants. This necessitates research and development of effective and accurate monitoring and diagnostic technologies. Additionally, there should be continuous development and improvement of integrated remediation technologies based on actual pollution surveys, as well as the establishment of corresponding technology suitability evaluation systems to provide scientific support for selecting efficient and cost-effective remediation schemes.

Author Contributions

Conceptualization, M.Y.; methodology, M.Y. and B.W.; software, Y.Q. and C.L.; validation, M.Y. and B.W.; formal analysis, M.Y. and Z.C.; investigation, M.Y. and Y.X.; resources, M.Y. and Y.Q.; data curation, M.Y. and Y.X.; writing—original draft preparation, M.Y. and B.W.; writing—review and editing, M.Y. and C.L.; visualization, B.W. and Z.C.; supervision, M.Y. and B.W.; project administration, M.Y. and Y.X.; funding acquisition, B.W. All authors have read and agreed to the published version of the manuscript.

Funding

This research was sponsored by the Guizhou Provincial Basic Research Program (Natural Science) (QKHJC-ZK(2022)-General 186); the National Natural Science Foundation of China (grant Nos. 41602275, 41977298); the High-Level Talent Introduction Program for The Guizhou Institute of Technology (2023GCC085); the Guizhou Provincial Key Technology R&D Program (QKHZC(2023)-General 143); the Provincial Higher Education Teaching Content and Curriculum System Reform Project of Guizhou Province (2023223); the Education and Teaching Reform Research Project of Guizhou Institute of Technology (XJJG-2022-22533); the Open Fund from the Key Lab of Eco-restoration of Regional Contaminated Environment (Shenyang University); the Ministry of Education (KF-22-02); and the Provincial Key Disciplines of Guizhou Province-Geological Resources and Geological Engineering (ZDXK (2018)001).

Data Availability Statement

The original contributions presented in this study are included in the article; further inquiries can be directed to the corresponding author.

Conflicts of Interest

The authors declare no conflicts of interest.

References

  1. Zhang, H.; Han, X.; Wang, G.; Mao, H.; Chen, X.; Zhou, L.; Huang, D.; Zhang, F.; Yan, X. Spatial distribution and driving factors of groundwater chemistry and pollution in an oil production region in the Northwest China. Sci. Total Environ. 2023, 875, 162635. [Google Scholar] [CrossRef] [PubMed]
  2. Sattar, S.; Hussain, R.; Shah, S.M.; Bibi, S.; Ahmad, S.R.; Shahzad, A.; Zamir, A.; Rauf, Z.; Noshad, A.; Ahmad, L. Composition, impacts, and removal of liquid petroleum waste through bioremediation as an alternative clean-up technology: A review. Heliyon 2022, 8, e11101. [Google Scholar] [CrossRef] [PubMed]
  3. Guo, Y.; Wen, Z.; Cheng, Z.; Jakada, H. Contamination and natural attenuation characteristics of petroleum hydrocarbons in a fractured karst aquifer, North China. Environ. Sci. Pollut. R. 2020, 27, 22780–22794. [Google Scholar] [CrossRef] [PubMed]
  4. Mukhopadhyay, A.; Quinn, M.; Al-Haddad, A.; Al-Khalid, A.; Al-Qallaf, H.; Rashed, T.; Bhandary, H.; Al-Salman, B.; Bushehri, A.; Boota, A. Pollution of fresh groundwater from damaged oil wells, North Kuwait. Environ. Earth Sci. 2017, 76, 145. [Google Scholar] [CrossRef]
  5. Ukhurebor, K.E.; Athar, H.; Adetunji, C.O.; Aigbe, U.O.; Onyancha, R.B.; Abifarin, O. Environmental implications of petroleum spillages in the Niger Delta region of Nigeria: A review. J. Environ. Manag. 2021, 293, 112872. [Google Scholar] [CrossRef] [PubMed]
  6. Cagle, G.A.; Chen, H.; Fleeger, J.W.; Deis, D.R.; Lin, Q.; Hou, A. Spatial heterogeneity and oil pollution structured the soil microbial community in salt marshes in Barataria Bay, Louisiana, USA, eight years after the Deepwater Horizon oil spill. Ecol. Indic. 2024, 160, 111884. [Google Scholar] [CrossRef]
  7. Al-Mebayedh, H.; Niu, A.; Lin, C. Strategies for cost-effective remediation of widespread oil-contaminated soils in Kuwait, an environmental legacy of the first Gulf War. J. Environ. Manag. 2023, 344, 118601. [Google Scholar] [CrossRef] [PubMed]
  8. Yuan, L.; Wu, Y.; Fan, Q.; Li, P.; Liang, J.; Wang, Z.; Li, R.; Shi, L. Spatial distribution, composition, and source analysis of petroleum pollutants in soil from the Changqing Oilfield, Northwest China. Mar. Pollut. Bull. 2022, 185, 114338. [Google Scholar] [CrossRef] [PubMed]
  9. Kuppusamy, S.; Maddela, N.R.; Megharaj, M.; Venkateswarlu, K. An overview of total petroleum hydrocarbons. In Total Petroleum Hydrocarbons; Springer: Berlin/Heidelberg, Germany, 2020; pp. 1–27. [Google Scholar]
  10. Varjani, S.; Gnansounou, E.; Pandey, A. Comprehensive review on toxicity of persistent organic pollutants from petroleum refinery waste and their degradation by microorganisms. Chemosphere 2017, 188, 280–291. [Google Scholar] [CrossRef]
  11. Xu, C.; Qaria, M.A.; Xu, Q.; Zhu, D. The role of microorganisms in petroleum degradation: Current development and prospects. Sci. Total Environ. 2023, 865, 161112. [Google Scholar]
  12. Sheng, Y.; Zhang, X.; Zhai, X.; Zhang, F.; Li, G.; Zhang, D. A mobile, modular and rapidly-acting treatment system for optimizing and improving the removal of non-aqueous phase liquids (NAPLs) in groundwater. J. Hazard Mater. 2018, 360, 639–650. [Google Scholar] [CrossRef] [PubMed]
  13. De Simone, G.; Lai, C.; Pompilj, F.; Galli, G.; Tuccimei, P. Laboratory simulation of recent NAPL spills to investigate radon partition among NAPL vapours and soil air. Appl. Radiat. Isot. 2017, 120, 106–110. [Google Scholar] [CrossRef] [PubMed]
  14. Ossai, I.C.; Ahmed, A.; Hassan, A.; Hamid, F.S. Remediation of soil and water contaminated with petroleum hydrocarbon: A review. Environ. Technol. Innov. 2020, 17, 100526. [Google Scholar] [CrossRef]
  15. Zargar, M.; Sarrafzadeh, M.H.; Taheri, B.; Keshavarz, A. Assessment of In Situ Bioremediation of Oil Contaminated Soil and Groundwater in a Petroleum Refinery: A Laboratory Soil Column Study. Petrol. Sci. Technol. 2014, 32, 1553–1561. [Google Scholar] [CrossRef]
  16. Liu, J.; Wei, K.; Xu, S.; Cui, J.; Ma, J.; Xiao, X.; Xi, B.; He, X. Surfactant-enhanced remediation of oil-contaminated soil and groundwater: A review. Sci. Total Environ. 2021, 756, 144142. [Google Scholar] [CrossRef] [PubMed]
  17. Wang, Z.; Yang, P.; Guo, H.; Wang, Y. Enhanced mass transfer of residual NAPL by convection in stagnant zone. J. Hydrol. 2023, 625, 130050. [Google Scholar] [CrossRef]
  18. Ramezanzadeh, M.; Aminnaji, M.; Rezanezhad, F.; Ghazanfari, M.H.; Babaei, M. Dissolution and remobilization of NAPL in surfactant-enhanced aquifer remediation from microscopic scale simulations. Chemosphere 2022, 289, 133177. [Google Scholar] [CrossRef]
  19. Mobile, M.A.; Widdowson, M.A.; Stewart, L.; Nyman, J.; Deeb, R.A.; Kavanaugh, M.C.; Mercer, J.W.; Gallagher, D.L. In-situ determination of field-scale NAPL mass transfer coefficients: Performance, simulation and analysis. J. Contam. Hydrol. 2016, 187, 31–46. [Google Scholar] [CrossRef] [PubMed]
  20. Sakhaei, Z.; Daryaee, R.; Moosavi, A.A.; Carrasco-Marin, F.; Betancur, S.; Bailón-García, E.; Pérez-Cadenas, A.F.; Riazi, M. Chemical-assisted biological methods for in situ remediation of petroleum hydrocarbon-contaminated soils. In Biotechnology of Emerging Microbes; Sarma, H., Joshi, S.J., Eds.; Academic Press: Cambridge, MA, USA, 2024; pp. 217–261. [Google Scholar]
  21. Guan, J.; Huang, J.; Sun, Y.; Li, C.; Wan, Y.; Guo, W.; Kang, R.; Pang, H.; Shi, Q.; McHugh, T.J. Understanding petroleum vapor fate and transport through high resolution analysis of two distinct vapor plumes. Sci. Total Environ. 2024, 912, 169464. [Google Scholar] [CrossRef]
  22. Fatehbasharzad, P.; Aliasghari, S.; Tabrizi, I.S.; Khan, J.A.; Boczkaj, G. Microbial fuel cell applications for removal of petroleum hydrocarbon pollutants: A review. Water Resour. Ind. 2022, 28, 100178. [Google Scholar] [CrossRef]
  23. Qi, S.; Luo, J.; O’Connor, D.; Wang, Y. A numerical model to optimize LNAPL remediation by multi-phase extraction. Sci. Total Environ. 2020, 718, 137309. [Google Scholar] [CrossRef]
  24. Mohamed, A.; El-Menshawy, N.; Saif, A.M. Remediation of saturated soil contaminated with petroleum products using air sparging with thermal enhancement. J. Environ. Manag. 2007, 83, 339–350. [Google Scholar] [CrossRef] [PubMed]
  25. Petri, B.G.; Fučík, R.; Illangasekare, T.H.; Smits, K.M.; Christ, J.A.; Sakaki, T.; Sauck, C. Effect of NAPL source morphology on mass transfer in the vadose zone. Groundwater 2014, 53, 685–698. [Google Scholar] [CrossRef] [PubMed]
  26. Cao, Z.; Yang, M.; Tan, T.; Song, X. Vertical transportation diversity of petroleum pollutants under groundwater fluctuations and the instructions for remediation strategy. Sustainability 2023, 15, 6514. [Google Scholar] [CrossRef]
  27. Sookhak, L.K.; Rayner, J.L.; Davis, G.B. Towards optimizing LNAPL remediation. Water Resour. Res. 2019, 55, 923–936. [Google Scholar] [CrossRef]
  28. Podgorski, D.C.; Zito, P.; Kellerman, A.M.; Bekins, B.A.; Cozzarelli, I.M.; Smith, D.F.; Cao, X.; Schmidt-Rohr, K.; Wagner, S.; Stubbins, A. Hydrocarbons to carboxyl-rich alicyclic molecules: A continuum model to describe biodegradation of petroleum-derived dissolved organic matter in contaminated groundwater plumes. J. Hazard Mater. 2021, 402, 123998. [Google Scholar] [CrossRef]
  29. Ciampi, P.; Esposito, C.; Cassiani, G.; Deidda, G.P.; Rizzetto, P.; Papini, M.P. A field-scale remediation of residual light non-aqueous phase liquid (LNAPL): Chemical enhancers for pump and treat. Environ. Sci. Pollut. R. 2021, 28, 35286–35296. [Google Scholar] [CrossRef]
  30. Wei, K.; Ma, J.; Xi, B.; Yu, M.; Cui, J.; Chen, B.; Li, Y.; Gu, Q.; He, X. Recent progress on in-situ chemical oxidation for the remediation of petroleum contaminated soil and groundwater. J. Hazard Mater. 2022, 432, 128738. [Google Scholar] [CrossRef] [PubMed]
  31. Kechavarzi, C.; Soga, K.; Illangasekare, T.H. Two-dimensional laboratory simulation of LNAPL infiltration and redistribution in the vadose zone. J. Contam. Hydrol. 2005, 76, 211–233. [Google Scholar] [CrossRef]
  32. He, Z.; Liang, F.; Meng, J.; Li, N. Effects of groundwater fluctuation on migration characteristics and representative elementary volume of entrapped LNAPL. J. Hydrol. 2022, 610, 127833. [Google Scholar] [CrossRef]
  33. Onaa, C.; Emmanuel Olaobaju, A.; Amro, M. Experimental and numerical assessment of Light Non-Aqueous Phase Liquid (LNAPL) subsurface migration behavior in the vicinity of groundwater table. Environ. Technol. Innov. 2021, 23, 101573. [Google Scholar] [CrossRef]
  34. Karthick, A.; Roy, B.; Chattopadhyay, P. A review on the application of chemical surfactant and surfactant foam for remediation of petroleum oil contaminated soil. J. Environ. Manag. 2019, 243, 187–205. [Google Scholar] [CrossRef] [PubMed]
  35. Ding, F.; Gao, M. Pore wettability for enhanced oil recovery, contaminant adsorption and oil/water separation: A review. Adv. Colloid. Interfac. 2021, 289, 102377. [Google Scholar] [CrossRef]
  36. Chen, T.; Zhang, Y.; Fu, B.; Huang, W. An evaluation model for in-situ bioremediation technology of petroleum hydrocarbon contaminated soil. Environ. Pollut. 2024, 344, 123299. [Google Scholar] [CrossRef] [PubMed]
  37. Qing, L.; Tan, X.; Almatrafi, E.; Yang, Y.; Wang, W.; Luo, H.; Qin, F.; Zhou, C.; Zeng, G.; Zhang, C. Effects of biochar-based materials on the bioavailability of soil organic pollutants and their biological impacts. Sci. Total Environ. 2022, 826, 153956. [Google Scholar]
  38. Haruna, A.; Tanimu, G.; Ibrahim, I.; Garba, Z.N.; Yahaya, S.M.; Musa, S.G.; Merican, Z.M.A. Mitigating oil and gas pollutants for a sustainable environment—Critical review and prospects. J. Clean. Prod. 2023, 416, 137863. [Google Scholar] [CrossRef]
  39. Jiang, W.; Meng, L.; Liu, F.; Sheng, Y.; Chen, S.; Yang, J.; Mao, H.; Zhang, J.; Zhang, Z.; Ning, H. Distribution, source investigation, and risk assessment of topsoil heavy metals in areas with intensive anthropogenic activities using the positive matrix factorization (PMF) model coupled with self-organizing map (SOM). Environ. Geochem. Hlth. 2023, 45, 6353–6370. [Google Scholar] [CrossRef] [PubMed]
  40. An, S.; Woo, H.; Kim, S.; Yun, S.; Chung, J.; Lee, S. Complex behavior of petroleum hydrocarbons in vadose zone: A holistic analysis using unsaturated soil columns. Chemosphere 2023, 326, 138417. [Google Scholar] [CrossRef]
  41. Han, K.; Zuo, R.; Cao, X.; Xu, D.; Zhao, X.; Shi, J.; Xue, Z.; Xu, Y.; Wu, Z.; Wang, J. Spatial distribution characteristics and degradation mechanism of microorganisms in n-hexadecane contaminated vadose zone. Sci. Total Environ. 2024, 924, 171462. [Google Scholar] [CrossRef]
  42. Shi, J.; Yang, Y.; Lu, H.; Xi, B.; Li, J.; Xiao, C.; Wang, Y.; Tang, J. Effect of water-level fluctuation on the removal of benzene from soil by SVE. Chemosphere 2021, 274, 129796. [Google Scholar] [CrossRef]
  43. Cavelan, A.; Faure, P.; Lorgeoux, C.; Colombano, S.; Deparis, J.; Davarzani, H.; Enjelvin, N.; Oltéan, C.; Tinet, A.J.; Domptail, F. An experimental multi-method approach to better characterize the LNAPL fate in soil under fluctuating groundwater levels. J. Contam. Hydrol. 2024, 262, 104319. [Google Scholar] [CrossRef] [PubMed]
  44. Koohbor, B.; Colombano, S.; Harrouet, T.; Deparis, J.; Lion, F.; Davarzani, H.; Ataie-Ashtiani, B. The effects of water table fluctuation on LNAPL deposit in highly permeable porous media: A coupled numerical and experimental study. J. Contam. Hydrol. 2023, 256, 104183. [Google Scholar] [CrossRef]
  45. Teramoto, E.H.; Chang, H.K. Field data and numerical simulation of btex concentration trends under water table fluctuations: Example of a jet fuel-contaminated site in Brazil. J. Contam. Hydrol. 2017, 198, 37–47. [Google Scholar] [CrossRef] [PubMed]
  46. Zhao, S.; Wang, J.; Feng, S.; Xiao, Z.; Chen, C. Effects of ecohydrological interfaces on migrations and transformations of pollutants: A critical review. Sci. Total Environ. 2022, 804, 150140. [Google Scholar] [CrossRef]
  47. Sakr, M.; El Agamawi, H.; Klammler, H.; Mohamed, M.M. A review on the use of permeable reactive barriers as an effective technique for groundwater remediation. Groundw. Sust. Dev. 2023, 21, 100914. [Google Scholar] [CrossRef]
  48. Gatsios, E.; García-Rincón, J.; Rayner, J.C.W.; McLaughlan, R.; Davis, G.B. LNAPL transmissivity as a remediation metric in complex sites under water table fluctuations. J. Environ. Manag. 2018, 215, 40–48. [Google Scholar] [CrossRef] [PubMed]
  49. Mineo, S. Groundwater and soil contamination by LNAPL: State of the art and future challenges. Sci. Total Environ. 2023, 874, 162394. [Google Scholar] [CrossRef] [PubMed]
  50. Javanbakht, G.; Arshadi, M.; Qin, T.; Goual, L. Micro-scale displacement of NAPL by surfactant and microemulsion in heterogeneous porous media. Adv. Water Resour. 2017, 105, 173–187. [Google Scholar] [CrossRef]
  51. Yang, Z.; Verpoort, F.; Dong, C.; Chen, C.; Chen, S.; Kao, C. Remediation of petroleum-hydrocarbon contaminated groundwater using optimized in situ chemical oxidation system: Batch and column studies. Process Saf. Environ. 2020, 138, 18–26. [Google Scholar] [CrossRef]
  52. Sun, Y.; Gu, Y.; Zha, Q. A novel surface imprinted resin for the selective removal of metal-complexed dyes from aqueous solution in batch experiments: ACB GGN as a representative contaminant. Chemosphere 2021, 280, 130611. [Google Scholar] [CrossRef]
  53. Negarestani, M.; Reisi, S.; Sohrabi, M.; Shayesteh, H.; Farimaniraad, H.; Mollahosseini, A.; Hosseinzadeh, M.; Tavassoli, S. In-situ growth of Al/Ni layered double hydroxide onto polyaniline-wrapped sisal fibers for highly efficient removal of pharmaceutical Ketoprofen and Ibuprofen contaminants: Batch and fixed-bed column studies. J. Water Process Eng. 2024, 57, 104657. [Google Scholar] [CrossRef]
  54. Xia, Y.; Wang, B.; Yang, Y.; Du, X.; Yang, M. Quantitative assessment of organic mass fluxes and natural attenuation processes in a petroleum-contaminated subsurface environment. Appl. Sci. 2023, 13, 12782. [Google Scholar] [CrossRef]
  55. Stafford, B.P.; Cápiro, N.L.; Alvarez, P.J.J.; Rixey, W.G. Pore Water Characteristics following a release of neat ethanol onto pre-existing NAPL. Ground Water Monit. R. 2009, 29, 93–104. [Google Scholar] [CrossRef]
  56. Rhee, S.; Lee, S.; Park, J. Effect of soil organic carbon on the quantification of jet-fuels in soil using partitioning tracer method. J. Hazard Mater. 2010, 184, 49–57. [Google Scholar] [CrossRef] [PubMed]
  57. Sun, Y.; Yue, G.; Ma, J. Transport and natural attenuation of benzene vapor from a point source in the vadose zone. Chemosphere 2023, 323, 138222. [Google Scholar] [CrossRef]
  58. Brost, E.J.; DeVaull, G.E. Non-aqueous phase liquid (NAPL) mobility limits in soil. API Soil Groundw. Res. Bull. 2000, 9, 1–9. [Google Scholar]
Figure 1. Conceptual model of the transportation of NAPL pollutants in the groundwater and soil system based on the contaminated site and stratigraphic column [26].
Water 16 01775 g001
Figure 2. Grain size distribution and SEM (scanning electron microscope) images of the experimental soil media [26].
Water 16 01775 g002
Figure 3. Types of organic matter and average n-alkane concentration in groundwater at the actual oil-contaminated site.
Water 16 01775 g003
Figure 4. Residual phase saturation experimental device (batch experiment 1).
Water 16 01775 g004
Figure 5. Diagram of the experimental design and device for the assessment of the effects of different moisture contents on component mobilization.
Water 16 01775 g005
Figure 6. Moisture content and physical and chemical parameters of the outflow liquid when discharging NAPL.
Water 16 01775 g006
Figure 7. Changes in toluene pollution areas in different media.
Water 16 01775 g007
Figure 8. Changes in the concentrations of the three pollutant species over time.
Water 16 01775 g008
Figure 9. Change map of hexadecane pollution area in medium sand column under different soil water content conditions.
Water 16 01775 g009
Figure 10. Change in saturation of three phases (air, water, and NAPL) in coarse sand under different soil water content conditions.
Water 16 01775 g010
Figure 11. Concentration change in water–soil–gas three-phase components in coarse sand.
Water 16 01775 g011
Table 1. Characteristics of the soil media at the actual oil-contaminated site.
Media TypeCoarse SandMedium SandFine SandClay
Packing density (g/cm3)1.831.721.631.52
Porosity (%)30.935.238.642.7
Specific surface area (m2/kg)58.8126.4231.8449.6
Organic matter content (%)1.52.23.63.8
Mean diameter (μm)653.55281.21129.3245.53
Table 2. Properties of the petroleum compounds at the actual oil-contaminated site.
MW
(g/mol)
FGA
(cm−1)
S
(mg/L)
ρ
(g/cm3)
BP
(℃)
η
(mPa·s)
H
(cm3/cm3)
log
Kow
Koc
(cm3/g)
Dair
(cm2/s)
Dwater
(cm2/s)
Hexadecane226.4-(CH2)n-2960260.7732873.341.6 × 1028.248.47 × 1060.0374.2 × 10−6
Cyclohexane84.2Water 16 01775 i0011450550.77980.70.987.8 × 1003.449.63 × 1020.0849.1 × 10−6
Toluene92.1Water 16 01775 i0027485150.866110.60.592.7 × 10−12.692.34 × 1020.0878.6 × 10−6
Octanoic acid144.2-COOH12446800.911239.75.835.0 × 1023.051.10 × 1040.0233.6 × 10−6
MW = molar mass; S = solubility; ρ = density; BP = vapor pressure; η = viscosity; H = Henry’s constant; Kow = partition coefficient of n-octanoic alcohol; Koc = partition coefficient of organic carbon; Dair = dispersion coefficient in gas; Dwater = dispersion coefficient in water; FG = characteristic functional group; A = absorption wave number.
Table 3. Residual phase saturation values (%) of different components in different media.
Residual Saturation (%)HexadecaneCyclohexaneTolueneOctanoic Acid
Coarse sand13.310.68.214.2
Medium sand16.215.211.121.8
Fine sand21.618.813.225.3
Clay28.124.220.128.8
Disclaimer/Publisher’s Note: The statements, opinions and data contained in all publications are solely those of the individual author(s) and contributor(s) and not of MDPI and/or the editor(s). MDPI and/or the editor(s) disclaim responsibility for any injury to people or property resulting from any ideas, methods, instructions or products referred to in the content.

