


Tracking the Dynamics of Spartina alterniflora with WorldView-2/3 and Sentinel-1/2 Imagery in Zhangjiang Estuary, China

Abstract
1. Introduction
2. Data
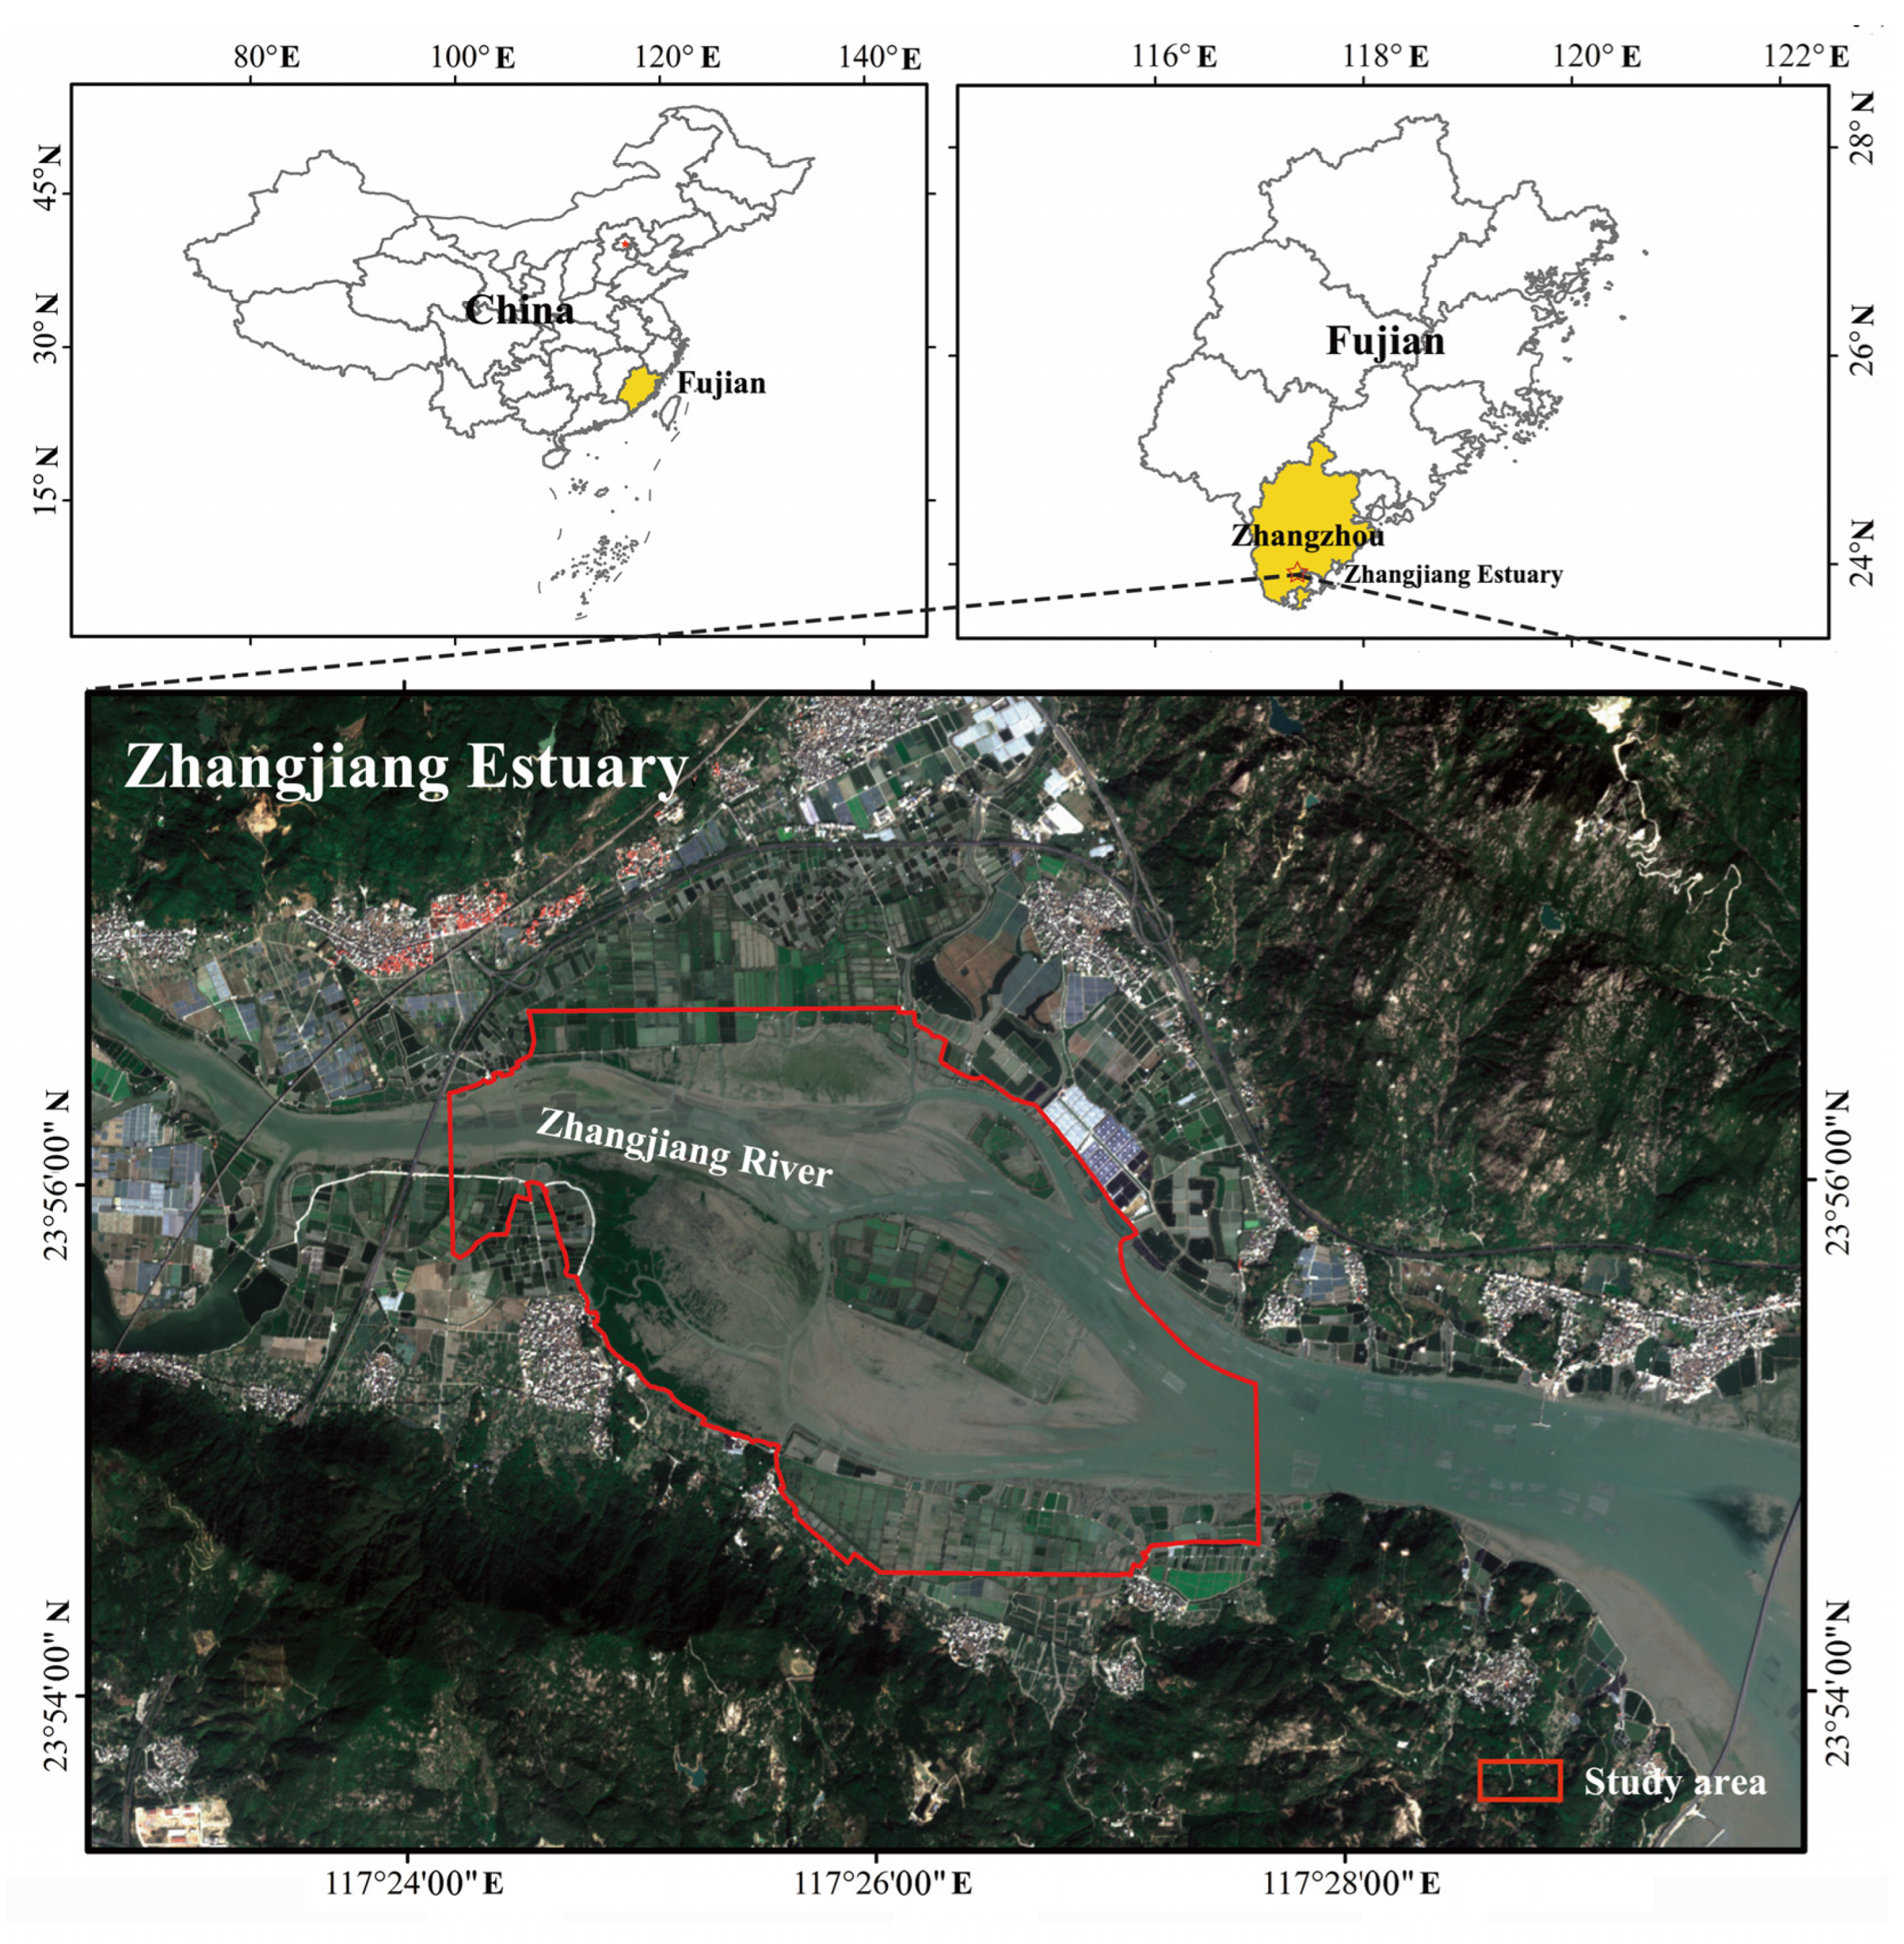
2.1. Study Site
2.2. Data and Preprocessing
2.3. Reference Data
3. Methods
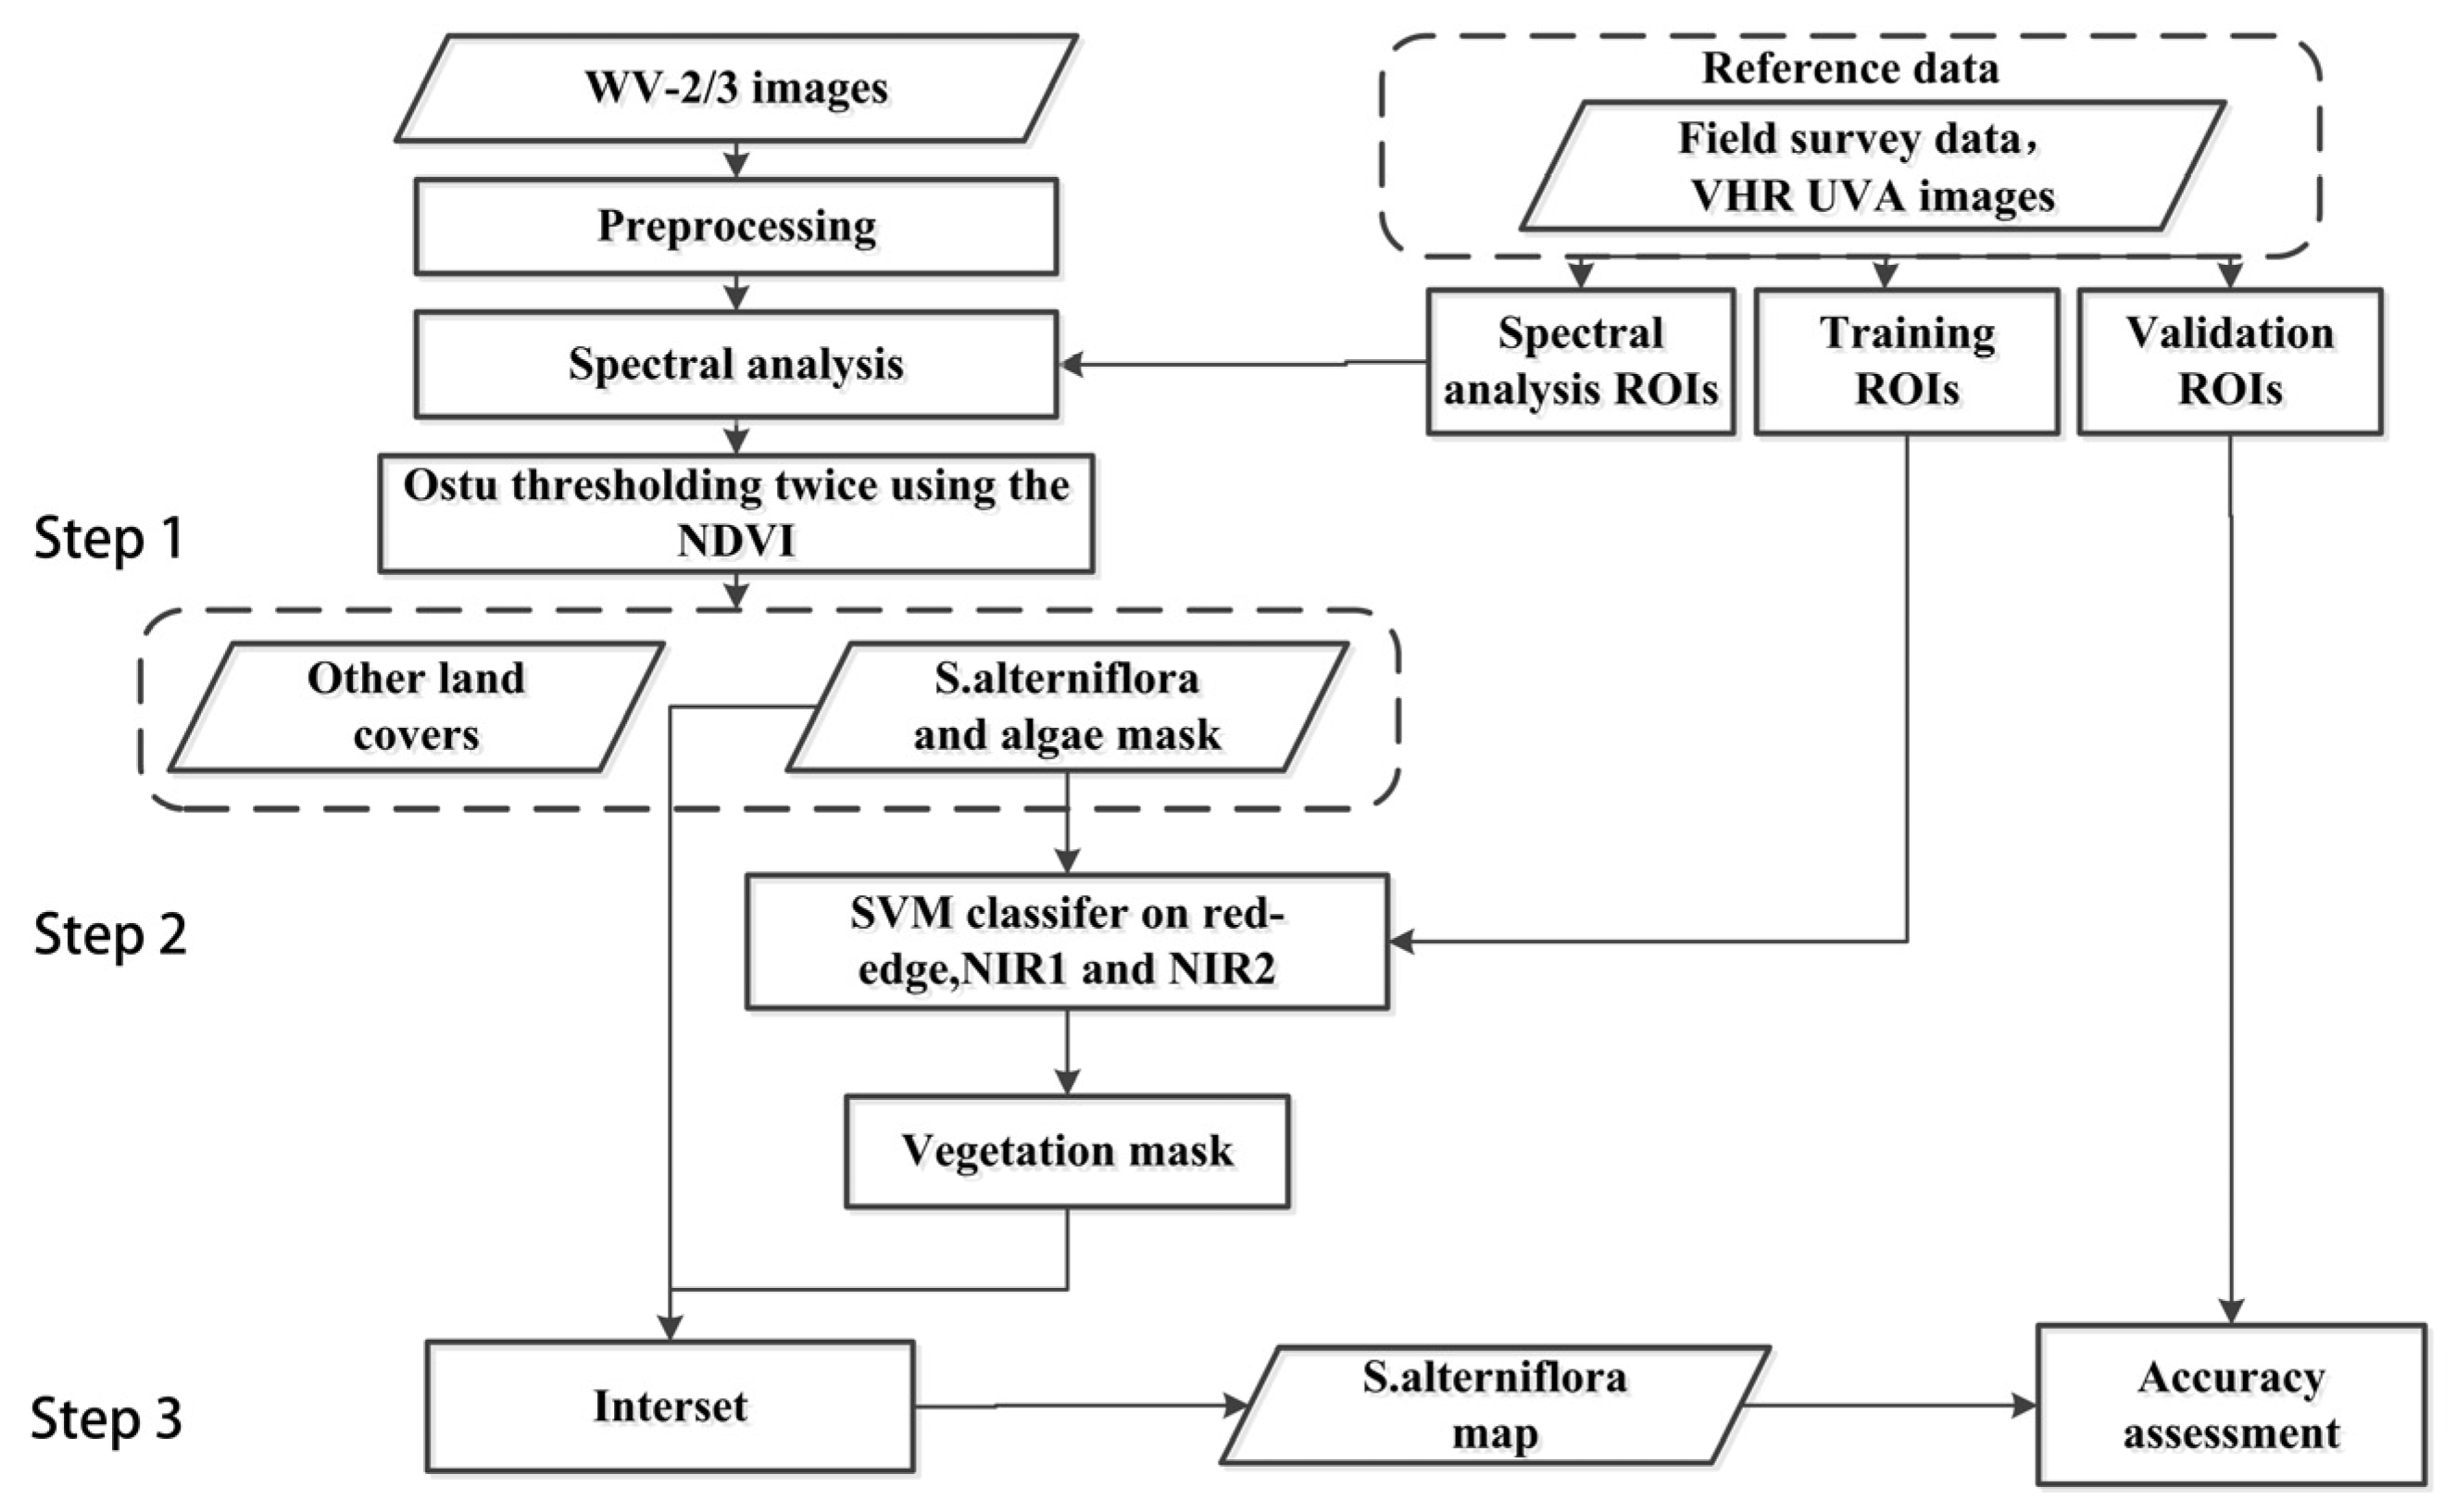
3.1. A New Method to Extract S. alterniflora with 8-Band WV-2/3 Imagery
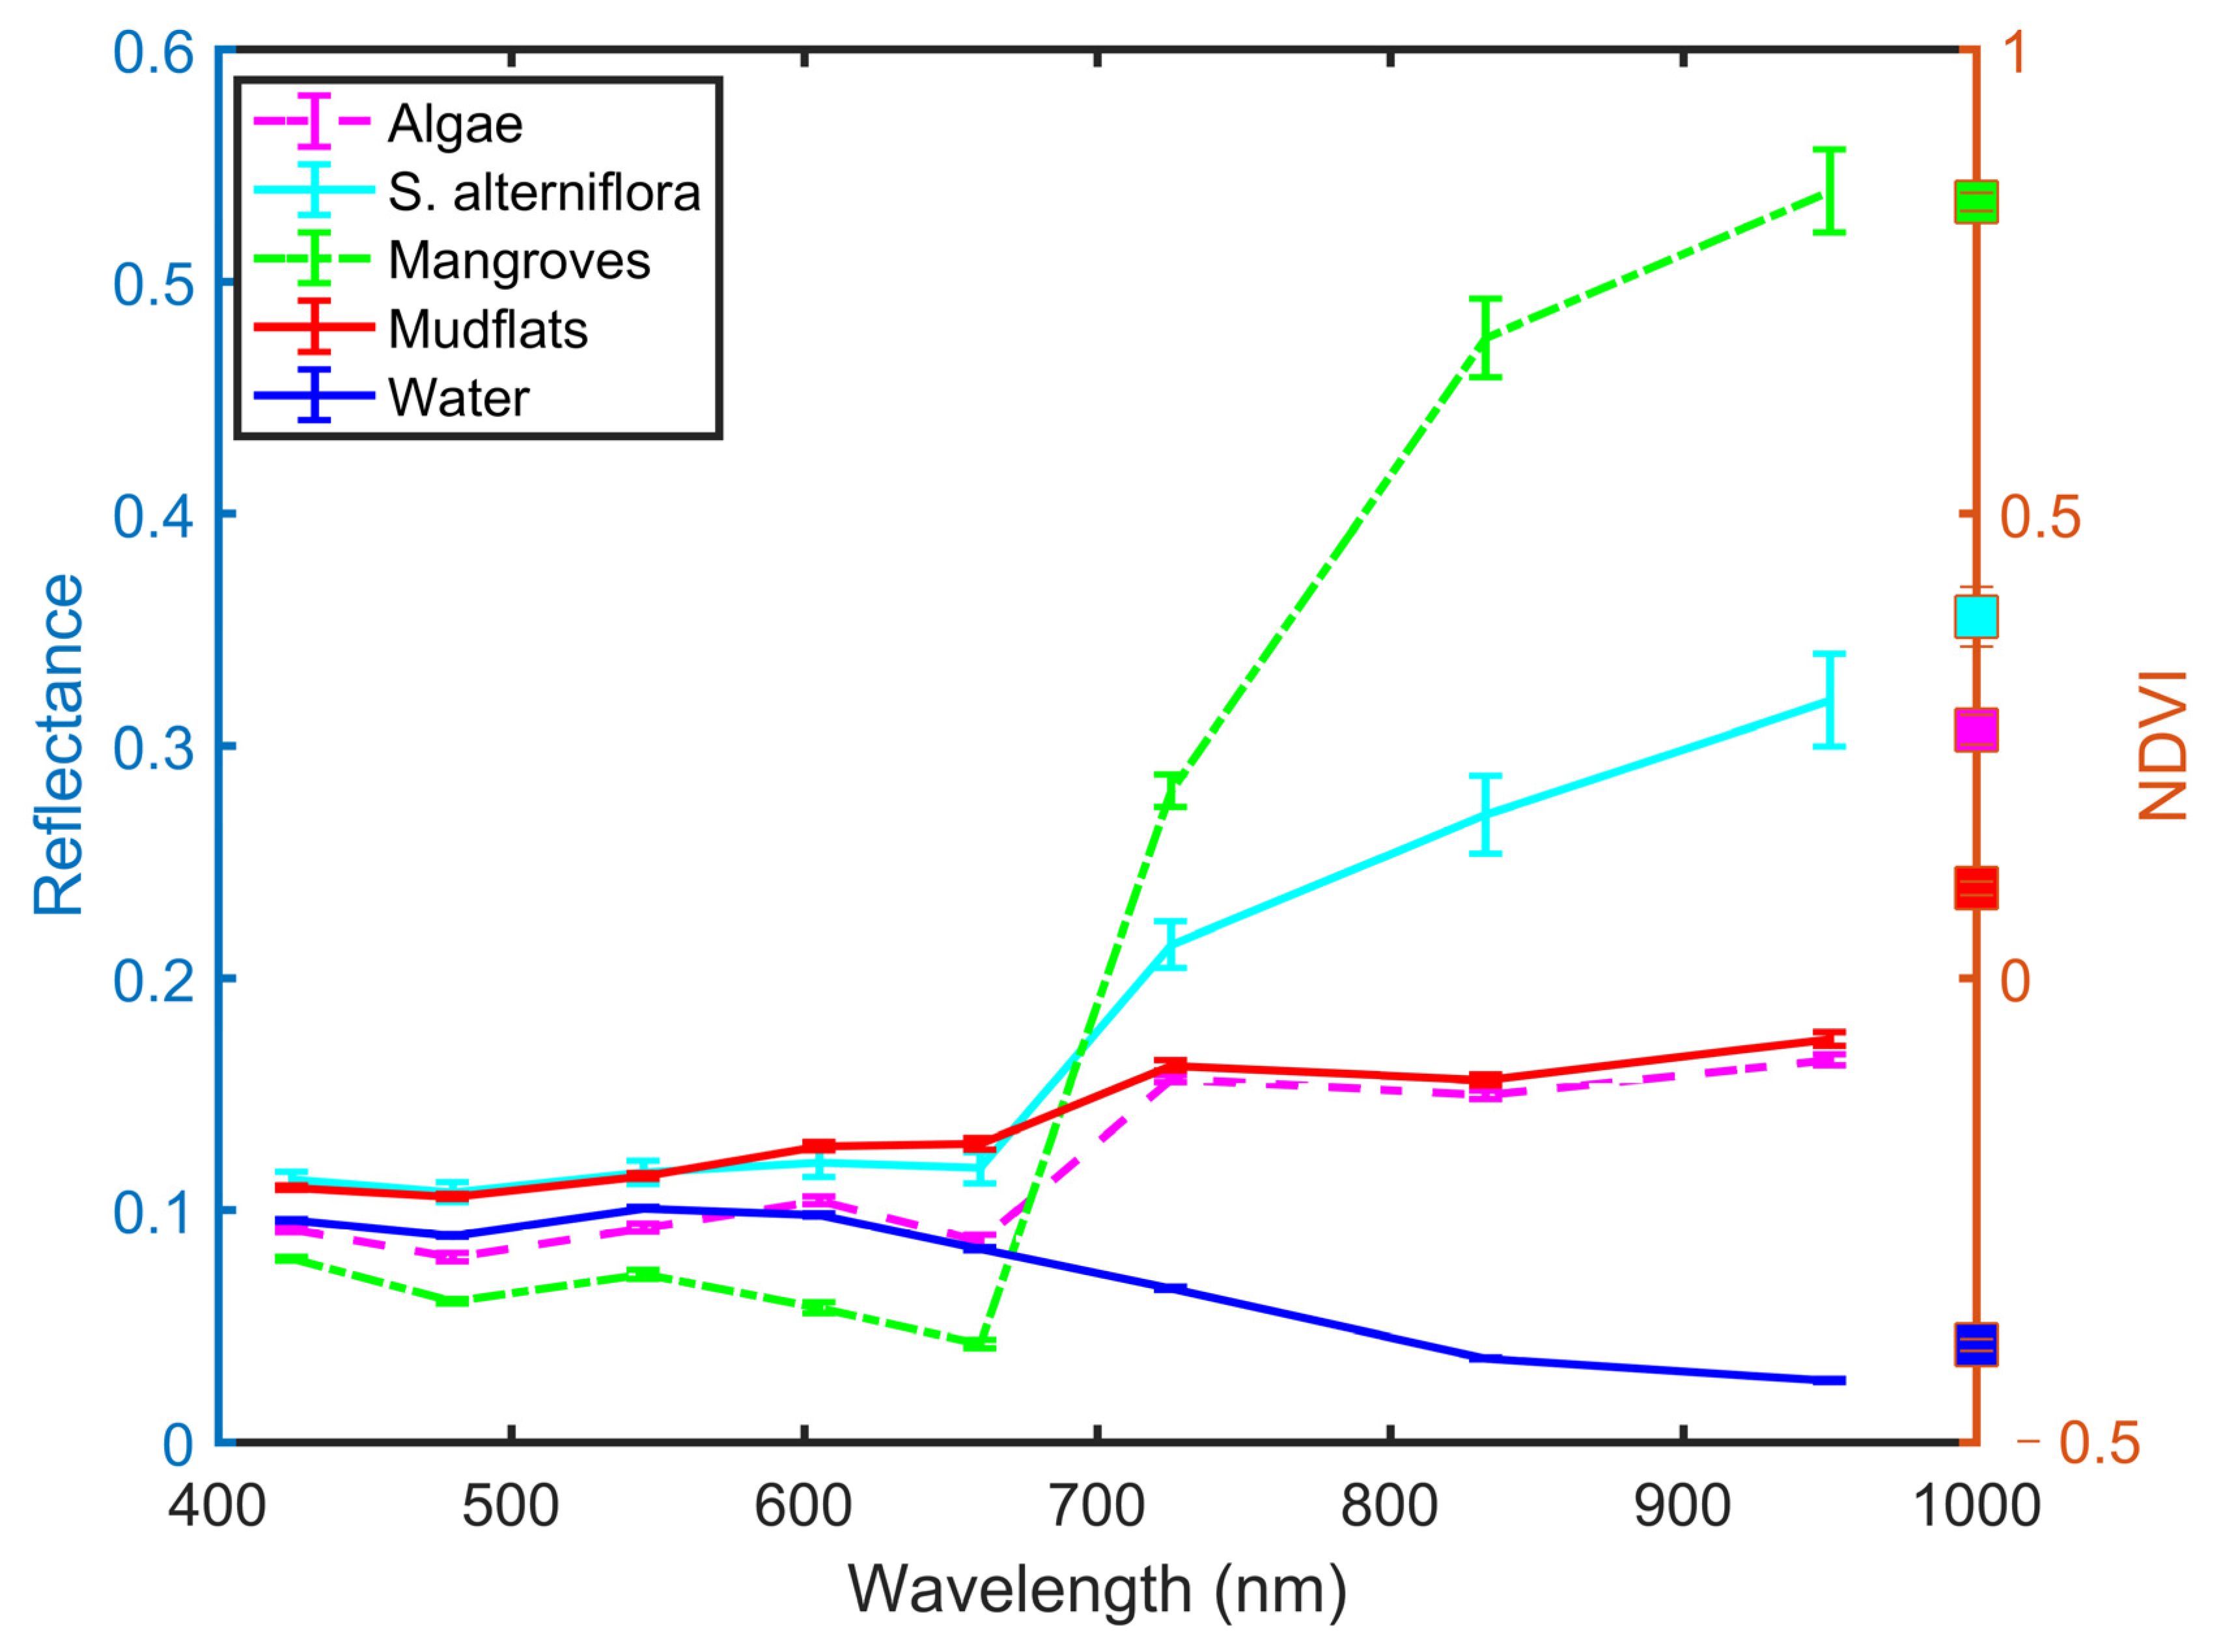
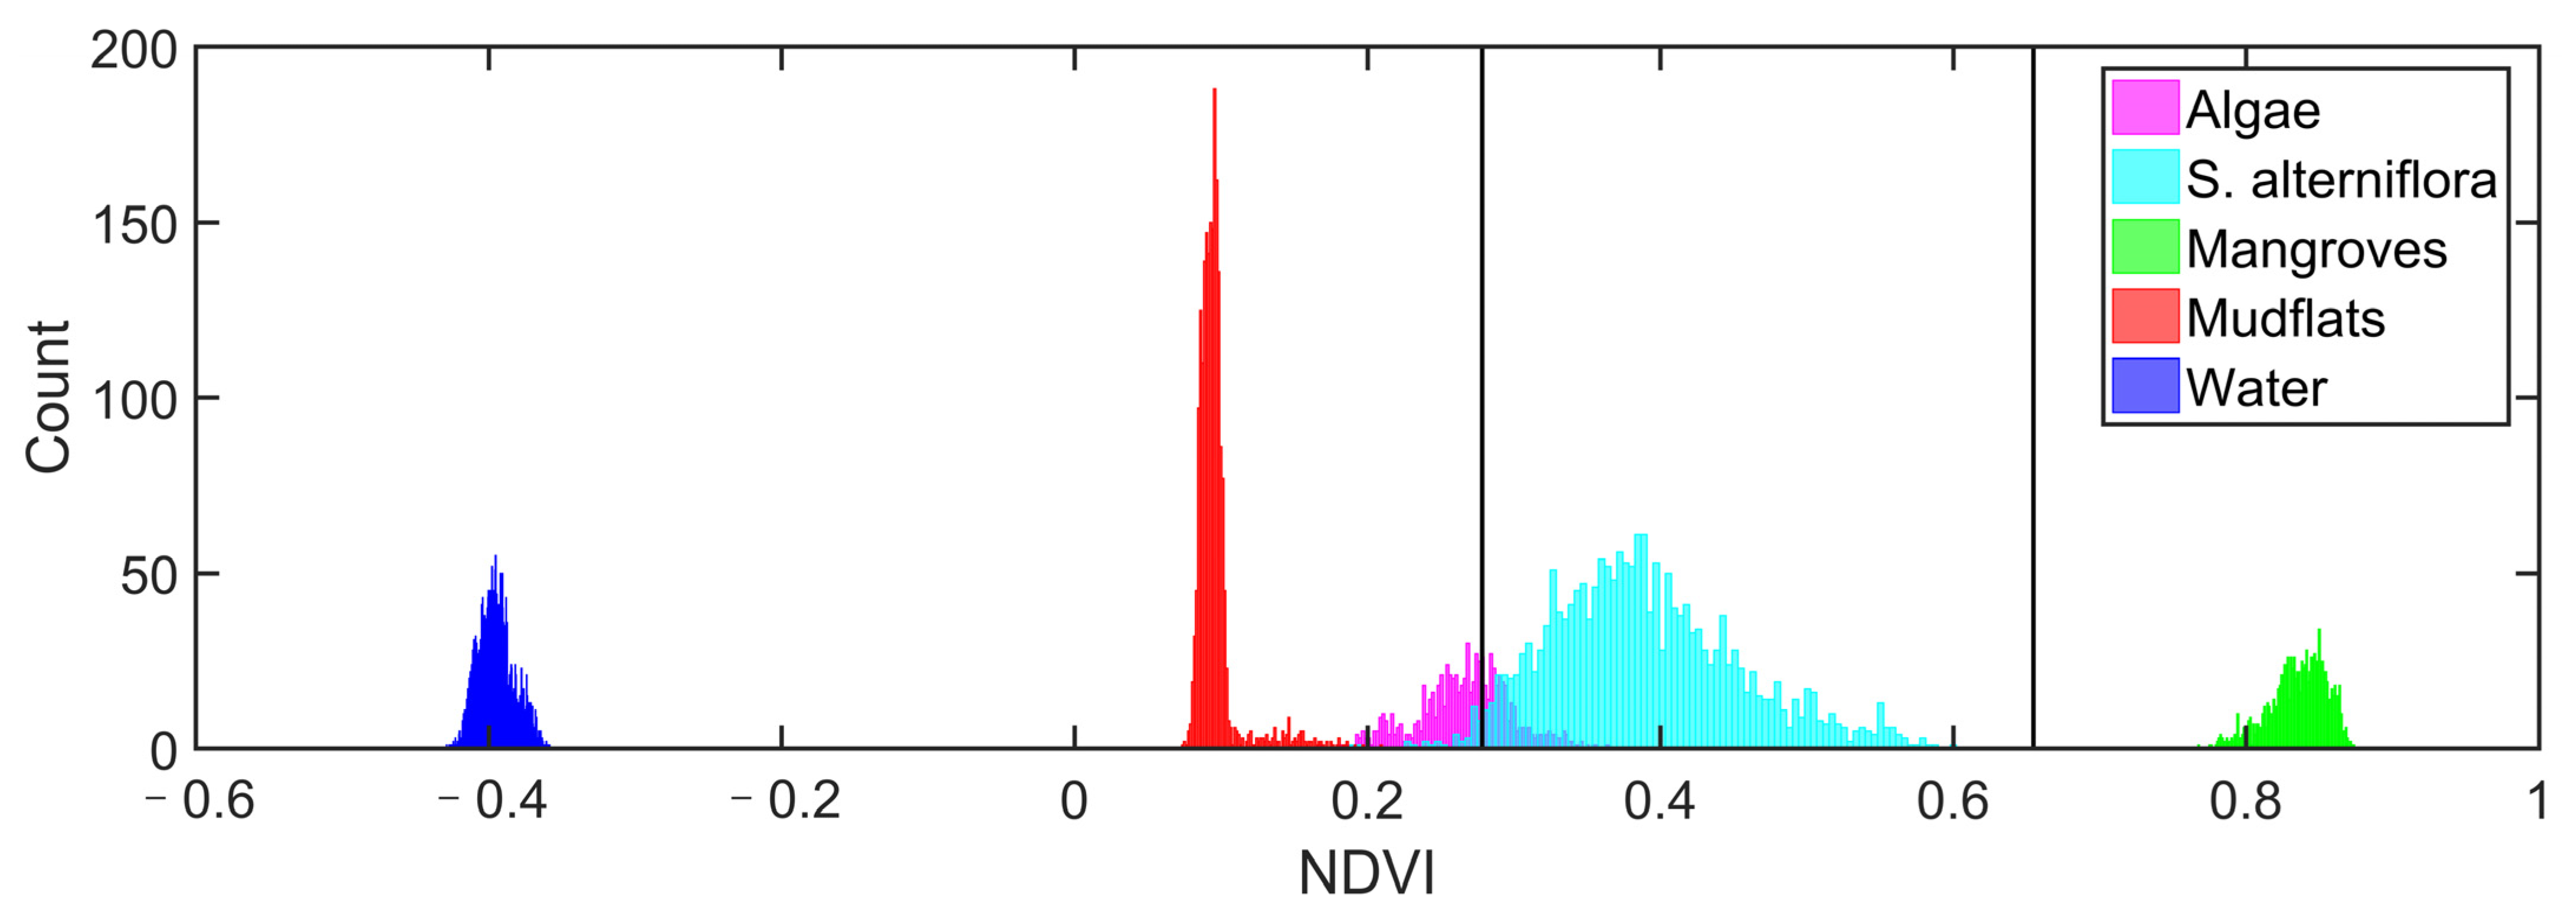
3.1.1. Spectral Analysis
3.1.2. The Extraction of S. alterniflora and Itinerant Biological Structures
3.1.3. Discrimination of S. alterniflora from Itinerant Biological Structures
3.2. Intra-Class Separability Evaluation
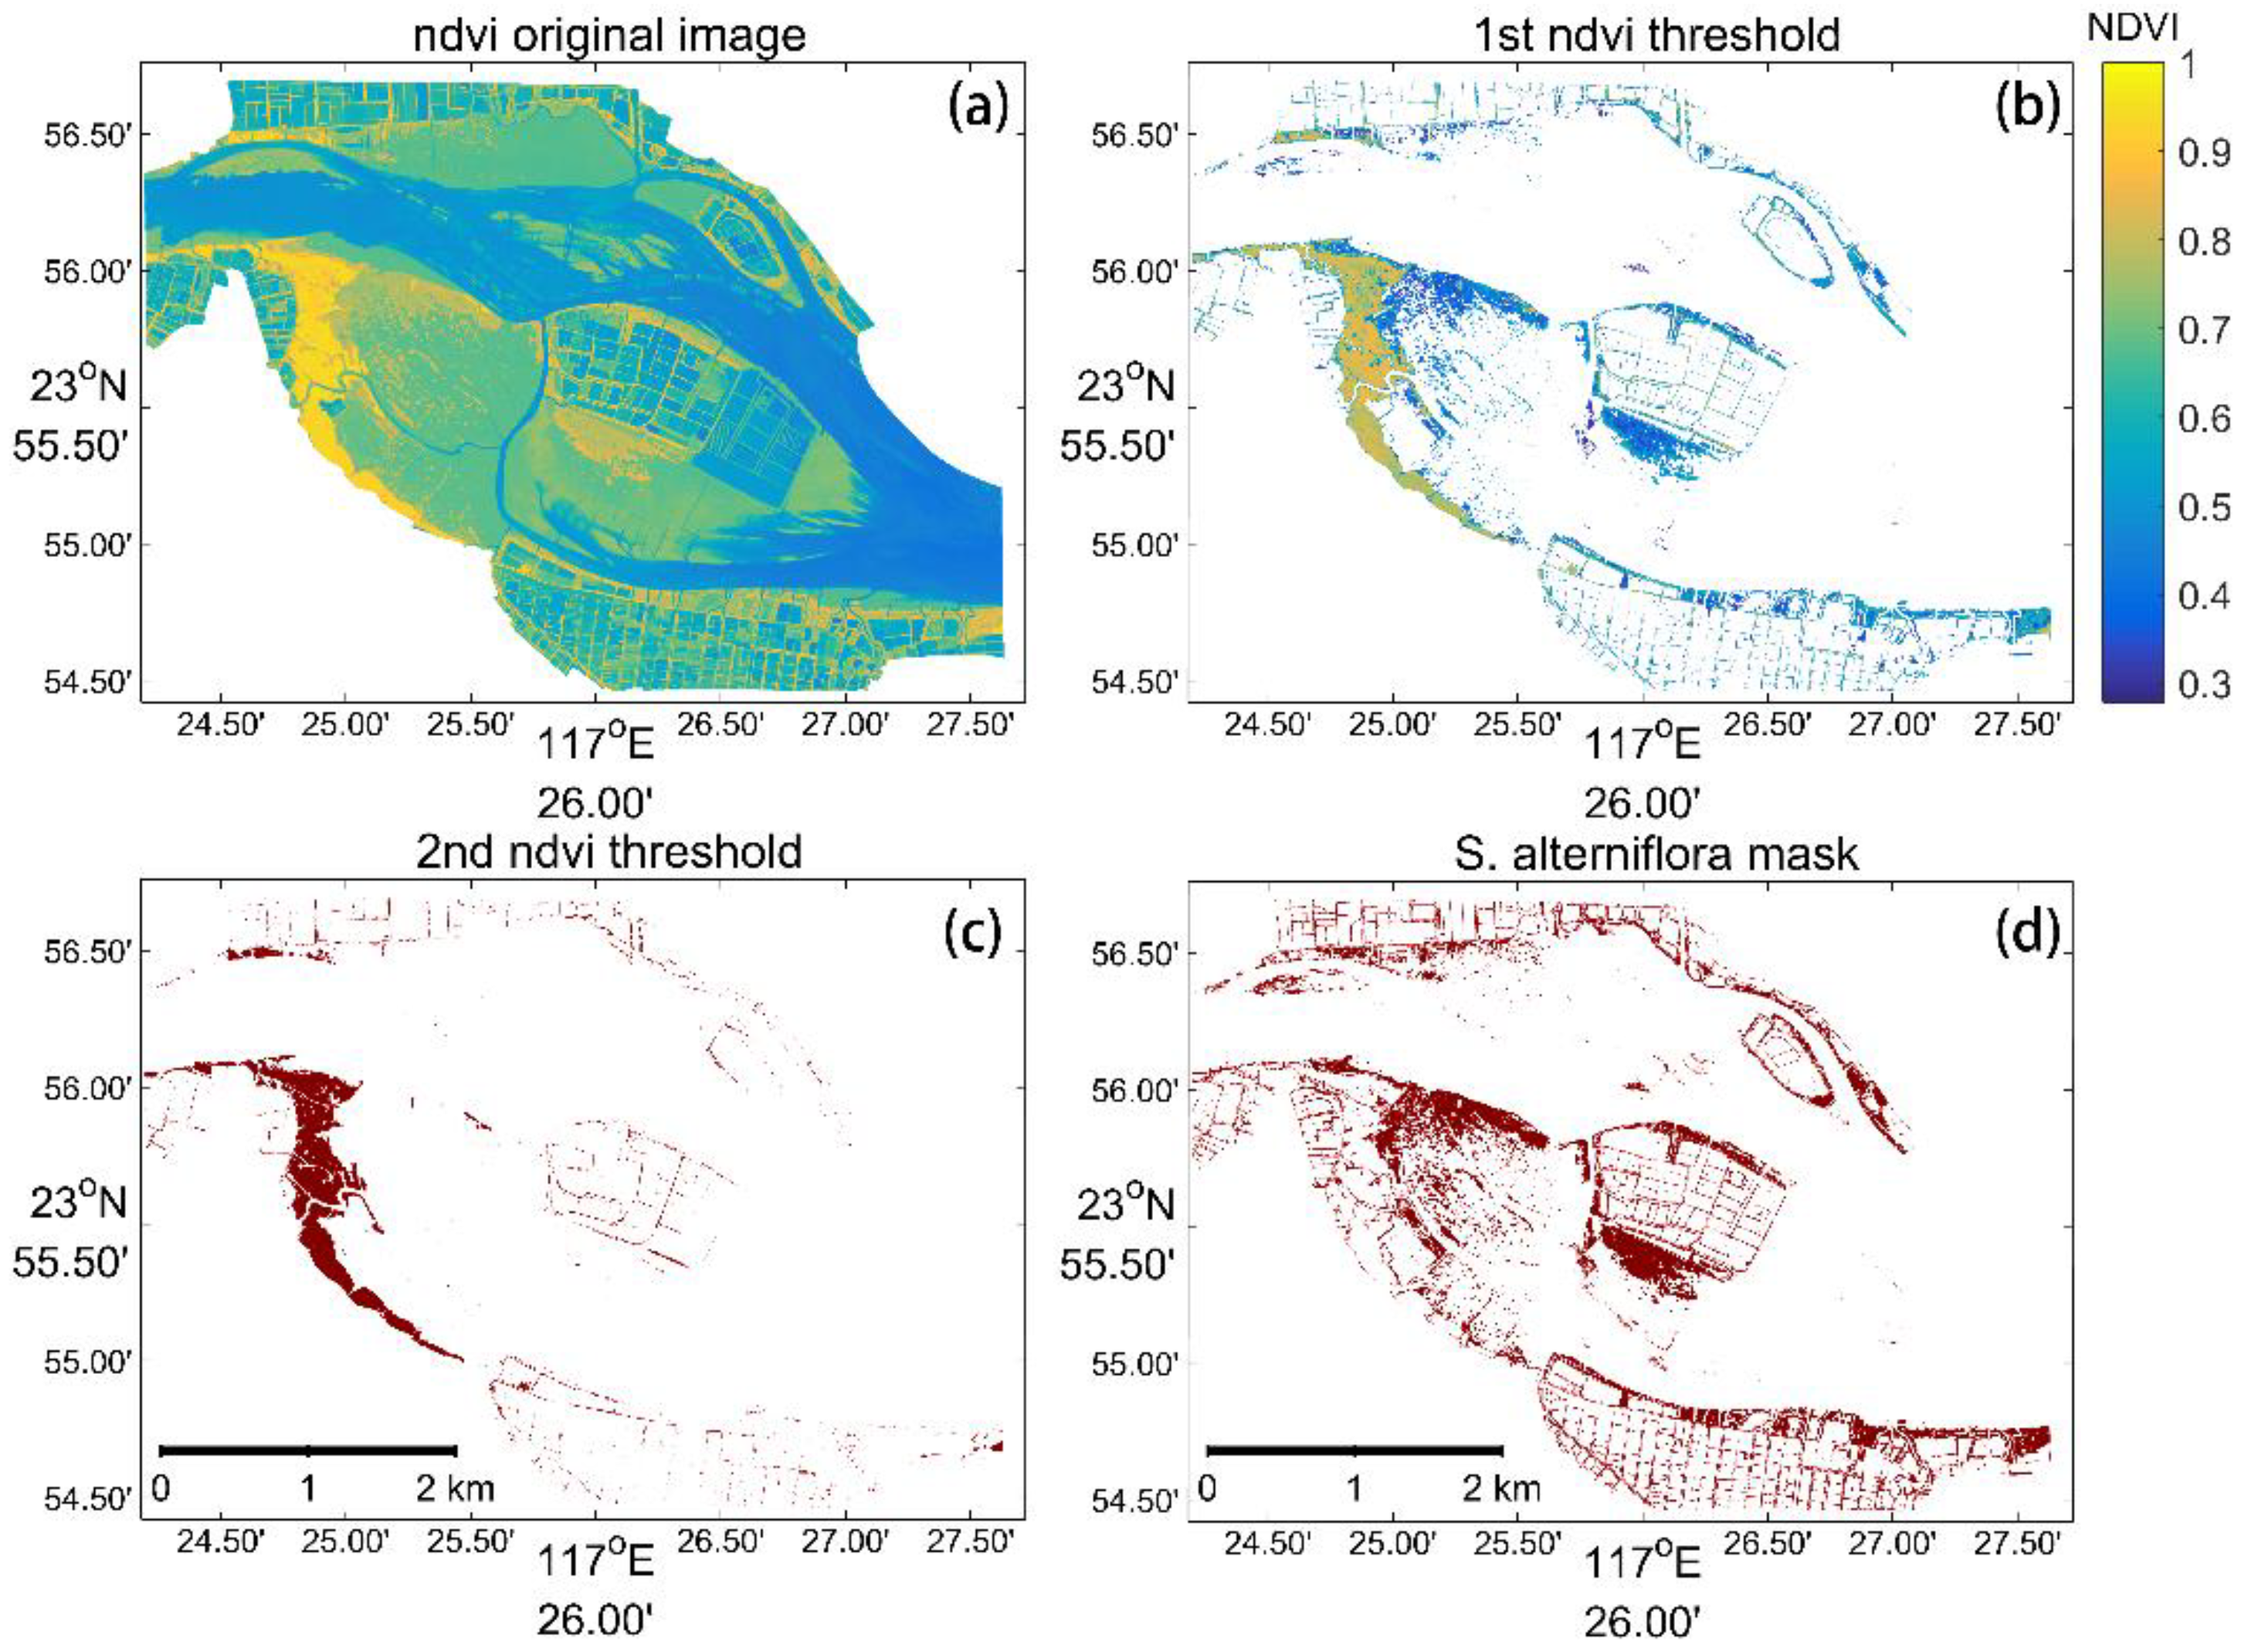
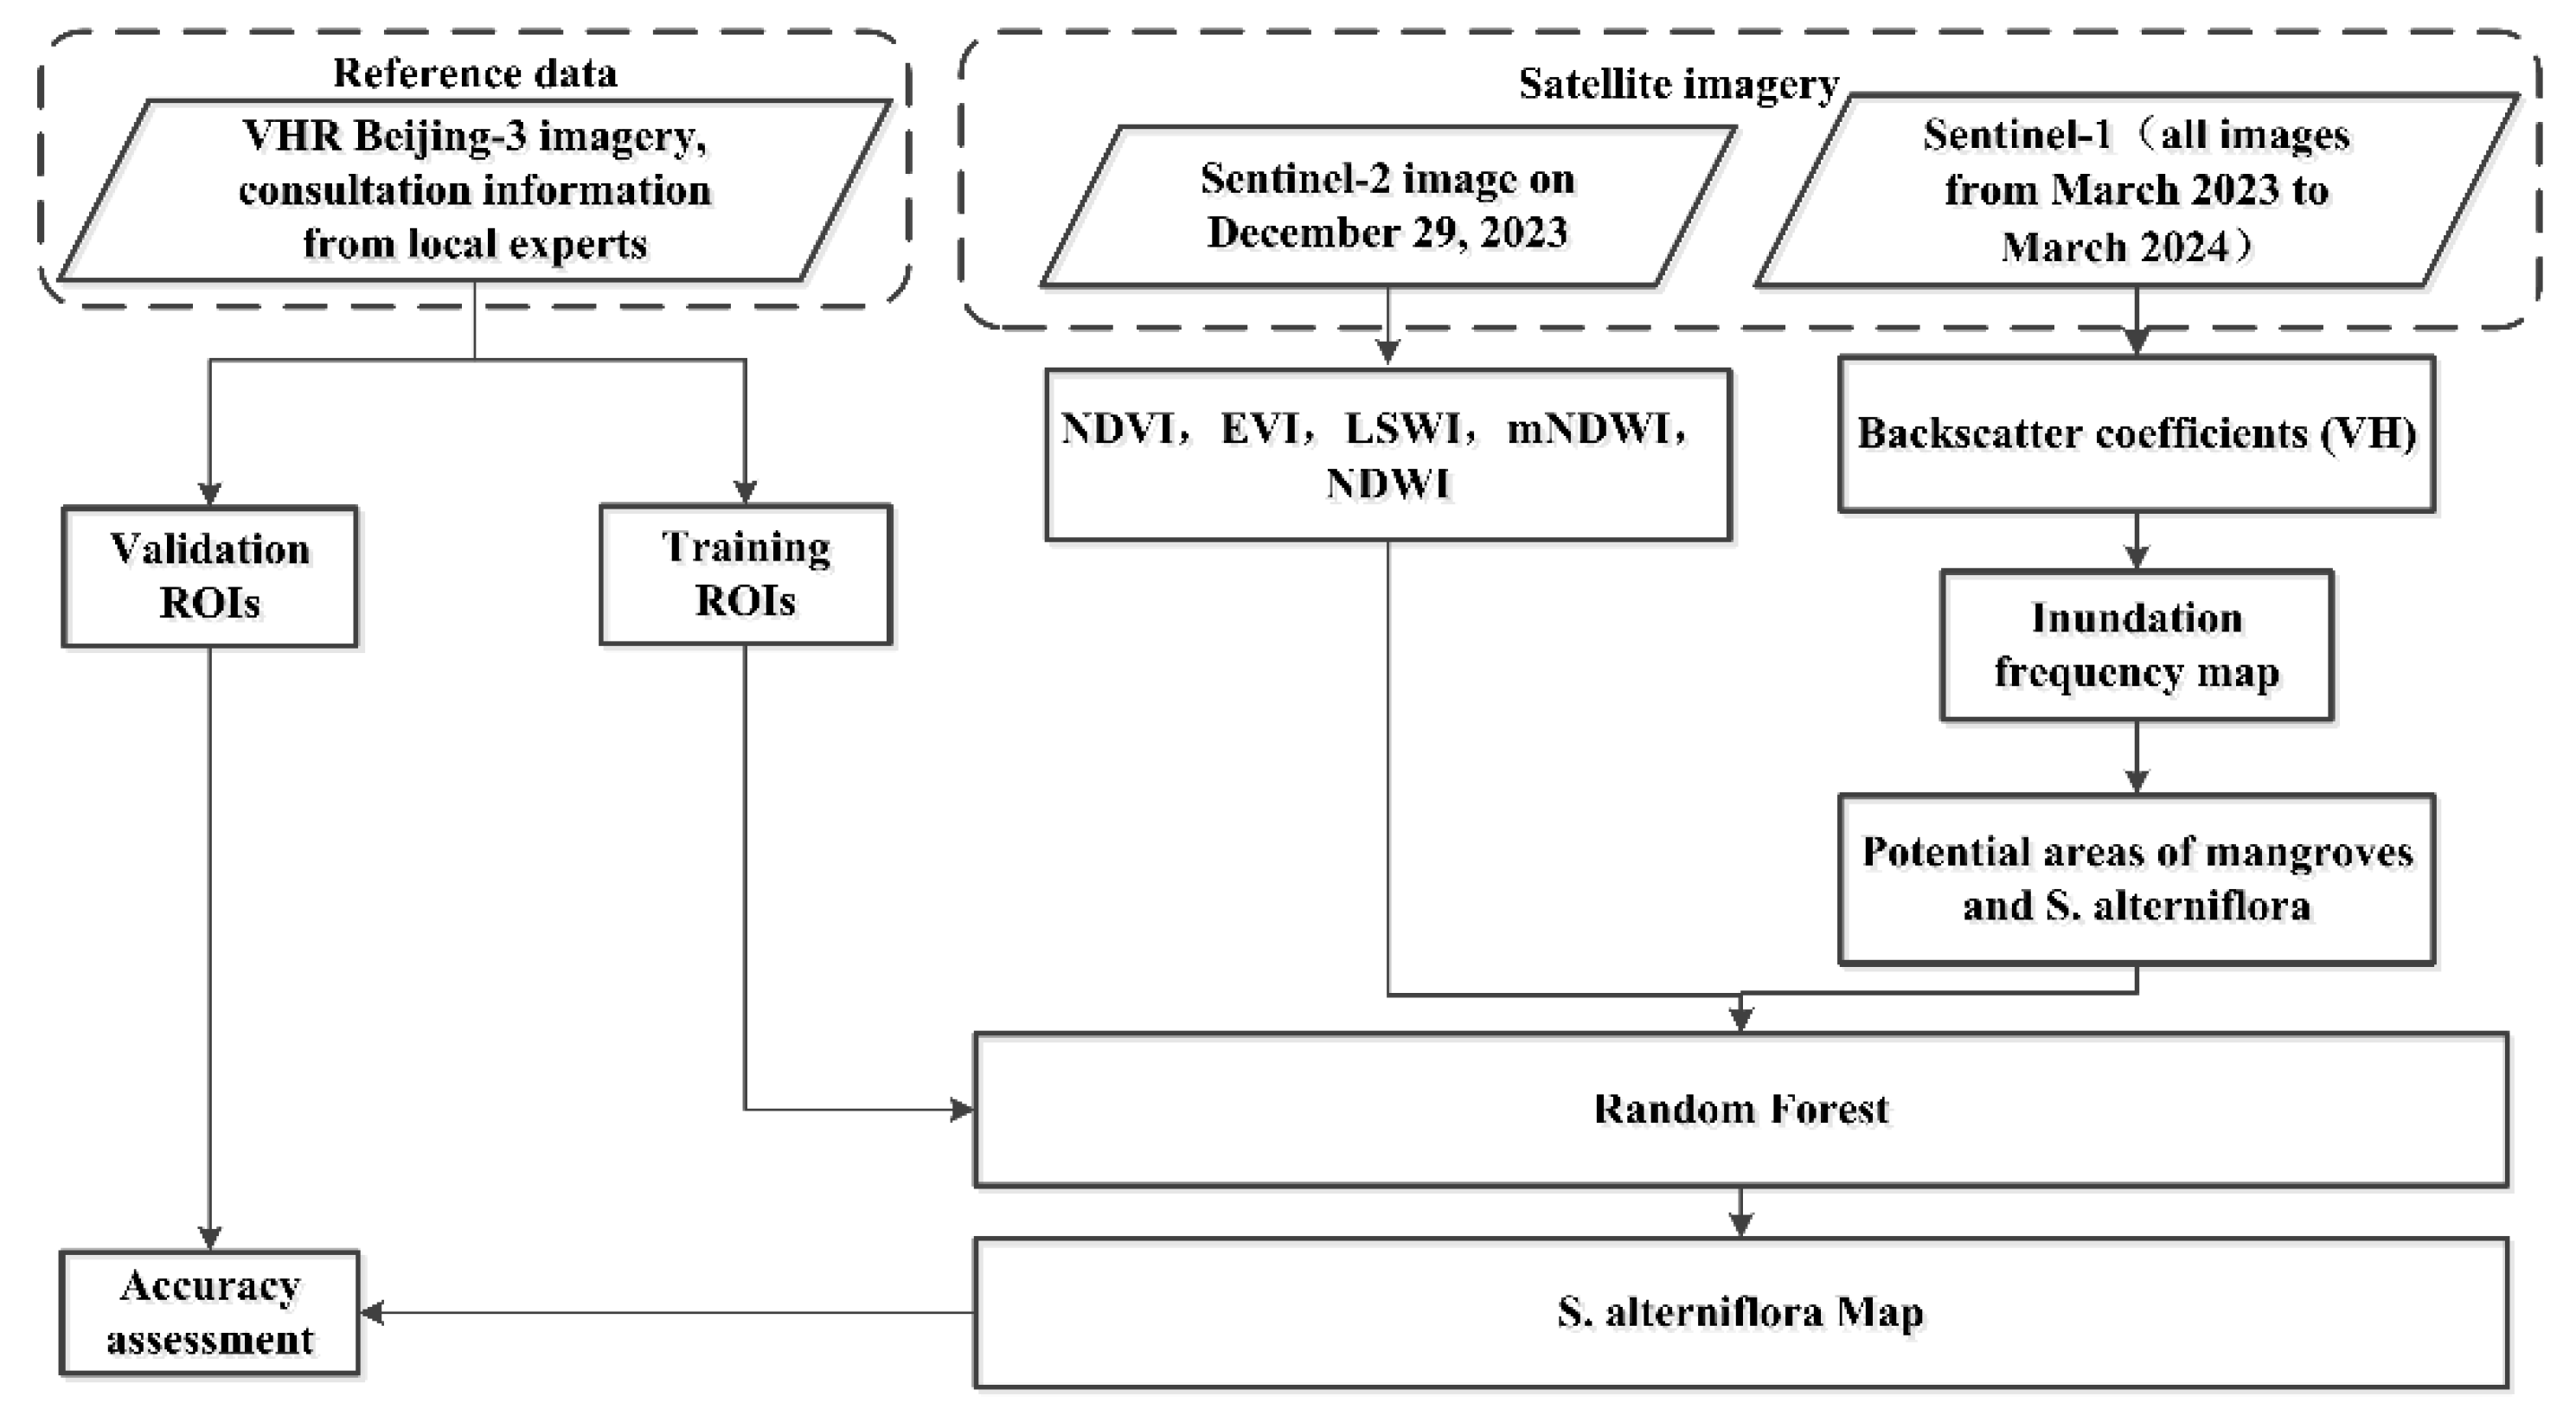
3.3. The Method to Extract S. alterniflora with Sentinel-1/2 Imagery
3.4. Accuracy Assessment
4. Results
4.1. Intra-Class Separability Statistics
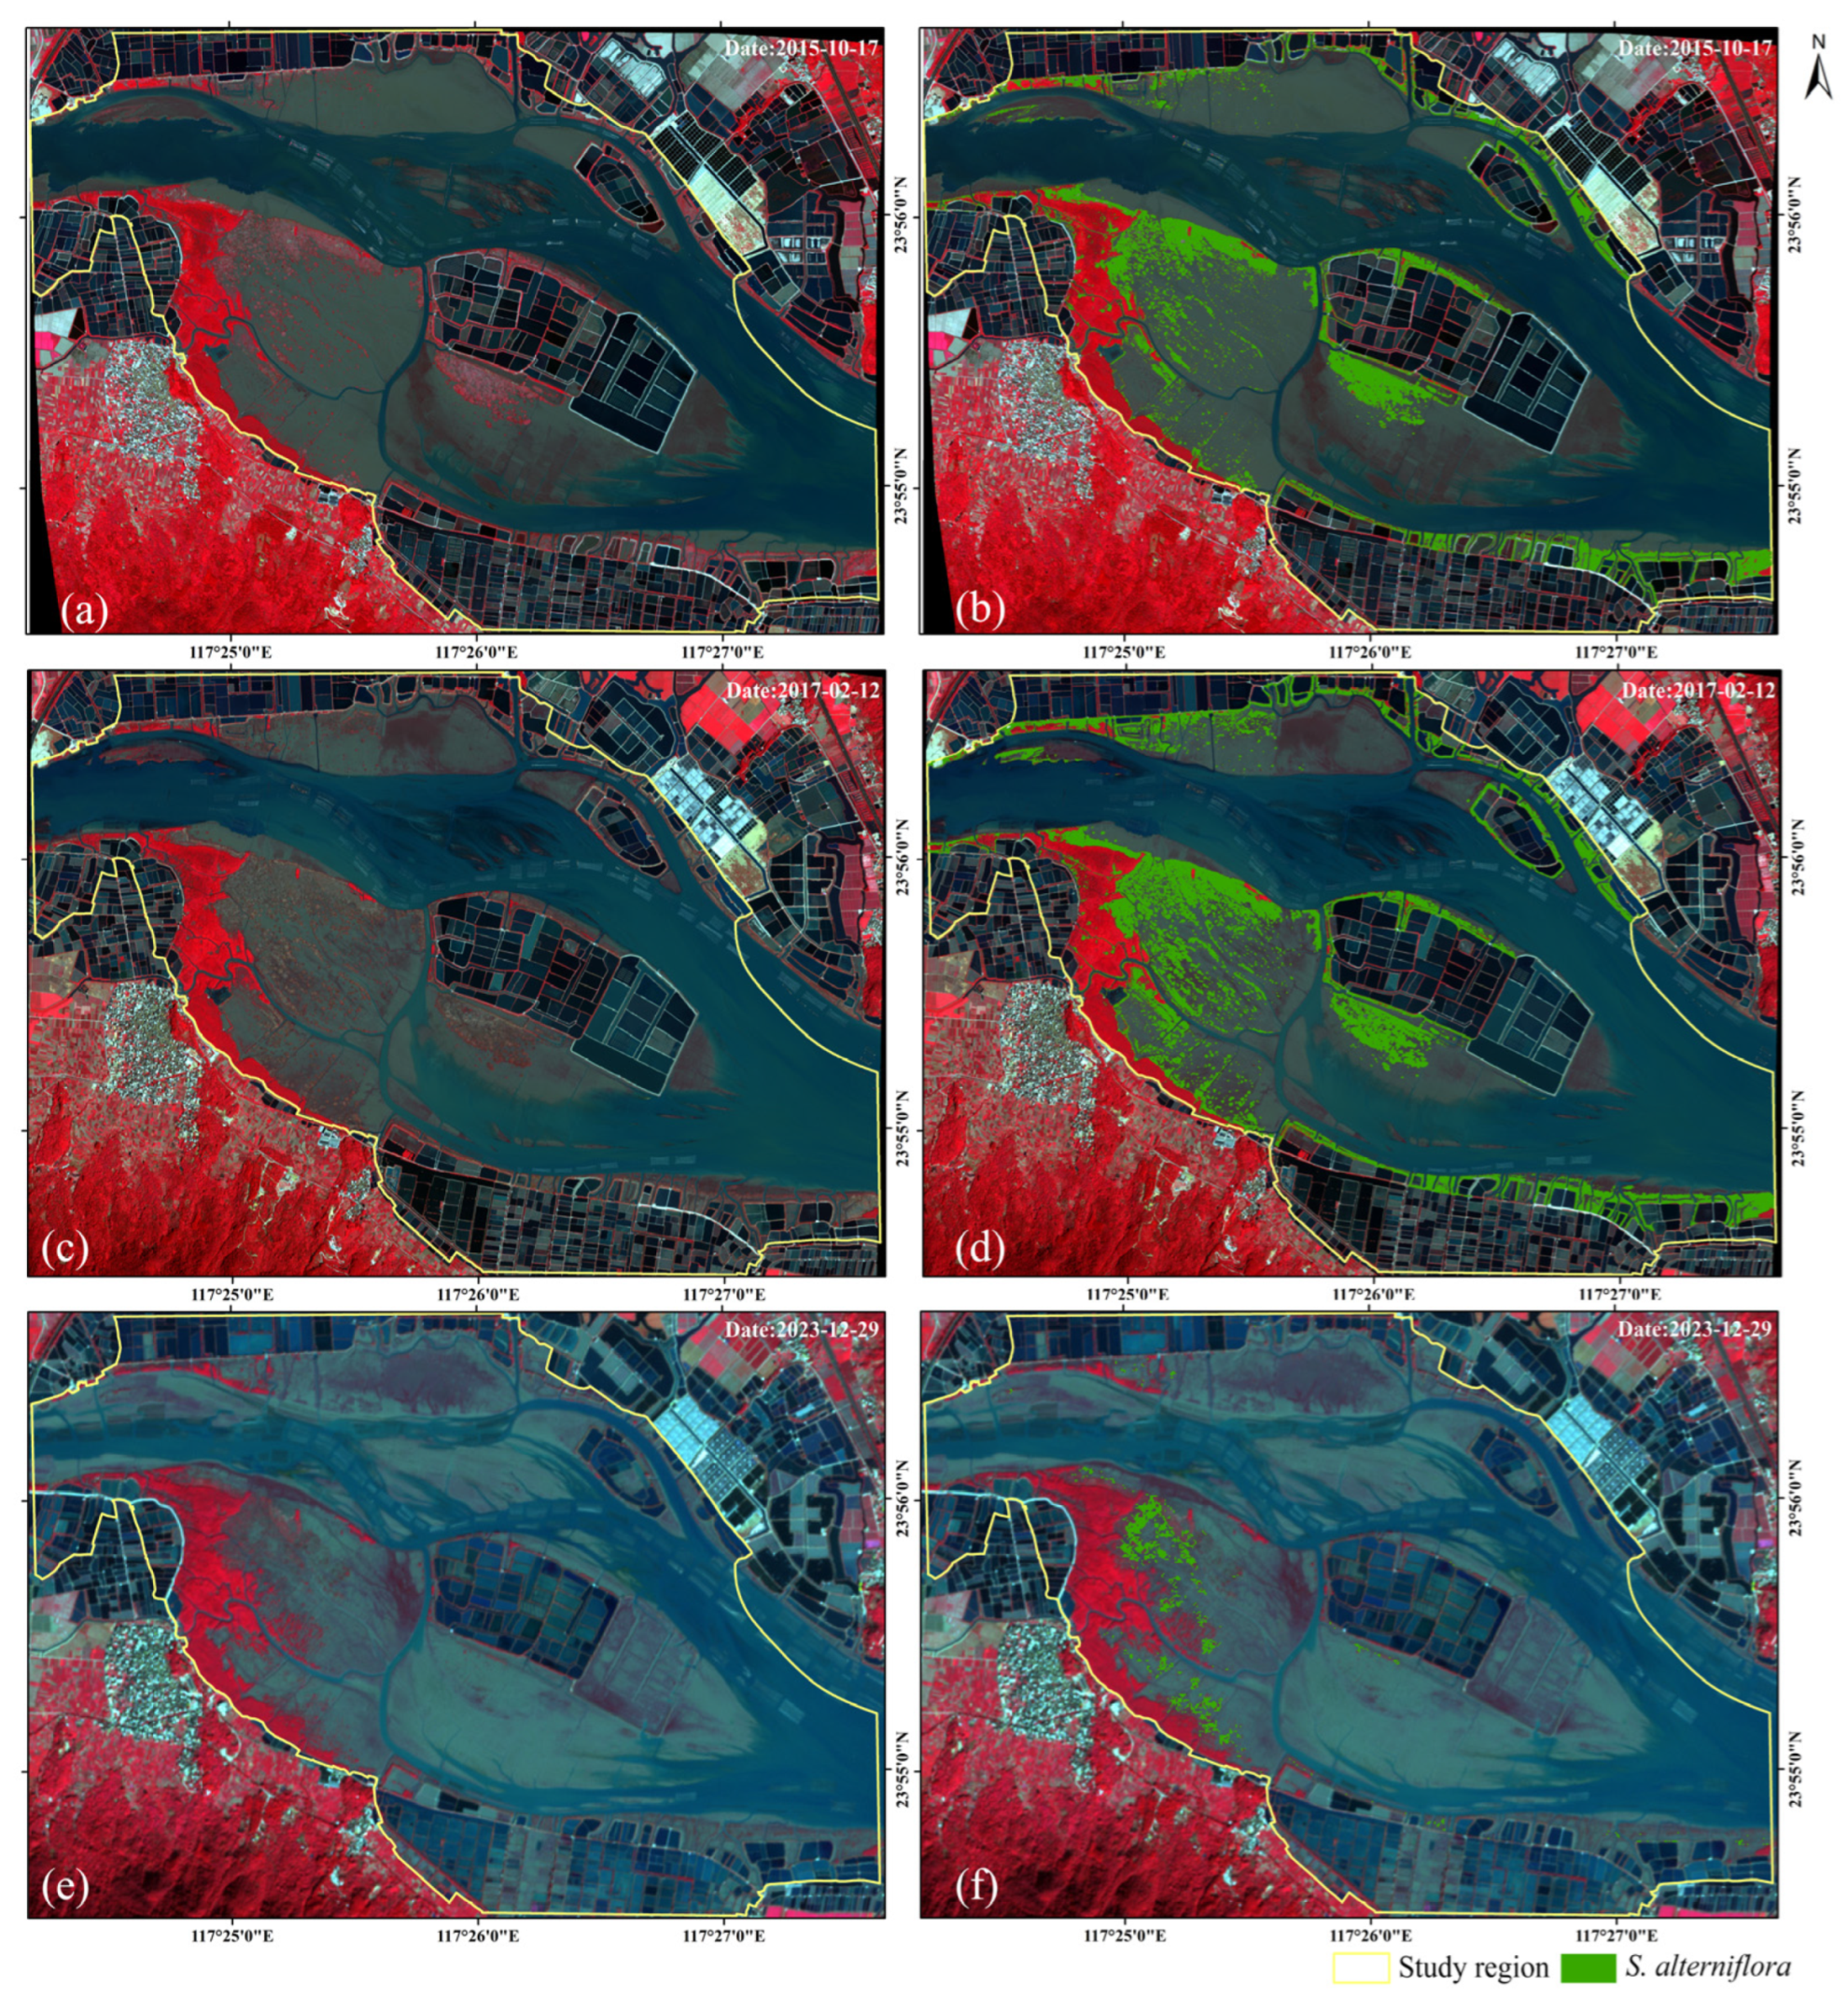
4.2. S. alterniflora Detection Results
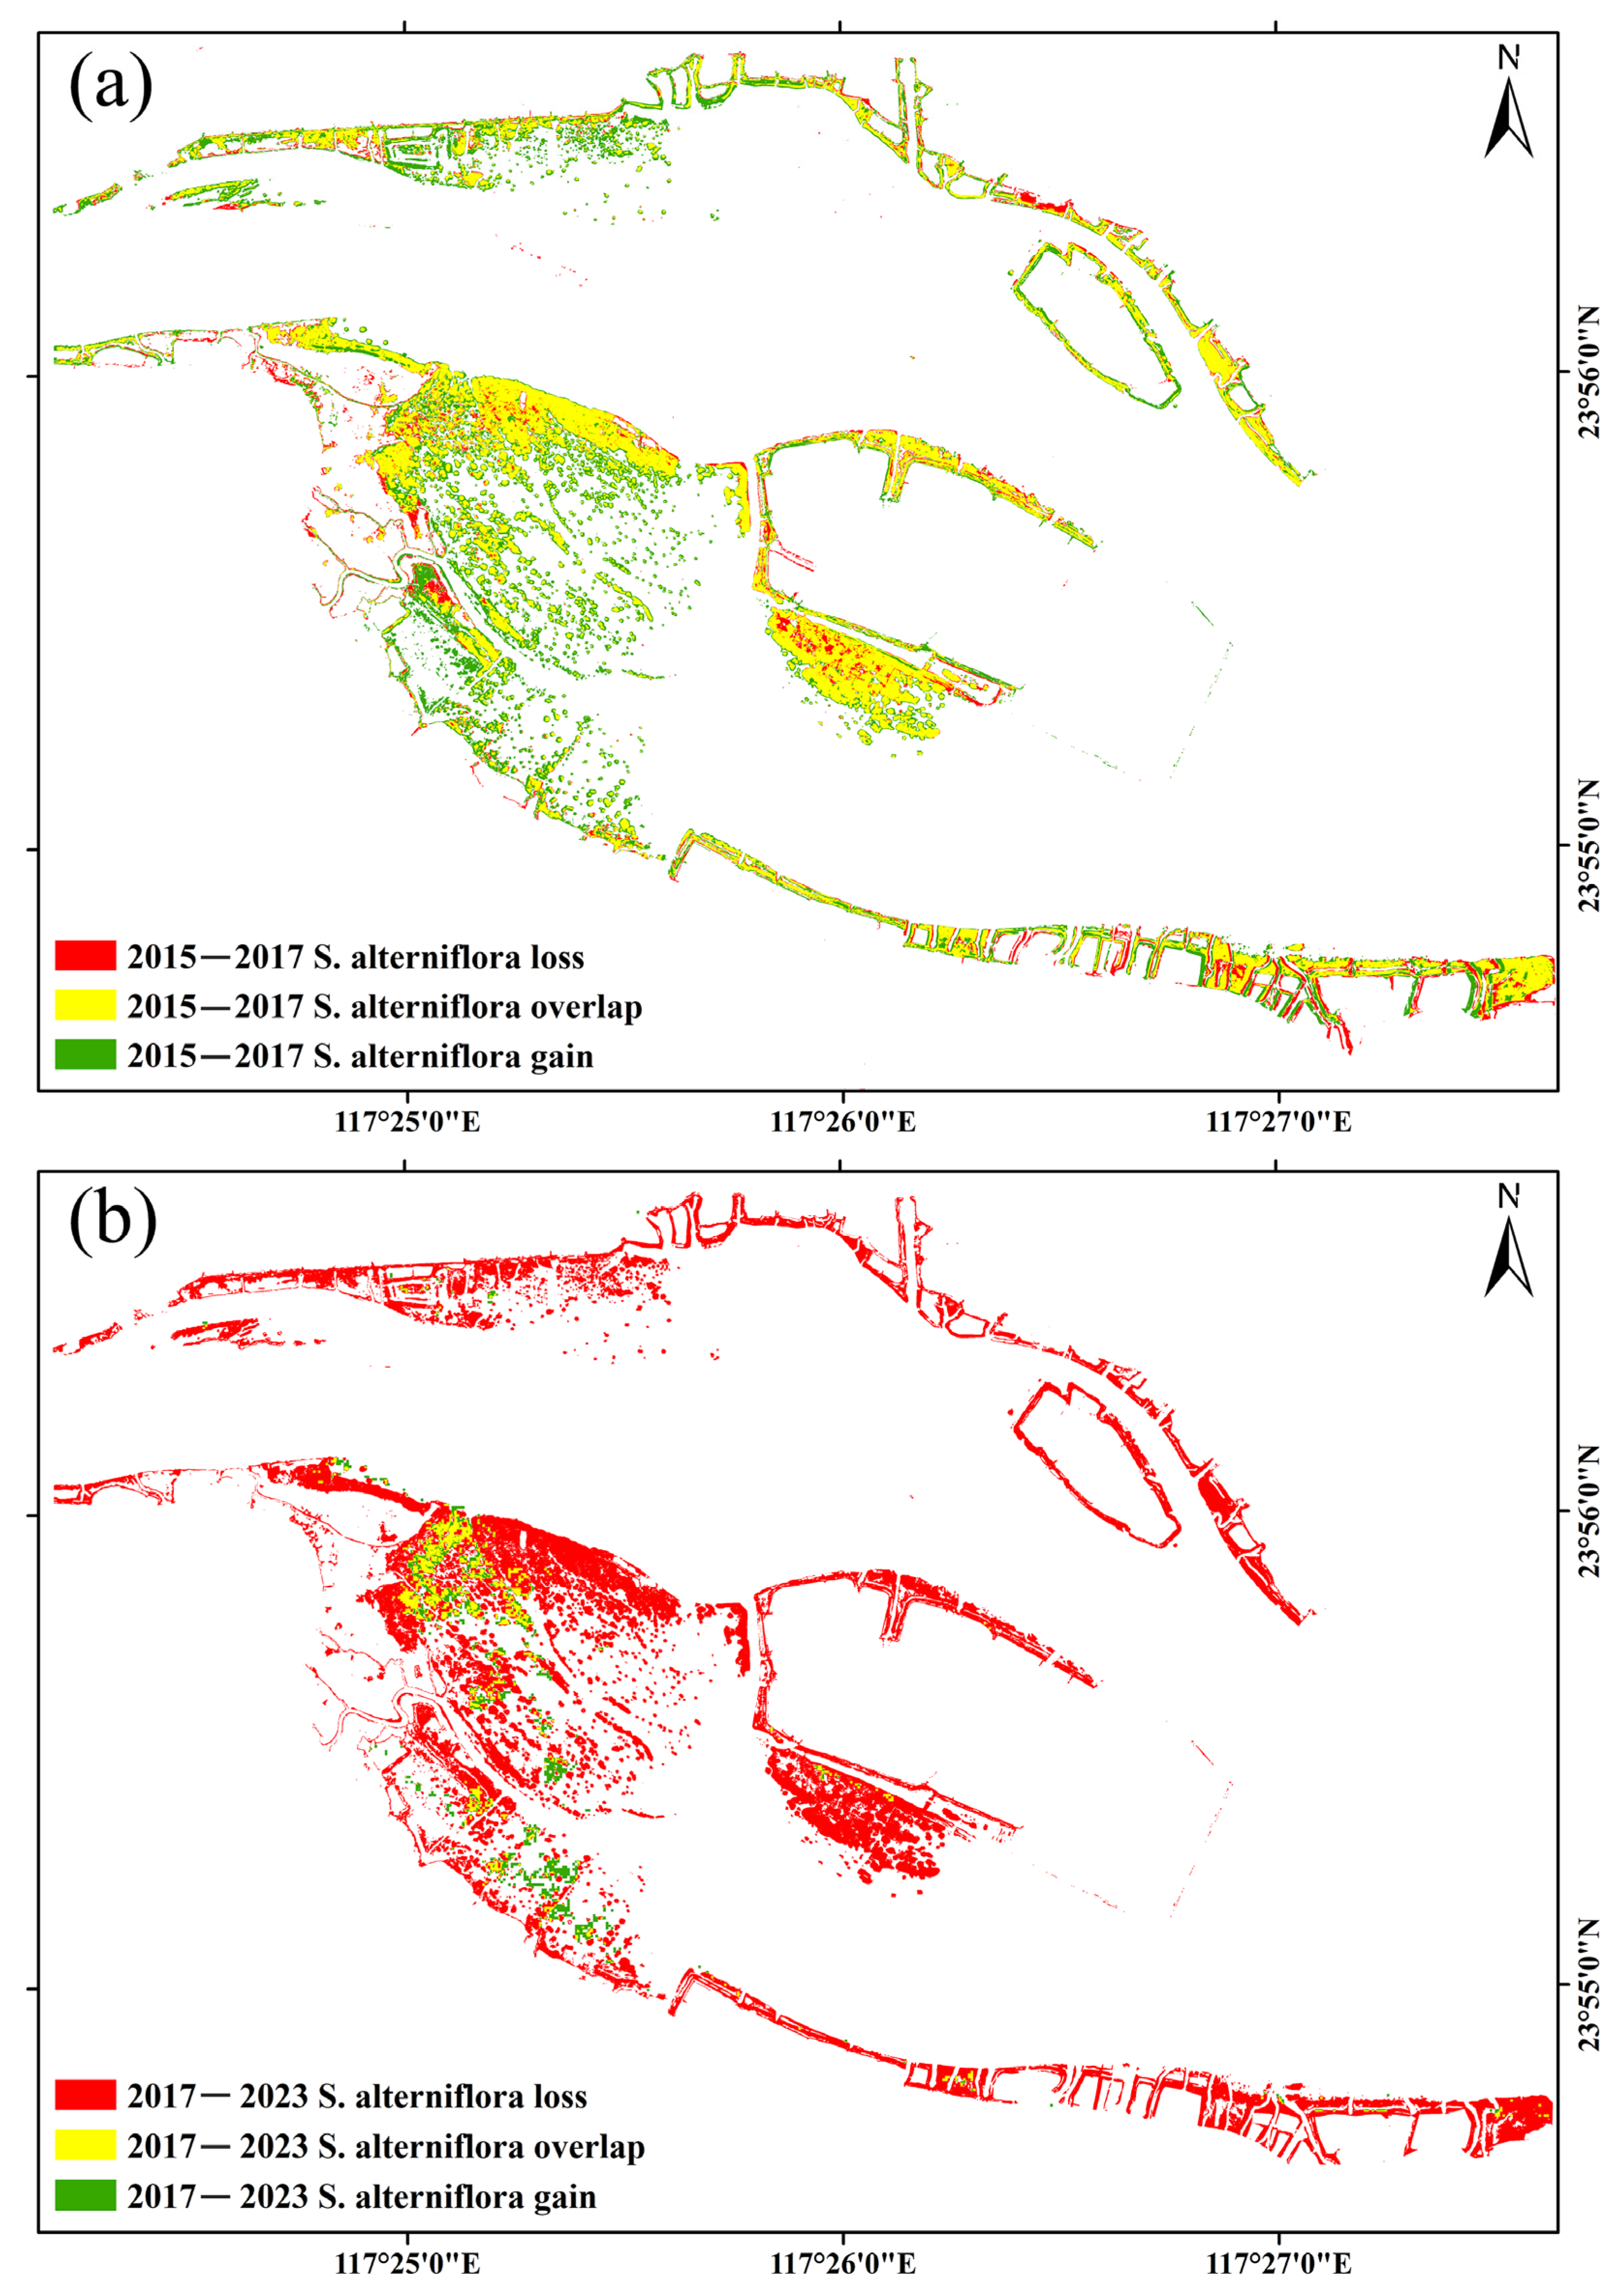
4.3. The S. alterniflora Distribution Changes from 2015 to 2023
5. Discussion
5.1. Adaptability of the Method and Data
5.2. The Expansion and Removal of S. alterniflora in Zhangjiang Estuary
5.3. Implications for S. alterniflora Control and Management
6. Conclusions
Supplementary Materials
Author Contributions
Funding
Data Availability Statement
Acknowledgments
Conflicts of Interest
References
- Zhang, D.; Hu, Y.; Liu, M.; Chang, Y.; Yan, X.; Bu, R.; Zhao, D.; Li, Z. Introduction and spread of an exotic plant, Spartina alterniflora, along coastal marshes of China. Wetlands 2017, 37, 1181–1193. [Google Scholar] [CrossRef]
- Valiela, I.; Fox, S.E. Managing coastal wetlands. Science 2008, 319, 290–291. [Google Scholar] [CrossRef] [PubMed]
- Barbier, E.B.; Hacker, S.D.; Kennedy, C.; Koch, E.W.; Stier, A.C.; Silliman, B.R. The value of estuarine and coastal ecosystem services. Ecol. Monogr. 2011, 81, 169–193. [Google Scholar] [CrossRef]
- Duarte, C.M.; Losada, I.J.; Hendriks, I.E.; Mazarrasa, I.; Marbà, N. The role of coastal plant communities for climate change mitigation and adaptation. Nat. Clim. Change 2013, 3, 961–968. [Google Scholar] [CrossRef]
- Shepard, C.C.; Crain, C.M.; Beck, M.W. The protective role of coastal marshes: A systematic review and meta-analysis. PLoS ONE 2011, 6, e27374. [Google Scholar] [CrossRef] [PubMed]
- Wang, X.; Xiao, X.; He, Q.; Zhang, X.; Wu, J.; Li, B. Biological invasions in China’s coastal zone. Science 2022, 378, 957. [Google Scholar] [CrossRef]
- Zhang, X.; Xiao, X.; Wang, X.; Xu, X.; Qiu, S.; Pan, L.; Ma, J.; Ju, R.; Wu, J.; Li, B. Continual expansion of Spartina alterniflora in the temperate and subtropical coastal zones of China during 1985–2020. Int. J. Appl. Earth Obs. 2023, 117, 103192. [Google Scholar] [CrossRef]
- Zhang, X.; Xiao, X.; Qiu, S.; Xu, X.; Wang, X.; Chang, Q.; Wu, J.; Li, B. Quantifying latitudinal variation in land surface phenology of Spartina alterniflora saltmarshes across coastal wetlands in China by Landsat 7/8 and Sentinel-2 images. Remote Sens. Environ. 2022, 269, 112810. [Google Scholar] [CrossRef]
- Zhang, X.; Xiao, X.; Wang, X.; Xu, X.; Chen, B.; Wang, J.; Ma, J.; Zhao, B.; Li, B. Quantifying expansion and removal of Spartina alterniflora on Chongming island, China, using time series Landsat images during 1995–2018. Remote Sens. Environ. 2020, 247, 111916. [Google Scholar] [CrossRef]
- Mao, D.; Liu, M.; Wang, Z.; Li, L.; Man, W.; Jia, M.; Zhang, Y. Rapid Invasion of Spartina alterniflora in the Coastal Zone of Mainland China: Spatiotemporal Patterns and Human Prevention. Sensors 2019, 19, 2308. [Google Scholar] [CrossRef]
- Zhou, J.; Zhang, J.; Chen, Y.; Qin, G.; Cui, B.; Lu, Z.; Wu, J.; Huang, X.; Thapa, P.; Li, H. Blue carbon gain by plant invasion in saltmarsh overcompensated carbon loss by land reclamation. Carbon Res. 2023, 2, 39. [Google Scholar] [CrossRef]
- Wan, S.; Qin, P.; Liu, J.; Zhou, H. The positive and negative effects of exotic Spartina alterniflora in China. Ecol. Eng. 2009, 35, 444–452. [Google Scholar] [CrossRef]
- Min, Y.; Cui, L.; Li, J.; Han, Y.; Zhuo, Z.; Yin, X.; Zhou, D.; Ke, Y. Detection of large-scale Spartina alterniflora removal in coastal wetlands based on Sentinel-2 and Landsat 8 imagery on Google Earth Engine. Int. J. Appl. Earth Obs. 2023, 125, 103567. [Google Scholar] [CrossRef]
- Zhao, W.; Li, X.; Xue, L.; Lin, S.; Ma, Y.; Su, L.; Li, Z.; Gong, L.; Yan, Z.; Macreadie, P.I. Mapping trade-offs among key ecosystem functions in tidal marsh to inform spatial management policy for exotic Spartina alterniflora. J. Environ. Manag. 2023, 348, 119216. [Google Scholar] [CrossRef] [PubMed]
- Liu, M.; Li, H.; Li, L.; Man, W.; Jia, M.; Wang, Z.; Lu, C. Monitoring the invasion of Spartina alterniflora using multi-source high-resolution imagery in the Zhangjiang Estuary, China. Remote Sens. 2017, 9, 539. [Google Scholar] [CrossRef]
- Liu, M.; Mao, D.; Wang, Z.; Li, L.; Man, W.; Jia, M.; Ren, C.; Zhang, Y. Rapid Invasion of Spartina alterniflora in the Coastal Zone of Mainland China: New Observations from Landsat OLI Images. Remote Sens. 2018, 10, 1933. [Google Scholar] [CrossRef]
- Dong, D.; Wang, C.; Yan, J.; He, Q.; Zeng, J.; Wei, Z. Combing Sentinel-1 and Sentinel-2 image time series for invasive Spartina alterniflora mapping on Google Earth Engine: A case study in Zhangjiang Estuary. J. Applied Remote Sens. 2020, 14, 044504. [Google Scholar] [CrossRef]
- Zhu, X.; Meng, L.; Zhang, Y.; Weng, Q.; Morris, J. Tidal and Meteorological Influences on the Growth of Invasive Spartina alterniflora: Evidence from UAV Remote Sensing. Remote Sens. 2019, 11, 1208. [Google Scholar] [CrossRef]
- Xu, R.; Zhao, S.; Ke, Y. A simple phenology-based vegetation index for mapping invasive Spartina alterniflora using Google Earth engine. IEEE J. STARS 2020, 14, 190–201. [Google Scholar] [CrossRef]
- Tian, J.; Wang, L.; Yin, D.; Li, X.; Diao, C.; Gong, H.; Shi, C.; Menenti, M.; Ge, Y.; Nie, S.; et al. Development of spectral-phenological features for deep learning to understand Spartina alterniflora invasion. Remote Sens. Environ. 2020, 242, 111745. [Google Scholar] [CrossRef]
- Li, H.; Mao, D.; Wang, Z.; Huang, X.; Li, L.; Jia, M. Invasion of Spartina alterniflora in the coastal zone of mainland China: Control achievements from 2015 to 2020 towards the Sustainable Development Goals. J. Environ. Manag. 2022, 323, 116242. [Google Scholar] [CrossRef]
- Li, N.; Li, L.; Zhang, Y.; Wu, M. Monitoring of the invasion of Spartina alterniflora from 1985 to 2015 in Zhejiang Province, China. BMC Ecol. 2020, 20, 7. [Google Scholar] [CrossRef] [PubMed]
- Chen, M.; Ke, Y.; Bai, J.; Li, P.; Lyu, M.; Gong, Z.; Zhou, D. Monitoring early stage invasion of exotic Spartina alterniflora using deep-learning super-resolution techniques based on multisource high-resolution satellite imagery: A case study in the Yellow River Delta, China. Int. J. Appl. Earth Obs. 2020, 92, 102180. [Google Scholar] [CrossRef]
- Chen, W.; Shi, C. Fine-scale mapping of Spartina alterniflora-invaded mangrove forests with multi-temporal WorldView-Sentinel-2 data fusion. Remote Sens. Environ. 2023, 295, 113690. [Google Scholar] [CrossRef]
- Ren, G.; Wang, J.; Wang, A.; Wang, J.; Zhu, Y.; Wu, P.; Ma, Y.; Zhang, J. Monitoring the Invasion of Smooth Cordgrass Spartina alterniflora within the Modern Yellow River Delta Using Remote Sensing. J. Coastal Res. 2019, 90, 135–145. [Google Scholar] [CrossRef]
- Wang, A.; Chen, J.; Jing, C.; Ye, G.; Wu, J.; Huang, Z.; Zhou, C. Monitoring the invasion of Spartina alterniflora from 1993 to 2014 with Landsat TM and SPOT 6 satellite data in Yueqing Bay, China. PLoS ONE 2015, 10, e0135538. [Google Scholar] [CrossRef] [PubMed]
- Zhou, Y.; Qiu, C.; Li, Y.; Wang, C.; Zhang, Y.; Huang, W.; Li, L.; Liu, H.; Zhang, D. Integrating UAV data to explore the relationship between microtopographic variation and Spartina alterniflora expansion during its early invasion. Ecol. Indic. 2023, 154, 110633. [Google Scholar] [CrossRef]
- Zhou, Z.; Yang, Y.; Chen, B. Estimating Spartina alterniflora fractional vegetation cover and aboveground biomass in a coastal wetland using SPOT6 satellite and UAV data. Aquat. Bot. 2018, 144, 38–45. [Google Scholar] [CrossRef]
- Windle, A.E.; Staver, L.W.; Elmore, A.J.; Scherer, S.; Keller, S.; Malmgren, B.; Silsbe, G.M. Multi-temporal high-resolution marsh vegetation mapping using unoccupied aircraft system remote sensing and machine learning. Front. Remote Sens. 2023, 4, 1140999. [Google Scholar] [CrossRef]
- Ng, W.-T.; Rima, P.; Einzmann, K.; Immitzer, M.; Atzberger, C.; Eckert, S. Assessing the Potential of Sentinel-2 and Pléiades Data for the Detection of Prosopis and Vachellia spp. in Kenya. Remote Sens. 2017, 9, 74. [Google Scholar] [CrossRef]
- Proença, B.; Frappart, F.; Lubac, B.; Marieu, V.; Ygorra, B.; Bombrun, L.; Michalet, R.; Sottolichio, A. Potential of High-Resolution Pléiades Imagery to Monitor Salt Marsh Evolution after Spartina Invasion. Remote Sens. 2019, 11, 968. [Google Scholar] [CrossRef]
- Wang, J.; Lin, Z.; Ma, Y.; Ren, G.; Xu, Z.; Song, X.; Ma, Y.; Wang, A.; Zhao, Y. Distribution and invasion of Spartina alterniflora within the Jiaozhou Bay monitored by remote sensing image. Acta Oceanol. Sin. 2022, 41, 31–40. [Google Scholar] [CrossRef]
- Zhu, W.; Ren, G.; Wang, J.; Wang, J.; Hu, Y.; Lin, Z.; Li, W.; Zhao, Y.; Li, S.; Wang, N. Monitoring the invasive plant Spartina alterniflora in Jiangsu coastal wetland using MRCNN and Long-Time Series Landsat Data. Remote Sens. 2022, 14, 2630. [Google Scholar] [CrossRef]
- Wang, X.; Wang, L.; Tian, J.; Shi, C. Object-based spectral-phenological features for mapping invasive Spartina alterniflora. Int. J. Appl. Earth Obs 2021, 101, 102349. [Google Scholar] [CrossRef]
- Sun, C.; Li, J.; Liu, Y.; Zhao, S.; Zheng, J.; Zhang, S. Tracking annual changes in the distribution and composition of saltmarsh vegetation on the Jiangsu coast of China using Landsat time series–based phenological parameters. Remote Sens. Environ. 2023, 284, 113370. [Google Scholar] [CrossRef]
- Zhao, B.; Zhang, M.; Wang, J.; Song, X.; Gui, Y.; Zhang, Y.; Li, W. Multiple Attention Network for Spartina Alterniflora Segmentation Using Multi-temporal Remote Sensing Images. IEEE Trans. Geosci. Remote Sens. 2023, 61, 5402915. [Google Scholar] [CrossRef]
- Zhao, B.; Zhang, M.; Li, W.; Song, X.; Gao, Y.; Zhang, Y.; Wang, J. Intermediate Domain Prototype Contrastive Adaptation for Spartina Alterniflora Segmentation Using Multi-temporal Remote Sensing Images. IEEE Trans. Geosci. Remote Sens. 2024, 62, 5401314. [Google Scholar] [CrossRef]
- Li, X.; Tian, J.; Li, X.; Yu, Y.; Ou, Y.; Zhu, L.; Zhu, X.; Zhou, B.; Gong, H. Annual mapping of Spartina alterniflora with deep learning and spectral-phenological features from 2017 to 2021 in the mainland of China. Int. J. Remote Sens. 2024, 45, 3172–3199. [Google Scholar] [CrossRef]
- Huang, M.; Zhang, Y.; Zhou, Z.; Zhu, X. A dataset of the UAV remote sensing spatial distribution of Spartina alterniflora in the Zhangjiang Estuary of Fujian Province from 2013 to 2022. Science Data Bank 2023, 8. [Google Scholar] [CrossRef]
- Wang, Y.; Mao, Z.; Xin, Z.; Liu, X.; Li, Z.; Dong, Y.; Deng, L. Assessing the Efficacy of Pixel-Level Fusion Techniques for Ultra-High-Resolution Imagery: A Case Study of BJ-3A. Sensors 2024, 24, 1410. [Google Scholar] [CrossRef]
- Tucker, C.J. Red and photographic infrared linear combinations for monitoring vegetation. Remote Sens. Environ. 1979, 8, 127–150. [Google Scholar] [CrossRef]
- Drori, R.; Dan, H.; Sprintsin, M.; Sheffer, E. Precipitation-sensitive dynamic threshold: A new and simple method to detect and monitor forest and woody vegetation cover in sub-humid to arid areas. Remote Sens. 2020, 12, 1231. [Google Scholar] [CrossRef]
- Otsu, N. A threshold selection method from gray-level histograms. IEEE Trans. Syst. Man Cybern. Syst. 1979, 9, 62–66. [Google Scholar] [CrossRef]
- Jia, M.; Wang, Z.; Mao, D.; Ren, C.; Wang, C.; Wang, Y. Rapid, robust, and automated mapping of tidal flats in China using time series Sentinel-2 images and Google Earth Engine. Remote Sens. Environ. 2021, 255, 112285. [Google Scholar] [CrossRef]
- Cortes, C.; Vapnik, V. Support-vector networks. Mach. Learn. 1995, 20, 273–297. [Google Scholar] [CrossRef]
- Mountrakis, G.; Im, J.; Ogole, C. Support vector machines in remote sensing: A review. ISPRS J. Photogramm. 2011, 66, 247–259. [Google Scholar] [CrossRef]
- Maulik, U.; Chakraborty, D. Remote Sensing Image Classification: A survey of support-vector-machine-based advanced techniques. IEEE Geosci. Remote Sens. Mag. 2017, 5, 33–52. [Google Scholar] [CrossRef]
- Wang, Y.; Zhu, X.; Wu, B. Automatic detection of individual oil palm trees from UAV images using HOG features and an SVM classifier. Int. J. Remote Sens. 2019, 40, 7356–7370. [Google Scholar] [CrossRef]
- Schmidt, K.; Skidmore, A. Spectral discrimination of vegetation types in a coastal wetland. Remote Sens. Environ. 2003, 85, 92–108. [Google Scholar] [CrossRef]
- Adam, E.; Mutanga, O. Spectral discrimination of papyrus vegetation (Cyperus papyrus L.) in swamp wetlands using field spectrometry. ISPRS J. Photogramm. 2009, 64, 612–620. [Google Scholar] [CrossRef]
- Silvestri, S.; Defina, A.; Marani, M. Tidal regime, salinity and salt marsh plant zonation. Estuar. Coast. Shelf S. 2005, 62, 119–130. [Google Scholar] [CrossRef]
- Peng, D.; Chen, L.; Pennings, S.C.; Zhang, Y. Using a marsh organ to predict future plant communities in a Chinese estuary invaded by an exotic grass and mangrove. Limnol. Oceanogr. 2018, 63, 2595–2605. [Google Scholar] [CrossRef]
- Xu, H. Modification of normalised difference water index (NDWI) to enhance open water features in remotely sensed imagery. Int. J. Remote Sens. 2006, 27, 3025–3033. [Google Scholar] [CrossRef]
- Huete, A.; Liu, H.; Batchily, K.; Van Leeuwen, W. A comparison of vegetation indices over a global set of TM images for EOS-MODIS. Remote Sens. Environ. 1997, 59, 440–451. [Google Scholar] [CrossRef]
- Xiao, X.; Boles, S.; Liu, J.; Zhuang, D.; Liu, M. Characterization of forest types in Northeastern China, using multi-temporal SPOT-4 VEGETATION sensor data. Remote Sens. Environ. 2002, 82, 335–348. [Google Scholar] [CrossRef]
- Shi, T.; Liu, J.; Hu, Z.; Liu, H.; Wang, J.; Wu, G. New spectral metrics for mangrove forest identification. Remote Sens. Lett. 2016, 7, 885–894. [Google Scholar] [CrossRef]
- Fundisi, E.; Tesfamichael, S.G.; Ahmed, F. A combination of Sentinel-1 RADAR and Sentinel-2 multispectral data improves classification of morphologically similar savanna woody plants. Eur. J. Remote Sens. 2022, 55, 372–387. [Google Scholar] [CrossRef]
- Blickensdörfer, L.; Schwieder, M.; Pflugmacher, D.; Nendel, C.; Erasmi, S.; Hostert, P. Mapping of crop types and crop sequences with combined time series of Sentinel-1, Sentinel-2 and Landsat 8 data for Germany. Remote Sens. Environ. 2022, 269, 112831. [Google Scholar] [CrossRef]
- Ienco, D.; Interdonato, R.; Gaetano, R.; Minh, D.H.T. Combining Sentinel-1 and Sentinel-2 Satellite Image Time Series for land cover mapping via a multi-source deep learning architecture. ISPRS J. Photogramm. 2019, 158, 11–22. [Google Scholar] [CrossRef]
- Wilson, K.L.; Wong, M.C.; Devred, E. Comparing Sentinel-2 and WorldView-3 imagery for coastal bottom habitat mapping in Atlantic Canada. Remote Sens. 2022, 14, 1254. [Google Scholar] [CrossRef]
- Kovacs, E.; Roelfsema, C.; Lyons, M.; Zhao, S.; Phinn, S. Seagrass habitat mapping: How do Landsat 8 OLI, Sentinel-2, ZY-3A, and Worldview-3 perform? Remote Sens. Lett. 2018, 9, 686–695. [Google Scholar] [CrossRef]
- Marcello, J.; Eugenio, F.; Gonzalo-Martin, C.; Rodriguez-Esparragon, D.; Marques, F. Advanced processing of multiplatform remote sensing imagery for the monitoring of coastal and mountain ecosystems. IEEE Access 2020, 9, 6536–6549. [Google Scholar] [CrossRef]
- Dattola, L.; Rende, S.F.; Dominici, R.; Lanera, P.; Di Mento, R.; Scalise, S.; Cappa, P.; Oranges, T.; Aramini, G. Comparison of Sentinel-2 and Landsat-8 OLI satellite images vs. high spatial resolution images (MIVIS and WorldView-2) for mapping Posidonia oceanica meadows. In Proceedings of the Remote Sensing of the Ocean, Sea Ice, Coastal Waters, and Large Water Regions 2018, Berlin, Germany, 10–12 September 2018; pp. 252–262. [Google Scholar]
- Xiao, Y.; Tang, J.; Qing, H.; Zhou, C.; Kong, W.; An, S. Trade-offs among growth, clonal, and sexual reproduction in an invasive plant Spartina alterniflora responding to inundation and clonal integration. Hydrobiologia 2011, 658, 353–363. [Google Scholar] [CrossRef]
- Liu, H.; Lin, Z.; Qi, X.; Zhang, M.; Yang, H. The relative importance of sexual and asexual reproduction in the spread of Spartina alterniflora using a spatially explicit individual-based model. Ecol. Res. 2014, 29, 905–915. [Google Scholar] [CrossRef]
- Daehler, C.C.; Strong, D.R. Variable reproductive output among clones of Spartina alterniflora (Poaceae) invading San Francisco Bay, California: The influence of herbivory, pollination, and establishment site. Am. J. Botany 1994, 81, 307–313. [Google Scholar] [CrossRef]
- Vitousek, P.M.; d’Antonio, C.M.; Loope, L.L.; Westbrooks, R. Biological invasions as global environmental change. Am. Sci. 1996, 84, 468–478. [Google Scholar]
- Nie, M.; Liu, W.; Pennings, S.C.; Li, B. Lessons from the invasion of Spartina alterniflora in coastal China. Ecology 2023, 104, e3874. [Google Scholar] [CrossRef] [PubMed]
- Strong, D.R.; Ayres, D.R. Ecological and evolutionary misadventures of Spartina. Annu. Rev. Ecol. Evol. Syst. 2013, 44, 389–410. [Google Scholar] [CrossRef]
- Zheng, X.; Javed, Z.; Liu, B.; Zhong, S.; Cheng, Z.; Rehman, A.; Du, D.; Li, J. Impact of Spartina alterniflora invasion in coastal wetlands of China: Boon or bane? Biology 2023, 12, 1057. [Google Scholar] [CrossRef]
- Zheng, J.; Wei, H.; Chen, R.; Liu, J.; Wang, L.; Gu, W. Invasive trends of Spartina alterniflora in the southeastern Coast of China and potential distributional impacts on mangrove forests. Plants 2023, 12, 1923. [Google Scholar] [CrossRef]
- Zhao, Z.; Yuan, L.; Li, W.; Tian, B.; Zhang, L. Re-invasion of Spartina alterniflora in restored saltmarshes: Seed arrival, retention, germination, and establishment. J. Environ. Manag. 2020, 266, 110631. [Google Scholar] [CrossRef] [PubMed]


| Method | Year | Class | SA | Non-SA | Use. Acc. | OA |
|---|---|---|---|---|---|---|
| Our | 2015 | SA | 134 | 16 | 89% | 95% |
| method | Non-SA | 0 | 150 | 100% | ||
| Pro. acc. | 100% | 90% | ||||
| 2017 | SA | 130 | 20 | 87% | 93% | |
| Non-SA | 1 | 149 | 99% | |||
| Pro. acc. | 99% | 88% | ||||
| SVM | 2015 | SA | 98 | 52 | 65% | 82% |
| Non-SA | 1 | 149 | 99% | |||
| Pro. acc. | 99% | 74% | ||||
| 2017 | SA | 100 | 50 | 67% | 83% | |
| Non-SA | 0 | 150 | 100% | |||
| Pro. acc. | 100% | 75% |
Disclaimer/Publisher’s Note: The statements, opinions and data contained in all publications are solely those of the individual author(s) and contributor(s) and not of MDPI and/or the editor(s). MDPI and/or the editor(s) disclaim responsibility for any injury to people or property resulting from any ideas, methods, instructions or products referred to in the content. |
© 2024 by the authors. Licensee MDPI, Basel, Switzerland. This article is an open access article distributed under the terms and conditions of the Creative Commons Attribution (CC BY) license (https://creativecommons.org/licenses/by/4.0/).
Share and Cite
Dong, D.; Huang, H.; Gao, Q. Tracking the Dynamics of Spartina alterniflora with WorldView-2/3 and Sentinel-1/2 Imagery in Zhangjiang Estuary, China. Water 2024, 16, 1780. https://doi.org/10.3390/w16131780
Dong D, Huang H, Gao Q. Tracking the Dynamics of Spartina alterniflora with WorldView-2/3 and Sentinel-1/2 Imagery in Zhangjiang Estuary, China. Water. 2024; 16(13):1780. https://doi.org/10.3390/w16131780
Chicago/Turabian StyleDong, Di, Huamei Huang, and Qing Gao. 2024. "Tracking the Dynamics of Spartina alterniflora with WorldView-2/3 and Sentinel-1/2 Imagery in Zhangjiang Estuary, China" Water 16, no. 13: 1780. https://doi.org/10.3390/w16131780
APA StyleDong, D., Huang, H., & Gao, Q. (2024). Tracking the Dynamics of Spartina alterniflora with WorldView-2/3 and Sentinel-1/2 Imagery in Zhangjiang Estuary, China. Water, 16(13), 1780. https://doi.org/10.3390/w16131780