Article

Investigate the Spatiotemporal Evolution of Drought and Its Interaction with Atmospheric Circulation in the Yellow River Middle Basin

1
Key Laboratory of Agricultural Water and Soil Engineering of Education Ministry, College of Water Resources and Architectural Engineering, Northwest Agriculture and Forestry University, Yangling 712100, China
2
Department of Environmental Sciences, Kohat University of Science and Technology, Kohat 26000, Pakistan
3
College of Civil Engineering and Architecture, Guangxi University, Nanning 530004, China
4
Instituted of Agricultural Science of the Third Division of Xinjiang Production and Construction Corps., Tumushuke 843900, China
*
Authors to whom correspondence should be addressed.
These authors contributed equally to this work.
Water 2024, 16(13), 1786; https://doi.org/10.3390/w16131786
Submission received: 23 May 2024 / Revised: 19 June 2024 / Accepted: 21 June 2024 / Published: 24 June 2024
(This article belongs to the Section Water Resources Management, Policy and Governance)

Abstract

:
Global warming contributes to an increased frequency and severity of droughts. Drought emerges as a highly prevalent natural calamity, distinguished by its formidable disruptive impact and the capacity to trigger considerable economic setbacks. Understanding the spatiotemporal characteristics of droughts and clarifying the driving role of atmospheric circulation on droughts is vital for agricultural, hydrological, ecological, and socio-economic systems. Leveraging meteorological data from 36 stations in the middle reaches of the Yellow River Basin from 1961 to 2020, we employed the Standardized Precipitation Evapotranspiration Index (SPEI) to calculate drought occurrence. Concurrently, we explored the influence of atmospheric circulation on the SPEI. The findings of our study underscore a concerning trend of worsening drought conditions within the study area. We discovered a significant correlation between the duration and severity of drought (R = 0.83, p < 0.001); longer durations often corresponded to higher levels of severity. Turning our attention to atmospheric dynamics, the Nino Eastern Pacific index (NE) emerged as a critical driver of SPEI dynamics (the contribution of NE to SPEI was 0.22), significantly impacting drought patterns. In conclusion, the study significantly contributes to our comprehension of the evolving drought patterns under the influence of global warming. The findings can provide valuable information for water resource management and drought disaster control.

Graphical Abstract

1. Introduction

Drought is a phenomenon of water shortage caused by the imbalance between income and expenditure or supply and demand of water, which is jointly caused by weather pattern shifts, atmospheric circulation alterations, and broader climatic conditions [1]. Drought can significantly impact the environment, such as aggravating soil erosion, increasing water eutrophication, and degrading ecosystems [2,3]. At the same time, drought can lead to decreased food production, exacerbate soil desertification, impact groundwater resources, and increase the frequency of forest fires [4,5,6]. In recent years, severe drought events have occurred in various regions around the world, including the 2005 Amazon Basin drought [7], the 2014 California drought [8], the Panama drought in 2015–2016 [9], and the 2017 extreme spring drought in South Korea [10]. Therefore, effective drought management and proactive readiness are pivotal, as they can alleviate droughts’ detrimental impacts and guarantee sustainable water resource utilization.
Despite having access to only 7% of the world’s arable land, China sustains nearly 22% of the global population [11]. The significance of food security in China cannot be overstated, as it plays a crucial role in maintaining social stability [12]. Influenced by the monsoon climate, a substantial portion of China’s regions and population face annual repercussions from drought [13]. Since the 21st century, China has lost 30 million tons of grain annually due to drought [14]. Hence, delving into drought patterns becomes pivotal in safeguarding food security. Situated as a pivotal economic belt in northern China, the Yellow River Basin is facing the vulnerability caused by repeated droughts. The decade spanning from 1991 to 2000 is a poignant example, during which, drought influenced approximately 7 million hectares of land within the Yellow River Basin. This impact translated to a substantial reduction in grain production of approximately 2.3 million tons [15]. In September 2019, a significant national strategy, the “Ecological Protection and High-Quality Development of the Yellow River Basin”, was introduced. Within the context of this national strategy, the middle reaches of the Yellow River Basin, serving as a vital grain-producing region, play a pivotal and integral role. Investigating the spatiotemporal progression of drought in the middle reaches will establish a crucial groundwork for subsequent disaster alerts and crafting effective policies.
Numerous researchers have introduced a variety of drought indicators aimed at effectively tracking drought patterns. Among these indicators, the most commonly employed ones include the Palmer Drought Severity Index (PDSI) [16], the Standardized Precipitation Index (SPI) [17], the Reconnaissance Drought Index (RDI) [18], the Standardized Precipitation Evapotranspiration Index (SPEI) [19], the Standardized Precipitation Temperature Index (SPTI) [20], the Integrated Drought Index (IDI) [21], and the Standardized Precipitation Evapotranspiration Irrigation Index (SPEII) [22]. Notably, the PDSI, SPI, and SPEI stand out as drought studies’ most widely adopted indicators. However, it is worth noting that while the PDSI considers both water supply and demand, it is calculated based on a fixed 12-month timescale [23]. In contrast, the SPI can be computed for different timescales, but it only considers precipitation without considering the demand side like PDSI [1]. Combining the strengths of the PDSI and SPI while incorporating the influence of temperature, the SPEI presents promising applicability [24]. Therefore, the SPEI was utilized to delve into drought variability.
Furthermore, the spatiotemporal patterns of drought evolution in the middle reaches of the Yellow River Basin have, to some extent, been explored. Yang et al. [25] investigated drought dynamics using the midsummer drought index and categorized drought based on varying precipitation distributions. Wang et al. [26] utilized the midsummer drought index to analyze the periodic features of midsummer drought in the middle reaches of the Yellow River. The likelihood of encountering drought events across different drought severity levels in various regions was also assessed. Considering early rainfall, a monthly standardized precipitation index (SPI) calculation method based on a ten-day cumulative scale was proposed by Liu et al. [27] to study the characteristics and future trends of drought in the middle reaches of the Yellow River Basin. Indeed, Zhang et al. [28] employed the Palmer Drought Severity Index (PDSI) to scrutinize the shifts in drought trends across the six subregions of the Loess Plateau. Conversely, Huang et al. [29] employed a non-parametric multivariate drought index to investigate drought traits within the Yellow River Basin (YRB). Prior studies have employed various approaches to investigate drought patterns in the Yellow River Basin. However, the chosen drought indices often concentrate solely on the impact of individual factors.
The existing research has also explored how atmospheric circulation patterns, such as the Arctic Oscillation (AO), North Atlantic Oscillation (NAO), Antarctic Oscillation Index (AAO), and NINO 1+2, influence rainfall dynamics and subsequently shape the evolution of drought conditions [30,31,32]. The climate in southern China is dry during El Niño Modoki events [33]. The periods of heightened solar activity are associated with a trend of increasing extreme weather events [34]. Li et al. [15] found that drought on the Loess Plateau has a temporal and spatial relationship with the Southern Oscillation Index (SOI).
Despite extensive research on drought and atmospheric circulation, a notable gap in our understanding persists concerning the intricate relationship between atmospheric circulation and drought dynamics within the middle Yellow River Basin. Hence, this investigation hinged on meteorological data encompassing the middle reaches of the Yellow River Basin spanning from 1961 to 2020, utilizing the SPEI. The objectives of this work are (1) to reveal the patterns of drought evolution based on the SPEI and (2) to elucidate the intricate interplay between atmospheric circulation and drought phenomena. The middle reaches of the Yellow River Basin are a disaster-prone area and a crucial grain-producing area in China. Understanding the development law and clarifying the driving role of atmospheric circulations on drought can provide theoretical support for drought mitigation and water resource allocation in the middle reaches of the Yellow River Basin.

2. Materials and Methods

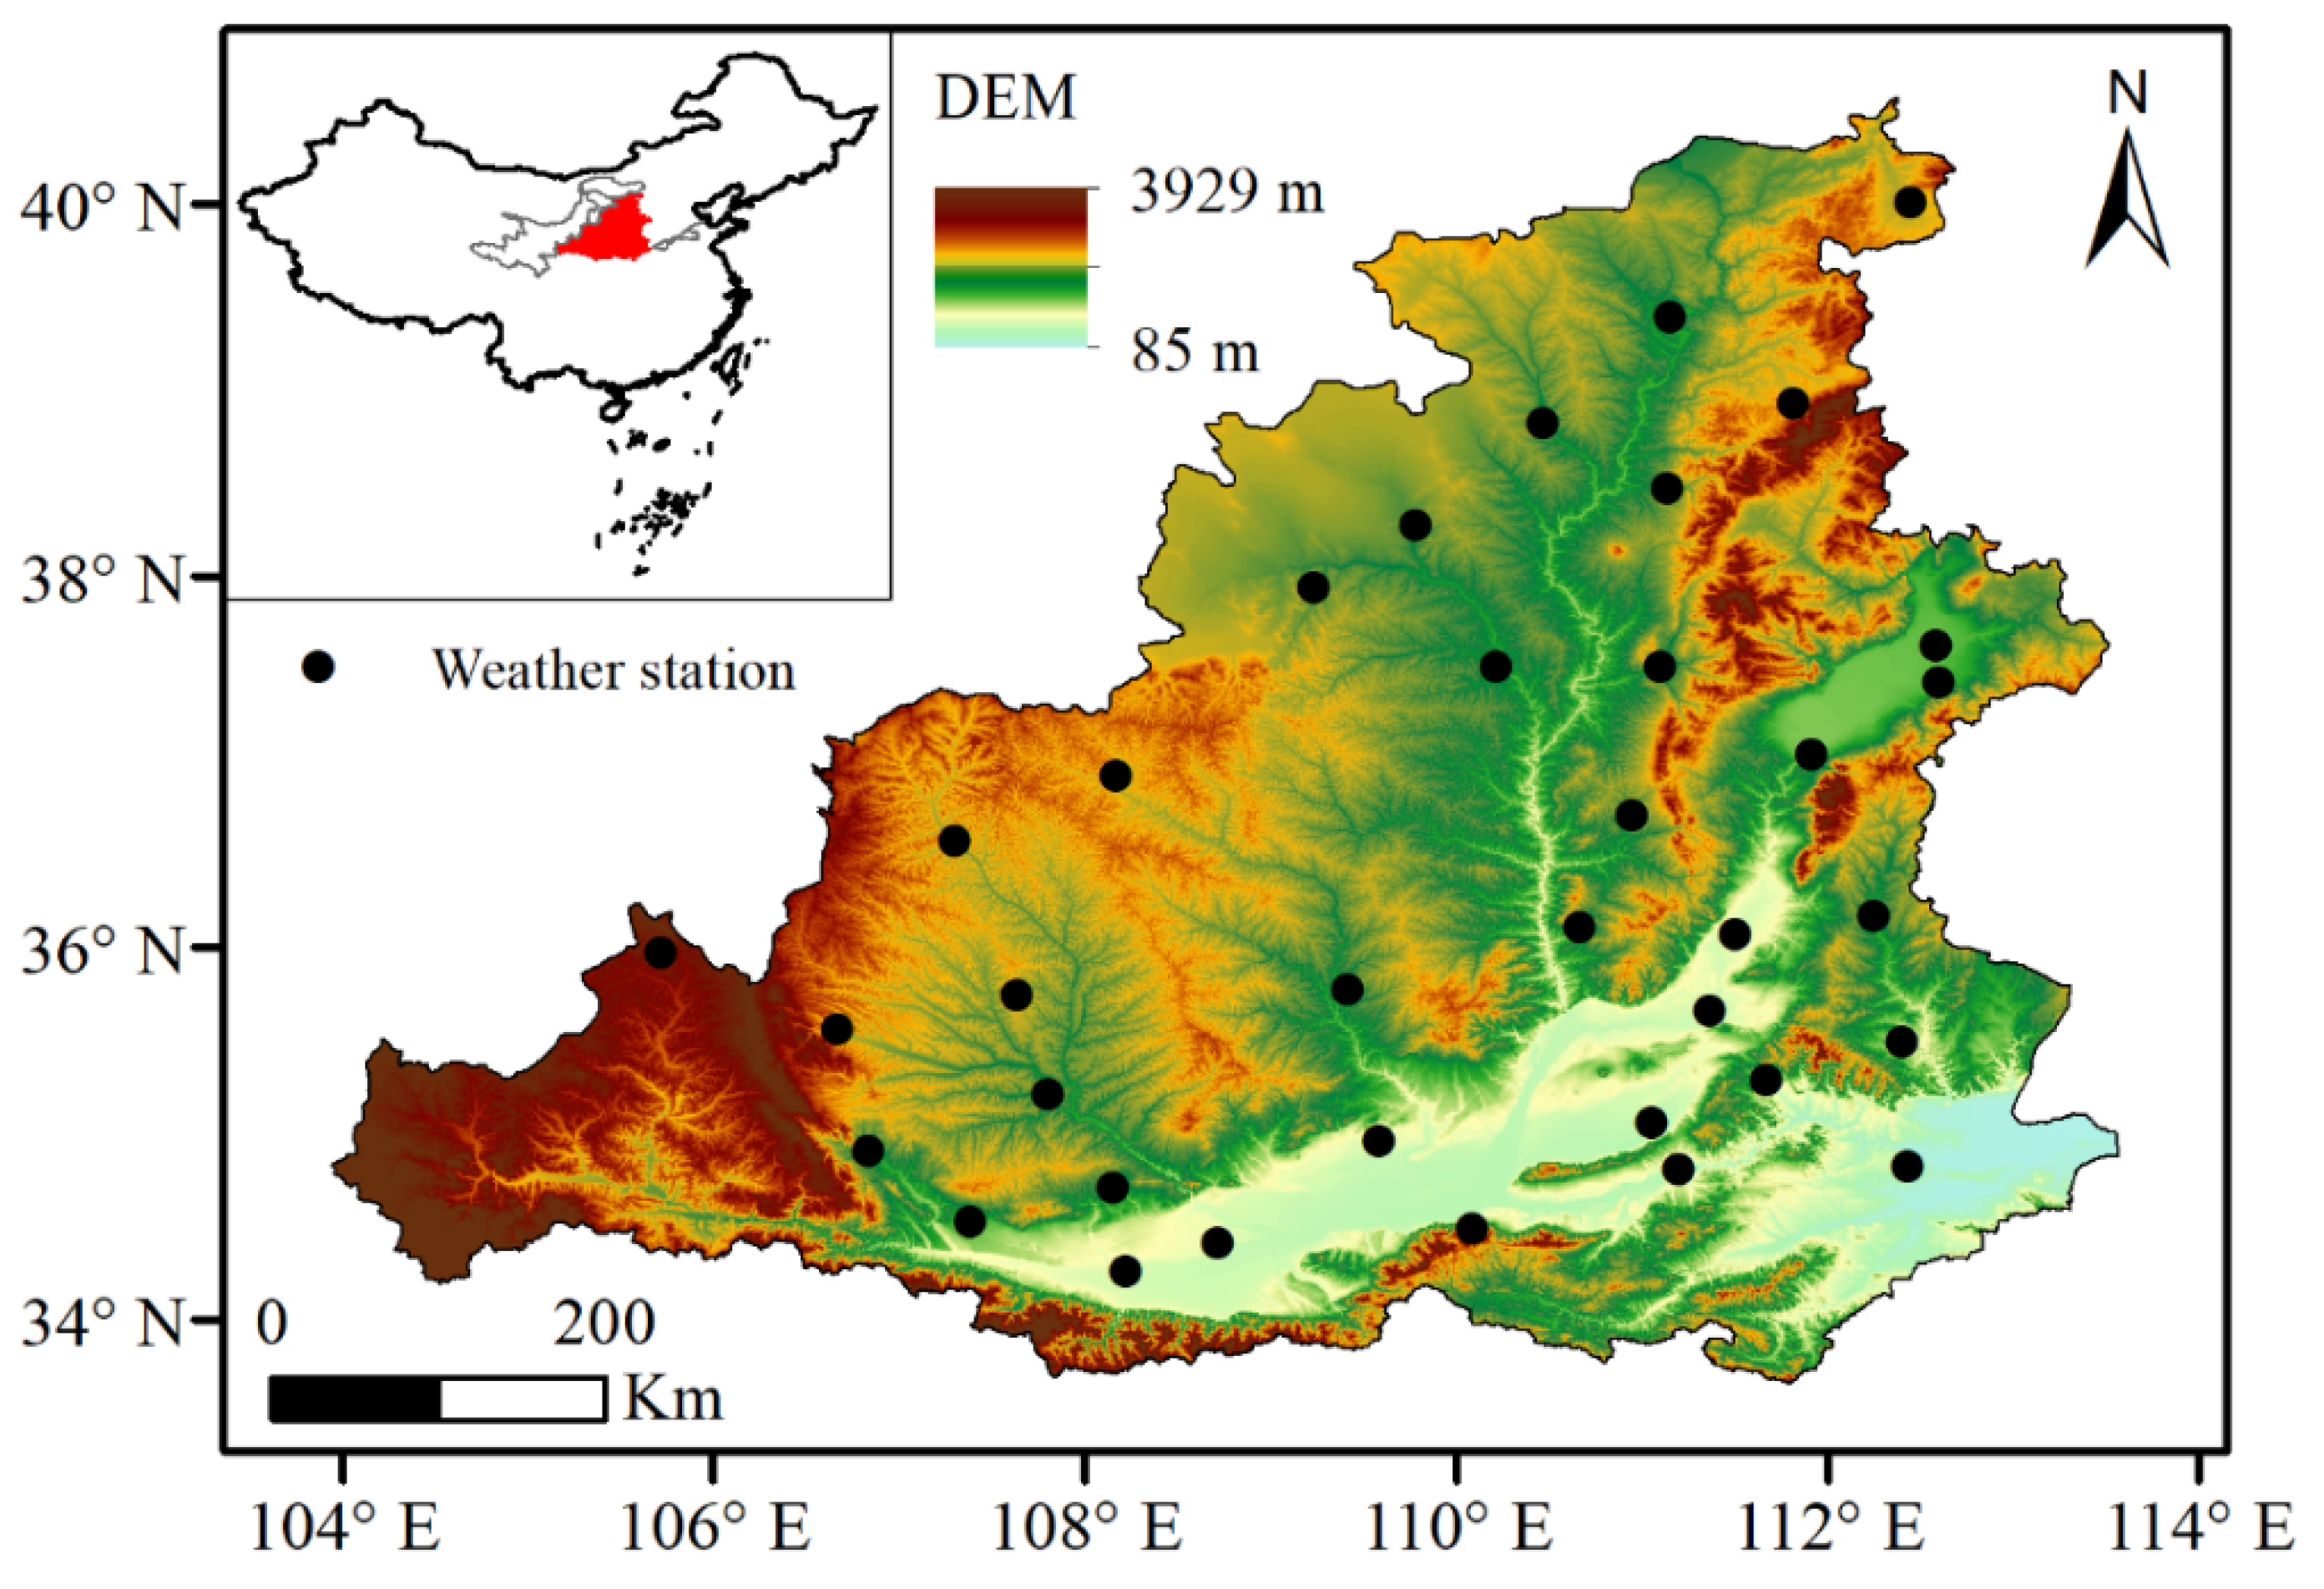
2.1. Study Area and Data Sources

The middle reaches of the Yellow River Basin encompass a significant stretch, spanning from Hekou Town in Inner Mongolia to Mengjin in Henan Province. This region traverses four provinces—Shanxi, Shaanxi, Henan, and Inner Mongolia. The middle reaches of the Yellow River Basin span a length of 1206 kilometers and cover a drainage area of 344,000 square kilometers, accounting for a substantial 45.7% of the entire basin’s drainage area. The middle reaches of the Yellow River Basin are located in the mid-latitude region and are influenced by monsoons throughout the year. In winter, the region experiences cold and dry conditions due to the influence of Siberian cold air, while in summer, it is hot and rainy under the impact of warm and humid air currents from the Pacific Ocean. Figure 1 illustrates the distribution of meteorological stations within the middle reaches of the Yellow River Basin.
The meteorological data and elevation details were acquired from the China Meteorological Data Network. This dataset includes crucial meteorological variables such as daily maximum temperature (Tmax), minimum temperature (Tmin), average temperature (Tmean), precipitation (P), average relative humidity (RH), wind speed at a 2 m height (U2), and sunshine hours (n). To ensure the data quality and reliability, a comprehensive assessment was conducted using the non-parametric Kendall rank correlation method and the Mann–Whitney homogeneity test [35]. From the National Climate Center (http://cmdp.ncc-cma.net/cn/download.htm, accessed on 1 January 2022), 130 circulation indices from 1961 to 2020 were collected. After the multi-layer screening, the representative Arctic Oscillation (AO), Antarctic Oscillation (AAO), North Atlantic Oscillation (NAO), NINO 1+2 SSTA Index (NINO1+2), ENSO Modoki Index (EM), Nino Eastern Pacific index (NE), Total Sunspot Number Index (TSN), and Southern Oscillation Index (SOI) were selected as the key circulation factors for the analysis of drought causes.

2.2. Calculation of Drought Index

The reference crop evapotranspiration (ET0) was determined using the FAO56 Penman–Monteith method [36]:
E T 0 = 0.408 Δ ( R n G ) + γ 900 T m e a n + 273 u 2 ( e s e a ) Δ + γ ( 1 + 0.34 u 2 )
where Δ is the slope of the saturated water vapor pressure curve (KPa °C−1), Tmean is the daily average temperature at the height of 2 m (°C), γ is the hygrometer constant (KPa °C−1), Rn is the net radiation (MJ m−2 day−1), u2 is the average daily wind speed at 2 m above the ground level, G is the soil heat flux (MJ m−2 day−1), es is the saturated water pressure (KPa), and ea is the actual water pressure (KPa).
The annual-scale SPEI (SPEI-12) is a widely used tool for analyzing inter-annual drought fluctuations. Notably, the SPEI incorporates temperature, thus encompassing the influence of changes in surface evapotranspiration on drought. This allows the SPEI to effectively capture droughts driven by rapid temperature increases. The cumulative water deficit for 12 months is determined based on the calculated cumulative P and ET0. A log-logistic probability distribution function normalizes the D series and obtains the SPEI [19]. The procedures were as follows:
D = P E T 0
S P E I = W c 0 + c 1 W + c 2 W 2 1 + d 1 W + d 2 W 2 + d 3 W 3
where the parameters c0, c1, c2, d1, d2, and d3 are 2.515517, 0.802853, 0.010328, 1.432788, 0.189269, and 0.001308, respectively. For P(D) ≤ 0.5, W = - 2 l n P ( D ) . For P(D) > 0.5, W = - 2 l n ( 1 - P ( D ) ) and the sign of SPEI is reversed, where P is the probability of exceeding a determined D value.

2.3. Methods for Identifying Drought Characteristics

The run theory methodology can be used to detect and characterize drought events occurring on 12-month timescales [37]. The runs are defined by the time series Xt portion, where all values are less than or greater than the selected threshold X0 [38]. A drought event is identified as commencing when the SPEI falls below −1.0 and terminating when the SPEI surpasses 0. The duration of a drought is determined by aggregating the consecutive months exhibiting dry conditions (SPEI < −1) across all drought events. Drought severity quantifies the cumulative absolute value of the SPEI for all drought events from initiation to termination. The nadir of the SPEI during a drought period represents the drought’s peak intensity.
In this study, drought conditions were characterized using the Standardized Precipitation Evapotranspiration Index (SPEI), where higher SPEI values indicate wetter conditions, while lower values indicate drier conditions. Specifically, the SPEI values were categorized as shown in Table 1.

2.4. Drought Trends and Mutation Testing Methods

The cumulative distance method is a method of judging trend changes visually using curves, and for the sequence x, the cumulative distance of t at a specific moment is
x t ^ = i = 1 t ( x i x ¯ ) ( t = 1 , 2 n )
x ¯ = 1 n i = 1 n x i
where x ^ t is the cumulative distance and x ¯ is the average value.
The Pettitt test is a mutation testing method proposed by Pettitt [39], and its significance level can be represented by p, with p < 0.05 indicating significant mutations. The calculation method for each value is as follows:
U t , N = U t 1 , N + i = 1 n s g n ( x t x i ) ,     t = 2 , 3 , 4 , n
K t , N = m a x U t , N , ( 1 t N )
p = e x p 6 K t , N 2 / ( N 3 + N 2 )
This method divides the time series into two parts before and after time t, namely x1, x2xt and xt+1, xt+2xn, assuming that time t is the most likely turning point. The method is based on the Mann–Whitney statistics Ut,N. The maximum value of |Ut,N| can determine the location of the possible mutation point and is represented by Kt,N.

2.5. Drought Interaction with Atmospheric Circulation

This study used correlation analysis and wavelet analysis to study the relationship between the SPEI and atmospheric circulation. At the same time, we also used the detrending method to study the influence of atmospheric circulation on a meteorological factor to determine whether circulation factors affect drought by influencing a particular meteorological factor. The steps are as follows: (1) calculate the Sen slope of each meteorological factor, (2) detrend each factor through the slope, (3) calculate the detrended SPEI by replacing one factor at a time, and (4) compare the distribution of the SPEI in different intervals. In addition, we also used the linear fitting method to study the influence of circulation factors on drought. Multiple circulation factors were used as independent variables to fit the SPEI, and the coefficients of each factor were compared to measure the individual contributions of the circulation factors to the SPEI. By converting time series signals into the time-frequency domain, wavelet analysis can determine the main change patterns and how these patterns change with time [40]. The main function of wavelet is as follows:
+ ψ ( t ) d t = 0
where t is the time and ψ ( t ) is a wavelet function, which can be translated and scaled on the time axis to form a cluster function:
ψ a , b t = a 1 / 2 ψ t b a , a , b R ,     a 0
where ψ a , b is the wavelet, a reflects the wavelet length factor, and b is the time translation factor. The Morlet wavelet was used as the basis function, and MATLAB R2022a was used for wavelet analysis.

3. Results

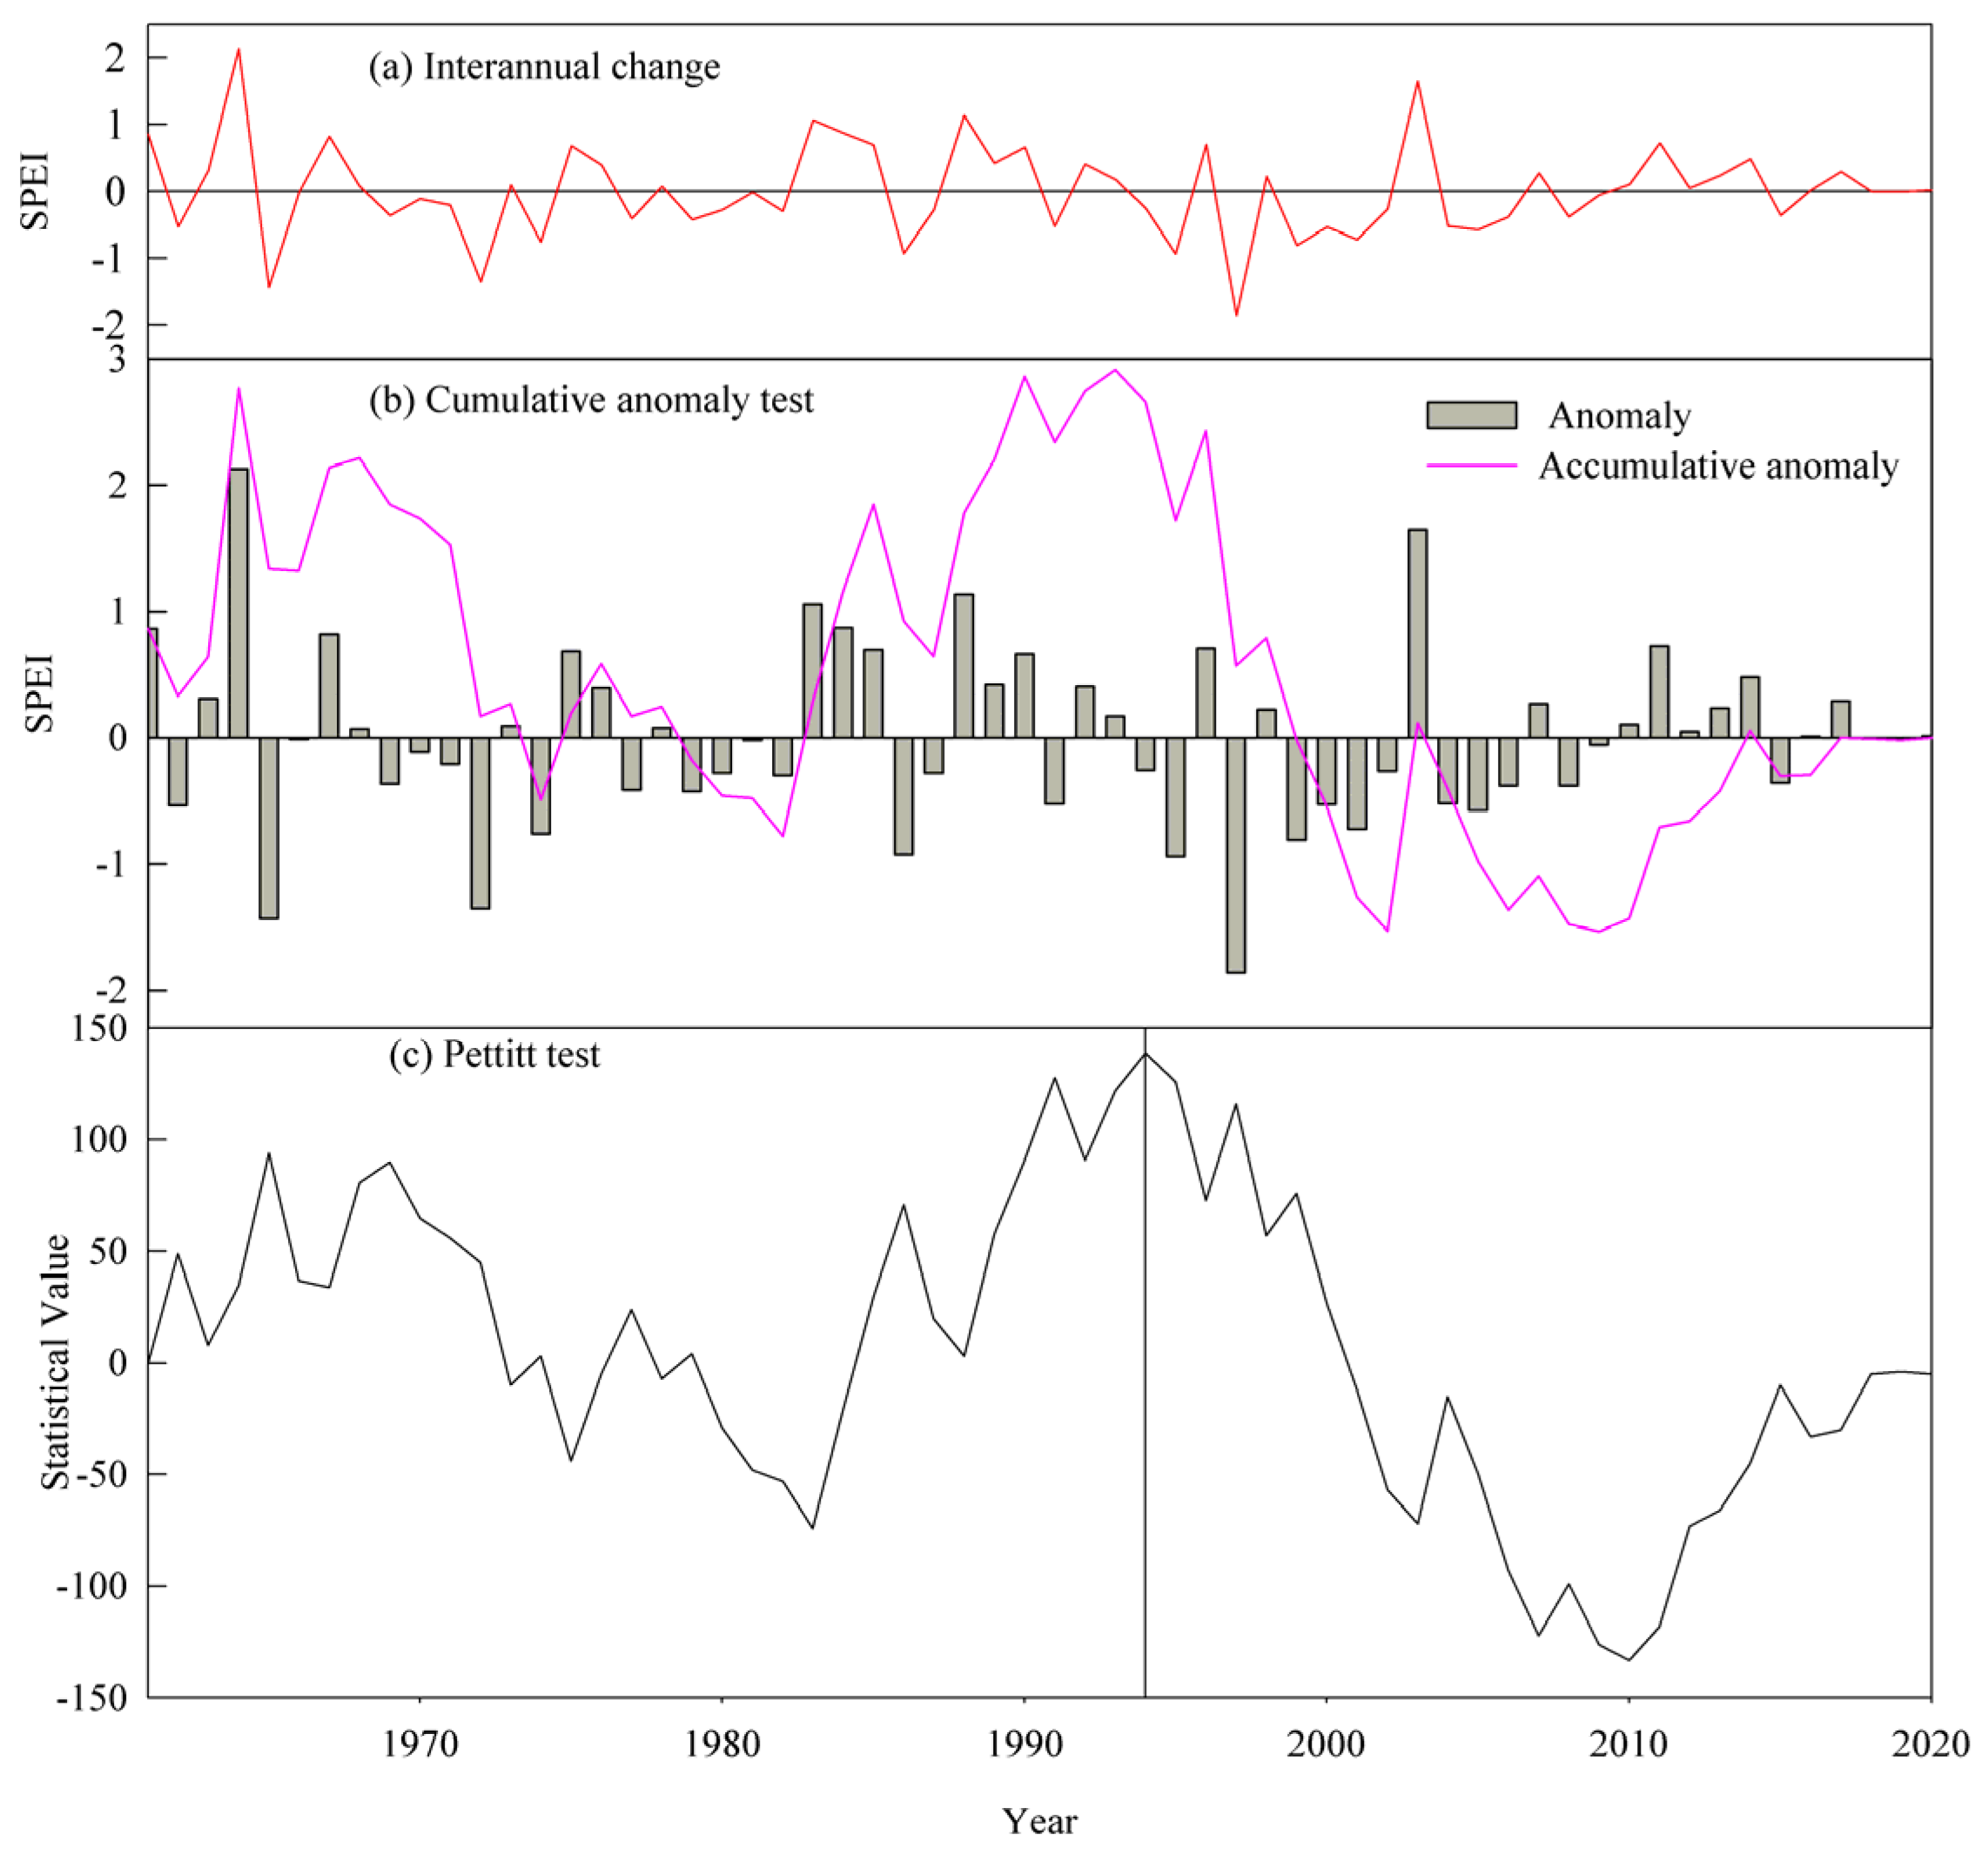
3.1. Time Variation Patterns and Trends of SPEI Changes

The annual SPEI values in the middle reaches of the Yellow River Basin (illustrated in Figure 2a) exhibited notable oscillations between positive and negative ranges from 1961 to 2020. During this period, there were 13 specific years (including 1962, 1974, 1986, 1991, etc.) where the SPEI fell below −0.5, coinciding with drought events. Furthermore, the years 1965, 1972, and 1997 saw the SPEI drop below −1.0, indicating moderate drought conditions. However, the SPEI did not reach levels below −2.0, suggesting the absence of extreme drought events in the region during the analyzed timeframe.
The trend of the SPEI (depicted in Figure 2b) was analyzed using the cumulative anomaly method. The highest SPEI value, 2.13, was observed in 1964, while the lowest value, −1.86, occurred in 1997. The interannual variation pattern of the SPEI within the middle reaches of the Yellow River Basin was complex. The SPEI for this region exhibited alternating upward and downward trends, with pivotal years including 1964, 1974, 1976, 1982, 1993, and 2009. The prevailing pattern gradually rose until 1994, followed by a gradual decline. A mutation analysis was conducted using the Pettitt test to analyze the SPEI sequence for any significant changes (Figure 2c). The findings revealed a concurrence between the evolving trend of the Pettitt statistic and the cumulative anomalous pattern. The maximum Pettitt statistic value, 139, was recorded in 1994 with a corresponding p-value of 1.18. This suggests that a mutation occurred in 1993, but the mutation trend was statistically insignificant.

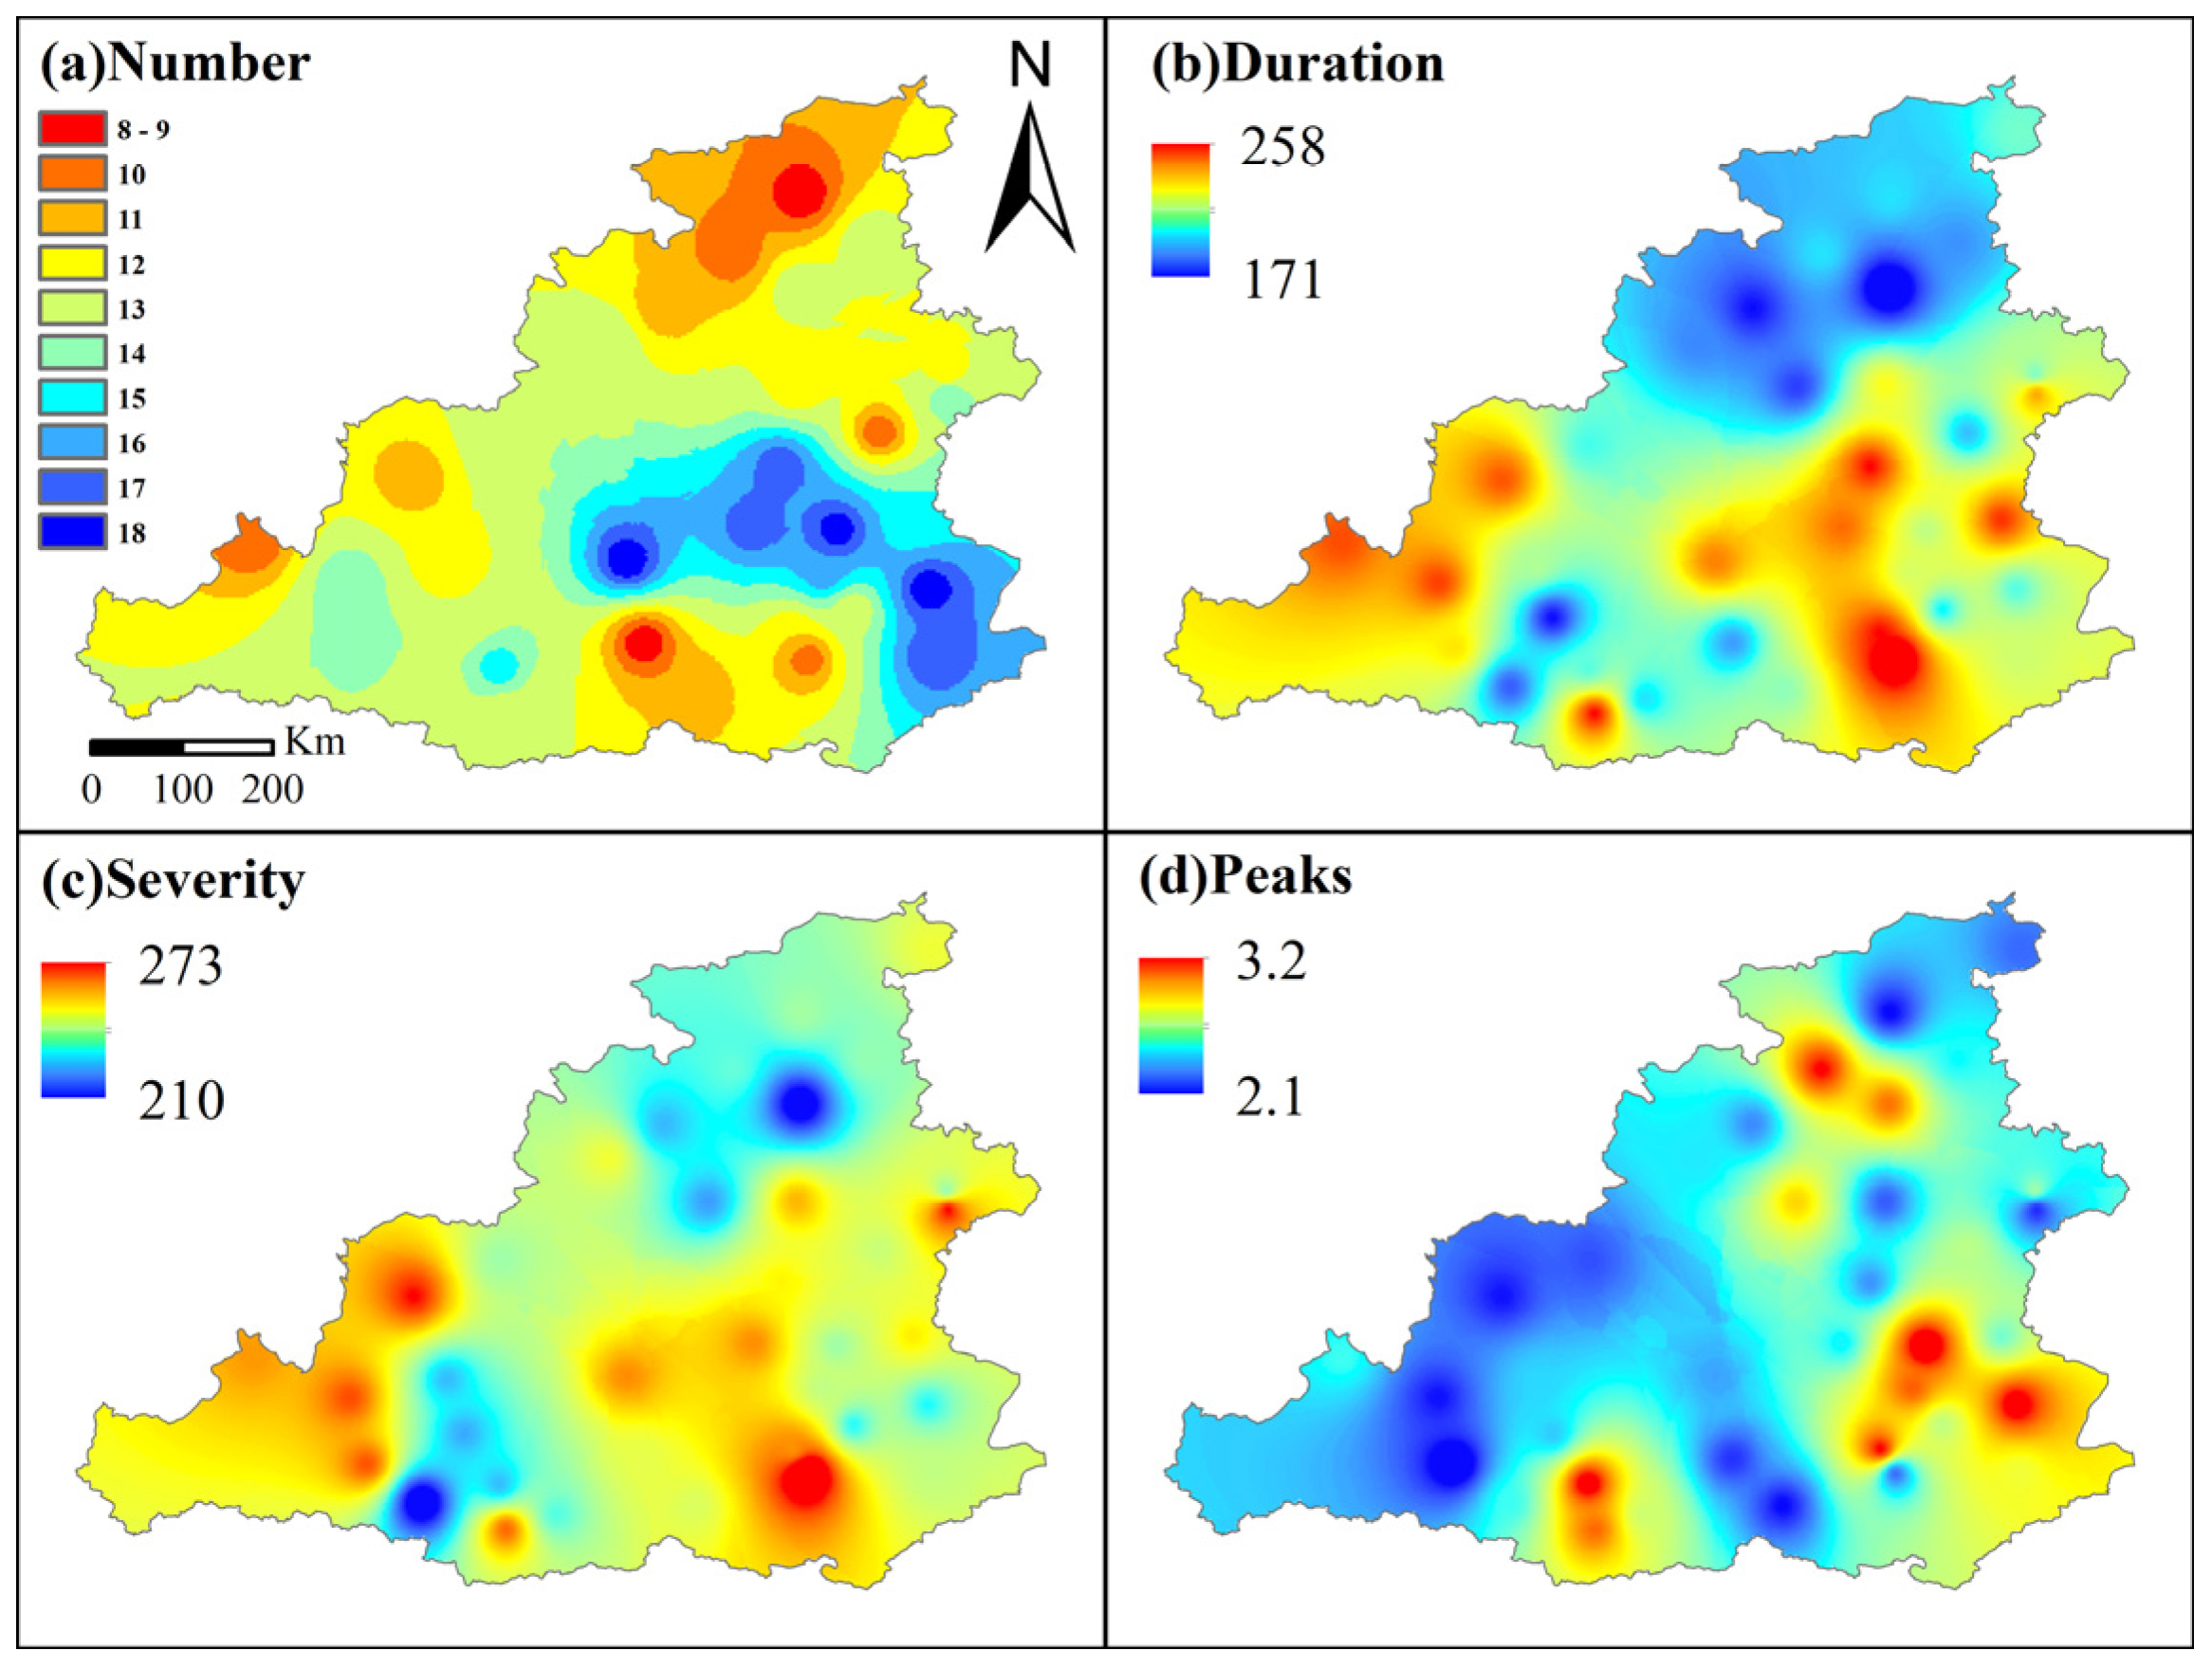
3.2. The Spatial Pattern of Drought Characteristics

Drought events from 1961 to 2020 exhibited substantial spatial variation, as depicted in Figure 3. It is crucial to note that a drought event does not solely encompass the duration of drought but encompasses the entire span. This does not imply that the entire period was under a drought state. Additionally, the frequency of drought events was not directly correlated with longer drought durations.
On average, there were 13 drought events in the Yellow River Middle Basin from 1961 to 2020. Among the 36 sites, the highest frequency of drought occurrences was observed in Linfen, Luochuan, and Yangcheng, each experiencing 18 drought events over 60 years. Conversely, Hequ and Pucheng were the least drought-affected sites, each tallying only a few drought events over the 60 years. Pronounced variations in drought occurrences were observed among the 36 stations in the middle reaches of the Yellow River Basin over the past six decades. The southeast area of this region was identified as a high-frequency drought zone, while the northernmost region exhibited a low frequency of drought occurrence (Figure 3a).
The average drought duration within the middle reaches of the Yellow River Basin for 1961–2020 was 214 months (Figure 3b). Notably, the most prolonged drought duration among the 36 sites reached 258 months, while the shortest was only 171 months. An intriguing observation was that the Sanmenxia station, despite enduring the most prolonged drought durations, experienced relatively fewer drought occurrences—only nine instances over the study period. This indicated a relatively lower frequency, suggesting that each drought event at this station was relatively extended within the middle reaches of the Yellow River Basin. Conversely, the Xingxian station exhibited the shortest drought durations, totaling 13 drought events. This suggested a higher frequency of drought events at this station, with each occurrence being relatively brief within the middle reaches of the Yellow River Basin. Overall, the spatial distribution of drought duration exhibited a pattern of shorter durations in the middle, with longer durations towards the two ends of the study region.
The average severity of drought across the middle reaches of the Yellow River Basin from 1961 to 2020 was found to be 241. Among the 36 sites, the highest drought severity was 273, while the lowest was 210 (Figure 3c). Over the 60 years, the drought severity in the ranges of 210–230, 230–250, 250–270, and >270 was noted in 7, 18, 10, and 1 site(s), respectively, out of the 36. Notably, the peak of drought was defined as the minimum positive value of the annual timescale SPEI, indicating the most severe drought level experienced by these regions over the 60 years. From 1961 to 2020, the number of sites with regionwide drought peaks falling into ranges such as 2.1–2.3, 2.3–2.5, 2.5–2.7, 2.7–2.9, 2.9–3.1, and >3.1 was 7, 12, 7, 2, 7, and 1, respectively (Figure 3d). The average peak of drought in the middle reaches of the Yellow River Basin over this period was 2.56. Among the 36 sites, the highest recorded peak was 3.2, while the lowest was 2.1. These data imply that extreme drought events occurred at all stations within the middle reaches of the Yellow River Basin over the past 60 years.
Additionally, Pearson’s correlation analysis was conducted to assess the degree of correlation among various drought characteristics based on the SPEI-12 (Figure 4). The strongest correlation was observed between drought duration and severity, with a coefficient of 0.83 and a p-value of less than 0.001. This observation indicates a positive correlation between the duration of a drought event and its severity. The second-highest correlation was found between the number of drought events and the peak, with a coefficient of 0.38 and a p-value of less than 0.05. This indicates that sites experiencing more drought events may also have higher peaks, which means that these sites are more likely to experience extreme drought events. Conversely, correlations between the number and duration, number versus severity, number versus duration, peak versus duration, and peak versus severity were not found to be highly significant.

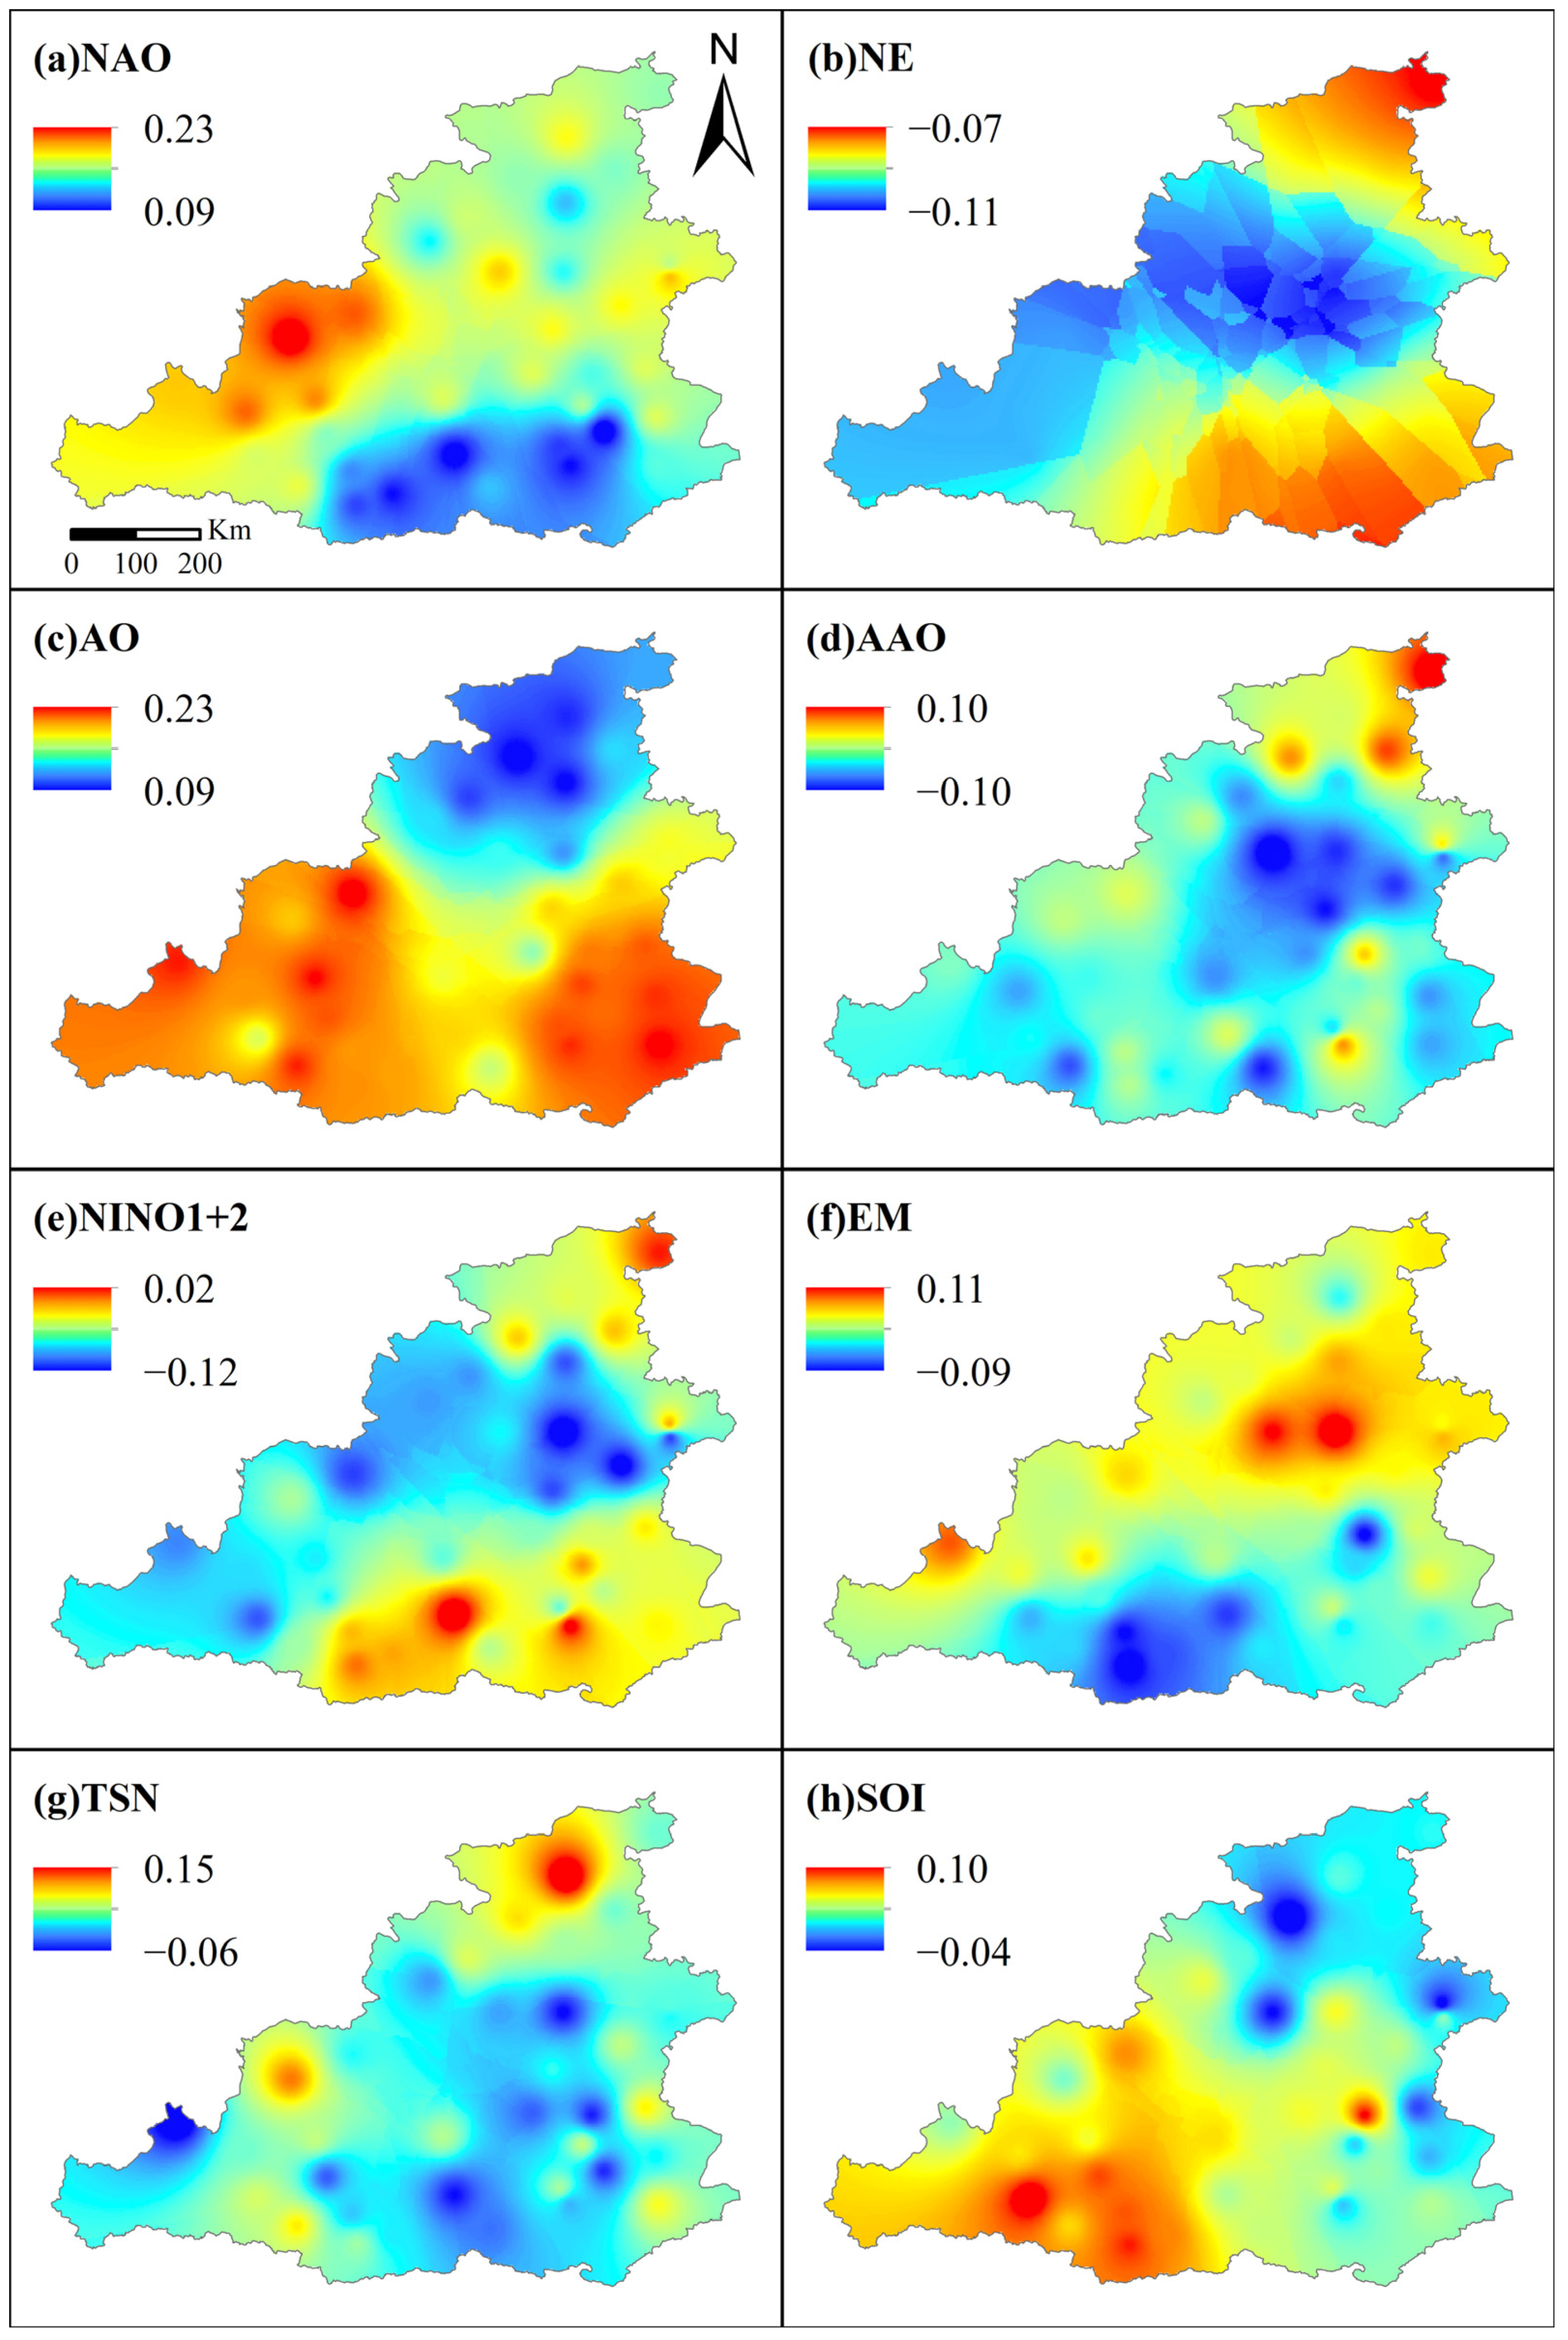
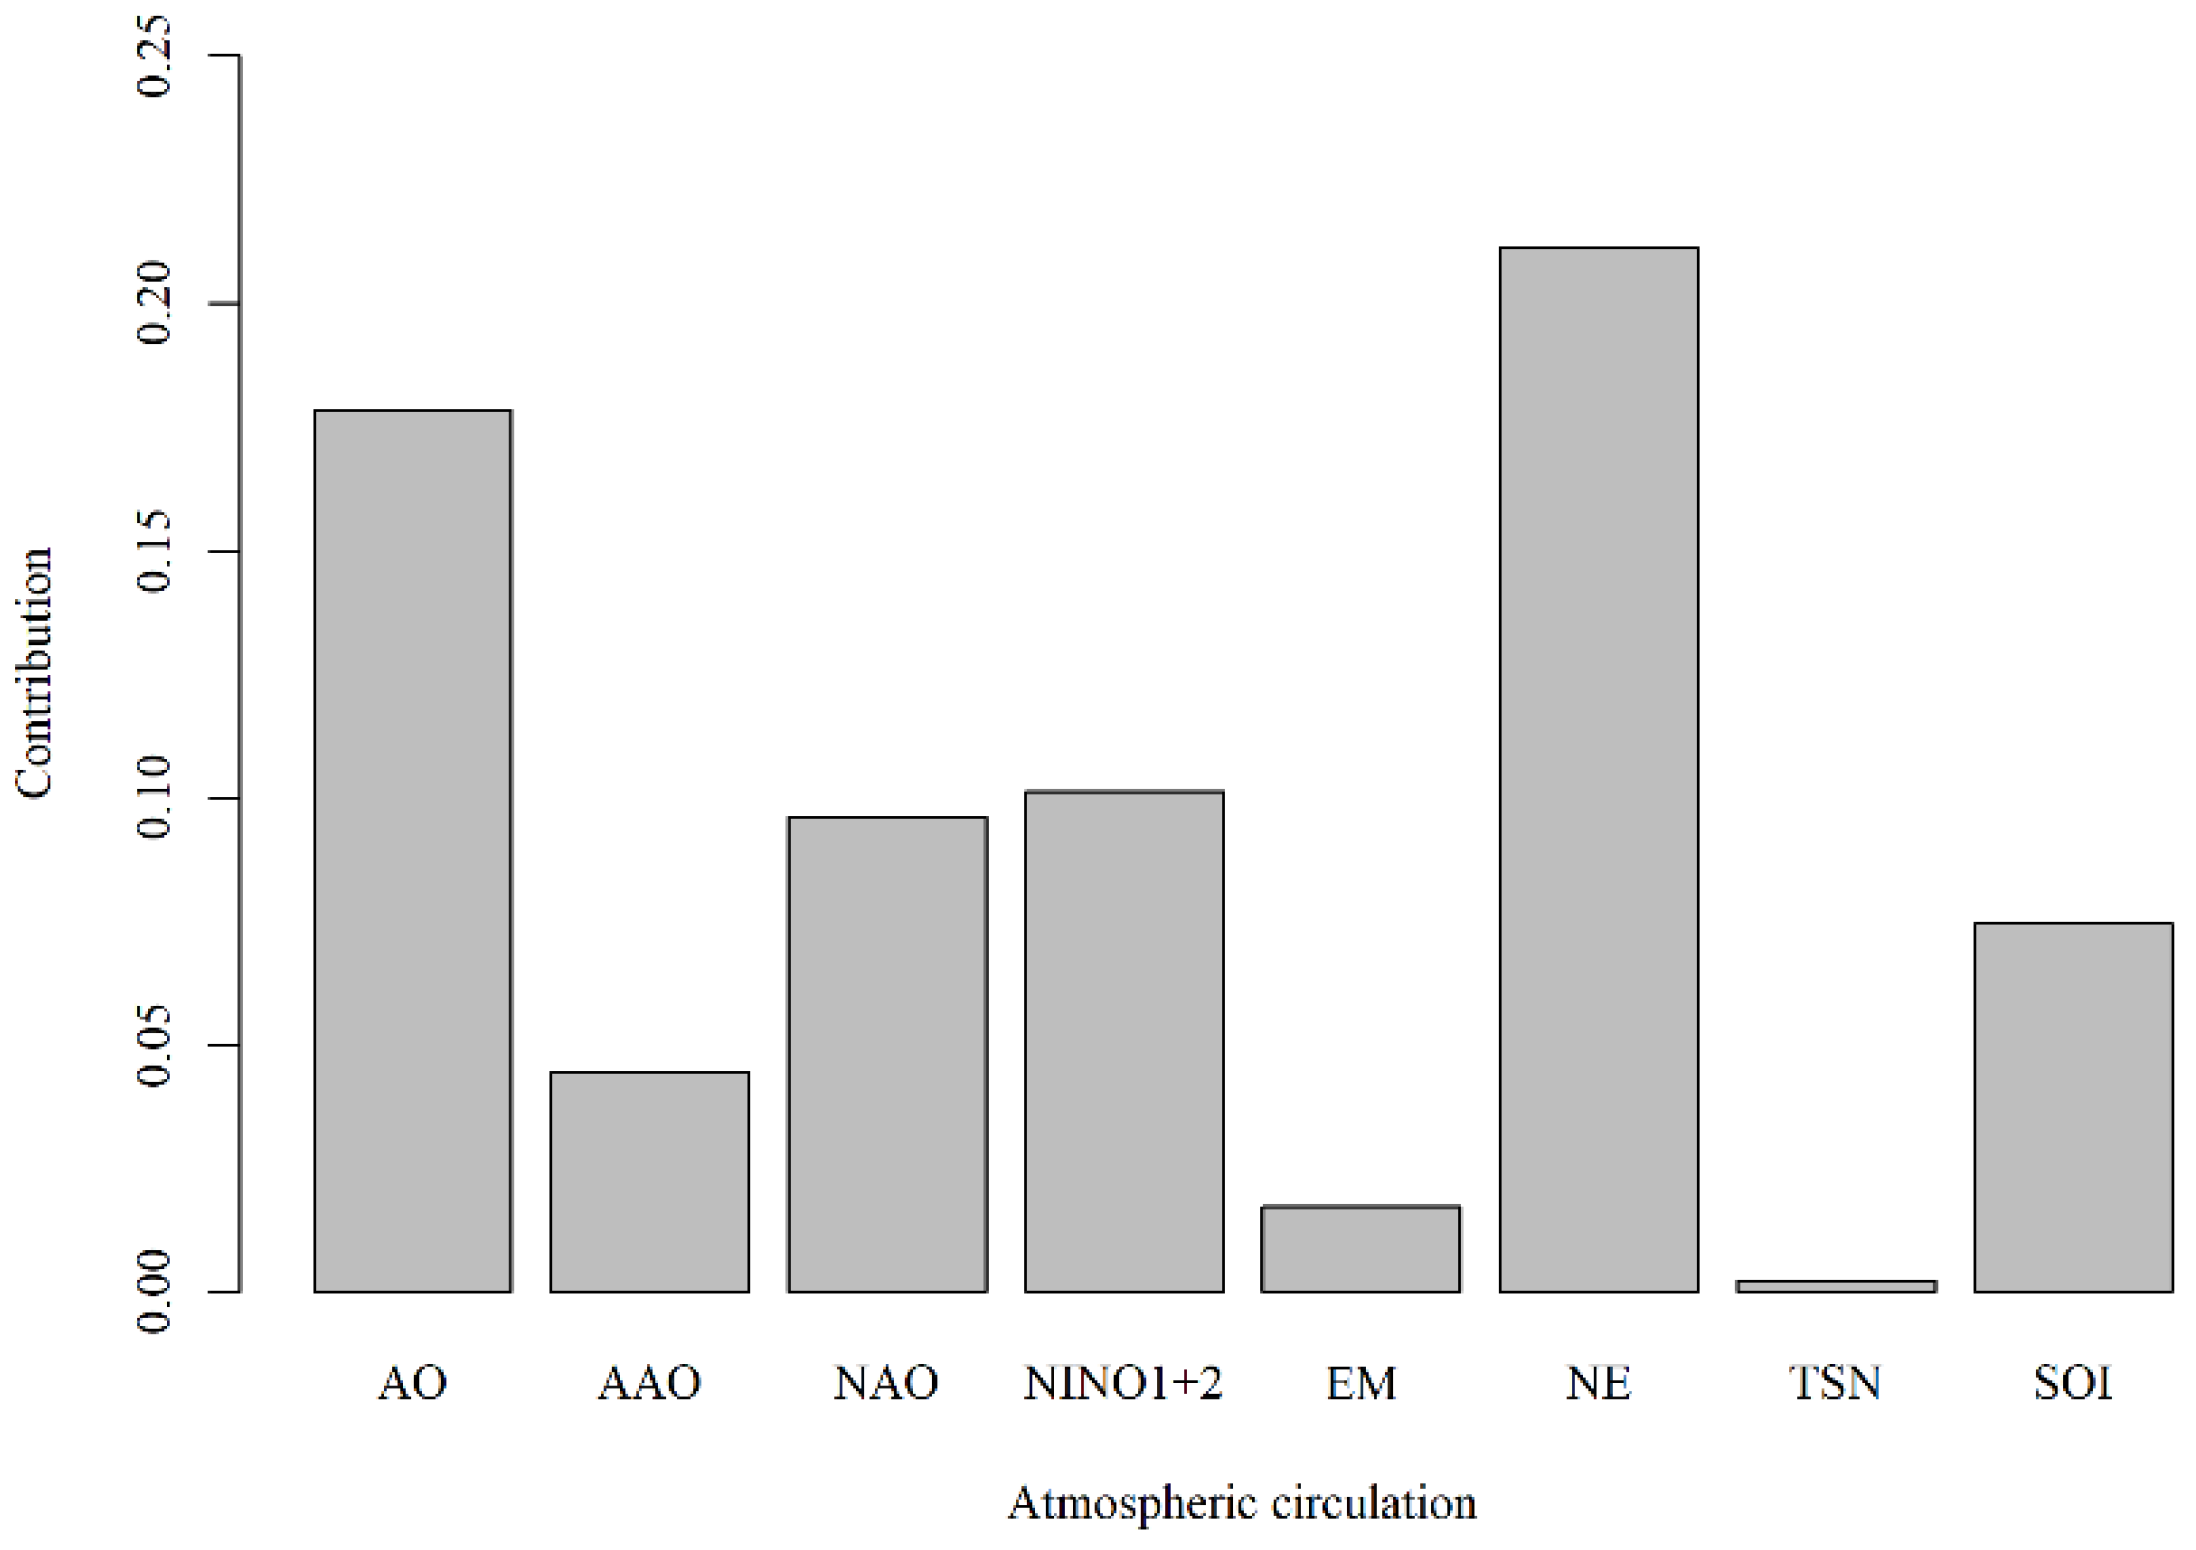
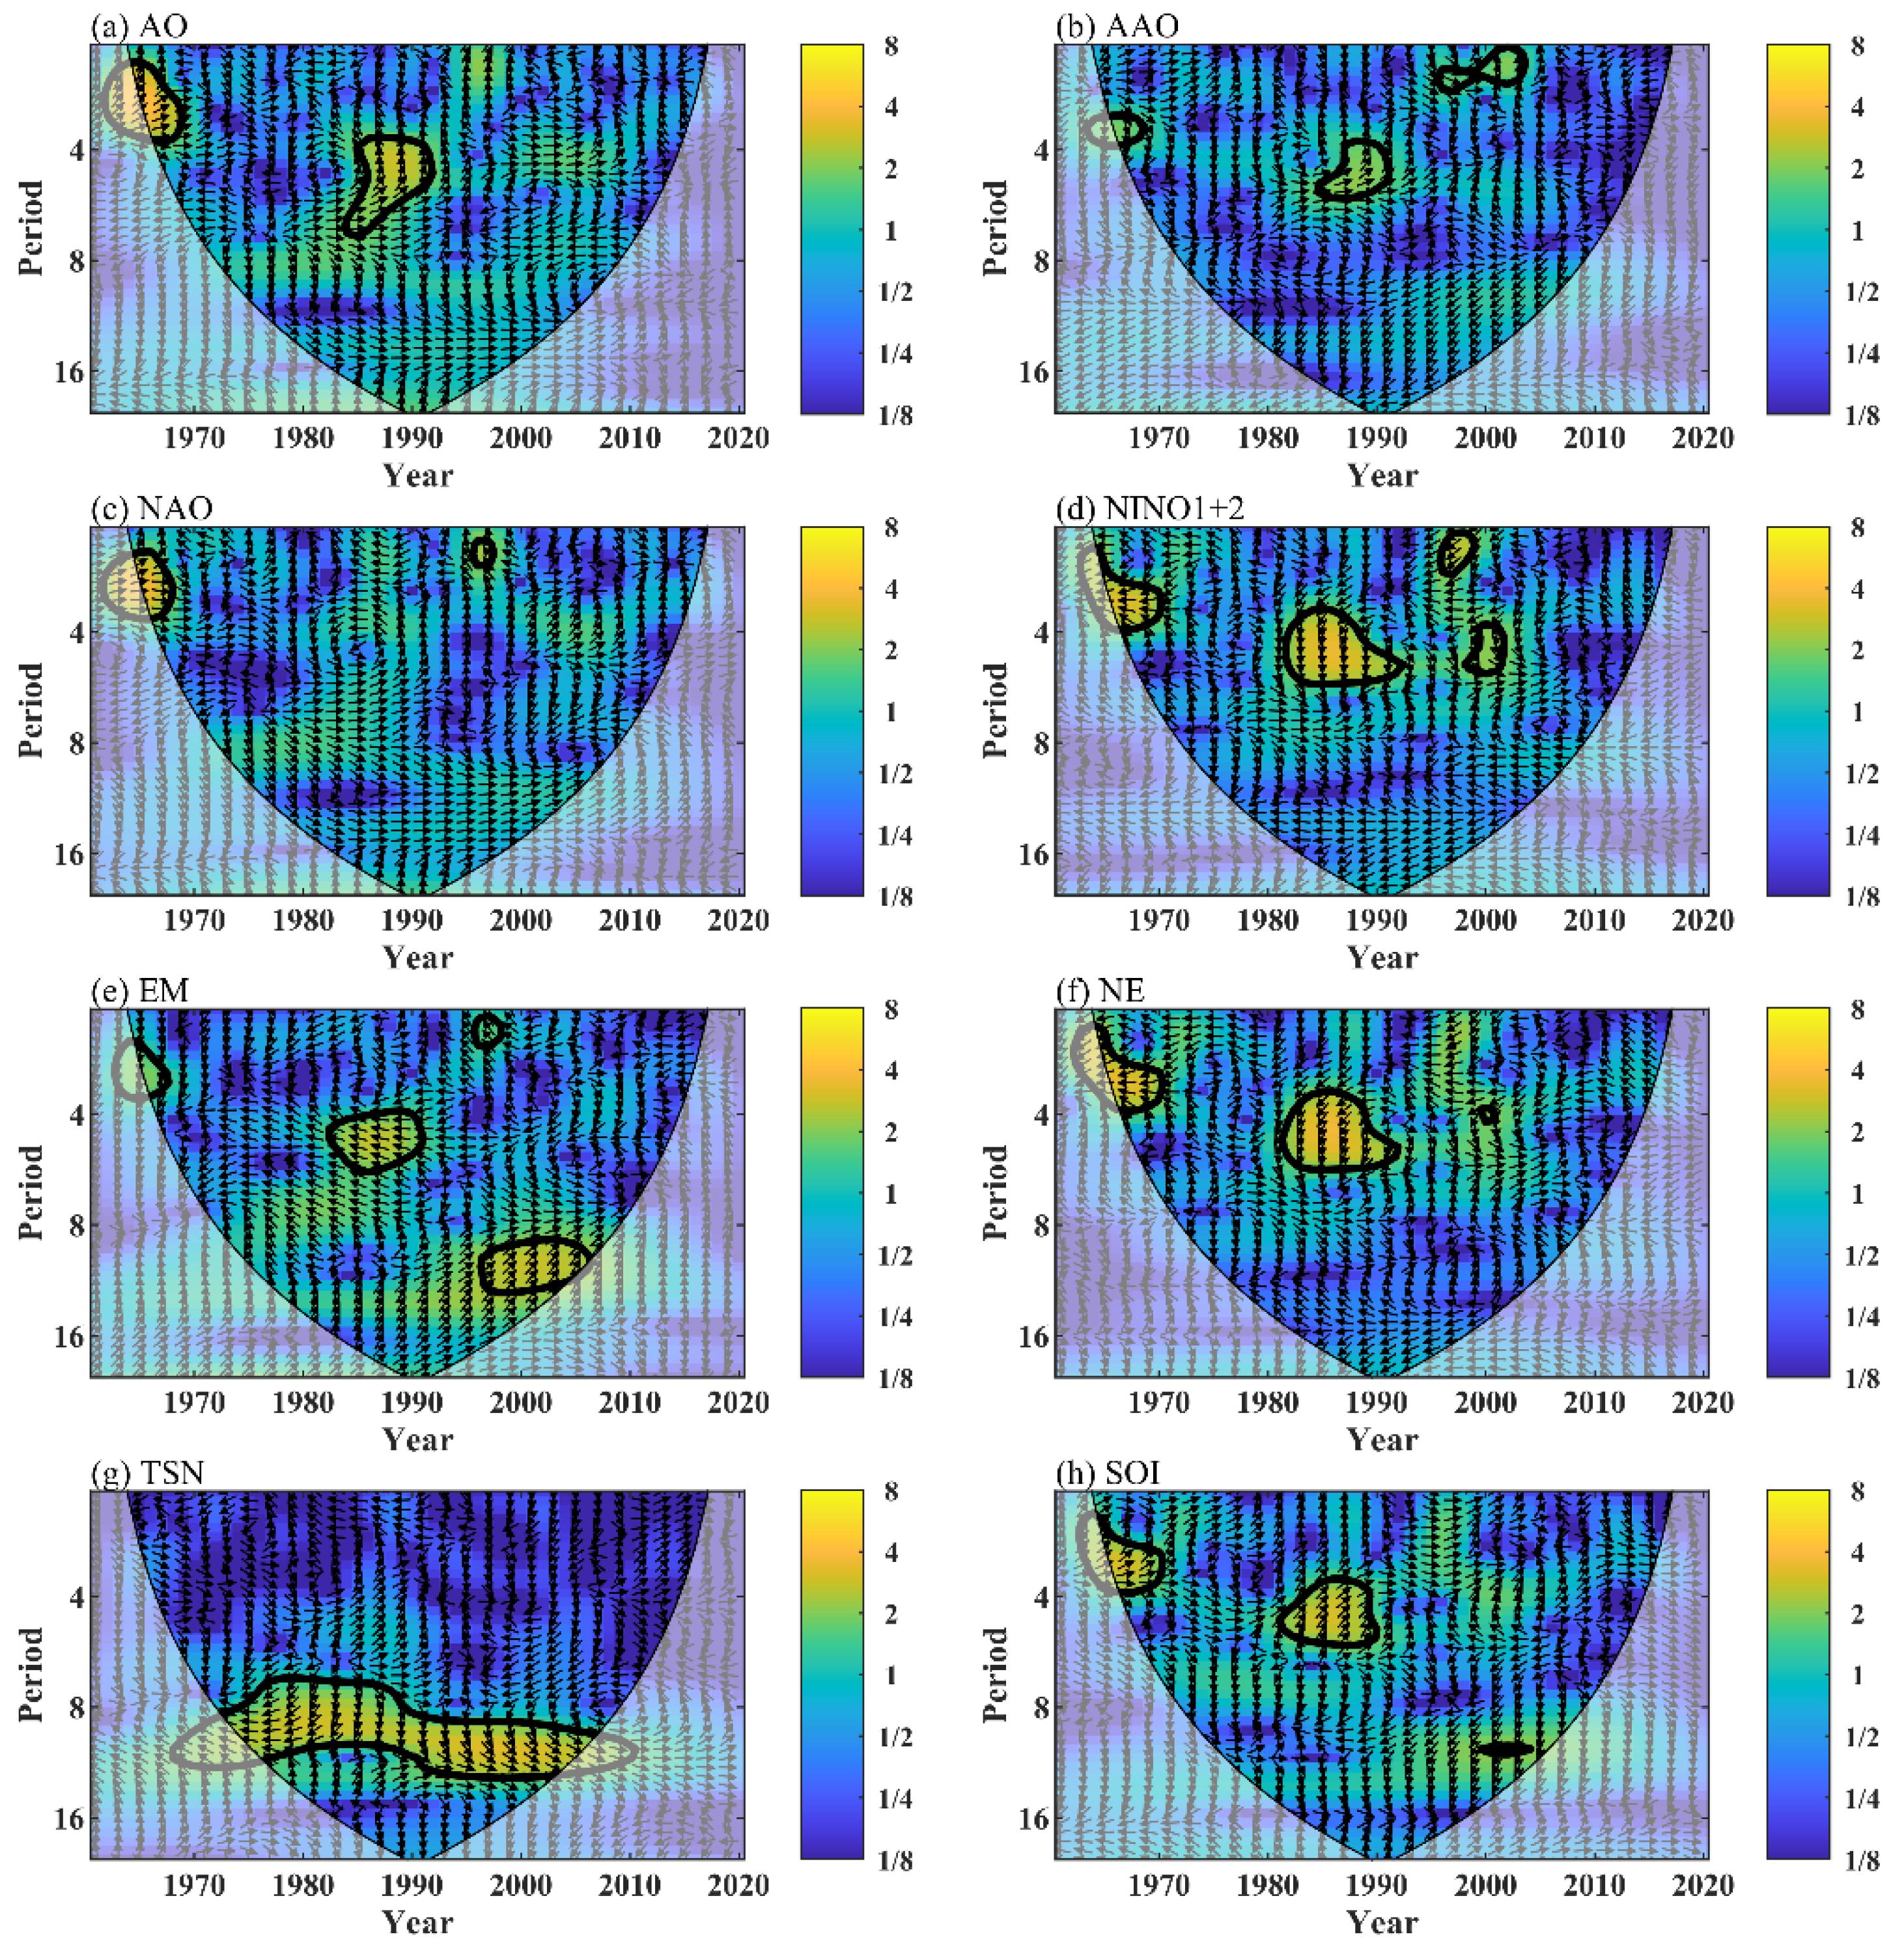
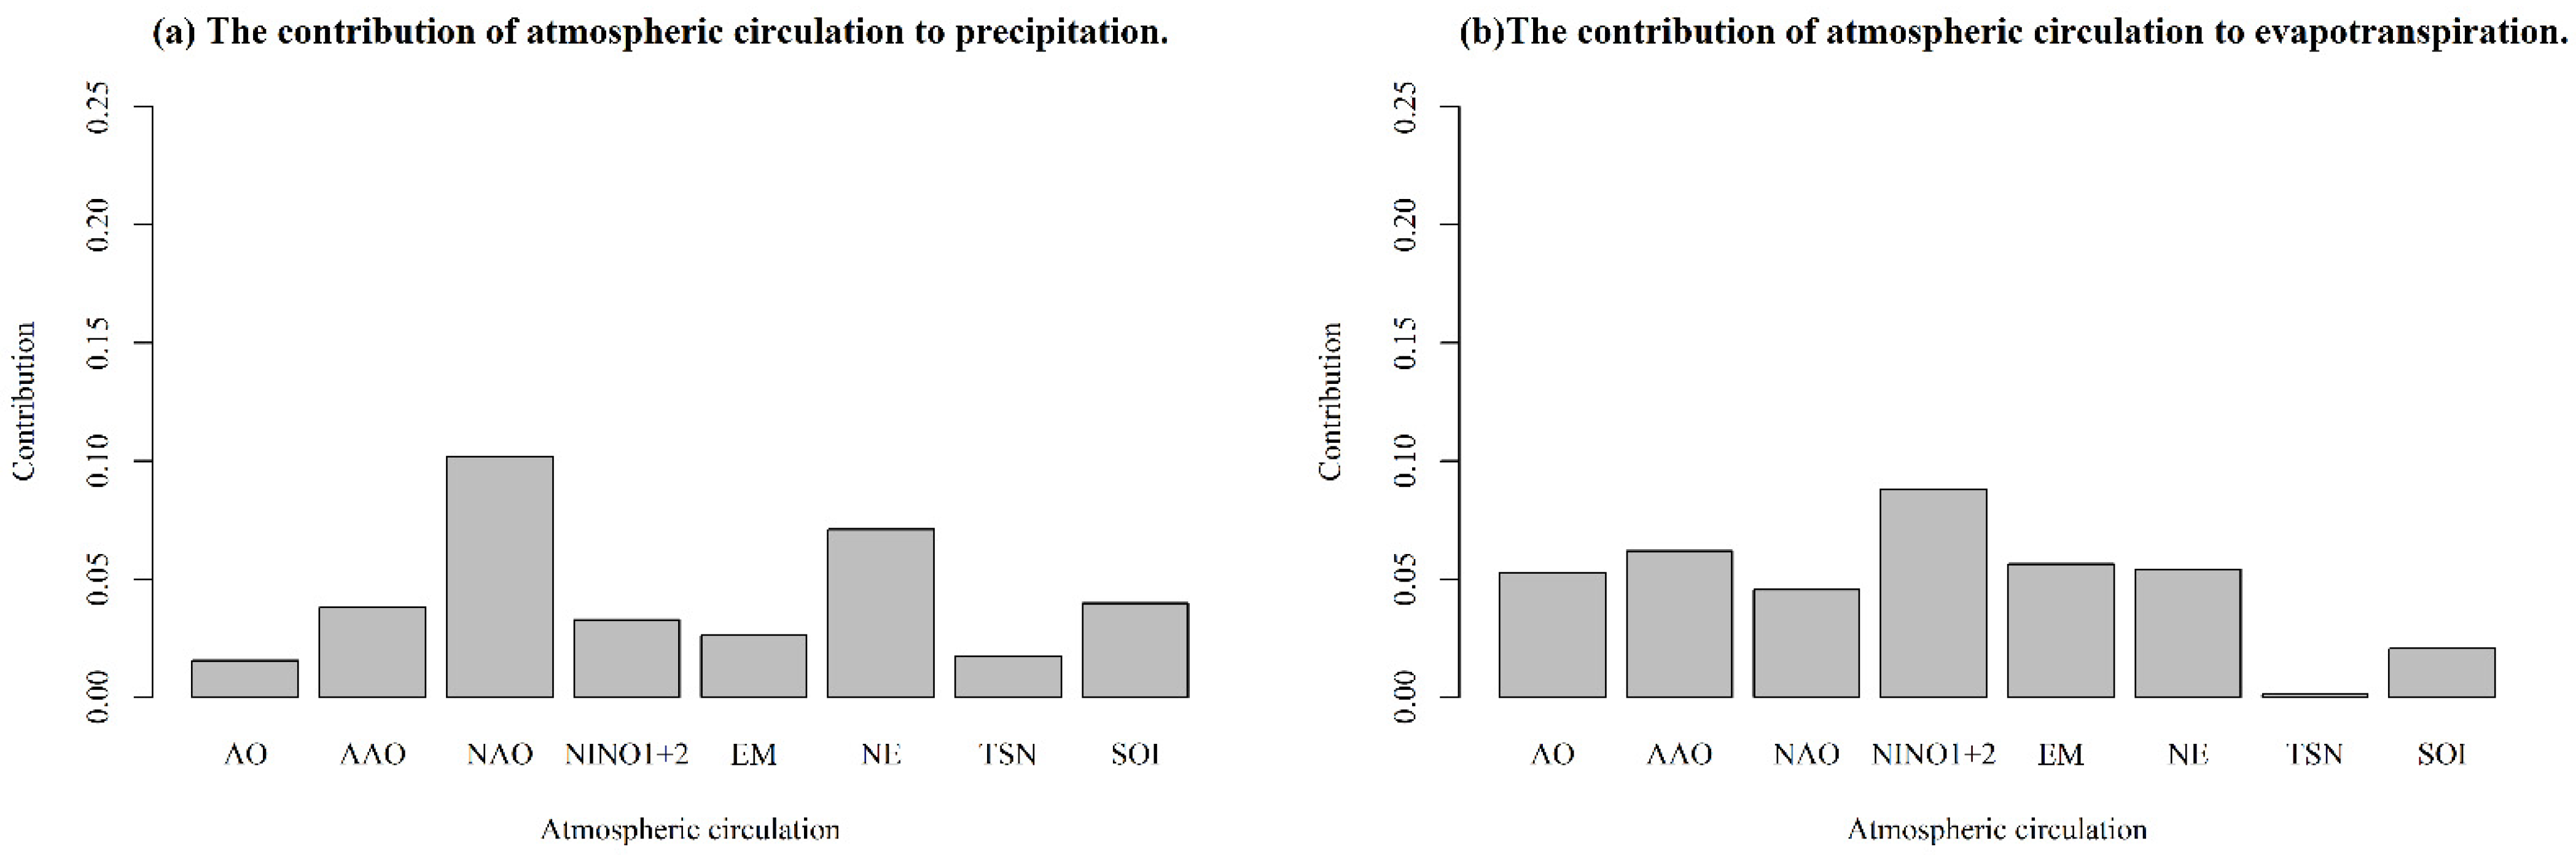
3.3. Effects of Atmospheric Circulation on Drought

The spatial correlations between the SPEI and various atmospheric circulation indices (including NAO, NE, AO, AAO, NINO1+2, NE, TSN, and SOI) on a one-month scale were examined across 36 stations within the middle reaches of the Yellow River Basin (Figure 5). Positive correlations were observed between the SPEI and AO and NAO (Figure 5a,c). The correlation coefficient between the SPEI and AO was slightly more substantial than that of the SPEI and NAO. In addition to the positive correlations with AO and NAO, the analysis also revealed positive and negative correlations between the SPEI and other climate indices, including AAO, NINO1+2, EM, TSN, and SOI (Figure 5b,d–h). Interestingly, the spatial distribution of the correlation coefficients between the SPEI, AAO, and TSN did not exhibit any distinct regional patterns (Figure 5d,g).
The relationship between the SPEI and the NINO1+2 index exhibited a spatial pattern, with positive correlations observed in the southern and northern regions but negative correlations in the central areas (Figure 5e). Similarly, the spatial distribution of the correlation between the SPEI and EM exhibited a regional contrast, with positive correlations observed in the northern part and negative correlations in the southern region (Figure 5f). Lastly, the spatial distribution of the correlation between the SPEI and SOI showed a positive correlation in the western region and a negative correlation in the eastern part (Figure 5h). It is worth noting that the correlation coefficients between the atmospheric circulation and the SPEI tended to be relatively low. This may be because atmospheric circulation influences the occurrence of droughts primarily through their impacts on meteorological factors, such as precipitation.
The weak correlation between the SPEI and the atmospheric circulation index may be attributed to the influence of atmospheric circulation on various factors, including meteorological factors. The Mann–Kendall method was employed to calculate the detrended SPEI to eliminate the influence of the meteorological factors’ trends. Additionally, the Sen slope of the SPEI for both sequences was calculated to analyze the spatial variations in drought and wetness in the middle reaches of the Yellow River. Figure 6 depicts the spatial distribution of the slopes of the SPEI and the detrended SPEI (retaining the precipitation trend) from 1960 to 2020. A positive slope indicates an increased likelihood of wetter conditions in the region, while a negative slope signifies a growing tendency towards drier conditions. The overall slope variability of the SPEI time series across the study area was relatively modest, with absolute values not exceeding 0.05. These findings suggest that substantial future changes in drought and wetness conditions within the basin are unlikely, underscoring the relative stability of the regional hydroclimatic regime. However, the slope of the detrended SPEI exhibited a marked reduction, suggesting the substantial impact of detrending meteorological factors on the SPEI slope. Consequently, this detrending process influenced not only the magnitude of the SPEI’s long-term trend but also modified the direction of the changing trend of SPEI across different regions within the basin. Notably, the analysis revealed transitions from dry to wet conditions in the region between 37° and 39° north latitude, as well as transitions from wet to dry conditions in the area between 108° and 112° east longitude, below 36° north latitude. The spatial extent of these observed dry-to-wet and wet-to-dry transitions encompassed more than 50% of the overall study area, underscoring the substantial influence of underlying meteorological factor trends on future drought and wetness conditions in the middle reaches of the Yellow River Basin. Furthermore, this widespread transition phenomenon highlights the significant impact of evolving meteorological conditions on drought formation dynamics in this region.
There were slight variations in the distribution of the SPEI across different value ranges when considering both the SPEI and detrended SPEI (Figure 7). The frequency of the SPEI, without accounting for detrended data, revealed a higher occurrence in the SPEI interval less than −2, signifying a marginal increase in the frequency of extreme drought events potentially influenced by atmospheric circulation. However, this increase was relatively modest. Conversely, in the SPEI interval between −2 and −1, the detrended data generally appeared lower than the non-detrended data, indicating a slight upsurge in the occurrence of moderate drought events potentially resulting from atmospheric circulation patterns. Again, the magnitude of this increase was comparatively small. In the SPEI interval between −1 and −0.5, the detrended data surpassed the non-detrended data, suggesting a minor reduction in the frequency of mild drought events due to the influence of atmospheric circulation. Nevertheless, this reduction was also relatively small. Overall, these findings indirectly imply the influence of atmospheric circulation on drought, albeit with a limited impact on the observed SPEI frequency distributions.
The SPEI was linearly fitted against eight atmospheric circulation indices, and the relative contributions of these indices were quantified through the calculated correlation coefficients (Figure 8). The graph shows that NE exerted the most significant influence on the SPEI, followed by AO and Nino1+2. Conversely, TSN exhibited a relatively minor impact on the SPEI.
Figure 9 illustrates the cross-wavelet energy spectra of the SPEI and various atmospheric circulation factors (AO, AAO, NAO, NINO1+2, EM, NE, TSN, and SOI) within the regions of high energy. There are two distinct mutual periods for the SPEI and AO, which occurred between 1 and 4 years during 1961–1969 and 3 and 7 years during 1983–1991. For the SPEI and AAO, there were three notable mutual periods: 3–4 years from 1963 to 1969, 3–5 years from 1984 to 1991, and 1–3 years from 1995 to 2003. The mutual periods for the SPEI and NAO were observed for 2–3 years from 1961 to 1968 and 1–2 years from 1995 to 1998. Furthermore, the SPEI and NINO1+2 showed four significant resonance periods: 1–4 years from 1963 to 1971, 3–6 years from 1981 to 1991, 1–2 years from 1996 to 1999, and 4–5 years from 1998 to 2002. The SPEI–EM interaction primarily featured four notable resonance periods: 2–3 years from 1963 to 1968, 4–6 years from 1982 to 1991, 1–2 years from 1996 to 1999, and 10–13 years from 1996 to 2007. For the SPEI and NE, two main mutual periods were evident: 1–4 years from 1962 to 1971 and 3–6 years from 1981 to 1990. A more prominent mutual period of 7–14 years was observed between the SPEI and TSN from 1968 to 2011. The SPEI and SOI had two key mutual periods: 2–4 years from 1962 to 1970 and 3–5 years from 1981 to 1990 (Table 2).
Notably, except for NAO, the other indices and the SPEI experienced periodic changes between 1980 and 1990. AO, AAO, and SOI exhibited notably positive correlations with the SPEI during this period. Conversely, the NE, EM, and NINO1+2 displayed significant negative correlations with the SPEI over the same timeframe. Furthermore, the correlations between NAO (EM) and SPEI also dis-played different patterns across different cycles (Figure 9). Table 2 reveals the distinct and significant correlations between the various circulation indices and the SPEI and their notable periodic relationships. Interestingly, even the same index and the SPEI exhibit diverse relationships across years, such as NAO. Most circulation indices displayed short-term variations lasting less than five years in their correlations with the SPEI. However, some relationships showed longer periodic changes in their correlations with the SPEI, such as EM (lasting from 1996 to 2007) and TSN (spanning 7 to 14 years).
Combined with Figure 2a, it can be seen that droughts of different degrees occurred during periods when the relationship between circulation factors and the SPEI was significant. It can be seen that the co-periodic oscillation of atmospheric circulation and SPEI was more likely to cause negative SPEI anomalies, thus triggering drought.

4. Discussion

4.1. The Variations and Trends of Drought

This study identified a rising trend of drought within the middle reaches of the Yellow River Basin. This phenomenon could be attributed to the substantial temperature rise coupled with a relatively minor increase in precipitation. The drought trend in this study is consistent with some of the results reported by Yang et al. (2004) [25]. However, it is worth noting that the difference between the findings of this study and Yang et al. [25] may be due to the selected time series and assessment methods. The research period of this study is shorter. Yang’s study had a more extended research period, but their drought index calculation was based on tree rings and drought/flood levels. However, the SPEI used in this study takes meteorological factors as input variables and considers evapotranspiration in the calculation. The identified areas with light drought and the regions experiencing the most severe drought, as highlighted in this study, diverge from the findings of Liu et al. [27]. This disparity might arise from the enhanced SPI’s incorporation of early rainfall effects while omitting the influence of basin evapotranspiration. This study furnishes a distinct foundation for formulating agricultural drought prevention and management strategies by examining the traits and trajectories of drought in the study area.

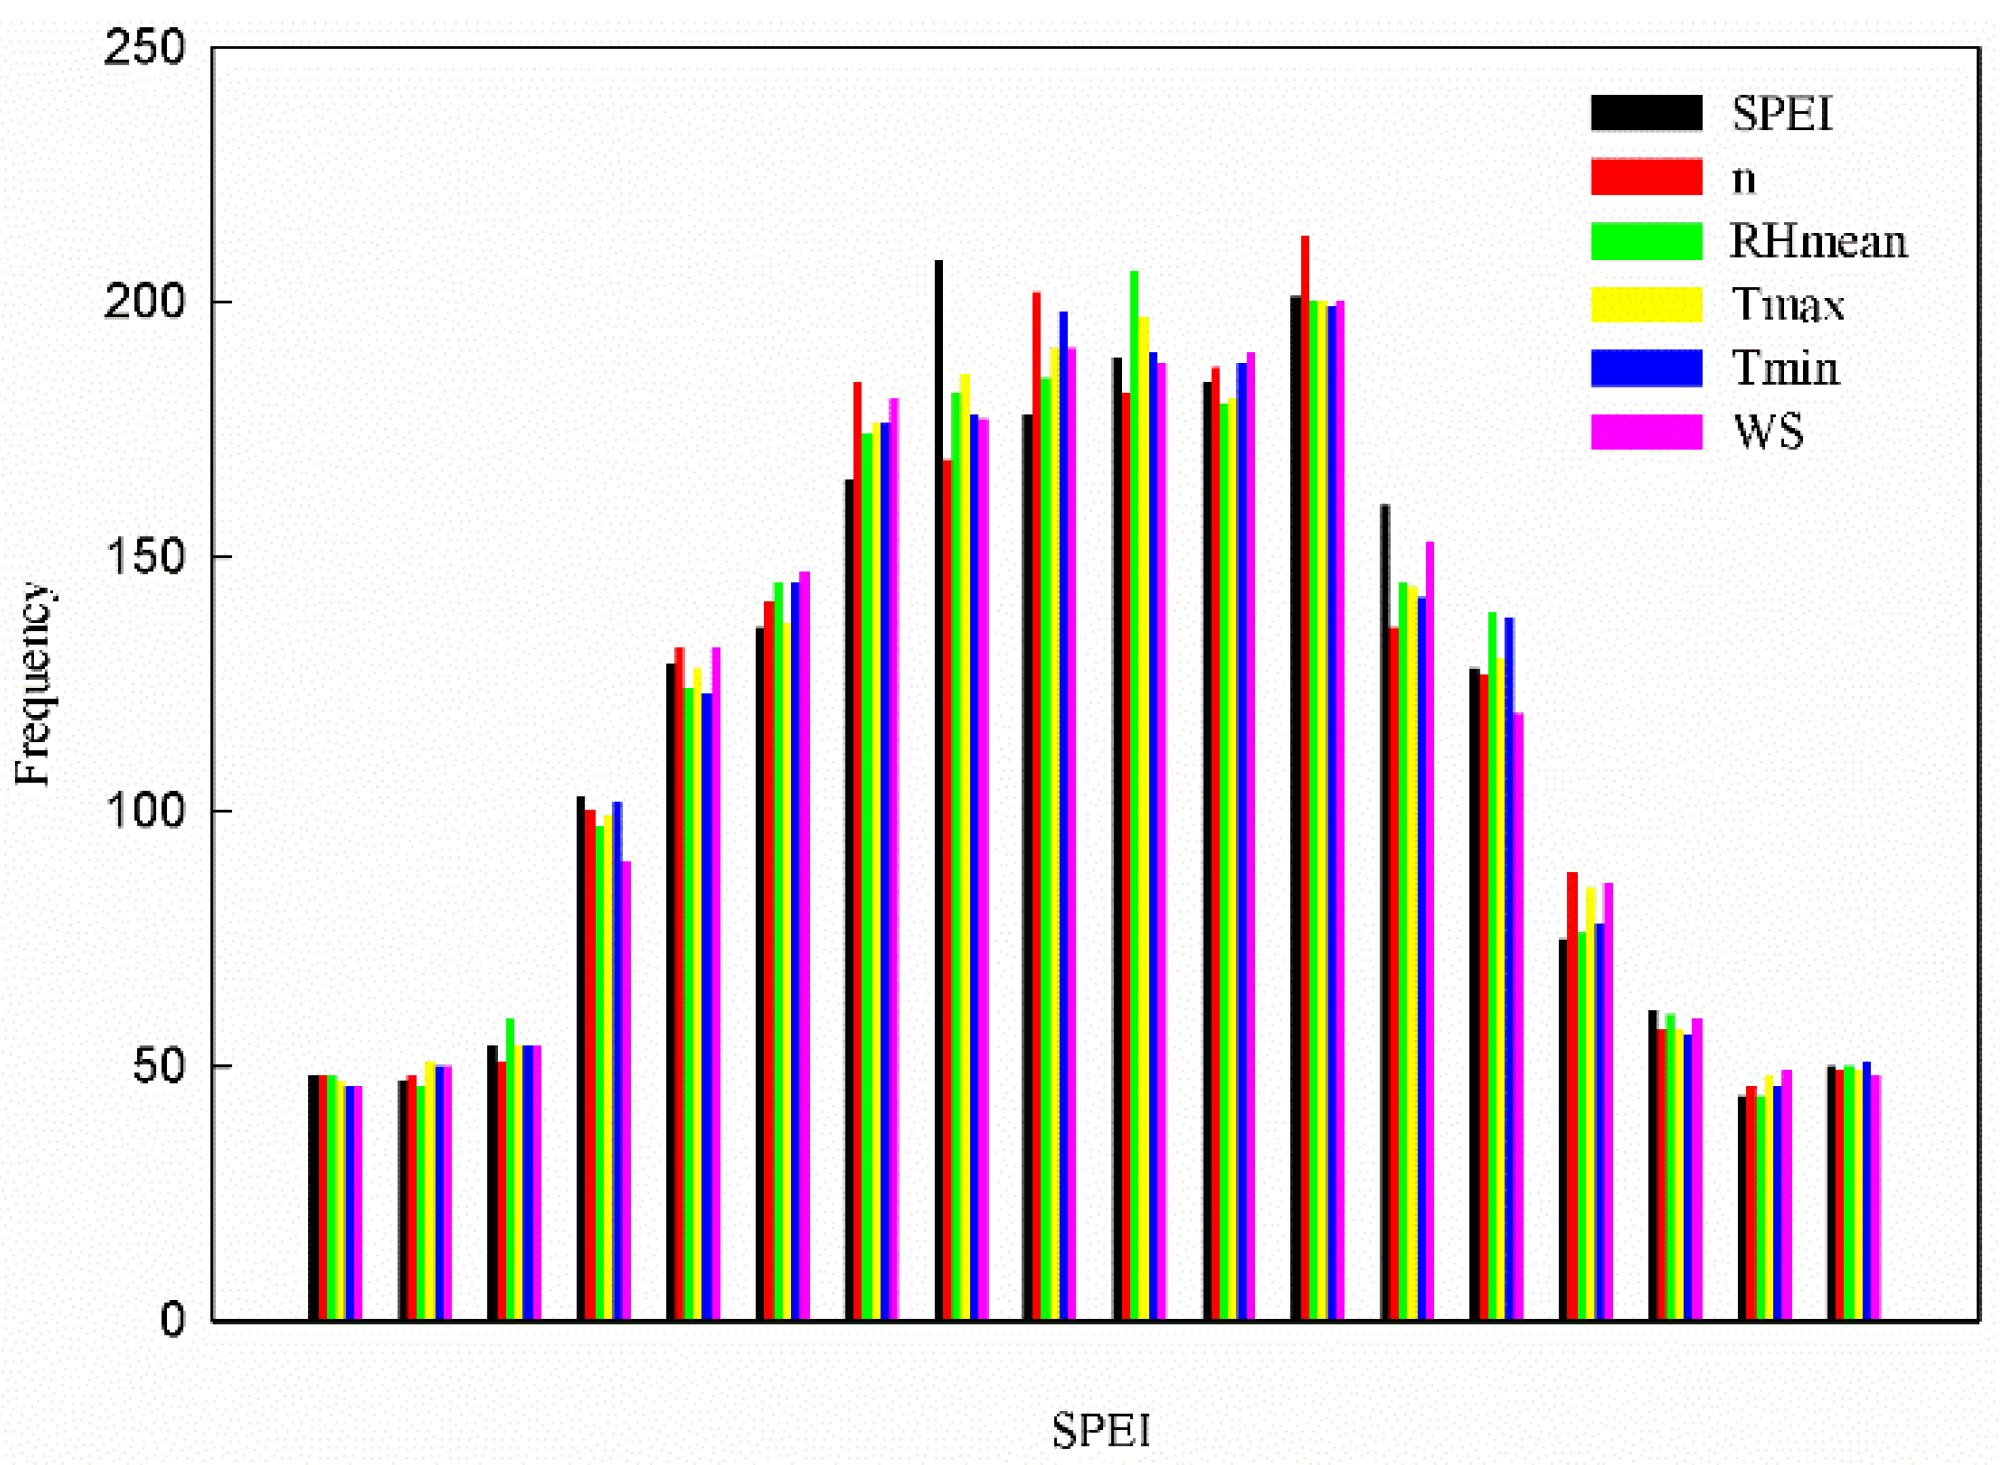
4.2. Non-Stationary Input Variables of the Drought Index

In recent years, we have been experiencing climate change [41]. Zhu et al. [42] reported that the study region experienced increases in temperature, precipitation, and the frequency and intensity of extreme weather events. Nonetheless, Milly et al. [43] argued that assuming stationarity in indices like the SPEI might not be appropriate, especially when considering other influential factors like climate change. Therefore, there is a growing interest in non-stationary versions of the traditional drought index [41]. The key difference between the calculation of stationary and non-stationary indices lies in selecting and estimating probability distribution covariates. This is primarily reflected in the methods used to compute the positional parameters of the chosen three-parameter probability distribution. The non-stationary version of different indices is obtained by incorporating additional covariates and employing regression analysis to estimate the corresponding positional parameters. The mainstream calculation method uses time or circulation index as covariates [44,45]. There are also alternative options for covariates, with human activity being one possible choice [46]. In future research, we can choose other covariates, such as soil and socio-economic factors. We can also develop a probability density function specially for calculating the non-stationary index.

4.3. Atmospheric Circulation on Drought

NAO contributed the most to precipitation, followed by NE (Figure 10a). NINO1+2 contributed the most to evapotranspiration, followed by AAO (Figure 10b). Although NINO1+2 contributed the most to evapotranspiration, the corresponding correlation coefficient was only 0.09. Comparatively, the correlation coefficient for NE was 0.06, slightly lower than 0.09. NE’s contributions to precipitation and evapotranspiration help to explain why NE contributed the most to the SPEI.
Drought events were found to occur during the periods when the SPEI exhibited a significant correlation with the circulation indices (Figure 2a and Figure 9). For instance, during the drought events observed in 1962 and 1965, AO and the SPEI exhibited 1–4-year cyclic variations from 1961 to 1969. The types of drought events differed when the same index exhibited changes in different cycles. For instance, moderate and mild drought events were observed during the 1–4-year cycle, whereas only mild drought events occurred in the 3–7-year cycle for AO and the SPEI. This could also suggest that short-term changes in AO are more likely to favor the occurrence of severe drought events.
Atmospheric circulation is one of the essential reasons for extreme events [47]. We found that NE had the most significant influence on the SPEI, and TSN had the most negligible influence on the SPEI. Ling et al. [48] found that the main climatic factors affecting the causes of drought in Huang-Huai-Hai Plain were NAO, ONI, and SOI, which is partly consistent with our results. The discrepancy may arise from using different methods to calculate the partial correlation coefficient to assess the contribution size of these factors. Additionally, our study employed eight indices to fit the SPEI and evaluate their respective contribution.
In contrast, the SPEI primarily emphasized meteorological factors. Li et al. [49] highlighted the intricate connection between drought, flood disasters, and sunspot activity, revealing a complex interplay. Employing a frequency analysis method, they examined the characteristics of drought and flood events during the minimum and maximum years. We found that TSN had the least effect on the SPEI. Perhaps we should further explore the use of the activity characteristics of sunspots to analyze the relationship between the maximum and minimum years of sunspots and the SPEI.
The emergence of drought stems from the combined effects of multiple influencing factors. However, this study solely examined individual influencing factors and did not encompass the intricate interplay of multiple factors. Univariate analyses ignore the effect of other variables and the dependencies between them. Farrokhi et al. [50] provided a novel methodology for modeling multivariate dependence structures of meteorological drought characteristics based on the combination of four-dimensional vine copulas and a data mining algorithm. Future research can consider combining multiple factors. In addition, the impact of human activities on the occurrence of drought can also be considered. In future investigations, it would be prudent to include factors linked to human activities for causal analysis, such as irrigation practices and reservoir scheduling, as these aspects can exert a certain degree of influence on drought occurrence. The importance of each factor in drought assessment can also be explored in other ways. Berdugo et al. [51] used a random forest algorithm to fit a model to measure the importance of different factors.

5. Conclusions

Utilizing meteorological data obtained from 36 meteorological stations, we employed the SPEI to delve into the dynamics of drought variations. Concurrently, we assessed the interaction between the SPEI and atmospheric circulation. Informed by our analysis of the SPEI, it became evident that while instances of drought have transpired within the study area, the frequency of these events remained relatively subdued. Compounding this observation, an observable trajectory indicated a deteriorating regional drought scenario. Furthermore, we identified a positive correlation between the duration of a drought event and its ensuing severity (R = 0.83, p < 0.001). This signifies that prolonged drought periods tend to culminate in more intense drought impacts. Intriguingly, we also observed that locations that experience a higher frequency of drought occurrences often exhibited more pronounced drought peaks (R = 0.38, p < 0.05). These revelations emphasize the significance of formulating and implementing policies addressing the escalating trajectory of intensified drought severity and frequency. These policy initiatives should prioritize adept water resource management and the formulation of strategies to ensure judicious land utilization, foster afforestation, and facilitate ecosystem restoration.
Notably, the Nino Eastern Pacific index (NE) emerged as a critical driver of SPEI dynamics (the contribution of NE to SPEI was 0.22). By integrating the analysis of atmospheric circulation indices and their relationship with the SPEI, decision-makers can develop pragmatic strategies to monitor and forecast drought conditions (time of occurrence, intensity, and duration). This knowledge enables timely interventions, including water resource management, agricultural planning, and mitigation measures, to minimize the potential impacts of evolving atmospheric circulation patterns on drought dynamics.
Considering the impact of climate change, the trend of some meteorological factors has changed, so using a stable drought index to assess drought is no longer suitable. This study mainly focused on the effects of atmospheric circulation on drought, ignoring the influence of other factors. In addition, drought is formed under the joint action of many factors, but this study only considered the influence of a single factor on the occurrence of drought. Therefore, the non-stationary version of the drought index should be chosen to evaluate drought in future studies. Multiple factors can be combined to consider the influence of their joint action on the occurrence of drought.

Author Contributions

Conceptualization, N.Y.; Data curation, Y.D. and J.D.; Formal analysis, M.X.; Funding acquisition, N.Y.; Investigation, Y.W.; Methodology, N.Y. and M.X.; Project administration, N.Y.; Resources, N.Y.; Software, Y.W.; Supervision, N.Y.; Validation, B.H.; Visualization, Y.D. and J.D.; Writing—original draft; Y.D. and J.D.; Writing—review and editing, T.J. and O.O.A. All authors have read and agreed to the published version of the manuscript.

Funding

This research was financially supported by the Natural Science Foundations of China (52209070, U2243235) and the Foreign Young Talent Plan (No. QN2022172005L).

Data Availability Statement

The data will be provided if requested.

Conflicts of Interest

The authors declare no conflicts of interest.

References

  1. Yao, N.; Li, Y.; Lei, T.; Peng, L. Drought evolution, severity and trends in mainland China over 1961–2013. Sci. Total Environ. 2018, 616, 73–89. [Google Scholar] [CrossRef] [PubMed]
  2. Qiu, J.; Shen, Z.; Xie, H. Drought impacts on hydrology and water quality under climate change. Sci. Total Environ. 2023, 858, 159854. [Google Scholar] [CrossRef] [PubMed]
  3. Band, S.S.; Karami, H.; Jeong, Y.-W.; Moslemzadeh, M.; Farzin, S.; Chau, K.-W.; Bateni, S.M.; Mosavi, A. Evaluation of Time Series Models in Simulating Different Monthly Scales of Drought Index for Improving Their Forecast Accuracy. Front. Earth Sci. 2022, 10, 839527. [Google Scholar] [CrossRef]
  4. Bruins, H.J.; Berliner, P.R. Bioclimatic aridity, climatic variability, drought and desertification: Definitions and management options. In The Arid Frontier; Springer: Dordrecht, The Netherlands, 1998; pp. 97–116. [Google Scholar]
  5. Pausas, J.G. Changes in fire and climate in the eastern Iberian Peninsula (Mediterranean basin). Clim. Chang. 2004, 63, 337–350. [Google Scholar] [CrossRef]
  6. Farzin, S.; Anaraki, M.V.; Naeimi, M.; Zandifar, S. Prediction of groundwater table and drought analysis; a new hybridization strategy based on bi-directional long short-term model and the Harris hawk optimization algorithm. J. Water Clim. Chang. 2022, 13, 2233–2254. [Google Scholar] [CrossRef]
  7. Chen, J.; Wilson, C.; Tapley, B.; Yang, Z.; Niu, G.-Y. 2005 drought event in the Amazon River basin as measured by GRACE and estimated by climate models. J. Geophys. Res. Solid Earth 2009, 114, B05404. [Google Scholar] [CrossRef]
  8. Robeson, S.M. Revisiting the recent California drought as an extreme value. Geophys. Res. Lett. 2015, 42, 6771–6779. [Google Scholar] [CrossRef]
  9. Carse, A. An Infrastructural Event: Making Sense of Panama’s Drought. Water Altern. 2017, 10, 888–909. [Google Scholar]
  10. Bang, N.-K.; Nam, W.-H.; Hong, E.-M.; Michael, J.H.; Mark, D.S. Assessment of the meteorological characteristics and statistical drought frequency for the extreme 2017 spring drought event across South Korea. J. Korean Soc. Agric. Eng. 2018, 60, 37–48. [Google Scholar]
  11. Piao, S.; Ciais, P.; Huang, Y.; Shen, Z.; Peng, S.; Li, J.; Zhou, L.; Liu, H.; Ma, Y.; Ding, Y.; et al. The impacts of climate change on water resources and agriculture in China. Nature 2010, 467, 43–51. [Google Scholar] [CrossRef]
  12. Zhao, R.; Wang, H.; Hu, S.; Zhan, C.; Guo, J. Joint probability of drought encounter among three major grain production zones of China under nonstationary climate. J. Hydrol. 2021, 603, 126995. [Google Scholar] [CrossRef]
  13. Li, X.; Ye, X. Spatiotemporal characteristics of dry-wet abrupt transition based on precipitation in Poyang Lake basin, China. Water 2015, 7, 1943–1958. [Google Scholar] [CrossRef]
  14. Tao, J.; Qiao, W.; Li, H.; Qu, X.; Gan, R. Spatial and temporal evolution characteristics and causes of drought and flood in the Henan section of the Yellow River. Nat. Hazards 2022, 113, 997–1016. [Google Scholar] [CrossRef]
  15. Li, X.; Zhang, K.; Gu, P.; Feng, H.; Yin, Y.; Chen, W.; Cheng, B. Changes in precipitation extremes in the Yangtze River Basin during 1960–2019 and the association with global warming, ENSO, and local effects. Sci. Total Environ. 2021, 760, 144244. [Google Scholar] [CrossRef] [PubMed]
  16. Palmer, W.C. Meteorological Drought; US Department of Commerce, Weather Bureau: Washington, DC, USA, 1965; Volume 30.
  17. McKee, T.B.; Doesken, N.J.; Kleist, J. The relationship of drought frequency and duration to time scales. In Proceedings of the 8th Conference on Applied Climatology, Anaheim, CA, USA, 17–22 January 1993; pp. 179–183. [Google Scholar]
  18. Tsakiris, G.; Pangalou, D.; Vangelis, H. Regional drought assessment based on the Reconnaissance Drought Index (RDI). Water Resour. Manag. 2007, 21, 821–833. [Google Scholar] [CrossRef]
  19. Vicente-Serrano, S.M.; Beguería, S.; López-Moreno, J.I. A multiscalar drought index sensitive to global warming: The standardized precipitation evapotranspiration index. J. Clim. 2010, 23, 1696–1718. [Google Scholar] [CrossRef]
  20. Ali, Z.; Hussain, I.; Faisal, M.; Nazir, H.M.; Moemen, M.A.-e.; Hussain, T.; Shamsuddin, S. A novel multi-scalar drought index for monitoring drought: The standardized precipitation temperature index. Water Resour. Manag. 2017, 31, 4957–4969. [Google Scholar] [CrossRef]
  21. Shah, D.; Mishra, V. Integrated Drought Index (IDI) for drought monitoring and assessment in India. Water Resour. Res. 2020, 56, e2019WR026284. [Google Scholar] [CrossRef]
  22. He, L.; Tong, L.; Zhou, Z.; Gao, T.; Ding, Y.; Ding, Y.; Zhao, Y.; Fan, W. A Drought Index: The Standardized Precipitation Evapotranspiration Irrigation Index. Water 2022, 14, 2133. [Google Scholar] [CrossRef]
  23. Zhang, B.; Long, B.; Wu, Z.; Wang, Z. An evaluation of the performance and the contribution of different modified water demand estimates in drought modeling over water-stressed regions. Land Degrad. Dev. 2017, 28, 1134–1151. [Google Scholar] [CrossRef]
  24. López-Moreno, J.I.; Vicente-Serrano, S.M.; Zabalza, J.; Beguería, S.; Lorenzo-Lacruz, J.; Azorin-Molina, C.; Morán-Tejeda, E. Hydrological response to climate variability at different time scales: A study in the Ebro basin. J. Hydrol. 2013, 477, 175–188. [Google Scholar] [CrossRef]
  25. Yang, Y.; Wang, Y.; Kang, L. Analysis of Drought Types and Circulation Characteristics in the Mid Summer of the Yellow River. Yellow River 2004, 26, 37–39. (In Chinese) [Google Scholar]
  26. Wang, J.; Liu, H.; Kang, l.; Wang, Y. Analysis on the Changes of Drought in the Middle Reaches of Yellow River. J. Arid. Land Resour. Environ. 2006, 20, 109–113. (In Chinese) [Google Scholar]
  27. Liu, Y.; Wang, G.; Gu, Y.; Zhang, J.; Liu, J.; Jin, J.; Liu, J. Drought trend estimation based on improved standard precipitation index for the middle reaches of Yellow River. J. Arid Land Resour. Environ. 2013, 27, 75–80. (In Chinese) [Google Scholar]
  28. Zhang, B.; Wu, P.; Zhao, X.; Wang, Y.; Wang, J.; Shi, Y. Drought variation trends in different subregions of the Chinese Loess Plateau over the past four decades. Agric. Water Manag. 2012, 115, 167–177. [Google Scholar] [CrossRef]
  29. Huang, S.; Chang, J.; Leng, G.; Huang, Q. Integrated index for drought assessment based on variable fuzzy set theory: A case study in the Yellow River basin, China. J. Hydrol. 2015, 527, 608–618. [Google Scholar] [CrossRef]
  30. Chen, Y.; Zhou, R.; Wu, H. Features of the Western Pacific Subtropical High during the Warm and Cool Periods of Nino 1+ 2 Area and Its influence on the East Asian Monsoon. Chin. J. Atmos. Sci. Chin. Ed. 2002, 26, 386–392. [Google Scholar]
  31. Lee, H.; Zhang, D. Relationship between NAO and drought disasters in northwestern China in the last millennium. J. Arid Environ. 2011, 75, 1114–1120. [Google Scholar] [CrossRef]
  32. Yuan, Z.; Qin, J.; Li, S.; Huang, S.; Mbululo, Y. Impact of spring AAO on summertime precipitation in the North China Part: Observational analysis. Asia-Pac. J. Atmos. Sci. 2021, 57, 1–16. [Google Scholar] [CrossRef]
  33. Deng, S.; Cheng, L.; Yang, K.; Chen, Y.; Gao, Y.; Yang, N.; Li, M. A multi-scalar evaluation of differential impacts of canonical ENSO and ENSO Modoki on drought in China. Int. J. Climatol. 2019, 39, 1985–2004. [Google Scholar] [CrossRef]
  34. Guan, M. Causes Analysis of Serious Drought Event in 2004. J. Meteorol. Res. Appl. 2007, 28, 60–63. (In Chinese) [Google Scholar]
  35. Helsel, D.R.; Hirsch, R.M. Statistical Methods in Water Resources; Elsevier: Amsterdam, The Netherlands, 1992; Volume 49. [Google Scholar]
  36. Allen, R.G.; Pereira, L.S.; Raes, D.; Smith, M. Crop Evapotranspiration-Guidelines for Computing Crop Water Requirements; FAO Irrigation and Drainage Paper 56; FAO: Rome, Italy, 1998; Volume 300, p. D05109. [Google Scholar]
  37. Yevjevich, V.M. Objective Approach to Definitions and Investigations of Continental Hydrologic Droughts; Colorado State University Libraries: Fort Collins, CO, USA, 1967. [Google Scholar]
  38. Montaseri, M.; Amirataee, B. Comprehensive stochastic assessment of meteorological drought indices. Int. J. Climatol. 2017, 37, 998–1013. [Google Scholar] [CrossRef]
  39. Pettitt, A.N. A non-parametric approach to the change-point problem. J. R. Stat. Soc. Ser. C Appl. Stat. 1979, 28, 126–135. [Google Scholar] [CrossRef]
  40. Liang, X.; Lettenmaier, D.P.; Wood, E.F.; Burges, S.J. A Simple Hydrologically Based Model of Land-Surface Water And Energy Fluxes For General-Circulation Models. J. Geophys. Res.-Atmos. 1994, 99, 14415–14428. [Google Scholar] [CrossRef]
  41. Masanta, S.K.; Srinivas, V. Proposal and evaluation of nonstationary versions of SPEI and SDDI based on climate covariates for regional drought analysis. J. Hydrol. 2022, 610, 127808. [Google Scholar] [CrossRef]
  42. Zhu, Z.; Lu, L.; Yao, X.; Zhang, W.; Liu, W. AR6 Climate Change 2021: The Physical Science Basis; IPCC: Geneva, Switzerland, 2021. [Google Scholar]
  43. Milly, P.C.; Betancourt, J.; Falkenmark, M.; Hirsch, R.M.; Kundzewicz, Z.W.; Lettenmaier, D.P.; Stouffer, R.J. Stationarity is dead: Whither water management? Science 2008, 319, 573–574. [Google Scholar] [CrossRef] [PubMed]
  44. Das, S.; Das, J.; Umamahesh, N. Nonstationary modeling of meteorological droughts: Application to a region in India. J. Hydrol. Eng. 2021, 26, 05020048. [Google Scholar] [CrossRef]
  45. Wang, Y.; Li, J.; Feng, P.; Hu, R. A time-dependent drought index for non-stationary precipitation series. Water Resour. Manag. 2015, 29, 5631–5647. [Google Scholar] [CrossRef]
  46. Shao, S.; Zhang, H.; Singh, V.P.; Ding, H.; Zhang, J.; Wu, Y. Nonstationary analysis of hydrological drought index in a coupled human-water system: Application of the GAMLSS with meteorological and anthropogenic covariates in the Wuding River basin, China. J. Hydrol. 2022, 608, 127692. [Google Scholar] [CrossRef]
  47. Shepherd, T.G. Atmospheric circulation as a source of uncertainty in climate change projections. Nat. Geosci. 2014, 7, 703–708. [Google Scholar] [CrossRef]
  48. Ling, M.; Han, H.; Hu, X.; Xia, Q.; Guo, X. Drought characteristics and causes during summer maize growth period on Huang-Huai-Hai Plain based on daily scale SPEI. Agric. Water Manag. 2023, 280, 108198. [Google Scholar] [CrossRef]
  49. Li, G.; Zhang, J.; Ding, S.; Wu, P.; Wang, W. Reconstruction of sunspot activity, cold and warm events, and drought and flood events in the central plain of China during the northern Song Dynasty using historical documents. Quat. Int. 2019, 525, 36–44. [Google Scholar] [CrossRef]
  50. Farrokhi, A.; Farzin, S.; Mousavi, S.-F. Meteorological drought analysis in response to climate change conditions, based on combined four-dimensional vine copulas and data mining (VC-DM). J. Hydrol. 2021, 603, 127135. [Google Scholar] [CrossRef]
  51. Berdugo, M.; Gaitán, J.J.; Delgado-Baquerizo, M.; Crowther, T.W.; Dakos, V. Prevalence and drivers of abrupt vegetation shifts in global drylands. Proc. Natl. Acad. Sci. USA 2022, 119, e2123393119. [Google Scholar] [CrossRef]
Figure 1. The spatial distribution of meteorological stations within the middle reaches of the Yellow River Basin.
Water 16 01786 g001
Figure 2. SPEI interannual changes and trends.
Water 16 01786 g002
Figure 3. Spatial distribution of drought characteristics.
Water 16 01786 g003
Figure 4. Correlations between the drought characteristics. The results highlight the relationships that were statistically significant at the levels of p < 0.001 (***), p < 0.05 (*), p < 0.1 (.), p < 1 (). Red lines are the best nonlinear fitted lines.
Water 16 01786 g004
Figure 5. Spatial distribution of correlation coefficients between SPEI and atmospheric circulation indices (NAO, NE, AO, AAO, NINO1+2, NE, TSN, SOI) on a one-month timescale.
Water 16 01786 g005
Figure 6. Spatial distribution of SPEI and detrended SPEI slope.
Water 16 01786 g006
Figure 7. Frequency distribution of SPEI and detrended SPEI, while the rest represents SPEI with only one meteorological factor retained, such as n representing SPEI with only sunshine hours retained.
Water 16 01786 g007
Figure 8. Contributions of different circulation indices to SPEI.
Water 16 01786 g008
Figure 9. Cross wavelet correlates of circulation index and SPEI. Thick contours signify a 95% confidence level in the visual representation, while arrows depict the relative phase relationship. The color bar on the diagram’s right side illustrates the distribution of the wavelet energy. The symbol “←” indicates that the circulation index and SPEI have a negative correlation, “→” indicates a positive correlation, “↓” indicates that it is ahead of the SPEI by 1/4 cycles, and “↑” indicates that it is 1/4 cycle behind the SPEI. The figure color represents the correlation coefficient between the two; the reddish color indicates that the correlation between the two is high, and blue indicates a low correlation.
Water 16 01786 g009
Figure 10. The contribution of atmospheric circulation to precipitation and evapotranspiration. We utilized eight circulation indices to fit the precipitation and evapotranspiration data. The correlation coefficients between these variables and the circulation indices represent their respective contributions.
Water 16 01786 g010
Table 1. Classification of SPEI.
Drought GradeRange
Extreme droughtSPEI ≤ −2.0
Moderate drought−2 < SPEI ≤ −1
Mild drought−1 < SPEI ≤ −0.5
No droughtSPEI > −0.5
Table 2. Significant correlation and periodicity between SPEI and atmospheric circulation.
Atmospheric Circulation PeriodIntervalRelationship
AO1~41961~1969Positive
3~71983~1991Positive
AAO3~41963~1969Positive
3~51984~1991Positive
1~31995~2003Positive
NAO2~31961~1968Positive
1~21995~1998Negative
NINO 1+21~41963~1971Negative
3~61981~1991Negative
1~21996~1999
4~51998~2002Negative
EM2~31963~1968
4~61982~1991
1~21996~1999Negative
10~131996~2007Positive
NE1~41962~1971Negative
3~61981~1990Negative
TSN7~141968~2011
SOI2~41962~1970Positive
3~51981~1990Positive
Disclaimer/Publisher’s Note: The statements, opinions and data contained in all publications are solely those of the individual author(s) and contributor(s) and not of MDPI and/or the editor(s). MDPI and/or the editor(s) disclaim responsibility for any injury to people or property resulting from any ideas, methods, instructions or products referred to in the content.

