Article

Attribution Analysis of Climate Change and Human Activities on Runoff and Vegetation Changes in the Min River Basin

1
The National Key Laboratory of Water Disaster Prevention, Nanjing Hydraulic Research Institute, No. 223, Guangzhou Road, Nanjing 210029, China
2
State Key Laboratory of Hydraulics and Mountain River Engineering, College of Water Resource & Hydropower, Sichuan University, No. 24 South Section 1, Yihuan Road, Chengdu 610065, China
*
Authors to whom correspondence should be addressed.
Water 2024, 16(13), 1804; https://doi.org/10.3390/w16131804
Submission received: 20 May 2024 / Revised: 21 June 2024 / Accepted: 21 June 2024 / Published: 26 June 2024

Abstract

:
Hydrological processes and the sustainable use of water resources in a river basin are altered by climate change and changes in human variables. This study examined the significant effects of vegetation and hydrological, climatic, and human activity changes on the basin’s biological environment and usage of water resources. The Min River Basin (MRB) in the upper Yangtze River served as the study location. Mann–Kendall and Pettitt mutation test techniques were used to examine the features of runoff changes in the basin. The effects of meteorological and anthropogenic factors on runoff and vegetation changes in the MRB from 1982 to 2020 were quantitatively evaluated using the expanded Budyko equation. Following this, spatial and temporal variations in land use and the NDVI in the basin were studied. The results of the research demonstrated the following: (1) The MRB yearly runoff trended downward and that an abrupt change in runoff happened in 1994. (2) Precipitation (Pr) showed a decreasing tendency from the base period (S1) to the change period (S2), but potential evapotranspiration (ET0) showed an increasing trend. (3) From 1985 to 2020, the land use area of the MRB changed rapidly, and the construction land and water area increased by 322% and 58.85%, respectively, while the cultivated land area decreased by 11.72%. (4) From S1 to S2, there was a rising trend in both the NDVI and the Budyko parameter n. The contributions of Pr, ET0, NDVI, and n to the runoff change were 32.41%, 9.43%, 27.51%, and 30.65%, respectively.

1. Introduction

By changing the pattern of solar radiation distribution on Earth, climate change is having a major effect on the global hydrological cycle. This has an effect on the spatial and temporal distribution of natural evaporation, water vapor transport, and precipitation, all of which are influenced by the hydrological cycle [1,2,3]. River runoff, as a critical link in the terrestrial water cycle process, is one of the important components of surface water resources. Surface water is not only the element in the terrestrial water cycle that has the closest relationship with human beings, but it is also the main focus of water resource management and water security [4,5,6,7]. In recent decades, anthropogenic factors have disturbed the original pattern of runoff, leading to significant changes, thus affecting regional water resources and threatening regional water security [8,9,10]. Three primary methods exist by which human activities impact the components of the water cycle: (1) modifications to land use and water resource utilization, for example, impact the circumstances of production and sinking in the watershed; (2) inter-basin water resource allocation and groundwater extraction and other engineering measures cause direct changes to the amount of water in the watershed; (3) reservoirs and other water storage projects affect the process of sinking in the river channel [11,12]. In order to preserve water security in the basin, it is crucial to examine how the features of runoff in the basin are changing in response to changing environmental conditions and to quantitatively evaluate the effects of climate change and human activity on runoff.
Attribution analysis of variations in watershed runoff is currently a popular topic of study worldwide. This trend in research seeks to establish a scientific foundation for the management of water resources and climate change adaptation by comprehending the ways in which various elements influence the hydrological cycle in watersheds [13,14,15]. The main analytical methods include the hydrological modeling method [16], the multivariate statistical analysis method [17,18], and the empirical modeling method [19]. Hydrological models have certain physical mechanisms that are suitable for the hydrological simulation of watersheds of different scales and complexity [20,21,22]. The model requires high data accuracy and continuity, although there are large uncertainties in the model parameters and structure [23]. The multivariate statistical analysis method is simple but requires a large number of observations as samples to support the statistical analysis [24,25]. In contrast with the other two approaches, the empirical modeling method based on Budyko assumptions is more extensively used to determine the attribution of runoff variations in various watersheds because it has fewer factors, a simpler structure, is easier to read, and is more accurate [26,27].
Previous studies on the Min River Basin (MRB) focused on the interrelationships between runoff and vegetation, as well as the analysis of the causes of change [28,29]. Guo et al. [30] evaluated the changes in runoff conditions of the MRB under changing environments using various hydrological indicators. They found that climate and anthropogenic factors contributed 30.20% and 69.80%, respectively, to the changes in runoff from the MRB. With runoff-sediment modeling, Wang et al. [31] discovered that between 1970 and 2019, the yearly runoff from the MRB exhibited a non-significant declining trend. Climate and anthropogenic activities were identified as important drivers of runoff changes, with anthropogenic factors contributing 78.92–66.71% of the runoff changes, while climate contributed 21.08–33.29%. Runoff variations in the MRB over the past 60 years were examined by Zhai et al. [32]. According to the data, MRB water supplies have been steadily declining over the past 60 years. Before 1990, runoff was mainly influenced by climatic conditions such as precipitation. Furthermore, runoff was significantly impacted by both human activity and climate change between 1990 and 2000. Human involvement has grown in importance since 2000 in terms of affecting runoff changes. According to the analysis, human activities, vegetation changes, and climatic factors contributed 76.24%, 13.62%, and 10.14%, respectively, to changes in the runoff in the MRB. Human activities have become the dominant factor, with runoff being influenced by hydropower and water resource development and utilization projects such as water withdrawal and land use [33].
Since 2000, the Chinese government has taken on a number of initiatives, including restoring fallow land to forests or grasslands, to protect the ecosystem and to improve the functioning of the ecosystem [34]. Representing a significant ecological barrier in the upper reaches of the Yangtze River, the MRB has carried out a number of water and soil conservation initiatives that, by lowering runoff volumes, postponing runoff formation times, enhancing water quality, and increasing the groundwater recharge, have helped to rationally utilize water resources and enhance the basin’s ecological environment. Liu et al. [35] discovered that the regional hydrological status was impacted by vegetation changes in the MRB. Due to drastic changes in the regional environment, the precipitation–runoff relationship has been significantly affected, resulting in a gradual reduction in water resources in the watershed and increasing vegetation degradation in the upper reaches of the watershed, which are serious threats to the long-term development of the watershed. However, most studies have focused primarily on the single effects of environmental changes in the MRB on runoff and vegetation, and dual quantitative analysis studies addressing changes in runoff and vegetation coverage, and the interactions between the two, have seldom been addressed. While some research has indicated that human and climatic factors may have detrimental effects on runoff and vegetation changes, other research has found that these factors have no effect on these variables and may even have beneficial effects under some circumstances [36,37]. Therefore, it is crucial to research the interactions between climate, human activity, vegetation growth, and hydrological processes in the MRB in the sustainable development of the watershed in order to comprehend the effects of environmental changes on vegetation and runoff as well as the mechanisms by which vegetation growth responds to runoff. This study aims to determine the years of abrupt runoff changes at the basin’s outlet hydrological stations and to analyze the temporal variability characteristics of the hydrometeorology of the basin from 1982 to 2020 in order to quantitatively assess the effects of meteorological and anthropogenic factors on runoff and vegetation in the MRB. The watershed’s land use, NDVI, and meteorology’s geographical and temporal variability characteristics during the baseline and change periods are analyzed. Runoff variability is analyzed using modified Budyko elasticity coefficient modeling to evaluate the effects of both human and climatic change. This work offers a scientific foundation for ecological management and water resource planning in the basin and advances our understanding of the effects of climate change and human activity on hydrological processes and ecosystems.

2. Materials and Methods

2.1. Study Area

The MRB is one of the biggest first-class tributaries in the upper sections of the Yangtze River, with a watershed area of 135,900 km2 and a total length of around 711 km. Depending on its geographic location, the MRB can be divided into the upstream, midstream, and downstream reaches (Figure 1). The middle reaches extend from Dujiangyan to the mouth of the Dadu River confluence, measuring approximately 216 km in length and covering an area of approximately 11,300 km2. The lower reaches, on the other hand, stretch from the mouth of the Yangtze River confluence in Yibin to the mouth of the Dadu River confluence, measuring approximately 154 km in length and covering an area of approximately 112,000 km2. Within the MRB, both the air temperature and the amount of precipitation exhibit a progressive rise from upstream to downstream. Climate-wise, from Zhengjiang Pass, Heishui County to Mao County, average annual temperatures range from 11 to 13 °C, and the average annual precipitation is 420 to 800 mm. In contrast, in the alpine climate zone of northwest Sichuan, average annual temperatures range from 5 to 9 °C, and the average annual precipitation is 730 to 840 mm. The upstream area of the MRB has a higher elevation and relies on snowmelt to recharge, whereas the other areas rely mainly on precipitation. The runoff depth along the upper reaches of Songpan reaches 300–500 mm and increases to between 500–700 mm toward the Wenchuan section, while the lowest end is the rainy center, with an annual runoff depth of 1200 mm. The basin runoff exhibits an extremely uneven intra-annual distribution, with the flood season having the largest amount of water, accounting for 60–80% of the yearly water volume. Influenced by the irrigation of farmland and water supply for residents in the Chengdu Plain, the water volume in the middle reaches of the MRB is relatively small, while the lower reaches, due to the confluence of tributaries such as the Dadu River and the Qingyi River, have a larger volume of water, and the change in runoff is more pronounced.

2.2. Data

The daily runoff statistics at the MRB control station from 1982 to 2020 were chosen from the Chinese Hydrological Yearbook based on the distribution of rivers in the MRB. The National Meteorological Information Center (http://data.cma.cn (accessed on 20 August 2022)) provided daily meteorological data at all observation stations in the study region from 1982 to 2020. This dataset is where the MRB meteorological observation data were acquired from. The NDVI data used in this work, which span the years 1982 to 2020, were retrieved on 1 September 2023 from (https://www.ncei.noaa.gov/data/land-normalized-difference-vegetation-index/access/ (accessed on 20 June 2022)). The land use data were provided by the Resource and Environmental Sciences Data Center (https://www.resdc.cn/DOI/doi.aspx?DOIid=54 (accessed on 20 Ju1y 2022)) at a spatial resolution of 30 m.

2.3. Research Methods

2.3.1. Mann–Kendall Trend Analysis with Mutation Test

The primary benefit of the Mann–Kendall (MK) trend test, a nonparametric rank test, is that it is unaffected by a few outliers and missing data and does not require the original data to follow a normal distribution. As a result, hydrological statistics have made extensive use of it [38,39]. The technique may be used for several kinds of time series data and is comparatively easy to compute. We may more precisely evaluate mutational changes in the sequence when the MK test investigates sequence mutations by creating an ordered sequence [40,41].

2.3.2. Analysis of Pettitt Mutations

A nonparametric statistical test called the Pettitt mutation analysis technique may be used to identify time points that correlate to mutation points and to ascertain whether or not there are mutation points in a particular data series [42,43]. The Pettitt statistic U t , T is computed using the following formula:
U t , T = i = 1 t j = 1 T s g n y j y i
where the time corresponding to the maximum value of U t , T is the time at which the mutation may exist, denoted as τ . The Pettitt statistic U τ for the location of the mutation is calculated as follows:
U τ = m a x U t , T
The significance level at this point is calculated by the formula:
P τ = 2 e x p 6 K τ 2 T 2 + T 3
The null hypothesis (no significant difference between the two subseries) is rejected when the significance level P τ < 0.05 . The approximate significance probability of a change point is calculated as α = 1 P τ .

2.3.3. Linear Regression Analysis

The analysis of the geographic trend of vegetation coverage has made extensive use of the linear regression approach [44]. The slope of the NDVI of remotely sensed images over the last n years was fitted on an image-by-image basis using a one-dimensional linear regression formula.
S l o p e = n × i = 1 n i × N i i = 1 n i × i = 1 n N i n × i = 1 n i 2 i = 1 n i 2
where n is the length of the study period, and N i is the annual mean NDVI for year i .

2.3.4. Stability Analysis

The data stability and fluctuation status can be represented by the coefficient of variation [45].
C V = σ x
where C V is the coefficient of variation of vegetation NDVI, σ is the standard deviation, and x is the multi-year mean. The larger the C V value, the more discrete the data distribution and the greater the inter-annual variability. On the contrary, it means that the vegetation NDVI changes are more stable.

2.3.5. Extended Budyko Equation

The analysis of the drivers of runoff change using the Budyko elasticity coefficient method includes the following three assumptions: (1) Climatic and anthropogenic causes are independent of each other and have no influence each other; (2) Long-term water balancing processes often allow for the disregard of the impact of variations in water storage on runoff depth; (3) The only factor affecting the baseline cycle is climate change; human activities are also classified as influencing other causes of runoff variability throughout the change period [46].
The following formula was derived from a multi-year scale water balance:
R = P r E T
The Penman–Monteith equation is used to determine the potential evapotranspiration [27,47], where E T 0 represents the potential evapotranspiration, Δ represents the slope of the saturated vapor pressure curve, R n represents the net surface radiation, G represents the soil heat flux, γ represents the dryness and wetness constants, T m e a n represents the average daily air temperature, u 2 represents the wind speed at a height of 2 m, and e s and e a represent the saturated and actual vapor pressures.
E T 0 = 0.408 Δ R n G + γ 900 T m e a n + 273 u 2 e s e a Δ + γ 1 + 0.34 u 2
Runoff depth, precipitation, actual evapotranspiration, and potential evapotranspiration in the basin are indicated by the letters  R P r E T , and  E T 0 , respectively. Actual evapotranspiration is determined by applying the Choudhury–Yang equation [48,49].
E T = P r × E T 0 P r n + E T 0 n 1 / n
The underlying impacts of terrain, soil, and human activity are all integrated to form the Budyko parameter  n . The subsurface is impacted by human activity primarily through pollution, water resource development, and changes in land use, whereas topography and soils remain immutable in short time frames. Li et al. [50] showed that there is a strong correlation between the Budyko parameter  n  and the NDVI.
n = a N D V I + b
R = P r P r × E T 0 P r a N D V I + b + E T 0 a N D V I + b 1 / ( a N D V I + b )
The linear relationship between the parameter n and vegetation is characterized by the watershed constants a and b , which are determined.

2.3.6. Elasticity Coefficient Method

Utilizing the following formula, the elasticity coefficients of R were determined with regard to P r , E T 0 , n , and NDVI [51].
ε p = 1 + E T 0 P r n 1 / n + 1 E T 0 P r n + 1 1 + E T 0 P r n 1 + E T 0 P r n 1 / n + 1 E T 0 P r
ε E T 0 = 1 1 + E T 0 P r n 1 1 + E T 0 P r n 1 / n
ε n = l n 1 + E T 0 P r n + E T 0 P r n l n 1 + E T 0 P r n n 1 + E T 0 P r n 1 1 + E T 0 P r n 1 / n
ε N D V I = ε n a N D V I a N D V I + b
ε E T 0 , ε p r , ε N D V I , and ε n represent the elasticity coefficients of E T 0 , P r , NDVI, and  n . The variation values of  P r E T 0 n , and NDVI from S1 to S2 were calculated and denoted as Δ P r Δ E T 0 Δ n , and  Δ N D V I , respectively.
Δ R P r = ε p R P r × Δ P r
Δ R E T 0 = ε E T 0 R E T 0 × Δ E T 0
Δ R n = ε n R N D V I × Δ n
Δ R n = ε N D V I R N D V I × Δ N D V I
Δ R h u m = Δ R n Δ R N D V I
Δ R P r , Δ R E T 0 , Δ R n , and Δ R N D V I denote the values of runoff changes due to changes in P r , E T 0 , the Budyko parameter n , and NDVI from the base period to the change period.
Δ R = Δ R P r + Δ R E T 0 + Δ R N D V I + Δ R h u m
η R P r = Δ R P r / Δ R × 100 %
η R E T 0 = Δ R E T 0 / Δ R × 100 %
η R N D V I = Δ R N D V I / Δ R × 100 %
η R H = Δ R hum / Δ R × 100 %
η R P r , η R E T 0   η R N D V I , and η R H denote the contribution of P r , E T 0 , NDVI, and n to the change in runoff.

3. Results

3.1. Trend Analysis of Factors

Drawing on the outcomes of the MK trend analysis for every research element listed in Table 1, it was concluded that the MRB runoff and precipitation decreased at rates of −0.311 mm/a and 0.452 mm/a. With an annual rate of increase of 0.108 mm/a, potential evapotranspiration increased significantly and was statistically significant at the 0.01 level. With an annual rate of increase of 0.001, the NDVI grew significantly and was statistically significant at the 0.01 level.

3.2. Analysis of Sudden Changes in Runoff and Influencing Factors

Natural runoff and precipitation exhibited a gradually declining trend, according to the MRB hydrometeorological data from 1982 to 2020. Significant declines in runoff depth and precipitation were revealed by regression analysis, although potential evapotranspiration exhibited a rising trend (Figure 2). The precipitation–runoff relationship exhibits a remarkably consistent feature driven by climate warming.
From the results in Figure 3, the non-parametric MK test revealed that the measured runoff depth had a mutation point in around 1993 (Figure 3a). Using the Pettitt test, it was concluded that the mutation in the 1982–2020 runoff volume for the MRB occurred in 1994 (Figure 3b). The mutation test results from the MRB annual runoff volume showed that UT was basically located below the value of 0 after 2008, indicating a decrease in runoff from the watershed with a significant downward trend. As a result, the base period, S1 (1982–1994), and the transition period, S2 (1995–2020), were created from the runoff time period.
The precipitation–runoff cumulative curve was fitted linearly based on the findings of the mutation analysis, and the fitting outcomes are displayed in Figure 4a. The fitted slopes at the high field station were 0.58 and 0.57 during the S1 and S2 periods, indicating that the slope decreased by 0.01 during the S2 period. At the high field station, precipitation and runoff had slopes of 0.55 and 0.42 during the S1 period and 0.53 and 0.39 during the S2 period, respectively. This suggests that during the S2 period, both precipitation and runoff had a declining tendency (Figure 4b).
Specific geographical distribution features were observed in the MRB area during S1 and S2 with respect to temperature, precipitation, and potential evapotranspiration. The trend in precipitation rose from the northwest to the southeast (Figure 5a), a phenomenon primarily determined by the interaction of terrain and climate. Because of tropical cyclones and monsoons, precipitation is often higher in the summer and lower in the winter. On the other hand, precipitation trends over the era of transition (Figure 5b) fell in certain areas of the basin’s lower portion and increased in the higher plateau mountains. Temperature, humidity, precipitation, and other climatic factors all have a direct impact on the potential evapotranspiration. Because they have steeper slopes and less vegetation, the center and southwest regions of the watershed in the MRB area have higher potential evapotranspiration (Figure 5c). These features encourage the evapotranspiration of water. In most areas of the basin, the spatial release of potential evapotranspiration during the change period had an increasing trend in comparison with the base period (Figure 5d), which was associated with the rise in basin temperature.

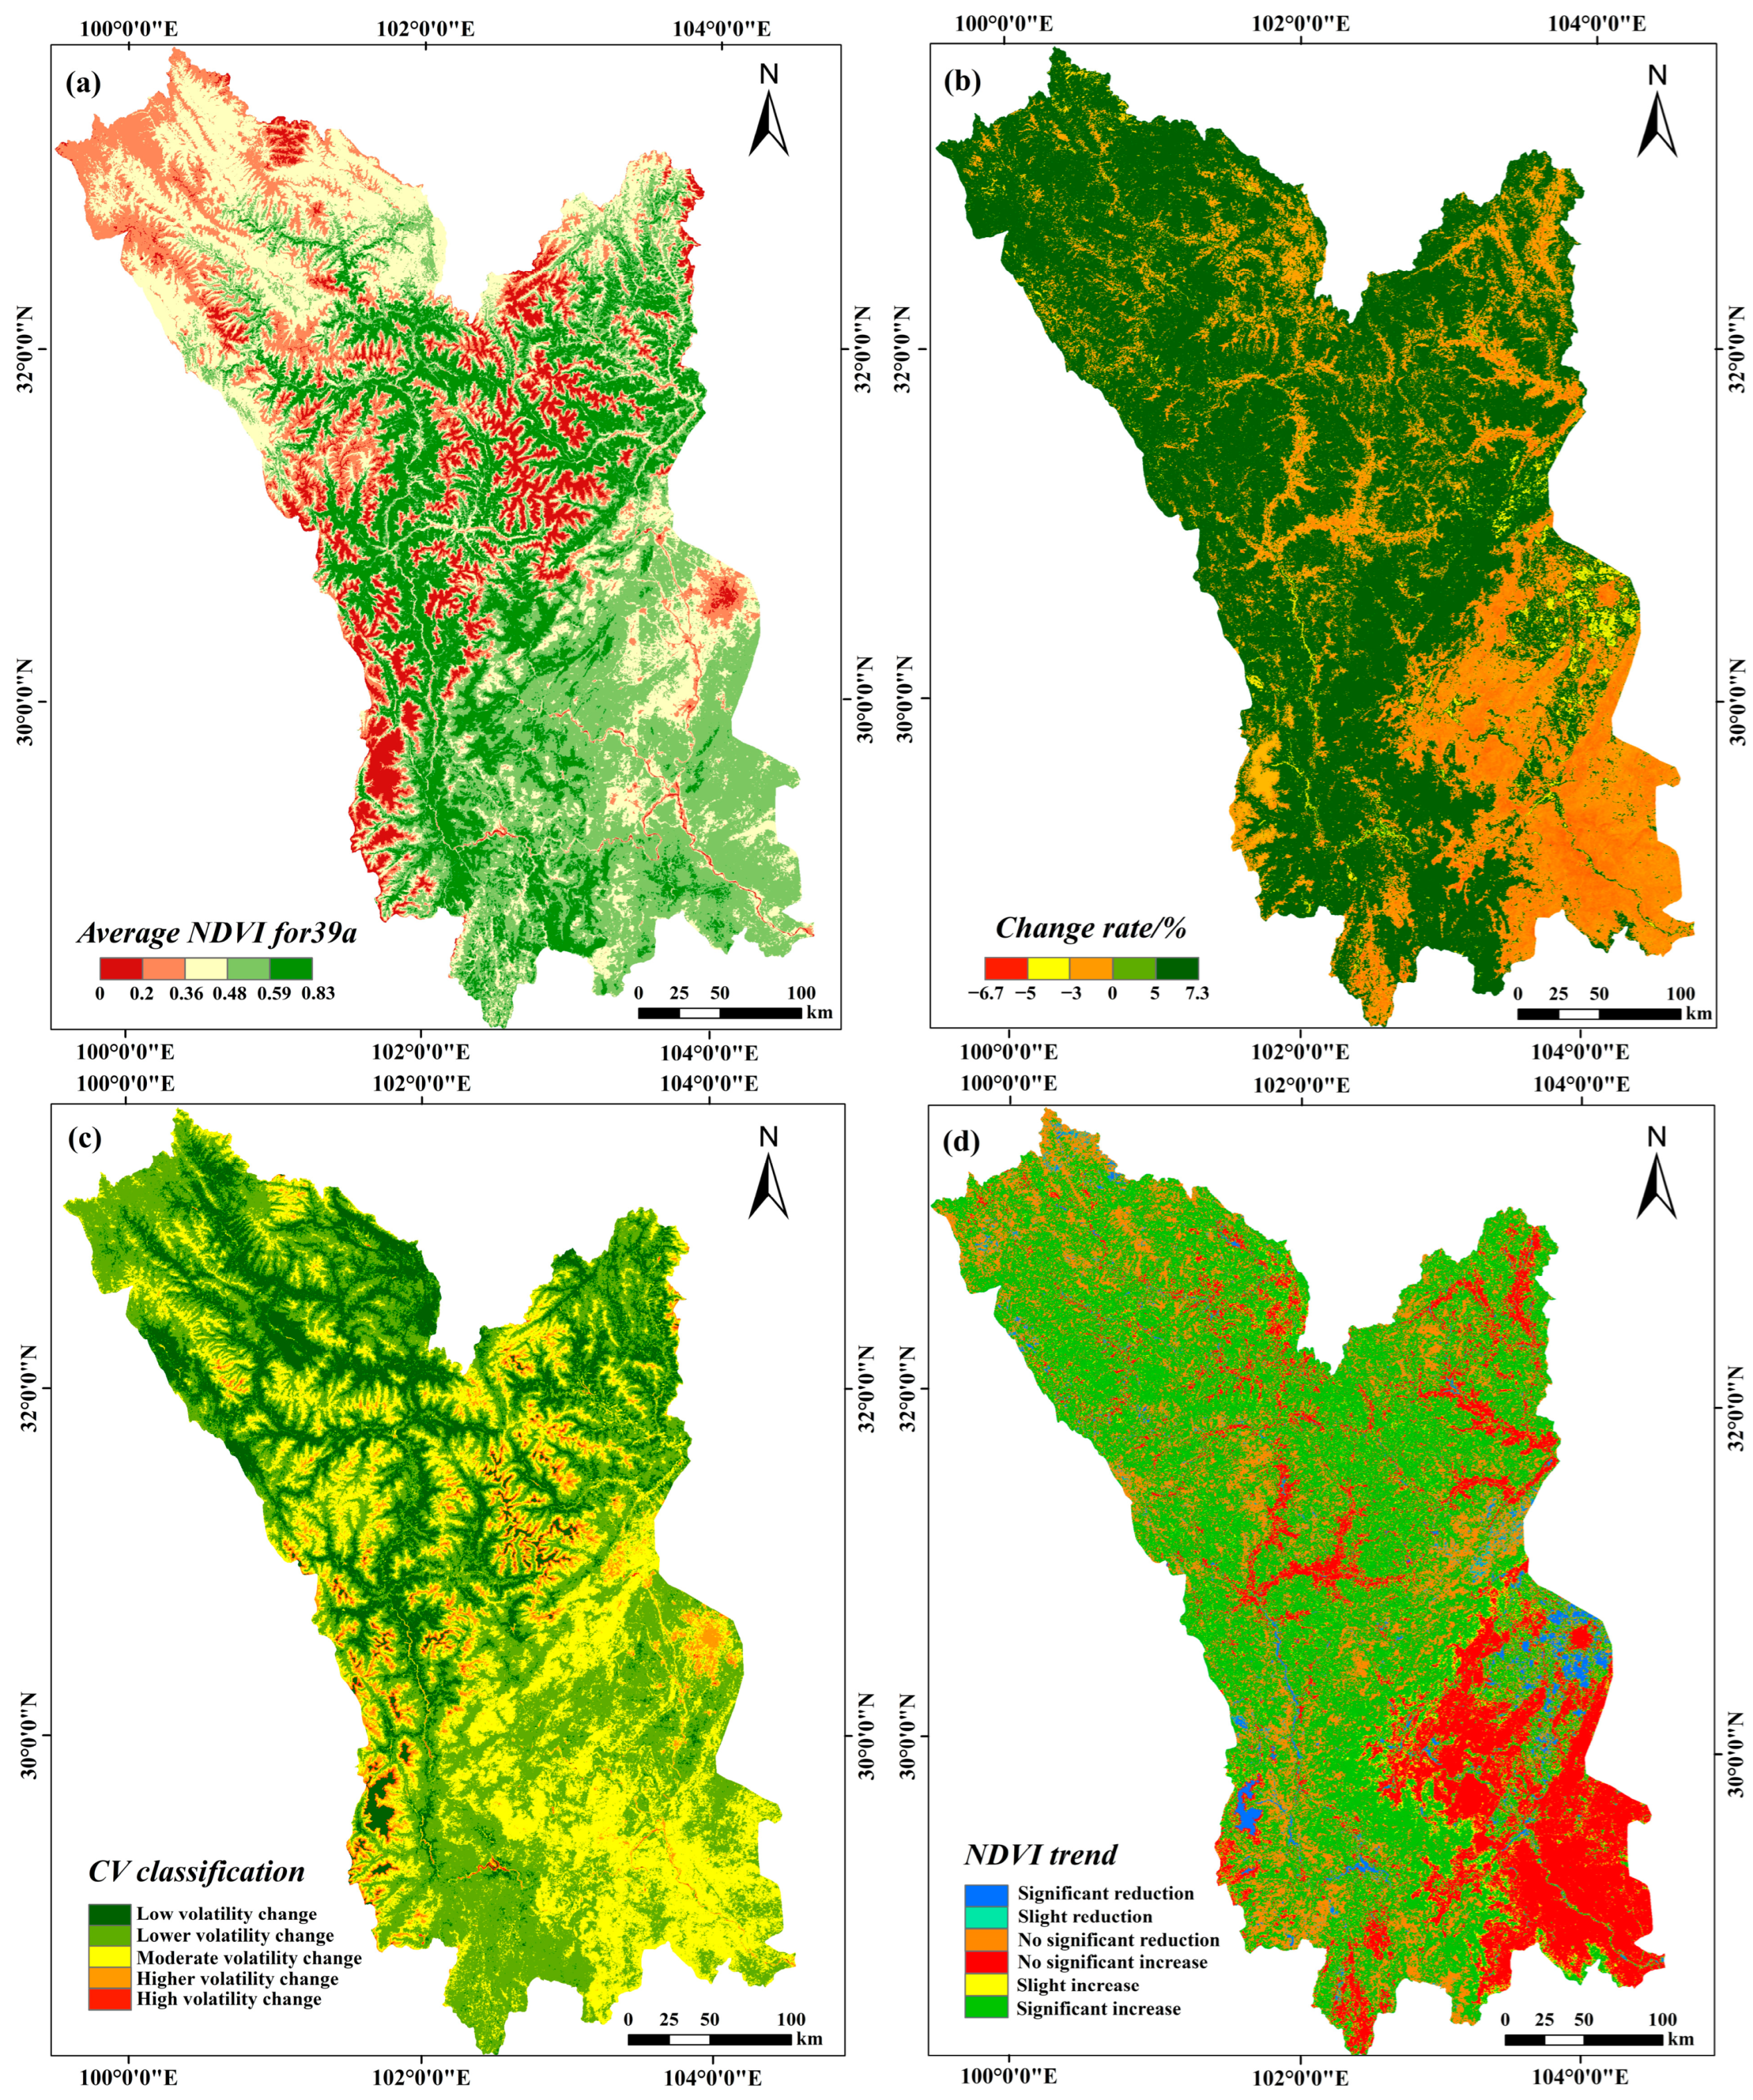
3.3. Trends in Vegetation Coverage Changes

The research presented the NDVI vegetation patterns in the MRB from 1982 to 2020, both spatially and temporally. The dynamics of the vegetation in both space and time were examined first (Figure 6a). The spatial distribution of the NDVI showed obvious heterogeneity, with fluctuations ranging from 0 to 0.83, with a mean value of 0.46. In the upper–middle and downstream portions of the watershed, high values were primarily found. From S1 to S2 (Figure 6b), the rate of change in the NDVI gradually decreased from upstream to downstream, with fluctuations ranging from −6.7% to 7.3%. In the given duration, the NDVI trended upward in 63.54% of the region and downward in 37.46% of it. In particular, near its outlet, where the rate of change in the NDVI exceeded −6%, the NDVI in the lower portion of the watershed exhibited a primarily declining trend during the two-year period. From 1994, the increase in vegetation cover in the MRB accelerated rapidly, showing a rapidly increasing trend, reflecting the effects of climate and subsurface changes on runoff. With an average coefficient of variance of 0.072, the vegetation NDVI in the MRB showed strong general stability over the research period (Figure 6c). Areas with low and lower volatility changes made up 66.37% of the total geographical study area, and they were primarily found in the upstream, central, and southwest portions of the watershed. In contrast, areas with medium, higher, and high volatility changes made up 33.63% of the area, and they were primarily found in the highland mountainous areas in the upper part of the basin, some areas in the lower part of the basin, and the Chengdu Plain. With the exception of the Chengdu Plain in the eastern portion of the watershed and the Leshan and Meishan mountains downstream, the overall plant cover of the MRB remained generally steady between 1982 and 2020. According to the spatial distribution of the different types of NDVI trends (Figure 6d), the area with increasing NDVI trends accounted for 76.76% of the total area, while the areas with significant and slight increases accounted for 54.73% of the total area. The areas with significant increases were spread out in the southwestern and upstream regions of the MRB. The non-significant declining trend, which was mostly seen in the eastern, central, and southern portions of the watershed, predominated the vegetation NDVI, which had a falling tendency in 23.24% of the area. The smallest and most dispersed sections, comprising only 2.78% of the total, were those with notable and minor reductions in the vegetation. These areas were mostly found in the Chengdu Plain region and a small fraction of its southwest. Taken together, the vegetation NDVI in the MRB showed an overall favorable development trend from 1982 to 2020, with most areas showing an increasing trend in the NDVI.

3.4. MRB Land Use Change

During the period 1985–2020, land use conditions in the MRB watershed experienced significant changes, as shown in Figure 7. With 41.45% of the total area in 1985, forest land was the predominant land cover type in the watershed. It was followed by grassland with 38.11%. Cropland and shrub cover were 16.3% and 2.1%, and urban built-up land was the least, with only 0.3%. As shown in Figure 8a, the shrub area decreased significantly between 1985 and 1995 by 1292.37 km2, or 47.21%. Concurrently, there was a 30.81% and 1.68% decline in the extent of arable and vacant land, respectively. In comparison, the increase in snow and ice and urban development land was 29.27% and 19.57%, respectively, while the extent of forest land and grassland expanded by 6070.81 km2 and 1357.99 km2, respectively. The areas of grassland and farmed land declined most dramatically, by 2423.32 km2 and 1085 km2, respectively, between 1995 and 2020 (Figure 8b). Moreover, the amount of snow reduced dramatically, by 30.55%. On the other hand, with rapid urbanization, the area of urban construction land increased by 271.74%. The area of forest land, unutilized land, bushes, and water also increased. Among them, the increase in unutilized land, water, and bushes increased by 115.81%, 58.85% and 33.87%, respectively. The increase in the forest land area from 1995 was smaller, only 1.14%, but the area increased by 681.06 km2. Overall, the most notable changes between 1985 and 2020 were in the amount of land used for urban building, the amount of land used for forests, the amount of land used for shrubs, and the amount of grassland area that declined.
Analyzing the MRB land use data by overlaying, we constructed a land use utilization transfer matrix from 1985 to 2020. Cultivated land in the MRB was mostly converted into construction, grassland, and forest land between 1985 and 1995 (Figure 9a), with more than 95% of the transferred area going to grassland and forest. The strategy of the government of converting farms back to woods, which aims to preserve and restore each natural ecosystem, had a major impact on this transfer trend. Bushes were primarily converted to forest land and grassland, with transferred areas of 1008.65 km2 and 689.93 km2, respectively, whereas the extent of forest land diminished and was primarily converted to cultivated land and bushes. The area of watersheds diminished minimally, with just a portion going to forest land and grassland, and grassland was primarily moved to become undeveloped land and forest land. Between 1995 and 2020 (Figure 9b), 3939.28 km2 of arable land were transferred out of the MRB; this land was primarily converted to forest land and construction land, making up 32.98% and 51.22% of the total area transferred out, respectively. The increase in construction land was largely due to the accelerated urbanization and urban area expansion in the MRB. The area converted to forest land was the largest, with the transfer being mainly to cropland, shrubs, and grassland, whose areas were 2017.18 km2, 442.92 km2 and 1932.69 km2, respectively. Cropland, shrubs, and grasslands were the land use categories that had the biggest areas transferred from forest land; this suggests that there is a higher frequency of conversion between these three land use kinds and forest land. Those converted to water mainly included cropland, grassland, glaciers, and urban construction land, among which cropland and grassland had the largest converted area, accounting for 65.97%. In urban and rural construction, the original construction land was converted to water due to water conservancy construction, landscape afforestation, and flood storage. In summary, during the period from 1985 to 2020, the land use structure of MRB underwent a dramatic evolution, and the internal structure became more and more reasonable, which not only improved the ecological environment of the region but also promoted the rapid development of urban construction.

3.5. NDVI with the Budyko Parameter n

The effects of vegetation changes in the MRB on runoff were quantitatively examined using the Budyko parameter n and the temporal variation features of the watershed NDVI. From Figure 10a, it is evident that the average NDVI value increased, with a relative change rate of 3.19% between the two periods before and after the mutation, going from 0.51 in the S1 period to 0.53 in the S2 period. Between the periods S1 and S2, the NDVI displayed an ascending trend with reasonably close upward slopes. The Budyko parameter n showed a mean change of 0.99 during the S1 period and 1.14 during the S2 phase, signifying a 15.8% increase of 0.15. It can also be observed from Figure 10b that the Budyko parameter n shows an upward trend in both the S1 and S2 periods, but the upward trend in the S1 period is more significant than that in the S2 period.
Numerous researchers have demonstrated that there is a substantial relationship between the NDVI change rate and the Budyko parameter n [52,53]. Thus, we created a scatter plot (Figure 10c) using the Budyko parameter n and the 5-year sliding average of the NDVI. Because the Budyko parameter n reflects changes in subsurface conditions, it should change on annual or multi-year scales. Using the least-squares approach, regression coefficients a and b were fitted using the previously determined values of n and NDVI for the S1 and S2 periods. The fitted equations achieved an R2 of 0.41, and the results of the fit were significant (p < 0.01), suggesting a good match.

3.6. Runoff Sensitivity Assessment and Quantitative Analysis

A correlation between precipitation and n in different periods was observed (Figure 11a). It was found that the correlation between precipitation and n was weak, with a correlation coefficient of only 0.07 in the S1 period. In the S2 period, the correlation between precipitation and n was significantly improved, with a correlation coefficient of 0.22, and it showed a positive linear correlation. Compared with precipitation, the correlation between n and ET0 is slightly better (Figure 11b). The correlation between the two is substantially stronger during the S2 phase, with a correlation coefficient of 0.31, than it is during the S1 period, when it is low at 0.12. The correlation between n and ET0 is a positive linear correlation in both the S1 and S2 periods. According to these findings, there was no significant correlation between n and potential evapotranspiration or precipitation during the S1 period, but during the S2 period, there was a significant increase in the correlation, indicating that the relationship between n and climate factors is being impacted more by climate change.
The computation results are displayed in Table 2 and are based on the multi-year average of R, Pr, ET0, n, and NDVI. It is evident that R and Pr decreased in the S2 phase as opposed to the S1 period. Within these, the average runoff depth in 1982–1994 decreased from 637.1 mm to 583.9 mm in 1995–2020, which is a decrease of 53.2 mm, and the relative change rate reached 8.36%. With a relative change rate of 3.06%, the amount of precipitation dropped from 1018.8 mm in the base period to 987.6 mm in the change period. On the other hand, ET0 had an increase rate of 5.24%, rising from 602.2 mm in the base period to 613.7 mm in the change period. During the research period, there appears to have been a steady rise in sensitivity to the subsurface parameter n and a decrease in sensitivity to precipitation, as indicated by the considerable changes in runoff depth and potential evapotranspiration. Calculated using Equations (11)–(14), we obtained the elasticity coefficients of the amount of change in runoff due to Pr, ET0, NDVI, and n, which are denoted as ε P r , ε E T 0 , ε n , and ε N D V I . There was a 1.41% and 0.41% drop in runoff depth with every 1% fall in Pr and NDVI, according to the elasticity coefficients of ε P r and ε N D V I for Pr and NDVI, which were 1.41 and 0.41, respectively. The elasticity coefficients ε E T 0 and ε n for ET0 and Budyko parameter n were −0.42 and −0.4, respectively, indicating that the runoff depth increased by 0.42% and 0.4% when the ET0 and n decreased by 1% per year.

3.7. Runoff Change Attribution Analysis

As shown in Table 3, the contribution of each driver to the runoff change was computed using Equations (21)–(24).The change in runoff depth for the period from S1 to S2 was 55.21 mm, and the value of the actual change in runoff depth was 53.2 mm, with a relative error of only 3.8%, which is lower than the threshold of 5% [54,55], suggesting that the Budyko model has a certain applicability. There were variations in the contributions of Pr, ET0, NDVI, and human activity to runoff throughout the S2 period. With a contribution of 32.41% from precipitation, the climatic components Pr and ET0 accounted for 41.84% of the runoff. Actually, evapotranspiration caused a contribution of 9.43% to a change in runoff depth of −5.21 mm, while precipitation alone accounted for 32.41% of the runoff. The amount of change in runoff due to anthropogenic causes and the NDVI was −32.11 mm, with a total contribution of 58.16%. Of this, the change in runoff due to anthropogenic causes was −15.19 mm, with a contribution rate of 27.51%, while the change due to NDVI was −16.92 mm, which was second only to precipitation. In conclusion, both natural and man-made influences affected the runoff, but the substantial increase in plant cover restrained the change in runoff and led to a notable reduction in runoff overall. This suggests that vegetation significantly reduces the ability of the MRB runoff to change.

4. Conclusions and Discussion

4.1. Discussion

4.1.1. Impacts of Climate Change and Human Activity on Runoff and Vegetation Coverage

Changes in stream runoff are influenced by a variety of factors, including climate change, anthropogenic factors, and vegetation changes. By analyzing the meteorological, NDVI, land use, and runoff data in the MRB watershed, it is possible to attribute the changes in runoff to the watershed. The topographic height of the MRB varies greatly, and summertime precipitation is mostly concentrated there. Precipitation and potential evapotranspiration, however, decreased downward throughout the S2 phase. This is mainly attributed to regional climate change, where the surface evapotranspiration rates increased, exacerbating regional aridity and thus leading to a decrease in regional precipitation [56]. At various time scales, environmental and socioeconomic processes are reflected in changes in land use within the watershed. The amount of the MRB covered by snow cover shrank over the research period, whereas the size of the watershed expanded. This is due to the release of large amounts of meltwater from glacial melting caused by the increase in regional temperatures, which increased the volume of water in rivers and lakes and expanded the watershed area [57]. In addition, the large-scale reduction in arable land and grassland and the large increase in urban construction land are mainly due to accelerated urbanization and population growth, which require more supporting infrastructure as well as government policies and planning, resulting in the conversion of arable land and grassland in some rural areas to construction land [58]. In the S1 period, there was little association between precipitation and potential evapotranspiration with n; in the change period, there was a considerable correlation. This is due to the increase in human activities, resulting in higher carbon emissions, while the change in land use changed the reflective properties of the surface, leading to higher atmospheric temperatures. In addition, the construction of large-scale reservoirs and the implementation of agricultural irrigation projects may have changed the water cycle of the basin surface and the regional precipitation distribution, which also had an impact on the basin climate [59,60]. We discovered that the NDVI and the Budyko parameter n in the MRB had a substantial positive association (Figure 10c), suggesting that n would probably grow in tandem with an increase in vegetation coverage.

4.1.2. Correlation of NDVI Changes with Runoff

Vegetation changes have important impacts on watershed ecosystems and the hydrological cycle and are one of the focuses of hydrological and ecological studies [61,62]. Wang et al. [63] found that the overall vegetation in the watershed has improved. Various parts of the MRB watershed see various responses from the plants to precipitation due to the irregular temporal and spatial distribution of precipitation. Of these, the upstream region showed the greatest improvement, which was attributed to the upper watershed’s rising temperature, which promotes photosynthesis and the growth and development of vegetation, raising the NDVI value. The continuous decrease in precipitation in the MRB directly affects the water supply for the vegetation, which will negatively affect the growth and development of vegetation in the watershed in the future. Vegetation experiences water stress during droughts, which causes the vegetation index to significantly drop. It can be concluded from past studies that any increase or decrease in vegetation will have some effect on the watershed runoff. Runoff in the MRB decreases as the plant cover increases, according to the attribution analyses conducted earlier. Numerous studies have observed [64] that the development of vegetation positively affects the runoff increase and that big watersheds with diverse terrain are the primary locations where increasing NDVI leads to increased runoff. However, the consistent view is that increased vegetation decreases runoff, and the findings in this paper are more consistent with this conclusion. Governmental agencies should thus develop sensible vegetation restoration plans that take into account the real circumstances of the watersheds and give particular consideration to how plant growth affects the water resources within the watersheds.

4.1.3. Shortcomings and Future Work

Despite the rigorous quality control of the data in this paper, a number of uncertainties remain. First, the wide range of human activities complicates the precise estimation of their impact on hydrological processes. Second, the elasticity coefficient method based on Budyko is based on the mutual independence of variables, which often does not hold in practice because of the complex interactions between the subsurface and the climate system. For example, when calculating the partial derivatives of multi-year precipitation, factors such as the NDVI, potential evapotranspiration, and human activities are required to be independent of each other, whereas in practice, there are interactions between these factors, leading to model errors. Lastly, because hydraulic projects directly impact the temporal and geographical variability of runoff, their being in the watershed further adds to the uncertainty [65]. Although this study considered the effect of ecological restoration projects on runoff, it ignored the effect of reservoirs, artificial forestation, and other engineering measures on runoff. We intend to develop a distributed coupled hydrological model in the future in order to compute the impacts of vegetation on hydrological processes in the MRB with greater accuracy. In addition, this study considered fewer factors in the attribution analysis and ignored the presence of many glacial tundra areas. With climate change, the contribution of snowmelt to MRB runoff is becoming increasingly significant. Consequently, in regard to climate change, the impact of snowmelt on MRB runoff variations will be quantitatively examined in further research.

4.2. Conclusions

Using the MK mutation test and the Pettit mutation test, the runoff from the MRB watershed from 1982 to 2020 was trend-analyzed in this study, and the year 1994 was determined to be the mutation year. Afterwards, the research period was split into the S1 and S2 periods, depending on the year of mutation. This study statistically examined the impacts of climatic and anthropogenic influences on runoff and vegetation in the MRB based on the revised Budyko equation, combining meteorological data, NDVI, land use, and observed runoff data. The results demonstrated that the following:
(1)
While ET0 had a growing trend during the investigation, the MRB R and Pr showed a declining tendency. Furthermore, there was a 0.01 decrease in the slope of the fitted curve that shows the relationship between precipitation and runoff. In terms of spatial distribution, the downstream Pr declined significantly, while the overall ET0 had a significant increasing trend.
(2)
With a coefficient of variation of 0.072, the overall NDVI fluctuation remained generally consistent between S1 and S2, with an overall mean value of 0.46. The NDVI indicated an increasing trend throughout, with the exception of the Chengdu Plain.
(3)
From 1985 to 2020, the land use in the watershed was dominated by cropland, grassland, and forest land, accounting for more than 95%; urban construction land and the watershed increased by 344.49% and 57.35%.
(4)
The vegetation index and the Budyko model parameters showed a substantial link, as evidenced by the positive linear relationship between the NDVI and the parameter n (correlation coefficient of 0.41, p < 0.01). In terms of precipitation and potential evapotranspiration in the S1 period, the correlation was not significant, while in the S2 period, the correlation was significant.
(5)
The sensitivity of the MRB runoff to changes in precipitation, NDVI, human activities, and potential evapotranspiration decreased sequentially in the S2 period, with contributions of 32.41%, 30.65%, 27.51%, and 9.43%, respectively.

Author Contributions

Conceptualization, H.W.; Methodology, S.L.; Software, S.L.; Formal analysis, S.L.; Data curation, S.L. and Y.G.; Writing—original draft, S.L. and P.Z.; Writing—review and editing, S.L., Y.G., H.W., J.L. and T.A.; Project administration, P.Z. and H.W.; Funding acquisition, H.W. and J.L. All authors have read and agreed to the published version of the manuscript.

Funding

This research was funded by the National Key R&D Program of China (2022YFC3002902).

Data Availability Statement

Data available on request due to restrictions eg privacy or ethical.

Conflicts of Interest

The authors declare no conflict of interest.

References

  1. Konapala, G.; Mishra, A.K.; Wada, Y.; Mann, M.E. Climate change will affect global water availability through compounding changes in seasonal precipitation and evaporation. Nat. Commun. 2020, 11, 3044. [Google Scholar] [CrossRef] [PubMed]
  2. Yang, D.; Yang, Y.; Xia, J. Hydrological cycle and water resources in a changing world: A review. Geogr. Sustain. 2021, 2, 115–122. [Google Scholar] [CrossRef]
  3. Masjud, Y.I. The correlation of human activities to climate change effect on hydrological cycle and water resource. Gend. Hum. Dev. Econ. 2024, 1, 10–19. [Google Scholar]
  4. Jin, T.; Zhang, X.; Wang, T.; Liang, J.; Ma, W.; Xie, J. Spatiotemporal impacts of climate change and human activities on blue and green water resources in northwest river basins of China. Ecol. Indic. 2024, 160, 111823. [Google Scholar] [CrossRef]
  5. Li, B.; Feng, Q.; Wang, Y. Historical and future runoff changes and their impacts on stormflow characteristics in the upper Yangtze River basin, China. Catena 2024, 235, 107684. [Google Scholar] [CrossRef]
  6. Ficklin, D.L.; Robeson, S.M.; Knouft, J.H. Impacts of recent climate change on trends in baseflow and stormflow in United States watersheds. Geophys. Res. Lett. 2016, 43, 5079–5088. [Google Scholar] [CrossRef]
  7. Zhang, K.; Parolari, A.J. Impact of stormwater infiltration on rainfall-derived inflow and infiltration: A physically based surface–subsurface urban hydrologic model. J. Hydrol. 2022, 610, 127938. [Google Scholar] [CrossRef]
  8. He, S.; Chen, K.; Liu, Z.; Deng, L. Exploring the impacts of climate change and human activities on future runoff variations at the seasonal scale. J. Hydrol. 2023, 619, 129382. [Google Scholar] [CrossRef]
  9. Quang, N.H.; Viet, T.Q.; Thang, H.N.; Hieu, N.T.D. Long-term water level dynamics in the Red River basin in response to anthropogenic activities and climate change. Sci. Total Environ. 2024, 912, 168985. [Google Scholar] [CrossRef]
  10. Yin, S.; Gao, G.; Li, Y.; Xu, Y.J.; Turner, R.E.; Ran, L.; Wang, X.; Fu, B. Long-term trends of streamflow, sediment load and nutrient fluxes from the Mississippi River Basin: Impacts of climate change and human activities. J. Hydrol. 2023, 616, 128822. [Google Scholar] [CrossRef]
  11. Wang, H.; Yuan, W.; Yang, H.; Hong, F.; Yang, K.; Guo, W. The ecological–hydrological regime of the Han River basin under changing conditions: The coupled influence of human activities and climate change. Ecohydrology 2024. [Google Scholar] [CrossRef]
  12. Ren, D.; Liu, S.; Wu, Y.; Xiao, F.; Patil, S.D.; Dallison, R.J.; Feng, S.; Zhao, F.; Qiu, L.; Wang, S. Quantifying natural and anthropogenic impacts on streamflow and sediment load reduction in the upper to middle Yellow River Basin. J. Hydrol. Reg. Stud. 2024, 53, 101788. [Google Scholar] [CrossRef]
  13. Xue, D.; Zhou, J.; Zhao, X.; Liu, C.; Wei, W.; Yang, X.; Li, Q.; Zhao, Y. Impacts of climate change and human activities on runoff change in a typical arid watershed, NW China. Ecol. Indic. 2021, 121, 107013. [Google Scholar] [CrossRef]
  14. Hu, J.; Ma, J.; Nie, C.; Xue, L.; Zhang, Y.; Ni, F.; Deng, Y.; Liu, J.; Zhou, D.; Li, L. Attribution Analysis of Runoff change in Min-tuo River Basin based on SWAT model simulations, china. Sci. Rep. 2020, 10, 2900. [Google Scholar] [CrossRef] [PubMed]
  15. Yi-nan, N.; Xiao-nan, Y.; Wen-yi, S.; Xing-min, M.; Peng, G.; Guang-ju, Z.; Xiao-yan, S. The trend of runoff change and its attribution in the middle reaches of the Yellow River. J. Nat. Resour. 2021, 36, 256–269. [Google Scholar]
  16. Wang, M.; Zhang, Y.; Lu, Y.; Gao, L.; Wang, L. Attribution analysis of streamflow changes based on large-scale hydrological modeling with uncertainties. Water Resour. Manag. 2023, 37, 713–730. [Google Scholar] [CrossRef]
  17. Chen, L.; Yang, M.; Liu, X.; Lu, X. Attribution and sensitivity analysis of runoff variation in the yellow river basin under climate change. Sustainability 2022, 14, 14981. [Google Scholar] [CrossRef]
  18. Wu, Z.; Mei, Y.; Chen, J.; Hu, T.; Xiao, W. Attribution analysis of dry season runoff in the Lhasa River using an extended hydrological sensitivity method and a hydrological model. Water 2019, 11, 1187. [Google Scholar] [CrossRef]
  19. Xu, R.; Qiu, D.; Wu, C.; Mu, X.; Zhao, G.; Sun, W.; Gao, P. Quantifying climate and anthropogenic impacts on runoff using the SWAT model, a Budyko-based approach and empirical methods. Hydrol. Sci. J. 2023, 68, 1358–1371. [Google Scholar] [CrossRef]
  20. Gao, X.; Yan, C.; Wang, Y.; Zhao, X.; Zhao, Y.; Sun, M.; Peng, S. Attribution analysis of climatic and multiple anthropogenic causes of runoff change in the Loess Plateau—A case-study of the Jing River Basin. Land Degrad. Dev. 2020, 31, 1622–1640. [Google Scholar] [CrossRef]
  21. Li, X.; Wang, Y.; Xue, B.; Zhang, X.; Wang, G. Attribution of runoff and hydrological drought changes in an ecologically vulnerable basin in semi-arid regions of China. Hydrol. Process. 2023, 37, e15003. [Google Scholar] [CrossRef]
  22. Osuch, M.; Wawrzyniak, T.; Nawrot, A. Diagnosis of the hydrology of a small Arctic permafrost catchment using HBV conceptual rainfall-runoff model. Hydrol. Res. 2019, 50, 459–478. [Google Scholar] [CrossRef]
  23. Herrera, P.A.; Marazuela, M.A.; Hofmann, T. Parameter estimation and uncertainty analysis in hydrological modeling. Wiley Interdiscip. Rev. Water 2022, 9, e1569. [Google Scholar] [CrossRef]
  24. Liu, W.; Shi, C.; Zhou, Y. Trends and attribution of runoff changes in the upper and middle reaches of the Yellow River in China. J. Hydro-Environ. Res. 2021, 37, 57–66. [Google Scholar] [CrossRef]
  25. Ni, Y.; Yu, Z.; Lv, X.; Qin, T.; Yan, D.; Zhang, Q.; Ma, L. Spatial difference analysis of the runoff evolution attribution in the Yellow River Basin. J. Hydrol. 2022, 612, 128149. [Google Scholar] [CrossRef]
  26. He, Y.; Hu, Y.; Song, J.; Jiang, X. Variation of runoff between southern and northern China and their attribution in the Qinling Mountains, China. Ecol. Eng. 2021, 171, 106374. [Google Scholar] [CrossRef]
  27. Ji, G.; Song, H.; Wei, H.; Wu, L. Attribution analysis of climate and anthropic factors on runoff and vegetation changes in the source area of the Yangtze River from 1982 to 2016. Land 2021, 10, 612. [Google Scholar] [CrossRef]
  28. Wu, Y.; Wang, Q.; Li, G.; Li, J. Data-driven runoff forecasting for Minjiang River: A case study. Water Supply 2020, 20, 2284–2295. [Google Scholar] [CrossRef]
  29. Zhang, H.-l.; Wang, Y.-j.; Wang, Y.-q.; Li, D.-x.; Wang, X.-k. Quantitative comparison of semi-and fully-distributed hydrologic models in simulating flood hydrographs on a mountain watershed in southwest China. J. Hydrodyn. 2013, 25, 877–885. [Google Scholar] [CrossRef]
  30. Guo, W.; Zhou, H.; Jiao, X.; Huang, L.; Wang, H. Analysis of alterations of the hydrological situation and causes of river runoff in the Min River, China. Water 2022, 14, 1093. [Google Scholar] [CrossRef]
  31. Wang, H.; Wang, W.; Hu, J.; Sang, Y.; Guo, W. Characterization of the evolution of runoff-sediment relationship in Min River based on coupling coordination theory. River Res. Appl. 2023, 39, 1067–1083. [Google Scholar] [CrossRef]
  32. Zhai, H.; Wang, M.; Shen, D.; Hu, B.; Li, Y. Analysis of runoff variation and driving factors in the Minjiang River Basin over the last 60 years. J. Water Clim. Change 2022, 13, 3675–3691. [Google Scholar] [CrossRef]
  33. Sajikumar, N.; Remya, R. Impact of land cover and land use change on runoff characteristics. J. Environ. Manag. 2015, 161, 460–468. [Google Scholar] [CrossRef] [PubMed]
  34. Zhang, Z.; Paudel, K.P. Small-scale forest cooperative management of the grain for green program in Xinjiang, China: A SWOT-ANP analysis. Small-Scale For. 2021, 20, 221–233. [Google Scholar] [CrossRef]
  35. Liu, L.; Ao, T.; Zhou, L.; Takeuchi, K.; Gusyev, M.; Zhang, X.; Wang, W.; Ren, Y. Comprehensive evaluation of parameter importance and optimization based on the integrated sensitivity analysis system: A case study of the BTOP model in the upper Min River Basin, China. J. Hydrol. 2022, 610, 127819. [Google Scholar] [CrossRef]
  36. Wang, Y.; Liu, Z.; Qian, B.; He, Z.; Ji, G. Quantitatively computing the influence of vegetation changes on surface discharge in the middle-upper reaches of the huaihe river, China. Forests 2022, 13, 2000. [Google Scholar] [CrossRef]
  37. Zhou, G.; Wei, X.; Luo, Y.; Zhang, M.; Li, Y.; Qiao, Y.; Liu, H.; Wang, C. Forest recovery and river discharge at the regional scale of Guangdong Province, China. Water Resour. Res. 2010, 466, W09503. [Google Scholar] [CrossRef]
  38. Hu, Z.; Liu, S.; Zhong, G.; Lin, H.; Zhou, Z. Modified Mann-Kendall trend test for hydrological time series under the scaling hypothesis and its application. Hydrol. Sci. J. 2020, 65, 2419–2438. [Google Scholar] [CrossRef]
  39. Ashraf, M.S.; Ahmad, I.; Khan, N.M.; Zhang, F.; Bilal, A.; Guo, J. Streamflow variations in monthly, seasonal, annual and extreme values using Mann-Kendall, Spearmen’s Rho and innovative trend analysis. Water Resour. Manag. 2021, 35, 243–261. [Google Scholar] [CrossRef]
  40. Jiang, X.; Zhang, J.; Lei, X. Spatial-Temporal Variations of Extreme Precipitation Indices in the Xinjiang Cold Area over the Past 60 Years. J. Hydrol. Eng. 2023, 28, 04023005. [Google Scholar] [CrossRef]
  41. Sun, J.; Wang, X.; Shahid, S. Precipitation and runoff variation characteristics in typical regions of North China Plain: A case study of Hengshui City. Theor. Appl. Climatol. 2020, 142, 971–985. [Google Scholar] [CrossRef]
  42. Yue, S.; Huang, J.; Zhang, Y.; Chen, W.; Guo, Y.; Cheng, M.; Ji, G. Quantitative Evaluation of the Impact of Vegetation Restoration and Climate Variation on Runoff Attenuation in the Luan River Basin Based on the Extended Budyko Model. Land 2023, 12, 1626. [Google Scholar] [CrossRef]
  43. Zhu, Y.; Zhang, S.; Luo, P.; Su, F.; Sun, B.; Guo, J.; Yang, R. Assessing ecohydrological factors variations and their relationships at different spatio-temporal scales in semiarid area, northwestern China. Adv. Space Res. 2021, 67, 2368–2381. [Google Scholar] [CrossRef]
  44. Sun, Y.-L.; Shan, M.; Pei, X.-R.; Zhang, X.-K.; Yang, Y.-L. Assessment of the impacts of climate change and human activities on vegetation cover change in the Haihe River basin, China. Phys. Chem. Earth Parts A/B/C 2020, 115, 102834. [Google Scholar] [CrossRef]
  45. Zuo, Y.; Li, Y.; He, K.; Wen, Y. Temporal and spatial variation characteristics of vegetation coverage and quantitative analysis of its potential driving forces in the Qilian Mountains, China, 2000–2020. Ecol. Indic. 2022, 143, 109429. [Google Scholar] [CrossRef]
  46. Wang, H.; Ma, Y.; Yang, H.; Hong, F.; Guo, W. Quantitative evaluation of the impact of climate change and human activities on Jialing river runoff changes in the past 60 years, China. J. Water Clim. Change 2023, 14, 590–609. [Google Scholar] [CrossRef]
  47. Allen, R.G.; Pereira, L.S.; Raes, D.; Smith, M. Crop evapotranspiration-Guidelines for computing crop water requirements-FAO Irrigation and drainage paper 56. FAO Rome 1998, 300, D05109. [Google Scholar]
  48. Yang, L.; Zhao, G.; Tian, P.; Mu, X.; Tian, X.; Feng, J.; Bai, Y. Runoff changes in the major river basins of China and their responses to potential driving forces. J. Hydrol. 2022, 607, 127536. [Google Scholar] [CrossRef]
  49. Xu, R.; Gu, C.; Qiu, D.; Wu, C.; Mu, X.; Gao, P. Analysis of runoff changes in the Wei River Basin, China: Confronting climate change and human activities. Water 2023, 15, 2081. [Google Scholar] [CrossRef]
  50. Li, D.; Pan, M.; Cong, Z.; Zhang, L.; Wood, E. Vegetation control on water and energy balance within the Budyko framework. Water Resour. Res. 2013, 49, 969–976. [Google Scholar] [CrossRef]
  51. Ji, G.; Yue, S.; Zhang, J.; Huang, J.; Guo, Y.; Chen, W. Assessing the impact of vegetation variation, climate and human factors on the streamflow variation of yarlung zangbo river with the corrected budyko equation. Forests 2023, 14, 1312. [Google Scholar] [CrossRef]
  52. Ji, G.; Huang, J.; Guo, Y.; Yan, D. Quantitatively calculating the contribution of vegetation variation to runoff in the middle reaches of Yellow River using an adjusted Budyko formula. Land 2022, 11, 535. [Google Scholar] [CrossRef]
  53. Luo, Y.; Yang, Y.; Yang, D.; Zhang, S. Quantifying the impact of vegetation changes on global terrestrial runoff using the Budyko framework. J. Hydrol. 2020, 590, 125389. [Google Scholar] [CrossRef]
  54. Gan, G.; Liu, Y.; Sun, G. Understanding interactions among climate, water, and vegetation with the Budyko framework. Earth-Sci. Rev. 2021, 212, 103451. [Google Scholar] [CrossRef]
  55. He, Q.; Fok, H.S.; Ferreira, V.; Tenzer, R.; Ma, Z.; Zhou, H. Three-dimensional Budyko framework incorporating terrestrial water storage: Unraveling water-energy dynamics, vegetation, and ocean-atmosphere interactions. Sci. Total Environ. 2023, 904, 166380. [Google Scholar] [CrossRef] [PubMed]
  56. Chen, T.; Ao, T.; Zhang, X.; Li, X.; Yang, K. Climate change characteristics of extreme temperature in the Minjiang River Basin. Adv. Meteorol. 2019, 2019, 1935719. [Google Scholar] [CrossRef]
  57. Fang, Y.-H.; Zhang, X.; Niu, G.-Y.; Zeng, W.; Zhu, J.; Zhang, T. Study of the spatiotemporal characteristics of meltwater contribution to the total runoff in the upper Changjiang River basin. Water 2017, 9, 165. [Google Scholar] [CrossRef]
  58. Fang, Y.; Du, S.; Wen, J.; Zhang, M.; Fang, J.; Liu, M. Chinese built-up land in floodplains moving closer to freshwaters. Int. J. Disaster Risk Sci. 2021, 12, 355–366. [Google Scholar] [CrossRef]
  59. Zheng, Y.; Tang, J.; Huang, F. The impact of industrial structure adjustment on the spatial industrial linkage of carbon emission: From the perspective of climate change mitigation. J. Environ. Manag. 2023, 345, 118620. [Google Scholar] [CrossRef]
  60. Cheng, Y.; Jin, L.; Fu, H.; Fan, Y.; Bai, R.; Wei, Y. Investigating the impact of climate change and policy orientation on energy–carbon–water nexus under multi-criteria analysis. Renew. Sustain. Energy Rev. 2024, 189, 114032. [Google Scholar] [CrossRef]
  61. Dai, T.; Dai, X.; Lu, H.; He, T.; Li, W.; Li, C.; Huang, S.; Huang, Y.; Tong, C.; Qu, G. The impact of climate change and human activities on the change in the net primary productivity of vegetation—Taking Sichuan Province as an example. Environ. Sci. Pollut. Res. 2024, 31, 7514–7532. [Google Scholar] [CrossRef] [PubMed]
  62. Du, C.; Sun, F.; Yu, J.; Liu, X.; Chen, Y. New interpretation of the role of water balance in an extended Budyko hypothesis in arid regions. Hydrol. Earth Syst. Sci. 2016, 20, 393–409. [Google Scholar] [CrossRef]
  63. Wang, J.; Fan, Y.; Yang, Y.; Zhang, L.; Zhang, Y.; Li, S.; Wei, Y. Spatial-temporal evolution characteristics and driving force analysis of NDVI in the Minjiang River Basin, China, from 2001 to 2020. Water 2022, 14, 2923. [Google Scholar] [CrossRef]
  64. Zhou, G.; Wei, X.; Chen, X.; Zhou, P.; Liu, X.; Xiao, Y.; Sun, G.; Scott, D.F.; Zhou, S.; Han, L. Global pattern for the effect of climate and land cover on water yield. Nat. Commun. 2015, 6, 5918. [Google Scholar] [CrossRef] [PubMed]
  65. Sun, L.; Yu, H.; Sun, M.; Wang, Y. Coupled impacts of climate and land use changes on regional ecosystem services. J. Environ. Manag. 2023, 326, 116753. [Google Scholar] [CrossRef]
Figure 1. Location of the study area in the MRB.
Water 16 01804 g001
Figure 2. Precipitation (Pr), potential evapotranspiration (ET0), and annual runoff depth (R) trends from 1982 to 2020.
Water 16 01804 g002
Figure 3. Runoff MK mutation test (a). Runoff Pettitt mutation test (b).
Water 16 01804 g003
Figure 4. Double cumulative curves of precipitation and runoff at various stages (a); slope ratio of runoff accumulation to precipitation (b).
Water 16 01804 g004
Figure 5. Spatial distribution of precipitation and potential evapotranspiration in the MRB watershed for the periods S1 and S2: base period Pr (a); change period Pr (b); base period ET0 (c); change period ET0 (d).
Water 16 01804 g005
Figure 6. Spatial distribution of the NDVI of MRB vegetation from 1982 to 2020 (a); spatial distribution of the rate of change of the NDVI in the two periods before and following 1994 (b); spatial distribution of the NDVI coefficient of variation (c); spatial distribution of the trend of NDVI change (d).
Water 16 01804 g006
Figure 7. (ah) MRB land use change from 1985 to 2020.
Water 16 01804 g007
Figure 8. Trends in land use change: 1985–1995 (a); 1995–2020 (b).
Water 16 01804 g008
Figure 9. MRB land use area transfer volume chord diagram: 1985–1995 (a);1995–2020 (b).
Water 16 01804 g009
Figure 10. Characteristics of temporal fluctuations in the n at different stages (a), characteristics of temporal fluctuations in the Budyko NDVI parameter at different stages (b), and regression equations of the NDVI and n (c).
Water 16 01804 g010
Figure 11. Correlation analysis of the Budyko parameter n with precipitation (a) and potential evapotranspiration (b).
Water 16 01804 g011
Table 1. MK trend analysis of indicators.
Variable β ZSignificance Level
R −0.311−0.569-
P r −0.452−0.375-
E T 0 0.1083.3870.01
N D V I 0.0013.2660.01
Table 2. Elasticity coefficients and characteristic values of climatic and hydrological components in the S1 and S2 periods.
Period R P r E T 0 N D V I n ε P r ε E T 0 ε n ε N D V I
S1637.11018.8602.20.510.981.38−0.37−0.390.48
S2583.9987.6613.70.481.131.41−0.42−0.40.41
−53.2−31.211.5−0.030.150.03−0.05−0.01−0.07
Table 3. Results of the runoff change attribution analysis.
Δ R P r Δ R E T 0 Δ R h u m Δ R N D V I η R P r η R E T 0 η R h u m η R N D V I
−17.89−5.21−15.19−16.9232.41%9.43%27.51%30.65%
Disclaimer/Publisher’s Note: The statements, opinions and data contained in all publications are solely those of the individual author(s) and contributor(s) and not of MDPI and/or the editor(s). MDPI and/or the editor(s) disclaim responsibility for any injury to people or property resulting from any ideas, methods, instructions or products referred to in the content.

