Article

Eco-Engineering Improves Water Quality and Mediates Plankton–Nutrient Interactions in a Restored Wetland

1
Key Laboratory of Wetland Ecology and Environment & Heilongjiang Xingkai Lake Wetland Ecosystem National Observation and Research Station, Northeast Institute of Geography and Agroecology, Chinese Academy of Sciences, Changchun 130102, China
2
College of Agriculture, Jilin Agricultural University, Changchun 130118, China
3
Sanhuanpao National Natural Reserve & Fujin National Wetland Park Service, Fujin 156100, China
*
Authors to whom correspondence should be addressed.
Water 2024, 16(13), 1821; https://doi.org/10.3390/w16131821
Submission received: 10 May 2024 / Revised: 20 June 2024 / Accepted: 21 June 2024 / Published: 26 June 2024
(This article belongs to the Section Biodiversity and Functionality of Aquatic Ecosystems)

Abstract

:
Eco-engineering is an important tool for wetland restoration, but there are still large theoretical and application gaps in the knowledge of the effects of eco-engineering implementation on the interactions between environmental conditions and organisms during wetland restoration processes. In this study, we investigated water quality parameters and plankton communities in a national wetland park to clarify the mechanism of changes in plankton community structure and their ecological networks before and after the eco-engineering project. Undoubtedly, we found water quality was significantly improved with increased metazooplankton diversity after the implementation of eco-engineering. Ecological engineering reduced the effect of farmland drainage on the restored wetland and changed the phytoplankton community structure, which significantly reduced the relative abundance of Cyanobacteria and increased the relative abundance of Bacillariophyta. The structural equation modeling revealed that the total effect of metazooplankton on phytoplankton was significantly enhanced and associated with weakened relationships between phytoplankton and environmental variables after eco-engineering. In addition, the ecological network analysis also showed that the network connection between phytoplankton and metazooplankton was stronger after the eco-engineering implementation, leading to an enhanced biotic interactions in different trophic levels. These results indicate that the main approach to regulating primary producers in wetland ecosystems changed from “bottom-up” control to a combination of “bottom-up” and “top-down” control under the intervention of artificial recovery measures. Our findings shed new light on the effects of eco-engineering on the interactions between water quality and organisms and provide a scientific basis for the sustainable management of wetland ecosystems.

1. Introduction

Wetlands are an essential natural ecosystem and an effective component of natural ecological space [1]. However, the long-term unreasonable use of wetlands has resulted in a sharp decline in wetland areas and ecological functions since the industrial revolution [2]. By combining records of drainage and conversion with land use maps, a study reconstructed the spatial distribution of wetland loss caused by land use conversion from 1700 to 2020. To gain more croplands, 3.4 million km2 of inland wetlands have been lost since 1700, and these losses have been concentrated in Europe, the United States, and China [3]. The destruction of wetland resources has greatly restricted the socio-economic development of human beings, which also strongly affects greenhouse gas fluxes, nutrient cycling and biodiversity [3,4]. The restoration and reconstruction of wetlands are an inevitable need of national sustainable development. However, there are still large theoretical and application gaps in the knowledge of the interactions between environmental condition, water quality, and organisms during the wetland restoration process. Therefore, a set of theories and technical support on the corresponding ecological processes, driving mechanisms, comprehensive restoration effects, and stability should be developed [5].
Phytoplankton are important primary producers and play an important role in the material cycle and energy flow in water ecosystems [6]. Variations in the phytoplankton community structure directly affect the ecological structure and function of wetland ecosystems [7,8]. Notably, harmful phytoplankton blooms have become one of the most severe problems threatening wetland development and human health around the world, which is urgent to be solved [9]. Therefore, it is crucial to figure out the spatio-temporal pattern of phytoplankton communities and the relevant driving factors during wetland restoration processes, and it is also essential to pay more attention to the variation trend and potential risk of abnormal proliferation of harmful algae in restored wetlands.
Phytoplankton are very sensitive to nutrient variations and are also controlled by higher trophic level organisms. Zooplankton is an essential component of aquatic organisms, playing an important role in regulating the level of primary productivity in wetland ecosystems [10,11]. In general, the phytoplankton community structure is regulated by a “top-down” biotic control [12,13,14], since zooplankton bridge the gap between primary producers and higher trophic levels by feeding on phytoplankton and transferring energy and nutrients [15], and “bottom-up” abiotic control includes ambient nutrient concentration, temperature, and light [16,17]. In addition, the interactions between phytoplankton and predators during wetland restoration processes are further influenced by environmental factors [17,18]. Therefore, not only the mechanisms of dynamic and ecological behind community variations can come to light, but also the contribution of wetland restoration engineering can be explored by identifying the interactions between environmental parameters and plankton community succession [15,19]. However, the study focusing on the effects of environmental parameters on phytoplankton community and the interactions between phytoplankton and zooplankton under the long-term operation of wetland restoration is still limited.
Fujin National Wetland Park (FNWP), a typical freshwater marsh, is located in Sanjiang Plain, Northeast China. The FNWP wetland was restored through technical methods such as bulldozing, damming, water diversion, and landscape matching started in 2009 to restore the important stopover site on the migration route of East Asia–Australia of birds [20]. Then, the Sino-German technical cooperation of eco-engineering and biodiversity conservation in FNWP was implemented in 2013. The wetland eco-engineering achieved the internal and external hydrological connection and scheduling of the wetland through a sluice gate so as to maintain the ecological water requirement of the wetland under the premise of controlling the external pollution as much as possible. However, the effects of eco-engineering on the water quality and the interactions among nutrients, primary producers, and consumers in the FNWP wetland is still unclear.
Our study objectives are to: (1) explore the changes in the water quality and the plankton community before and after eco-engineering and (2) identify the key factors influencing the variations in the plankton community and the patterns of changes in the interactions between primary producers and consumers. We hypothesize that water quality and plankton community structure are altered because of wetland eco-engineering, which will affect the effects of environmental variables on phytoplankton and metazooplankton as well as the network connectivity relationships among plankton species. Our study improves the understanding of water quality and biological interactions in restored wetlands in the context of ecological engineering impacts. At the same time, the analysis of plankton network in this study can also provide a scientific basis for understanding the stability of wetland ecosystems and sustainable management. Our study also improves the understanding of the ecological function variations during wetland restoration processes and provides a scientific basis for effective eutrophication prevention.

2. Materials and Methods

2.1. Study Area and Sampling Sites

The FNWP is located in the northeastern part of Heilongjiang Province and the core area of the Sanjiang Plain. The FNWP covers an area of 2200 ha, which is a typical wetland restored from farmland started in 2009 with a reconstruction area of 1152 ha, accounting for 52.36% of the total area. The study area belongs to the mid-temperate semi-humid continental monsoon climate zone, with a large seasonal temperature difference. (The average temperature of the coldest month is −19.0 °C, and the average temperature of the hottest month is 22.2 °C.) In this study, only spring, summer, and autumn samples were collected due to the freezing period in winter (Table S2). Precipitation, surface runoff, and farmland drainage are the main pathways of water recharge to the wetland.
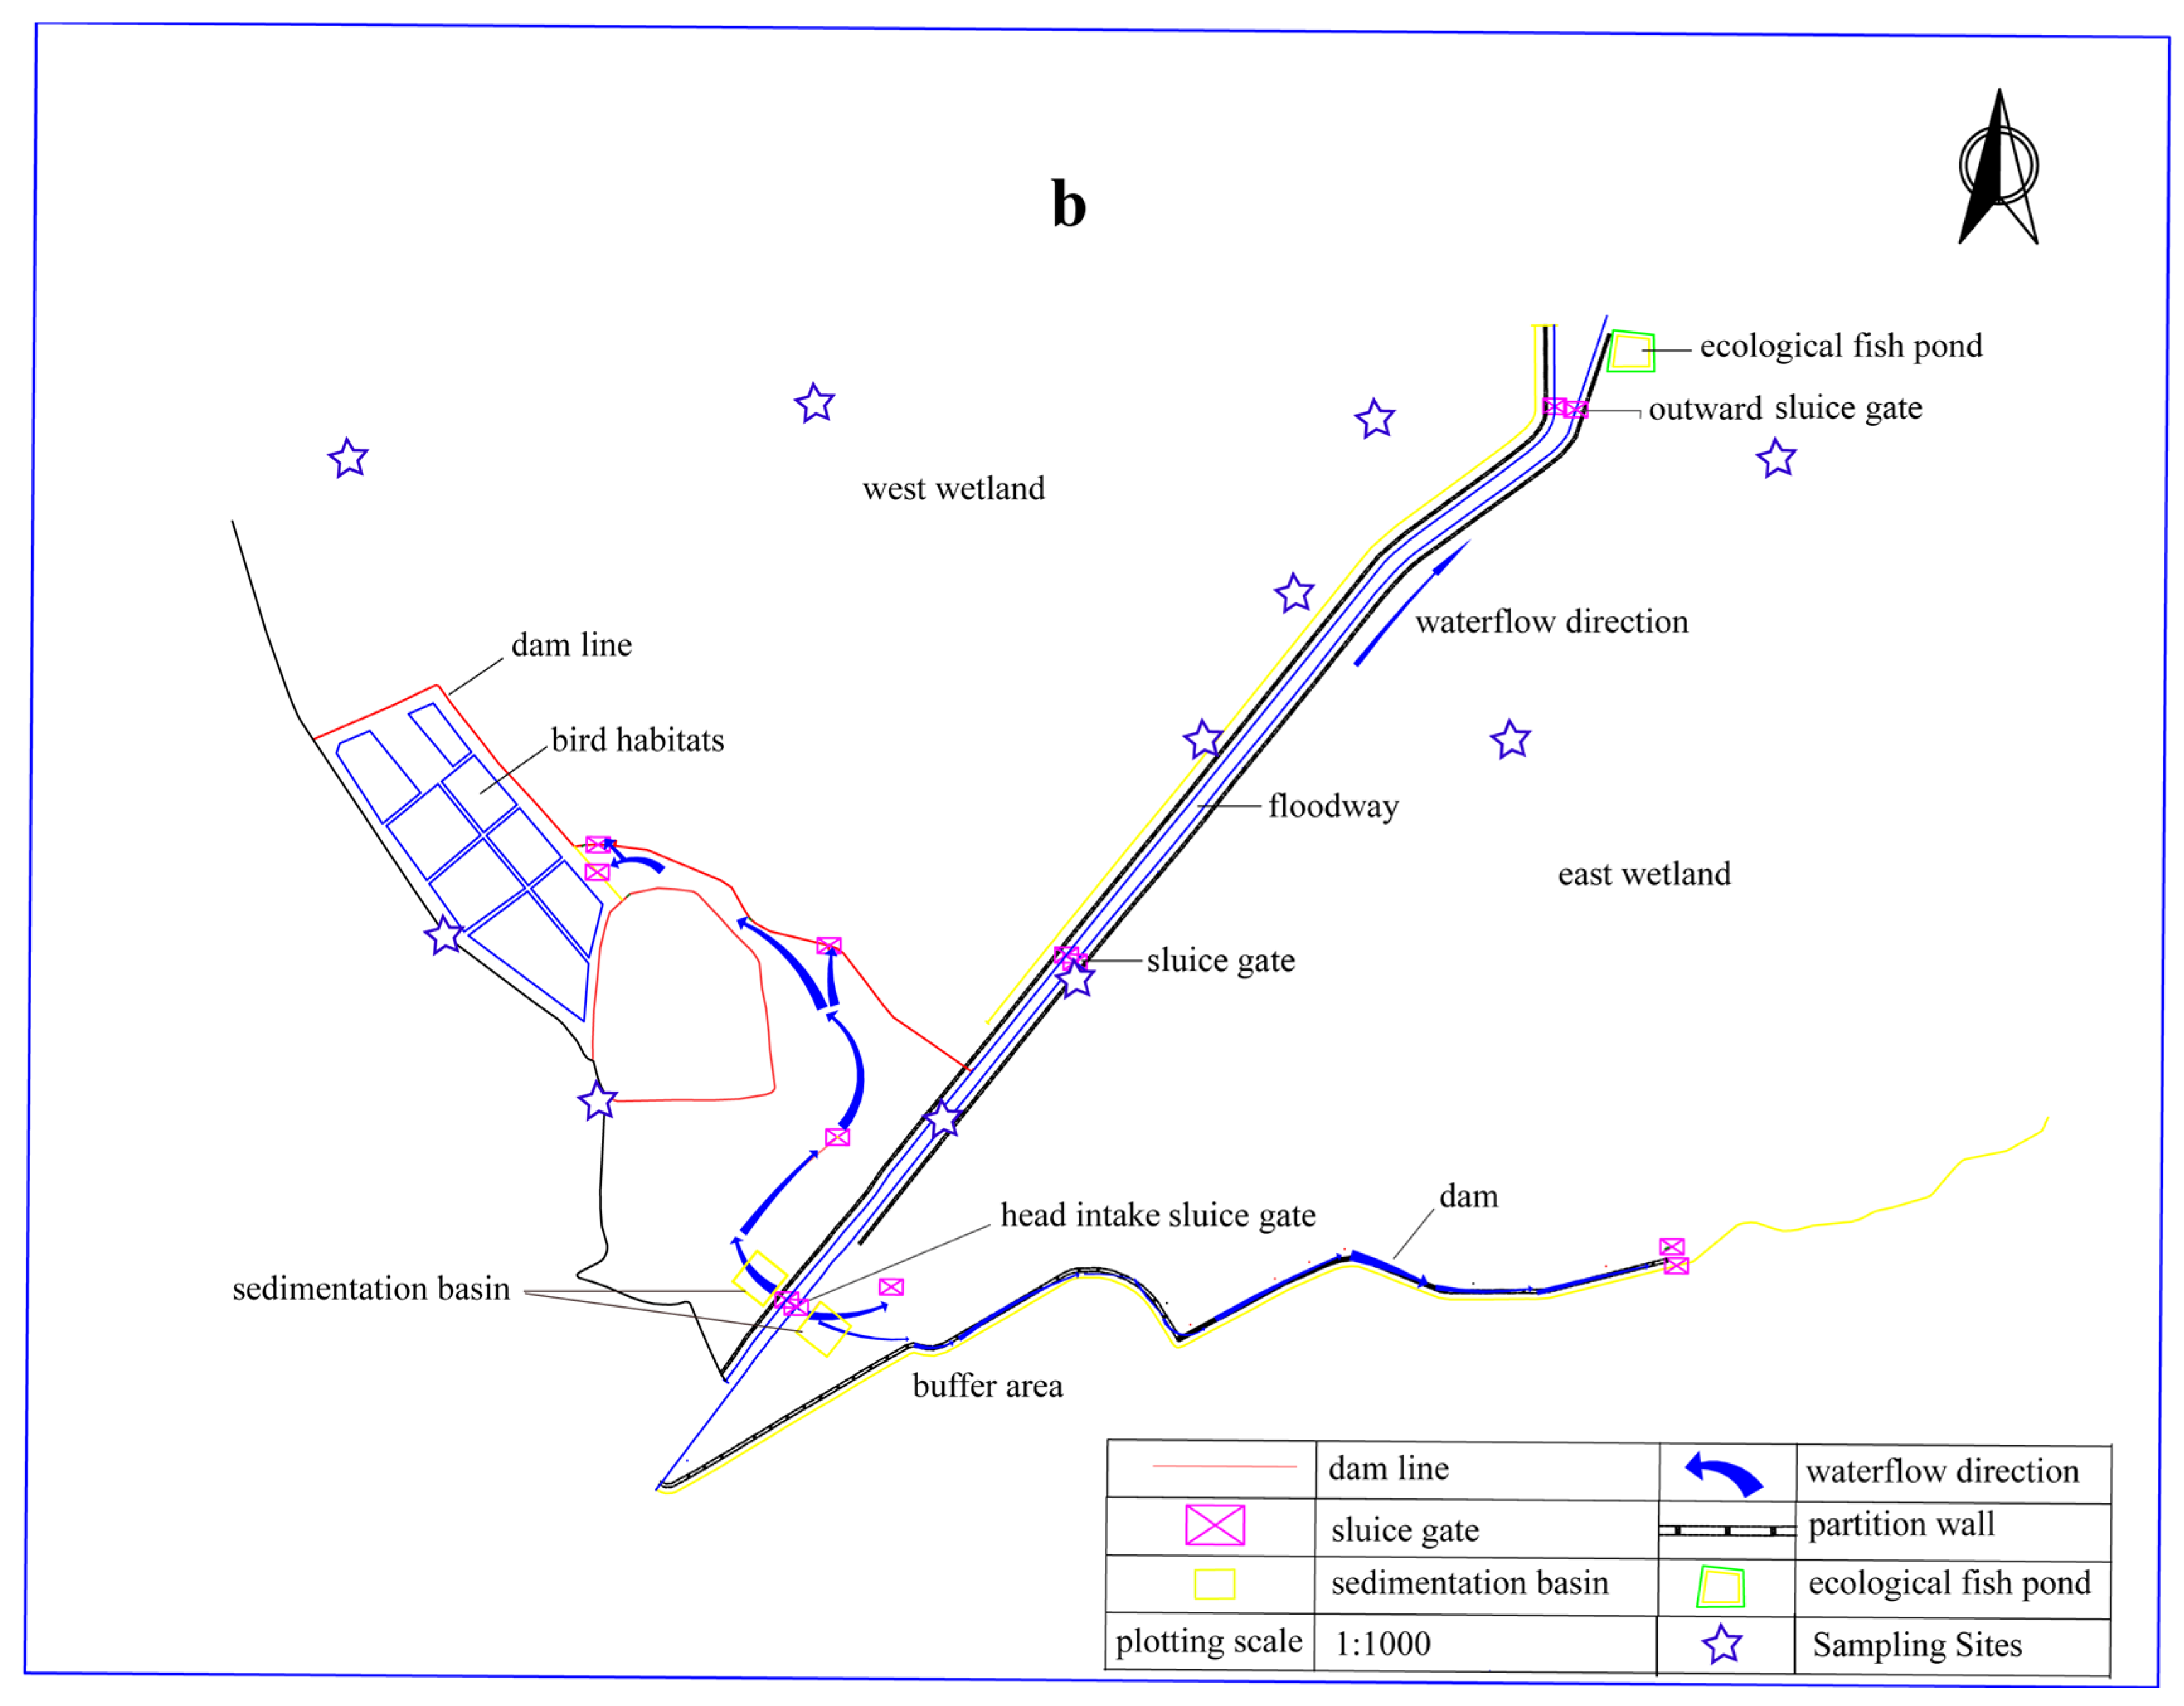
To maintain the sustainable development and stability of the ecosystem, Fujin City government carried out a wetland biodiversity conservation eco-engineering project for wetland protection and restoration, including the sluice gate construction, sediment dredging, vegetation recovery and microgeomorphic modification for hydrological connection, water purification, water level control, water resource storage, and flood detention (Figure 1b). The specific implementation method of wetland eco-engineering was: Through the construction of sluice gates and the formulation of corresponding dispatching methods, the water quantity and water level inside the wetland can be artificially regulated to ensure the ecological water use of the wetland. At the same time, the dike engineering achieved the isolation of the wetland from the external farmland and can be controlled independently according to the needs. This can avoid the drainage of upstream farmland into the wetland and affect the water quality, but also plays the role of wetland flood storage. Finally, the wetland protection eco-engineering project was completed and adopted in early 2018. After the eco-engineering project was adopted, the water quality in the wetland and the water environment affecting plankton changed.
In this study, environmental variables, phytoplankton, and zooplankton monitoring were conducted in spring, summer, and autumn in 2016 and 2018. Eleven sampling sites (Figure 1a) were selected from water inlet to outlet positions along the flow direction in the FNWP wetland park. These sampling points were located in some characteristic locations, such as water outlet, water inlet, gate, and open water constructed by ecological engineering. The samples collected before eco-engineering were labeled as “before”, and those collected after eco-engineering project were labeled as “after” in this paper.

2.2. Sample Collection and Analyses

2.2.1. Water Sample Collection and Testing

Surface water samples were collected, and transparency was determined by a Sechi Disk (SD). The water quality parameters included temperature (WT), pH, dissolved oxygen (DO), and chlorophyll a (Chl-a), which were tested on site using a portable water quality analyzer (YSI EXO2, USA). Meanwhile, 1 L surface water sample (0.5 m) at each site was collected and then kept refrigerated for further analysis. Total nitrogen (TN), total phosphorus (TP), ammonium nitrogen (NH4-N), nitrate nitrogen (NO3-N), and chemical oxygen demand (CODMn) were tested according to the sample analysis standard GB3838-2002 in the “Monitoring and Analysis Method of Water and Wastewater” (Ministry of Ecology and Environment, PRC, 2002) [21].

2.2.2. Trophic Level Index

At present, the trophic level index (TLI) method based on the whole or part of TN, TP, SD, Chl-a, and CODMn is the most commonly used eutrophication level evaluation method in China. It has been applied in many research studies. In this study, the nutrient level index (TLI) was calculated using Chl-a, TP, TN, SD, and CODMn to evaluate the nutrient status of the water [22,23,24,25]. Among these parameters, Chl-a was taken as the reference parameter, and the correlation coefficients of TP, TN, SD, and CODMn with the reference parameter were as follows: 0.84, 0.82, 0.83, and 0.83, respectively. The parameters (Chl-a, TP, TN, SD, and CODMn) of the relative weights were, respectively, 0.2263, 0.1879, 0.1790, 0.1834, and 0.1834 [24]. The formula is:
TLI ( Σ ) = j = 1 m Wj × TLI ( j )
  • TLI(Σ ) means the trophic level index;
  • Wj is the relevant weight of the nutritional status index of the jth parameter;
  • TLI(j) is the nutritional status index representing the jth parameter.
The meaning of TLI and the corresponding water quality levels are shown in Table S1.

2.2.3. Phytoplankton and Zooplankton Identification

We collected phytoplankton samples in wetland water (0~0.5 m) with a plankton net (mesh diameter of 0.128 mm, China) for qualitative analysis and then fixed the samples with 4% formalin. A total of 1 L samples from different water layers were obtained with a 5 L Plexiglass water sampler and fixed with 5% non-acetic Lugol iodine solution. Then, the samples were identified after concentration. We filtered 20 L water through a mesh (mesh diameter of 0.063 mm, China) (from the water surface to the bottom, every 50 cm was a water layer, and a total of 20 L water samples were collected from each water layer) and then fixed with 1.5% formaldehyde in 100 mL polyethylene bottles.
We identified and counted phytoplankton and metazooplankton in the laboratory with a 100–400× microscope (CKX41, Olympus, Tokio, Japan). Phytoplankton was identified according to the Chinese Freshwater Algae [26]. For zooplankton, the rotifers were identified according to the Chinese Freshwater Rotifers [27], the cladocerous were identified according to Chinese Zoology [28], and the copepods were identified according to the Atlas of Freshwater Microorganisms [29].

2.2.4. Plankton Diversity

After the identification and counting of the plankton samples, abundance, biomass, Shannon–Weiner index (H’), Margalef index (d), Pielou index (J), and species dominance (y) were calculated for the phytoplankton and metazooplankton. The specific formulas are, respectively, as follows [30,31,32,33]:
H = P i log 2 P i
d = ( s 1 ) / log 2 N
J = H / log 2 S
y = P i × f i , P i = n i / N
  • ni means the number of the ith plankton;
  • N means the total number of individual plankton identified in the sample;
  • S means the total number of plankton species in the sample;
  • fi means the frequency of the ith plankton;
  • Pi means the percentage of the ith plankton individual number in the total individual number.
When y ≥ 0.02, it was considered as the dominant species.

2.3. Statistical Analysis

Significant differences in plankton abundance, biomass, diversity index, environment parameters, and trophic state index were compared before and after the eco-engineering project using a one-way ANOVA with a paired-samples t-test in SPSS26.0 [18,19]. Non-metric multidimensional scaling (NMDS) was performed in R (version 3.6.1) to analyze the differences in the plankton community structure before and after the eco-engineering project [34].
In this study, ecological networks were used to explore associations among plankton. Species with an abundance > 0.05% were selected. The statistical stability between the two species was considered strong if the Spearman’s correlation coefficient (ρ) was >0.6 and p-value < 0.01 [34]. These stable correlations form a network. Nodes and edges represent species and correlations between them, respectively. We computed some parameters of the network using the igraph package in the R environment and visualized them using the Gephi software [34,35].
Structural equation modeling was performed using the Amos software to further quantify the total effect of water environment parameters and the influence of post-zooplankton on phytoplankton. Structural equation models, as post-validation models, are usually built based on previous experience and research results, etc. In this study, the initial model and related pathways were set up based on summarizing and generalizing the literature [14,17], and three broad categories were selected for the initial model, namely phytoplankton, metazooplankton, and water environment parameters. The biomass of phytoplankton and metazooplankton, Shannon–Wiener index, TN, TP, DO, and pH were selected for the model through literature generalization and preliminary studies and calculation of the variance expansion factors to remove covariates (VIF ≥ 10) [19,34]. The initial model is shown in the attached Supplementary Materials (Figure S1).

3. Results

3.1. Environmental Variables and TLI

The one-way ANOVA results show that the differences in most of the annual mean values of the environmental variables (except DO, SD, and CODMn) were significant (p < 0.01) when compared before and after the eco-engineering project (Table S2). In comparison with the environmental variables before eco-engineering, the water temperature, pH, Chl-a, DO, and CODMn decreased, whereas the mean value of SD slightly increased after eco-engineering.
The nutrient content after the eco-engineering project was significantly lower than that before eco-engineering. Before eco-engineering, TN concentrations varied from 0.88 mg/L to 12.03 mg/L and were extremely high, even far exceeding the V level (the same as “category” in Table S1) at most of the sampling sites in summer and autumn, water standard, and fluctuating. After eco-engineering, TN concentrations decreased by 75% (p < 0.01) and ranged from 0.79 mg/L to 3.05 mg/L. Similarly, TP concentrations also decreased by 34% (p < 0.05) after eco-engineering, with the mean value decreasing from 0.087 mg/L before eco-engineering to 0.057 mg/L after eco-engineering.
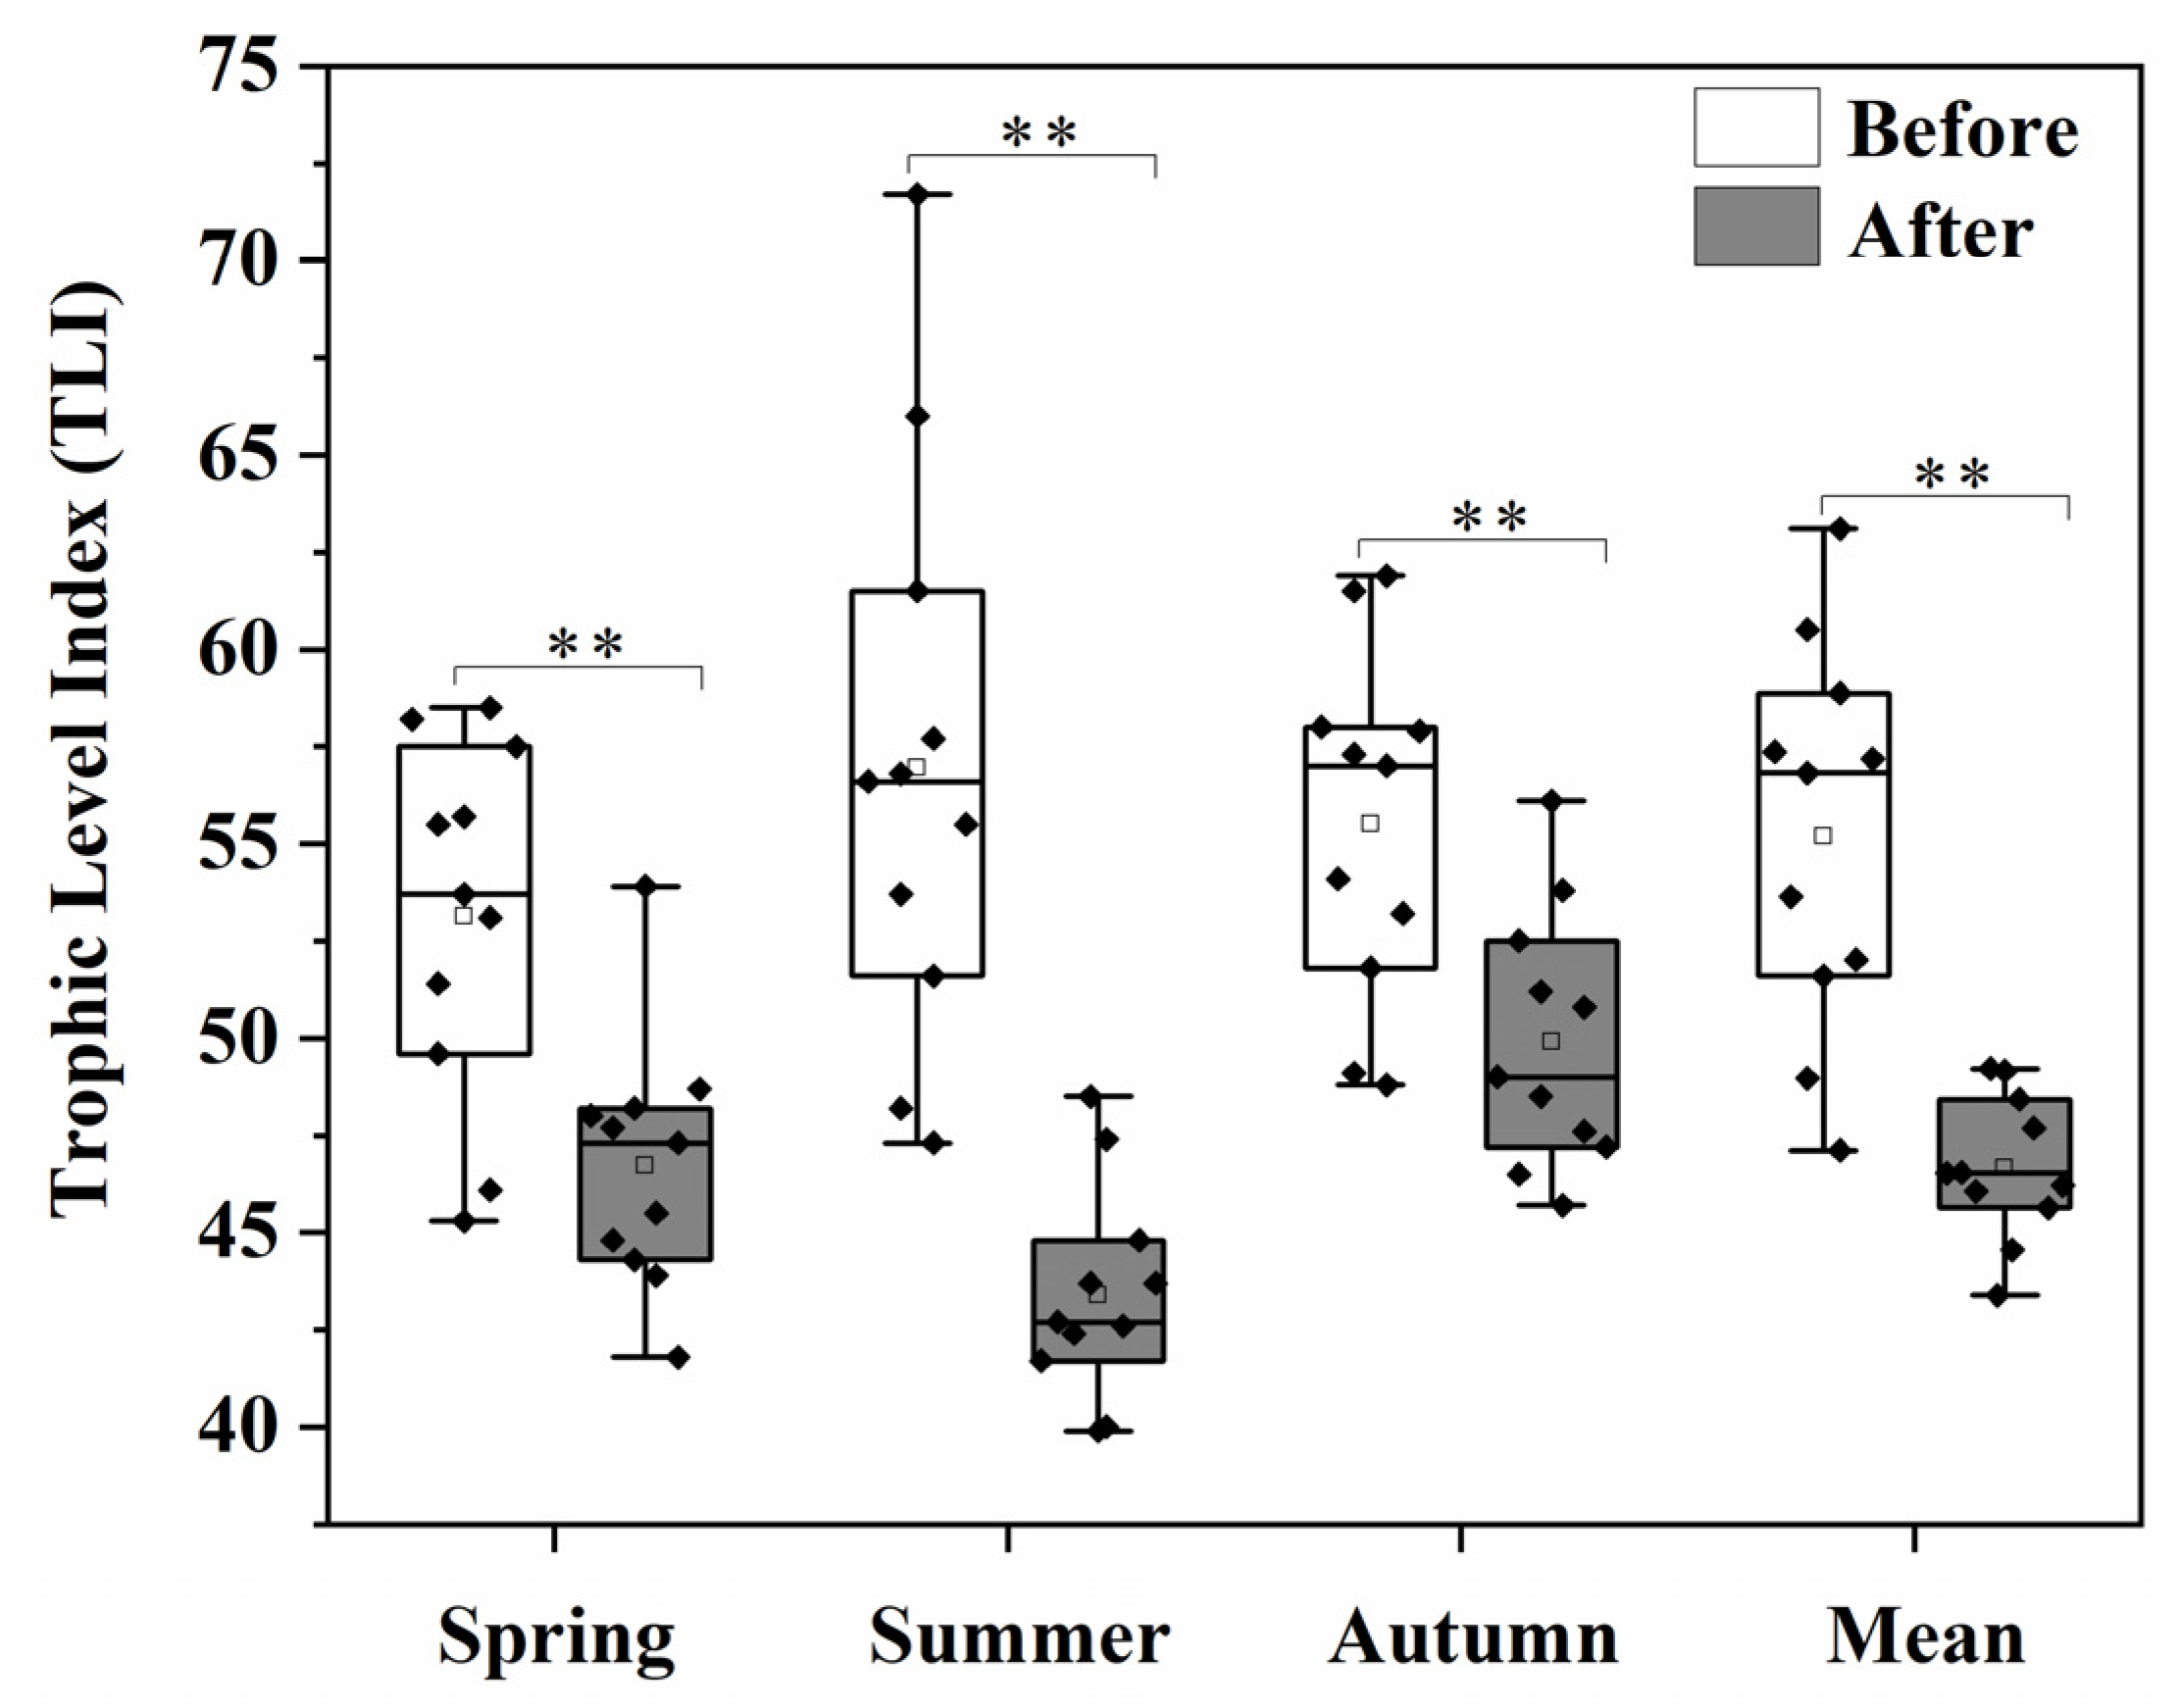
The analysis of the TLI showed that four trophic levels occurred in the Fujin National Wetland Park during this study, including moderate, mild eutrophication, moderate eutrophication, and severe eutrophication (Figure 2). The nutrient level was mainly moderate eutrophication, with an average TLI of 55.2 (range: 45.3–71.7) before the implementation of wetland protection eco-engineering. By contrast, the nutrient level was improved to moderate and mild eutrophication, with an average TLI of 46.7 (range: 39.9–56.1) after eco-engineering implementation. Seasonally, there were highly significant differences in the TLI in spring, summer, autumn, and the annual means compared before and after the implementation of eco-engineering (p < 0.01).

3.2. Changes in the Plankton Community

3.2.1. Species Composition, Abundance, and Biomass of Plankton

Totally, 177 phytoplankton species belonging to seven phyla were identified in the FNWP, including 21 species of Cyanobacteria, 99 species of Chlorophyta, 36 species of Bacillariophyta, and 21 species of other algae. A total of 50 metazooplankton species belonging to three categories were identified, including 10 species of cladocerans, 3 species of copepods, and 37 species of rotifers.
“Abundance” refers to the amount of plankton per unit volume. The seasonal variations in phytoplankton and zooplankton abundance and biomass before and after eco-engineering are shown in Figure 3. Phytoplankton abundance (PPA) showed no difference (p > 0.05) before and after eco-engineering, but the spring and annual mean phytoplankton biomass (PPB) significantly increased (p < 0.01) after the implementation of the eco-engineering project. After the eco-engineering implementation, both metazooplankton abundance (MZA) and metazooplankton biomass (MZB) decreased (p < 0.01), except for spring biomass. This indicates an enhanced fluctuation in the metazooplankton community after eco-engineering, maybe due to a combination of phytoplankton and water quality.
In this study, “relative abundance” refers to the sum of the abundances of all species in a genus as a percentage of the total abundance. Of all algae phyla, in comparison to the significantly increased 10.67% proportion of Bacillariophyta abundance (T = 5.353, p < 0.01), the relative abundance of Chlorophyta showed no statistical difference (T = 0.914, p > 0.05), while the relative abundances of Cyanobacteria (T = 4.46, p < 0.01) and other phyla were significantly decreased by 8.67% and 4.33%, respectively (T = 2.874, p < 0.05) (Figure S2).

3.2.2. Plankton Diversity

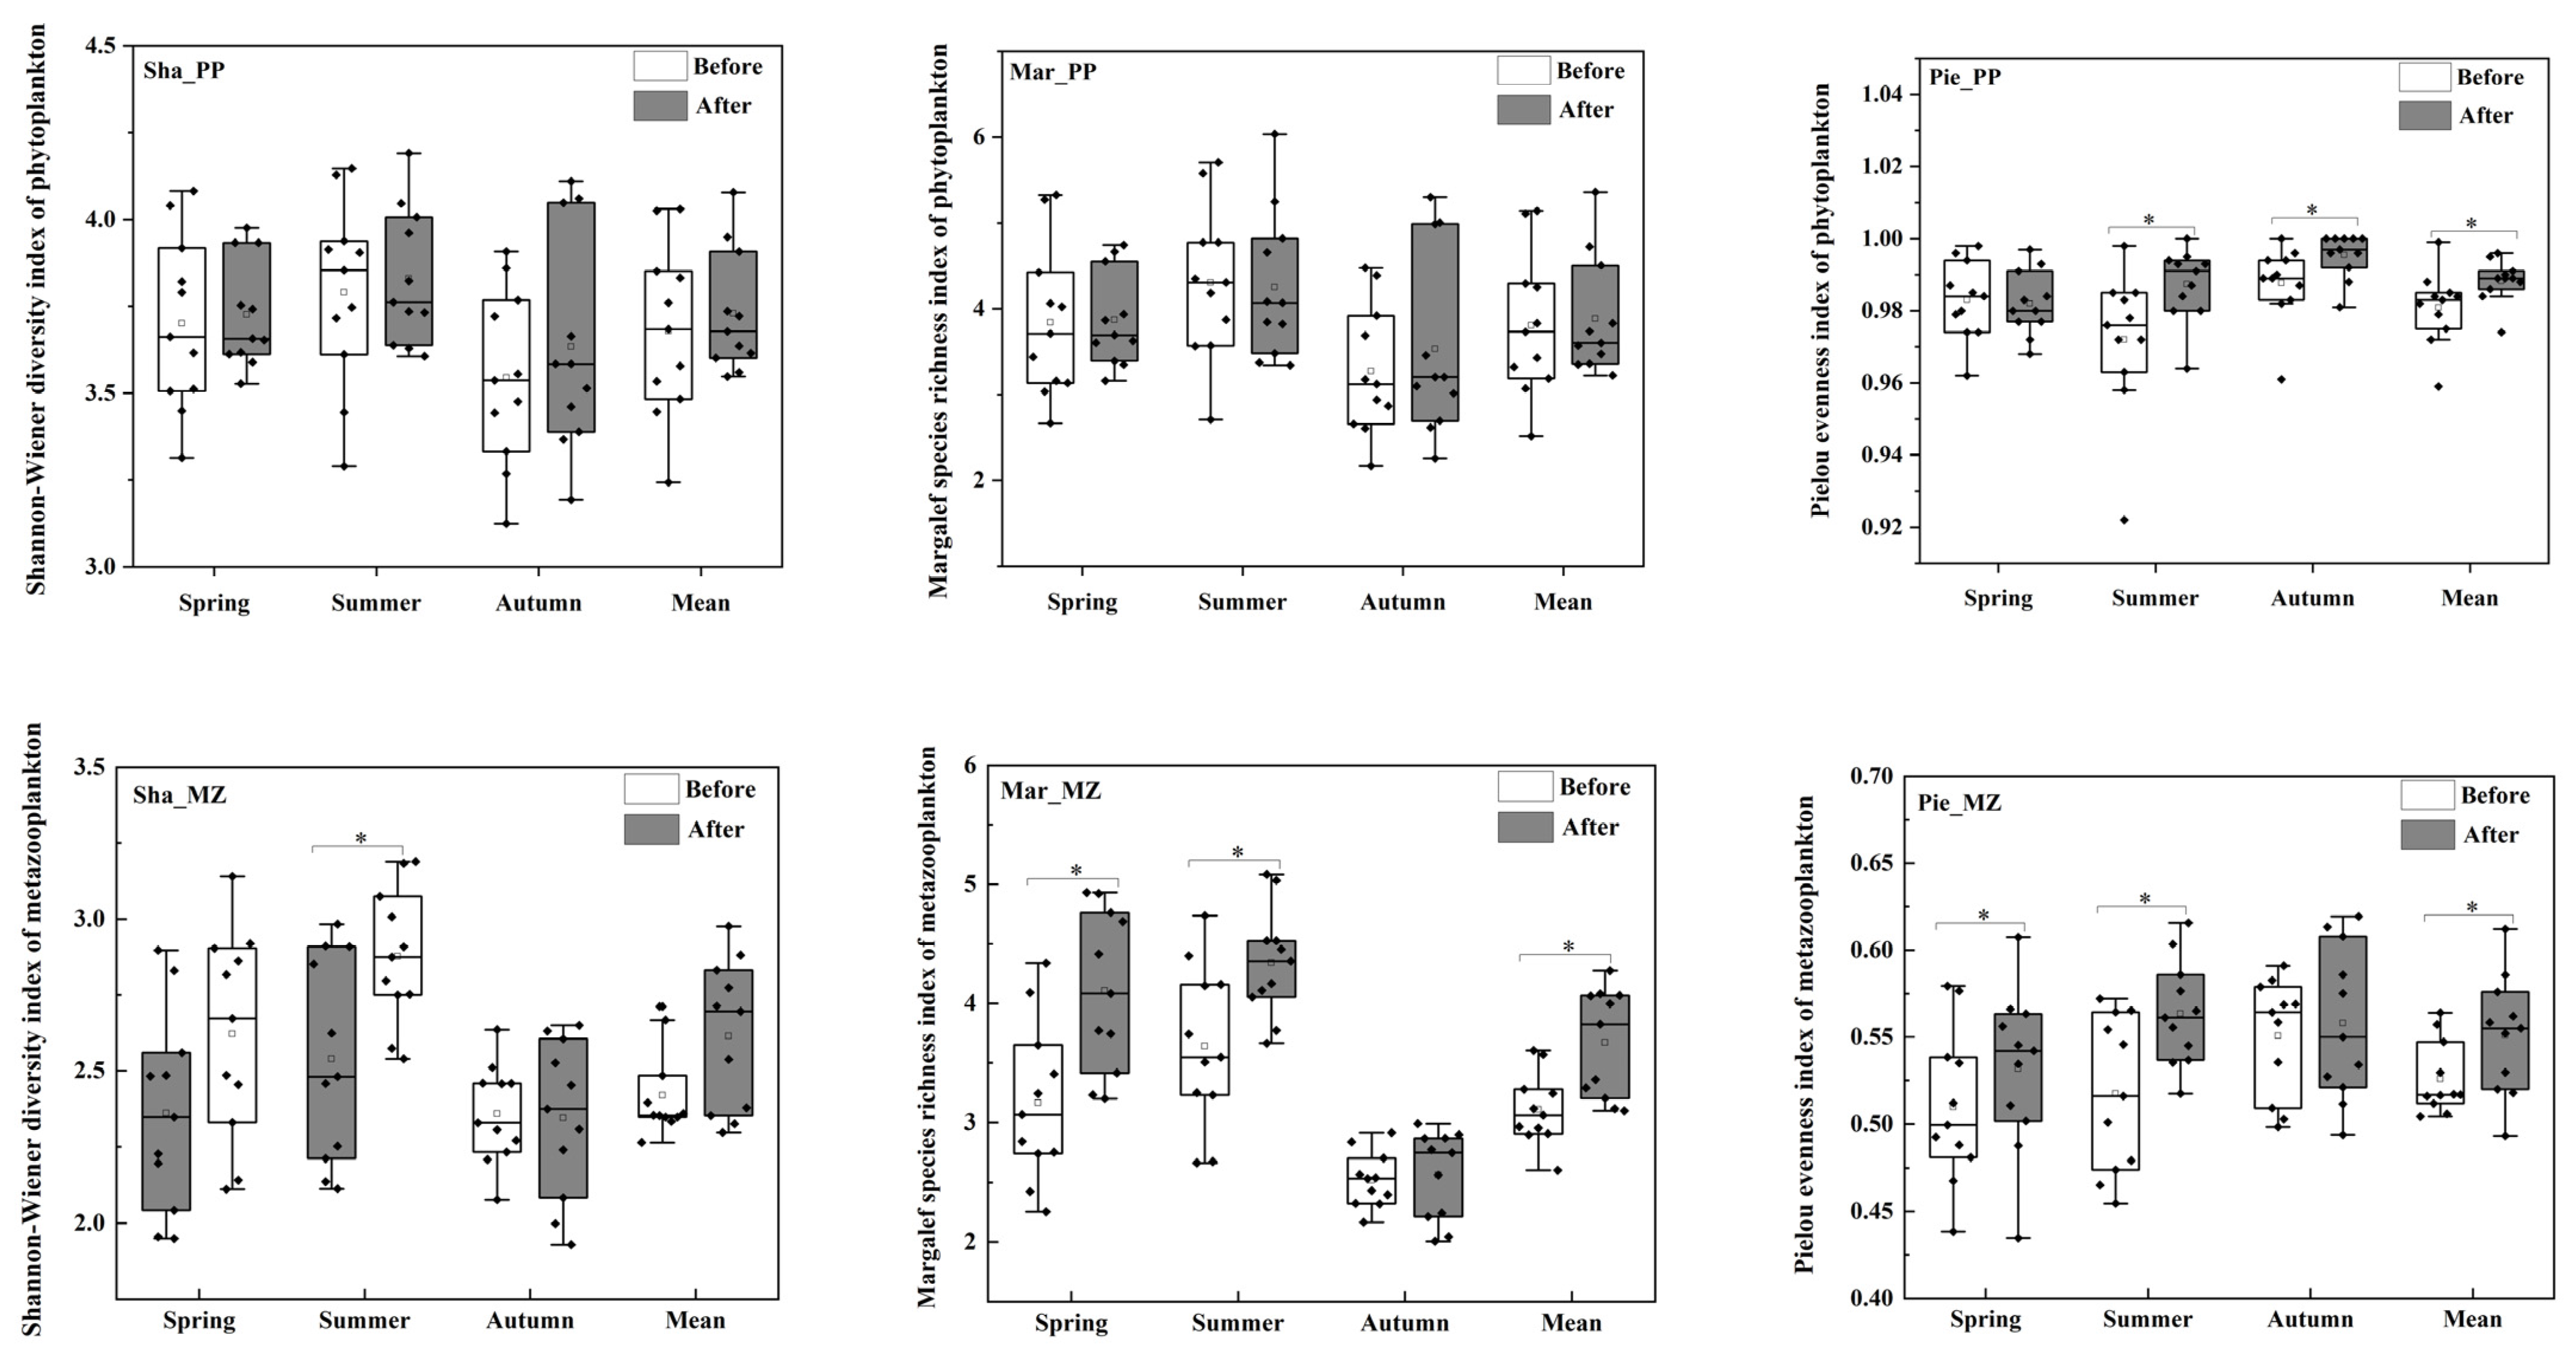
The Shannon–Wiener diversity index (Sha_PP) and Margalef species richness index (Mar_PP) of the phytoplankton before and after eco-engineering showed no statistical difference (p > 0.05), while the Pielou evenness index (Pie_PP) increased significantly (p < 0.05) after the eco-engineering implementation compared to that before the project (Figure 4).
In comparison, the Shannon–Wiener diversity index (Sha_MZ), Margalef species richness index (Mar_MZ), and Pielou evenness index (Pie_MZ) of the metazooplankton were significantly increased (p < 0.05) after eco-engineering.

3.2.3. Dominant Species

“Dominance” is an expression of a species’ superiority or inferiority in the overall community. The dominant species of phytoplankton (PP) and metazooplankton (MZ) and their dominance are shown in Table 1. A total of 18 dominant phytoplankton species belonging to Cyanobacteria, Bacillariophyta, Chlorophyta, and Chrysophyta was identified. Meanwhile, six dominant species of metazooplankton were observed, including cladocerans, copepods, and rotifers.
It is noteworthy that the dominant phytoplankton species greatly varied after eco-engineering. Before eco-engineering, the dominant species in the FNWP were mainly Cyanobacteria and Bacillariophyta. By contrast, after the eco-engineering project was adopted, the dominant species changed to Bacillariophyta and Chlorophyta, and Cyanobacteria dominance was significantly decreased (p < 0.01), but the proportion of rotifers in the dominant metazooplankton species increased.

3.3. Relationships between Plankton Community and Environmental Factors

3.3.1. Non-Metric Multidimensional Scale Analysis (NMDS)

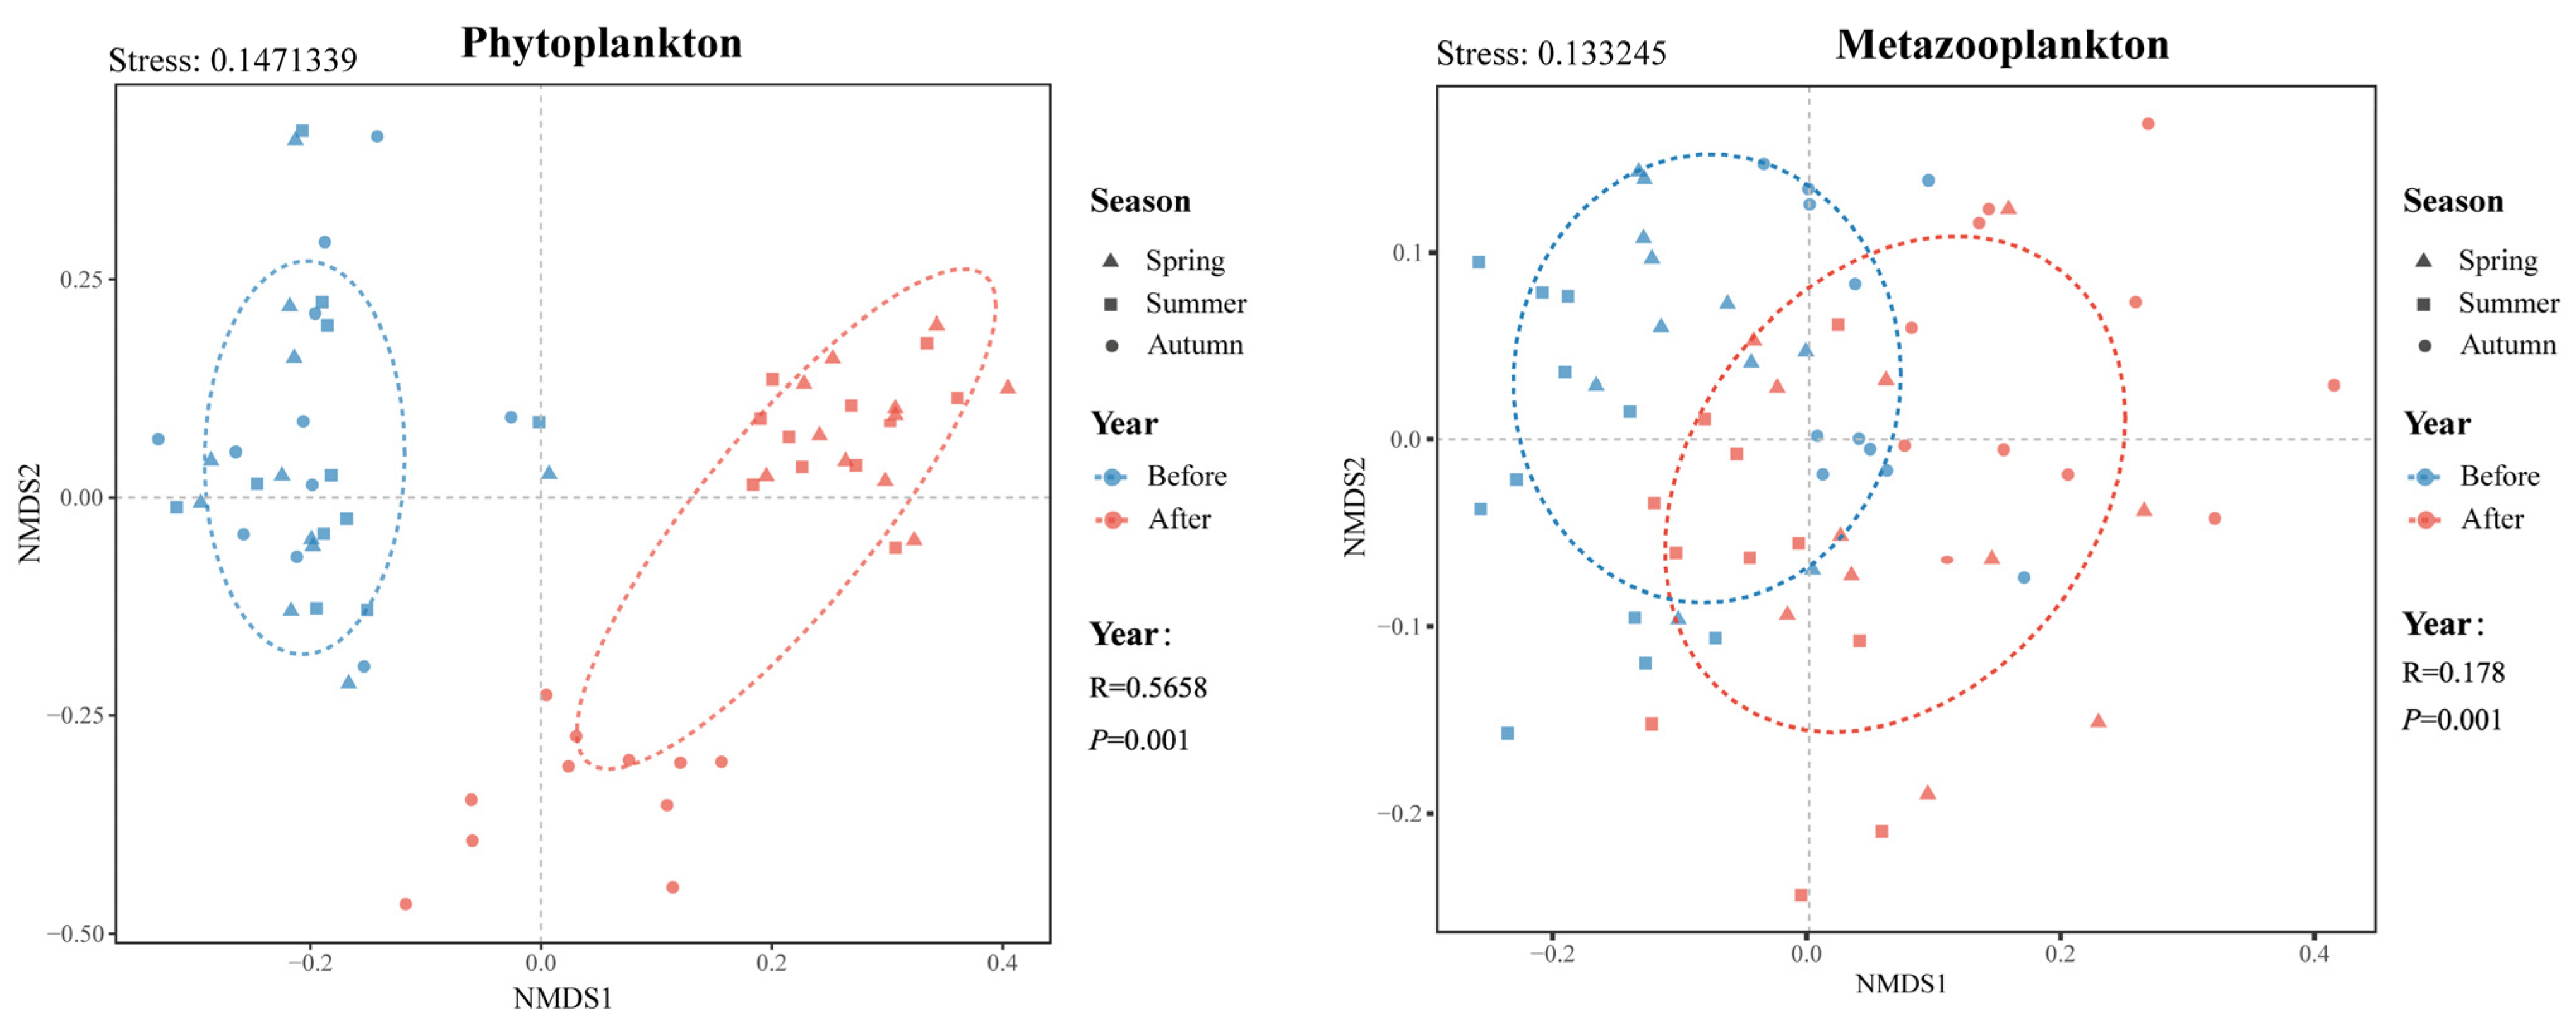
The phytoplankton and metazooplankton communities before and after eco-engineering were analyzed at multidimensional scales using NMDS ranking maps (Figure 5). There were significant differences in the phytoplankton (R = 0.57, p < 0.01) and metazooplankton (R = 0.18, p < 0.01) community structures before and after eco-engineering. Additionally, plankton communities between the different seasons also showed significant differences (p < 0.05). This indicates that the wetland eco-engineering project had a strong effect not only on the plankton community structure, but also on the seasonal plankton community structure in the FNWP.

3.3.2. Structural Equation Modeling of Planktonic Biomass and Environmental Factors

Structural equation modeling (SEM) was conducted to further quantify the interspecific relationship and differential effects of environmental factors on phytoplankton (Figure 6). SEM explained 41% of the PPB variation and 18% of the Shan_PP variation before eco-engineering (Figure 6a). PPB was subjected to a significant direct positive effect of TP and a significant direct negative effect of TN. Moreover, the Shan_PP was subject to a significant direct negative effect of DO.
By contrast, SEM explained 51% of the PPB variation and 27% of the Shan_PP variation after eco-engineering (Figure 6b). The direct effect of the environment parameters on PPB and Shan_PP was undermined after the eco-engineering implementation, but the effect of the metazooplankton was notably enhanced. Moreover, MZB was enhanced by the direct effect of the environmental factors.
In terms of the standard total effects (direct and indirect effects) (Figure 6c,d), the total effects of the MZB and Shan_MZ diversity indices on PPB and Shan_PP were significantly enhanced after the eco-engineering implementation.

3.3.3. Ecological Network Analysis of the Plankton Community

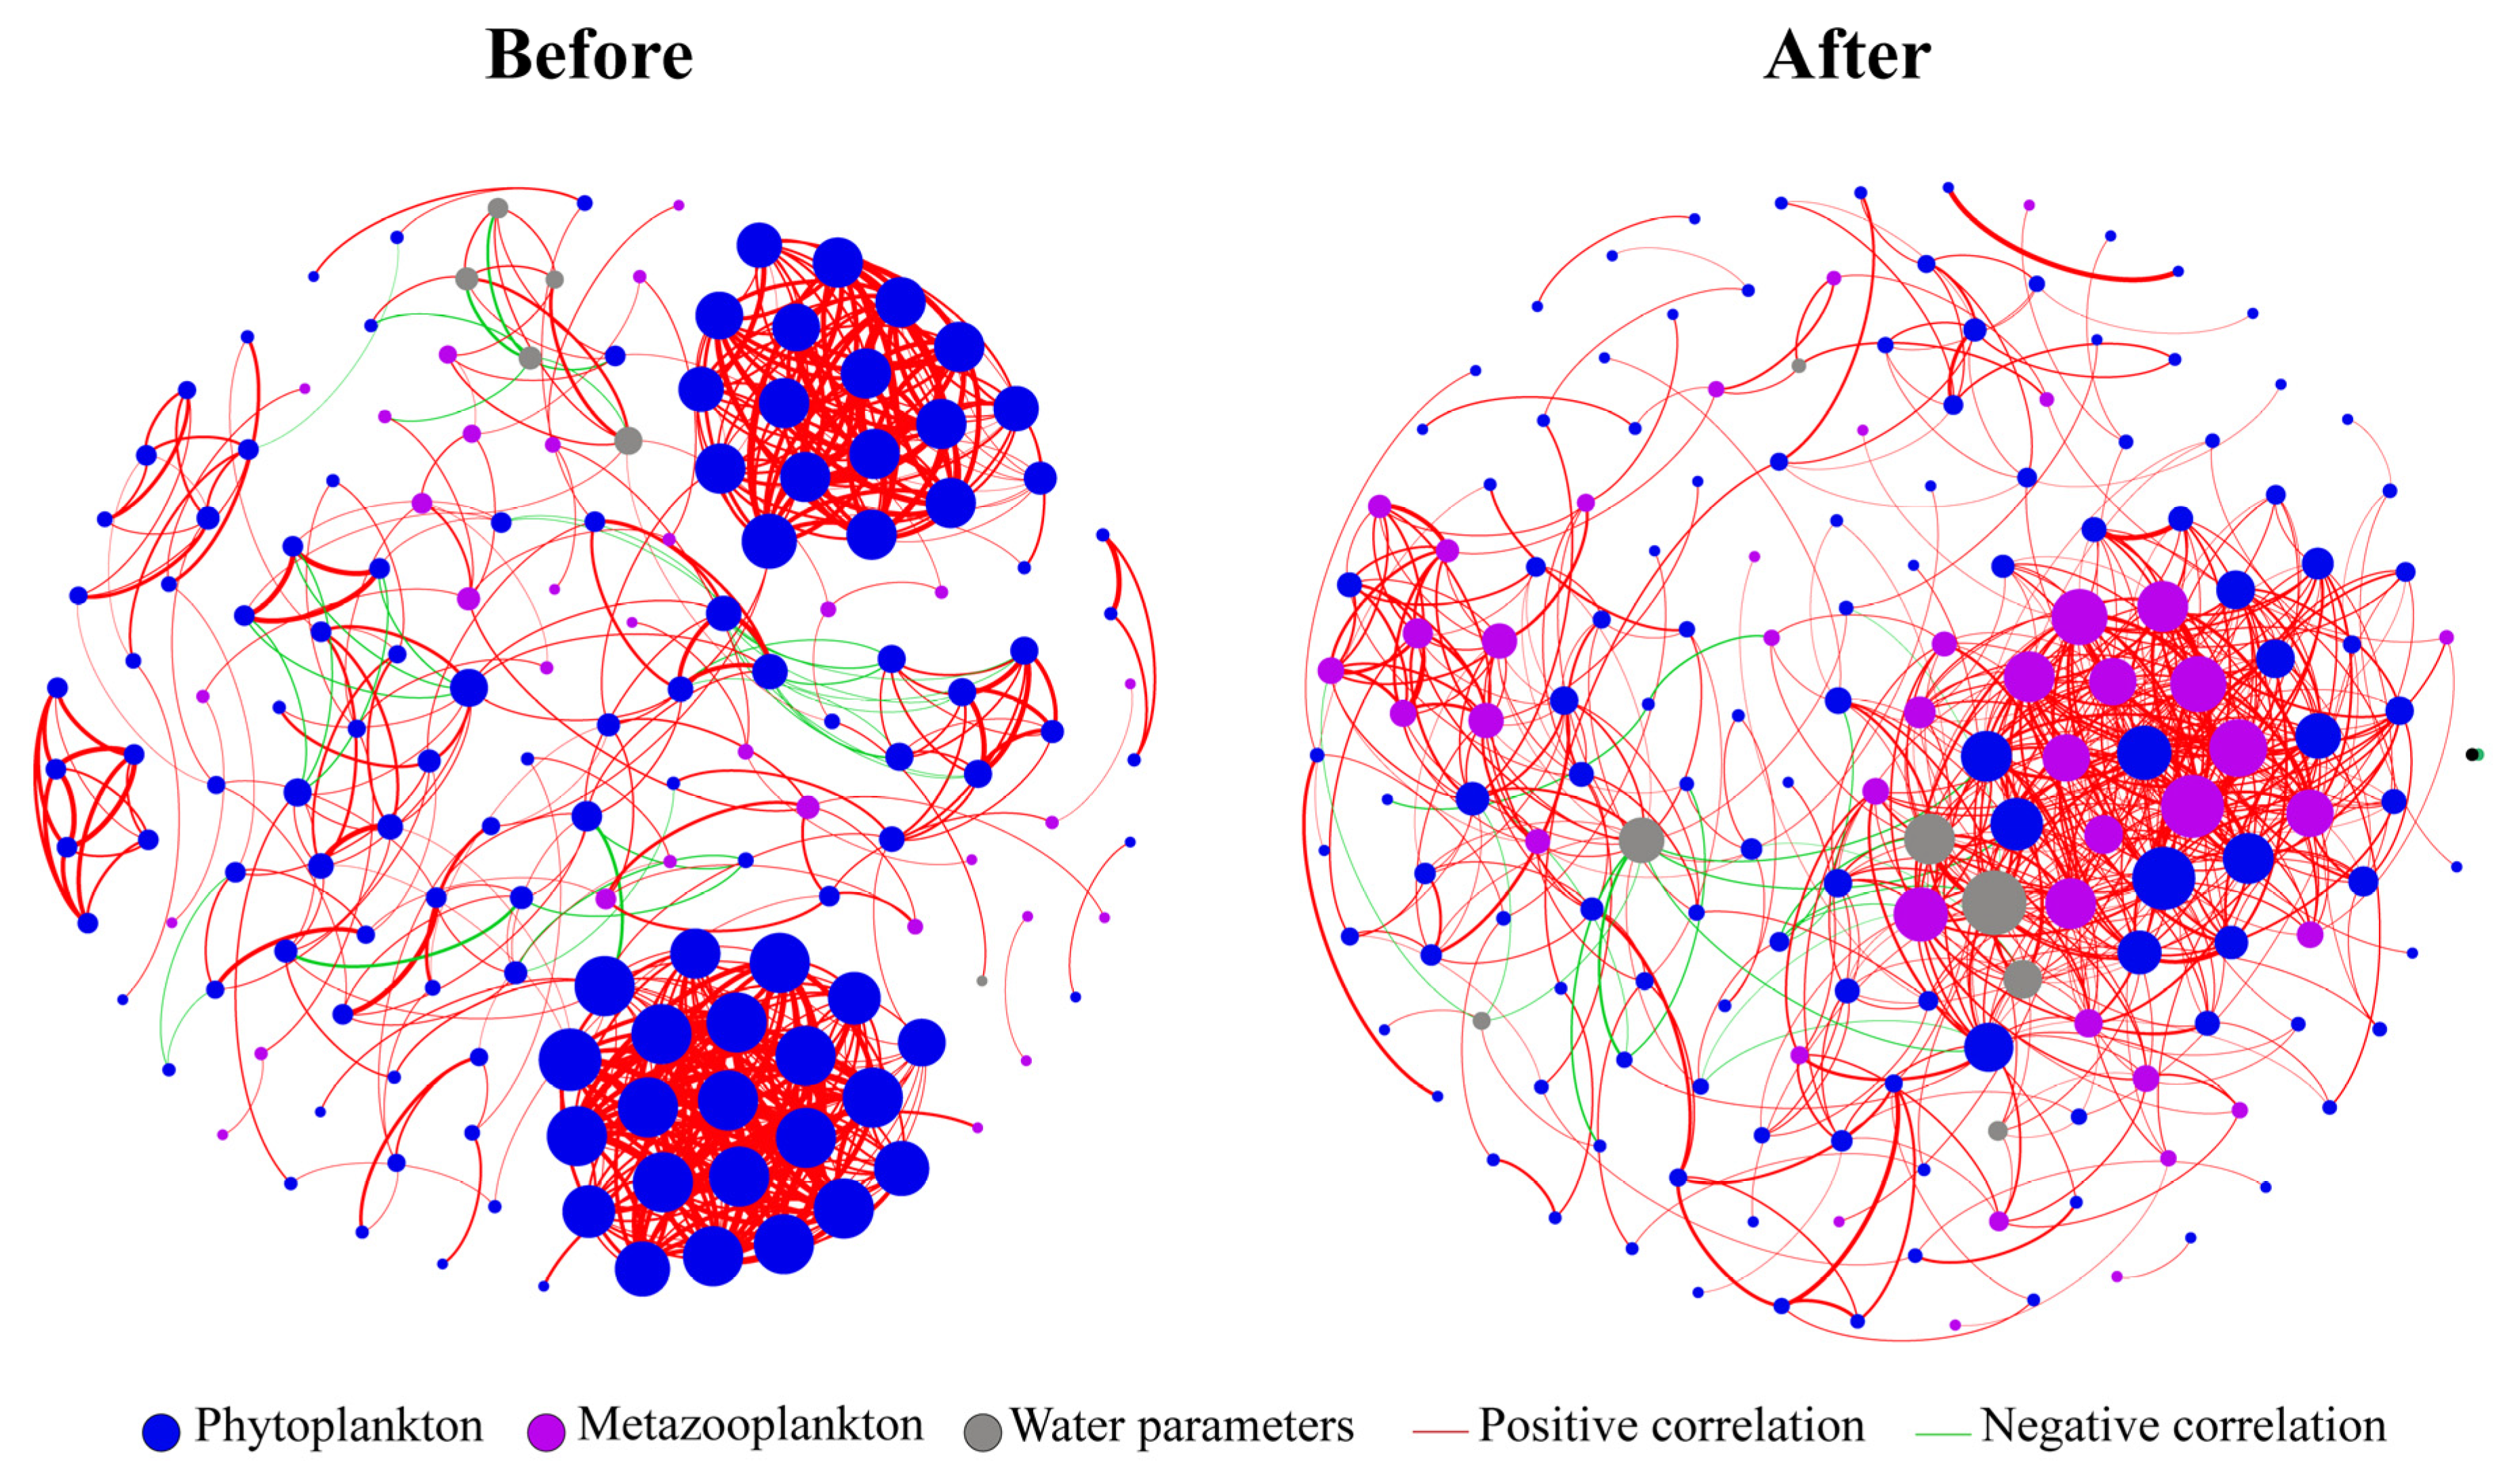
An ecological network diagram was constructed to determine the overall effect of the eco-engineering project on the plankton community (Figure 7). The aggregation coefficient after the eco-engineering network (0.445) was smaller than that before the eco-engineering implementation (0.606), and the network density (0.046) was also slightly smaller than that before the eco-engineering implementation (0.048). This indicates that the plankton communities were closely connected either before eco-engineering or after eco-engineering.
The network relationships among phytoplankton, metazooplankton, and the environmental factors are shown in Table S3. We noticed that edges linking PP to PP (%) decreased from 89.48% to 32.33%, edges linking MZ to MZ (%) increased from 4.17% to 19.81%, and edges linking PP to MZ (%) increased from 2.84% to 31.54% after eco-engineering. The environmental factors were strongly linked to phytoplankton and metazooplankton after the eco-engineering implementation, increasing to 9.03% and 6.50%, respectively.

4. Discussion

4.1. Effect of Eco-Engineering Implementation on Wetland Trophic Status

In general, indicators for assessing eutrophication in water bodies can be simply divided into two main categories. The first category is physicochemical indicators, such as nitrogen and phosphorus, which are commonly considered as limiting factors for phytoplankton growth [36]. Meanwhile, TN and TP are considered as important indicators for eutrophication assessment [37]. In this study, TN and TP concentrations were significantly decreased, and the eutrophication status was largely improved after the eco-engineering project. In fact, TN concentrations before eco-engineering were dramatically fluctuating, and the average TN concentration in autumn was even worse than the standard for Class V water quality, which may be influenced by the seasonal pattern of drainage from upstream agricultural activities [9]. The regulation of wetland water sources via the eco-engineering project may play an important role in water quality improvement, judging from the apparent decrease in nutrients. The second category is biological indicators, such as chlorophyll a concentrations (Chl-a) [38], which characterize the relative biomass of phytoplankton. A previous study has found that the combined operation involving water transfer and lake sluice works exhibited an improving effect on the water quality in Chaohu Lake and help to decrease the Chl-a concentration in the whole lake [39]. In this study, the Chl-a concentration was remarkably reduced by 66% after the eco-engineering project, and the water quality was accordingly improved from Class III to Class II.
Additionally, TN, TP, SD, CODMn, and Chl-a are also widely used as water quality indicators in the eutrophication assessment of wetlands [40]. In this study, we calculated the TLI based on these five indicators and found that the trophic status in the FNWP was significantly improved after the eco-engineering implementation, even better than the best water quality in previous years [41]. This is because, before the project, the farmland drainage through the ditch flowed directly into the park. The wetland ecological project built a sedimentation pool and treated the wetland in the southwest area of the park, which greatly reduced the amount of sediments and nutrients entering the park. Meanwhile, the amount of farmland water entering the wetland can also be properly controlled through the gate. In comparison, similar findings were found in the water transfer project in Taihu Lake, where significant improvements in water quality related to indicators such as TN, TP and Chl-a concentrations were observed [42]. These provided a credible evidence that the use of gates and dams for water source regulation is beneficial for water quality improvement in wetlands.

4.2. Pattern of Plankton Community Structure Variation before and after Eco-Engineering

Based on the NMDS result, we found that wetland eco-engineering had a strong effect on the community structure of the phytoplankton and metazooplankton in the FNWP. This is mainly due to changes in the water environmental conditions that have a strong impact on plankton [43]. For example, nitrogen and phosphorus are often identified as limited nutrients for primary productivity because they are vital materials for cell composition and life activities [44]. We did find that the PPA increased after the eco-engineering project implementation, although it did not change significantly, associated with the significantly decreased percentage of Cyanobacteria abundance (p < 0.01) and the significantly increased percentage of Bacillariophyta abundance (p < 0.01). Moreover, the dominant phytoplankton species changed from Cyanobacteria to Bacillariophyta after eco-engineering, may due to the overall decrease in nutrients in the water of the FNWP as a result of the declining agricultural nonpoint pollution after the project [45]. However, compared to the general case that increased TN promotes phytoplankton growth, there was a significant negative effect of TN on phytoplankton biomass before the eco-engineering implementation; in other words, phytoplankton biomass increased with the decrease in the TN concentration. This may due to the fact that excessive nitrogen promotes Cyanobacteria dominance [46], but the individual biomass of Cyanobacteria is relatively low and Bacillariophyta is extremely high, and thus TN shows a negative effect on the total biomass in our study.
In wetland ecosystems, in general, the high number of phytoplankton species, low abundance, high diversity index, and low dominance of dominant species indicate a quite stable phytoplankton community structure [37,45]. Therefore, in terms of species composition and richness and dominant species, the community structures were stabilized with the extension of the restoration time. In terms of diversity indices, Pie_PP increased significantly after eco-engineering, and all three diversity indices of metazooplankton increased, which can also add an evidence of the stabilization of the metazooplankton community. Previous studies have shown that Shan_PP and Mar_PP can effectively reflect information such as water quality and bioturbation in aquatic ecosystems [47], and attention to their changes during wetland restoration is necessary. However, in this study, Shan_PP and Mar_PP increased slightly but not significantly, maybe due to the disturbance of some metazooplankton during the construction of the eco-engineering project. It is possible that Shan_PP and Mar_PP were also influenced by changes in the dominant species of metazooplankton and their feeding preferences [48].
In addition, phytoplankton communities of the Cyanobacteria–Chlorophyta type are characteristic of waters with higher trophic levels [49]. In particular, Cyanobacteria include many species that can release toxic and harmful substances during algae bloom outbreaks [50], while Bacillariophyta is characteristic of water bodies with relatively low nutrient levels [51]. In this study, we found the increase in the proportion of Bacillariophyta abundance led to low Cyanophyta/Bacillariophyta ratios in the FNWP after eco-engineering. Therefore, it can be inferred from the abundance ratio of the different phytoplankton phyla that the water quality was improved after the project was adopted.

4.3. Effect of Wetland Eco-Engineering on Planktonic Interactions

Phytoplankton are primary producers in wetland ecosystems, and their abundances are influenced by their consumers, metazooplankton and fish that feed on them [52,53]. We found that the total effect of metazooplankton on phytoplankton was significantly enhanced after eco-engineering. In addition, the results of the network analysis show that, before the eco-engineering project, the network of phytoplankton itself was strongly connected, but not for metazooplankton nor for zooplankton and phytoplankton. By contrast, after eco-engineering, phytoplankton and metazooplankton were strongly connected. The interactions between strong (metazooplankton) and weak (phytoplankton) organisms are essential for stabilizing biological communities [54]. In fact, the network of interactions within communities is considered to be an index that contains more information than species diversity [18]. Similar to other indices, this network is affected by environmental changes [18,55], as demonstrated in our study. The lower trophic levels after eco-engineering in this study provided considerable possibilities for different biologies to interact [56]. It is widely accepted that the increased complexity of plankton, the behavior of competition, and symbiosis contribute to higher community stability in mixed interaction types [57,58,59]. Furthermore, a tight network and strong links between competitors can increase the efficiency of resources’ transformation [60]. Therefore, the close connection between phytoplankton and metazooplankton in this study may have a positive impact on ecosystem functioning and facilitate ecosystem resistance to community disturbance by an extreme environment. Therefore, the effect of environmental factors on phytoplankton was greater than that of metazooplankton before the eco-engineering project, and the effect of metazooplankton on phytoplankton was enhanced after the eco-engineering project. That is to say, after eco-engineering, the phytoplankton was controlled by a combination of “bottom-up” and “top-down” controls. Therefore, in order to improve the stability of the plankton community and reduce the risk of algae bloom, environmental factors and high trophic level organisms should be adjusted simultaneously.

5. Conclusions

The wetland ecological engineering project has significantly improved the water quality in the FNWP and reduced the average TLI from 55.2 to 46.7. Comprehensive changes in the composition, abundance, diversity, and dominant species of phytoplankton showed that the phytoplankton community is dominated by diatoms and the community structure tends to be stable with the extension of the restoration time. The total effect of metazooplankton on phytoplankton was significantly enhanced because of the eco-engineering implementation. The interaction between phytoplankton and metazooplankton was also enhanced after eco-engineering (from 2.84% to 31.54%). In conclusion, the eco-engineering implementation led to a shift from “bottom-up” control to a combination of the “bottom-up” and “top-down” control of phytoplankton. Our findings improve the understanding of the effects of eco-engineering on the interactions between water quality and organisms and provide a scientific basis for sustainable wetland ecosystem management.

Supplementary Materials

The following supporting information can be downloaded at: https://www.mdpi.com/article/10.3390/w16131821/s1. Figure S1: Structural equation model of the initial model structure; Figure S2: Changes in the relative abundance and the parameters of paired-samples t-test of different phytoplankton phyla before and after eco-engineering; Table S1: Trophic level index (TLI) based on Carlson (1977); Table S2: Environmental variables summarized as means ± standard error before and after the wetland eco-engineering project in the FNWP; Table S3: Topological indices of each network in Figure 7.

Author Contributions

X.T.: Concept, methodology, research, software, and writing—original draft and editing. L.Q.: Data management, visualization, and writing—original draft. Y.Z.: Methodology, investigation, and editing. H.Y.: Visualization and funding acquisition. Y.L.: Resources. Y.Y.: Data curation, funding acquisition, and editing. M.J.: Visualization, funding acquisition, and writing—review and editing. All authors have read and agreed to the published version of the manuscript.

Funding

This research was financially supported by the National Key Research and Development Program of China (2022YFF1300900), Strategic Priority Research Program of the Chinese Academy of Sciences (XDA28100103), National Natural Science Foundation of China (42230516; 42101071; 42001112; 42171107), and the Department of Science and Technology of Jilin Province (20230508089RC).

Data Availability Statement

The data presented in this study are available in the article and Supplementary Materials.

Conflicts of Interest

The authors declare no conflicts of interest.

References

  1. Schuerch, M.; Spencer, T.; Temmerman, S.; Kirwan, M.L.; Wolff, C.; Lincke, D.; McOwen, C.J.; Pickering, M.D.; Reef, R.; Vafeidis, A.T.; et al. Future response of global coastal wetlands to sea-level rise. Nature 2018, 561, 231–234. [Google Scholar] [CrossRef] [PubMed]
  2. Gopal, B. Should ‘wetlands’ cover all aquatic ecosystems and do macrophytes make a difference to their ecosystem services? Folia Geobot. 2016, 51, 209–226. [Google Scholar] [CrossRef]
  3. Fluet-Chouinard, E.; Stocker, B.D.; Zhang, Z.; Malhotra, A.; Melton, J.R.; Poulter, B.; Kaplan, J.O.; Goldewijk, K.K.; Siebert, S.; Minayeva, T.; et al. Extensive global wetland loss over the past three centuries. Nature 2023, 614, 281–286. [Google Scholar] [CrossRef] [PubMed]
  4. Liu, X.; Xiong, Z.; Ouyang, L.; He, G.; Liu, W.; Cai, M. Macrohabitat and microhabitat mediate the relationships between wetland multifaceted biodiversity and multifunctionality. Catena 2024, 241, 108023. [Google Scholar] [CrossRef]
  5. Chen, Y.Y.; Lu, X.G. Wetland function and research direction of wetland science. Wetl. Sci. 2003, 1, 7–11. (In Chinese) [Google Scholar] [CrossRef]
  6. Jiang, Y.-J.; He, W.; Liu, W.-X.; Qin, N.; Ouyang, H.-L.; Wang, Q.-M.; Kong, X.-Z.; He, Q.-S.; Yang, C.; Yang, B.; et al. The seasonal and spatial variations of phytoplankton community and their correlation with environmental factors in a large eutrophic Chinese lake (Lake Chaohu). Ecol. Indic. 2014, 40, 58–67. [Google Scholar] [CrossRef]
  7. Zhang, J.; Yang, K.; Cheng, Y.; Li, J.; Lu, W. Investigation of Dominant Populations of Late-summer Phytoplankton and Comprehensive Nutritional Evaluation of Water Quality in Bailang Lake. Agric. Sci. Technol. 2013, 14, 453–457. [Google Scholar] [CrossRef]
  8. Jiang, Y.; Wang, Y.; Huang, Z.; Zheng, B.; Wen, Y.; Liu, G. Investigation of phytoplankton community structure and formation mechanism: A case study of Lake Longhu in Jinjiang. Front. Microbiol. 2023, 14, 1267299. [Google Scholar] [CrossRef]
  9. Xu, R.; Cai, Y.; Wang, X.; Li, C.; Liu, Q.; Yang, Z. Agricultural nitrogen flow in a reservoir watershed and its implications for water pollution mitigation. J. Clean. Prod. 2020, 267, 122034. [Google Scholar] [CrossRef]
  10. Beaver, J.R.; Miller-Lemke, A.M.; Acton, J.K. Midsummer zooplankton assemblages in four types of wetlands in the Upper Midwest, USA. Hydrobiologia 1998, 380, 209–220. [Google Scholar] [CrossRef]
  11. Nielsen, D.L.; Smith, D.; Petrie, R. Resting egg banks can facilitate recovery of zooplankton communities after extended exposure to saline conditions. Freshw. Biol. 2012, 57, 1306–1314. [Google Scholar] [CrossRef]
  12. Gerhard, M.; Koussoroplis, A.M.; Hillebrand, H.; Striebel, M. Phytoplankton community responses to temperature fluctuations under different nutrient concentrations and stoichiometry. Ecology 2019, 100, e02834. [Google Scholar] [CrossRef]
  13. Zhang, S.; Xu, H.; Zhang, Y.; Li, Y.; Wei, J.; Pei, H. Variation of phytoplankton communities and their driving factors along a disturbed temperate river-to-sea ecosystem. Ecol. Indic. 2020, 118, 106776. [Google Scholar] [CrossRef]
  14. Tian, W.; Zhang, H.; Zhao, L.; Zhang, F.; Huang, H. Phytoplankton Diversity Effects on Community Biomass and Stability along Nutrient Gradients in a Eutrophic Lake. Int. J. Environ. Res. Public Health 2017, 14, 95. [Google Scholar] [CrossRef] [PubMed]
  15. Chen, M.; Gao, H.; Zhang, J. Mycoloop: Modeling phytoplankton–chytrid–zooplankton interactions in aquatic food webs. Math. Biosci. 2024, 368, 109134. [Google Scholar] [CrossRef] [PubMed]
  16. Severiano, J.d.S.; Almeida-Melo, V.L.d.S.; Bittencourt-Oliveira, M.D.C.; Chia, M.A.; Moura, A.D.N. Effects of increased zooplankton biomass on phytoplankton and cyanotoxins: A tropical mesocosm study. Harmful Algae 2018, 71, 10–18. [Google Scholar] [CrossRef] [PubMed]
  17. Gusha, M.N.; Dalu, T.; Wasserman, R.J.; McQuaid, C.D. Zooplankton grazing pressure is insufficient for primary producer control under elevated warming and nutrient levels. Sci. Total. Environ. 2019, 651, 410–418. [Google Scholar] [CrossRef]
  18. Yang, Y.; Gao, Y.; Chen, Y.; Li, S.; Zhan, A. Interactome-based abiotic and biotic impacts on biodiversity of plankton communities in disturbed wetlands. Divers. Distrib. 2019, 25, 1416–1428. [Google Scholar] [CrossRef]
  19. Song, J.; Hou, C.; Liu, Q.; Wu, X.; Wang, Y.; Yi, Y. Spatial and temporal variations in the plankton community because of water and sediment regulation in the lower reaches of Yellow River. J. Clean. Prod. 2020, 261, 120972. [Google Scholar] [CrossRef]
  20. Li, C.; Feng, W.; Chen, H.; Li, X.; Song, F.; Guo, W.; Giesy, J.P.; Sun, F. Temporal variation in zooplankton and phytoplankton community species composition and the affecting factors in Lake Taihu—A large freshwater lake in China. Environ. Pollut. 2019, 245, 1050–1057. [Google Scholar] [CrossRef]
  21. GB3838-2002; Surface water environmental quality Standard. China Environmental Science Press: Beijing, China, 2002.
  22. Carlson, R.E. A trophic state index for lakes. Limnol. Oceanogr. 1977, 22, 361–369. [Google Scholar] [CrossRef]
  23. Aizaki, M. Application of Modified Carlson’s Trophic State Index to Japanese Lakes and Its Relationships to Other Parameters Related to Trophic State; National Institute of Environmental Study: Tsukuba, Japan, 1981; pp. 13–31. [Google Scholar]
  24. Wang, J.; Fu, Z.; Qiao, H.; Liu, F. Assessment of eutrophication and water quality in the estuarine area of Lake Wuli, Lake Taihu, China. Sci. Total. Environ. 2019, 650, 1392–1402. [Google Scholar] [CrossRef] [PubMed]
  25. Wang, M.C.; Liu, X.Q.; Zhang, J.H. Evaluate method and classification standard on lake eutrophicatio. Environ. Monit. China 2002, 18, 47–49. [Google Scholar] [CrossRef]
  26. Shen, Y.F.; Gu, M.R.; Feng, W.S. Micro-biological monitoring of water pollution. Life Sci. 1997, 1997, 81–85. (In Chinese) [Google Scholar]
  27. Wang, J.J. Freshwater Rotifers of China; Science Press: Beijing, China, 1961; pp. 1–343. [Google Scholar]
  28. Jiang, X.Z.; Du, N.S. Zoography of China, Arthropods, Crustaceans, Freshwater Cladoceras; Science Press: Beijing, China, 1979. [Google Scholar]
  29. Zhou, F.X.; Chen, J.H. Freshwater Microbiomes and Benthos; Chemical Industry Press: Beijing, China, 2011. [Google Scholar]
  30. Shannon, E.; Weaver, W. The Mathematical Theory of Communication; University Illinois Press: London, UK, 1949; pp. 296–297. [Google Scholar]
  31. Margalef, R. Information theory in ecology. Gensyst 1958, 3, 36–71. [Google Scholar]
  32. Pielou, C. An Introduction to Mathematical Ecology; Wiley Interscience: New York, NY, USA, 1969. [Google Scholar]
  33. Lampitt, R.S.; Wishner, K.F.; Turley, C.M.; Angel, M.V. Marine snow studies in the Northeast Atlantic Ocean: Distribution, composition and role as a food source for migrating plankton. Mar. Biol. 1993, 116, 689–702. [Google Scholar] [CrossRef]
  34. Jiao, S.; Liu, Z.; Lin, Y.; Yang, J.; Chen, W.; Wei, G. Bacterial communities in oil contaminated soils: Biogeography and co-occurrence patterns. Soil Biol. Biochem. 2016, 98, 64–73. [Google Scholar] [CrossRef]
  35. Bastian, M.; Heymann, S.; Jacomy, M. Gephi: An open source software for exploring and manipulating networks. Icwsm 2009, 8, 361–362. [Google Scholar] [CrossRef]
  36. Albarico, F.P.J.B.; Lim, Y.C.; Chen, C.-W.; Chen, C.-F.; Wang, M.-H.; Dong, C.-D. Linking seasonal plankton succession and cellular trace metal dynamics in marine assemblages. Sci. Total. Environ. 2024, 907, 167805. [Google Scholar] [CrossRef] [PubMed]
  37. Chao, C.; Wang, L.; Li, Y.; Yan, Z.; Liu, H.; Yu, D.; Liu, C. Response of sediment and water microbial communities to submerged vegetations restoration in a shallow eutrophic lake. Sci. Total. Environ. 2021, 801, 149701. [Google Scholar] [CrossRef]
  38. Chen, C.-C.; Meng, P.-J.; Hsieh, C.-H.; Jan, S. Plankton Community Respiration and Particulate Organic Carbon in the Kuroshio East of Taiwan. Plants 2022, 11, 2909. [Google Scholar] [CrossRef]
  39. Peng, Z.; Hu, W.; Zhang, Y.; Liu, G.; Zhang, H.; Gao, R. Modelling the effects of joint operations of water transfer project and lake sluice on circulation and water quality of a large shallow lake. J. Hydrol. 2020, 593, 125881. [Google Scholar] [CrossRef]
  40. Lucas, C.; Chalar, G.; Ibarguren, E.; Baeza, S.; De Giacomi, S.; Alvareda, E.; Brum, E.; Paradiso, M.; Mejía, P.; Crossa, M. Nutrient levels, trophic status and land-use influences on streams, rivers and lakes in a protected floodplain of Uruguay. Limnologica 2022, 94, 125966. [Google Scholar] [CrossRef]
  41. Li, N.; Tian, X.; Li, Y.; Fu, H.; Jia, X.; Jin, G.; Jiang, M. Seasonal and Spatial Variability of Water Quality and Nutrient Removal Efficiency of Restored Wetland: A Case Study in Fujin National Wetland Park, China. Chin. Geogr. Sci. 2018, 28, 1027–1037. [Google Scholar] [CrossRef]
  42. Hu, L.; Hu, W.; Zhai, S.; Wu, H. Effects on water quality following water transfer in Lake Taihu, China. Ecol. Eng. 2010, 36, 471–481. [Google Scholar] [CrossRef]
  43. Mai, S.; He, Y.; Li, W.; Zhao, T. Effects of environmental factors on vertical distribution of the eukaryotic plankton community in early summer in Danjiangkou Reservoir, China. Front. Ecol. Evol. 2023, 11, 1324932. [Google Scholar] [CrossRef]
  44. Lowery, C.M.; Bown, P.R.; Fraass, A.J.; Hull, P.M. Ecological Response of Plankton to Environmental Change: Thresholds for Extinction. Annu. Rev. Earth Planet. Sci. 2020, 48, 403–429. [Google Scholar] [CrossRef]
  45. Yang, C.; Nan, J.; Yu, H.; Li, J. Embedded reservoir and constructed wetland for drinking water source protection: Effects on nutrient removal and phytoplankton succession. J. Environ. Sci. 2020, 87, 260–271. [Google Scholar] [CrossRef] [PubMed]
  46. Ma, J.; Qin, B.; Paerl, H.W.; Brookes, J.D.; Hall, N.S.; Shi, K.; Zhou, Y.; Guo, J.; Li, Z.; Xu, H.; et al. The persistence of cyanobacterial (M icrocystis spp.) blooms throughout winter in Lake Taihu, China. Limnol. Oceanogr. 2016, 61, 711–722. [Google Scholar] [CrossRef]
  47. Xu, Y.; Li, A.J.; Qin, J.; Li, Q.; Ho, J.G.; Li, H. Seasonal patterns of water quality and phytoplankton dynamics in surface waters in Guangzhou and Foshan, China. Sci. Total. Environ. 2017, 590–591, 361–369. [Google Scholar] [CrossRef]
  48. Srichandan, S.; Baliarsingh, S.K.; Prakash, S.; Panigrahy, R.C.; Sahu, K.C. Zooplankton Research in Indian Seas: A Review. J. Ocean Univ. China 2018, 17, 1149–1158. [Google Scholar] [CrossRef]
  49. Ren, L.; Rabalais, N.N.; Turner, R.E. Effects of Mississippi River water on phytoplankton growth and composition in the upper Barataria estuary, Louisiana. Hydrobiologia 2020, 847, 1831–1850. [Google Scholar] [CrossRef]
  50. Pohnert, G.; Poulin, R.X.; Baumeister, T.U.H. The making of a plankton toxin. Science 2018, 361, 1308–1309. [Google Scholar] [CrossRef]
  51. Gu, P.; Jia, J.; Qi, D.; Gao, Q.; Zhang, C.; Yang, X.; Nie, M.; Liu, D.; Luo, Y. Response of phytoplankton composition to environmental stressors under humidification in three alpine lakes on the Qinghai-Tibet Plateau, China. Front. Microbiol. 2024, 15, 1370334. [Google Scholar] [CrossRef] [PubMed]
  52. Ersoy, Z.; Brucet, S.; Bartrons, M.; Mehner, T. Short-term fish predation destroys resilience of zooplankton communities and prevents recovery of phytoplankton control by zooplankton grazing. PLoS ONE 2019, 14, e0212351. [Google Scholar] [CrossRef] [PubMed]
  53. Carpenter, S.R.; Kitchell, J.F.; Hodgson, J.R. Cascading Trophic Interactions and Lake Productivity. BioScience 1985, 35, 634–639. [Google Scholar] [CrossRef]
  54. Carvalho, S.A.; Martins, M.L. Community structures in allelopathic interaction networks: An ecoevolutionary approach. Phys. Rev. E 2018, 102, 042305. [Google Scholar] [CrossRef] [PubMed]
  55. Wang, S.; Wang, X.; Han, X.; Deng, Y. Higher precipitation strengthens the microbial interactions in semi-arid grassland soils. Glob. Ecol. Biogeogr. 2018, 27, 570–580. [Google Scholar] [CrossRef]
  56. Steinberger, Y.; Zelles, L.; Bai, Q.Y.; von Lützow, M.; Munch, J.C. Phospholipid fatty acid profiles as indicators for the microbial community structure in soils along a climatic transect in the Judean Desert. Biol. Fertil. Soils 1999, 28, 292–300. [Google Scholar] [CrossRef]
  57. Moreno-Mateos, D.; Alberdi, A.; Morriën, E.; van der Putten, W.H.; Rodríguez-Uña, A.; Montoya, D. The long-term restoration of ecosystem complexity. Nat. Ecol. Evol. 2020, 4, 676–685. [Google Scholar] [CrossRef]
  58. Mougi, A.; Kondoh, M. Diversity of Interaction Types and Ecological Community Stability. Science 2012, 337, 349–351. [Google Scholar] [CrossRef] [PubMed]
  59. Ghoul, M.; Mitri, S. The Ecology and Evolution of Microbial Competition. Trends Microbiol. 2016, 24, 833–845. [Google Scholar] [CrossRef] [PubMed]
  60. Morriën, E.; Hannula, S.E.; Snoek, L.B.; Helmsing, N.R.; Zweers, H.; de Hollander, M.; Soto, R.L.; Bouffaud, M.-L.; Buée, M.; Dimmers, W.; et al. Soil networks become more connected and take up more carbon as nature restoration progresses. Nat. Commun. 2017, 8, 14349. [Google Scholar] [CrossRef] [PubMed]
Figure 1. (a). Location of sampling sites in the FNWP wetland park. (b). Partial construction sketch of wetland biodiversity conservation eco-engineering in the FNWP wetland park.
Water 16 01821 g001aWater 16 01821 g001b
Figure 2. Trophic level index (TLI) was significantly decreased after eco-engineering (p < 0.01) compared to that before eco-engineering. ** p < 0.01 (2-tailed).
Water 16 01821 g002
Figure 3. Plankton abundance and biomass before and after eco-engineering. * p < 0.05; ** p < 0.01 (2-tailed); PPA: phytoplankton abundance; PPB: phytoplankton biomass; MZA: metazooplankton abundance; MZB: metazooplankton biomass.
Water 16 01821 g003
Figure 4. Phytoplankton and zooplankton diversity index before and after eco-engineering. * p < 0.05 (2-tailed); Sha_PP: Shannon–Wiener diversity index; Mar_PP: Margalef species richness index; Pie_PP: Pielou evenness index; Sha_MZ: Shannon–Wiener diversity index; Mar_MZ: Margalef species richness index; Pie_MZ: Pielou evenness index.
Water 16 01821 g004
Figure 5. Non-metric multidimensional scale analysis of phytoplankton (left) and metazooplankton (right) in the FNWP. Sampling seasons were represented by different shapes, and sampling periods, which spanned years, are represented by blue (before eco-engineering, 2016) and red (after eco-engineering, 2018). p < 0.01 means that there were significant differences between different years, that is, between “before” and “after”.
Water 16 01821 g005
Figure 6. Structural equation model (SEM) revealing the effects of TP, TN, DO, pH, metazooplankton biomass, and the Pielou index of metazooplankton on phytoplankton biomass and Pielou index of phytoplankton before the wetland eco-engineering project (a) and after the wetland eco-engineering project (b). Continuous arrows and dashed arrows indicate significant and insignificant relationships, respectively. The width of the arrow is proportional to the path coefficient. Green and red arrows represent positive and negative correlations, respectively. r2 values imply the percentage of variance explained by each plankton indicator. *: p < 0.05, **: p < 0.01, ***: p < 0.001. Total effects are shown in (c) (before) and (d) (after). The parameters in the model indicate that our research results fit the hypothesized model.
Water 16 01821 g006
Figure 7. Network of co-occurring plankton and water parameters based on the correlation analysis. The sizes of nodes are proportional to planktonic abundances; the thicknesses of edges are proportional to the values of Spearman’s correlation coefficient. The color of the dots is determined by the plankton or water parameters, with blue for phytoplankton, purple for metazooplankton, and gray for water parameters. The color of the line is determined by a positive or negative correlation, with red for positive and green for negative.
Water 16 01821 g007
Table 1. Changes in the dominant phytoplankton and zooplankton species and their dominance in different seasons during different eco-engineering periods. PP: phytoplankton; MZ: metazooplankton.
BeforeAfter
PhylumSpeciesSpringSummerAutumnSpringSummerAutumn
PPCyanobacteriaM. marssonii0.0270.022////
M. aeruginosa//0.021///
C. minutus0.0200.0270.0250.020//
P. allorgei0.0210.029////
BacillariophytaS. amphicephala//0.023///
C. meneghiniana///0.024 /0.024
F. brevistriata0.022//0.020//
N. exigua///0.029/0.024
C. placentula0.027///0.031/
M. Granulata var. angustissima/0.029//0.022/
S. acusvar////0.0200.024
ChlorophytaS. platydiscus0.025/0.035///
A. acicularis///0.02//
C. vulgaris//////
S. gracile0.0250.0260.035//0.020
A. angustus////0.0290.020
ChrysophytaD. divergens0.0250.0260.035///
C. elegans////0.020 /
MZCladoceranB. longirostris/0.0300.034/0.0200.059
CopepodM. leuckarti//0.098//0.037
nauplius.sp0.0950.072/0.0750.0590.13
RotiferB. calyciflorus//0.0280.0210.0210.042
V. limax//0.0220.026/0.032
L. buna/////0.029
Disclaimer/Publisher’s Note: The statements, opinions and data contained in all publications are solely those of the individual author(s) and contributor(s) and not of MDPI and/or the editor(s). MDPI and/or the editor(s) disclaim responsibility for any injury to people or property resulting from any ideas, methods, instructions or products referred to in the content.