
Enhancing Ecological Security in Ili River Valley: Comprehensive Approach

Abstract
:1. Introduction
2. Materials and Methods
2.1. Study Area
2.2. Data Sources
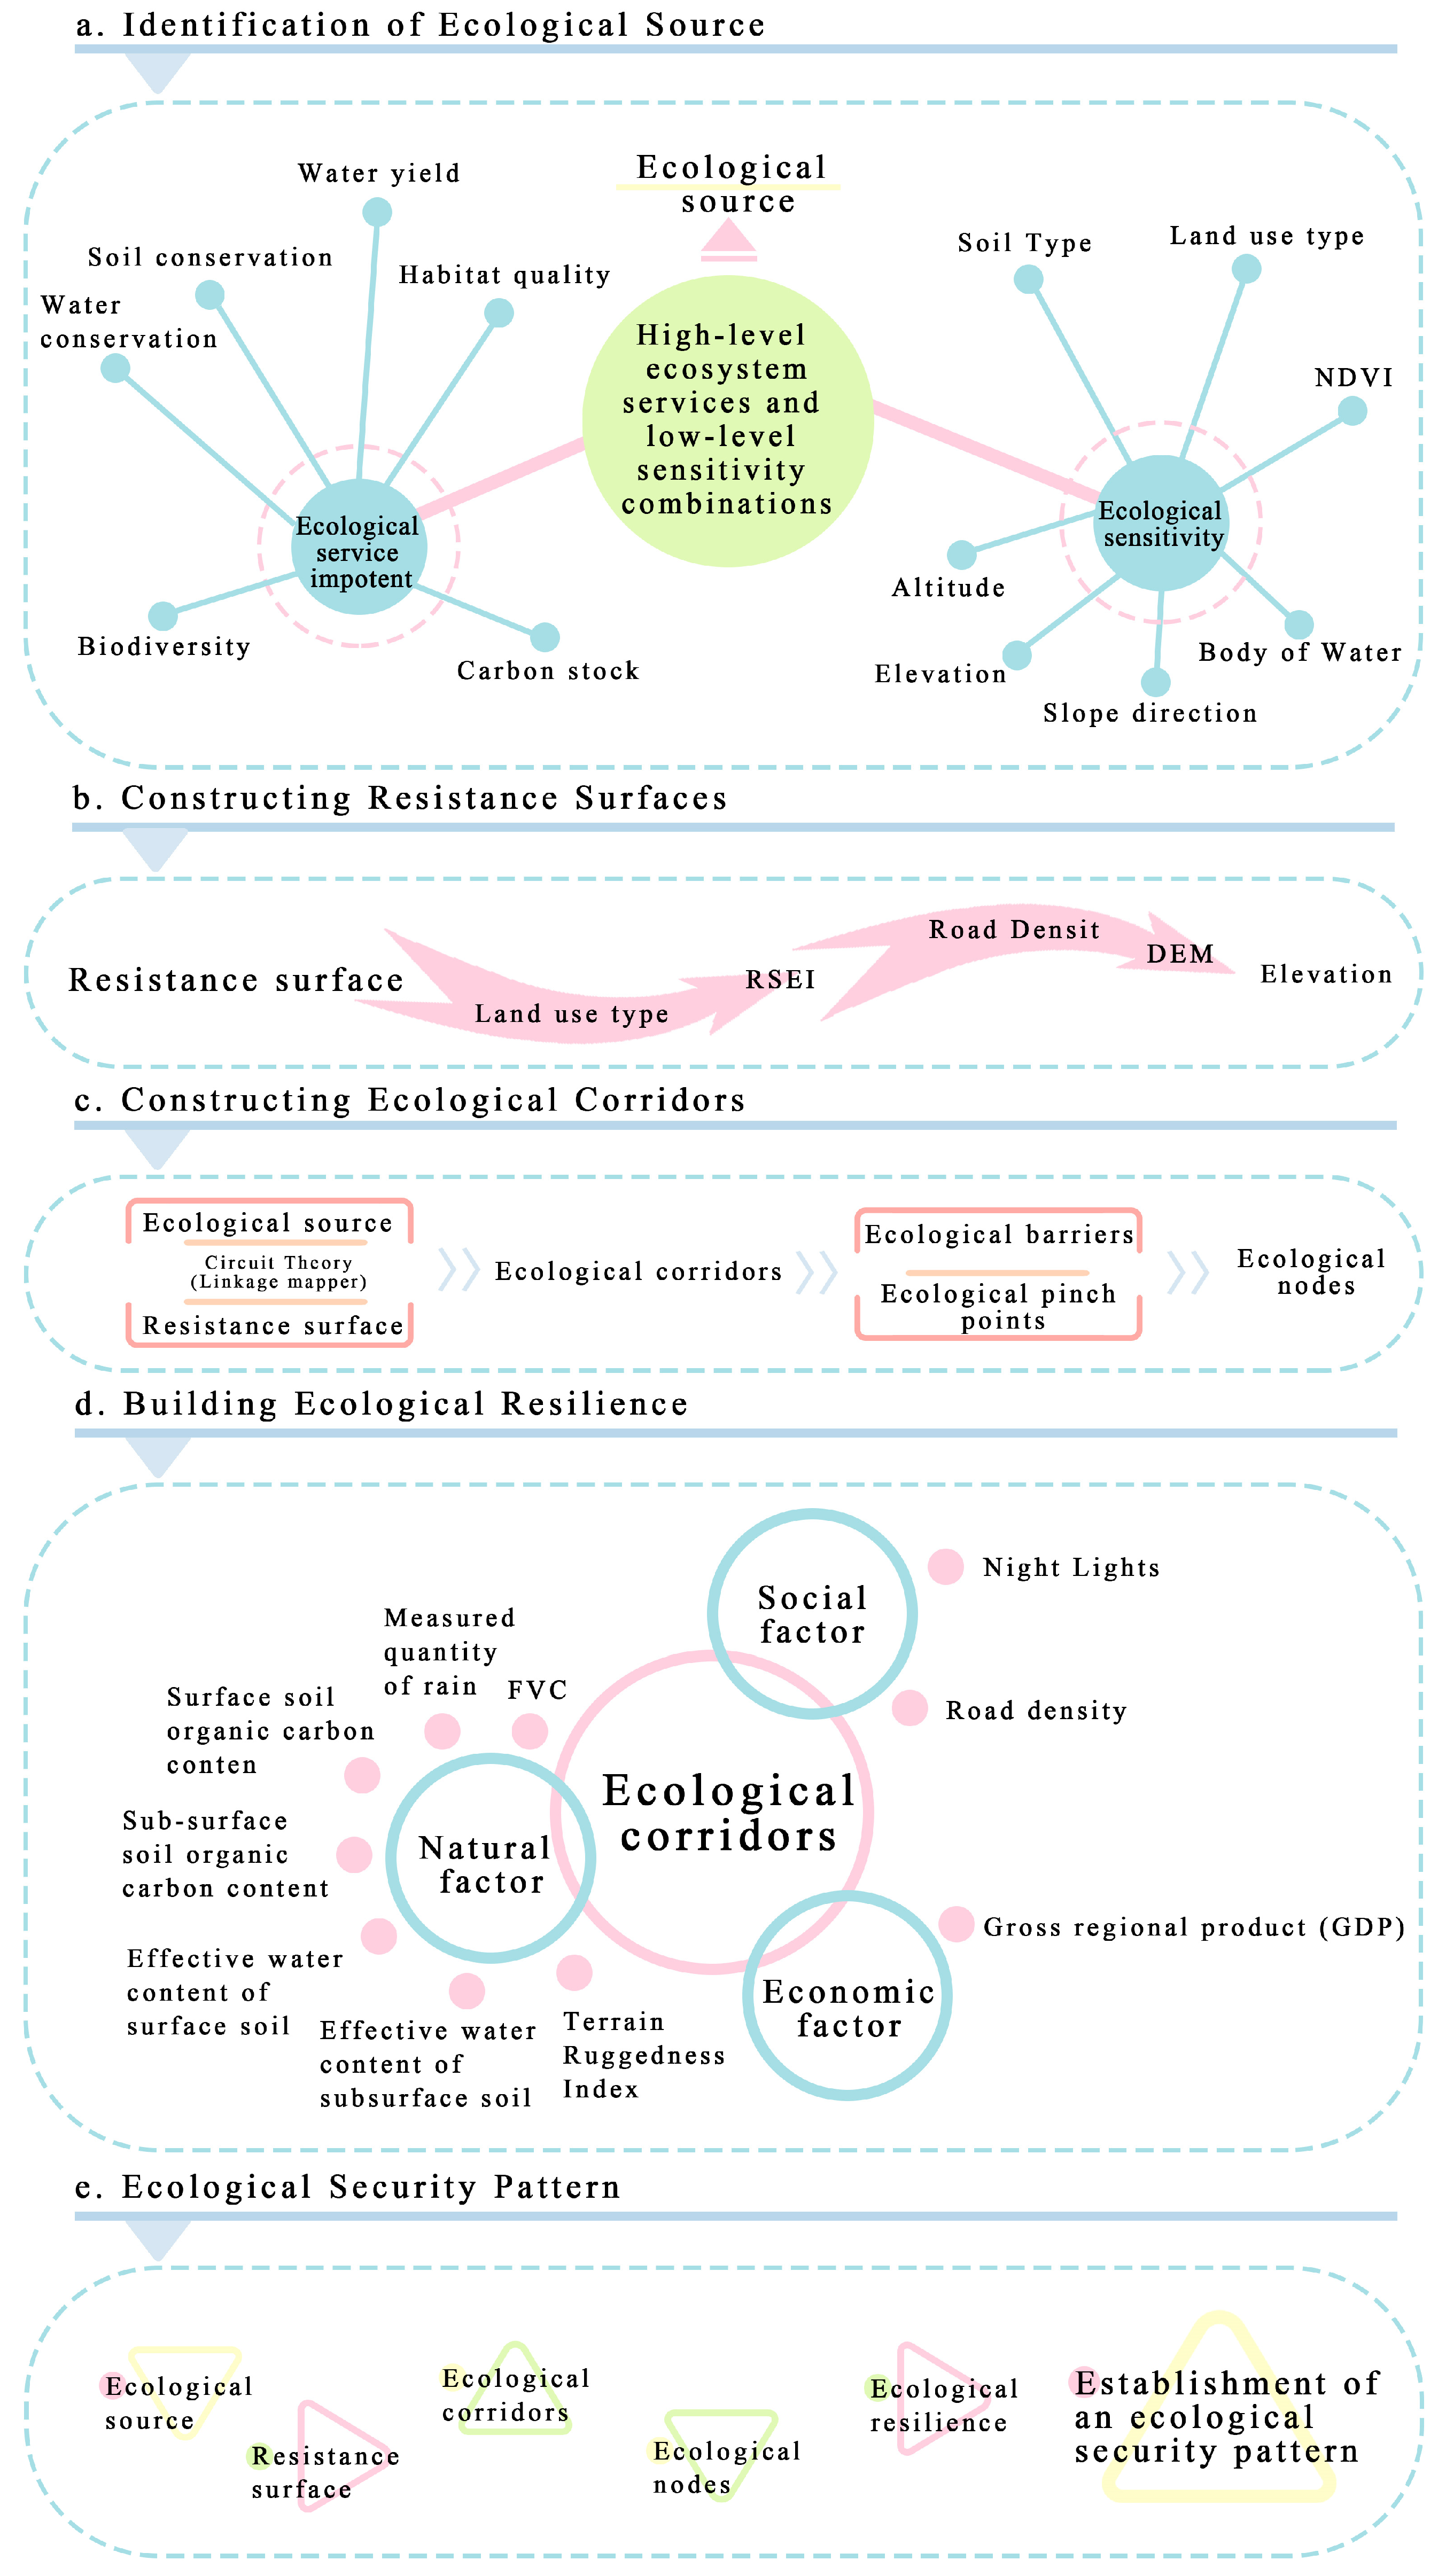
2.3. Methods
2.3.1. Identification of Ecological Source Areas
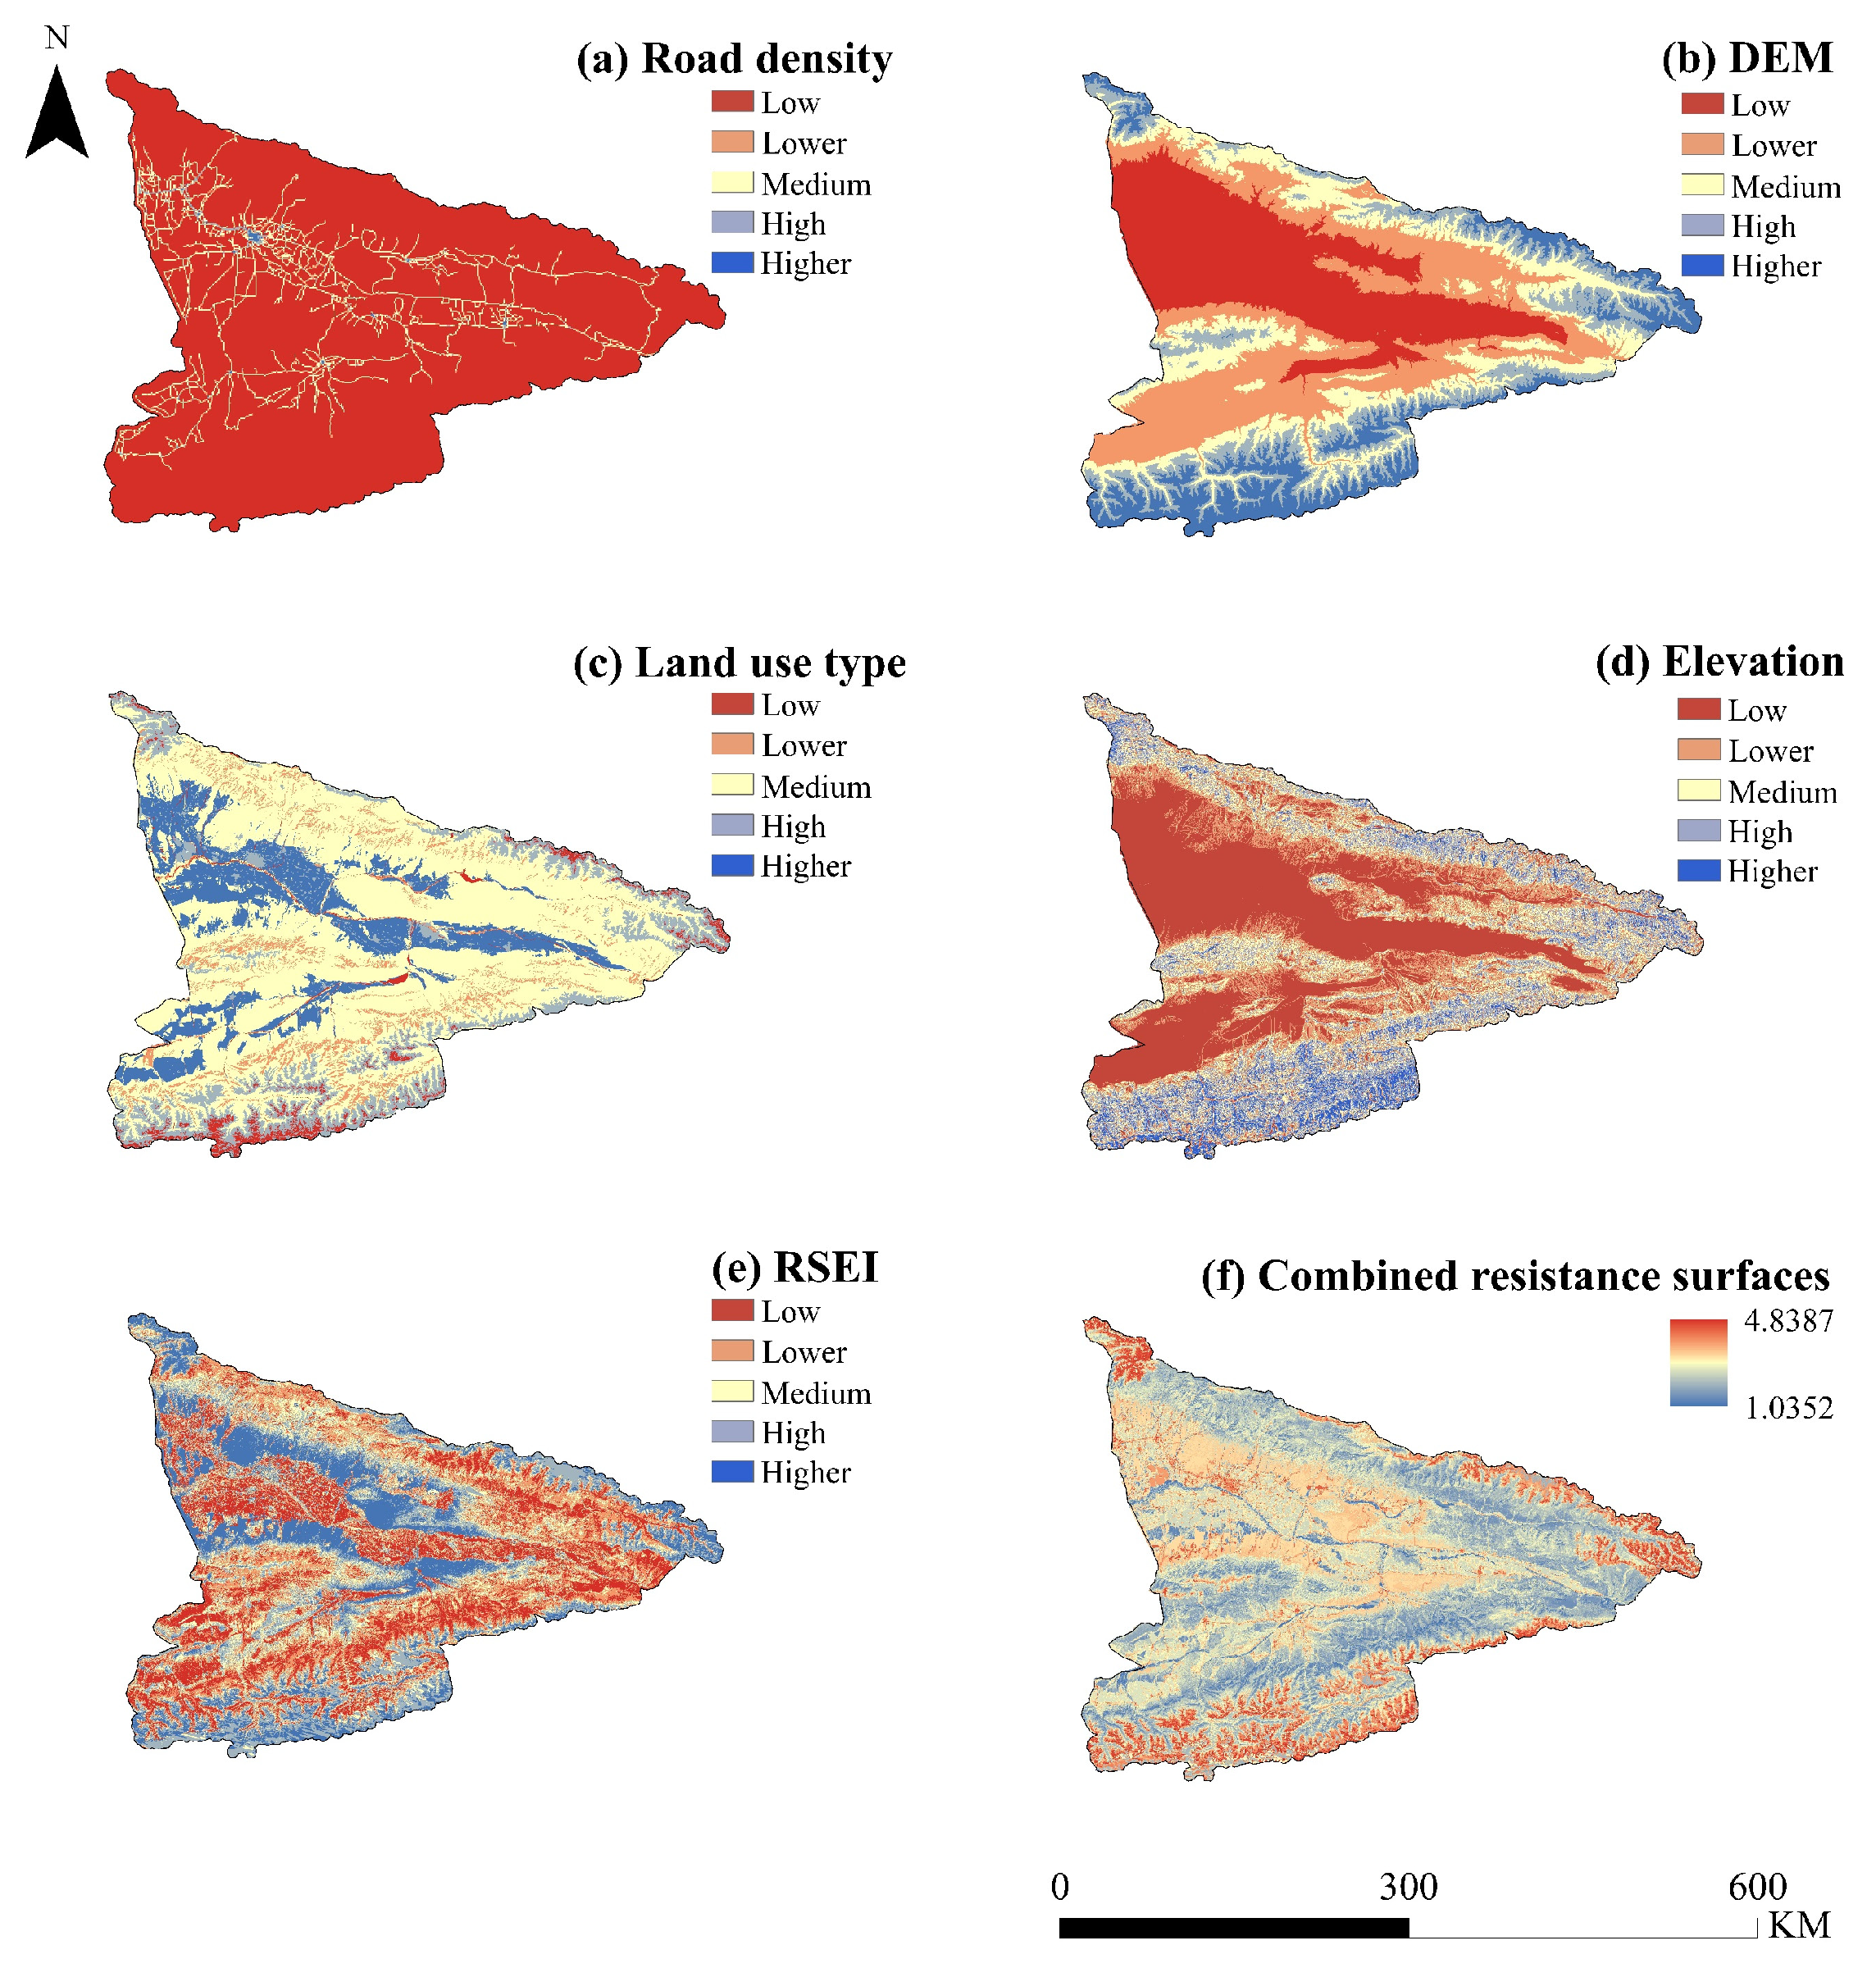
2.3.2. Construction of Resistance Surfaces, Corridor Identification
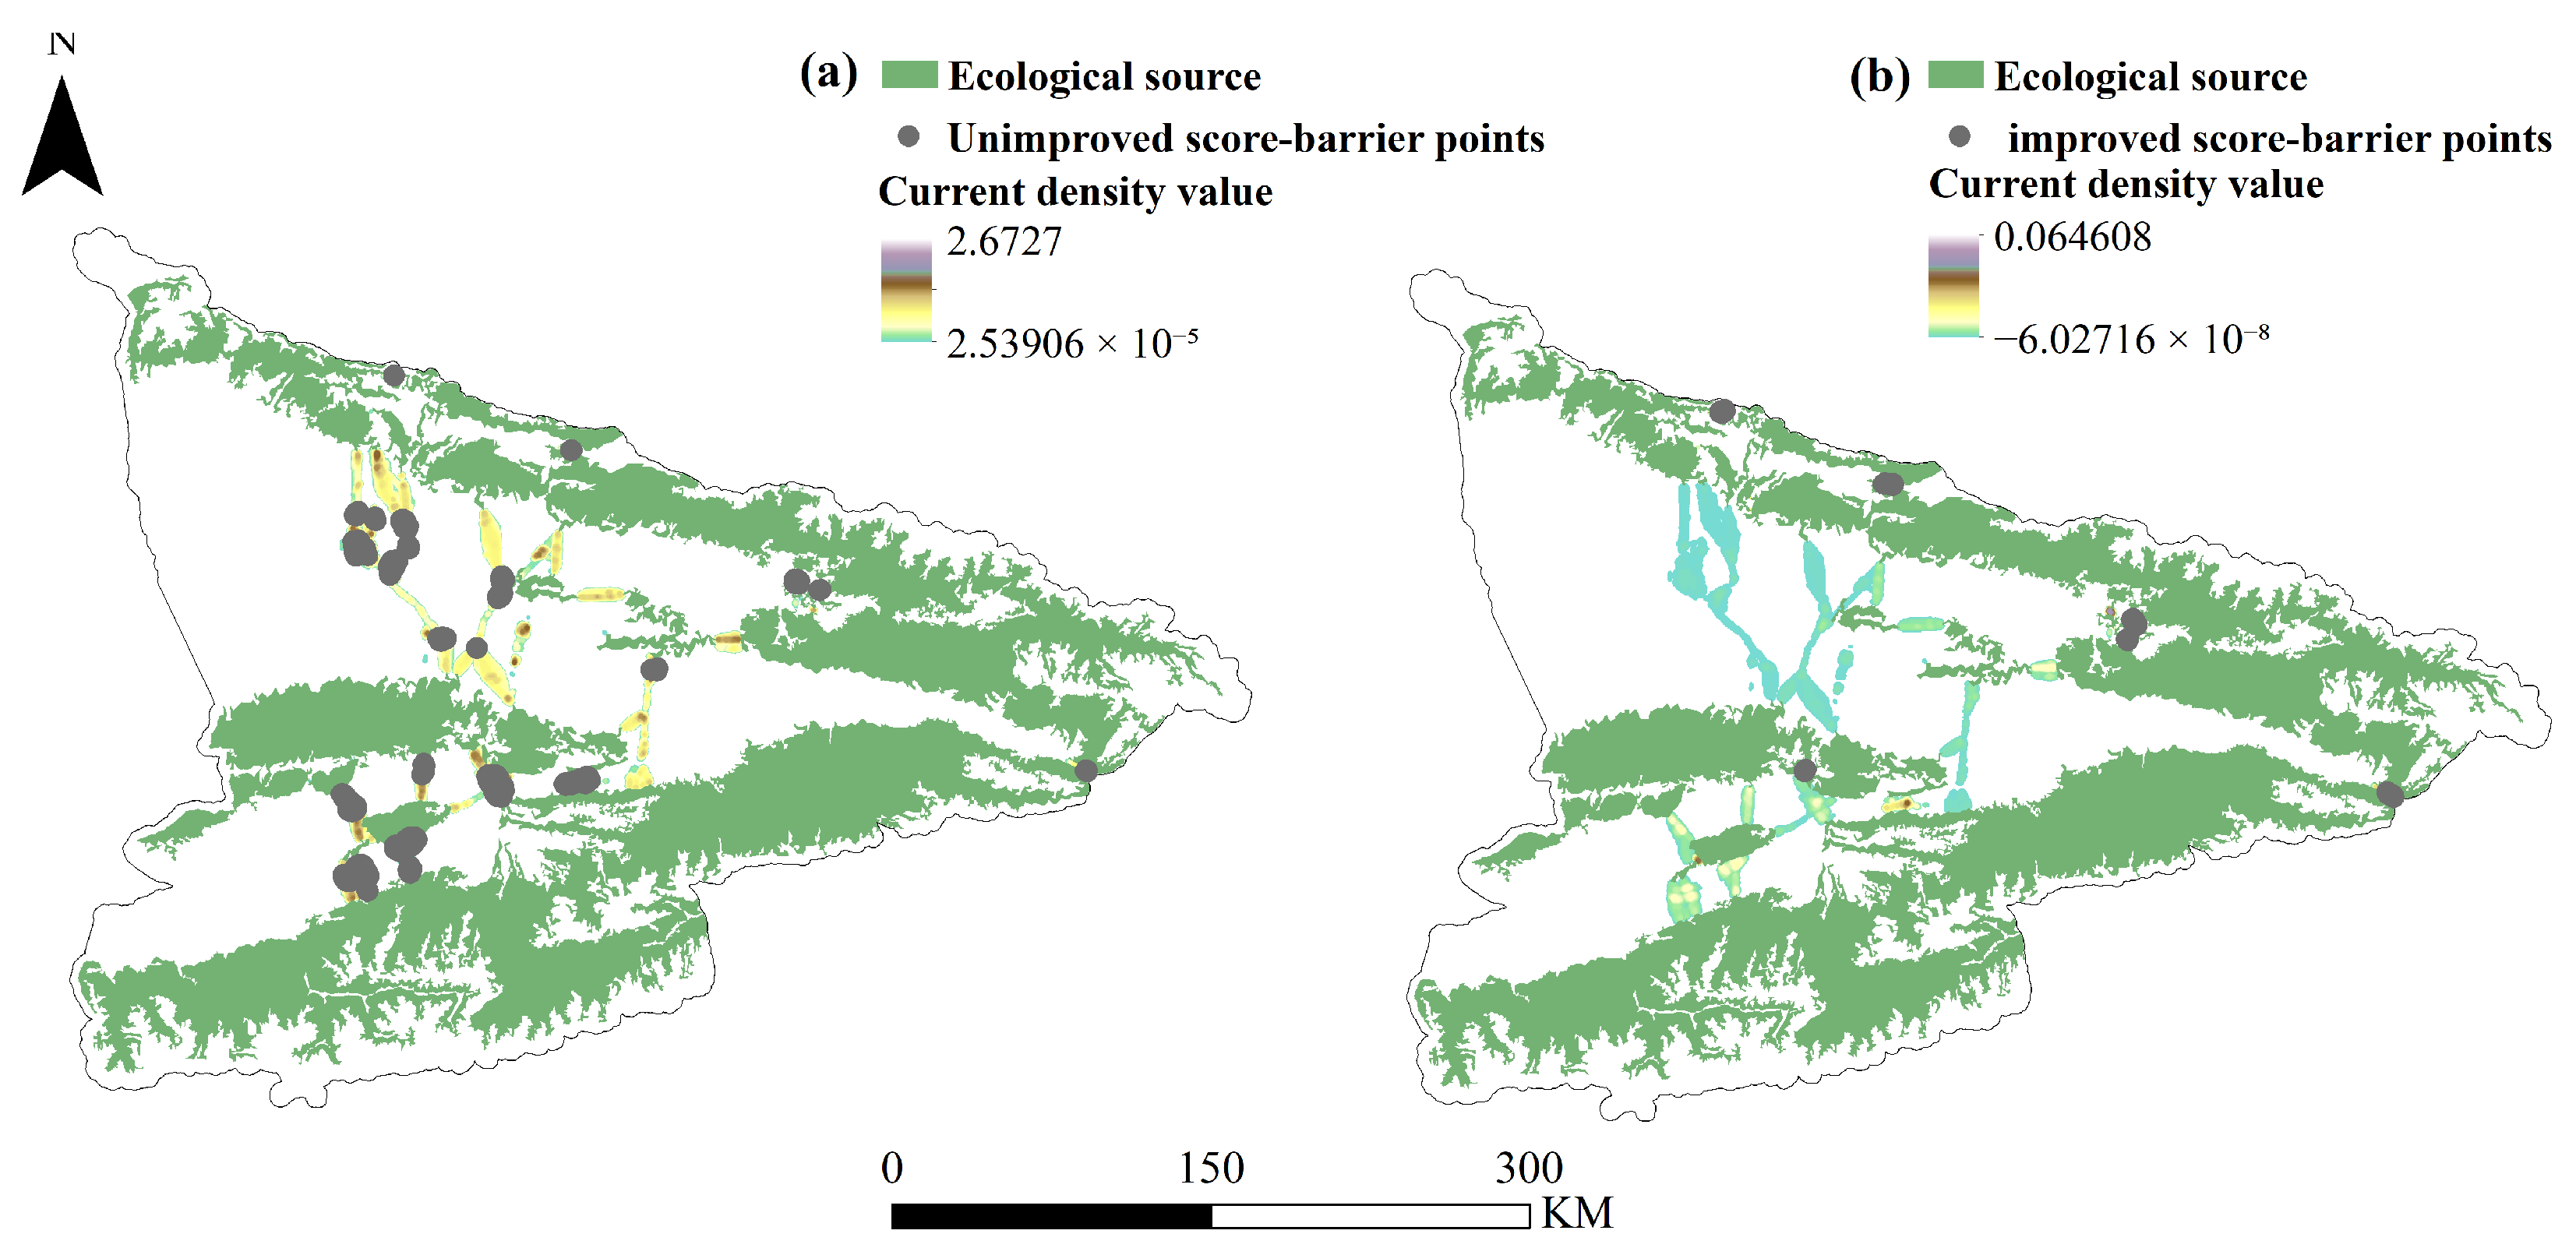
2.3.3. Identification of Ecological Pinch Points and Barrier Points
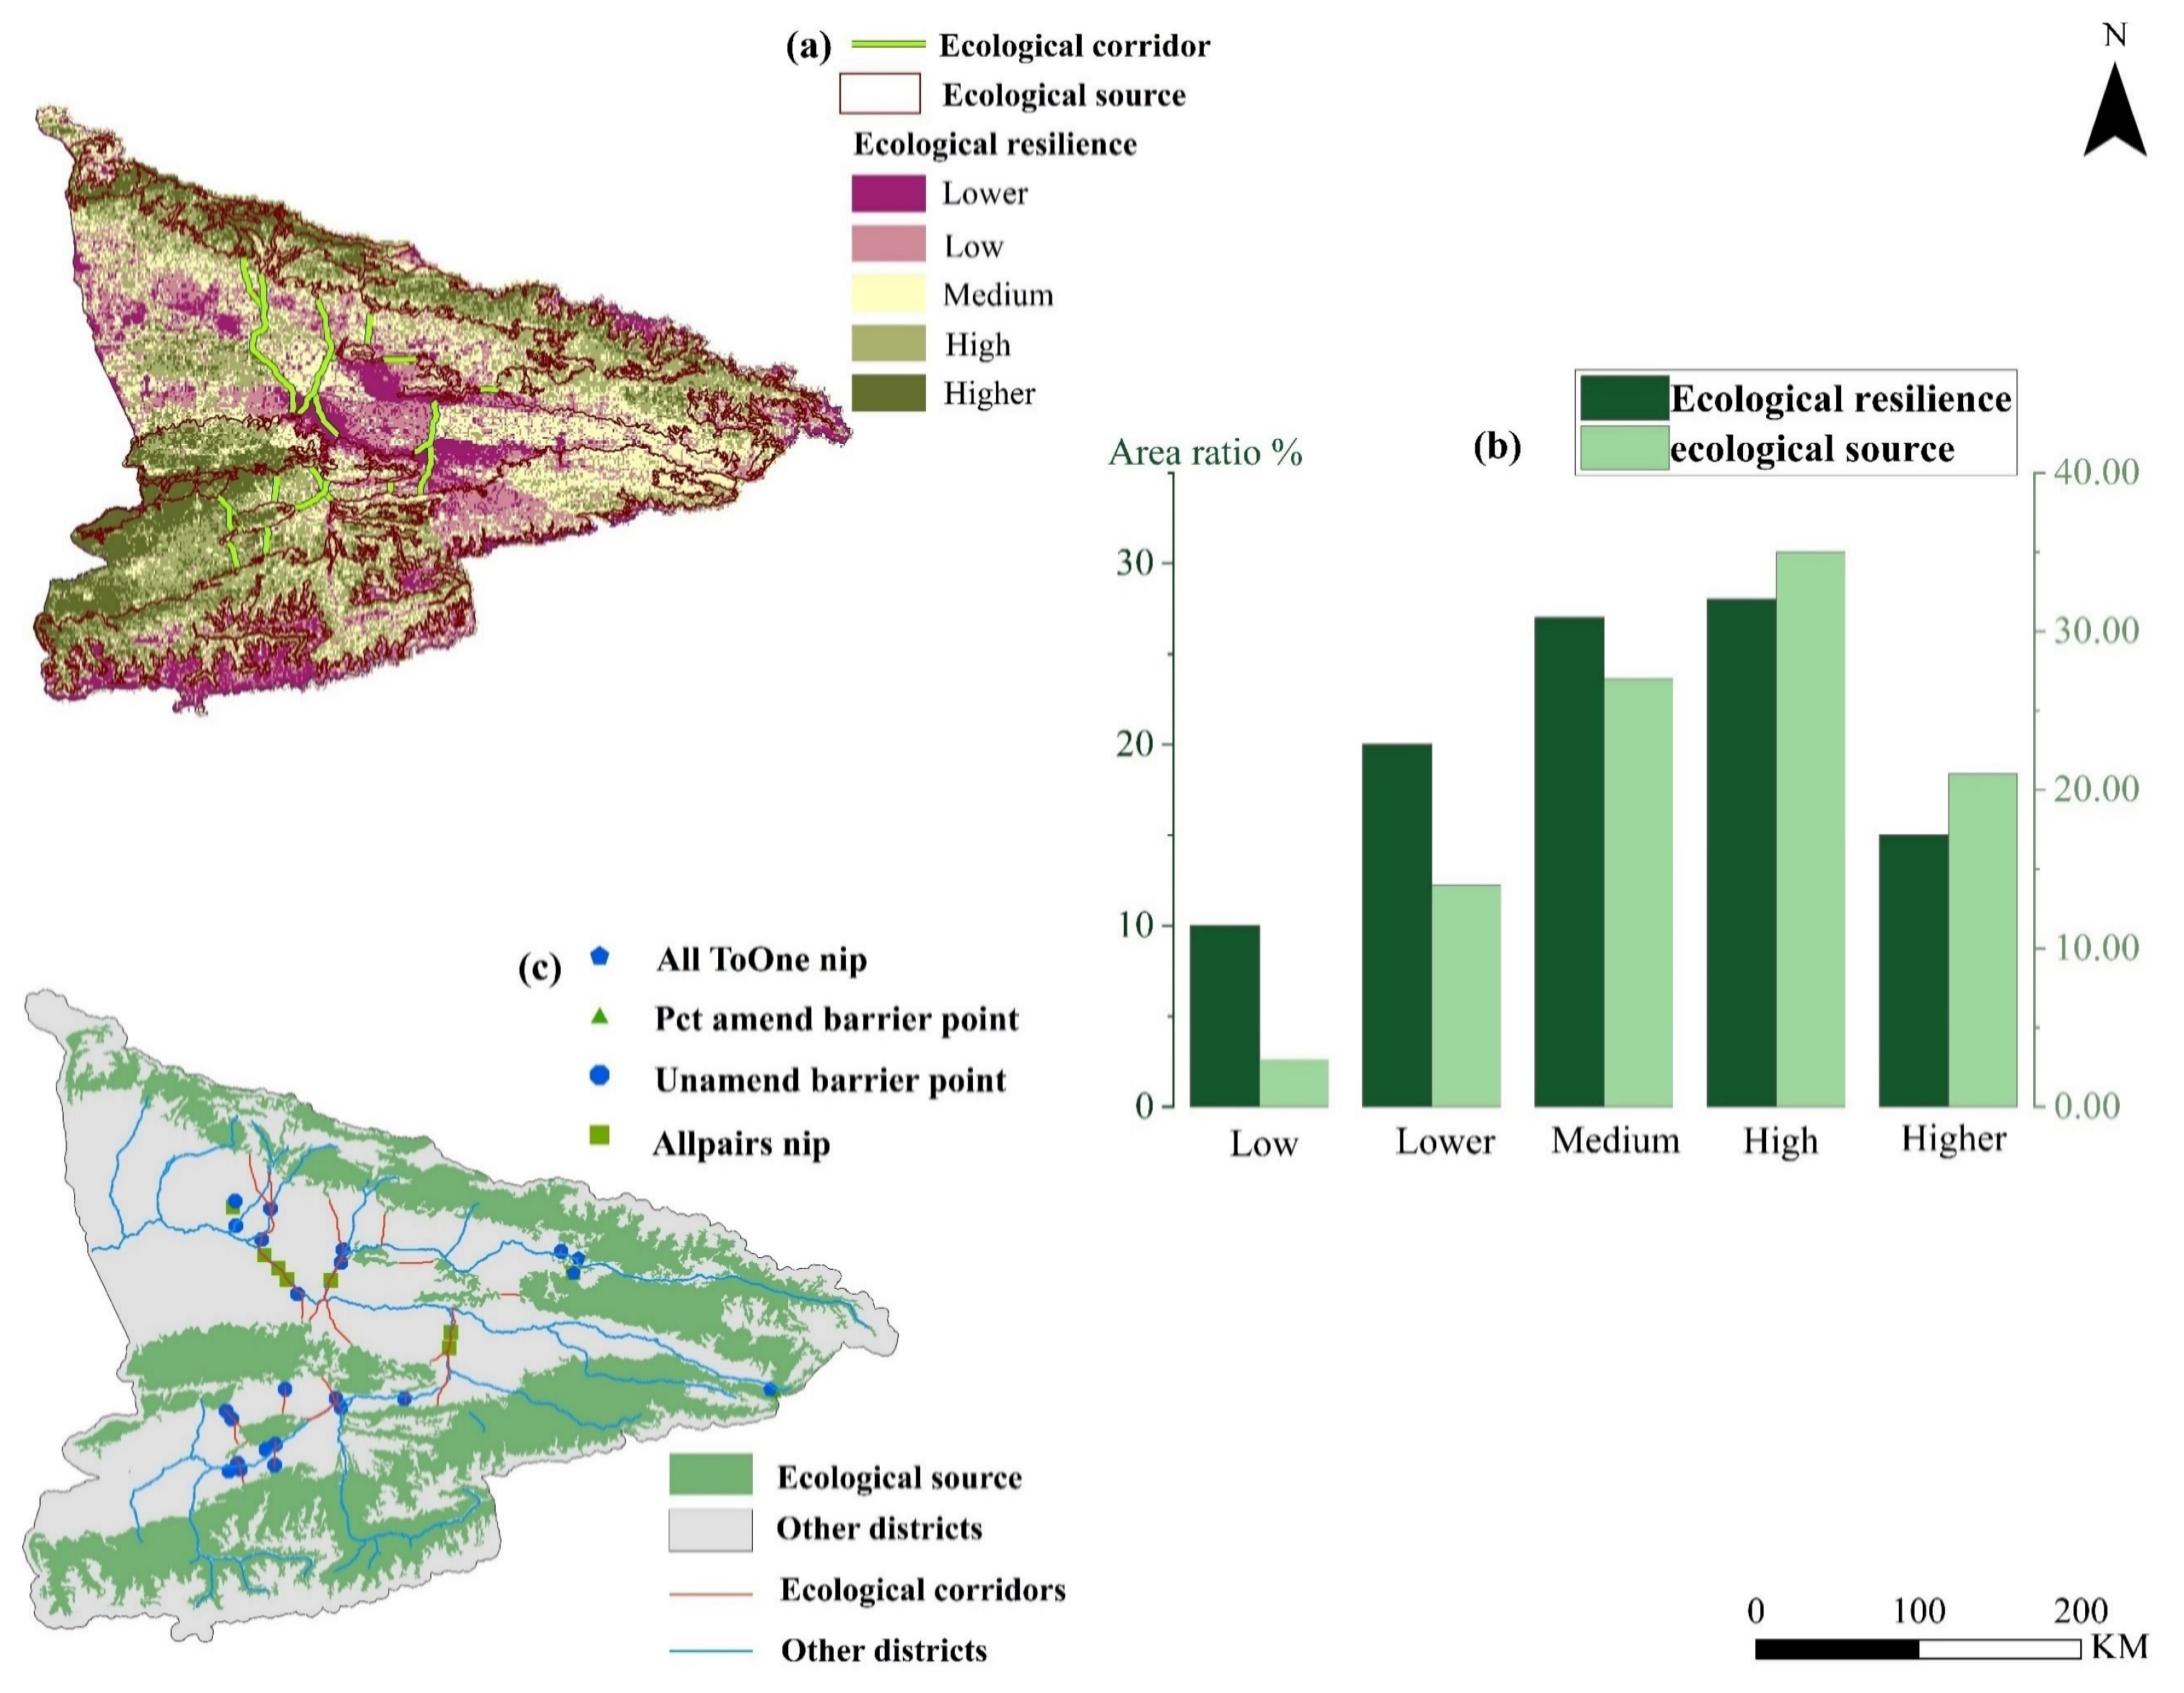
2.3.4. Identification of Ecological Resilience
3. Result
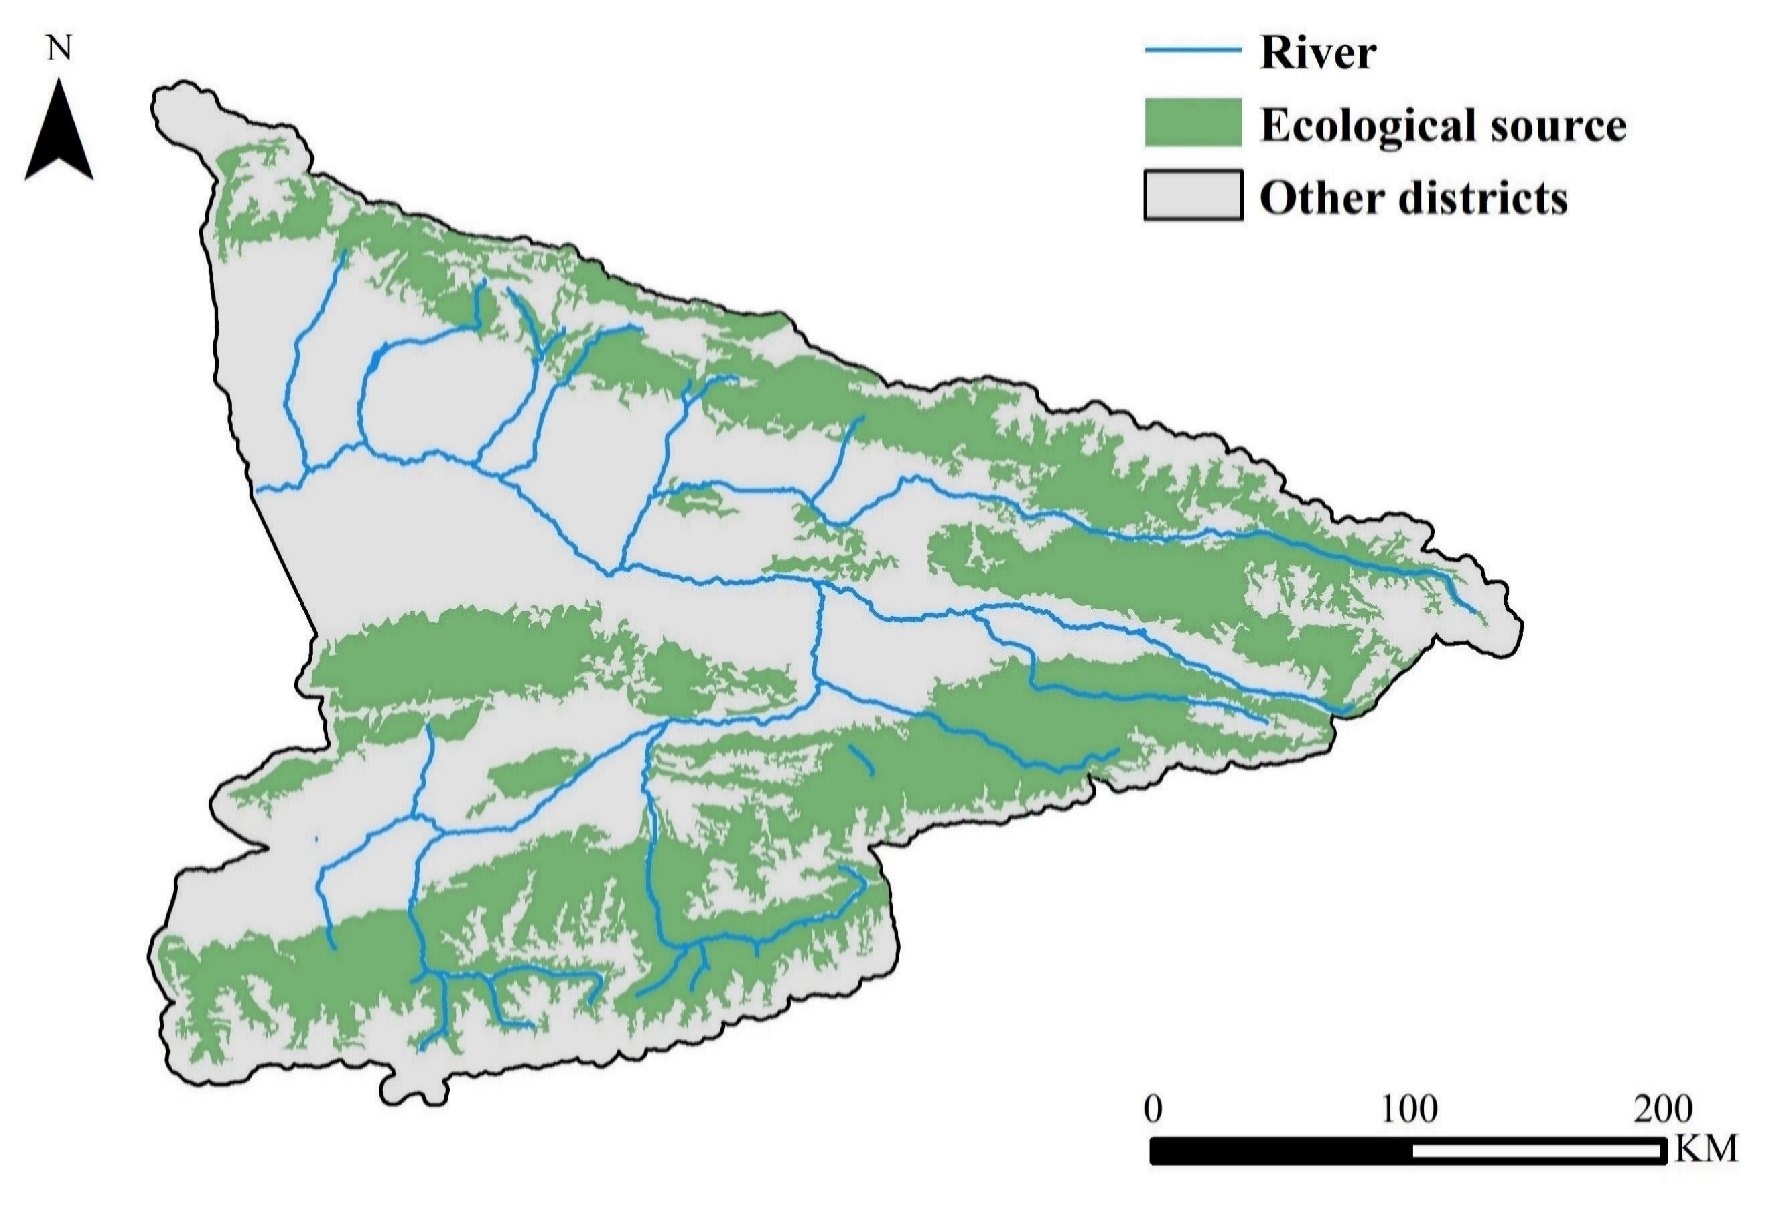
3.1. Ecological Identification
3.1.1. Calculation of Ecosystem Services
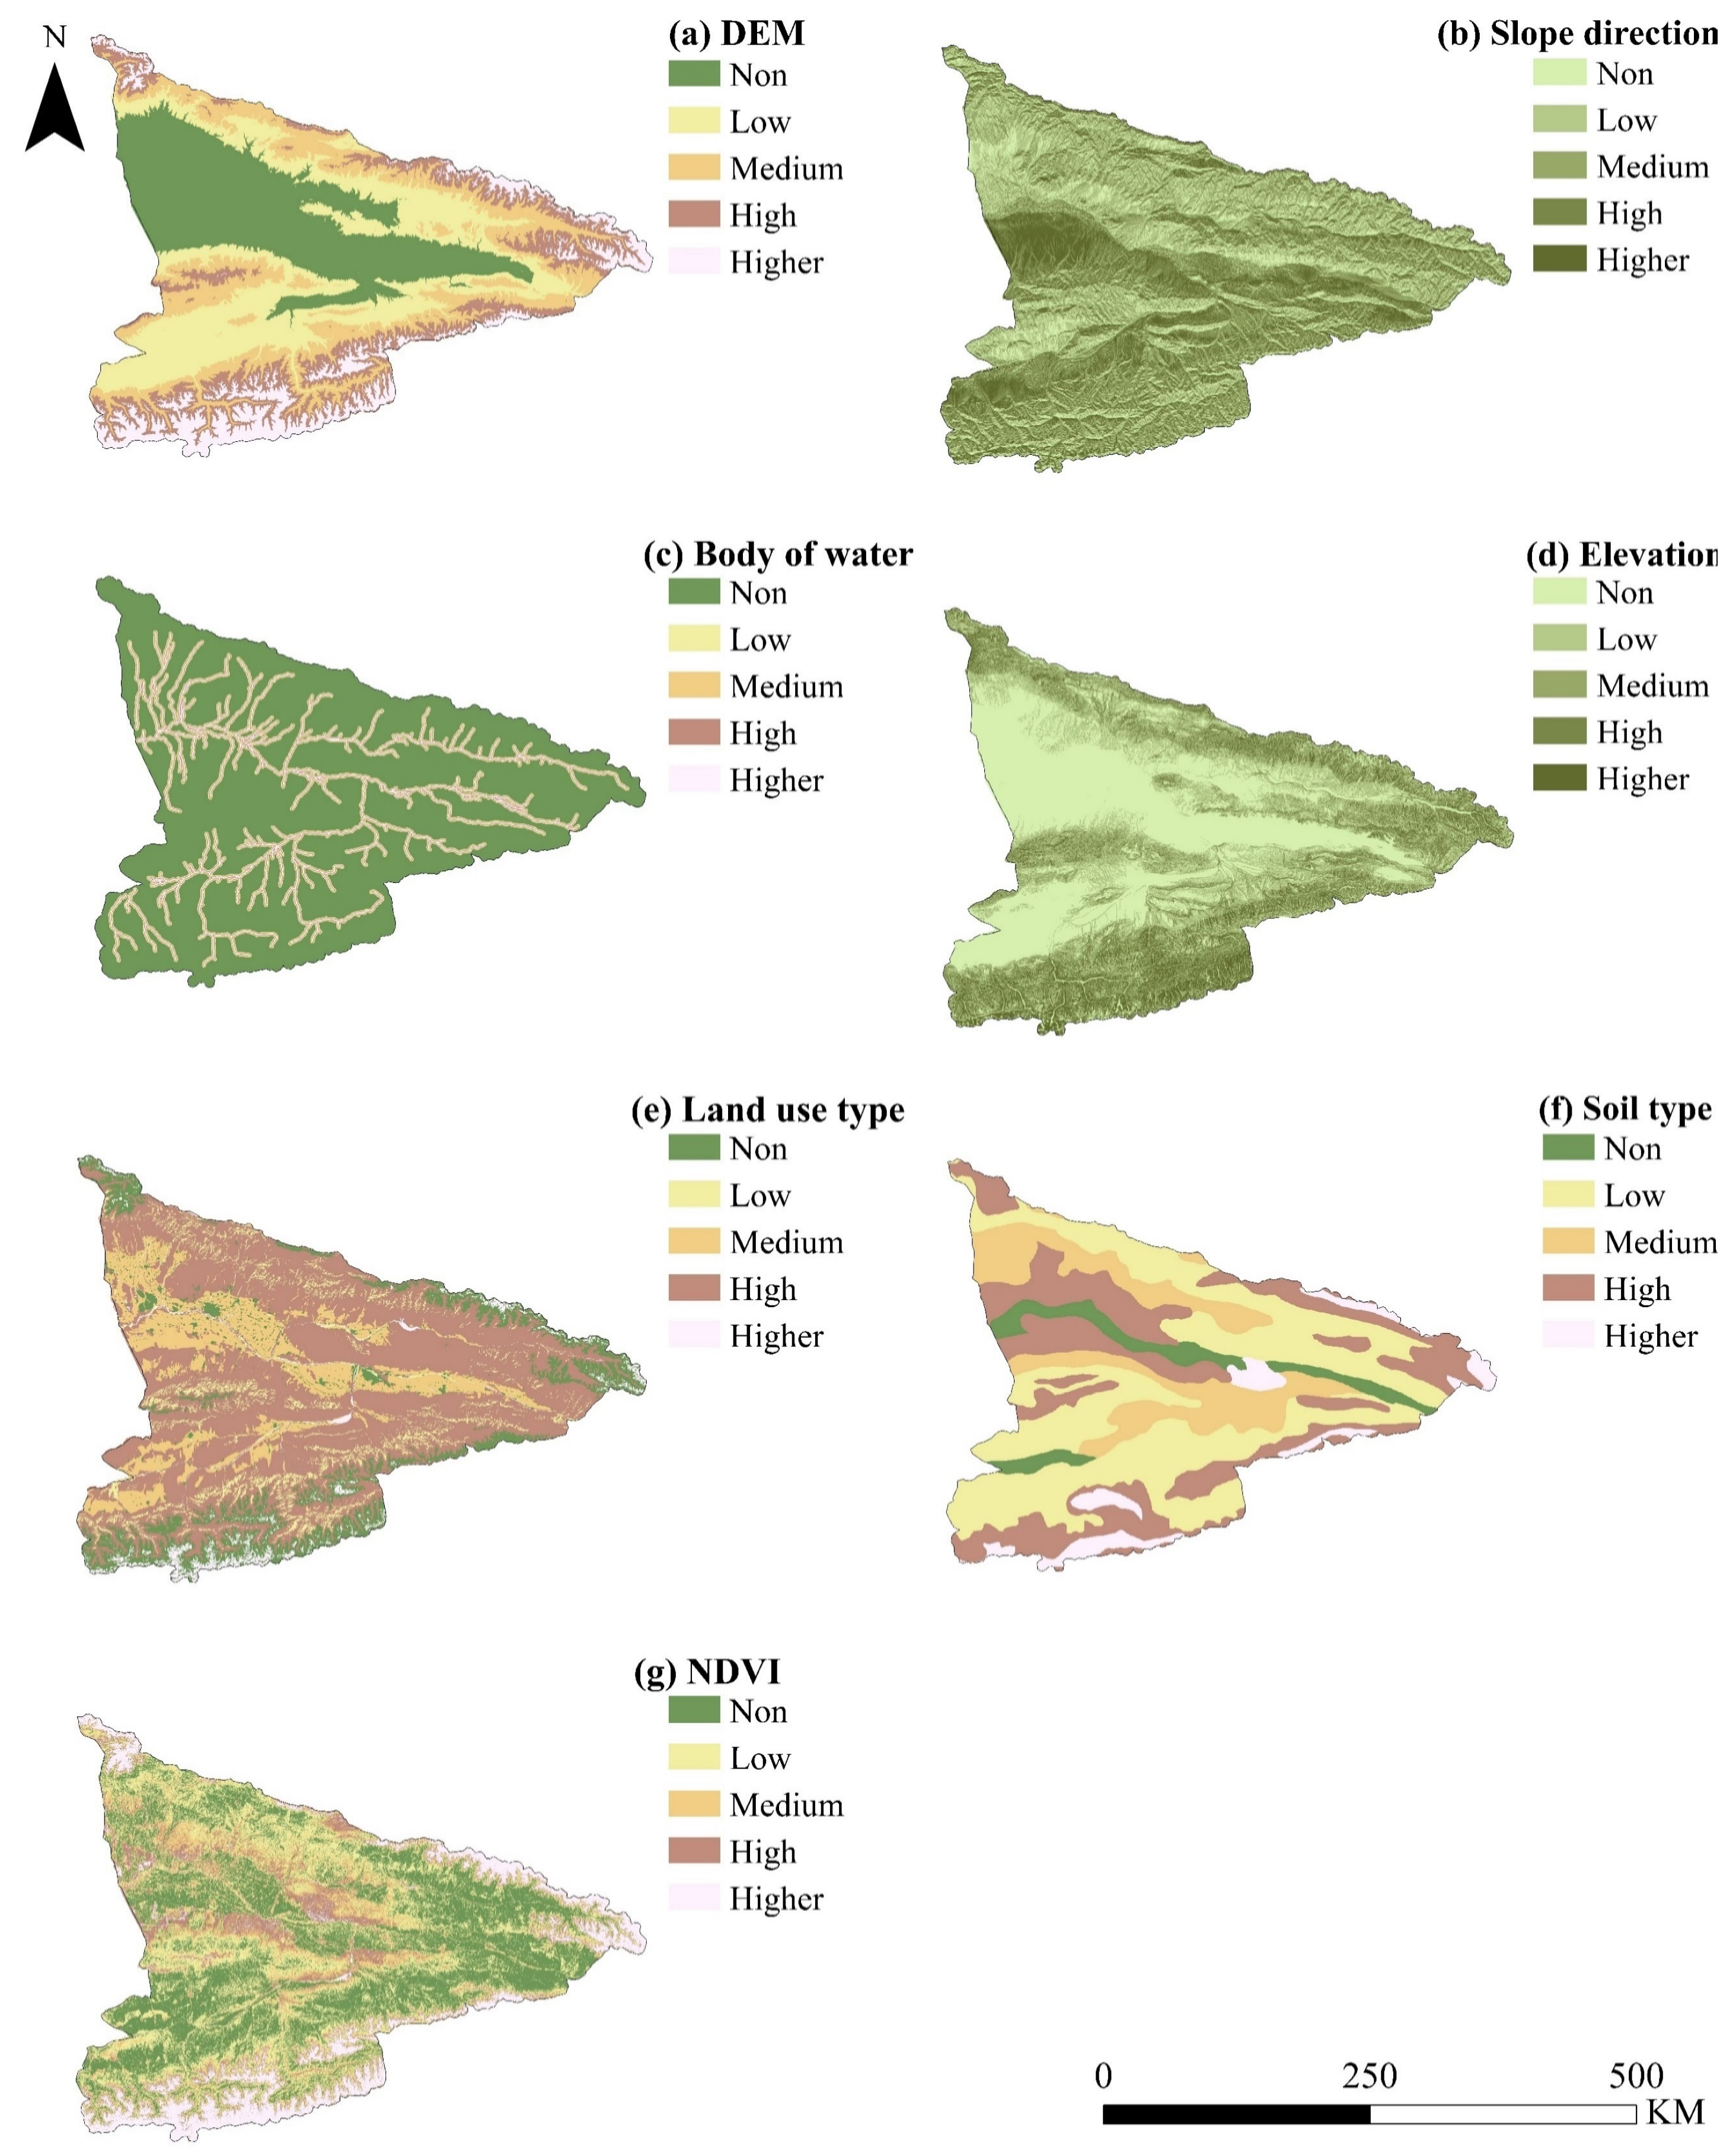
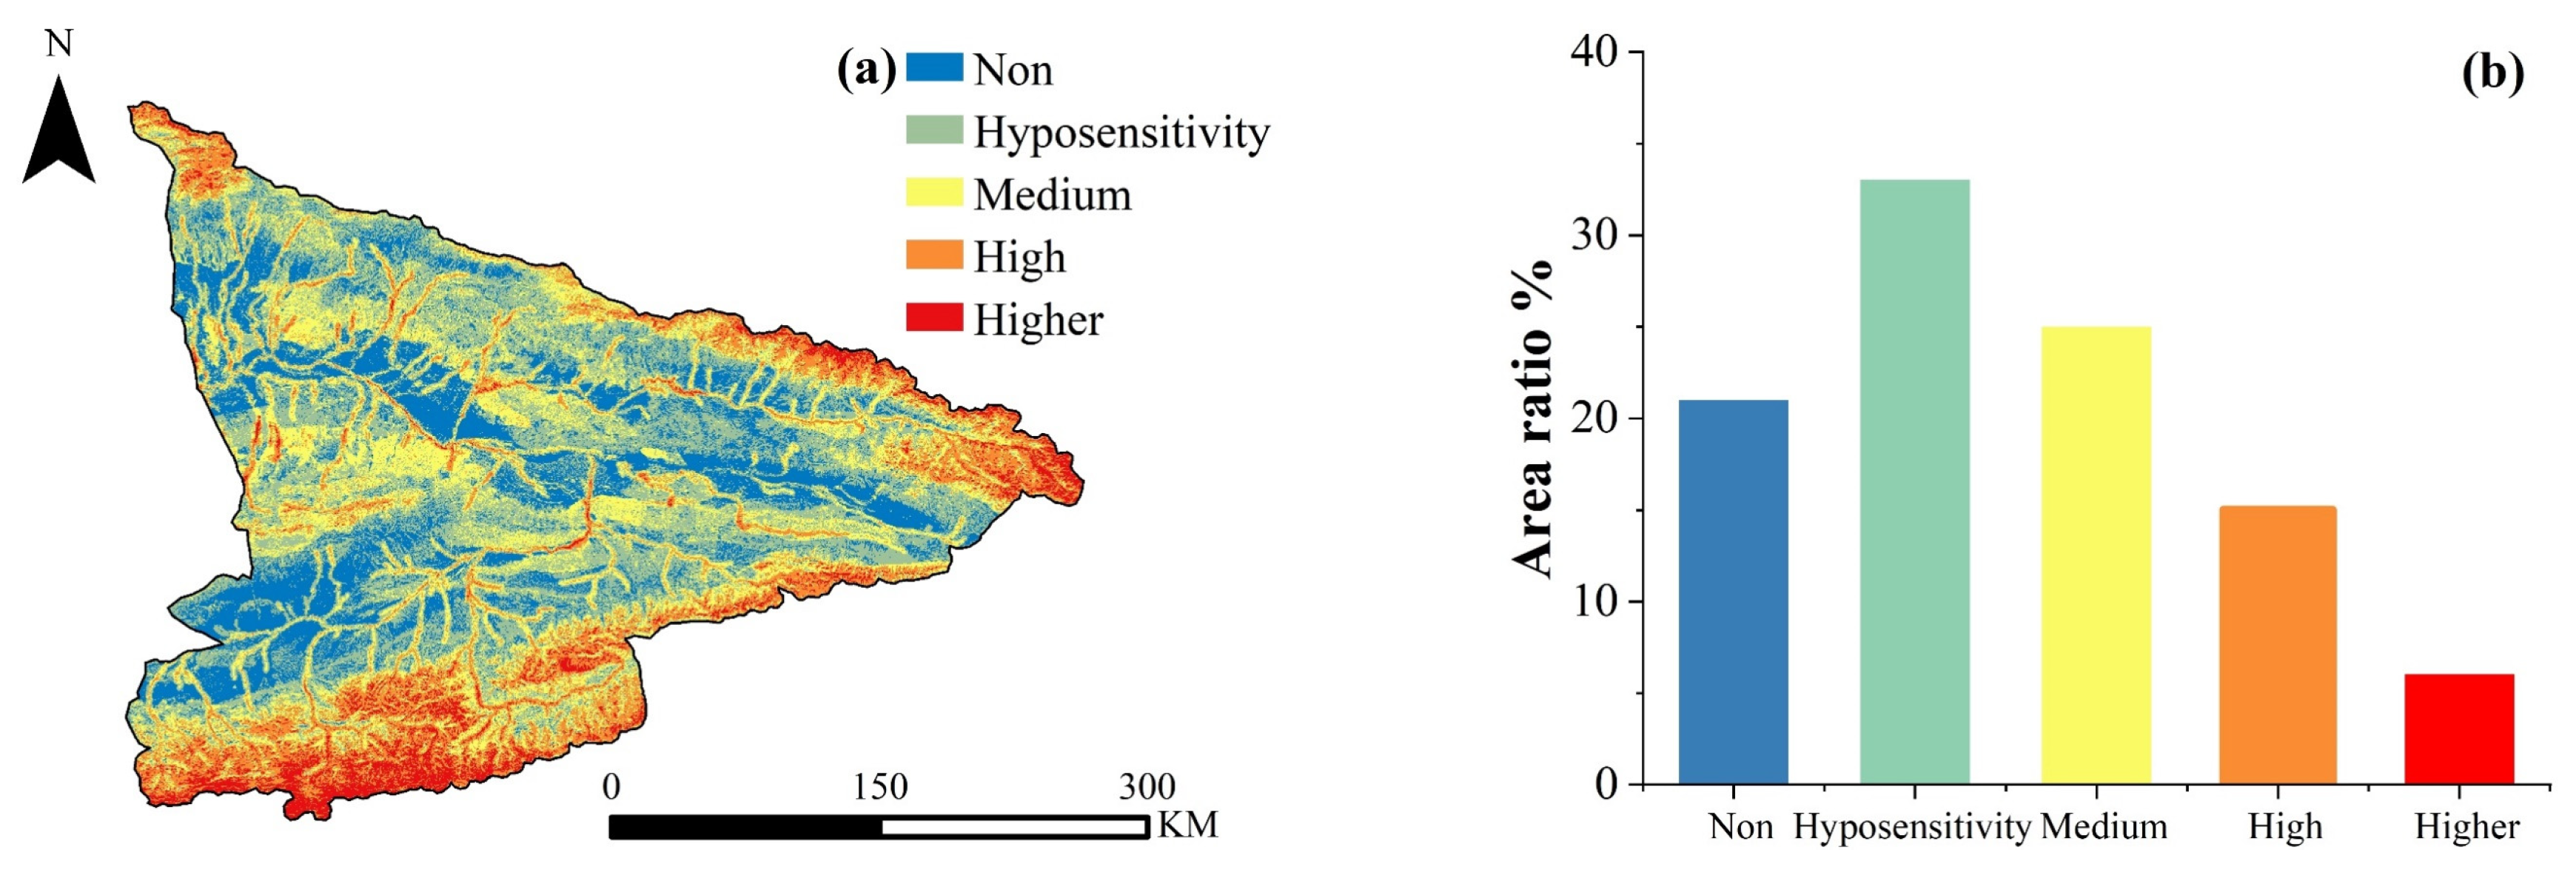
3.1.2. Calculation of Ecological Sensitivity
3.2. Setting of Resistance Surfaces
3.3. Extraction of Ecological Corridors
3.4. Extraction of Ecological Pinch Points and Barrier Points
4. Discussion
4.1. Integration of Ecological Resilience to Construct and Assess the Ecological Security Pattern
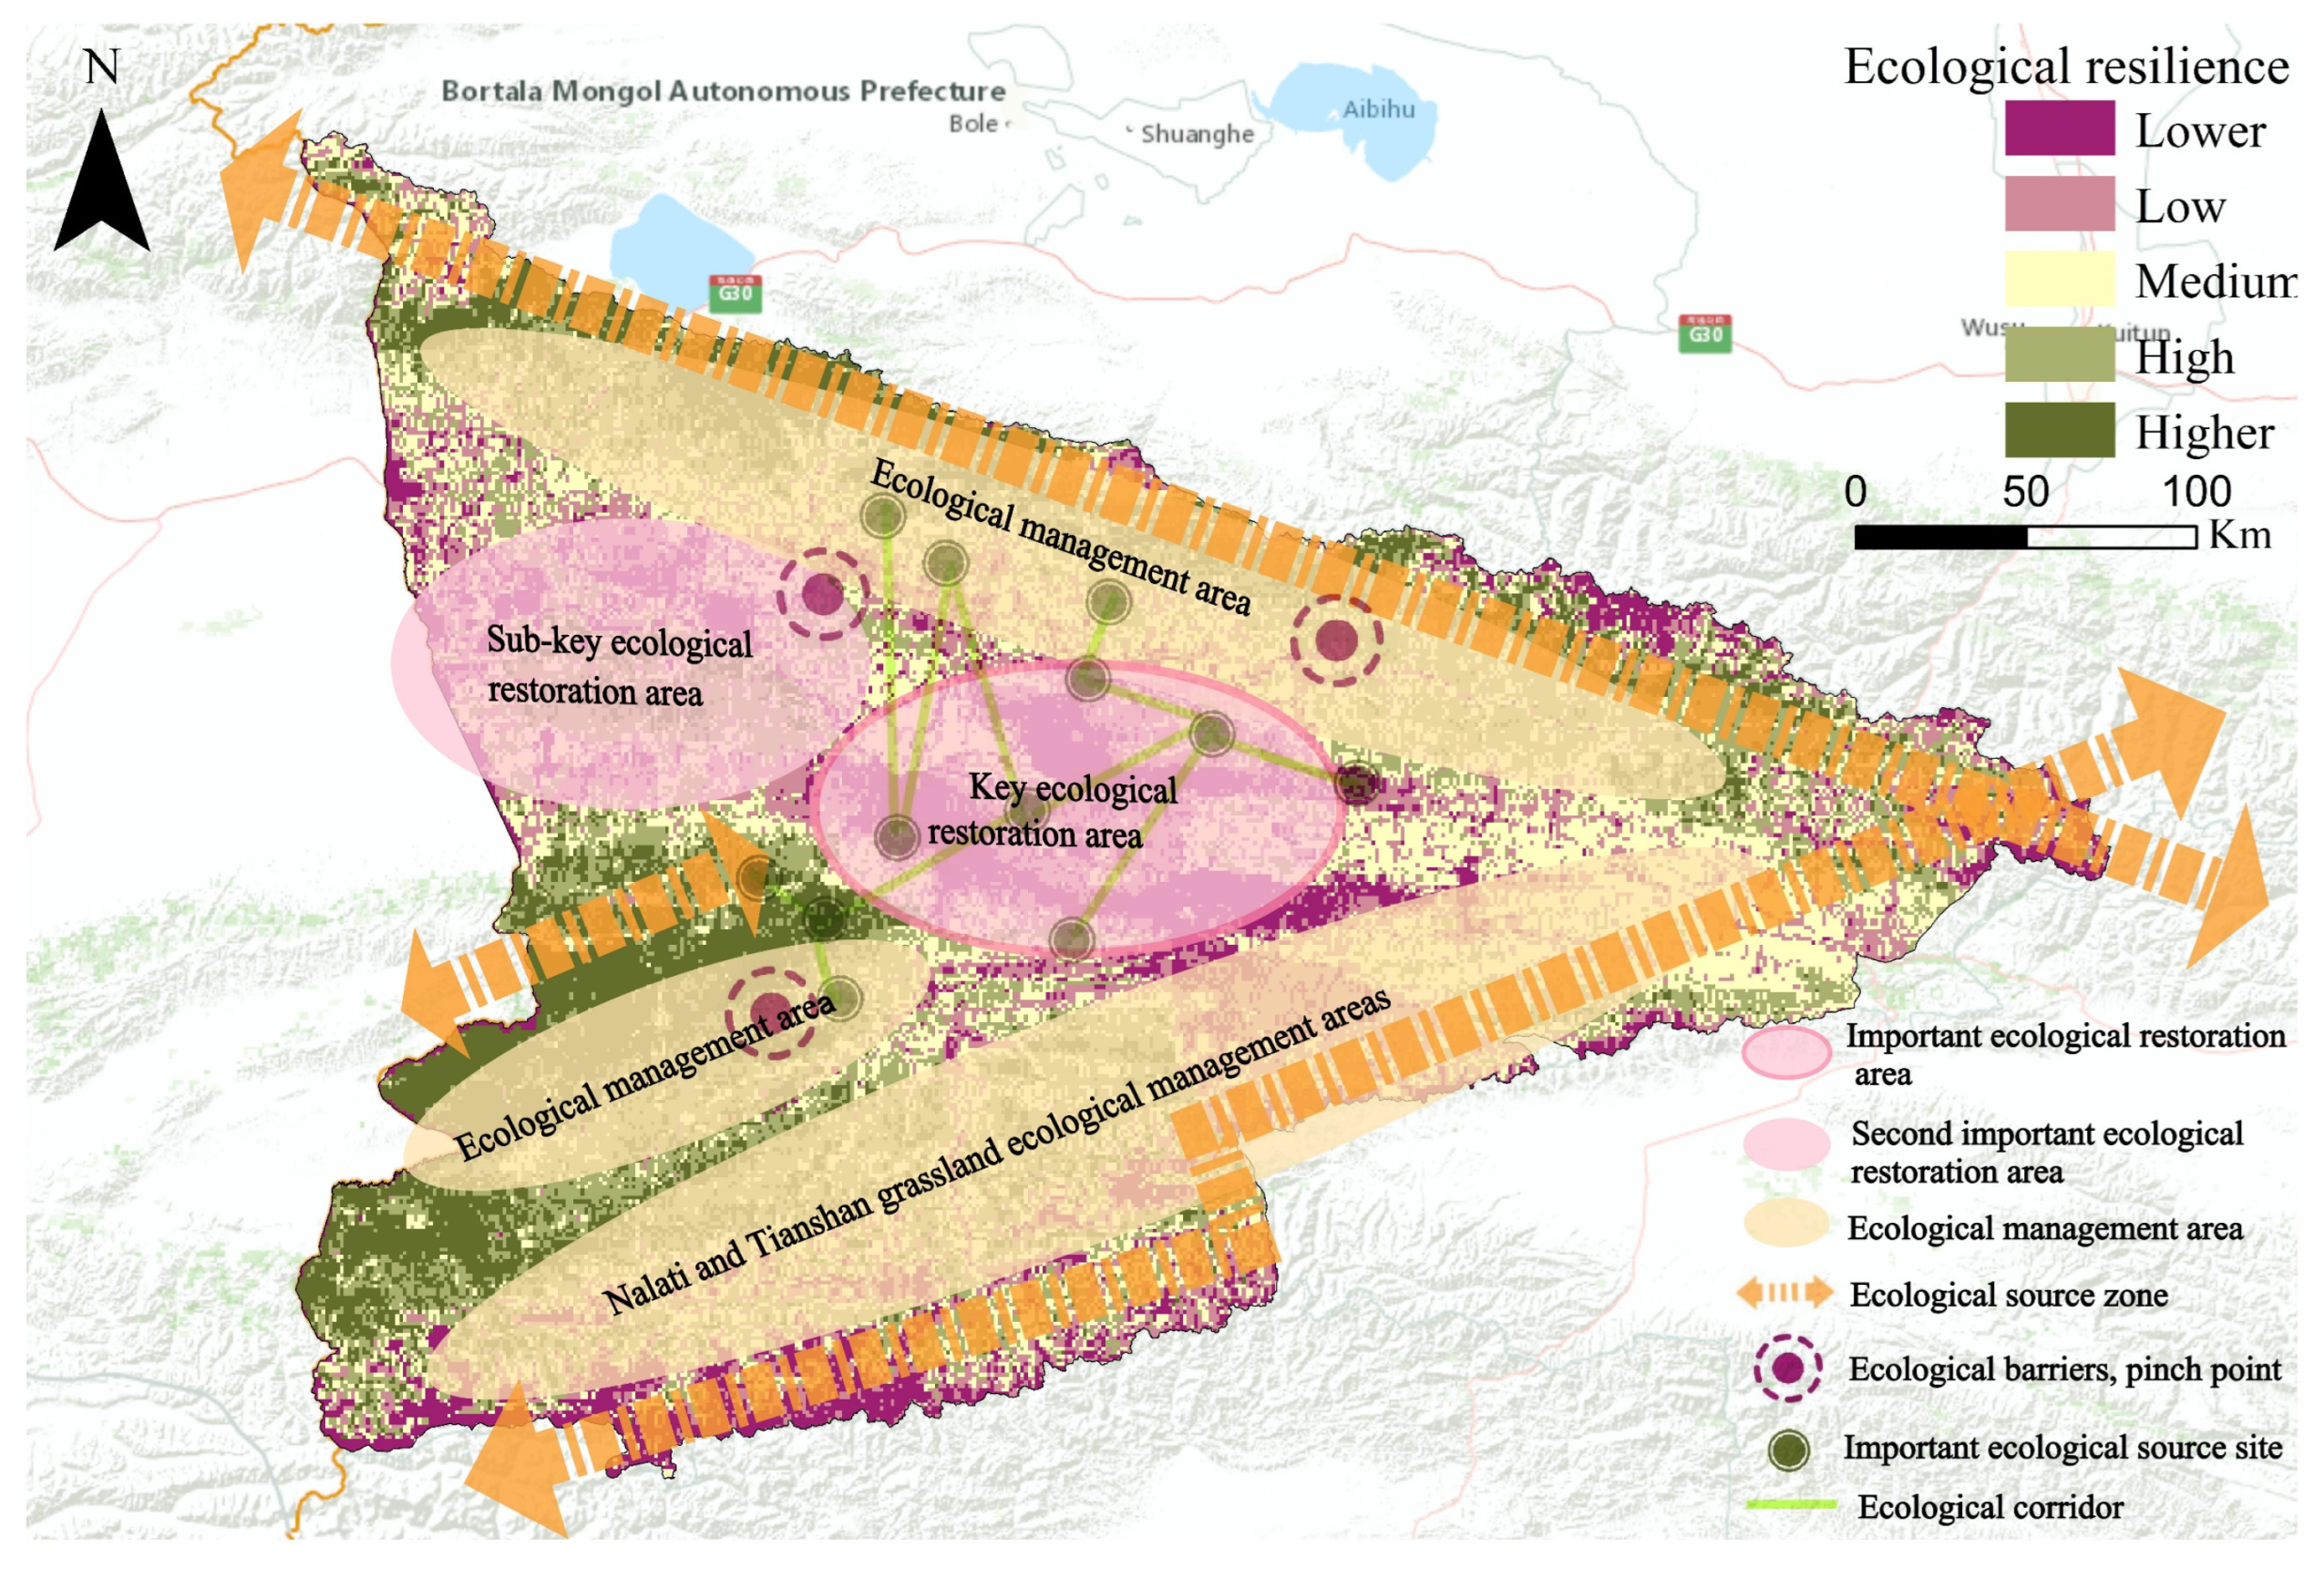
4.2. Optimizing the Ecological Network
4.3. Limitations of the Study
5. Conclusions
Author Contributions
Funding
Data Availability Statement
Conflicts of Interest
References
- Stern, D.I.; Common, M.S.; Barbier, E.B. Economic growth and environmental degradation: The environmental Kuznets curve and sustainable development. World Dev. 1996, 24, 1151–1160. [Google Scholar] [CrossRef]
- Yu, K. Security patterns and surface model in landscape ecological planning. Landsc. Urban Plan. 1996, 36, 1–17. [Google Scholar] [CrossRef]
- Peng, J.; Liu, Y.; Corstanje, R.; Meersmans, J. Promoting sustainable landscape pattern for landscape sustainability. Landsc. Ecol. 2021, 36, 1839–1844. [Google Scholar] [CrossRef]
- Wang, S.; Song, Q.; Zhao, J.; Lu, Z.; Zhang, H. Identification of key areas and early-warning points for ecological protection and restoration in the yellow river source area based on ecological security pattern. Land 2023, 12, 1643. [Google Scholar] [CrossRef]
- Yan, R.; Zhang, X.; Yan, S.; Zhang, J.; Chen, H. Spatial patterns of hydrological responses to land use/cover change in a catchment on the Loess Plateau, China. Ecol. Indic. 2018, 92, 151–160. [Google Scholar] [CrossRef]
- Ye, H.; Yang, Z.; Xu, X. Ecological corridors analysis based on MSPA and MCR model—A case study of the Tomur World Natural Heritage Region. Landsc. Ecol. 2020, 12, 959. [Google Scholar] [CrossRef]
- Wu, W.; Zeng, H.; Guo, C.; You, W.; Xu, H.; Hu, Y.; Wang, M.; Liu, X. Spatial heterogeneity and management challenges of ecosystem service trade-offs: A case study in Guangdong Province, China. Environ. Manag. 2024, 73, 378–394. [Google Scholar] [CrossRef] [PubMed]
- Barabás, G.; Pásztor, L.; Meszéna, G.; Ostling, A. Sensitivity analysis of coexistence in ecological communities: Theory and application. Ecol. Lett. 2014, 17, 1479–1494. [Google Scholar] [CrossRef]
- Chi, Y.; Zhang, Z.; Gao, J.; Xie, Z.; Zhao, M.; Wang, E. Evaluating landscape ecological sensitivity of an estuarine island based on landscape pattern across temporal and spatial scales. Ecol. Indic. 2019, 101, 221–237. [Google Scholar] [CrossRef]
- Fu, Y.; Shi, X.; He, J.; Yuan, Y.; Qu, L. Identification and optimization strategy of county ecological security pattern: A case study in the Loess Plateau, China. Ecol. Indic. 2020, 112, 106030. [Google Scholar] [CrossRef]
- Xu, H. A remote sensing urban ecological index and its application. Acta Ecol. Sin. 2013, 33, 7853–7862. [Google Scholar] [CrossRef]
- Worboys, G.L.; Lockwood, M.; Kothari, A.; Feary, S.; Pulsford, I. Protected Area Governance and Management; ANU Press: Canberra, Australia, 2015; Chapter 4; p. 69. [Google Scholar]
- Huang, L.; Wang, D.; He, C. Ecological security assessment and ecological pattern optimization for Lhasa city (Tibet) based on the minimum cumulative resistance model. Environ. Sci. Pollut. Res. 2022, 29, 83437–83451. [Google Scholar] [CrossRef] [PubMed]
- Hou, C.; Chen, H.; Long, R. Construction and optimization of an ecological network based on morphological spatial pattern analysis and circuit theory. Landsc. Ecol. 2021, 36, 2059–2076. [Google Scholar] [CrossRef]
- Dickson, B.G.; Albano, C.M.; Anantharaman, R.; Beier, P.; Fargione, J.; Graves, T.A.; Gray, M.E.; Hall, K.R.; Lawler, J.J.; Leonard, P.B. Circuit-theory applications to connectivity science and conservation. Conserv. Biol. 2019, 33, 239–249. [Google Scholar] [CrossRef] [PubMed]
- McRae, B.H.; Dickson, B.G.; Keitt, T.H.; Shah, V.B. Using circuit theory to model connectivity in ecology, evolution, and conservation. Ecology 2008, 89, 2712–2724. [Google Scholar] [CrossRef] [PubMed]
- Dickson, B.G.; Roemer, G.W.; McRae, B.H.; Rundall, J.M. Models of regional habitat quality and connectivity for pumas (Puma concolor) in the southwestern United States. PLoS ONE 2013, 8, e81898. [Google Scholar] [CrossRef] [PubMed]
- Gunderson, L.H. Ecological resilience—In theory and application. Annu. Rev. Ecol. Syst. 2000, 31, 425–439. [Google Scholar] [CrossRef]
- Li, J.X.; Nie, W.B.; Zhang, M.X.; Wang, L.N.; Dong, H.Y.; Xu, B. Assessment and optimization of urban ecological network resilience based on disturbance scenario simulations: A case study of Nanjing city. J. Clean. Prod. 2024, 438, 140812. [Google Scholar] [CrossRef]
- Bustamante, M.M.; Silva, J.S.; Scariot, A.; Sampaio, A.B.; Mascia, D.L.; Garcia, E.; Sano, E.; Fernandes, G.W.; Durigan, G.; Roitman, I. Ecological restoration as a strategy for mitigating and adapting to climate change: Lessons and challenges from Brazil. Mitig. Adapt. Strateg. Glob. Chang. 2019, 24, 1249–1270. [Google Scholar] [CrossRef]
- Zhao, Y.X.; Zhang, M.; Zhao, D.X.; Duo, L.; Lu, C.Y. Optimizing the ecological network of resource-based cities to enhance the resilience of regional ecological networks. Environ. Sci. Pollut. Res. 2024, 31, 17156–17163. [Google Scholar] [CrossRef]
- Xu, Y.; Chen, Y.; Li, W.; Fu, A.; Ma, X.; Gui, D.; Chen, Y. Distribution pattern of plant species diversity in the Mountainous Region of Ili River Valley, Xinjiang. Environ. Monit. Assess. 2011, 177, 681–694. [Google Scholar] [CrossRef] [PubMed]
- Li, W.S.; Smith, A.T. Ochotona iliensis. In The IUCN Red List of Threatened Species 2019; International Union for Conservation of Nature (IUCN): Gland, Switzerland, 2019; Available online: https://www.iucnredlist.org/species/15050/45179204 (accessed on 14 June 2024). [CrossRef]
- Tortoise; Freshwater Turtle Specialist Group. Testudo horsfieldii. In The IUCN Red List of Threatened Species 1996; International Union for Conservation of Nature (IUCN): Gland, Switzerland, 1996; Available online: https://www.iucnredlist.org/species/21651/9306759 (accessed on 14 June 2024). [CrossRef]
- Li, C.; Fu, B.; Wang, S.; Stringer, L.C.; Wang, Y.; Li, Z.; Liu, Y.; Zhou, W. Drivers and impacts of changes in China’s drylands. Nat. Rev. Earth Environ. 2021, 2, 858–873. [Google Scholar] [CrossRef]
- Saimire, W.; Yang, H.; Zhong, R.; Zhang, P.; Niyazihainimu, X.; Bao, A. Characterization of spatial and temporal changes and influencing factors in vegetation cover in the Ili River delta. J. Hydroecology 2024, 1–11. [Google Scholar] [CrossRef]
- Sui, L.; Yan, Z.; Li, K.; He, P.; Ma, Y.; Zhang, R. Prediction of habitat quality in the Ili River Valley under the influence of human activities and climate change. Arid Land Geogr. 2024, 47, 104–116. [Google Scholar] [CrossRef]
- Yu, F.; Wang, H.; Qian, T.; Xie, L.; Wei, Y. Construction of Ecological Security Pattern in Yili River Valley Under Geological Hazard Sensitivity. J. Huaqiao Univ. Nat. Sci. 2023, 44, 510–517. [Google Scholar]
- Liu, P.L.; Zhang, S.J.; Qiu, M.H.; Ruan, Q.R.; Luo, J.M.; Miao, Y.F.; Ling, Z.Y. Vegetation history and its links to climate change during the last 36 ka in arid Central Asia: Evidence from a loess-paleosol sequence in the Eastern Ili Valley. Front. Earth Sci. 2023, 10, 1041374. [Google Scholar] [CrossRef]
- Enssle, F.; Kabisch, N. Urban green spaces for the social interaction, health and well-being of older people—An integrated view of urban ecosystem services and socio-environmental justice. Environ. Sci. Policy 2020, 109, 36–44. [Google Scholar] [CrossRef]
- Saurí, D. Water conservation: Theory and evidence in urban areas of the developed world. Annu. Rev. Environ. Resour. 2013, 38, 227–248. [Google Scholar] [CrossRef]
- Lal, R. Soil conservation and ecosystem services. Int. Soil Water Conserv. Res. 2015, 2, 36–47. [Google Scholar] [CrossRef]
- Johnson, M.D. Measuring habitat quality: A review. Condor 2007, 109, 489–504. [Google Scholar] [CrossRef]
- Lal, R. Carbon sequestration. Philos. Trans. R. Soc. B Biol. Sci. 2008, 363, 815–830. [Google Scholar] [CrossRef] [PubMed]
- Fathieh, F.; Kalmutzki, M.J.; Kapustin, E.A.; Waller, P.J.; Yang, J.; Yaghi, O.M. Practical water production from desert air. Sci. Adv. 2018, 4, eaat3198. [Google Scholar] [CrossRef] [PubMed]
- Bergengren, J.C.; Waliser, D.E.; Yung, Y.L. Ecological sensitivity: A biospheric view of climate change. Clim. Chang. 2011, 107, 433–457. [Google Scholar] [CrossRef]
- Vaidya, O.S.; Kumar, S. Analytic hierarchy process: An overview of applications. Eur. J. Oper. Res. 2006, 169, 1–29. [Google Scholar] [CrossRef]
- Li, Y.; Zhang, X.; Cao, Z.; Liu, Z.; Lu, Z.; Liu, Y. Towards the progress of ecological restoration and economic development in China’s Loess Plateau and strategy for more sustainable development. Sci. Total Environ. 2021, 756, 143676. [Google Scholar] [CrossRef]
- Hu, X.; Xu, H. A new remote sensing index for assessing the spatial heterogeneity in urban ecological quality: A case from Fuzhou City, China. Ecol. Indic. 2018, 89, 11–21. [Google Scholar] [CrossRef]
- Xu, H.; Wang, Y.; Guan, H.; Shi, T.; Hu, X. Detecting ecological changes with a remote sensing based ecological index (RSEI) produced time series and change vector analysis. Remote Sens. 2019, 11, 2345. [Google Scholar] [CrossRef]
- Hu, C.; Wang, Z.; Wang, Y.; Sun, D.; Zhang, J. Combining MSPA-MCR model to evaluate the ecological network in Wuhan, China. Land 2022, 11, 213. [Google Scholar] [CrossRef]
- Zhang, H.; Li, J.; Tian, P.; Pu, R.; Cao, L. Construction of ecological security patterns and ecological restoration zones in the city of Ningbo, China. J. Geogr. Sci. 2022, 32, 663–681. [Google Scholar] [CrossRef]
- Hanks, E.M.; Hooten, M.B. Circuit theory and model-based inference for landscape connectivity. J. Am. Stat. Assoc. 2013, 108, 22–33. [Google Scholar] [CrossRef]
- Lin, L.; Wei, X.; Luo, P.; Wang, S.; Kong, D.; Yang, J. Ecological security patterns at different spatial scales on the Loess Plateau. Remote Sens. 2023, 15, 1011. [Google Scholar] [CrossRef]
- McRae, B.H.; Hall, S.A.; Beier, P.; Theobald, D.M. Where to restore ecological connectivity? Detecting barriers and quantifying restoration benefits. PLoS ONE 2012, 7, e52604. [Google Scholar] [CrossRef] [PubMed]
- Tan, J.; Li, H.; Lin, W. Integrating ecosystems and socioeconomic systems to identify ecological security pattern and restoration strategy in a rapidly urbanizing landscape. Front. Environ. Sci. 2022, 10, 862310. [Google Scholar] [CrossRef]
- Cutter, S.L.; Burton, C.G.; Emrich, C.T. Disaster resilience indicators for benchmarking baseline conditions. J. Homel. Secur. Emerg. Manag. 2010, 7. [Google Scholar] [CrossRef]
- Timpane-Padgham, B.L.; Beechie, T.; Klinger, T. A systematic review of ecological attributes that confer resilience to climate change in environmental restoration. PLoS ONE 2017, 12, e0173812. [Google Scholar] [CrossRef] [PubMed]
- Bi, M.; Xie, G.; Yao, C. Ecological security assessment based on the renewable ecological footprint in the Guangdong-Hong Kong-Macao Greater Bay Area, China. Ecol. Indic. 2020, 116, 106432. [Google Scholar] [CrossRef]
- Salviano, I.R.; Gardon, F.R.; dos Santos, R.F. Ecological corridors and landscape planning: A model to select priority areas for connectivity maintenance. Landsc. Ecol. 2021, 36, 3311–3328. [Google Scholar] [CrossRef]
- Shi, F.; Liu, S.; Sun, Y.; An, Y.; Zhao, S.; Liu, Y.; Li, M. Ecological network construction of the heterogeneous agro-pastoral areas in the upper Yellow River basin. Agric. Ecosyst. Environ. 2020, 302, 107069. [Google Scholar] [CrossRef]
- Zhou, M.; Deng, J.; Lin, Y.; Zhang, L.; He, S.; Yang, W. Evaluating combined effects of socio-economic development and ecological conservation policies on sediment retention service in the Qiantang River Basin, China. J. Clean. Prod. 2021, 286, 124961. [Google Scholar] [CrossRef]
- Zhang, W.; Wang, H.; Cao, K.; He, S.; Shan, L. Ecological conservation–and economic development–based multiobjective land-use optimization: Case study of a rapidly developing city in central China. J. Urban Plan. Dev. 2019, 145, 05018023. [Google Scholar] [CrossRef]
- Huang, L.; Xiao, T.; Zhao, Z.; Sun, C.; Liu, J.; Shao, Q.; Fan, J.; Wang, J. Effects of grassland restoration programs on ecosystems in arid and semiarid China. J. Environ. Manag. 2013, 117, 268–275. [Google Scholar] [CrossRef] [PubMed]
- Cantwell, M.D.; Forman, R.T. Landscape graphs: Ecological modeling with graph theory to detect configurations common to diverse landscapes. Landsc. Ecol. 1993, 8, 239–255. [Google Scholar] [CrossRef]


| Data Type | Clarification | Source of Data |
|---|---|---|
| Land use type | 1. Jie Yang, and Xin Huang. The 30 M Annual Land Cover Datasets and Its Dynamics in China from 1985 to 2022. Earth System Science Data. Zenodo, 1 August 2023: 2. Institute of Geographic Sciences and Resources, Chinese Academy of Sciences: www.igsnrr.cas.cn (2022 edition) | |
| Digital Elevation Model (DEM) | DEM was used to further calculate the slope, slope direction, and river system data | ASTER Global Digital Elevation Model V002: https://search.earthdata.nasa.gov/search?q=ASTER (2022 edition) (accessed on 2 May 2024) |
| Roads | Creation of road density calculations for fishing nets | OpenStreetMap |
| Soil type | Cutting, reclassification | Home | Food and Agriculture Organization of the United Nations (fao.org) (2022 edition) |
| Atmosphere | Average annual precipitation | National Tibetan Plateau Science Data Centre: https://data.tpdc.ac.cn/ (accessed on 13 June 2023) |
| Normalized Vegetation Index (NDVI) | normalization | China Ecological Science Data Centre: http://www.nesdc.org.cn/sdo/list (accessed on 15 August 2023) |
| Night Lights | Standard deviation stretch | NOAA EOG: NOAA/NGDC—Earth Observation Group: ngdc.noaa.gov (accessed on 5 March 2022) |
| Soil organic carbon content, effective soil water content | Includes data on soil surface and subsoil content | Hengl, T., MacMillan, R.A. (2019). Predictive Soil Mapping with R. OpenGeoHub foundation, Wageningen, the Netherlands, 370 pages, ISBN: 978-0-359-30635-0 |
| Gross regional product (GDP) | Plotted from an Excel sheet imported into an ArcGIS attribute table. | Xinjiang Statistical Yearbook: https://tjj.xinjiang.gov.cn/tjj/zhhvgh/list_nj1.shtml (2022 edition) (accessed on 2 May 2024) |
| RSEI | Calling of Landsat 8 satellite imagery for June-August 23 through the GEE platform | Google Earth engine.https://developers.google.cn/earth-engine/ (June to August 2023) |
| Sensitivities | Altitude | Elevation | Slope Direction | Body of Water | Plant Cover | Soil Type | Land Use Type | Hierarchy |
|---|---|---|---|---|---|---|---|---|
| Non-sensitive | 53–1300 | Level ground, due south | Level ground, due south | >500 m | 0.8–0.99 | Marshy soils, grey meadow soils | Built-up and unused land | 1 |
| Hypoallergenic | 1300–2000 | South-east, South-west | South-east, South-west | 500–1000 m | 0.6–0.8 | Black calcium soil | Grassland | 2 |
| Medium-sensitive | 2000–2800 | Ramp | East, West | 1000–1500 m | 0.4–0.6 | Calcium chestnut soil | Arable land | 3 |
| Highly-sensitive | 2800–3500 | Steep incline | North-east, north-west | 1500–2000 m | 0.2–0.4 | Grey-calcium Soil, grey-brown soil | Woodland | 4 |
| Higher-sensitive | 3500–6317 | Rapid and dangerous slopes | Main north | <2000 m | 0–0.2 | Inland saline Soils, glaciers | Water Bodies and glaciers | 5 |
| Weights | 0.13 | 0.1 | 0.09 | 0.17 | 0.21 | 0.16 | 0.14 |
| Norm | Count |
|---|---|
| Normalized Difference Vegetation Index (NDVI) | |
| Dryness Barrier Indicator (NDBSI) | |
| Humidity indicator (WET) | |
| Heat metrics (LST) | This indicator is expressed in terms of surface temperature (LST) |
| Drag Factor | Resistance Value | Weights | ||||
|---|---|---|---|---|---|---|
| 1 | 2 | 3 | 4 | 5 | ||
| Land use type | Body of water | Woodland | Grassland | Residential and unused land | Arable land | 0.3518 |
| RSEI | 1–0.7 | 0.7–0.6 | 0.6–0.4 | 0.4–0.2 | 0.2–0 | 0.2666 |
| Road density | 0–0.28 | 0.28–0.85 | 0.85–1.91 | 1.91–4.66 | 4.66–12.93 | 0.2021 |
| Altitude | 530–281 | 1281–013 | 2013–2721 | 2721–3444 | 3444–6317 | 0.1021 |
| Slope | 0–4.44 | 4.44–10.74 | 10.74–17.75 | 17.75–25.92 | 25.92–59.32 | 0.0744 |
| Evaluation Factor | Weights | Affect (Usually Adversely) | |
|---|---|---|---|
| Natural factor | Topographic relief | 0.0568 | Negative direction |
| Vegetation cover | 0.1758 | Forward | |
| Measured quantity of rain | 0.2328 | Forward | |
| Surface soil organic carbon content | 0.0449 | Forward | |
| Sub-surface soil organic carbon content | 0.0556 | Forward | |
| The effective water content of surface soil | 0.0464 | Forward | |
| The effective water content of subsurface soil | 0.0568 | Forward | |
| Social and economic factors | Gross regional product (GDP) | 0.1229 | Negative direction |
| Road density | 0.1023 | Negative direction | |
| Night Lights | 0.1058 | Negative direction |
| Component Indicator | PC1 | PC2 | PC3 | PC4 |
|---|---|---|---|---|
| NDVI | 0.864 | 0.463 | 0.195 | −0.036 |
| WET | 0.397 | −0.400 | −0.823 | −0.073 |
| LST | −0.305 | 0.791 | −0.531 | −0.016 |
| NDBSI | −0.056 | −0.001 | 0.061 | −0.997 |
| Eigenvalue (math.) | 0.052 | 0.0124 | 0.004 | 0.000007 |
| % contribution | 75.64 | 17.99 | 6.36 | 0.01 |
Disclaimer/Publisher’s Note: The statements, opinions and data contained in all publications are solely those of the individual author(s) and contributor(s) and not of MDPI and/or the editor(s). MDPI and/or the editor(s) disclaim responsibility for any injury to people or property resulting from any ideas, methods, instructions or products referred to in the content. |
© 2024 by the authors. Licensee MDPI, Basel, Switzerland. This article is an open access article distributed under the terms and conditions of the Creative Commons Attribution (CC BY) license (https://creativecommons.org/licenses/by/4.0/).
Share and Cite
Pan, R.; Yan, J.; Xia, Q.; Jin, X. Enhancing Ecological Security in Ili River Valley: Comprehensive Approach. Water 2024, 16, 1867. https://doi.org/10.3390/w16131867
Pan R, Yan J, Xia Q, Jin X. Enhancing Ecological Security in Ili River Valley: Comprehensive Approach. Water. 2024; 16(13):1867. https://doi.org/10.3390/w16131867
Chicago/Turabian StylePan, Ruyi, Junjie Yan, Qianqian Xia, and Xufan Jin. 2024. "Enhancing Ecological Security in Ili River Valley: Comprehensive Approach" Water 16, no. 13: 1867. https://doi.org/10.3390/w16131867
APA StylePan, R., Yan, J., Xia, Q., & Jin, X. (2024). Enhancing Ecological Security in Ili River Valley: Comprehensive Approach. Water, 16(13), 1867. https://doi.org/10.3390/w16131867