Article

Hydrological Drought Risk Assessment and Its Spatial Transmission Based on the Three-Dimensional Copula Function in the Yellow River Basin

1
School of Geographical Science and Tourism, Nanyang Normal University, Nanyang 473061, China
2
Key Laboratory of Water Management and Water Security for Yellow River Basin, Ministry of Water Resources (under Construction), Zhengzhou 450009, China
3
Yunnan Water Conservancy and Hydroelectric Survey Design and Research Institute, Kunming 650021, China
*
Author to whom correspondence should be addressed.
Water 2024, 16(13), 1873; https://doi.org/10.3390/w16131873
Submission received: 6 June 2024 / Revised: 22 June 2024 / Accepted: 26 June 2024 / Published: 29 June 2024

Abstract

:
Administrative strategies to cope with drought are steadily changing, from emergency procedures to day-to-day monitoring. More consideration must be paid to long-term and preventive drought control measures in the future. This paper discusses the risk of hydrological drought in the Yellow River Basin. The standardized runoff index (SRI) was used to characterize hydrological drought, and the run theory was used to identify drought states and quantify drought characteristic variables. Based on the drought severity and duration, a drought development plan was proposed and a three-dimensional copula function was constructed to obtain the joint distribution function of three-dimensional drought characteristic variables. A drought risk assessment system based on the loss × probability risk theory was constructed to explore the spatial and temporal characteristics of hydrological drought risk in the Yellow River Basin. Finally, according to the risk assessment results, the risk level was divided into low, medium and high risk, and a Bayesian network was used to explore the probability of hydrological drought. The main results are as follows: (1) From 1960 to 2018, the severity of hydrological drought in the Yellow River Basin increased, the duration lengthened, and the development speed accelerated. (2) The hydrological drought risk in the Yellow River Basin showed an overall upward trend, with the fastest increase in the HJ region of 0.041/10a. The highest annual average drought risk in the TDG region is 0.598. (3) The spatial transmission of hydrological drought risk is divided into three types: constant, enhanced and mitigation types, of which the constant type is the most common. The transmission probabilities of low, medium and high risk of hydrological drought from the HYK region to the low, medium and high risk of hydrological drought in the LJ region are 0.68, 0.66 and 0.78, respectively.

Graphical Abstract

1. Introduction

Drought is a major natural disaster with complex causes, long duration and widespread effects, which are difficult to predict and prevent. It thus has an enduring impact on agriculture, water resources, the environment and the economy, and the consequences are difficult to recover from [1,2]. Drought has increasingly become the leading extreme meteorological disaster, causing substantial losses to society, the economy and ecosystems. Statistics show that 70% of global natural disasters are meteorological, with more than half being droughts [3].
Droughts can be separated into the following types: meteorological drought, hydrological drought, agricultural drought and socioeconomic drought. Among them, meteorological drought is often considered to be the primary type and is generally characterized by insufficient precipitation [4]. After the meteorological drought, the water loss resulting from insufficient precipitation will be transmitted to all steps of the water cycle, which will lead to hydrological drought, agricultural drought and ultimately socioeconomic drought [5]. Scholars have extensively analyzed the spatiotemporal variations of different hydrological drought types. For instance, Graw et al. quantified drought with a remote sensing-derived index, classifying droughts according to their timing and duration [6]. Zhu et al. used the standardized runoff index (SRI) to characterize hydrological droughts and examined the transition from meteorological to hydrological droughts [7]. Additionally, van Loon and Laaha provided a comprehensive summary of the definitions, processes and scientific quantification of hydrological droughts [8]. Advances in hydrological drought research have led to the establishment of mature methodologies for calculating drought indices, identifying drought events and quantifying drought characteristics. However, the current quantification mainly focuses on the severity, duration and frequency of complete drought events, neglecting the drought development process. With climate change intensifying, the incidence of sudden droughts is on the rise [9]. This paper thus explores the rate of drought development, aiming to offer a more comprehensive description of drought characteristics and contribute new insights and methodologies for drought identification and characteristic quantification. In addition, some studies have employed the copula function for comprehensive drought analysis. For example, Farrokhi et al. introduced a novel method for modeling multivariate dependencies of meteorological drought characteristics (severity, duration, peak and interval time), based on a combination of four-dimensional vine copulas and a data mining algorithm (hereafter called vc-dm) [10,11]. Reddy and Ganguli performed a three-dimensional joint analysis of drought intensity, duration and frequency using the copula function [12]. Mirabbas et al. also used the copula function to carry out binary bivariate analysis of droughts [13].
The term “risk” was first proposed by Western scholars in the field of economics at the end of the 19th century. It indicates uncertainty about the outcome of an activity. Later, the concept of risk was gradually introduced into the research field of natural disasters. In the study of drought risk, some scholars believe that probability-related concepts such as the occurrence probability, frequency and return period of droughts constitute drought risk. For instance, Apurv et al. quantified drought risk using frequency methods under both stationary and non-stationary hypotheses, finding a significantly higher risk under the latter, which may lead to the underestimation of future drought risk [14]. Yang et al. combined the Markov chain Monte Carlo method with the maximum entropy copula to develop a drought risk assessment based on the bivariate co-occurrence probability of drought duration and severity [15]. This method has certain advantages in that it reflects the uncertainty of drought assessment. Furthermore, some researchers argue that drought risk assessment should incorporate multiple factors, including physical mechanisms and socioeconomic aspects. Tsakiris, for instance, emphasizes the need to consider system vulnerability in drought risk [16]. Relevant studies have developed evaluation index systems to quantitatively assess exposure, environmental vulnerability, disaster prevention and mitigation capacities at the basin or regional level. Drought duration, severity and probability of occurrence, taken together, stand in for the risk of disaster-causing factors, employing a method akin to the “four-factor” theory of basin-level drought risk evaluation. Dunne et al., for instance, used various indicators to evaluate exposure and vulnerability based on drought metrics specified by agricultural authorities when conducting a risk assessment in the Murray Darling Basin, Australia [17]. Hagenlocher et al. reviewed numerous studies on conceptual and methodological aspects of drought risk assessment over the past two decades. They found that over 60% of the assessments lacked a clear specification of the drought hazard type, while 42% did not clearly define drought risk [18]. Therefore, in the current study, the definitions of drought types and drought risk need to be further clarified. Therefore, based on the characteristics of the drought itself, drought loss is represented by drought characteristic variables, and a drought risk assessment system based on the loss × probability risk theory is constructed. This comprehensively reflects the drought risk and its possible impact.
Current research on drought transmission has shifted from focusing on event transmission to quantifying drought risk transmission, facilitating a transition in drought management from passive crisis response to active risk management. Some scholars have carried out research on the law of drought risk transmission, but most of the research fails to consider the risk level. Therefore, based on a hydrological drought risk assessment, this paper further discusses its transmission law. The technical roadmap of this paper is shown in Figure 1.

2. Materials and Methods

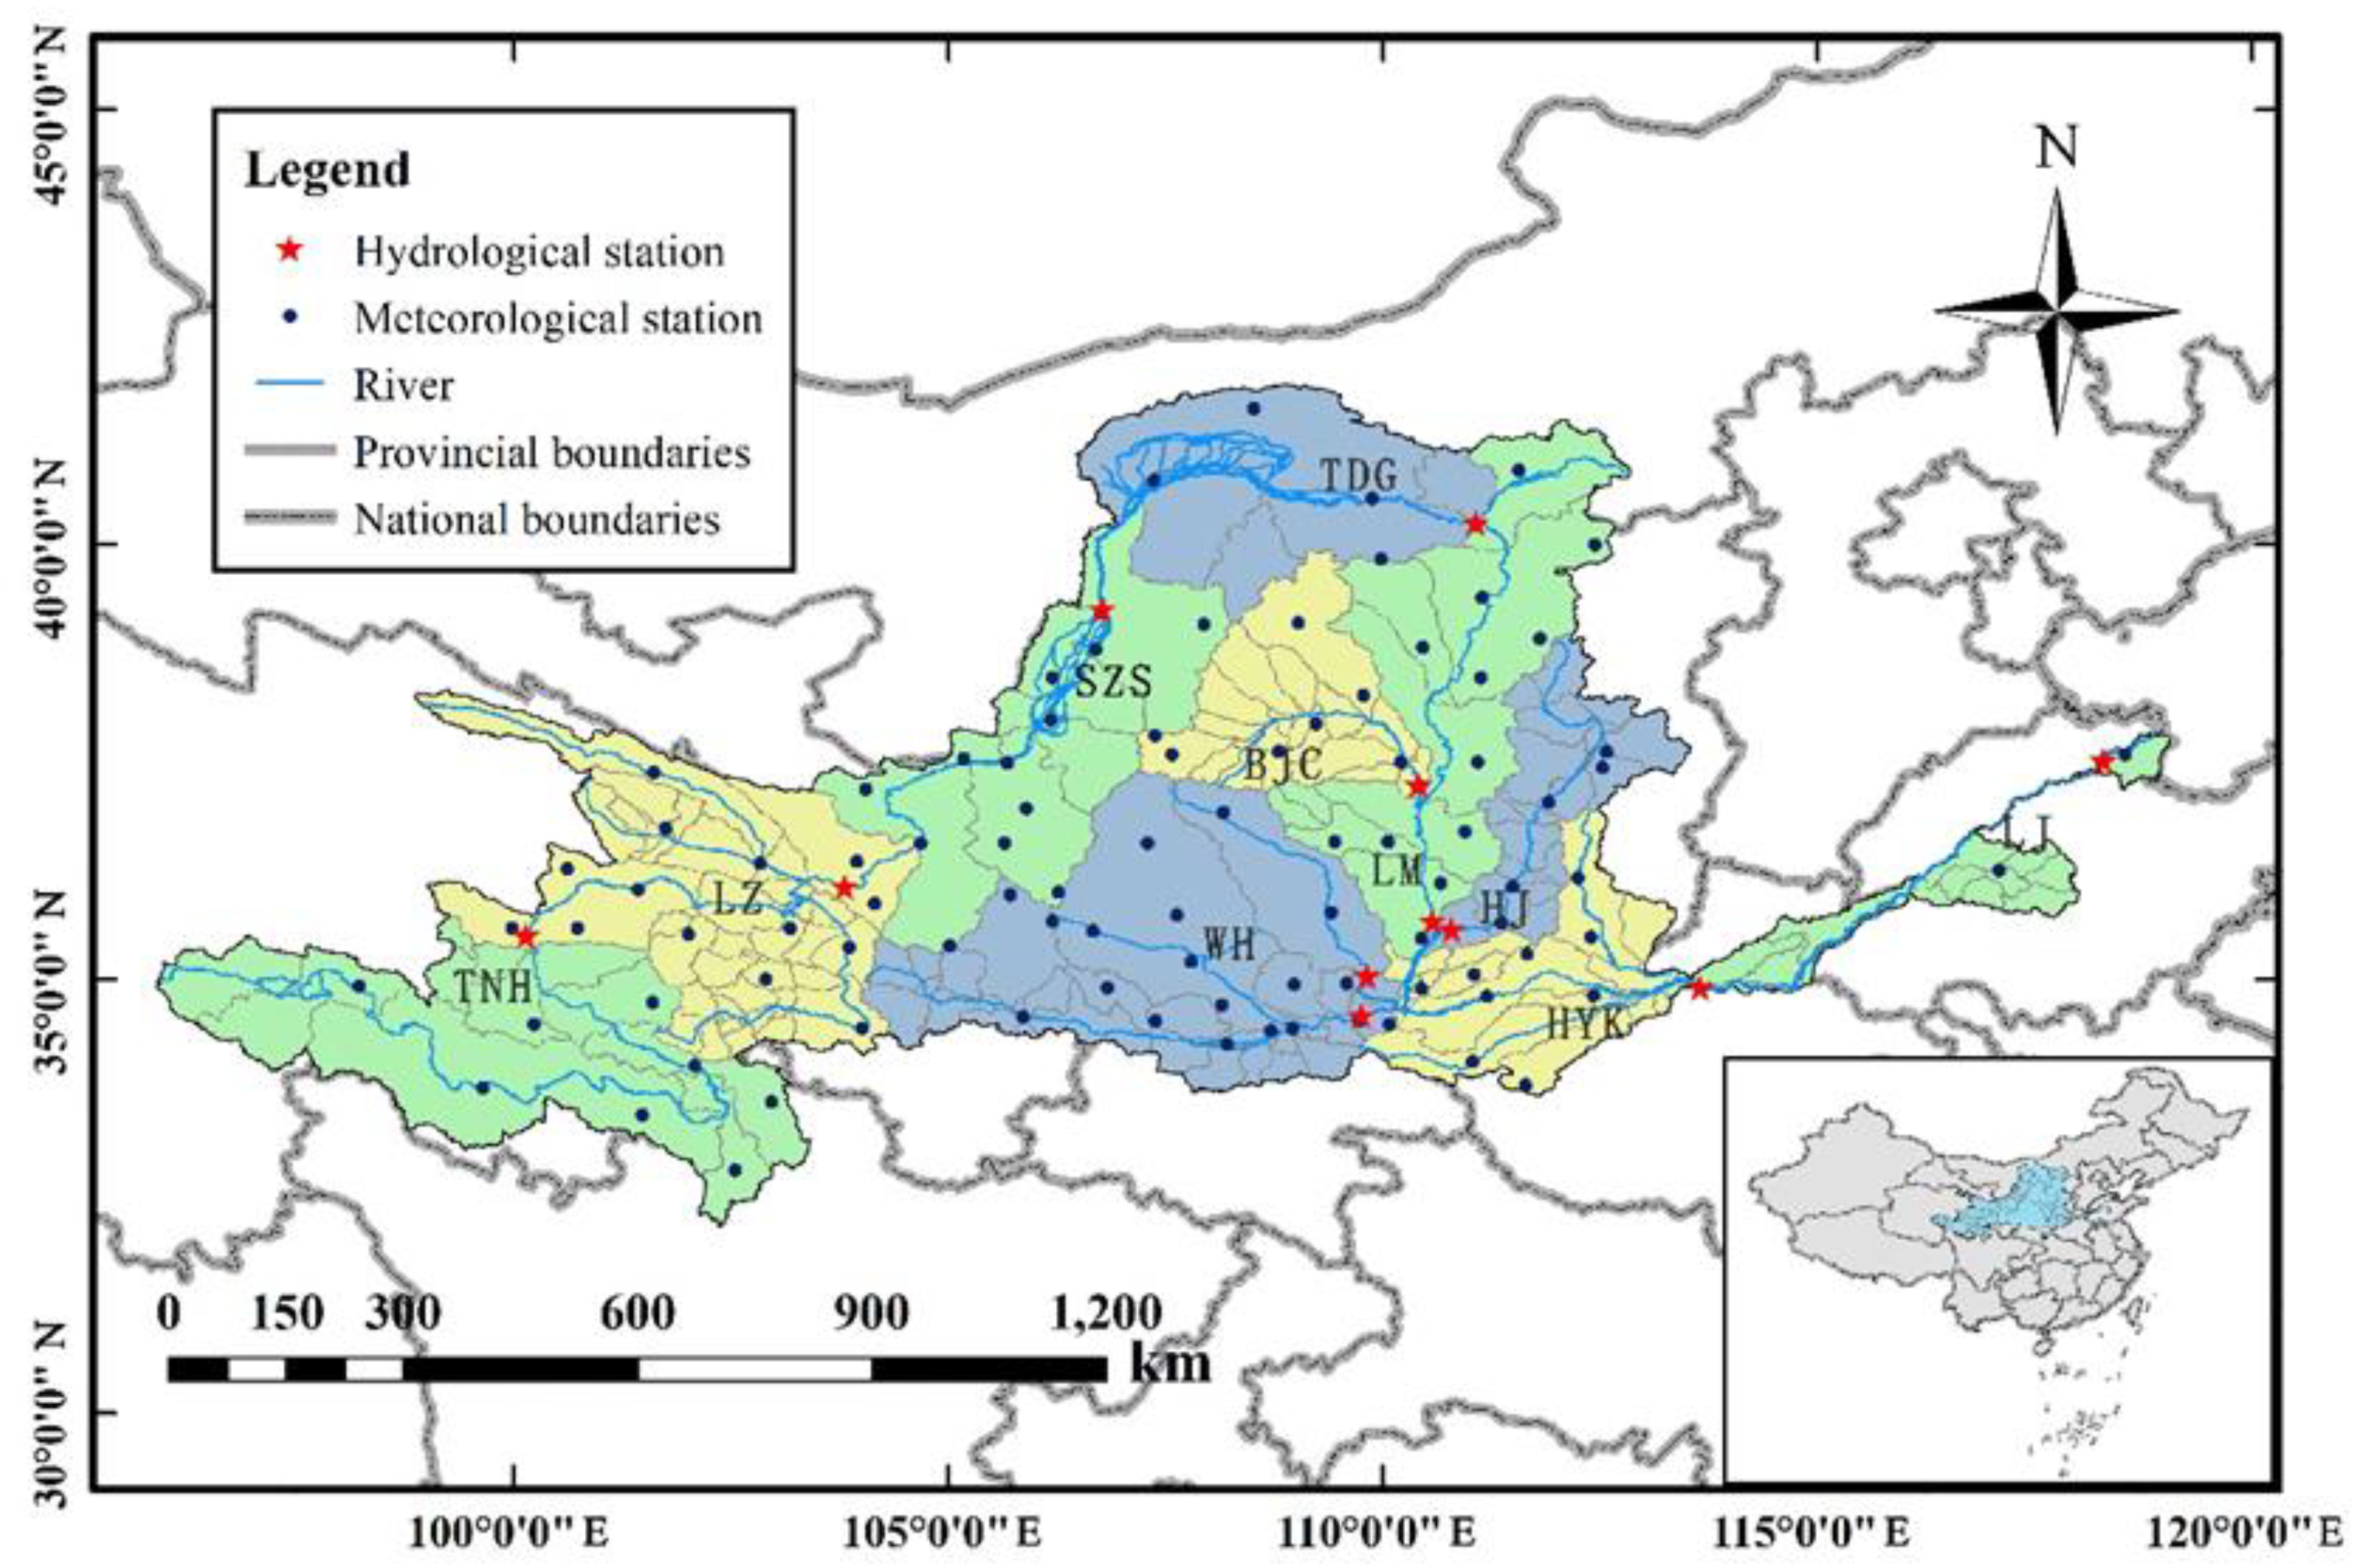
2.1. Study Area and Data

The Yellow River Basin, situated in northern China, spans from 115°24′ E to 121°55′ N and from 31°37′ N to 39°59′ N. It stretches 1900 km from east to west and 1100 km from north to south, covering a drainage area of approximately 795,000 square kilometers. The distribution of water resources across the basin is spatially and temporally uneven. The average annual flow in the Yellow River Basin is approximately 53.5 billion m3, though this volume fluctuates significantly across different years and seasons. In the upper reaches, the water yield constitutes about 60% of the total volume with stable runoff, whereas the middle reaches contribute around 40% of the total water volume. The flood season (July to October) accounts for 60% of the annual runoff, while the dry season (March to June) accounts for only 10% to 20% [19,20].
This paper employs monthly runoff data from 11 hydrological stations in the Yellow River Basin from 1960 to 2018, including Tangnaihai, Lanzhou, Shizuishan, Toudaoguai, Baijiachuan, Huaxian, Zhuangtou, Longmen, Hejin, Huayuankou and Lijin. Natural runoff data were taken from the Hydrological Yearbook of the People’s Republic of China (hydrological data of the Yellow River Basin). According to the location of hydrological stations, the Yellow River Basin is divided into 10 subregions: TNH (Tangnaihai), LZ (Lanzhou), SZS (Shizuishan), TDG (Toudaoguai), BJC (baijiachuan), WH (Weihe) (Huaxian, Zhuangtou), LM (Longmen), HJ (Hejin), HYK (Huayuankou) and LJ (Lijin), as shown in Figure 2. Specific site information is given in Table 1.

2.2. Research methods

2.2.1. Drought identification and feature quantification

  • Drought index calculation
The standardized runoff index (SRI) is used in this work to symbolize the hydrological drought. A drought index that is created by using the measured runoff as a variable is called the standardized runoff index, or SRI. It has been extensively utilized in the assessment and identification of hydrological drought. The pertinent literature also introduces a particular computation procedure [5,21,22]. First, a distribution function is fitted to the runoff data. This involves discussing the optimal distribution function that the monthly runoff data in each region of the Yellow River Basin satisfy. Five distribution functions, including normal, logistic, exponential, gamma and Weibull, are fitted to the runoff data. Maximum likelihood is used to estimate each distribution function’s parameters, and the Bayesian information criterion (BIC) and Akaike information criterion (AIC) methods are used to assess the fitting impact. The fitting result is optimized, and a K-S (Kolmogorov–Smirnov) test is conducted. If the test is passed, the distribution function is considered to be satisfied by the runoff data. Finally, the SRI value corresponding to the runoff data can be obtained through the inverse operation of the normal distribution function. Details on the AIC, BIC and K-S tests are given in previous studies [23,24].
According to the drought index value, the drought level can be divided into five levels: no drought, mild drought, moderate drought, severe drought and extreme drought, as shown in Table 2.
2.
Run theory
The run length theory, proposed by Yevjevich in 1967 [25], is usually used to identify disaster events. Figure 3 shows a conceptual map for identifying drought events based on the run length theory. First, the run length theory threshold is established. A drought event is said to have occurred when the duration surpasses a predetermined length and the drought index is below the threshold. The severity of the drought event is determined by the accumulation of the disaster index over the course of the drought, and this severity is then divided by the disaster’s duration. Herbst first used this method to identify drought events [26]. At present, it has been widely used in the identification of drought events and can pick out traits such as drought start time, end time, duration, and severity [27,28]. In this paper, the run length theory is used to identify the drought months every year and quantify the drought’s severity, S, and drought duration, D. On this basis, this paper further considers the drought development speed, which is recorded as KF. S indicates the degree of rainfall or runoff deficit in the basin or region, D indicates the duration of rainfall or runoff deficit in the basin or region, KF indicates the time taken for the drought development period of the basin or region to develop from a normal state to the most severe drought in the current year, and the drought development speed reflects the regional drought’s resistance ability. The faster the drought development speed, the worse the regional drought resistance ability becomes. Through the quantitative analysis of these three variables, the regional drought situation can be discussed more comprehensively. As shown in the figure, when the drought index value is lower than the threshold value of −0.5, the area is considered to be in a drought state in the current month. In general, the Yellow River Basin is mainly dry and rainless in winter. The details are as follows:
Assuming that there are i months of a year in a drought state, the corresponding drought severity of each month is S1, S2, …, Si:
D = i
S = S 1 + S 2 + + S i
K F = S s t a r t - S f max s t a r t - max ,
where D represents drought duration, S represents drought severity, KF represents drought development speed, Sstart is the drought severity at the beginning of the drought development period and Sfmax is the drought severity at the most serious point.

2.2.2. Drought Risk Assessment Method Based on Three-Dimensional Copula Function

This paper defines the drought risk according to the probability × loss risk theory and considers that drought risk is the possible adverse effects caused by drought conditions such as insufficient precipitation, runoff reduction and soil water content reduction, which can be divided into meteorological drought risk, hydrological drought risk and agricultural drought risk, according to the different influencing factors. We take drought severity, drought duration and drought development speed as negative indicators, i.e., they can indicate the adverse effects of drought. Through the comprehensive consideration of these three-dimensional drought characteristic variables, the drought risk can be more accurately assessed. The specific expression of drought risk assessment is as follows:
S = S max S S max S min
D = D D min D max D min
K F = K F K F min K F max K F min
R = ( S + D + K F ) P 3 ,
where R refers to drought risk; S′, D′, KF′ are the normalized and isotropic variables of S, D and KF, respectively (the larger S′, D′, KF′ are, the more unfavorable the situation); and P is the probability of adverse events, i.e., the probability of at least one of the three adverse conditions: s′ > S′, d′ > D′, kf′ > KF′. The specific formula is as follows:
P = 1 P ( s S , d D , k f K F ) = 1 F S , D , K F ( s , d , k f ) = 1 C S , D , K F ( F S ( s ) , F D ( d ) , F K F ( k f ) ) .
The construction method of  C S , D , K F ( F S ( s ) , F D ( d ) , F K F ( k f )  is as follows.
As drought is a very complex natural phenomenon, a single variable cannot fully describe the drought situation. Therefore, it is necessary to carry out joint analyses on multiple characteristic variables of drought, and constructing a joint distribution function is a common method. For the independent variables, it is very easy to construct the joint distribution, but the drought characteristic variables are obviously correlated. A copula function is a versatile multivariate joint distribution modeling tool that can describe the correlation structure between variables and overcome edge distribution limits. It allows random variables to establish different edge distributions based on their unique characteristics, and then connects the edge distributions to form a joint distribution. Consequently, fitting was used to create copula functions for the three drought characteristic variables, and the copula function yielded the joint distribution function.
The univariate edge distribution can be connected using a copula function to create a multivariate function that follows a uniform distribution on the [0,1] interval. Let X1, X2, …, Xn be random variables, and let F1, F2, …, Fn be univariate distribution functions, such that there exists a copula function C for any X that satisfies  F ( x 1 , x 2 , , x n ) = P X 1 x 1 , X 2 x 2 , X n x n = C ( F 1 ( x 1 ) , F 2 ( x 2 ) , F n ( x n ) ) .
  • where  x 1 , x 2 , , x n  are sample observations;  F 1 ( x 1 ) , F 2 ( x 2 ) , F n ( x n )  are the corresponding edge distribution functions.
A joint distribution function of three drought characteristic variables is constructed in this study using the nested copula approach. The development of a three-dimensional copula function is divided into two parts. Each step estimates the parameters of a binary copula function, thereby avoiding the difficulty of directly estimating the parameters of multivariate copula function. Different types of binary copula function can be selected at each step so as to achieve a better fitting effect. The specific process was as follows:
The first step was fitting the marginal distribution of drought characteristic variables S, D and KF after the treatment. Normal, logistic, exponential, gamma and Weibull distributions were selected to fit the edge distribution function of the transformed drought characteristic variables. AIC and BIC were used to test the fitting effect. The distribution function with the best fitting effect was selected for the K-S test. If it passed the test, it was considered that the sample data obeyed the selected distribution function, and the assumptions were the following:  F S ( s ) , F D ( d ) , F K F ( k f ) .
The second step was the construction of a two-dimensional copula function: first, we selected the edge distribution functions  F S ( s ) F D ( d )  to construct a two-dimensional copula function and selected five commonly used copula functions, Gaussian, t, Glayton, Gumbel and Frank to fit  F S ( s ) F D ( d ) . Finally, we used the maximum likelihood method to estimate the parameters. We used MSE, Kendall’s τ and Spearman’s ρ. The rank correlation coefficient was used to evaluate the fitting effect. We selected the distribution function with the best fitting effect, and used the K-S test method based on Rosenblatt integral transformation to test the goodness of fit. If it passed the test, it was believed that the correlation structure between the variables can be accurately described by the copula function, which is written as  C S , D ( F S ( s ) , F D ( d ) , θ S , D ) .
The third step was the construction of a three-dimensional copula function. On the basis of the two-dimensional copula function, the third drought characteristic variable KF was nested, and the constructed  C S , D ( F S ( s ) , F D ( d ) , θ S , D )  was regarded as a new edge distribution function. The two-dimensional copula function was constructed again with the edge distribution function  F K F ( k f )  of the third variable. Through parameter estimation, fitting optimization and statistical tests, three-dimensional copula functions were obtained:  C S , D , K F ( F S ( s ) , F D ( d ) , F K F ( k f ) , θ S , D , K F ) .
In the above equation,  θ S , D , θ S , D , K F  are the corresponding parameters of the two-dimensional copula function and the three-dimensional copula function, respectively.
Once the construction of the three-dimensional copula functions for the three drought characteristic variables was completed, the corresponding joint distribution function could be obtained:  F S , D , K F ( s , d , k f , k h ) = C S , D , K F , K H ( F S ( s ) , F D ( d ) , F K F ( k f ) ) .
The different properties of drought, as well as the likelihood of occurrence and the characteristics of the drought itself, can be thoroughly considered through the definition and design of drought risk. All variables in the formula are normalized and isotropic data, and the range is between 0 and 1; the probability p is also between 0 and 1. Therefore, the range of the drought risk value obtained is [0,1], which is convenient for horizontal comparison in time or space. At the same time, the probability structure of P can cover the adverse conditions of most droughts; that is, conditions of high drought severity, long drought duration, rapid drought development, single occurrence or simultaneous occurrence. An area must adopt countermeasures if there is a greater chance of drought because this increases the region’s potential losses from drought. We can identify factors contributing to high or low drought risk and implement targeted risk-reduction actions based on the findings of the drought risk assessment and the overall characteristics of drought. In addition, the results of the drought risk assessment can help us to further explore the law of drought risk transmission.

2.2.3. Quantitative Methods of Drought Risk Transmission Law

3.
Equal frequency discrete method
In order to meet the requirements of the later algorithm and improve the robustness of the model to outliers, the drought risk obtained from the previous evaluation was discretized into the three levels of low, medium and high risk by using the equal frequency discrete method. This is a method of data analysis that statisticians frequently employ [29,30]. This technique involves segmenting the data interval according to the data’s frequency distribution in order to generate a consistent data distribution and more accurately depict varying risk levels. Earlier research employed comparable techniques to categorize drought. For example, Zhou et al. defined the boundaries between mild and moderate drought, moderate and severe drought and severe and extreme drought according to the Kendall frequency values of 0.5, 0.25 and 0.1, respectively [31]. Hao et al. classified drought according to the drought percentile categories recommended by the U.S. Drought Monitor: d0 (20 to 30), D1 (10 to 20), D2 (5 to 10), D3 (2 to 5) and D4 (≤2) [32]. For SPI, these categories correspond to the thresholds of −0.5, −0.8, −1.3, −1.6 and −2. This study refers to the above research and discretizes the drought risk based on the frequency of drought risk value in each region.
4.
Bayesian network
The Bayesian network, alternatively referred to as the belief network, is a theoretical model that is highly successful at explaining and reasoning about ambiguous knowledge. It is a continuation of the Bayesian technique proposed by Pearl in 1988, and it has become a hot research topic in recent years. A directed acyclic graph (DAG), with nodes standing in for variables and directed edges joining them, is what makes up a Bayesian network. Random variables are represented by nodes, and the link between nodes is shown by the directed edge connecting them (from the parent node to its child node). Conditional probability expresses the strength of the association, whereas a priori probability expresses the information in the absence of a parent node. The connection between every two nodes is based on a Bayesian formula. Using a Bayesian network, the causal relationship between events (nodes) can be displayed intuitively. This is suitable for expressing and analyzing uncertain and probabilistic events and for conditionally relying on a variety of control factors. It can facilitate reasoning from partial, inaccurate or ambiguous knowledge or data. The particular procedure and approach for Bayesian network application analysis can be found in earlier studies [28]. For this paper, a Bayesian network was used to quantify the spatial transmission law of hydrological drought risk.

3. Results

3.1. Hydrological Drought Characteristics of the Yellow River Basin

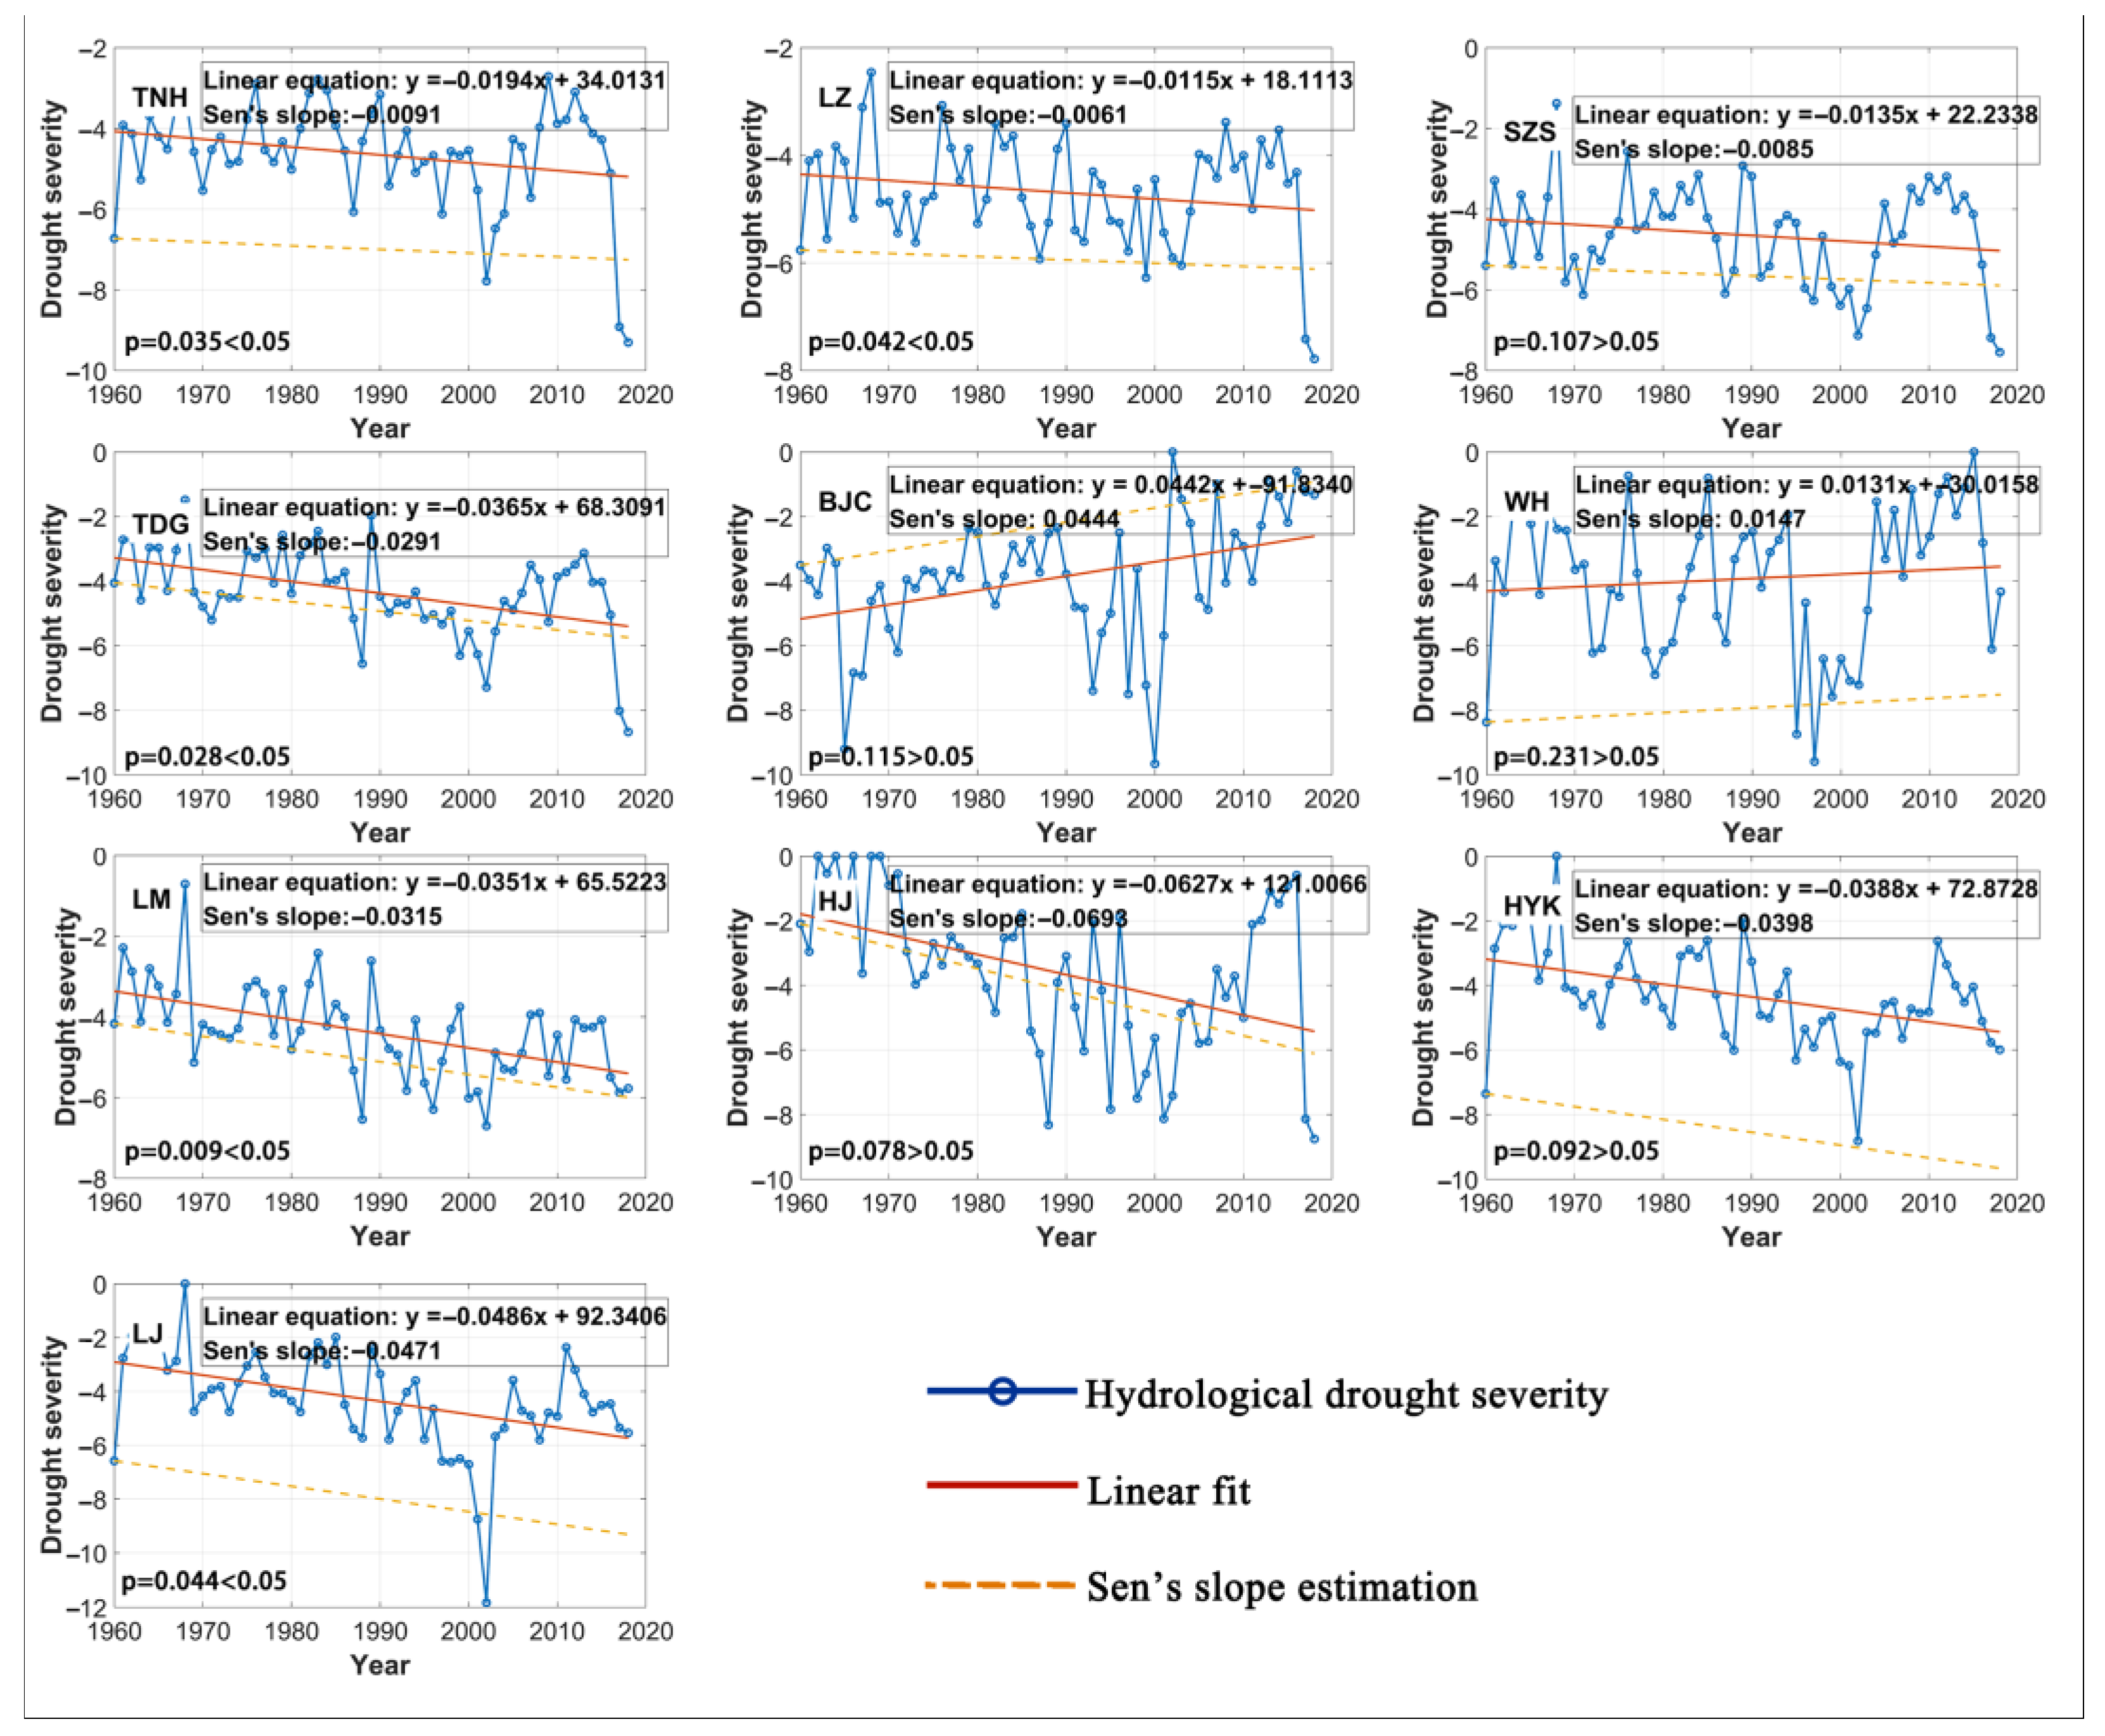
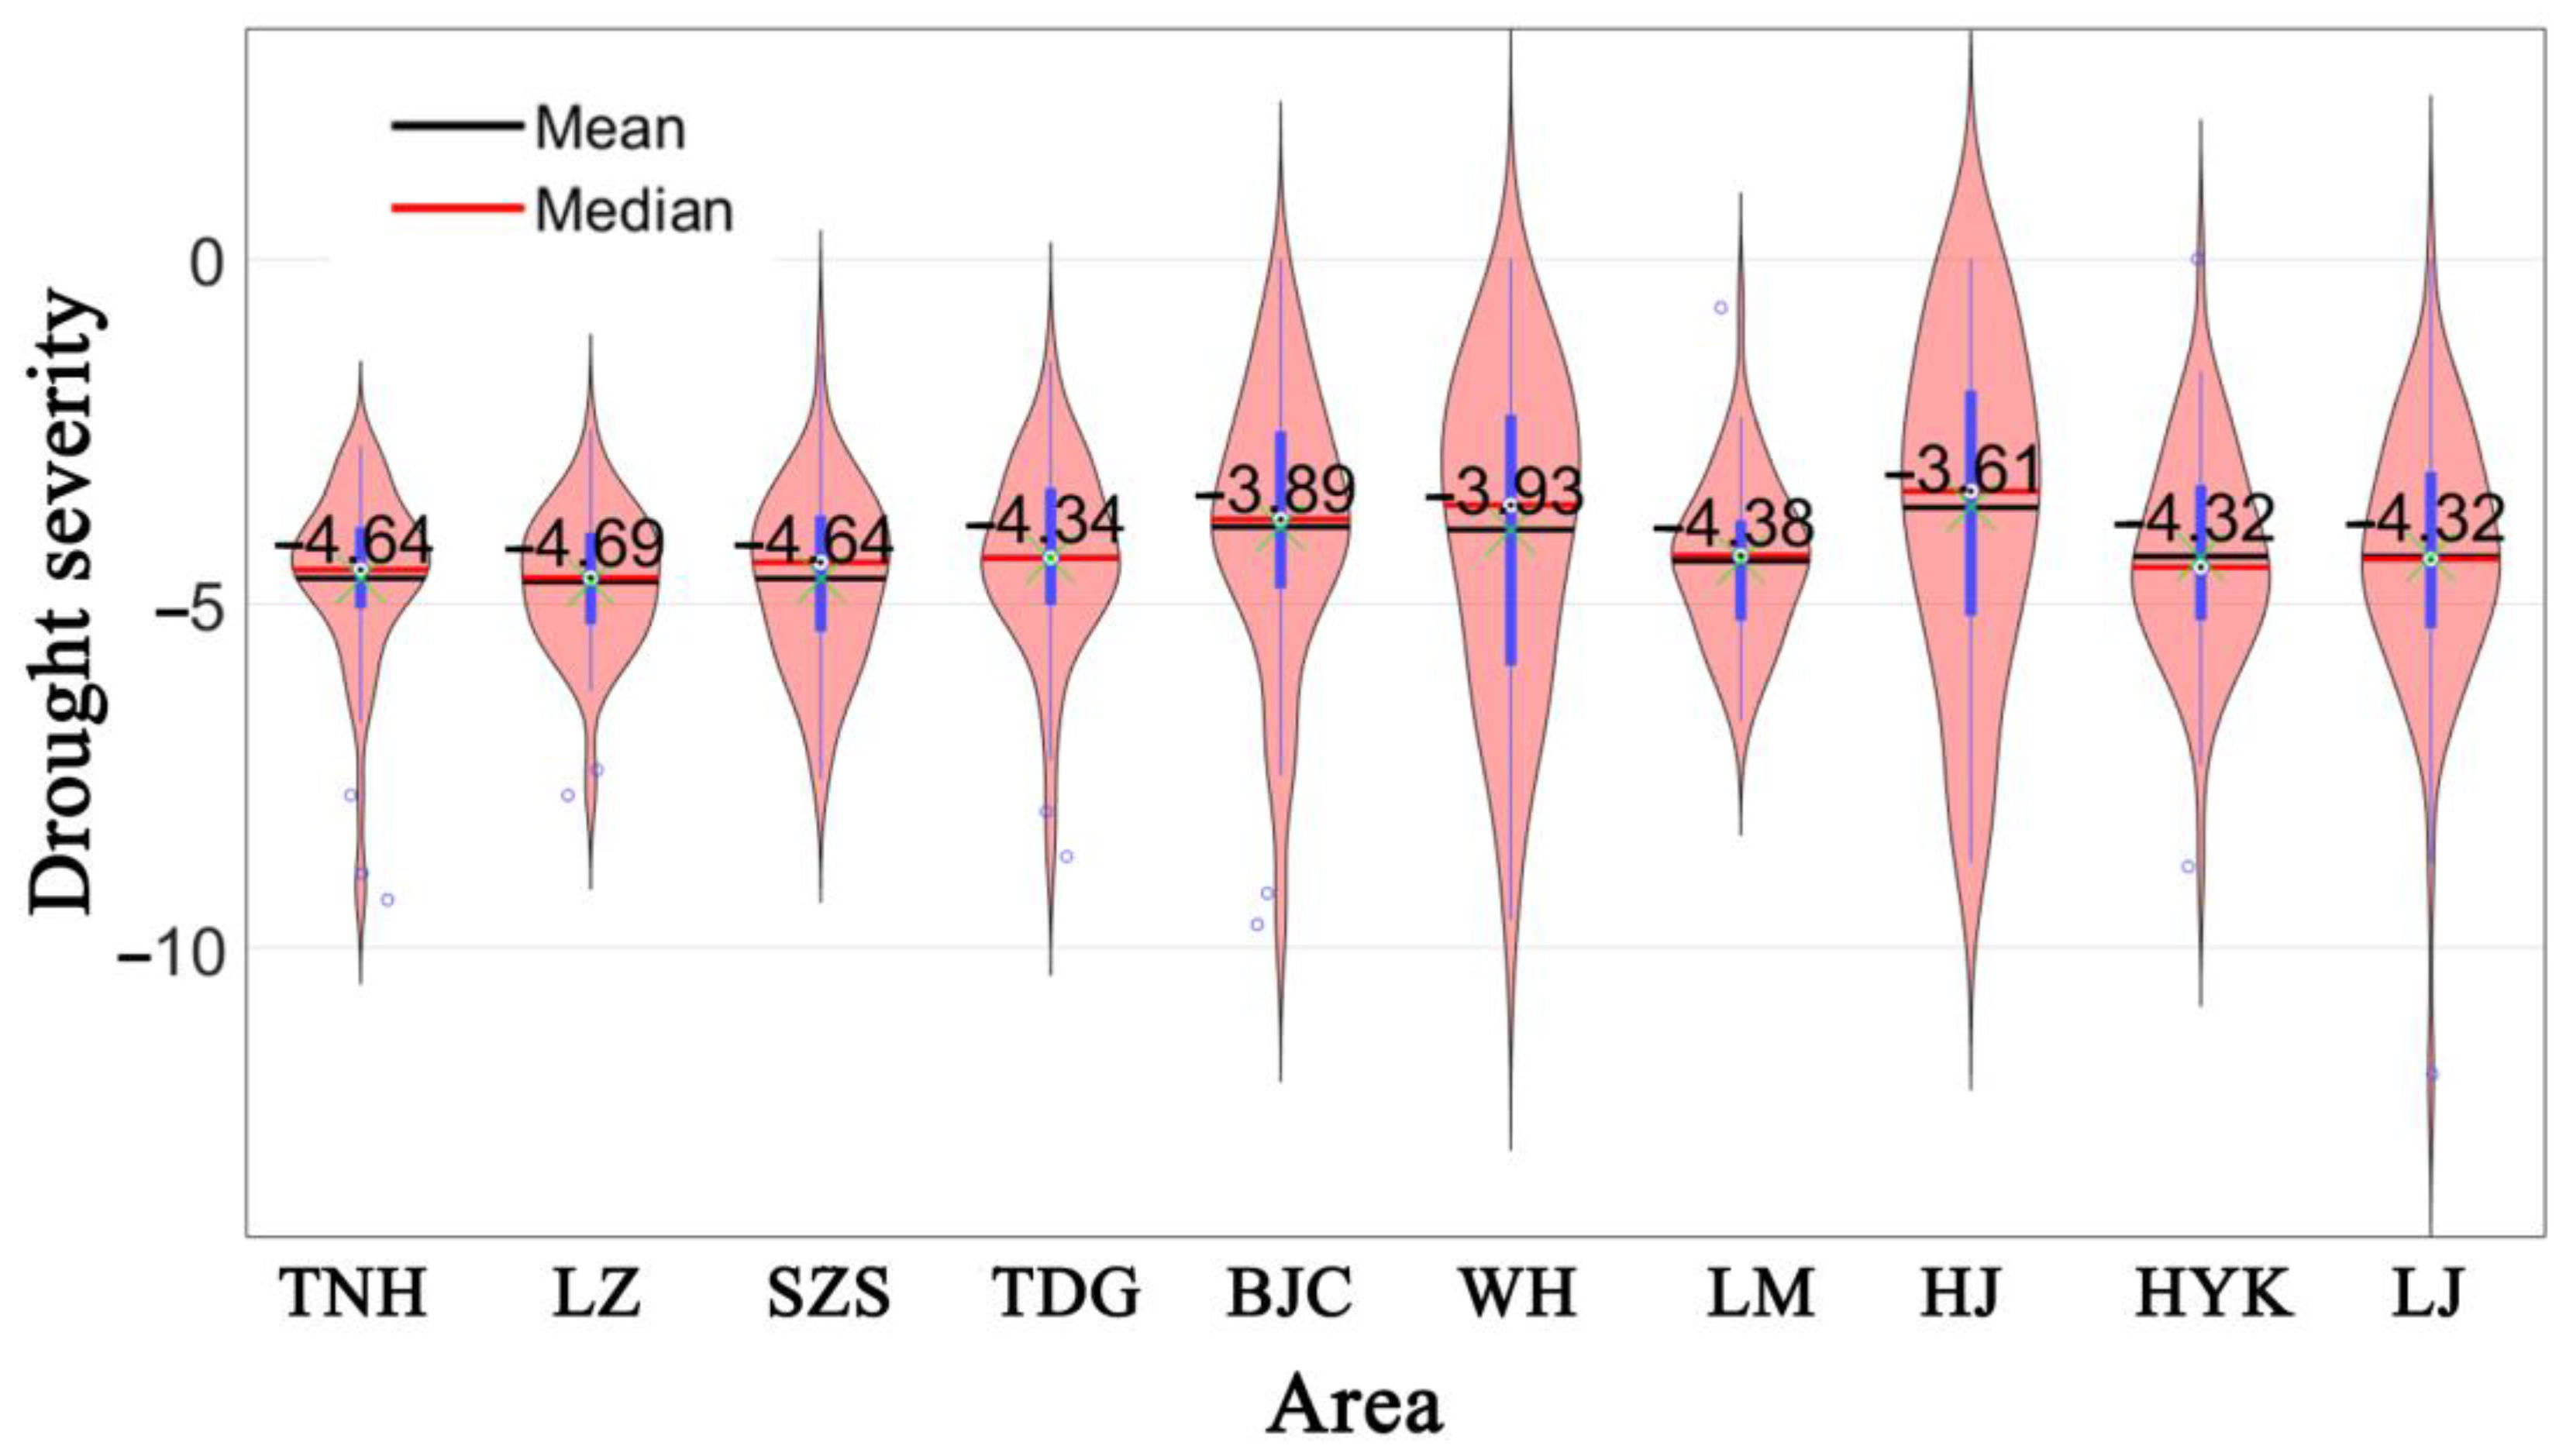
3.1.1. Hydrological Drought Severity

The hydrological drought severity, quantified based on SRI, represents the degree of runoff deficit of a basin or region in the current year. The greater the absolute value of drought severity, the more serious the runoff deficit of the basin or region. The run length theory determines the hydrological drought severity in each section of the Yellow River Basin. Sen’s slope method and linear trend fitting are used to describe the trend of change in drought [33,34]. The results are shown in Figure 4, which shows that the overall trend of hydrological drought severity in each region of the mainstream of the Yellow River was increasing to varying degrees. At the same time, only the BJC and WH regions show a decreasing trend; BJC’s is more obvious, about 0.044/a, while the change trend in the WH region is relatively gentle, about 0.013/a. In addition, the hydrological drought severity in the source region of the Yellow River shows a slow increasing trend, and the values in the TNH and LZ regions are −0.019/a and −0.012/a, respectively, with no obvious change in trend. The changes in the middle and lower reaches, such as LM and HYK, are more dramatic, showing a downward trend of −0.035/a and −0.039/a, respectively. The HJ region, where the Fenhe River Basin is located, experienced the most obvious change, with the hydrological drought severity worsening by −0.063/a. The hydrological drought severity in the HYK and LJ regions represents the overall situation of the Yellow River Basin: both regions showed an obvious worsening trend.
Figure 5 compares the hydrological drought severity in each region, showing the average and median of hydrological drought severity in each region over the years, as well as the distribution of the data. It can be seen that the average hydrological drought severity along the mainstream of the Yellow River Basin is relatively close, which may be due to the continuity of the mainstream. The average values are less than −4, indicating that the drought situation is more serious than that of the tributaries, but more serious in the upstream. The TNH and LZ regions in the source region reached −4.64 and −4.69, respectively, reflecting the fact that the uneven distribution of runoff in this region is more serious than in other regions. From the data distribution in the box chart and violin chart, it is evident that the hydrological drought severity data distribution in the upper reaches of the Yellow River is the most concentrated. At the same time, due to the centralized data distribution, there are more outliers identified, and the data distribution of BJC, WH and HJ in the area where the tributary is located is more scattered, with fewer outliers. In addition, the hydrological drought severity data of the HYK and LJ stations in the lower reaches of the Yellow River Basin are scattered. The low abnormal values, about −9 and −12, respectively, indicate that there was a relatively serious hydrological drought in that year.

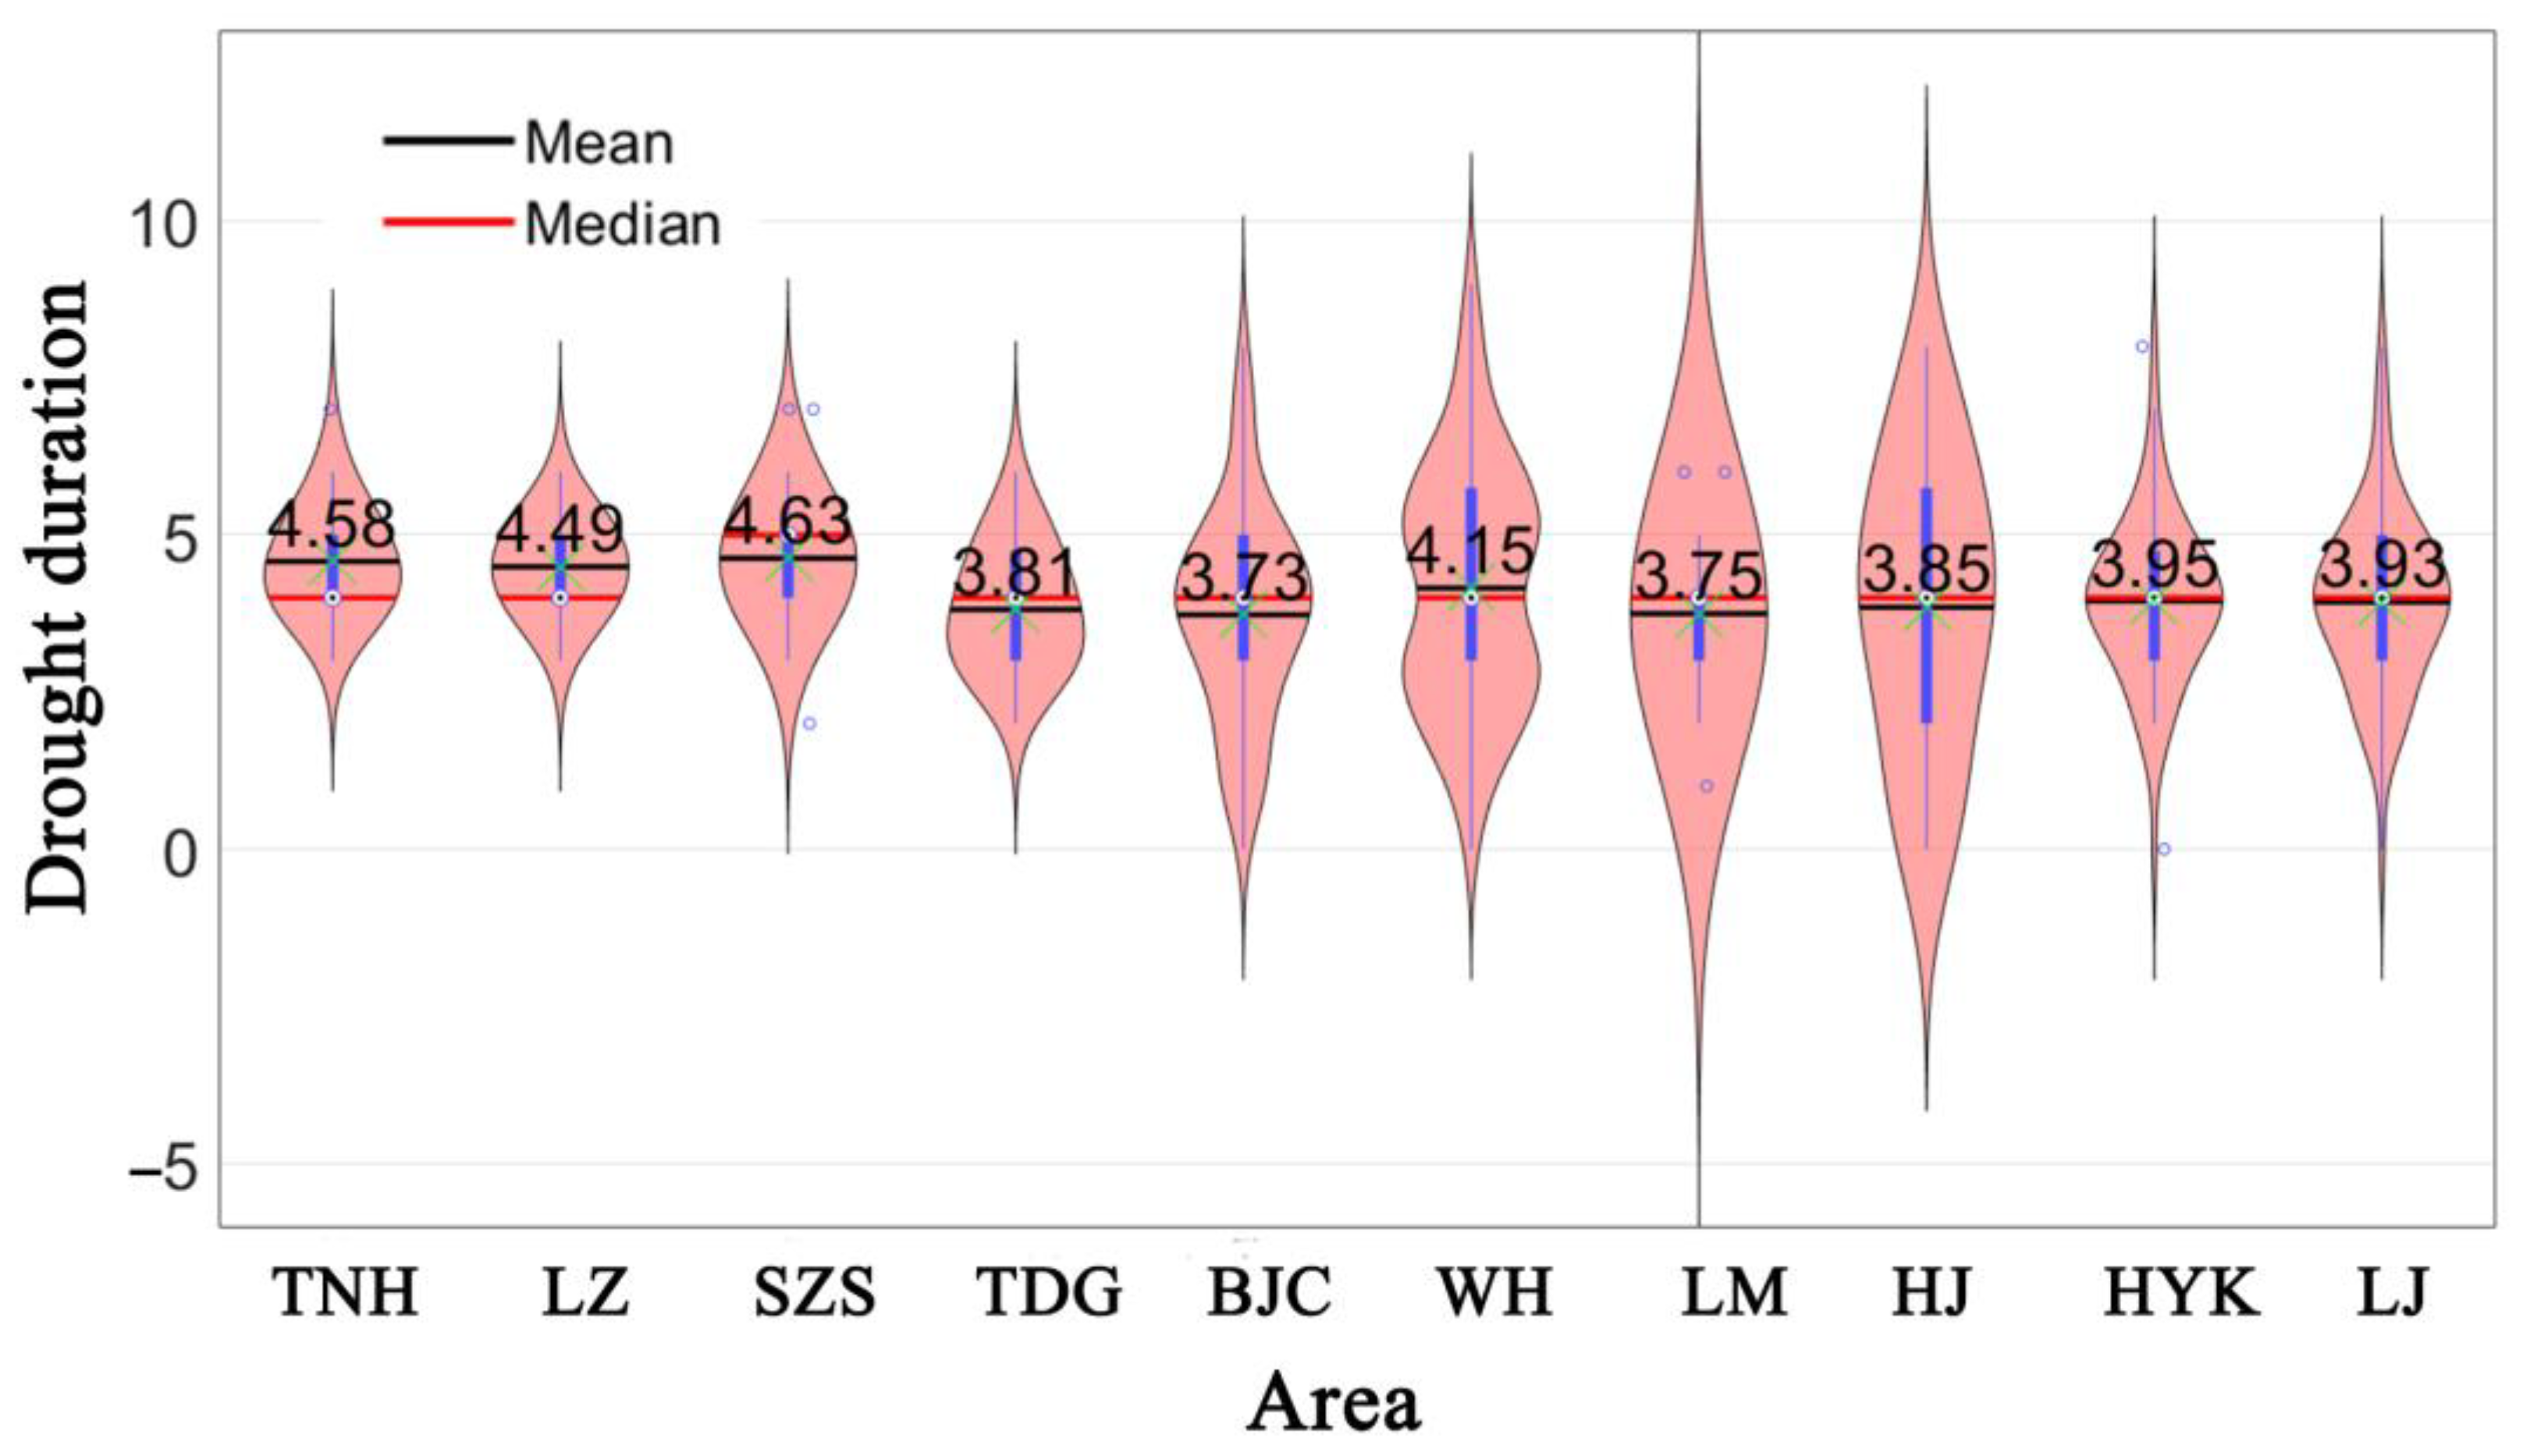
3.1.2. Hydrological Drought Duration

The duration of hydrological drought, based on SRI, represents the duration of runoff deficit in a basin or region. Most people agree that there is a relationship between the length and severity of a hydrological drought; that is, the longer the drought, the more severe it is [35]. The variation of hydrological drought duration in various regions of the Yellow River Basin is shown in Figure 6. In the estimation of the diachronic variation trend, the Sen’s slope estimation method cannot accurately capture the changes in data due to the characteristics of the algorithm. This is because the change in drought duration is not obvious, and the value is too discrete. It can be seen from the figure that only the Sen’s slope estimation method could obtain the data change slope, which is similar to the linear trend fitting result for the BJC and HJ regions, where there were large hydrological drought duration changes and more data fluctuations. The figure shows that the hydrological drought duration in all regions except BJC showed an overall upward trend. It can be seen from the HYK and LJ stations (0.227/10a and 0.266/10a, respectively) that the overall hydrological drought duration in the Yellow River Basin showed a slow upward trend. On the whole, the change rate in each region was not high, and the rise rate of each region in the upstream was relatively slow, with the source region being the highest and the TNH and LZ regions at 0.075/10a and 0.029/10a, respectively. However, the trend and data for before and after the mutation showed different characteristics. The TNH region showed a downward trend before the mutation, while it rose afterward; the LZ region showed the opposite situation. According to the figure, the duration of hydrological drought increased the fastest in the HJ region, about 0.426/10a, while the change in the WH region was the least obvious, and the long-term trend was close to 0.
By comparing the average duration of hydrological drought in various regions of the Yellow River Basin, as shown in Figure 7, it can be seen that the duration of hydrological drought was similar to the severity. Except for TDG, the average duration in each region in the upper reaches was relatively high, at 4.58, 4.49 and 4.63, respectively. Only the WH region in the middle and lower reaches had an average duration of more than four months. The data distribution of each region in the upper reaches was relatively concentrated, and the distribution of BJC, WH and HJ in the middle and lower reaches was relatively scattered: 0–8 months, 0–9 months and 0–8 months, respectively. At the same time, the LM region showed more abnormal values. The duration of hydrological drought in this region in 2000 and 2002 was 6 months, while the duration for most other years in this region was 3–4 months, so 6 months was identified as a high abnormal value. In each region of the mainstream of the Yellow River, the data distribution of the HYK and LJ regions in the lower reaches was relatively scattered, indicating that there were many changes in runoff, which is affected by long-term hydrological drought. In 1960, 2001 and 2002, the duration of hydrological drought was 7 months, 7 months and 8 months, respectively.

3.1.3. Hydrological Drought Development Speed

The development speed of hydrological drought is essentially the value of monthly drought index reduction, which represents the speed of runoff from a normal state to a shortage state. Figure 8 shows the change trend of hydrological drought development speed in various regions of the Yellow River Basin in the past 60 years. The long-term trend obtained by linear trend fitting and Sen’s slope estimation is basically the same. The development speed of hydrological drought in the upper reaches tends to slow down, while that in the middle and lower reaches tends to accelerate. The change trend of the source area was not obvious. That for the TNH and LZ regions was about 0.021/10a and 0.016/10a, respectively, i.e., basically no change. The slowing trend of the TDG and BJC regions was relatively fast—about 0.066/10a and 0.045/10a, respectively. The HYK and LJ regions are used to represent the situation of the whole Yellow River Basin. The development rate of hydrological drought in these two regions gradually accelerated (0.063/10a and 0.117/10a, respectively), indicating that hydrological drought in the Yellow River Basin is developing faster and faster on the whole. This may lead to a rapid progression from mild to more severe drought. The response time is getting shorter and shorter, which makes it more difficult to deal with.
The comparison of hydrological drought development speed in various regions of the Yellow River Basin, using a box chart and a violin chart, is depicted in Figure 9. The figure shows that the average hydrological drought development speed in various regions of the Yellow River mainstream is relatively low, being the lowest in the source region and no more than 0.6 in the TNH and LZ regions. The mainstream is gradually increasing from upstream to downstream, while the middle tributary BJC and WH regions are higher, reaching 0.88 and 0.73, respectively. In addition, the data distribution range along the mainstream is small and relatively concentrated, about 0.3~1.0, while the distribution range of the tributaries is large and relatively scattered, especially in the BJC region, where it is about 0.4~1.6.

3.2. Hydrological Drought Risk Assessment in the Yellow River Basin

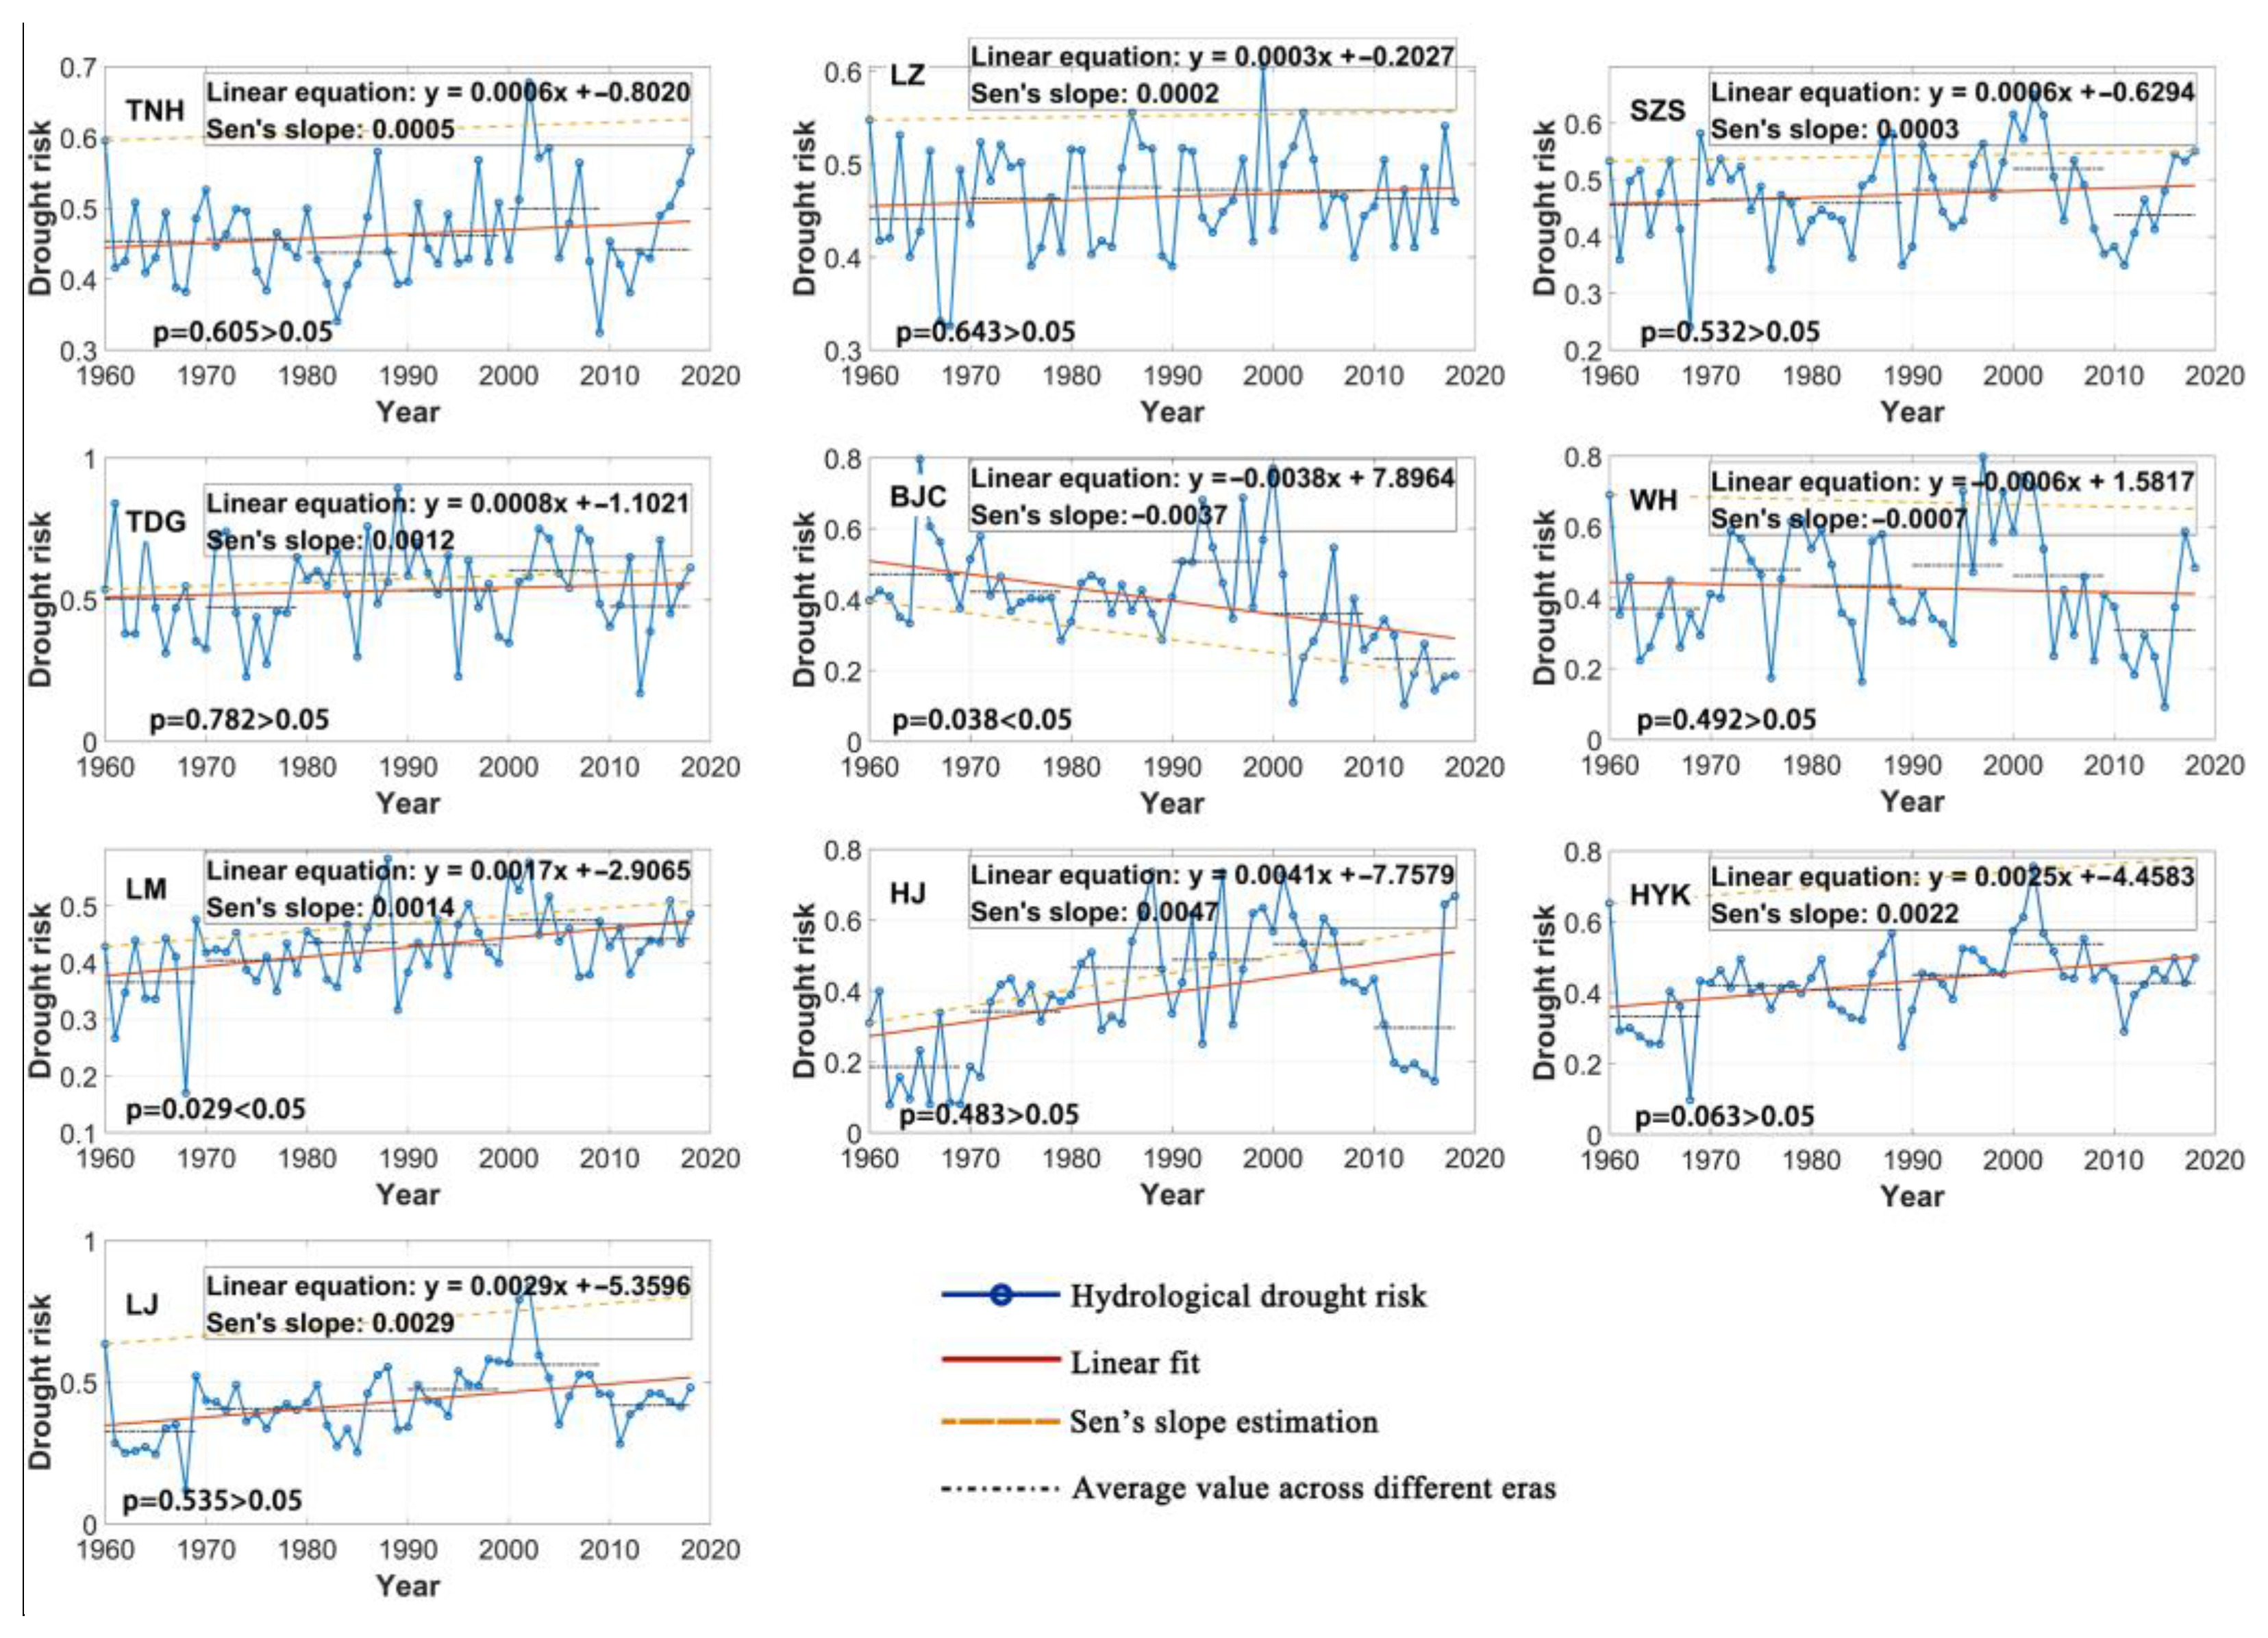
3.2.1. Temporal Variation Characteristics of Hydrological Drought Risk

According to the established drought risk assessment system, the hydrological drought risk of each region in the Yellow River Basin was evaluated. Figure 10 shows the variation trend of hydrological drought risk in various regions of the Yellow River Basin for the past 60 years and the average level for each year. The linear fitting results were generally consistent with the Sen’s slope estimation. It can be seen from the figure that 73% of the regional hydrological drought risk values in the Yellow River Basin are on the rise, but the change trend of each region in the upper reaches is not obvious. For each region, it was not more than 0.01/10a, and the annual average difference between years was small, not more than 0.1. At the same time, it showed a slow upward trend, but it has declined since 2010. Among all regions, only the hydrological drought risk of the BJC region showed a significant downward trend, about −0.038/10a. From the annual averages of each decade, it can be seen that, before the 1990s, the average value of hydrological drought risk showed a downward trend; after the 1990s, it was significantly higher, then continued to decline. Until the 2010s, the average value of hydrological drought risk was only about 0.23, and the average level gap between years was large, with a difference of about 0.27 between the highest and the lowest. The hydrological drought risk in the HJ region shows the most obvious upward trend, about 0.041/10a. The average annual risk in this region continued to rise before the 2010s, peaked at about 0.53 in the 2000s and declined significantly after the 2010s, falling to 0.30. The hydrological drought risk changes in the HYK and HJ regions in the lower reaches are similar, with upward trends of about 0.025/10a and 0.029/10a, respectively. However, both regions experienced declines in the 2010s, indicating that the hydrological drought situation in the Yellow River Basin has eased in recent years.

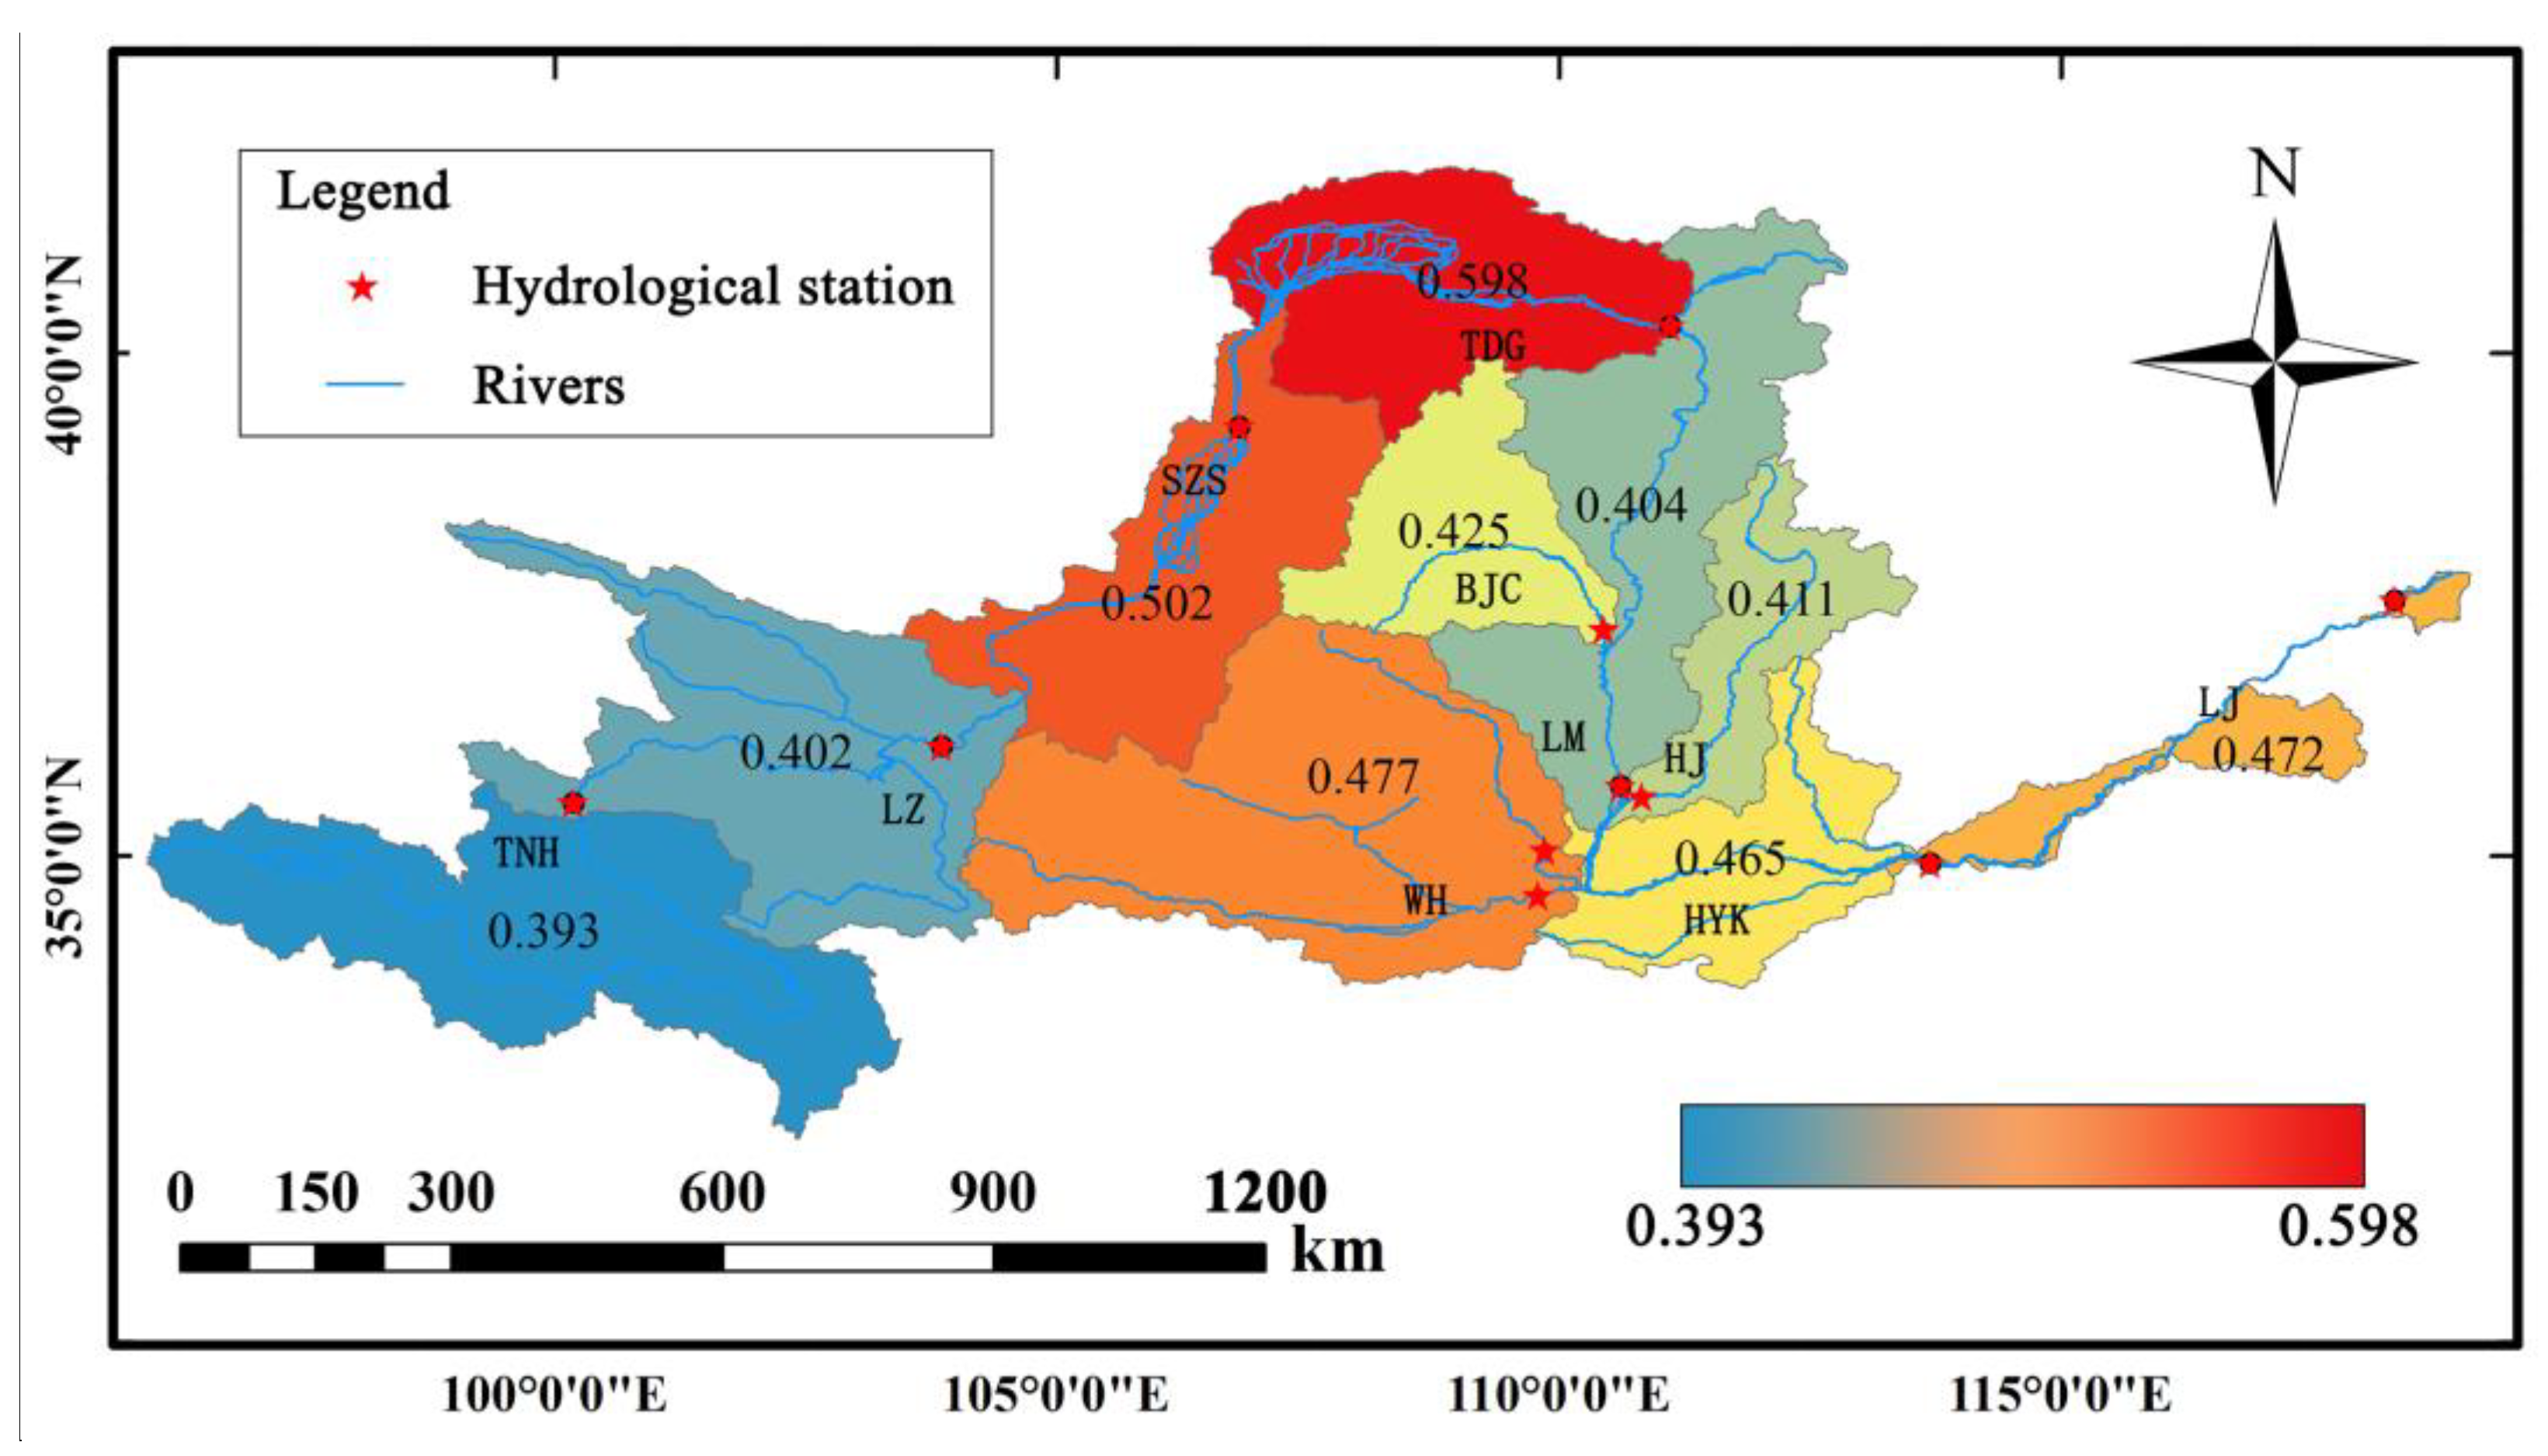
3.2.2. Spatial Distribution Characteristics of Hydrological Drought Risk

Figure 11 reflects the multi-year average level of hydrological drought risk in various regions of the Yellow River Basin. As shown in the figure, the region with the highest risk is the TDG region, at 0.598, while the region with the lowest risk is the TNH region, at 0.393. Combined with the quantitative results of drought characteristic variables mentioned above, the average hydrological drought severity and duration in the TDG region were slightly lower than those in other regions of the upper reaches, but the drought development speed was relatively fast. Finally, the hydrological drought severity in the TNH region was high. However, the hydrological drought development speed in the TNH region was the lowest of all regions, which will lead to low drought risk assessment results. On the other hand, we took into account probability × loss in drought risk assessment and integrated the joint distribution probability of three-dimensional drought characteristic variables. A lower joint distribution probability will also lead to the final results showing that the hydrological drought risk in the TNH region is low. The risk in the upstream source area of the mainstream of the Yellow River Basin is low, while that in the middle and lower reaches is relatively high. The risk in the west is low, while the risk in the central and southeast regions is high.

3.3. Risk Transfer Law of Hydrological Drought in the Yellow River Basin

In this paper, based on the empirical CDF of hydrological risk values in each region, risk values were discretized in equal frequencies, as shown in Table 3. The risk classification boundaries of each region and those of the whole basin of the Yellow River Basin were determined. For example, when the hydrological drought risk of the TNH region for a certain year was in the range of [0, 0.43], it can be considered that the region was at low risk of hydrological drought in that year, while ranges of [0.43, 0.49] and [0.49, 1] indicated a medium and high risk of hydrological drought, respectively.
According to the relationships between the upstream and downstream and the trunk and tributary, transmission paths between regions were constructed. The transmission paths of each region are shown in Figure 12. The TNH region is the parent node of the trunk stream; the BJC, WH and HJ regions are the parent nodes of the tributary, respectively; and the rest of the regions are the child nodes, but they are also the parent nodes of the next region. For example, the LZ region is the parent node of the TNH region and also the parent node of the SZS region.
The spatial transmission characteristics of hydrological drought risk among regions were quantified. According to the risk spatial transmission path defined above, a Bayesian network model of hydrological drought risk transmission between regions in the Yellow River Basin was built, with a total of nine transmission paths. As shown in Figure 13, it shows the transmission probability matrix between different risk states of each path. The probability of the diagonal of the matrix represents the transmission probability of hydrological drought risk of the same level;that is, the invariable transmission. The probability value on the upper side of the diagonal represents an increased transmission of hydrological drought risk, while the probability value on the lower side represents a reduced transmission of hydrological drought risk.
It can be seen from the figure that, during the spatial transmission of hydrological drought risk among regions in the upper reaches of the Yellow River, the transmission process of hydrological drought risk from TNH to LZ and from LZ to SZS is invariable. In the transmission process of hydrological drought risk from TNH to LZ, the transmission probabilities of low risk to low risk, medium risk to medium risk and high risk to high risk are 0.58, 0.53 and 0.64, respectively, while the transmission probabilities of these three types in the risk transmission process from LZ to SZS are 0.65, 0.57 and 0.67, respectively. The transfer process of low-risk status from TDG to LM is heavy; that is, the probability of transferring to medium risk is 0.56. The transfer process of medium risk status to LM is a mitigation transfer, and the probability of transferring to low risk is 0.47.
At the same time, in the lower reaches of the Yellow River Basin, in the process of risk transmission from LM to HYK, the transmission probabilities of low risk to low risk and from high risk to high risk are higher: 0.70 and 0.69, respectively. At the same time, it is noted that the transfer probability from a high-risk state in the HYK region to a low-risk state in the LJ region is 0.00, which indicates that when a high-risk state occurs in the HYK region, the LJ region cannot be in a low-risk state.
In addition, in the process of transmission from the three tributary regions to the mainstream region, the probability of risk transmission at all levels is low, which indicates that a hydrological drought in the tributary region may have little impact on the mainstream region. For example, the HYK region has three parent nodes, LM, HJ and WH, of which the LM region plays the most important role, while the HJ and WH regions have little impact.

4. Discussion

In this paper, the hydrological drought risk assessment system is constructed based on the three-dimensional copula function. On this basis, the hydrological drought risk transfer law in the Yellow River Basin is explored, which provides a reference for a comprehensive understanding of drought risk transfer characteristics, drought risk management and decision making. This paper first quantifies the three-dimensional drought characteristic variables, including drought severity, duration and development speed. A method for assessing the danger of drought based on three-dimensional copula functions is devised, taking into account the elements that characterize drought and the probability of its occurrence. This assessment method can consider the characteristics of all aspects of drought, making it more comprehensively representative of the drought risk. In addition, the results obtained in this paper are of great significance for guiding drought resistance. According to the drought risk assessment results, combined with the characteristics of drought in all aspects, we can determine the causes of high or low drought risk and take targeted measures to reduce the risk. Furthermore, we may investigate the law of drought risk transmission in more detail based on the findings of the drought risk assessment. The research findings on the drought risk transmission law and the probability matrix of the drought risk state transition allow for the prediction of the drought risk state for the upcoming period based on the current period’s drought risk state. This allows for the timely implementation of appropriate measures to interrupt the drought risk’s transmission path and promote long-term drought prevention and control.
This study found that the hydrological drought severity in all the mainstream areas of the Yellow River Basin showed an increasing trend. Meanwhile, the hydrological drought length in the mainstream areas is thought to have an increasing tendency, and the severity and duration of the drought are widely thought to show a positive correlation. This shows that hydrological drought has been worsening in the Yellow River Basin in the past 60 years, which is consistent with the research results of Wang et al. and Tao et al. [20,36]. The Yellow River Basin’s decreased precipitation will cause meteorological drought to transition into hydrological drought. The research of Zhang et al. also shows that the Yellow River Basin is dominated by precipitation reduction, and the lack of precipitation could make the scarcity of water supplies worse [37]. There can be a severe decline in the water supply in the middle reaches of the Yellow River. In addition, with the intensification of global warming and climate change [38], the temperature in the Yellow River basin has gradually increased [39], resulting in increased evaporation, reduced river water volume and drought. Furthermore, because the upper reaches are being impounded, the implementation of extensive water conservation projects in the Yellow River basin throughout the 1980s may have made the hydrological drought in the lower reaches worse. Moreover, urbanization is speeding up, the population in the basin is growing and the amount of water is rising, which causes the volume of river water to decrease [40,41].
Additionally, this study assessed the Yellow River Basin’s hydrological drought risk and discovered that it was increasing in the majority of its sections, with the HJ, HYK and LJ regions in the lower reaches showing faster increases. The research by Zhou et al. also shows that drought in some basins in China is gradually increasing, especially in the Yellow River Basin, Haihe River Basin and Southwest River Basin [42]. The annual average hydrological drought risk in the TDG region is the highest due to the serious soil and water loss in the Loess Plateau region. Huang’s research also revealed that the middle reaches of the Yellow River had a higher danger of drought than other regions of the Yellow River Basin [43]. In addition, Wang et al. built an ecological drought risk assessment index system and model based on the climate, environment and human activities of the Yellow River Basin [44]. Their study found that the high-risk areas of ecological drought were mainly distributed in the Northern Shaanxi plateau, central Gansu plateau, Ningxia plain and Hetao plain. Therefore, based on the findings of the risk assessment, it is imperative to improve hydrological drought prevention in high-risk areas by implementing water-saving measures such as boosting water transfer outside of the basin. However, the hydrological drought risk in the TNH area is the lowest, which may be due to more vegetation and water conservation in this area, helping the river runoff in this area maintain a relatively stable state for a long time. When there is a hydrological drought, conditions develop slowly, and there is enough time to address the situation safely. This paper examined the law of hydrological drought risk transfer in the Yellow River Basin and discovered that, while the risk transfer probability from tributaries to the mainstream regions lacked clear characteristics, the characteristics of the hydrological drought risk transfer probability between the mainstream regions were evident. This is because the primary river inflow is the primary stream area upstream, and the minor tributary flow has less influence on the primary stream, resulting in a low probability of risk transmission.
The research results of this paper are significant in two respects. First, in terms of practical significance, it is crucial to direct scientific efforts toward drought prevention, develop countermeasures for drought emergencies and ensure that the economy of the Yellow River Basin develops sustainably. This also contributes to the realization of ecological protection and high-quality development in the region, and serves as a resource for drought risk management, drought prevention and control, and the wise use of water resources in the region. Second, in terms of academic significance, this study provides a new drought risk assessment method: the four-dimensional copula function-based drought risk assessment system. It also builds a drought-risk-transmission-law-based model on the risk assessment and suggests changing the focus of drought transmission-related research from event transmission to risk transmission.
However, due to the complexity and uncertainty of drought itself, this paper has some limitations, which need to be further explored and improved in the future. The main limitations are that the time scale of drought risk assessment is single, the analysis and evaluation are based on monthly scale data only, and the identification of short-term or long-term drought may not be sufficient. The drought risk transfer model needs to be further improved. A risk transfer model of hydrological drought is established in this paper, which does not involve other types of droughts such as agricultural drought, groundwater drought, socioeconomic drought, etc. For future research, our main suggestions are as follows: (1) Put forward a more comprehensive and applicable drought risk assessment method. Adopt more diversified drought indexes, such as the standardized precipitation evapotranspiration index SPEI [45] and the Palmer drought index PDSI [46], and comprehensively consider the impact of more factors (such as temperature, sunshine hours, radiation, underlying surface, groundwater, etc.) on drought risk and drought risk transmission. This is of great significance for developing more comprehensive drought risk assessment, reducing the probability of drought risk transmission and preventing drought risk from developing to a higher level. (2) Further improve the drought risk transfer model. To increase the precision of the geographic scale, further subdivide the basin or region, for example, by splitting it into multiple subregions based on terrain, climate, administrative division and regional meteorological conditions.

5. Conclusions

The Yellow River Basin has also been significantly impacted by rising global heat and climate change, with decreased annual flow and more frequent droughts. With the acceleration of urbanization and the increase in human access to water, the water pressure is greater, and drought seriously restricts the high-quality development of regions along the Yellow River Basin. Therefore, research on hydrological drought risk assessment and its transmission law in the Yellow River Basin was carried out, and we obtained the following main conclusions:
(1)
The hydrological drought characteristics of each region in the Yellow River Basin were quantified. In general, the severity of hydrological drought in the Yellow River Basin has increased, the duration has increased and the development has accelerated. The HYK and LJ regions are used to represent the situation of the whole Yellow River Basin. The rate at which the hydrological drought is increasing in the two regions is 0.063/10a and 0.117/10a, respectively. This suggests that the hydrological drought in the Yellow River Basin is intensifying.
(2)
The risk of hydrological drought in the Yellow River Basin was assessed. On the whole, the hydrological drought risk in all regions of the Yellow River Basin, except BJC and WH, showed an upward trend. The risk in the BJC region decreased rapidly, about −0.038/10a, while in the WH region, it changed slowly. The hydrological drought risk in the HYK and LJ regions increased rapidly, about 0.025/10a and 0.029/10a, respectively. At the same time, the annual average hydrological drought risk in the upper reaches was high, while that in the middle and lower reaches was relatively low, with the highest value of 0.533 in the TDG area, in the upper reaches, and the lowest value of 0.393 in the HJ area.
(3)
The risk transfer law of hydrological drought in the Yellow River Basin was explored. The risk transmission types of hydrological drought in each region can be roughly divided into unchanged types. For example, the transmission probabilities of the low, medium and high risks of hydrological drought from the HYK region to the low, medium and high risks of hydrological drought in the LJ region are 0.68, 0.66 and 0.78, respectively. The risk transfer probability from the low risk of hydrological drought in the TDG region to the middle risk in the LM region is 0.56. The probability of risk transfer from the TDG hydrological drought to the low risk in the LM region is 0.47.

Author Contributions

Conceptualization, H.L. and J.G.; methodology, H.L.; software, H.L.; validation, D.Y., H.W. and X.J.; formal analysis, H.L.; investigation, J.G.; resources, J.G.; data curation, J.G.; writing—original draft preparation, H.L.; writing—review and editing, H.L.; visualization, H.W.; supervision, H.W.; project administration, X.J.; funding acquisition, H.W. All authors have read and agreed to the published version of the manuscript.

Funding

Research Fund of Key Laboratory of Water Management and Water Security for the Yellow River Basin, Ministry of Water Resources (under construction) (2022-SYSJJ-06), and Excellent Youth Foundation of the He’nan Scientific Committee (242300421038).

Data Availability Statement

All data and materials used in this manuscript are freely available and comply with field standards.

Conflicts of Interest

The authors have no relevant financial or non-financial interests to disclose.

References

  1. Ault, T.R. On the essentials of drought in a changing climate. Science 2020, 368, 256–260. [Google Scholar] [CrossRef]
  2. Schwalm, C.R.; Anderegg, W.R.L.; Michalak, A.M.; Fisher, J.B.; Biondi, F.; Koch, G.; Litvak, M.; Ogle, K.; Shaw, J.D.; Wolf, A.; et al. Global patterns of drought recovery. Nature 2017, 548, 202. [Google Scholar] [CrossRef] [PubMed]
  3. Zhao, W. Extreme weather and climate events in China under changing climate. Natl. Sci. Rev. 2020, 7, 938–943. [Google Scholar] [CrossRef] [PubMed]
  4. Zhang, X.; Hao, Z.; Singh, V.P.; Zhang, Y.; Feng, S.; Xu, Y.; Hao, F. Drought propagation under global warming: Characteristics, approaches, processes, and controlling factors. Sci. Total Environ. 2022, 838, 156021. [Google Scholar] [CrossRef] [PubMed]
  5. Wang, H.; Zhu, Y.; Qin, T.; Zhang, X. Study on the propagation probability characteristics and prediction model of meteorological drought to hydrological drought in basin based on copula function. Front. Earth Sci. 2022, 10, 961871. [Google Scholar] [CrossRef]
  6. Graw, V.; Dubovyk, O.; Ghazaryan, G.; Schreier, J.; Gonzalez, J.; Abdel-Hamid, A.; Walz, Y.; Dall, K.; Post, J.; Jordaan, A. Timing is everything—Drought classification for risk assessment. IEEE J. Sel. Top. Appl. Earth Observ. Remote Sens. 2020, 13, 428–433. [Google Scholar] [CrossRef]
  7. Zhu, S.; Huang, W.; Luo, X.; Guo, J.; Yuan, Z. The spread of multiple droughts in different seasons and its dynamic changes. Remote Sens. 2023, 15, 3848. [Google Scholar] [CrossRef]
  8. Van Loon, A.F.; Laaha, G. Hydrological drought severity explained by climate and catchment characteristics. J. Hydrol. 2015, 526, 3–14. [Google Scholar] [CrossRef]
  9. Li, P.; Jia, L.; Lu, J.; Jiang, M.; Zheng, C. A new evapotranspiration-based drought index for flash drought identification and monitoring. Remote Sens. 2024, 16, 780. [Google Scholar] [CrossRef]
  10. Chianeh, F.N.; Anaraki, M.V.; Mahmoudian, F.; Farzin, S. A new methodology for the prediction of optimal conditions for dyes’ electrochemical removal; Application of copula function, machine learning, deep learning, and multi-objective optimization. Process Saf. Environ. Protect. 2024, 182, 298–313. [Google Scholar] [CrossRef]
  11. Farrokhi, A.; Farzin, S.; Mousavi, S. Meteorological drought analysis in response to climate change conditions, based on combined four-dimensional vine copulas and data mining (VC-DM). J. Hydrol. 2021, 603, 127135. [Google Scholar] [CrossRef]
  12. Reddy, M.J.; Ganguli, P. Application of copulas for derivation of drought severity-duration-frequency curves. Hydrol. Process. 2012, 26, 1672–1685. [Google Scholar]
  13. Mirabbasi, R.; Fakheri-Fard, A.; Dinpashoh, Y. Bivariate drought frequency analysis using the copula method. Theor. Appl. Climatol. 2012, 108, 191–206. [Google Scholar] [CrossRef]
  14. Apurv, T.; Cai, X. Evaluation of the stationarity assumption for meteorological drought risk estimation at the multidecadal scale in contiguous united states. Water Resour. Res. 2019, 55, 5074–5101. [Google Scholar]
  15. Yang, X.; Li, Y.P.; Liu, Y.R.; Gao, P.P. A mcmc-based maximum entropy copula method for bivariate drought risk analysis of the amu darya river basin. J. Hydrol. 2020, 590, 125502. [Google Scholar] [CrossRef]
  16. Tsakiris, G. Drought risk assessment and management. Water Resour. Manag. 2017, 31, 3083–3095. [Google Scholar] [CrossRef]
  17. Dunne, A.; Kuleshov, Y. Drought risk assessment and mapping for the murray-darling basin, australia. Nat. Hazards 2023, 115, 839–863. [Google Scholar] [CrossRef]
  18. Hagenlocher, M.; Meza, I.; Anderson, C.C.; Min, A.; Renaud, F.G.; Walz, Y.; Siebert, S.; Sebesvari, Z. Drought vulnerability and risk assessments: State of the art, persistent gaps, and research agenda. Environ. Res. Lett. 2019, 14, 083002. [Google Scholar] [CrossRef]
  19. Li, X.; Jiao, Y.; Liu, J. Changes in drought characteristics in the yellow river basin during the carbon-neutral period under low-emission scenarios. Water 2024, 16, 1045. [Google Scholar] [CrossRef]
  20. Wang, F.; Wang, Z.; Yang, H.; Di, D.; Zhao, Y.; Liang, Q.; Hussain, Z. Comprehensive evaluation of hydrological drought and its relationships with meteorological drought in the yellow river basin, China. J. Hydrol. 2020, 584, 124751. [Google Scholar] [CrossRef]
  21. Dabanli, I.; Mishra, A.K.; Sen, Z. Long-term spatio-temporal drought variability in turkey. J. Hydrol. 2017, 552, 779–792. [Google Scholar] [CrossRef]
  22. Qiu, J.; Shen, Z.; Xie, H. Drought impacts on hydrology and water quality under climate change. Sci. Environ. 2023, 858, 159854. [Google Scholar] [CrossRef] [PubMed]
  23. Burnham, K.P.; Anderson, D.R. Multimodel inference—Understanding aic and bic in model selection. Sociol. Methods Res. 2004, 33, 261–304. [Google Scholar] [CrossRef]
  24. Jahangir, M.H.; Yarahmadi, Y. Hydrological drought analyzing and monitoring by using streamflow drought index (SDI) (case study: Lorestan, Iran). Arab. J. Geosci. 2020, 13, 110. [Google Scholar] [CrossRef]
  25. Yevjevich, V. An objective approach to definitions and investigations of continental hydrologic droughts: Vujica yevjevich: Fort Collins, Colorado State University, 1967, 19 p. (Hydrology paper no. 23). J. Hydrol. 1969, 7, 353. [Google Scholar]
  26. Herbst, P.H.; Bredenkamp, D.B.; Barker, H.M.G. A technique for the evaluation of drought from rainfall data. J. Hydrol. 1966, 4, 264–272. [Google Scholar] [CrossRef]
  27. Wu, J.; Chen, X.; Yao, H.; Zhang, D. Multi-timescale assessment of propagation thresholds from meteorological to hydrological drought. Sci. Total Environ. 2021, 765, 144232. [Google Scholar] [CrossRef] [PubMed]
  28. Wu, J.; Yao, H.; Chen, X.; Wang, G.; Bai, X.; Zhang, D. A framework for assessing compound drought events from a drought propagation perspective. J. Hydrol. 2022, 604, 127228. [Google Scholar] [CrossRef]
  29. Boulle, M. Optimal bin number for equal frequency discretizations in supervized learning. Intell. Data Anal. 2005, 9, 175–188. [Google Scholar] [CrossRef]
  30. Cao, F.; Ge, Y.; Wang, J. Spatial data discretization methods for geocomputation. Int. J. Appl. Earth Obs. Geoinf. 2014, 26, 432–440. [Google Scholar] [CrossRef]
  31. Zhou, Z.; Tu, X.; Wang, T.; Singh, V.P.; Chen, X.; Lin, K. Bivariate socioeconomic drought assessment based on a hybrid framework and impact of human activities. J. Clean. Prod. 2023, 409, 137150. [Google Scholar] [CrossRef]
  32. Hao, Z.; Hao, F.; Singh, V.P.; Xia, Y.; Ouyang, W.; Shen, X. A theoretical drought classification method for the multivariate drought index based on distribution properties of standardized drought indices. Adv. Water Resour. 2016, 92, 240–247. [Google Scholar] [CrossRef]
  33. Abbas, A.; Waseem, M.; Ullah, W.; Zhao, C.; Zhu, J. Spatiotemporal analysis of meteorological and hydrological droughts and their propagations. Water 2021, 13, 2237. [Google Scholar] [CrossRef]
  34. Chen, N.; Li, R.; Zhang, X.; Yang, C.; Wang, X.; Zeng, L.; Tang, S.; Wang, W.; Li, D.; Niyogi, D. Drought propagation in northern China plain: A comparative analysis of gldas and merra-2 datasets. J. Hydrol. 2020, 588, 125026. [Google Scholar] [CrossRef]
  35. Vaziri, H.; Karami, H.; Mousavi, S.; Hadiani, M. Analysis of hydrological drought characteristics using copula function approach. Paddy Water Environ. 2018, 16, 153–161. [Google Scholar] [CrossRef]
  36. Tao, Y.; Meng, E.; Huang, Q. Spatiotemporal changes and hazard assessment of hydrological drought in China using big data. Water 2024, 16, 106. [Google Scholar] [CrossRef]
  37. Zhang, Q.; Peng, J.; Singh, V.P.; Li, J.; Chen, Y.D. Spatio-temporal variations of precipitation in arid and semiarid regions of China: The yellow river basin as a case study. Glob. Planet. Chang. 2014, 114, 38–49. [Google Scholar] [CrossRef]
  38. Kay, J.E. Early climate models successfully predicted global warming. Nature 2020, 578, 45–46. [Google Scholar] [CrossRef]
  39. Niu, Z.; Wang, L.; Fang, L.; Li, J.; Yao, R. Analysis of spatiotemporal variability in temperature extremes in the yellow and Yangtze river basins during 1961–2014 based on high-density gauge observations. Int. J. Climatol. 2020, 40, 1–21. [Google Scholar] [CrossRef]
  40. Dang, S.; Liu, X.; Yin, H.; Guo, X. Prediction of sediment yield in the middle reaches of the yellow river basin under extreme precipitation. Front. Earth Sci. 2020, 8, 542686. [Google Scholar] [CrossRef]
  41. Zhao, Y.; Cao, W.; Hu, C.; Wang, Y.; Wang, Z.; Zhang, X.; Zhu, B.; Cheng, C.; Yin, X.; Liu, B.; et al. Analysis of changes in characteristics of flood and sediment yield in typical basins of the yellow river under extreme rainfall events. Catena 2019, 177, 31–40. [Google Scholar] [CrossRef]
  42. Zhou, S.; Wang, Y.; Li, Z.; Chang, J.; Guo, A.; Zhou, K. Characterizing spatio-temporal patterns of multi-scalar drought risk in mainland China. Ecol. Indic. 2021, 131, 108189. [Google Scholar] [CrossRef]
  43. Huang, S.; Chang, J.; Leng, G.; Huang, Q. Integrated index for drought assessment based on variable fuzzy set theory: A case study in the yellow river basin, China. J. Hydrol. 2015, 527, 608–618. [Google Scholar] [CrossRef]
  44. Wang, Y.; Wang, J.; Zhang, Q. Analysis of ecological drought risk characteristics and leading factors in the yellow river basin. Theor. Appl. Climatol. 2024, 155, 1739–1757. [Google Scholar] [CrossRef]
  45. Lee, S.; Moriasi, D.N.; Mehr, A.D.; Mirchi, A. Sensitivity of standardized precipitation and evapotranspiration index (SPEI) to the choice of SPEI probability distribution and evapotranspiration method. J. Hydrol.-Reg. Stud. 2024, 53, 101761. [Google Scholar] [CrossRef]
  46. Zhong, Z.; He, B.; Guo, L.; Zhang, Y. Performance of various forms of the palmer drought severity index in China from 1961 to 2013. J. Hydrometeorol. 2019, 20, 1867–1885. [Google Scholar] [CrossRef]
Figure 1. Technology roadmap.
Water 16 01873 g001
Figure 2. Overview and regional division of the Yellow River Basin.
Water 16 01873 g002
Figure 3. Identifying drought events and quantifying drought characteristics based on run length theory.
Water 16 01873 g003
Figure 4. Linear variation in the trend of hydrological drought severity in various regions of the Yellow River Basin.
Water 16 01873 g004
Figure 5. Comparison of hydrological drought severity in various regions of the Yellow River Basin.
Water 16 01873 g005
Figure 6. Linear variation trend of hydrological drought duration in various regions of the Yellow River Basin.
Water 16 01873 g006
Figure 7. Comparison of hydrological drought duration in various regions of the Yellow River Basin.
Water 16 01873 g007
Figure 8. Linear variation trend of hydrological drought development speed in various regions of the Yellow River Basin.
Water 16 01873 g008
Figure 9. Comparison of hydrological drought development speed in various regions of the Yellow River Basin.
Water 16 01873 g009
Figure 10. Variation trend of hydrological drought risk in various regions of the Yellow River Basin.
Water 16 01873 g010
Figure 11. Annual average hydrological drought risk in each region of the Yellow River Basin.
Water 16 01873 g011
Figure 12. Spatial transmission path of hydrological drought risk among regions in the Yellow River Basin.
Water 16 01873 g012
Figure 13. Spatial transmission characteristics of hydrological drought risk among regions.
Water 16 01873 g013
Table 1. Hydrological station information.
YearHydrological StationLongitudeLatitudeData
1960–2018Tangnaihai100°09′35°30′Monthly runoff
1960–2018Lanzhou103°49′36°04′Monthly runoff
1960–2018Shizuishan106°47′39°15′Monthly runoff
1960–2018Toudaoguai111°5′40°15′Monthly runoff
1960–2018Baijiachuan110°25′37°14′Monthly runoff
1960–2018Huaxian109°46′34°35′Monthly runoff
1960–2018Zhuangtou109°50′35°02′Monthly runoff
1960–2018Longmen110°35′35°40′Monthly runoff
1960–2018Hejin110°48′35°34′Monthly runoff
1960–2018Huayuankou113°40′34°54′Monthly runoff
1960–2018Lijin118°18′37°31′Monthly runoff
Table 2. Drought classification.
SRIDrought Grade
SRI > −0.5No drought
−1.0 < SRI ≤ −0.5Light drought
−1.5 < SRI ≤ −1.0Moderate drought
−2.0 < SRI ≤ −1.5Severe drought
SRI ≤ −2.0Extreme drought
Table 3. Classification of hydrological drought risk levels in various regions of the Yellow River Basin.
Risk GradeDrought Risk Values in Various Regions
TNHLZSZSTDGBJC
Low0 ≤ R < 0.3670 ≤ R < 0.3810 ≤ R < 0.3240 ≤ R < 0.480 ≤ R < 0.388
Medium0.367 ≤ R < 0.4120.381 ≤ R< 0.4570.324 ≤ R< 0.60.48 ≤ R < 0.710.388 ≤ R < 0.496
High0.412 ≤ R ≤ 10.457 ≤ R ≤ 10.6 ≤ R ≤ 10.71 ≤ R ≤ 10.496 ≤ R ≤ 1
Risk GradeDrought Risk Values in Various Regions
WHLMHJHYKLJ
Low0 ≤ R < 0.40 ≤ R < 0.2990 ≤ R < 0.3750 ≤ R < 0.3320 ≤ R< 0.39
Medium0.4 ≤ R < 0.6190.299 ≤ R < 0.5160.375 ≤ R < 0.4670.332 ≤ R < 0.590.39 ≤ R < 0.56
High0.619 ≤ R ≤ 10.516 ≤ R ≤ 10.467 ≤ R ≤ 10.59 ≤ R ≤ 10.56 ≤ R ≤ 1
Disclaimer/Publisher’s Note: The statements, opinions and data contained in all publications are solely those of the individual author(s) and contributor(s) and not of MDPI and/or the editor(s). MDPI and/or the editor(s) disclaim responsibility for any injury to people or property resulting from any ideas, methods, instructions or products referred to in the content.

