
Study on the Transient Flow Characteristics of Multistage Centrifugal Pumps during the Startup Process before System Operation


Abstract
1. Introduction
2. Experimental Model and Computational Method
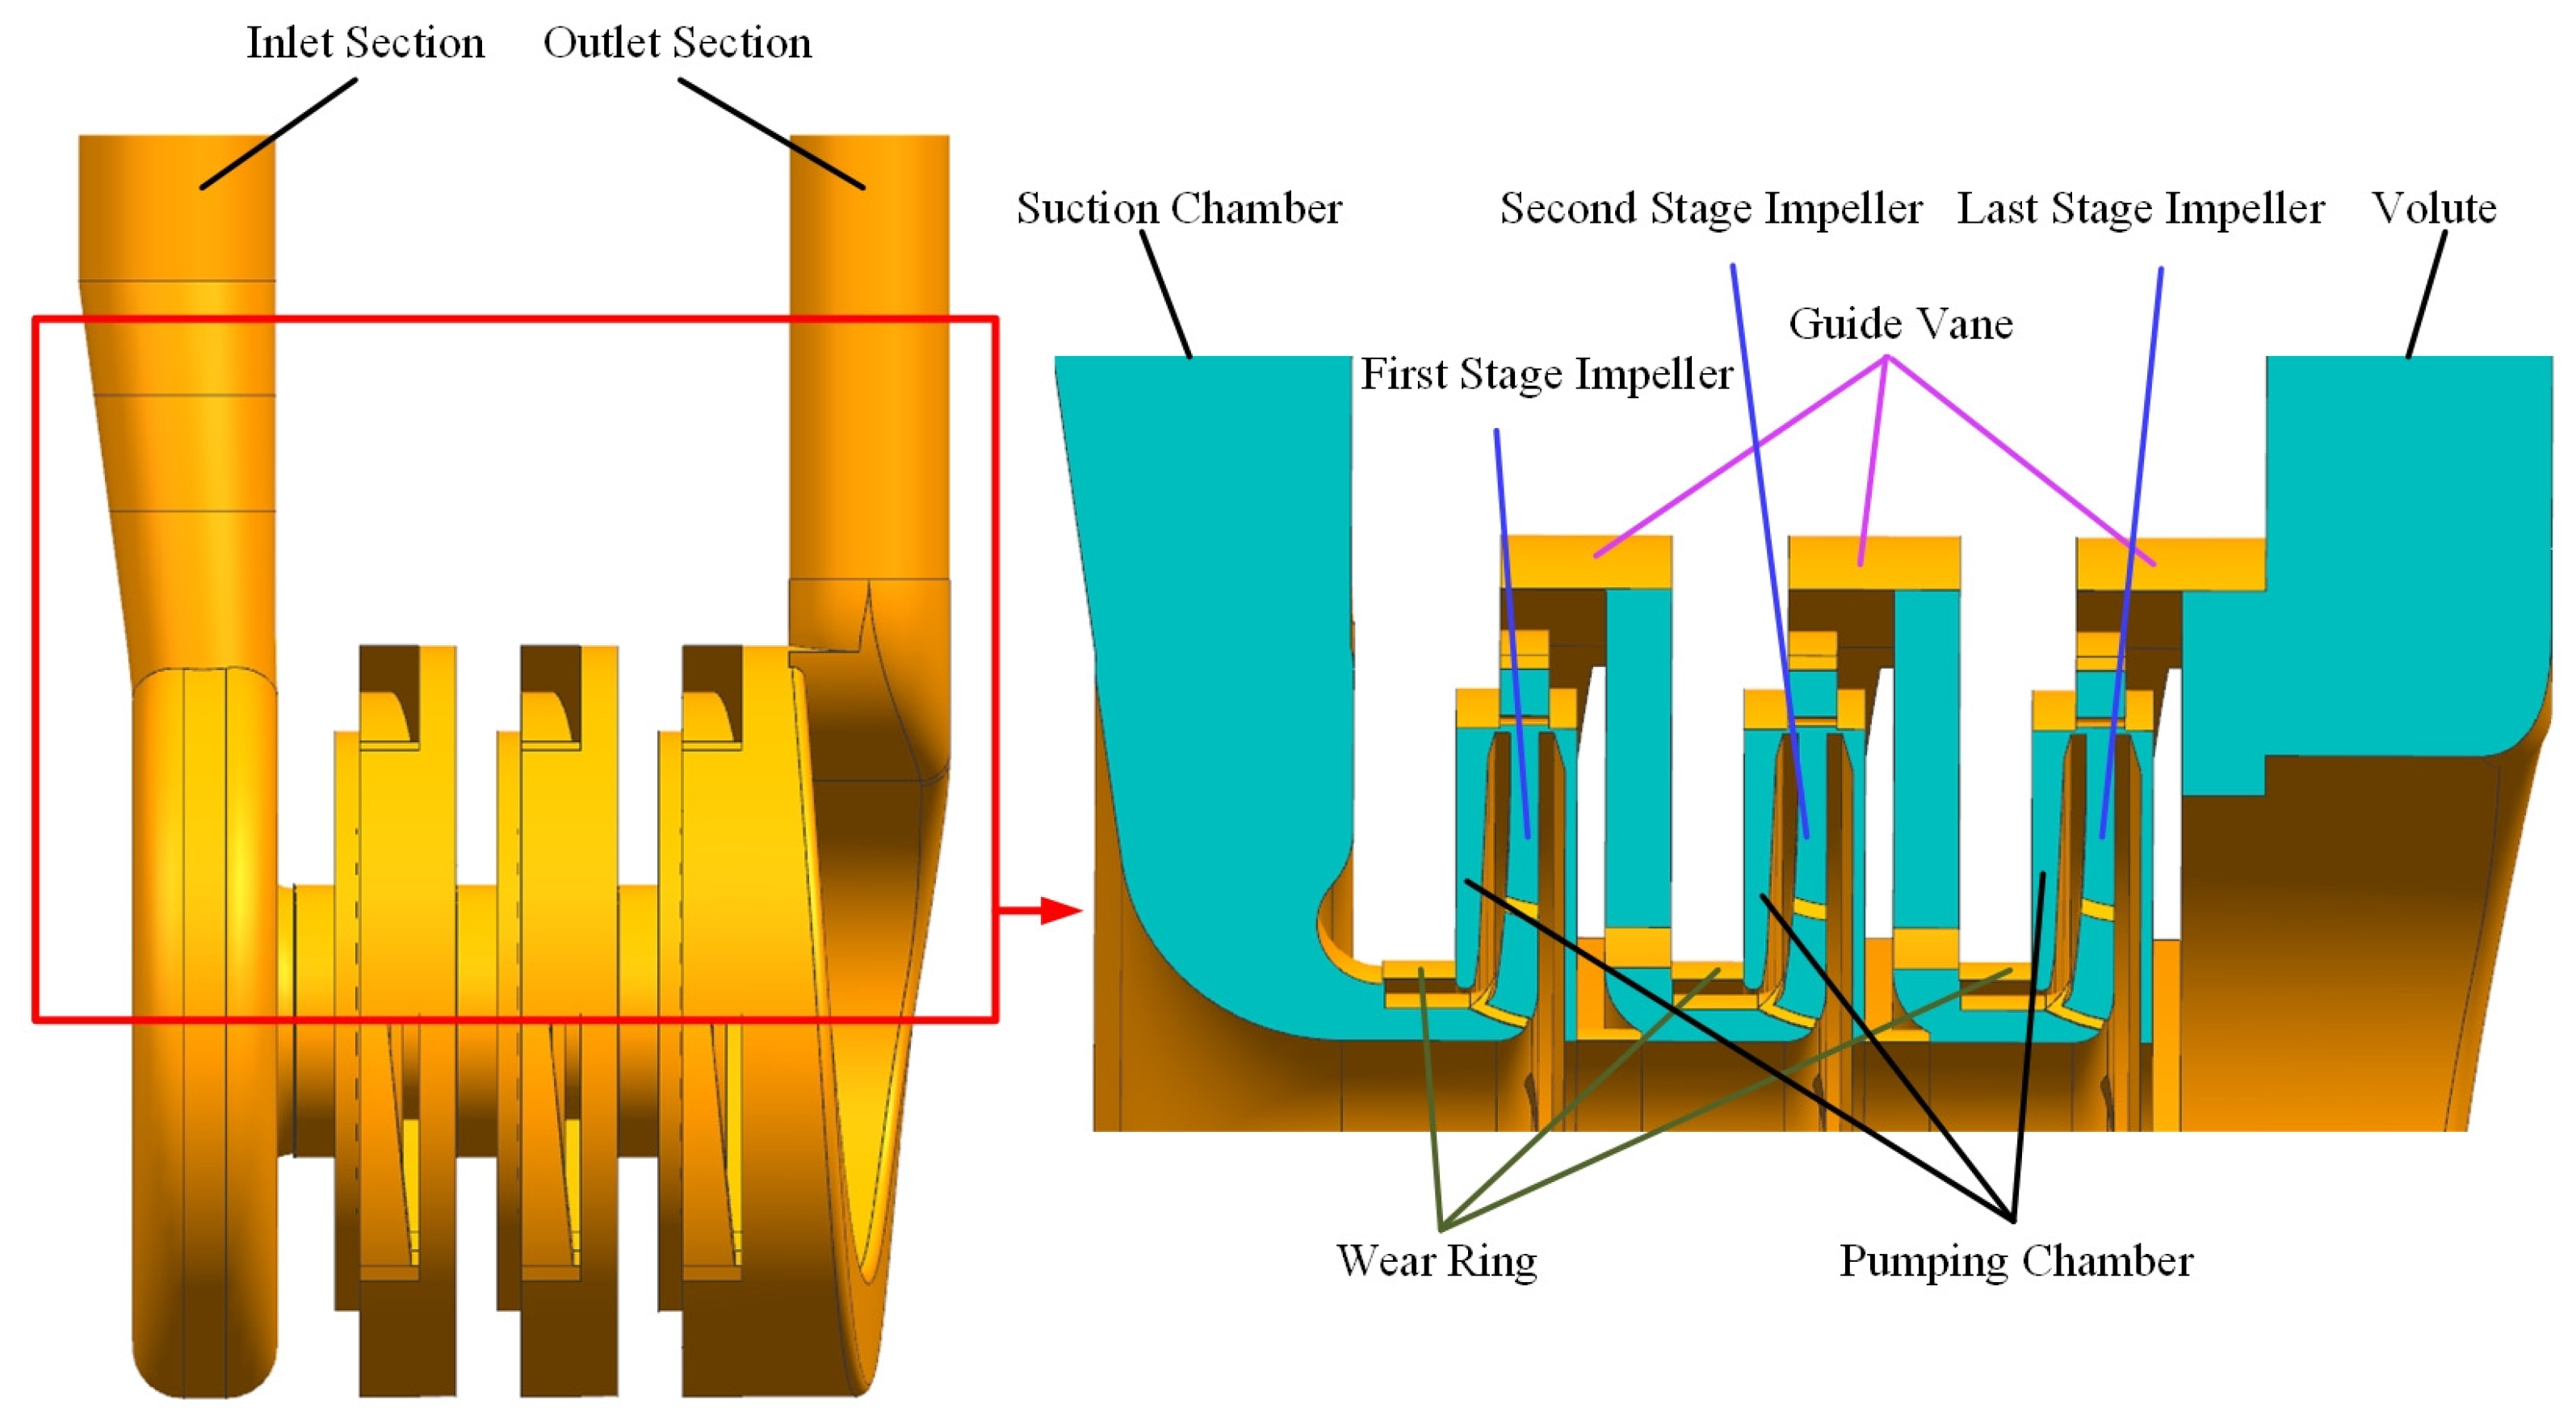
2.1. Pump Parameters and Computational Domain
2.2. Computational Simulation Method
2.2.1. Equations and Turbulent Model
2.2.2. Boundary Conditions and Controlling Functions
2.3. Computational Simulation Methods
2.3.1. Equation of Vortex Identification
2.3.2. Equation of the Entropy Generation
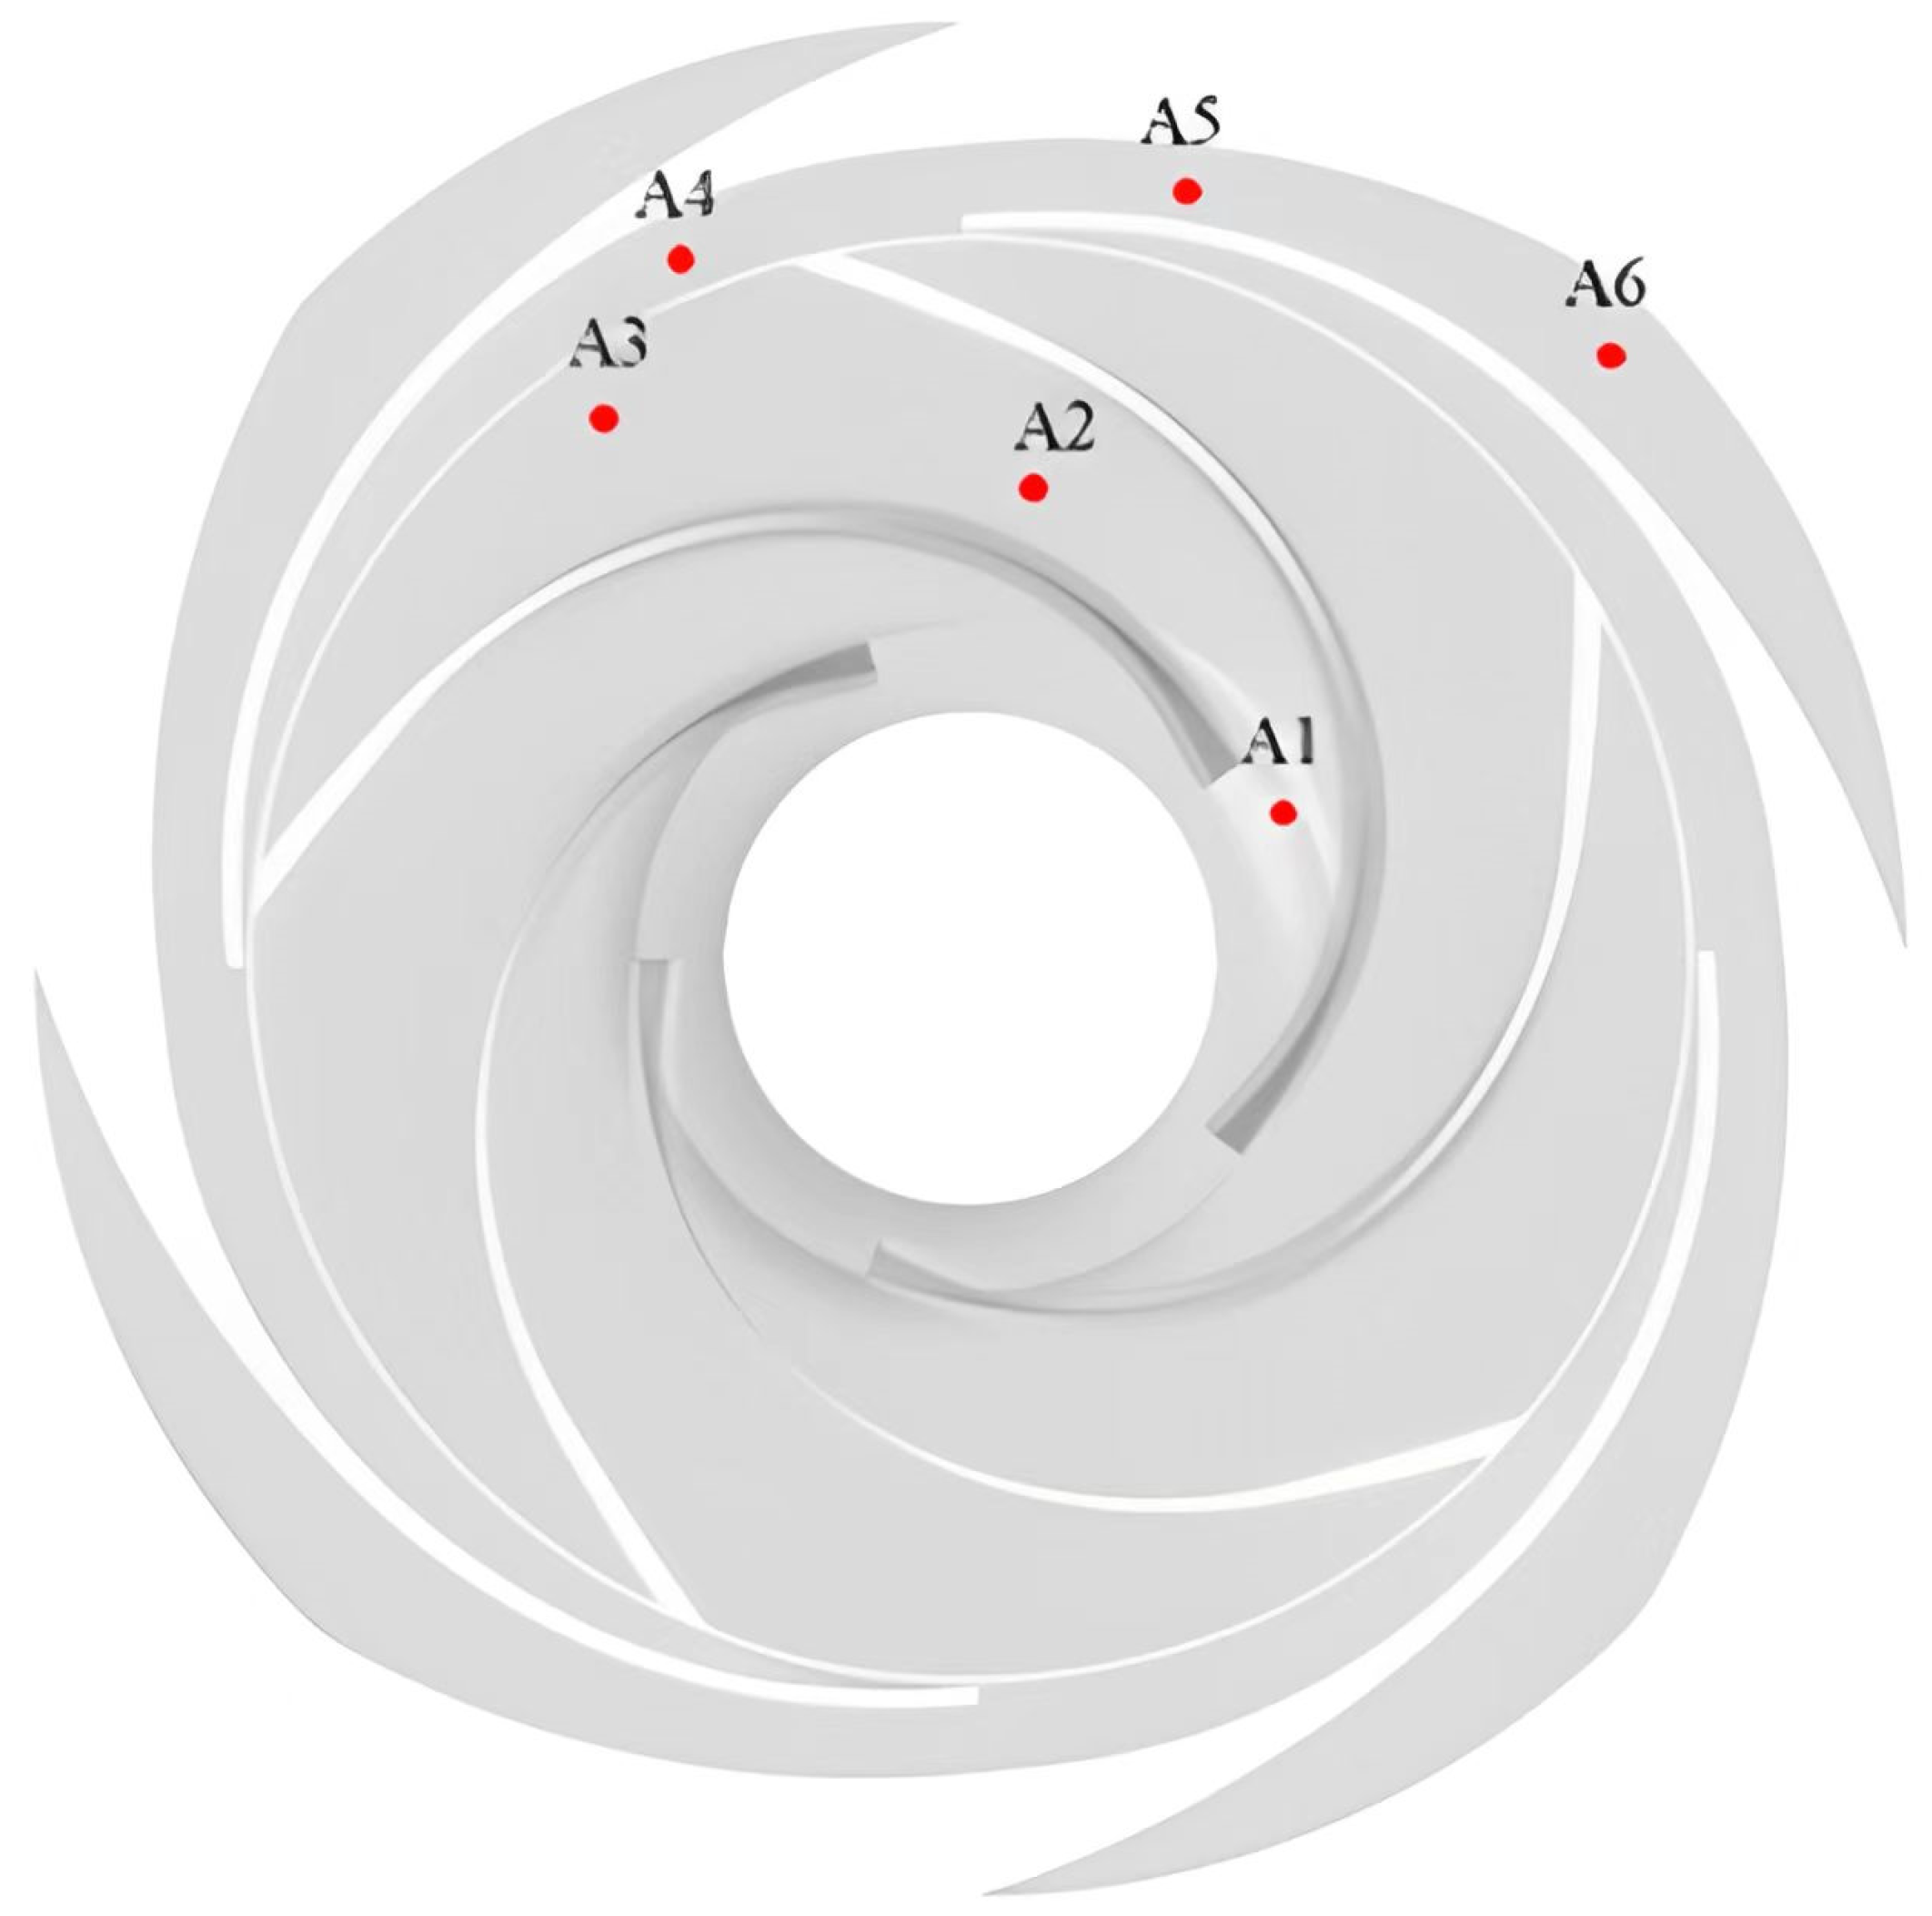
2.3.3. Pressure Pulsation Analysis
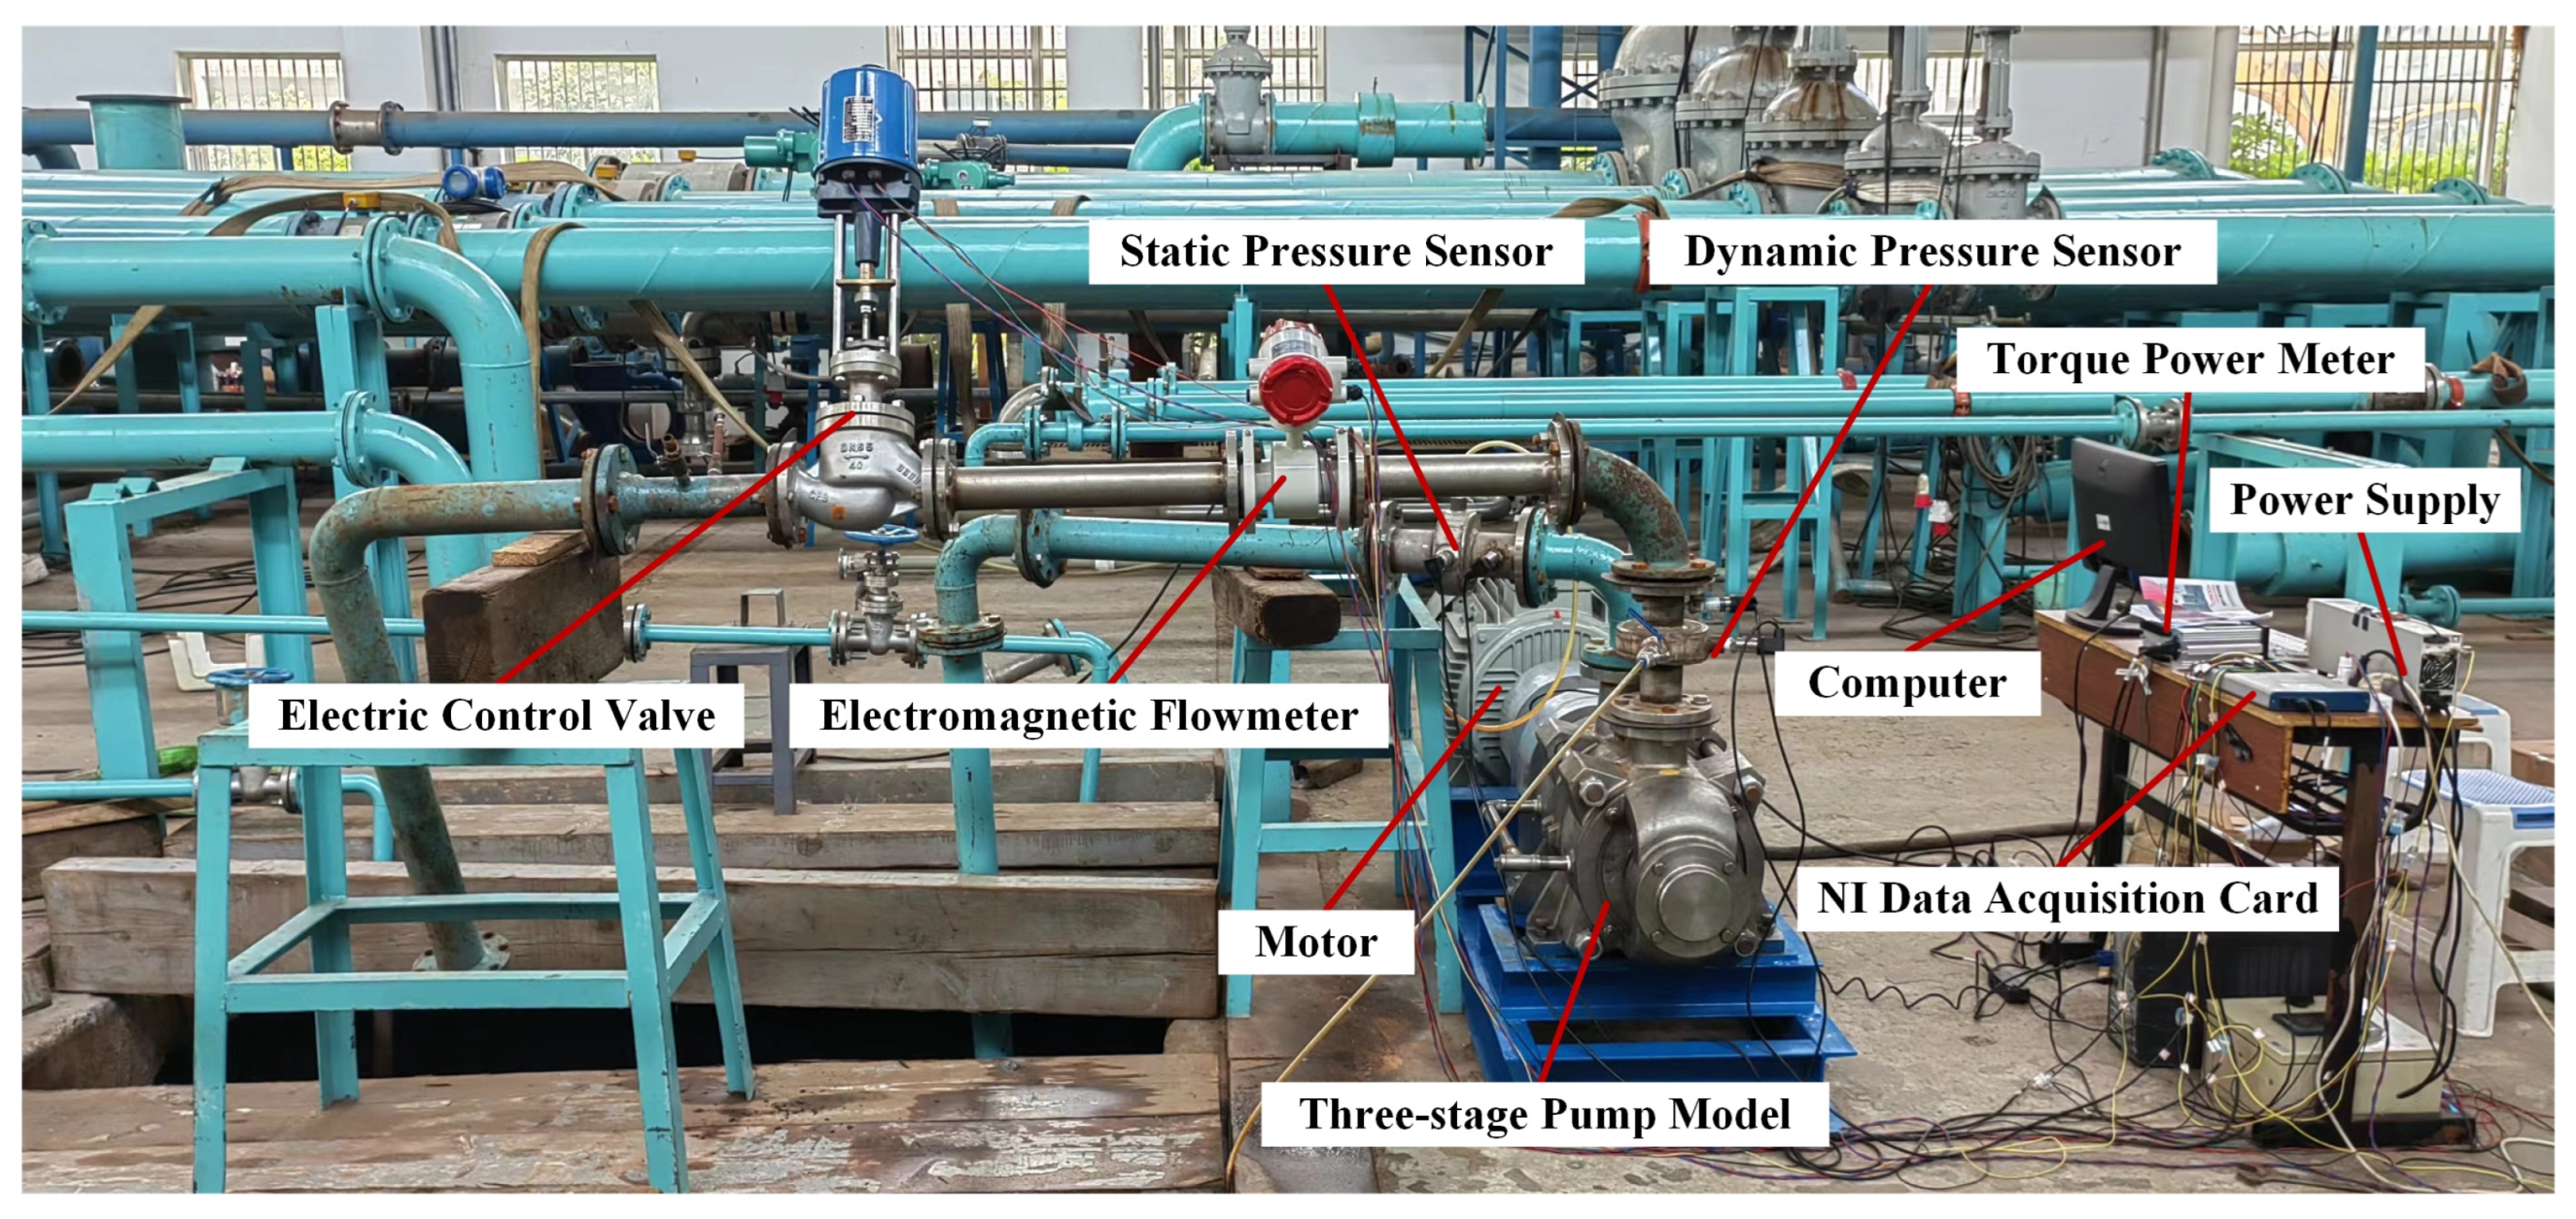
2.4. Test Rig
3. Results Analysis
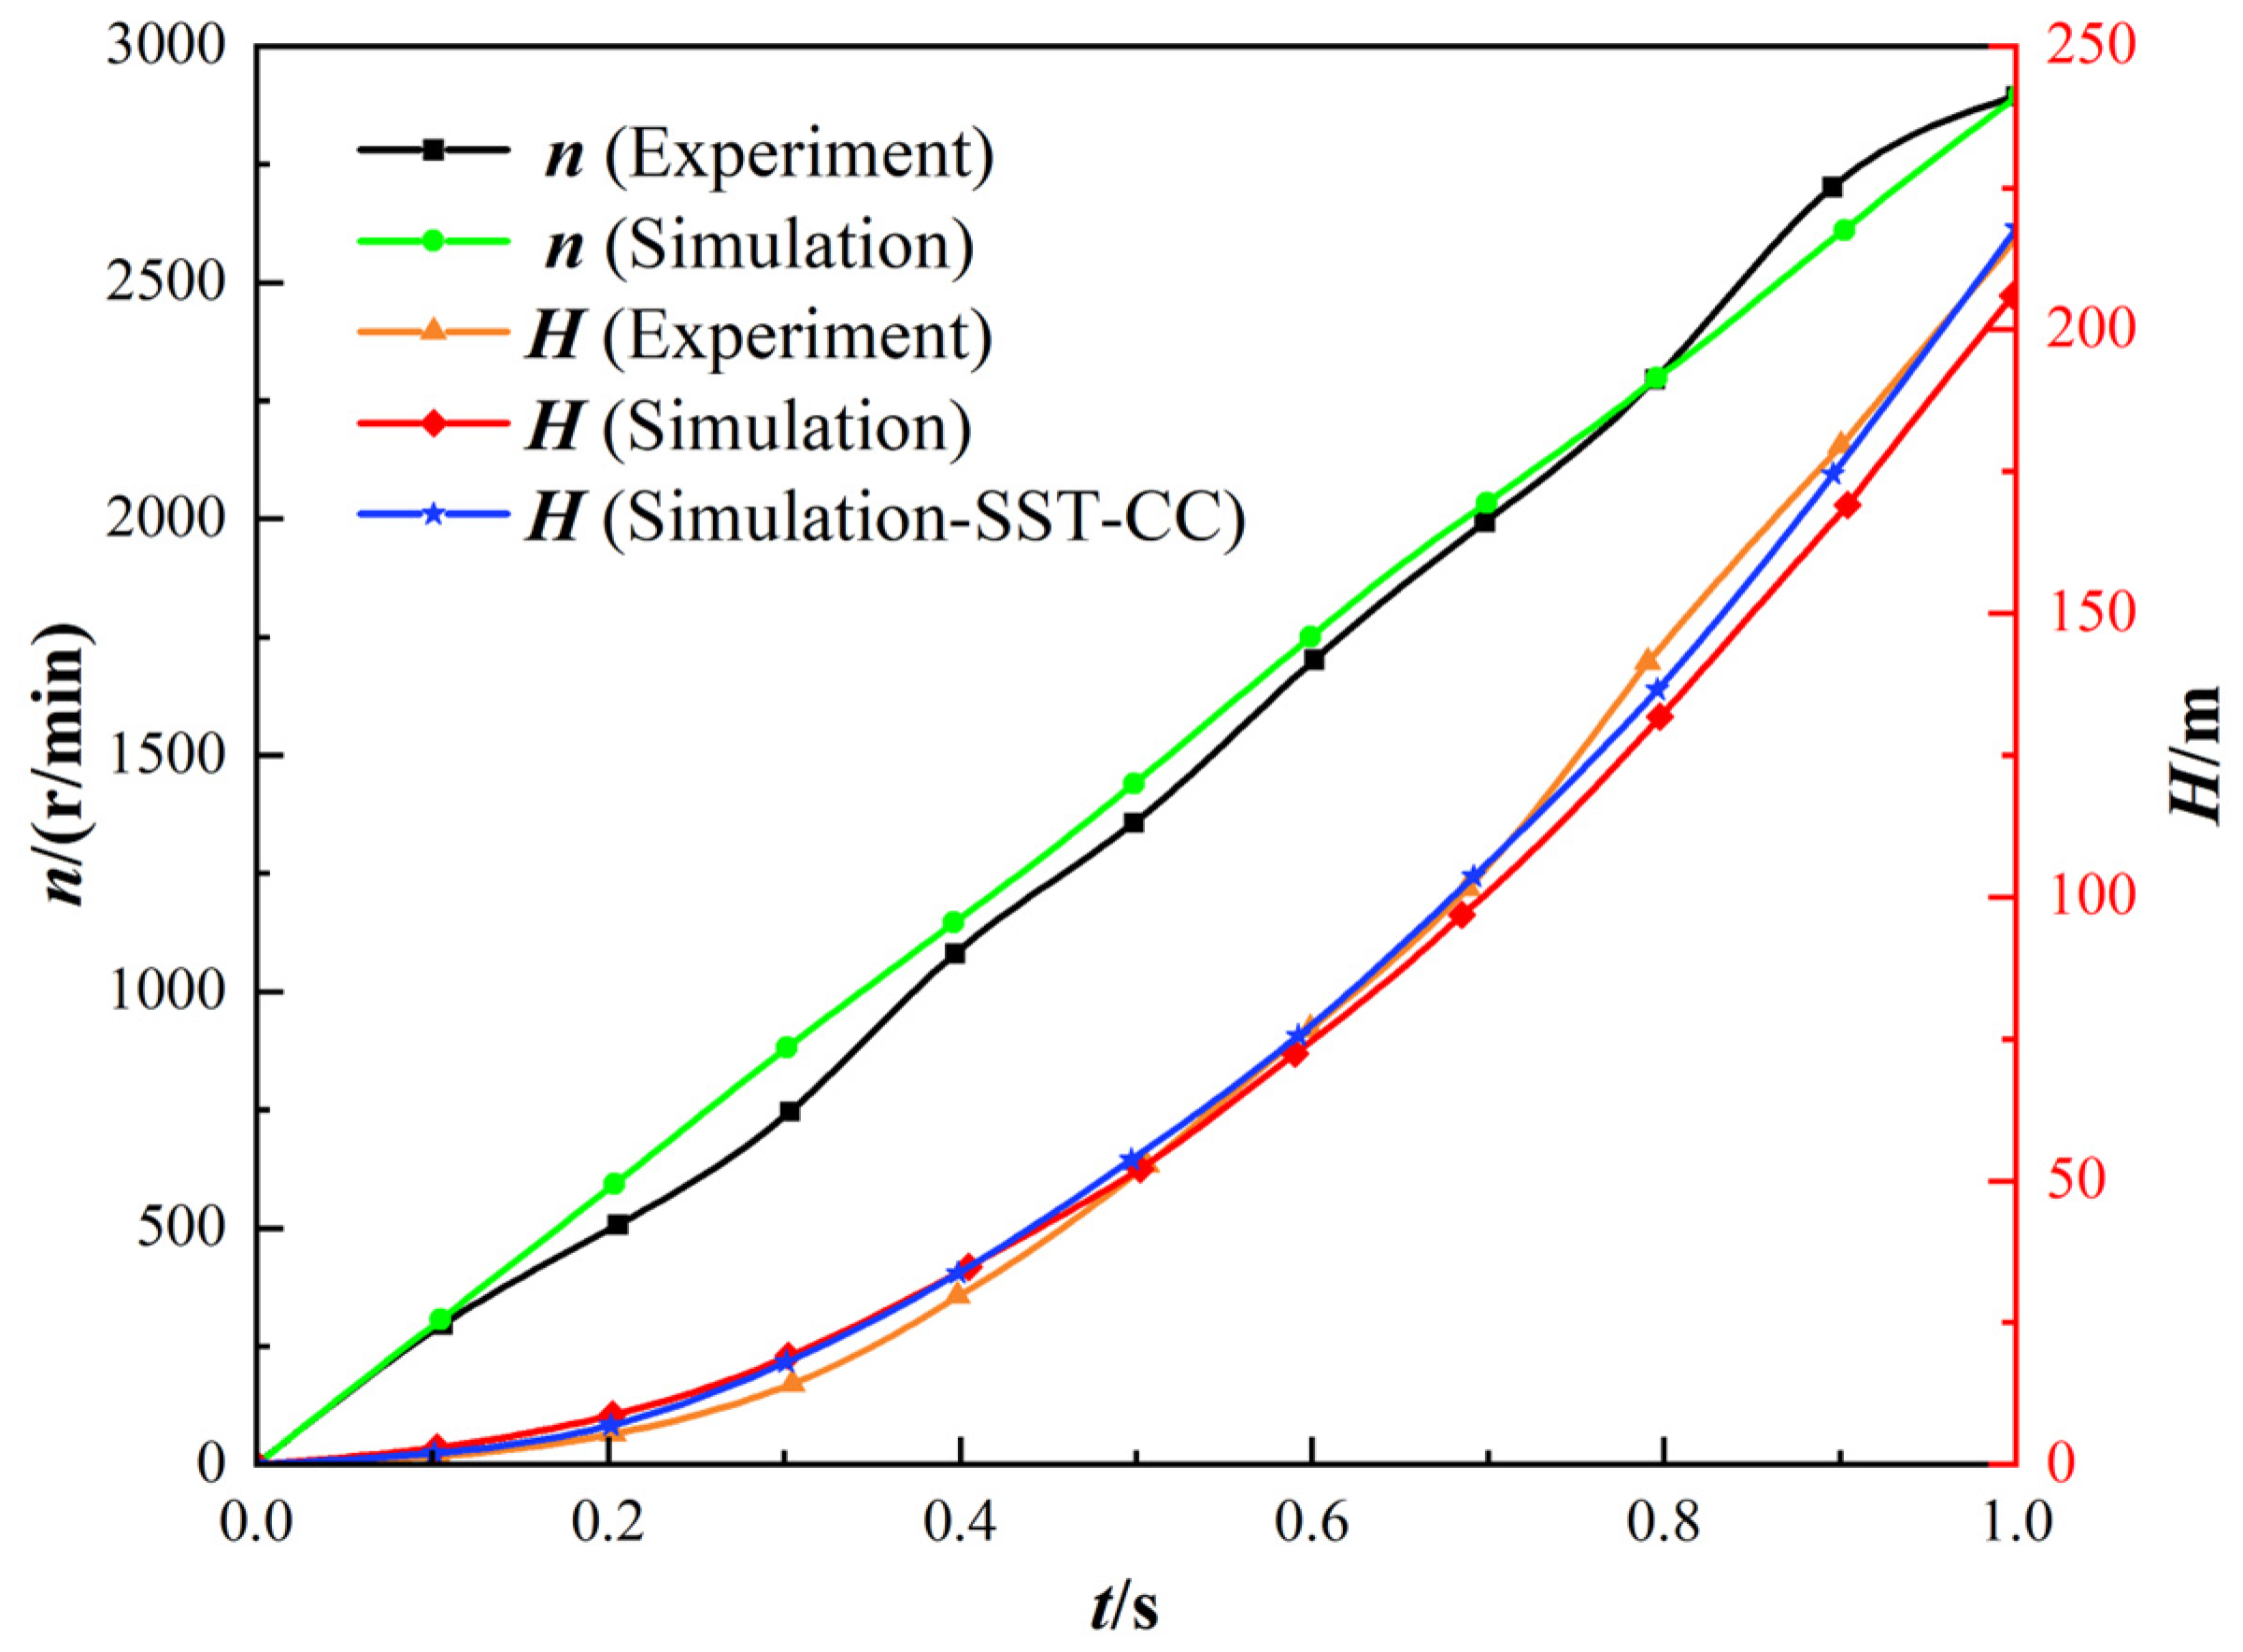
3.1. Experiment Validation
3.2. Transient Internal Flow Characteristics Analysis during the Startup Process
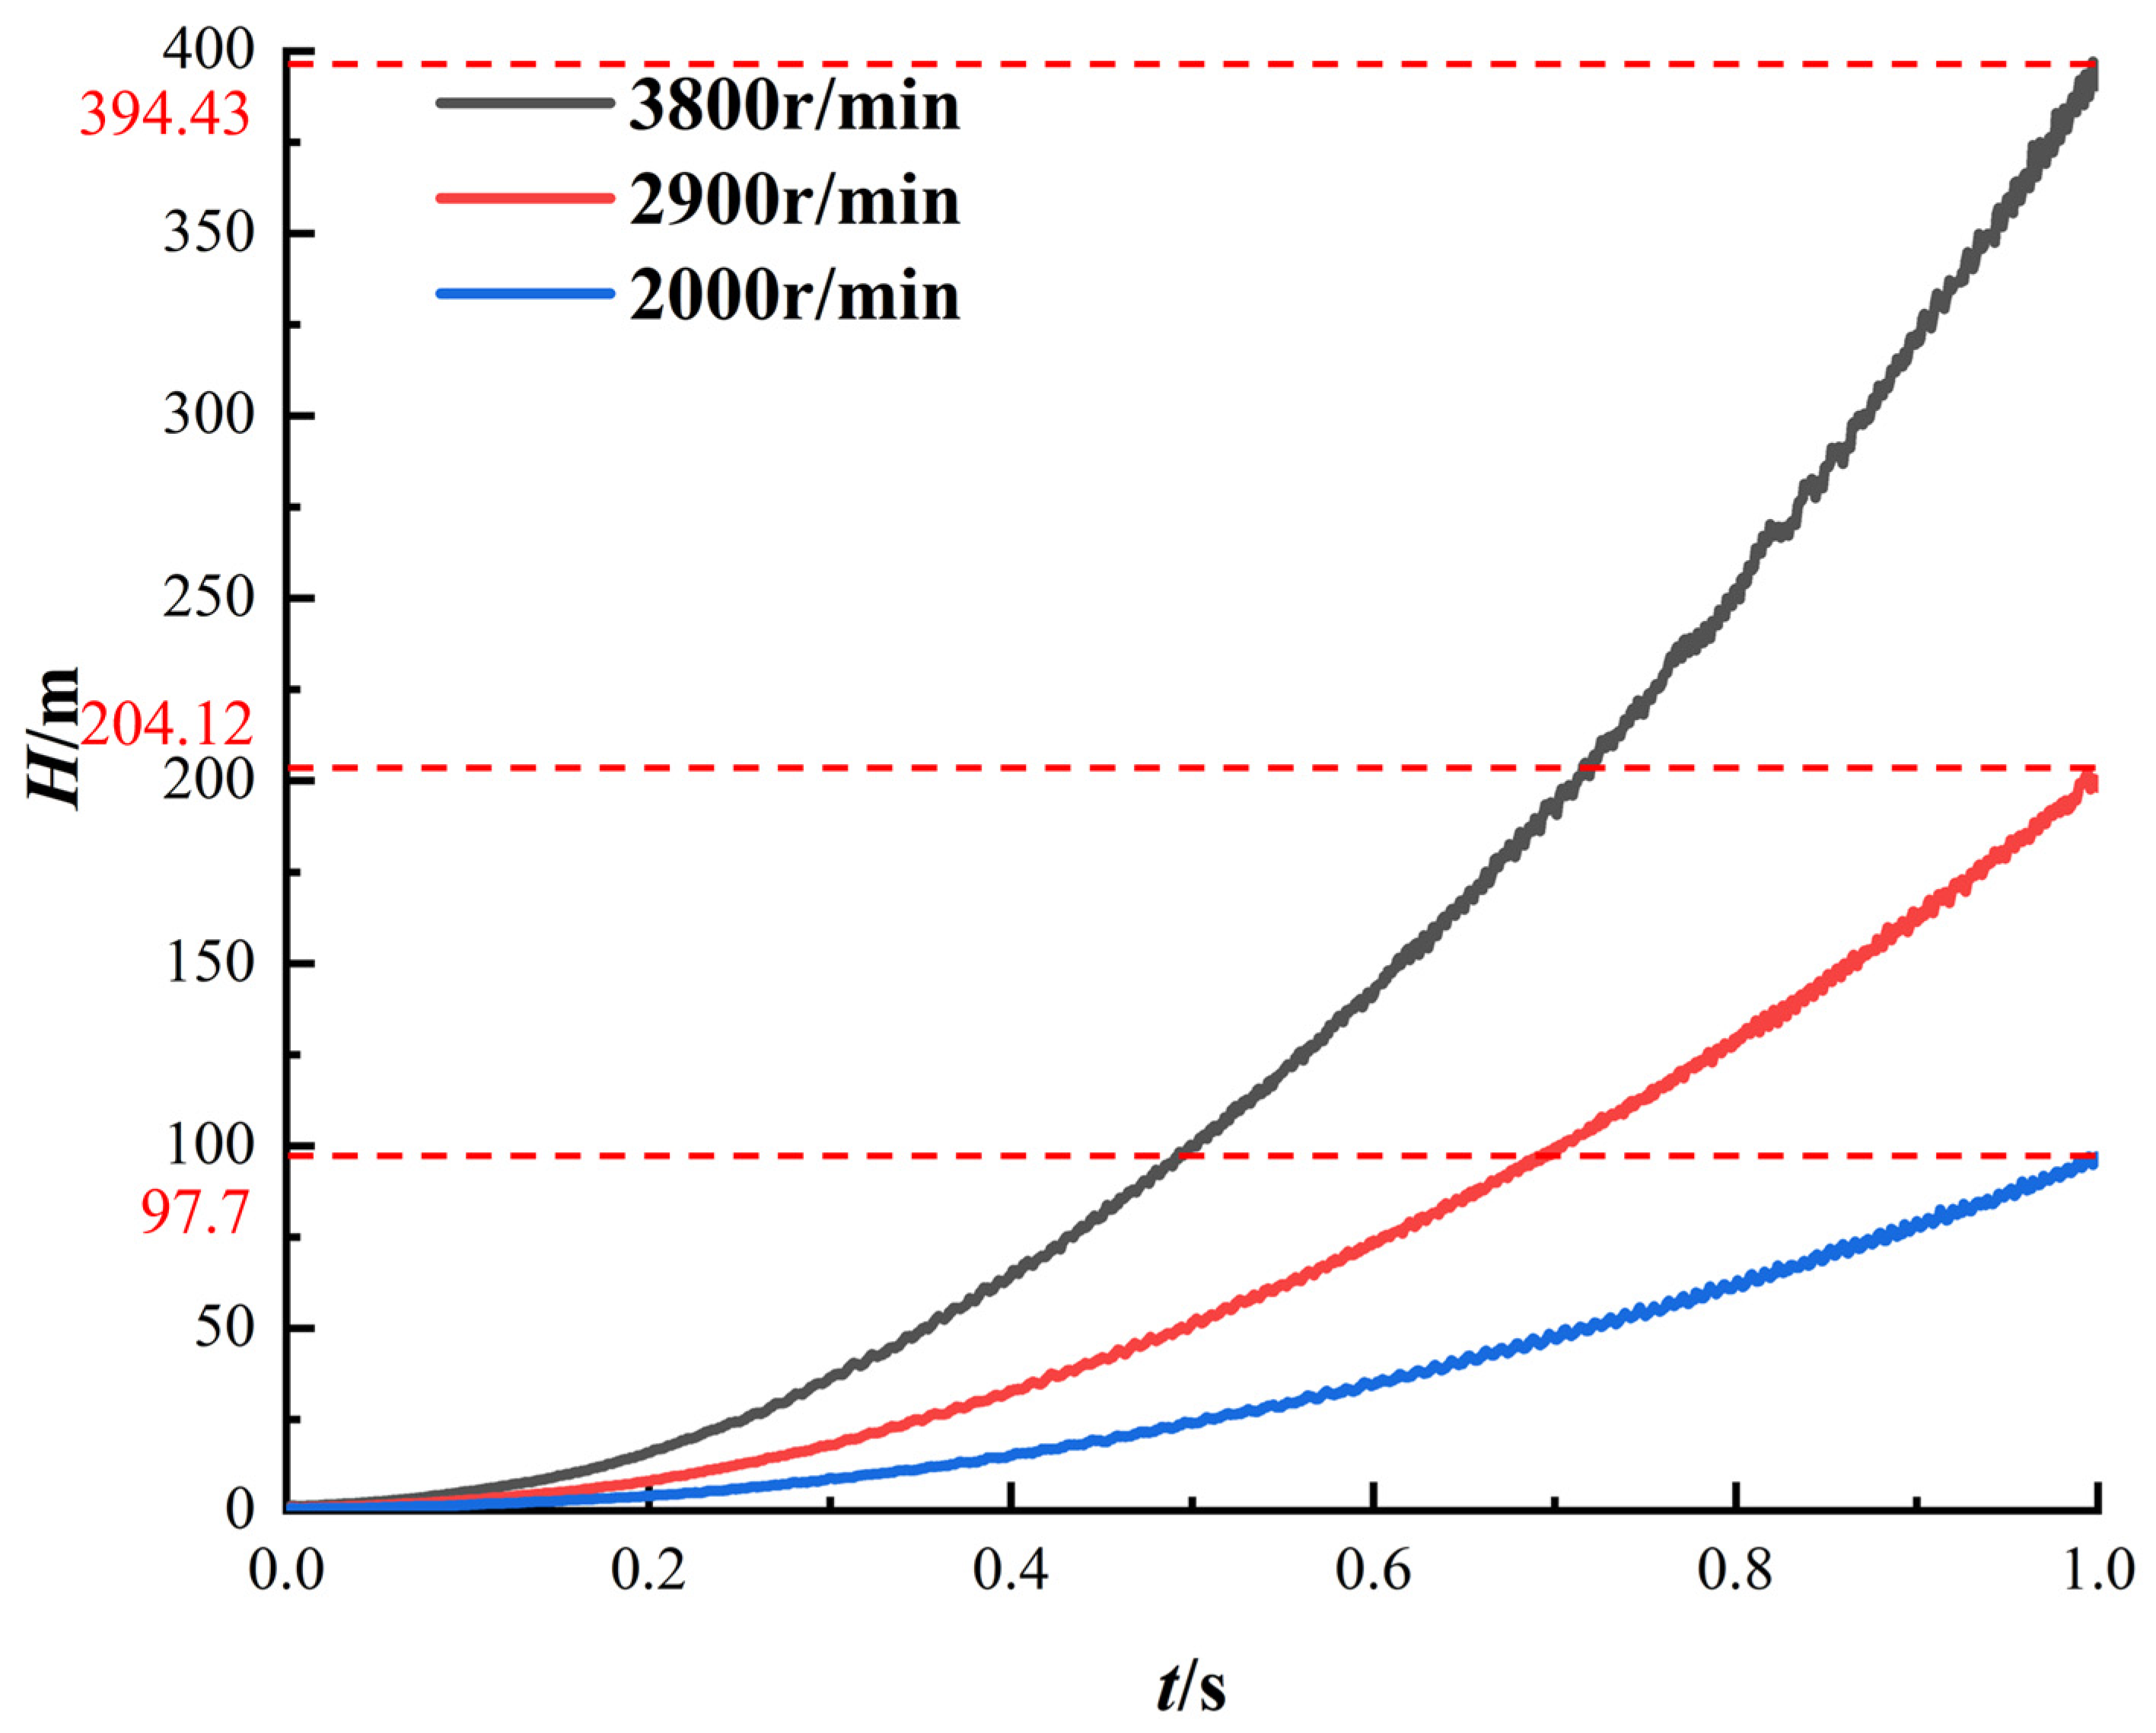
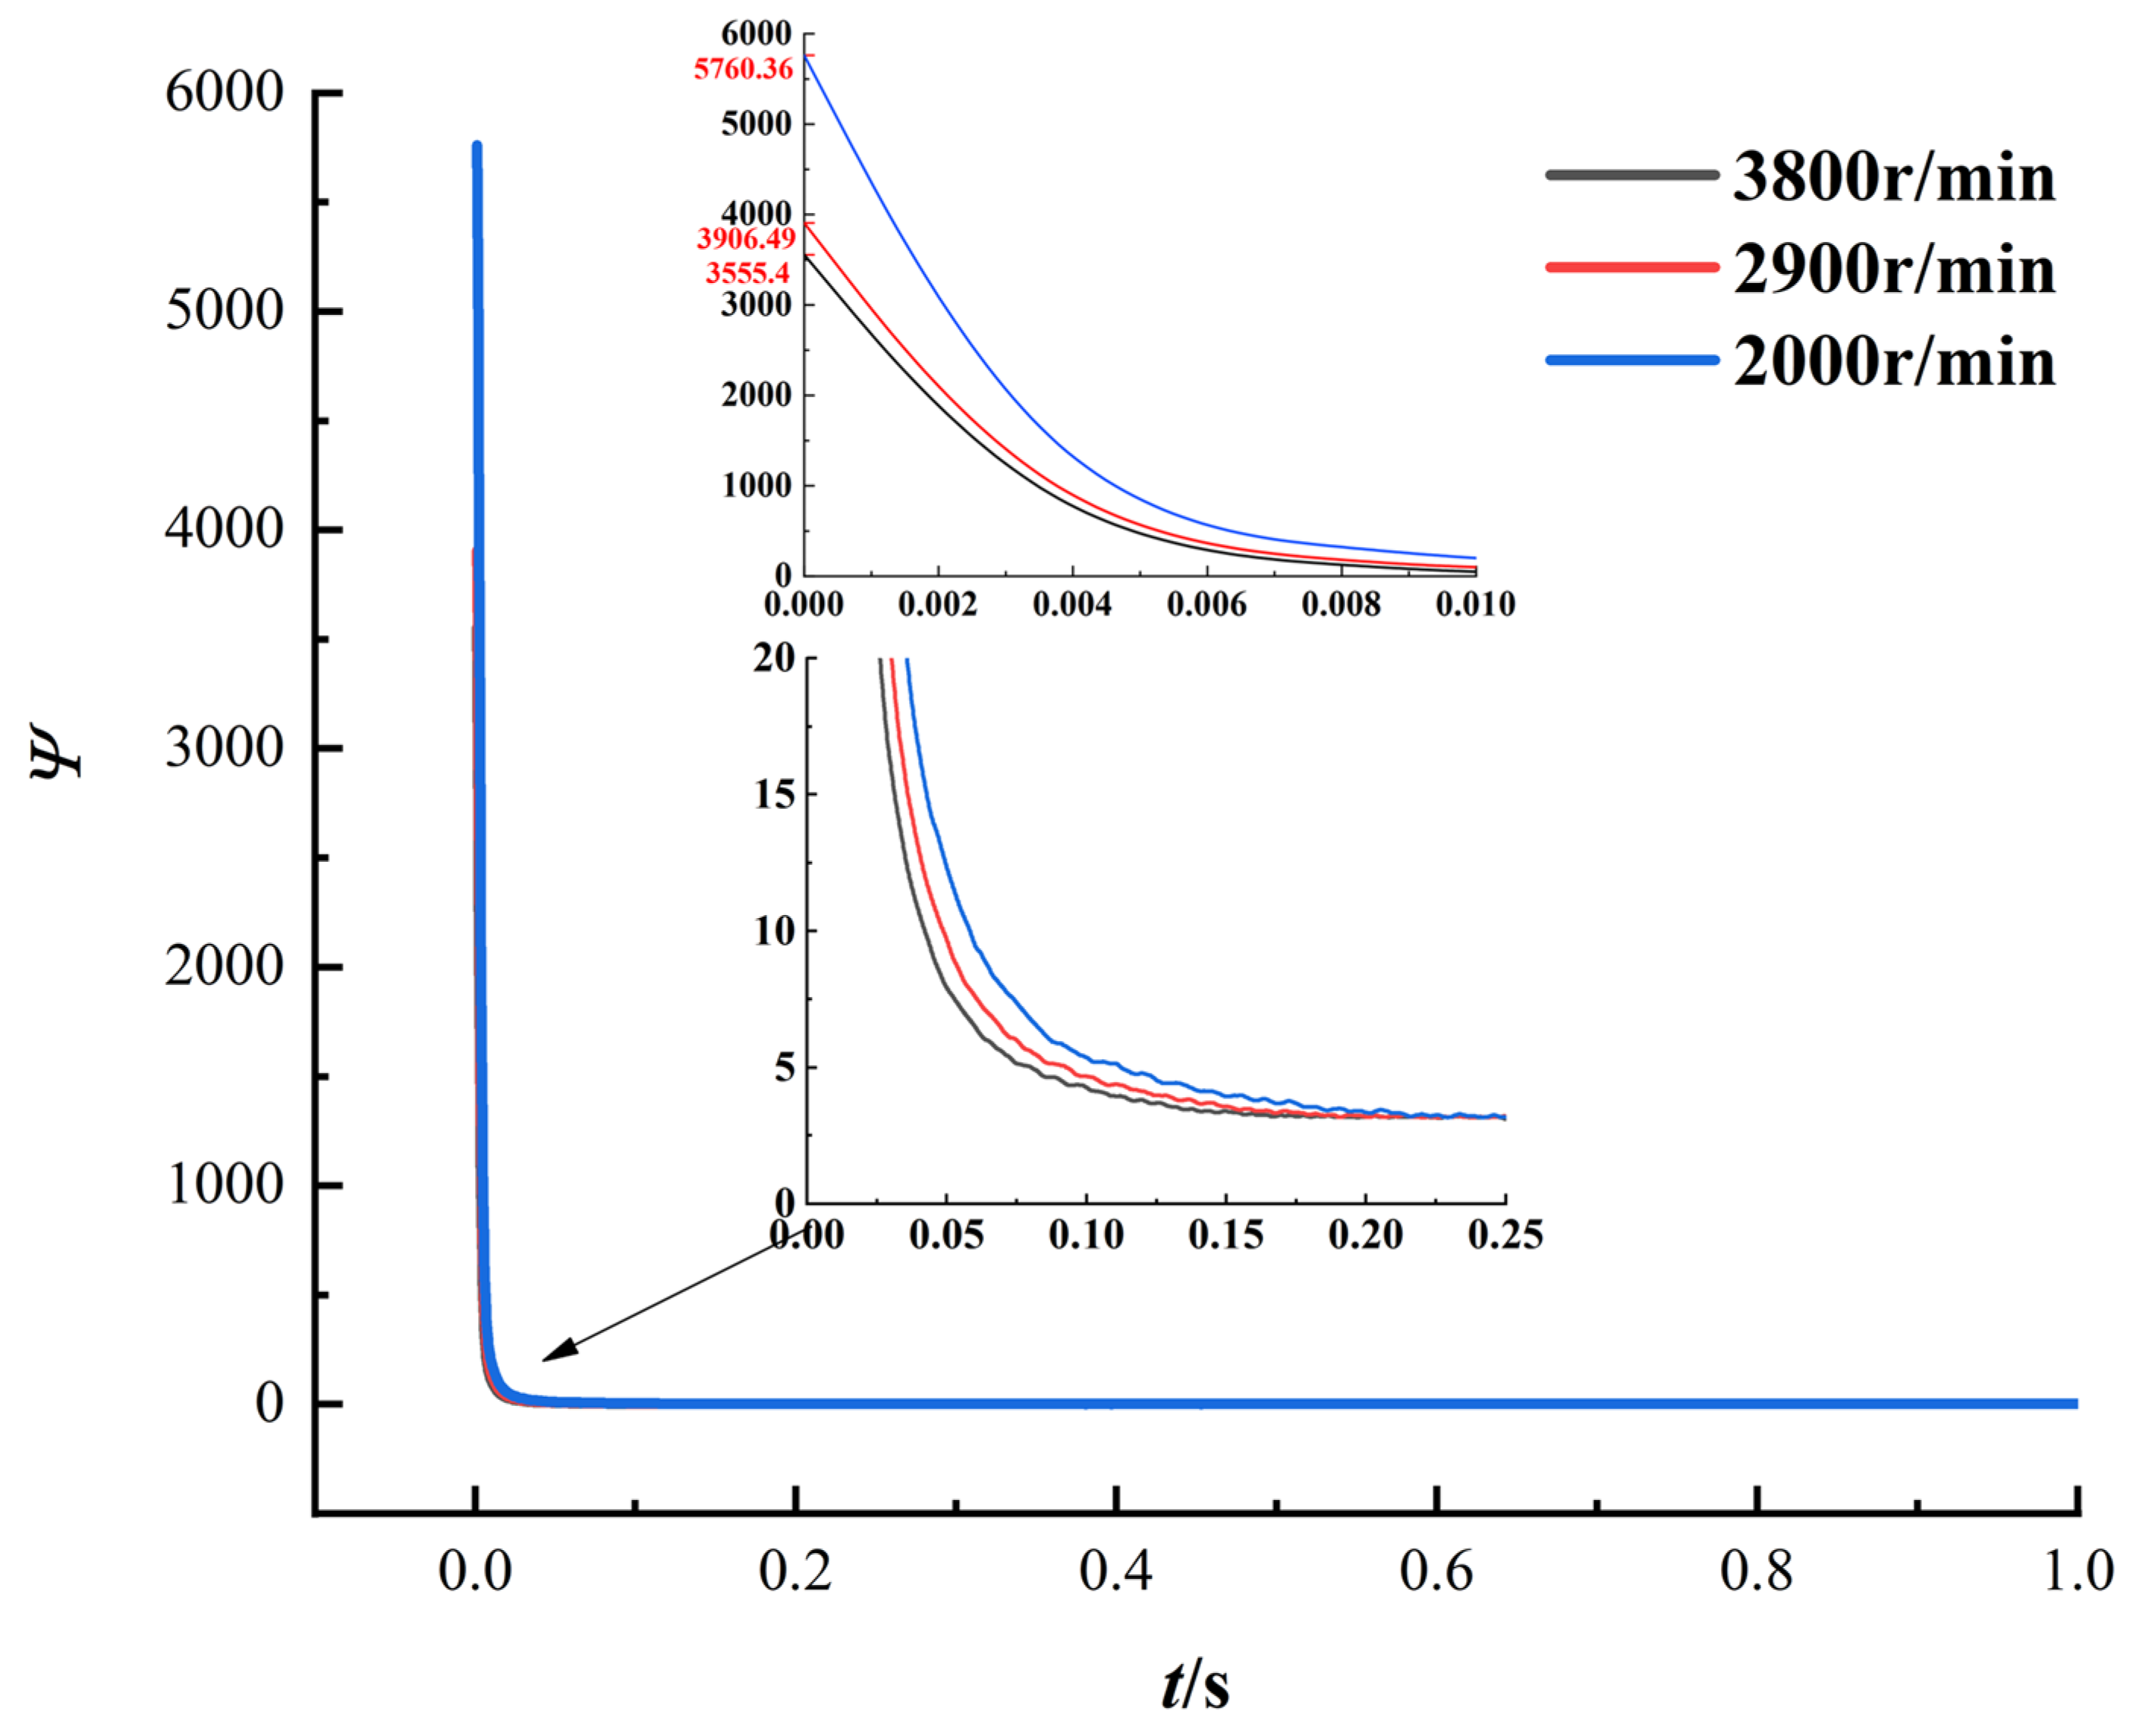
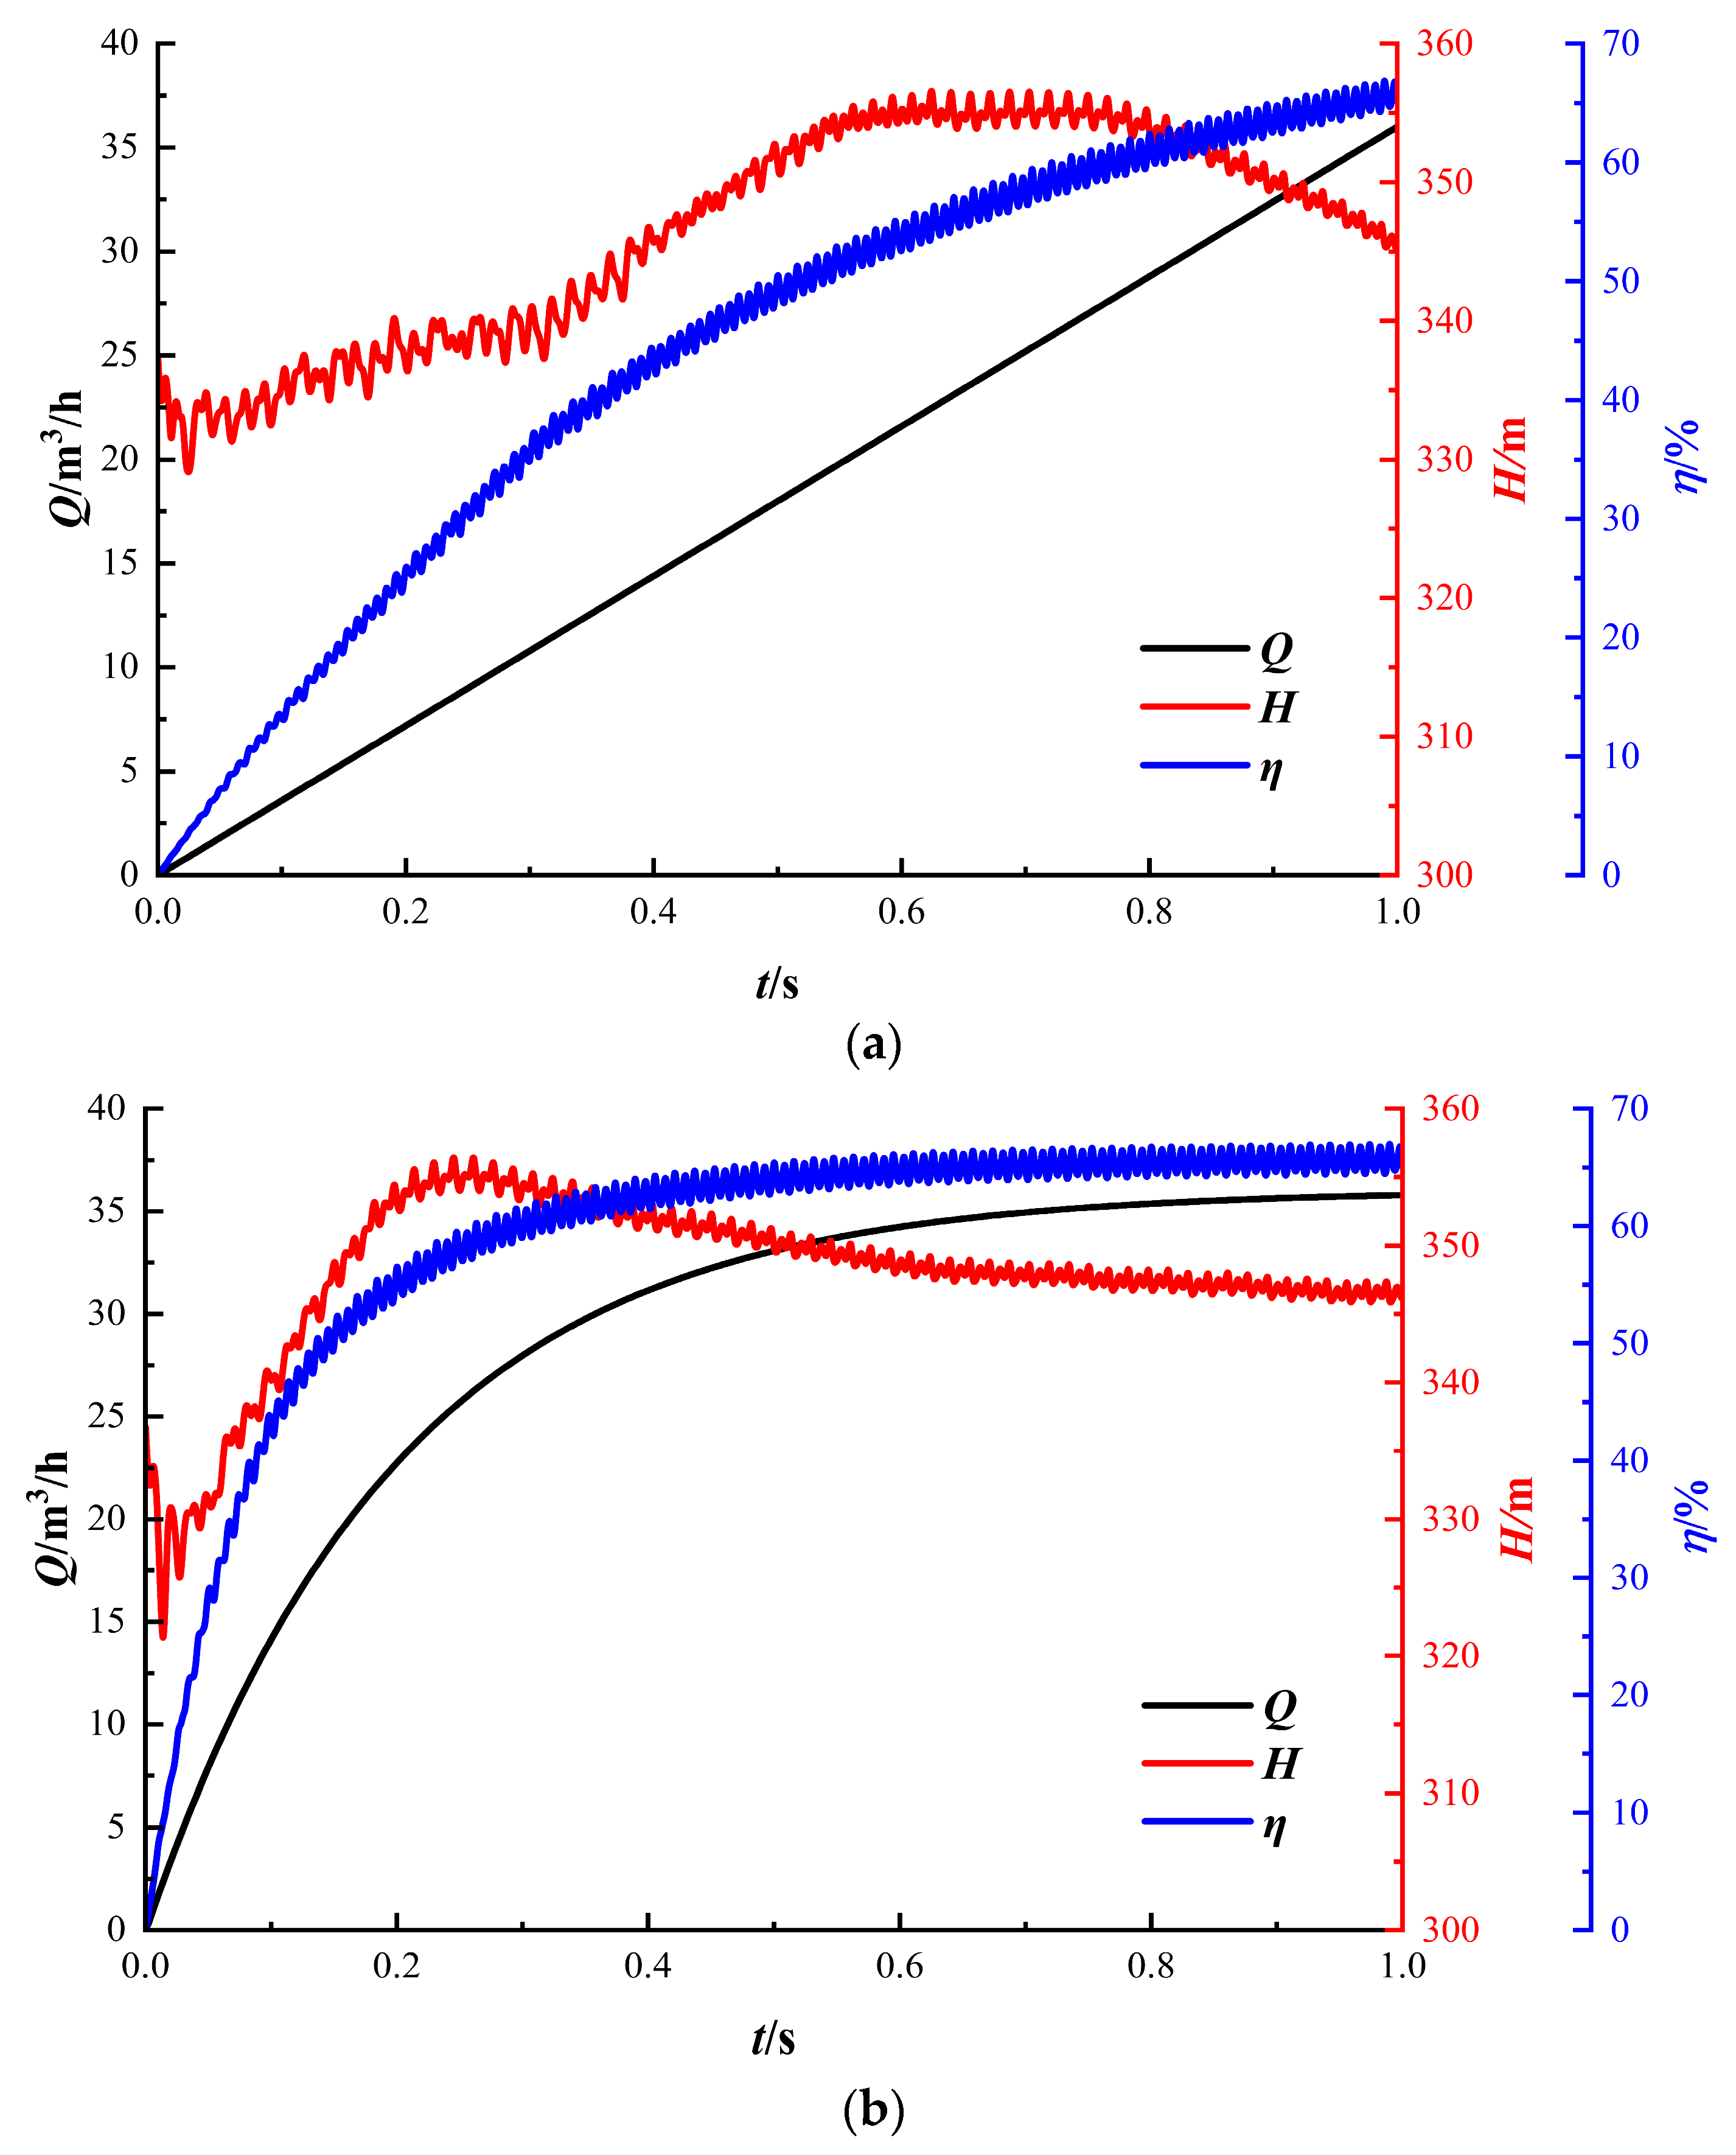
3.2.1. Pump Performance Analysis and Vortex Structures Evolution
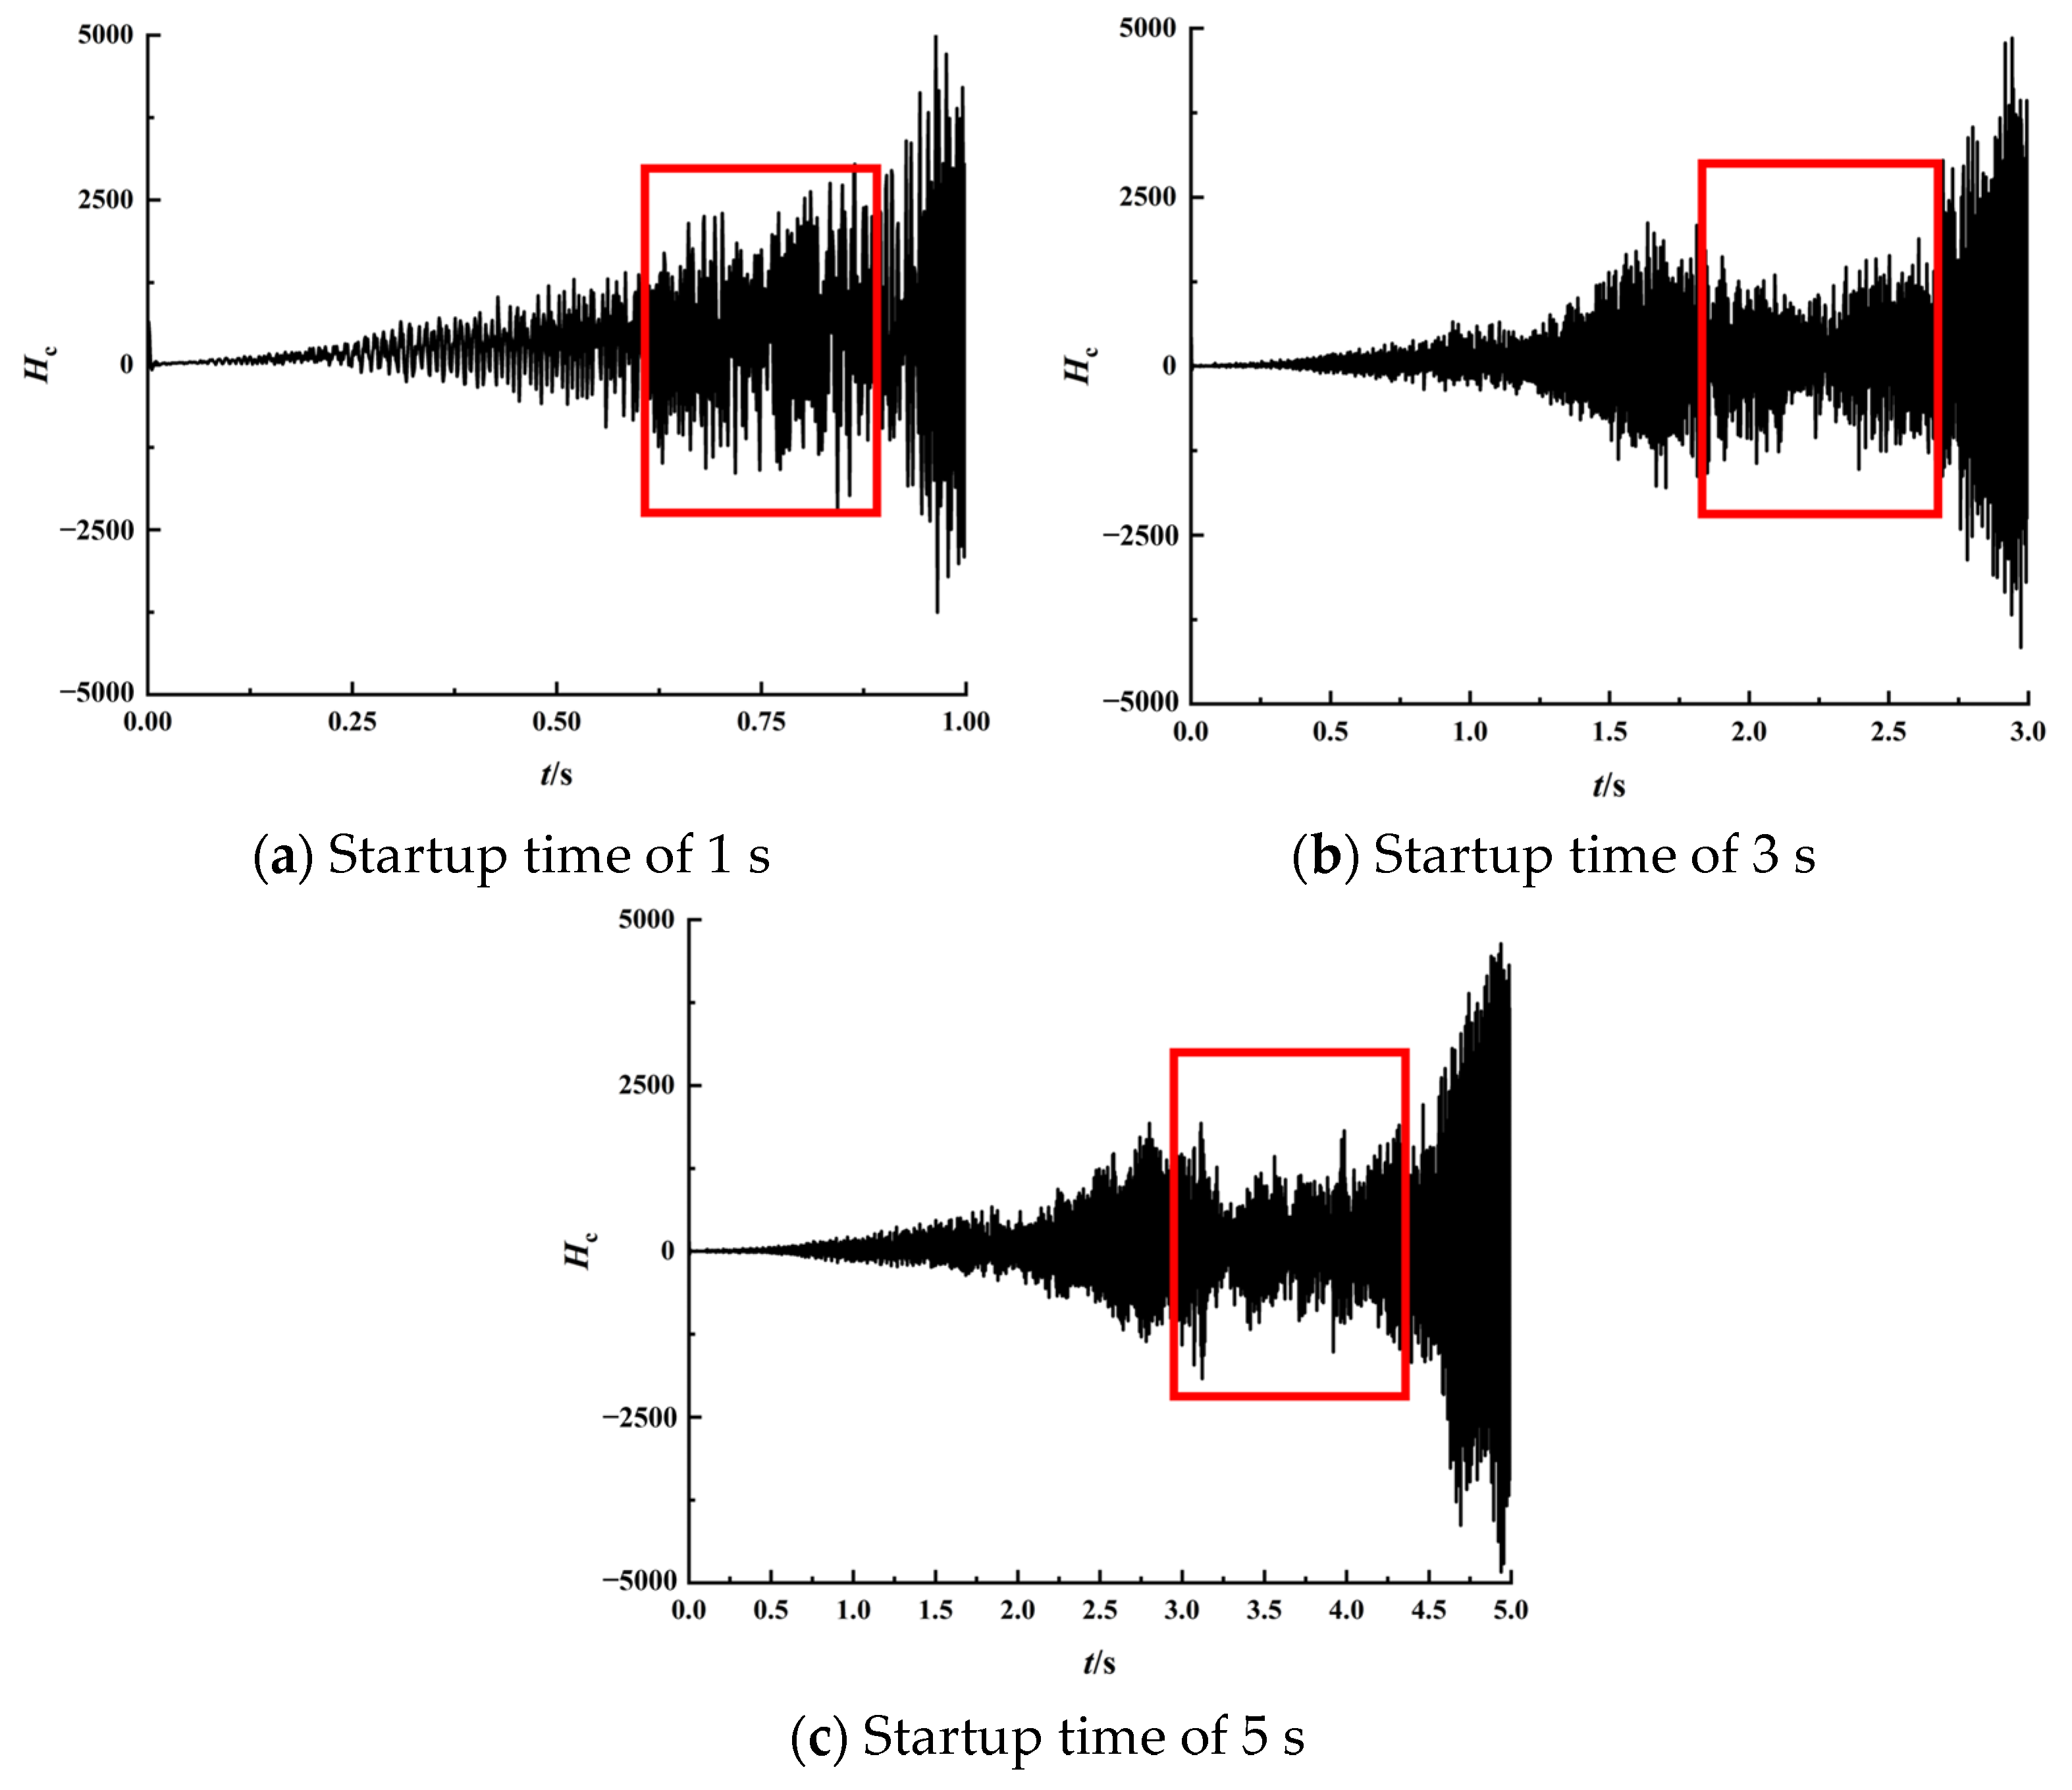
3.2.2. Influence of Startup Time on Transient Characteristics of Multistage Pump
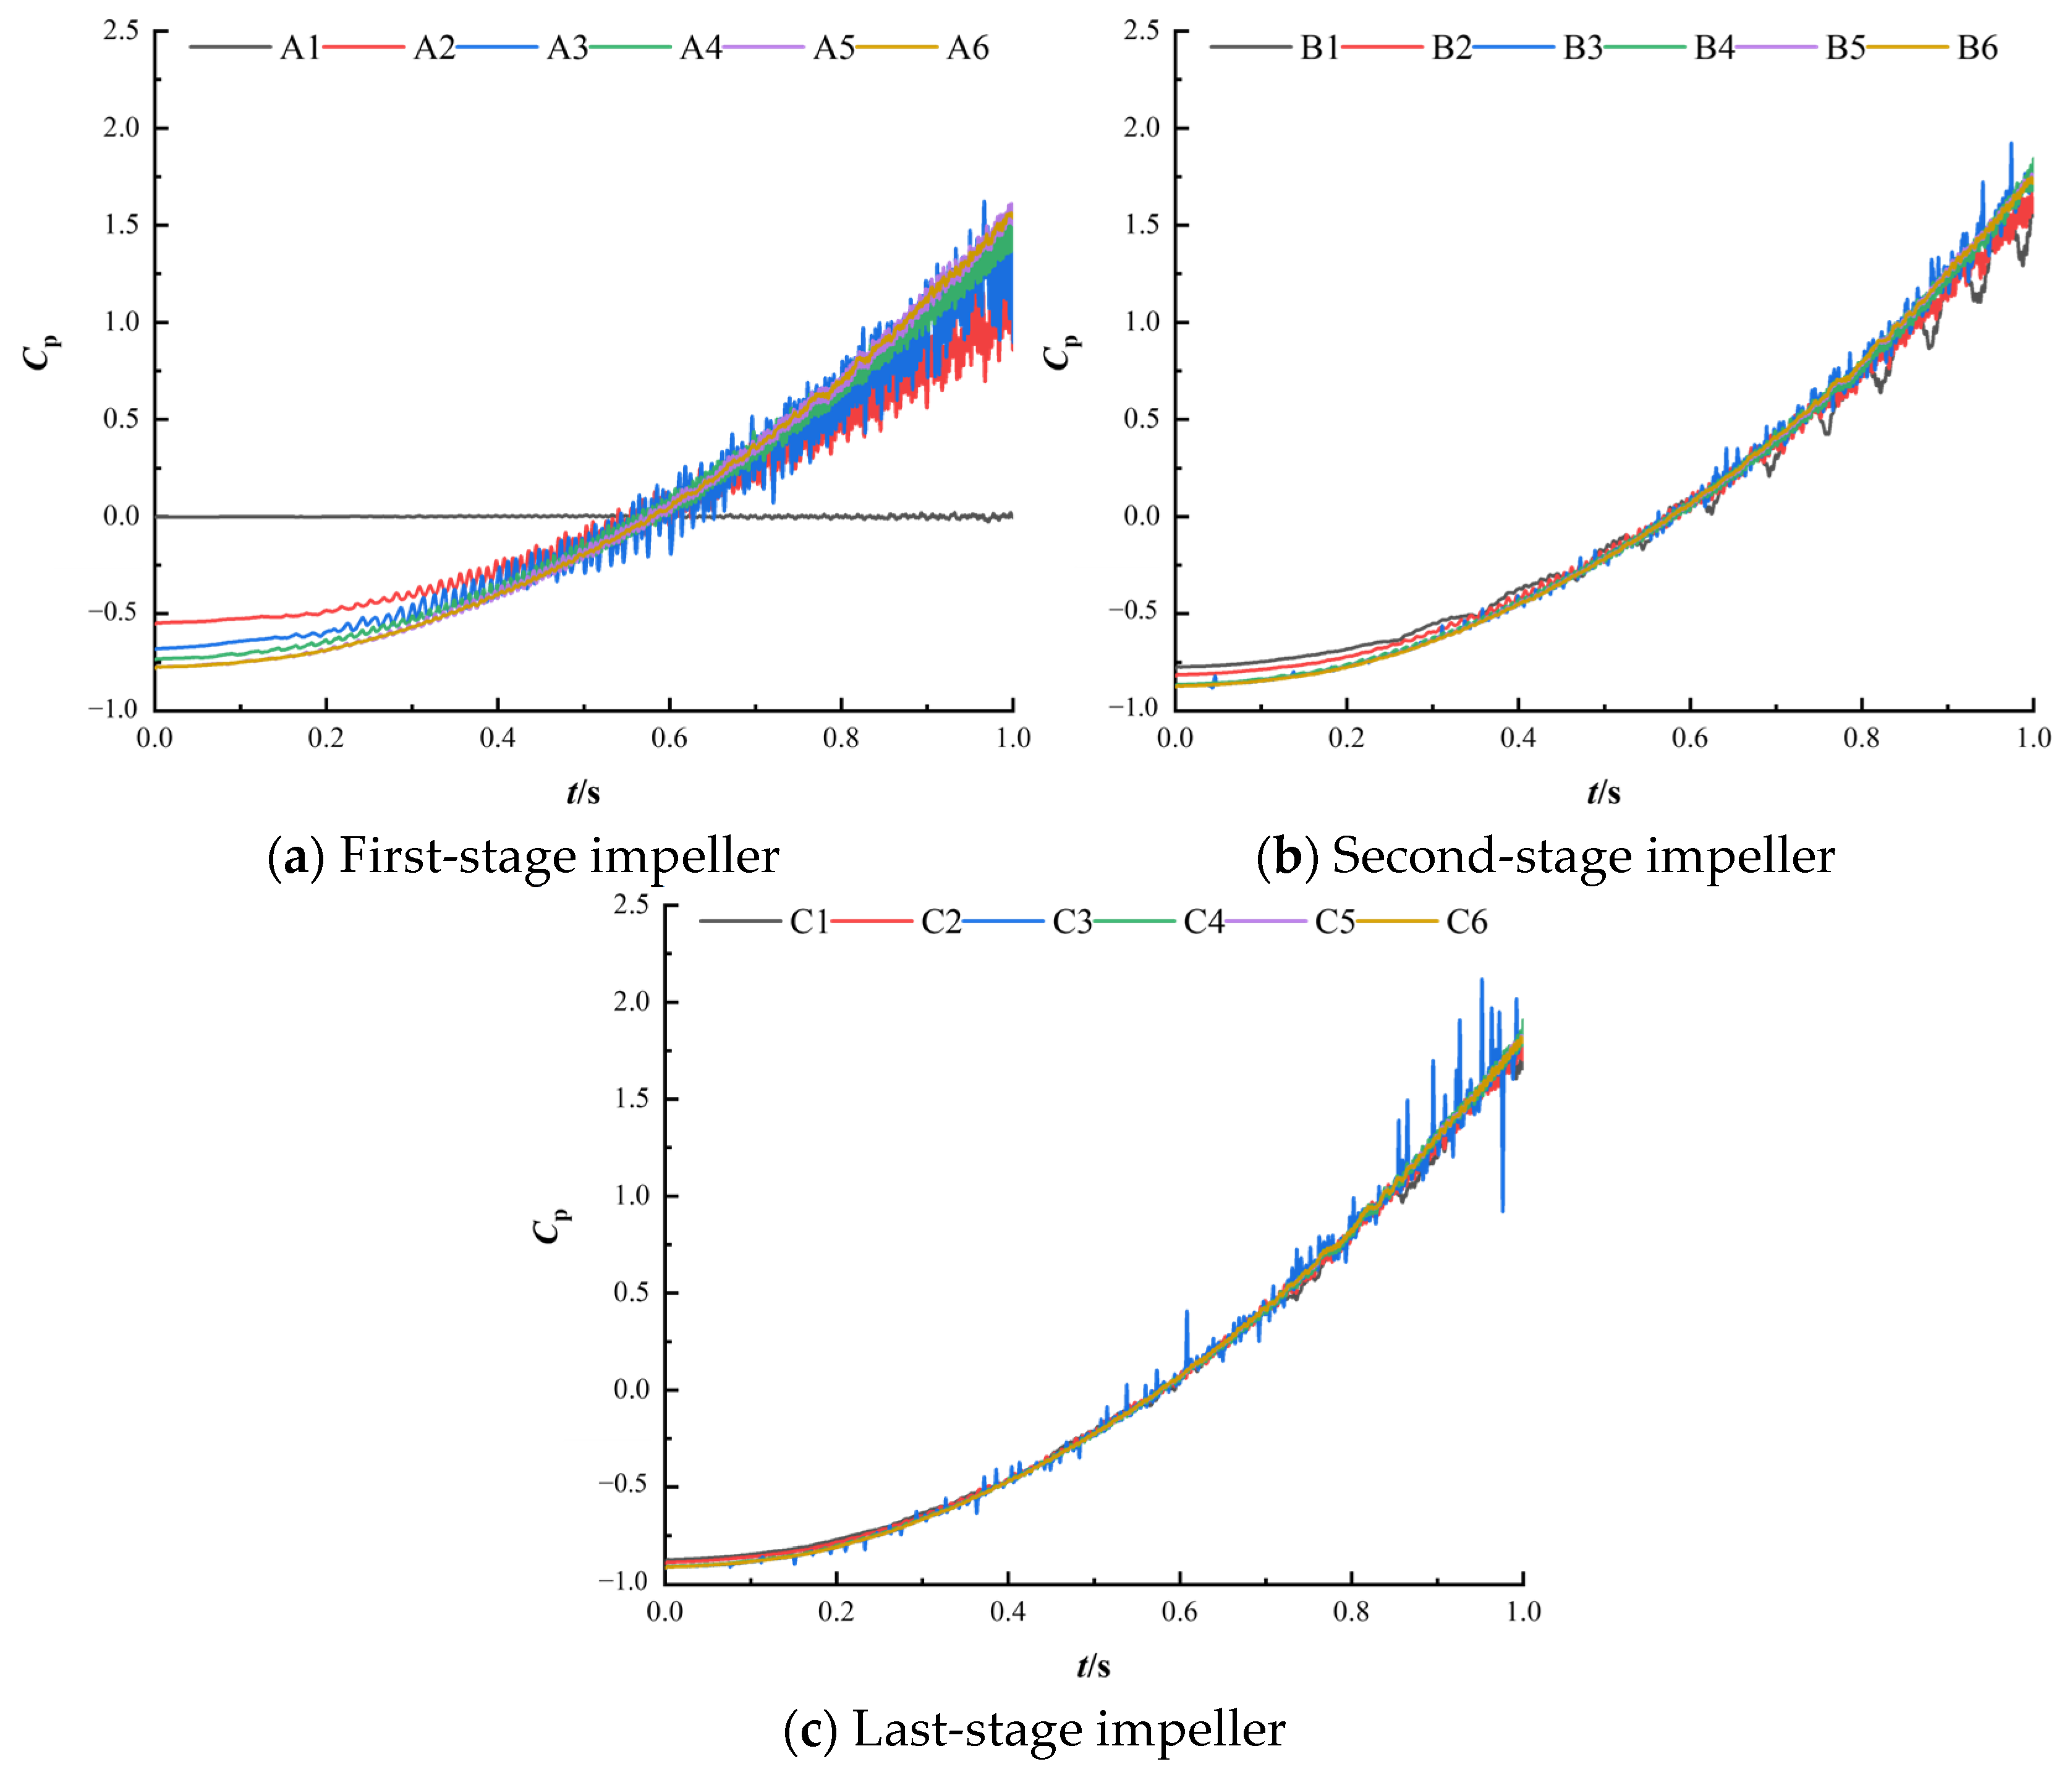
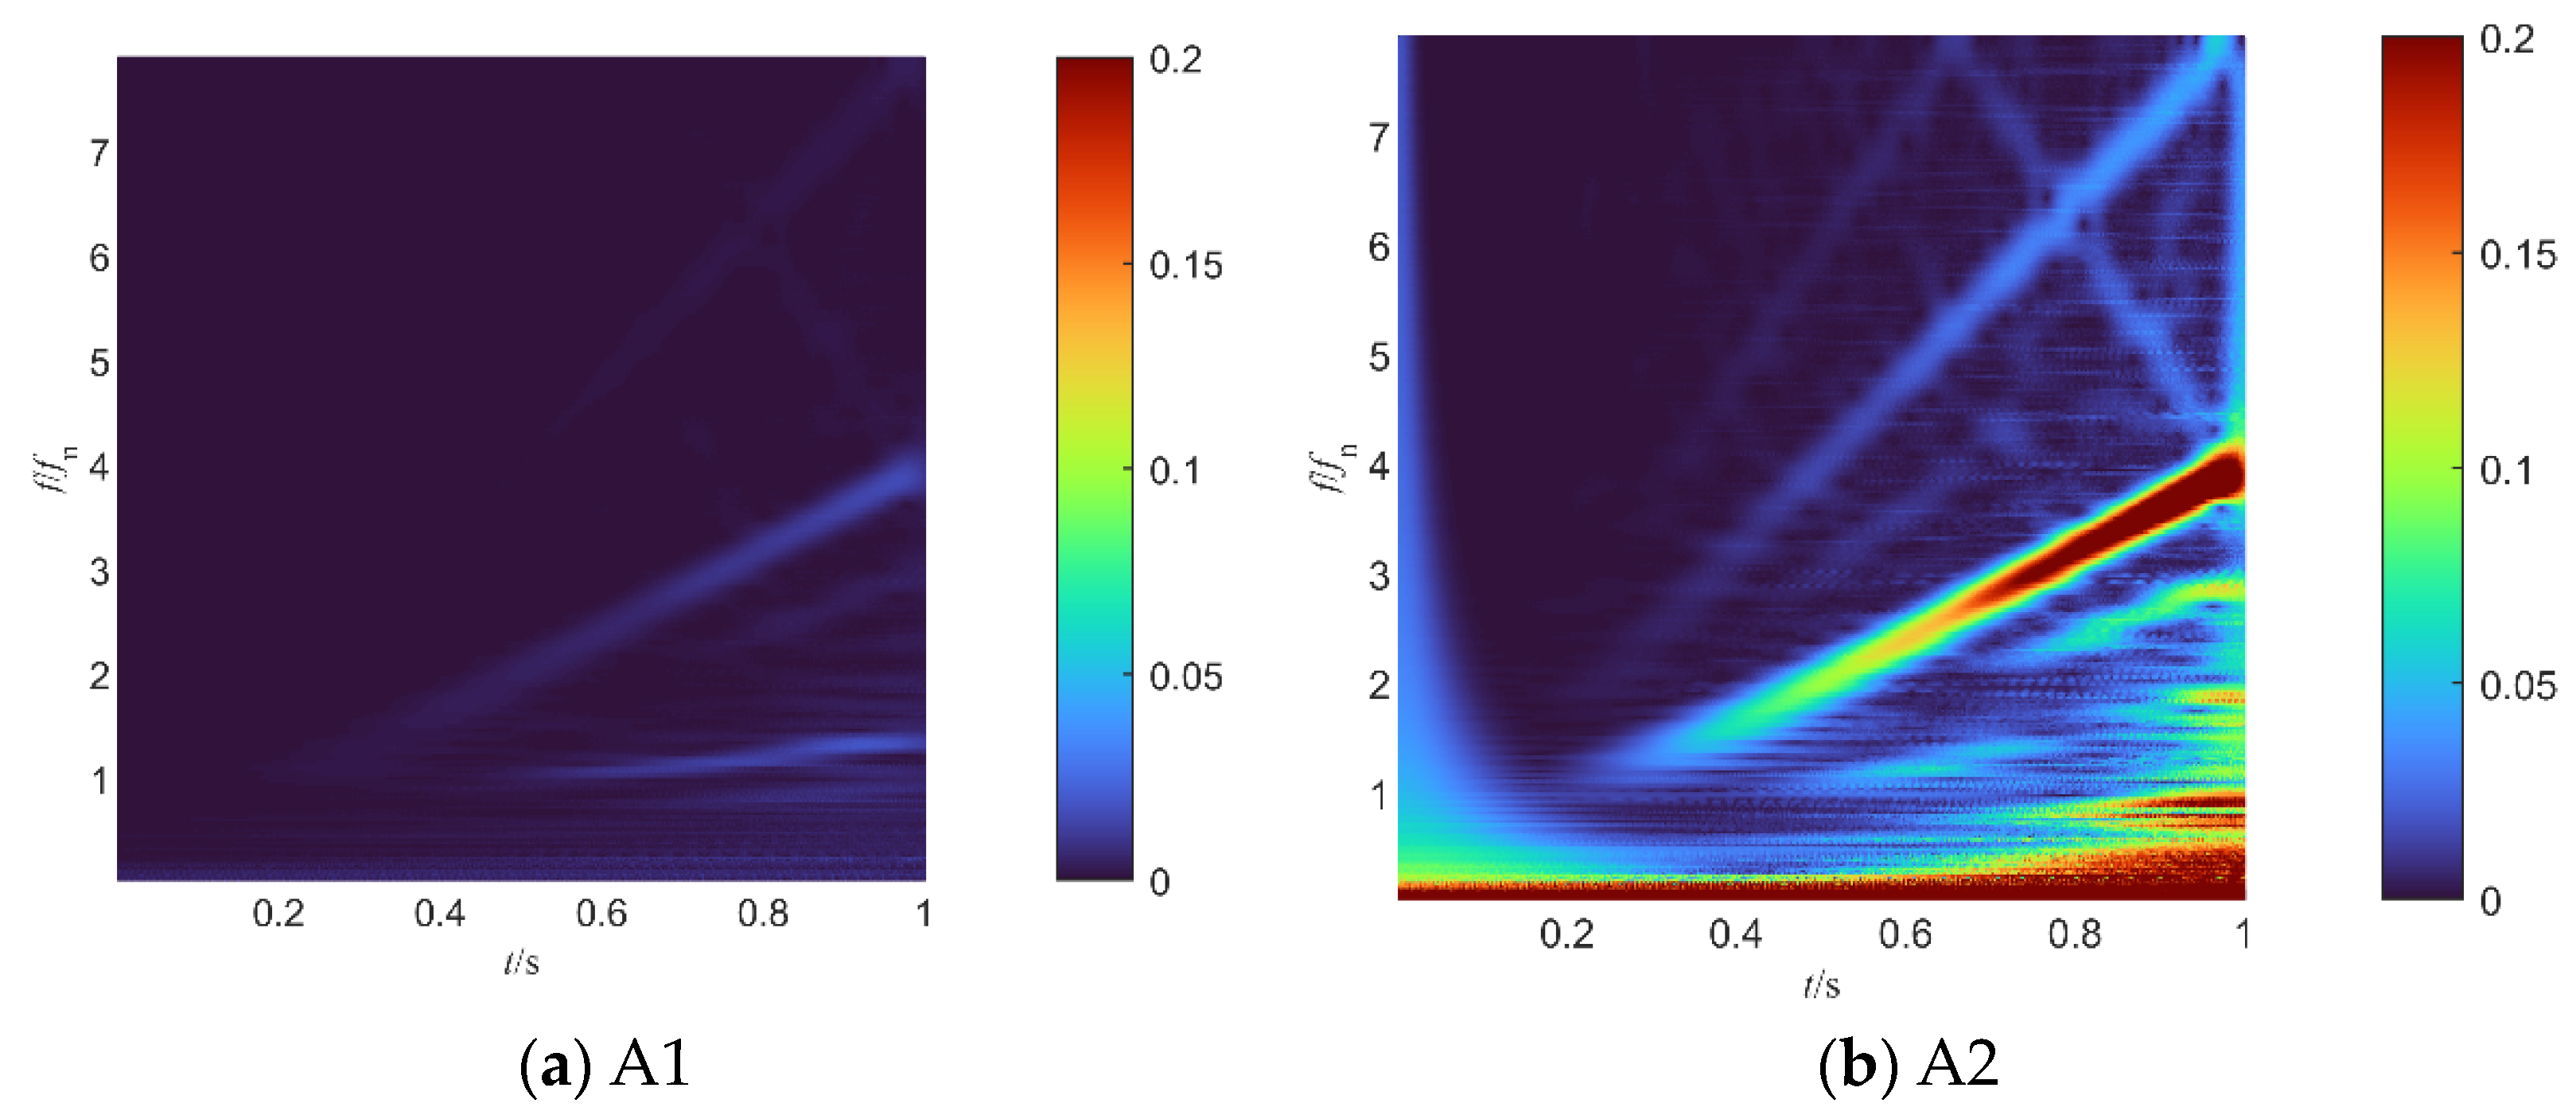
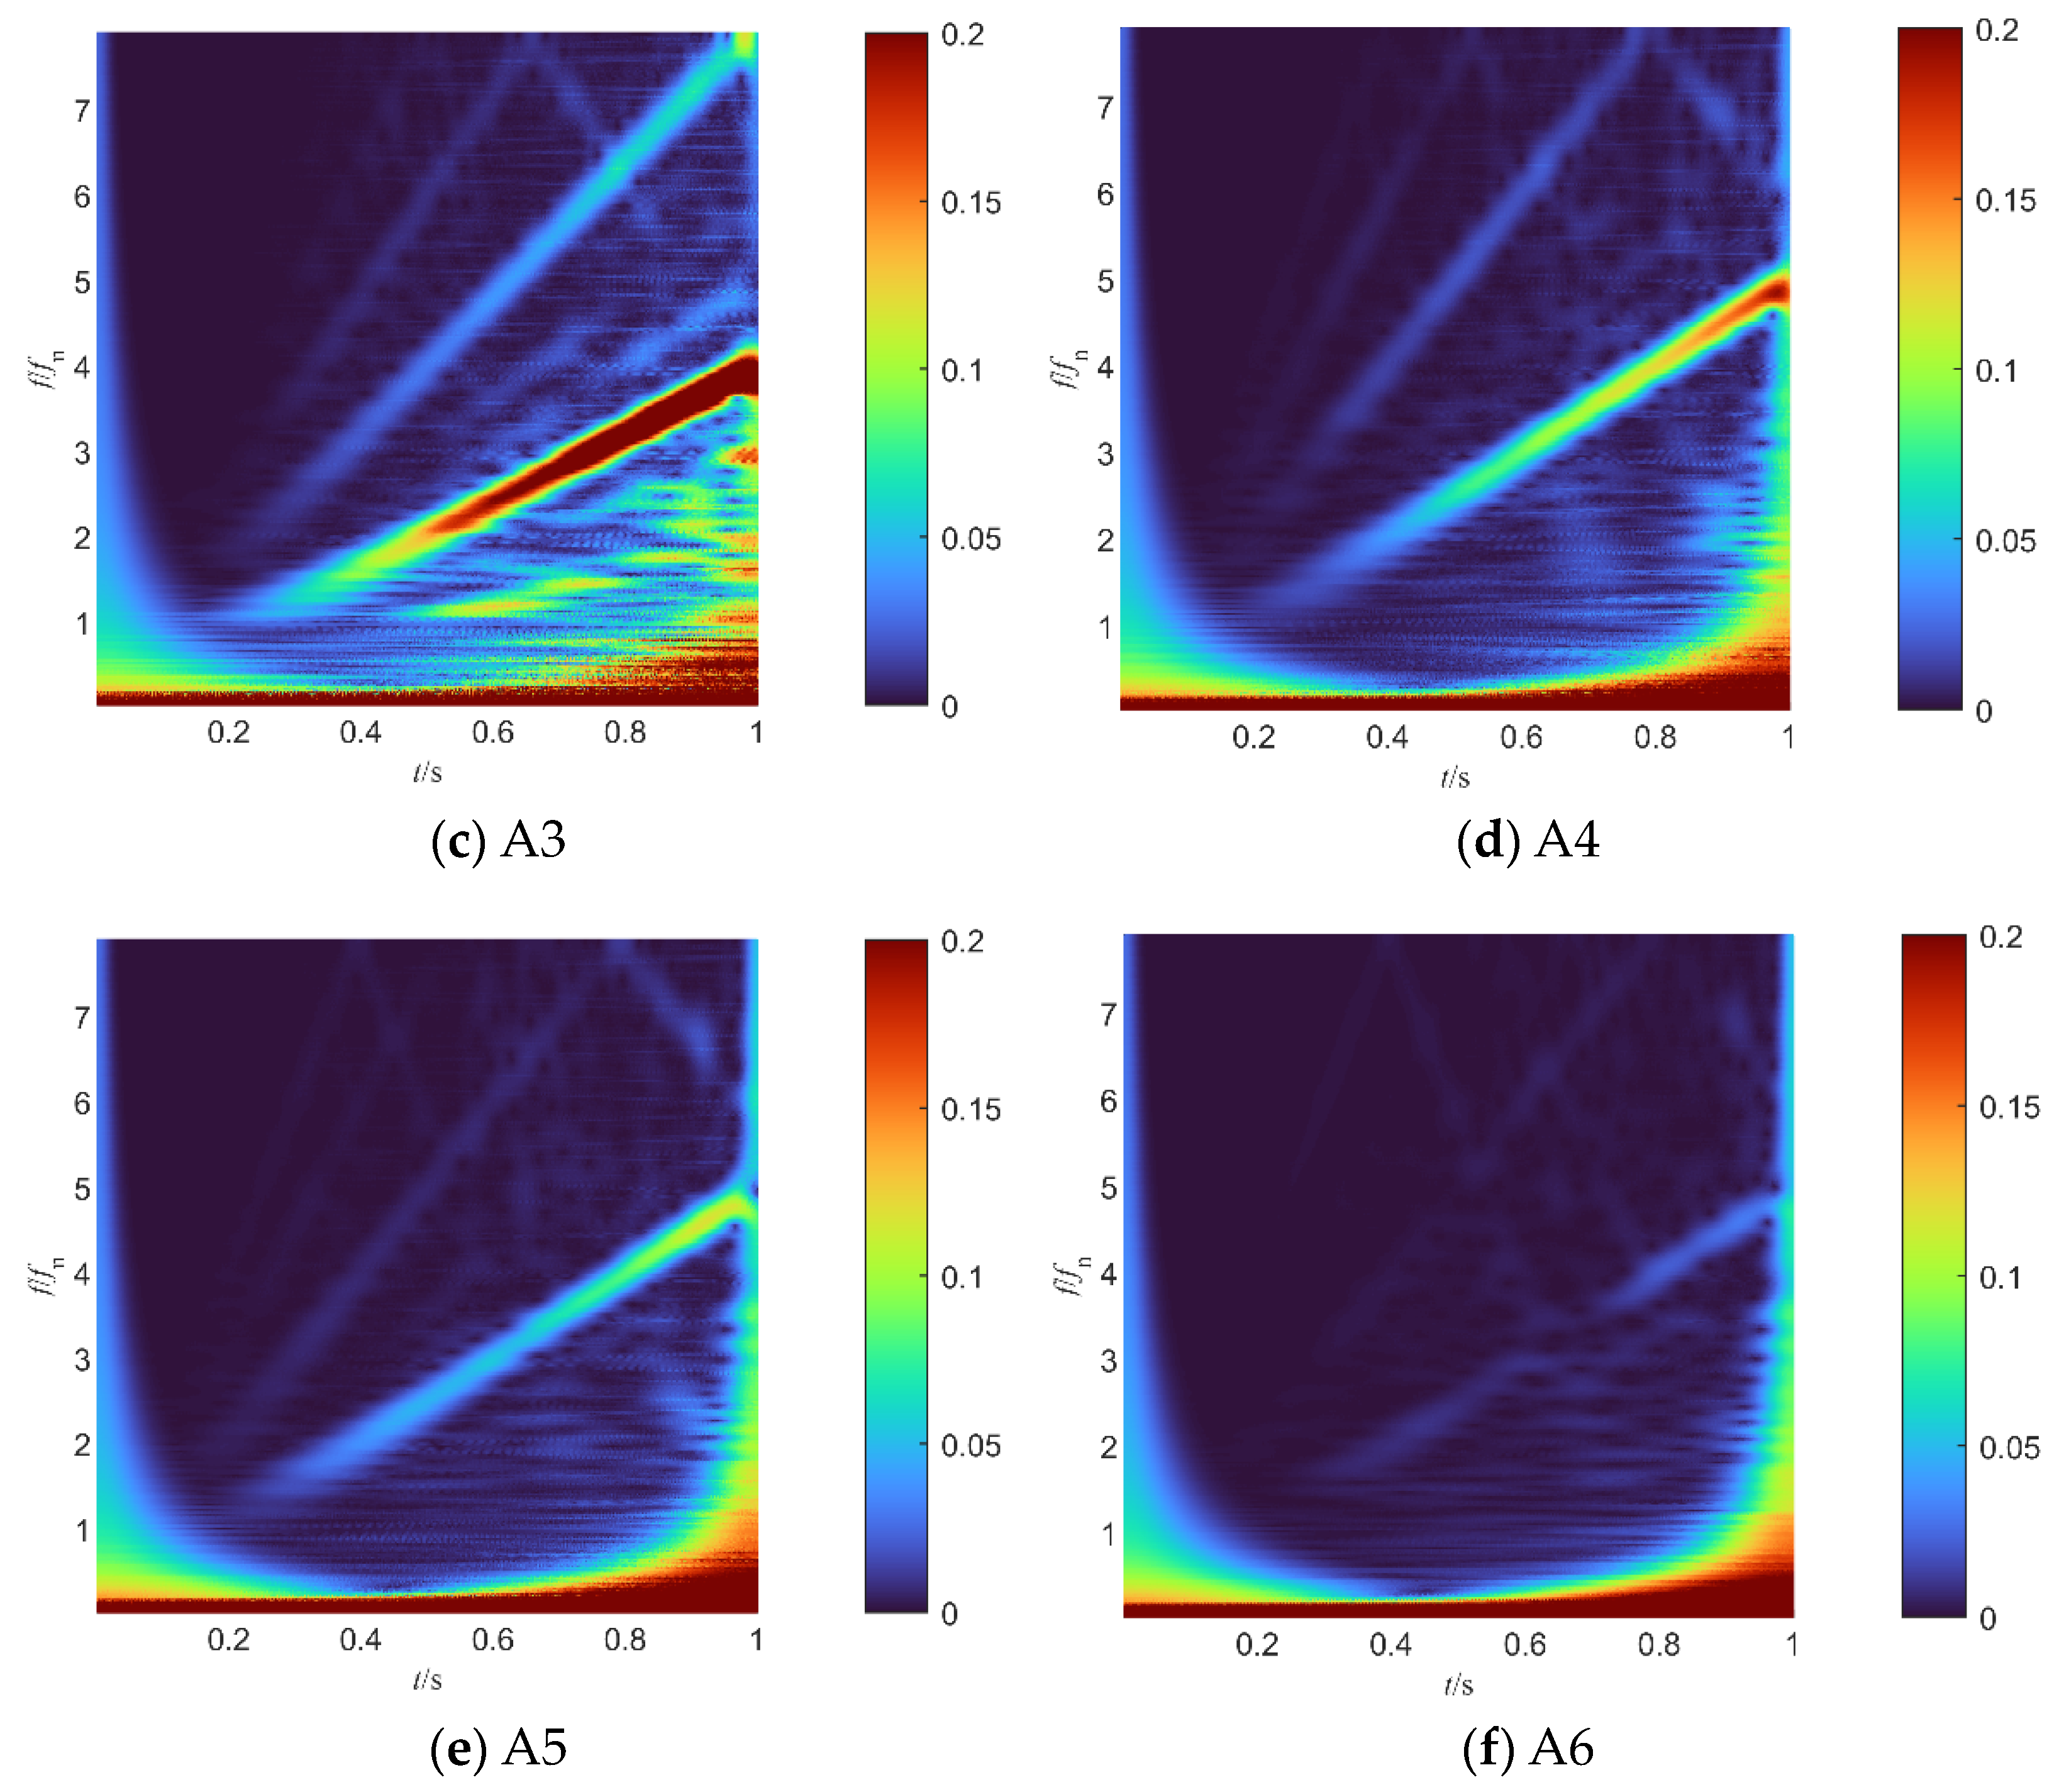
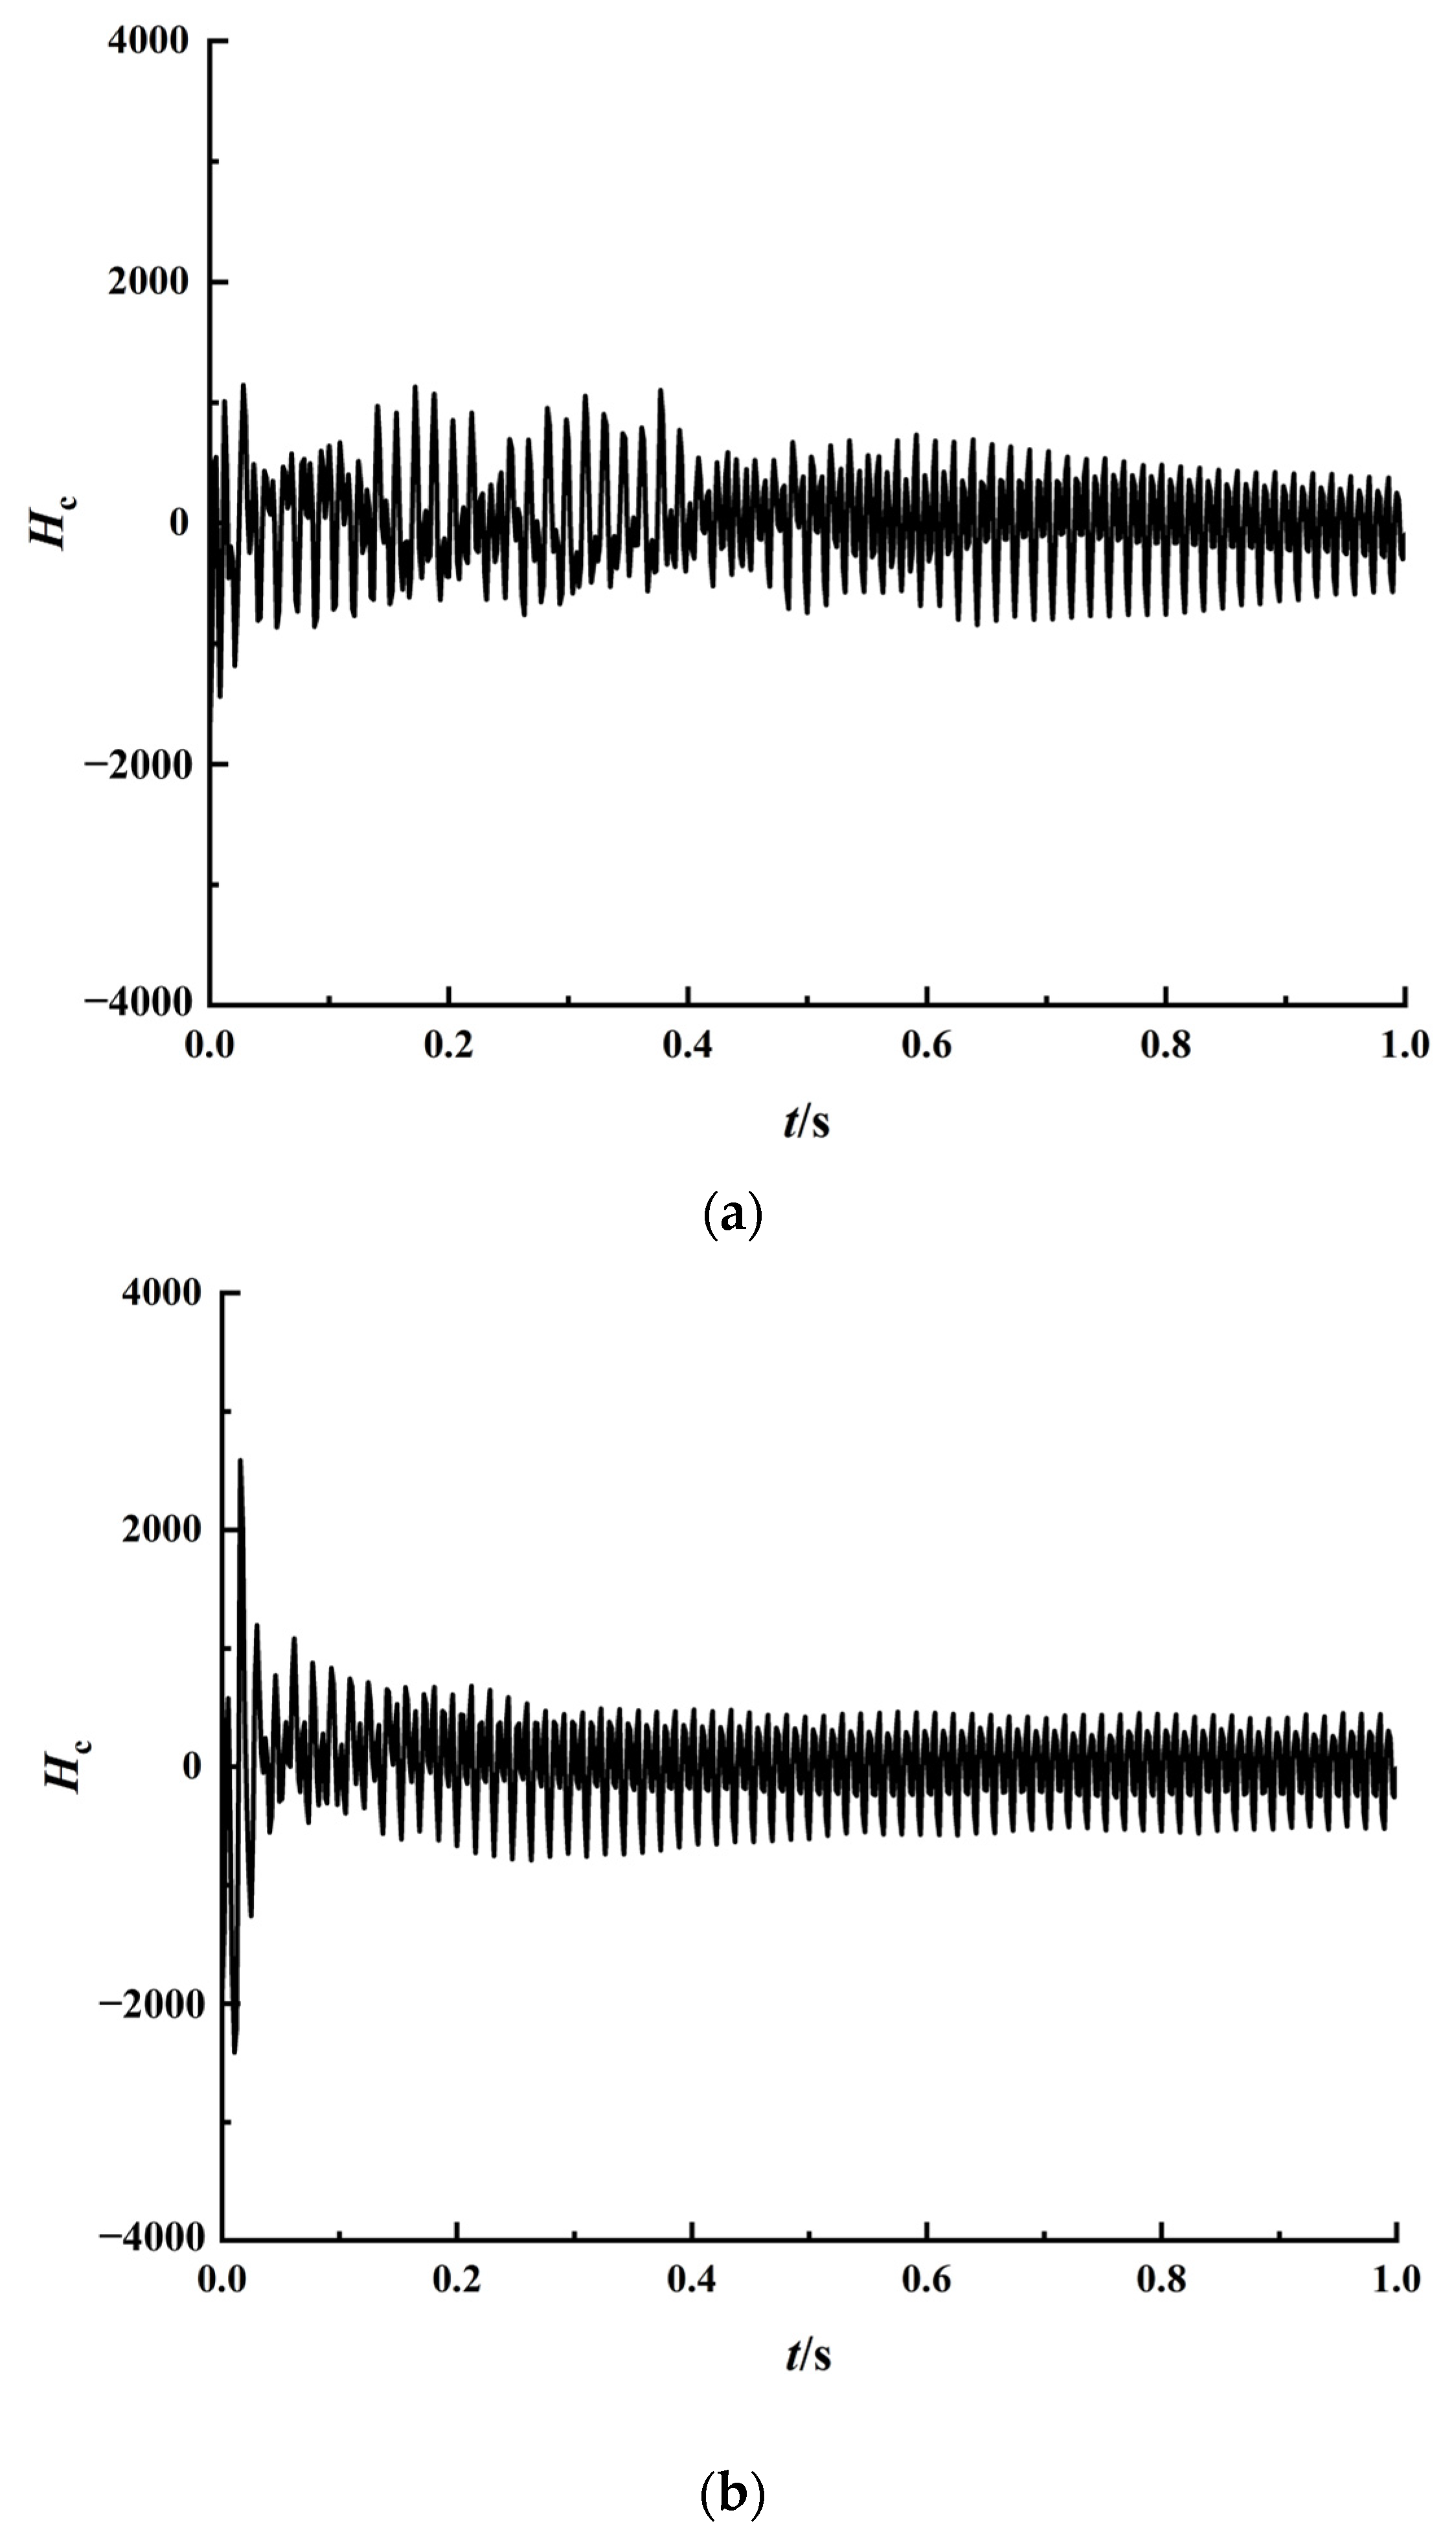
3.2.3. Time–Frequency Analysis of the Pressure Pulsation
3.3. Transient Internal Flow Characteristics Analysis during the Valve Opening Process
3.3.1. Pump Performance Analysis and Vortex Structures Evolution
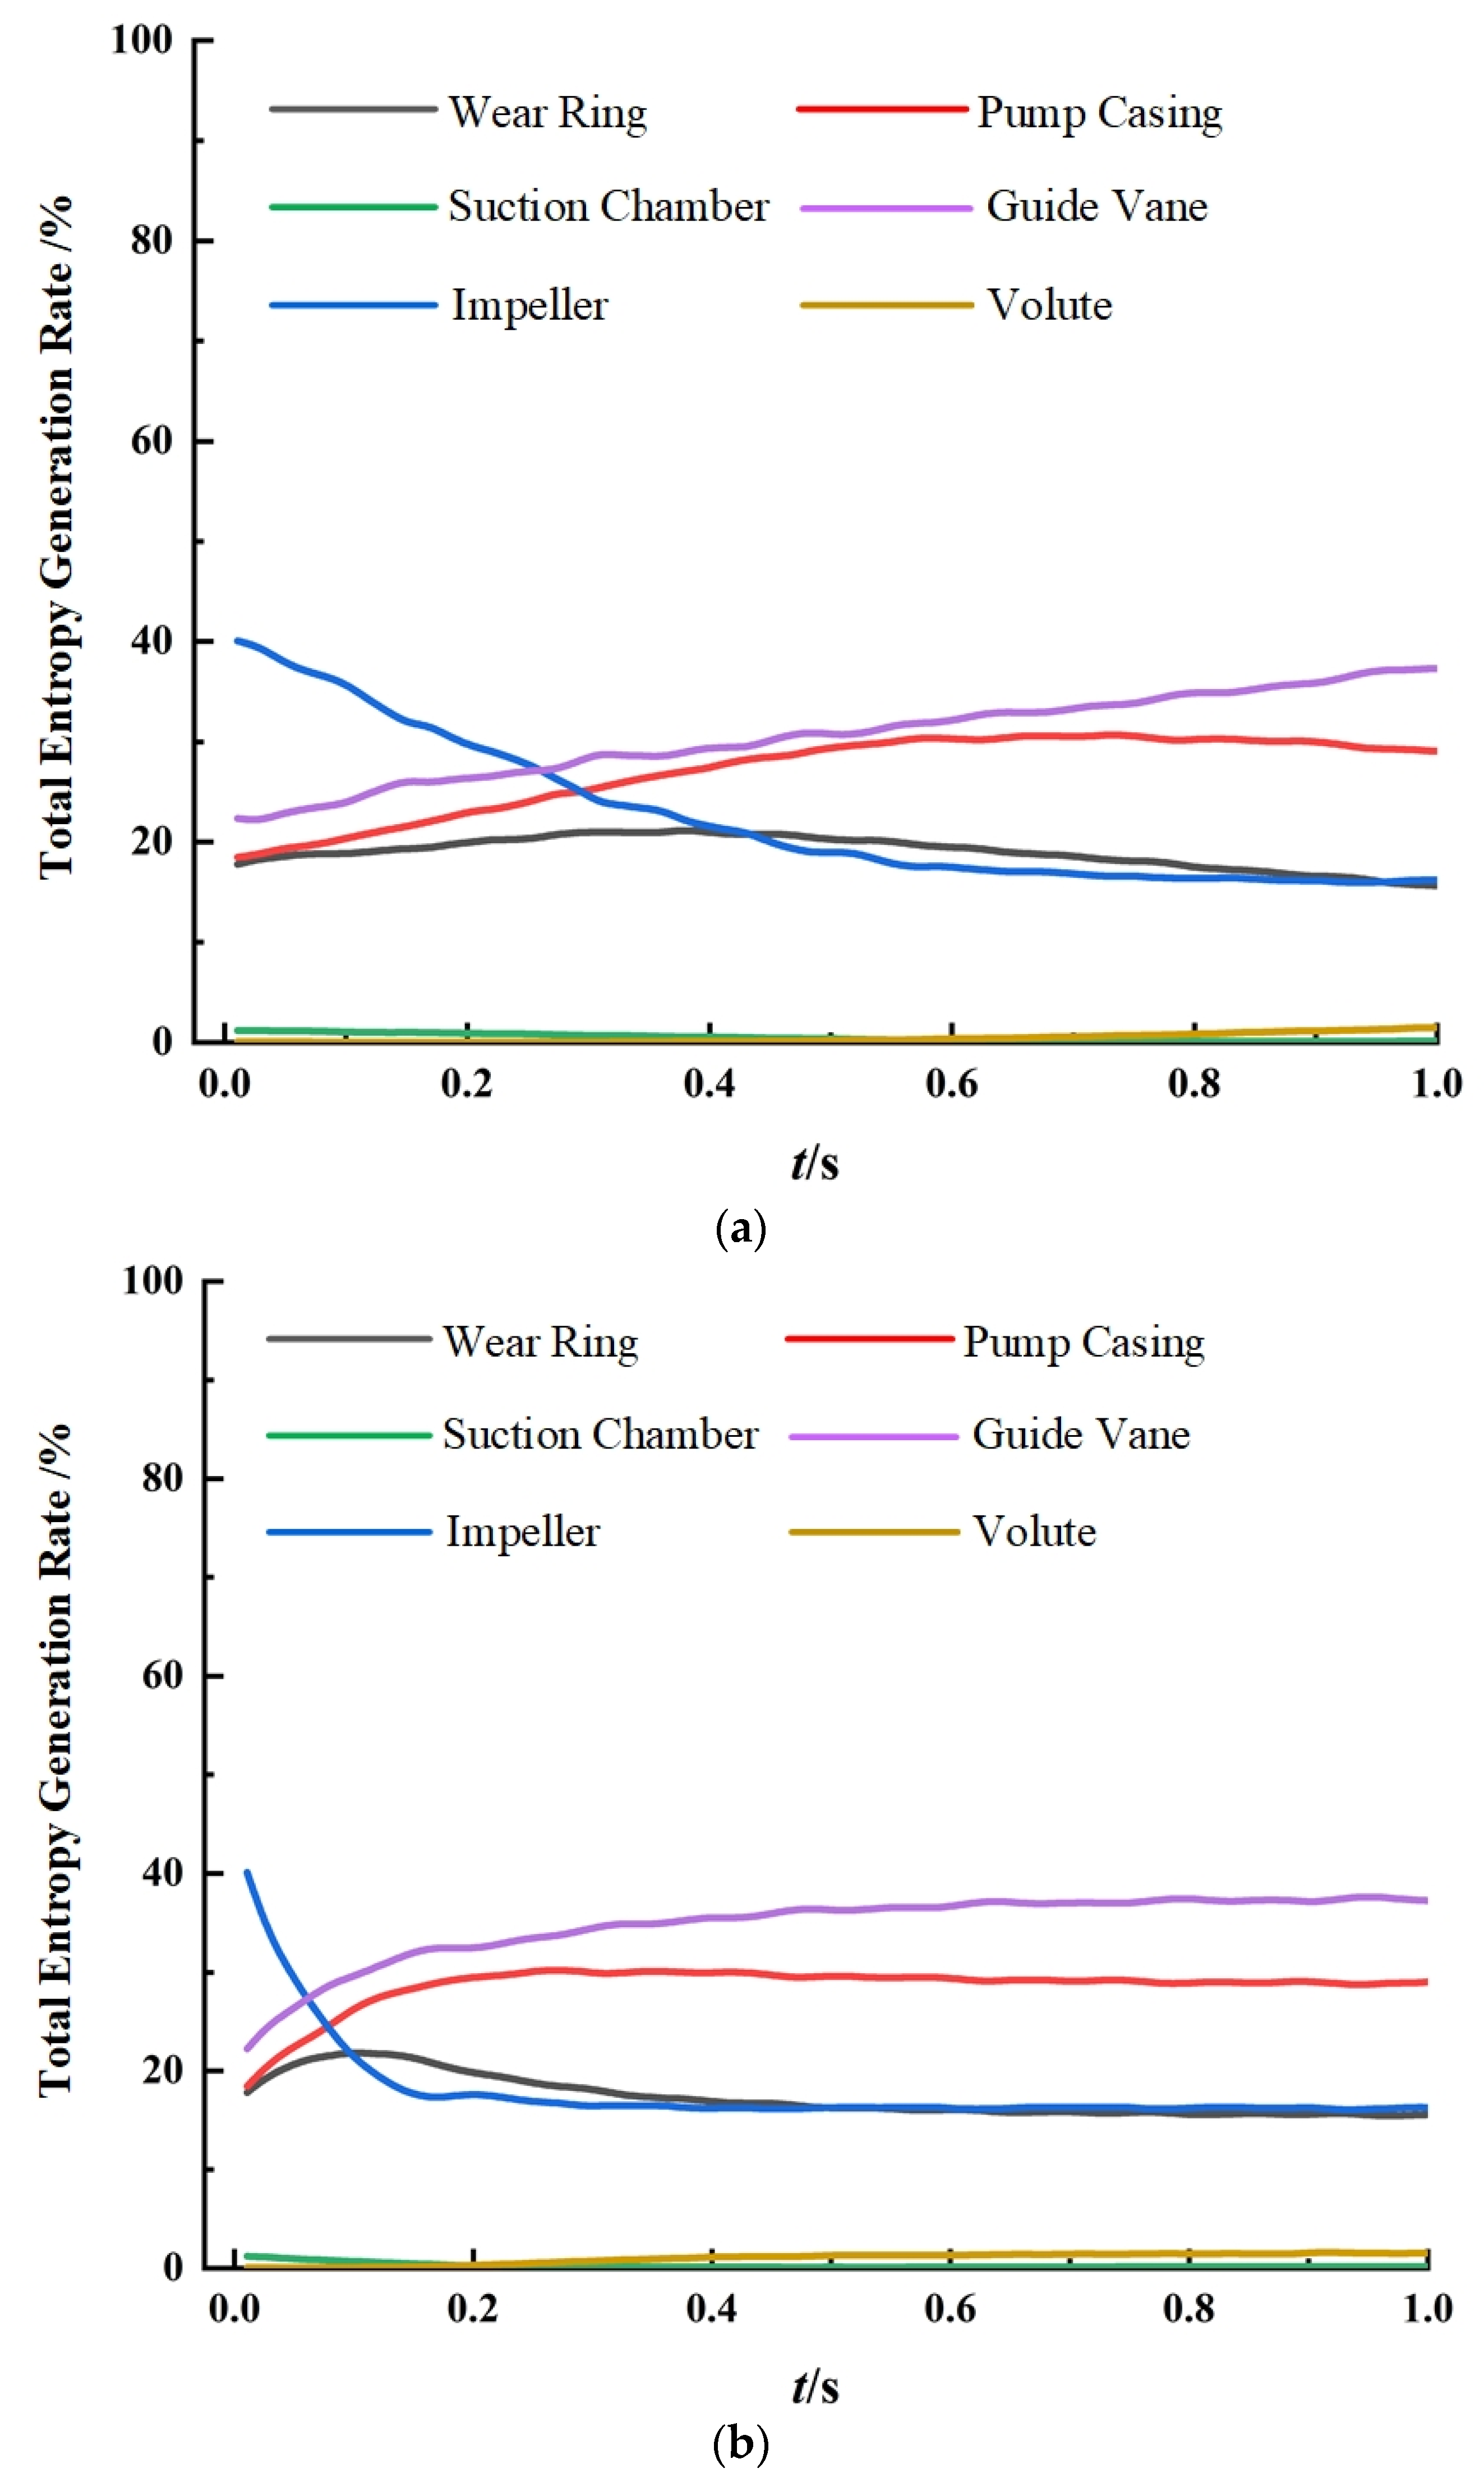
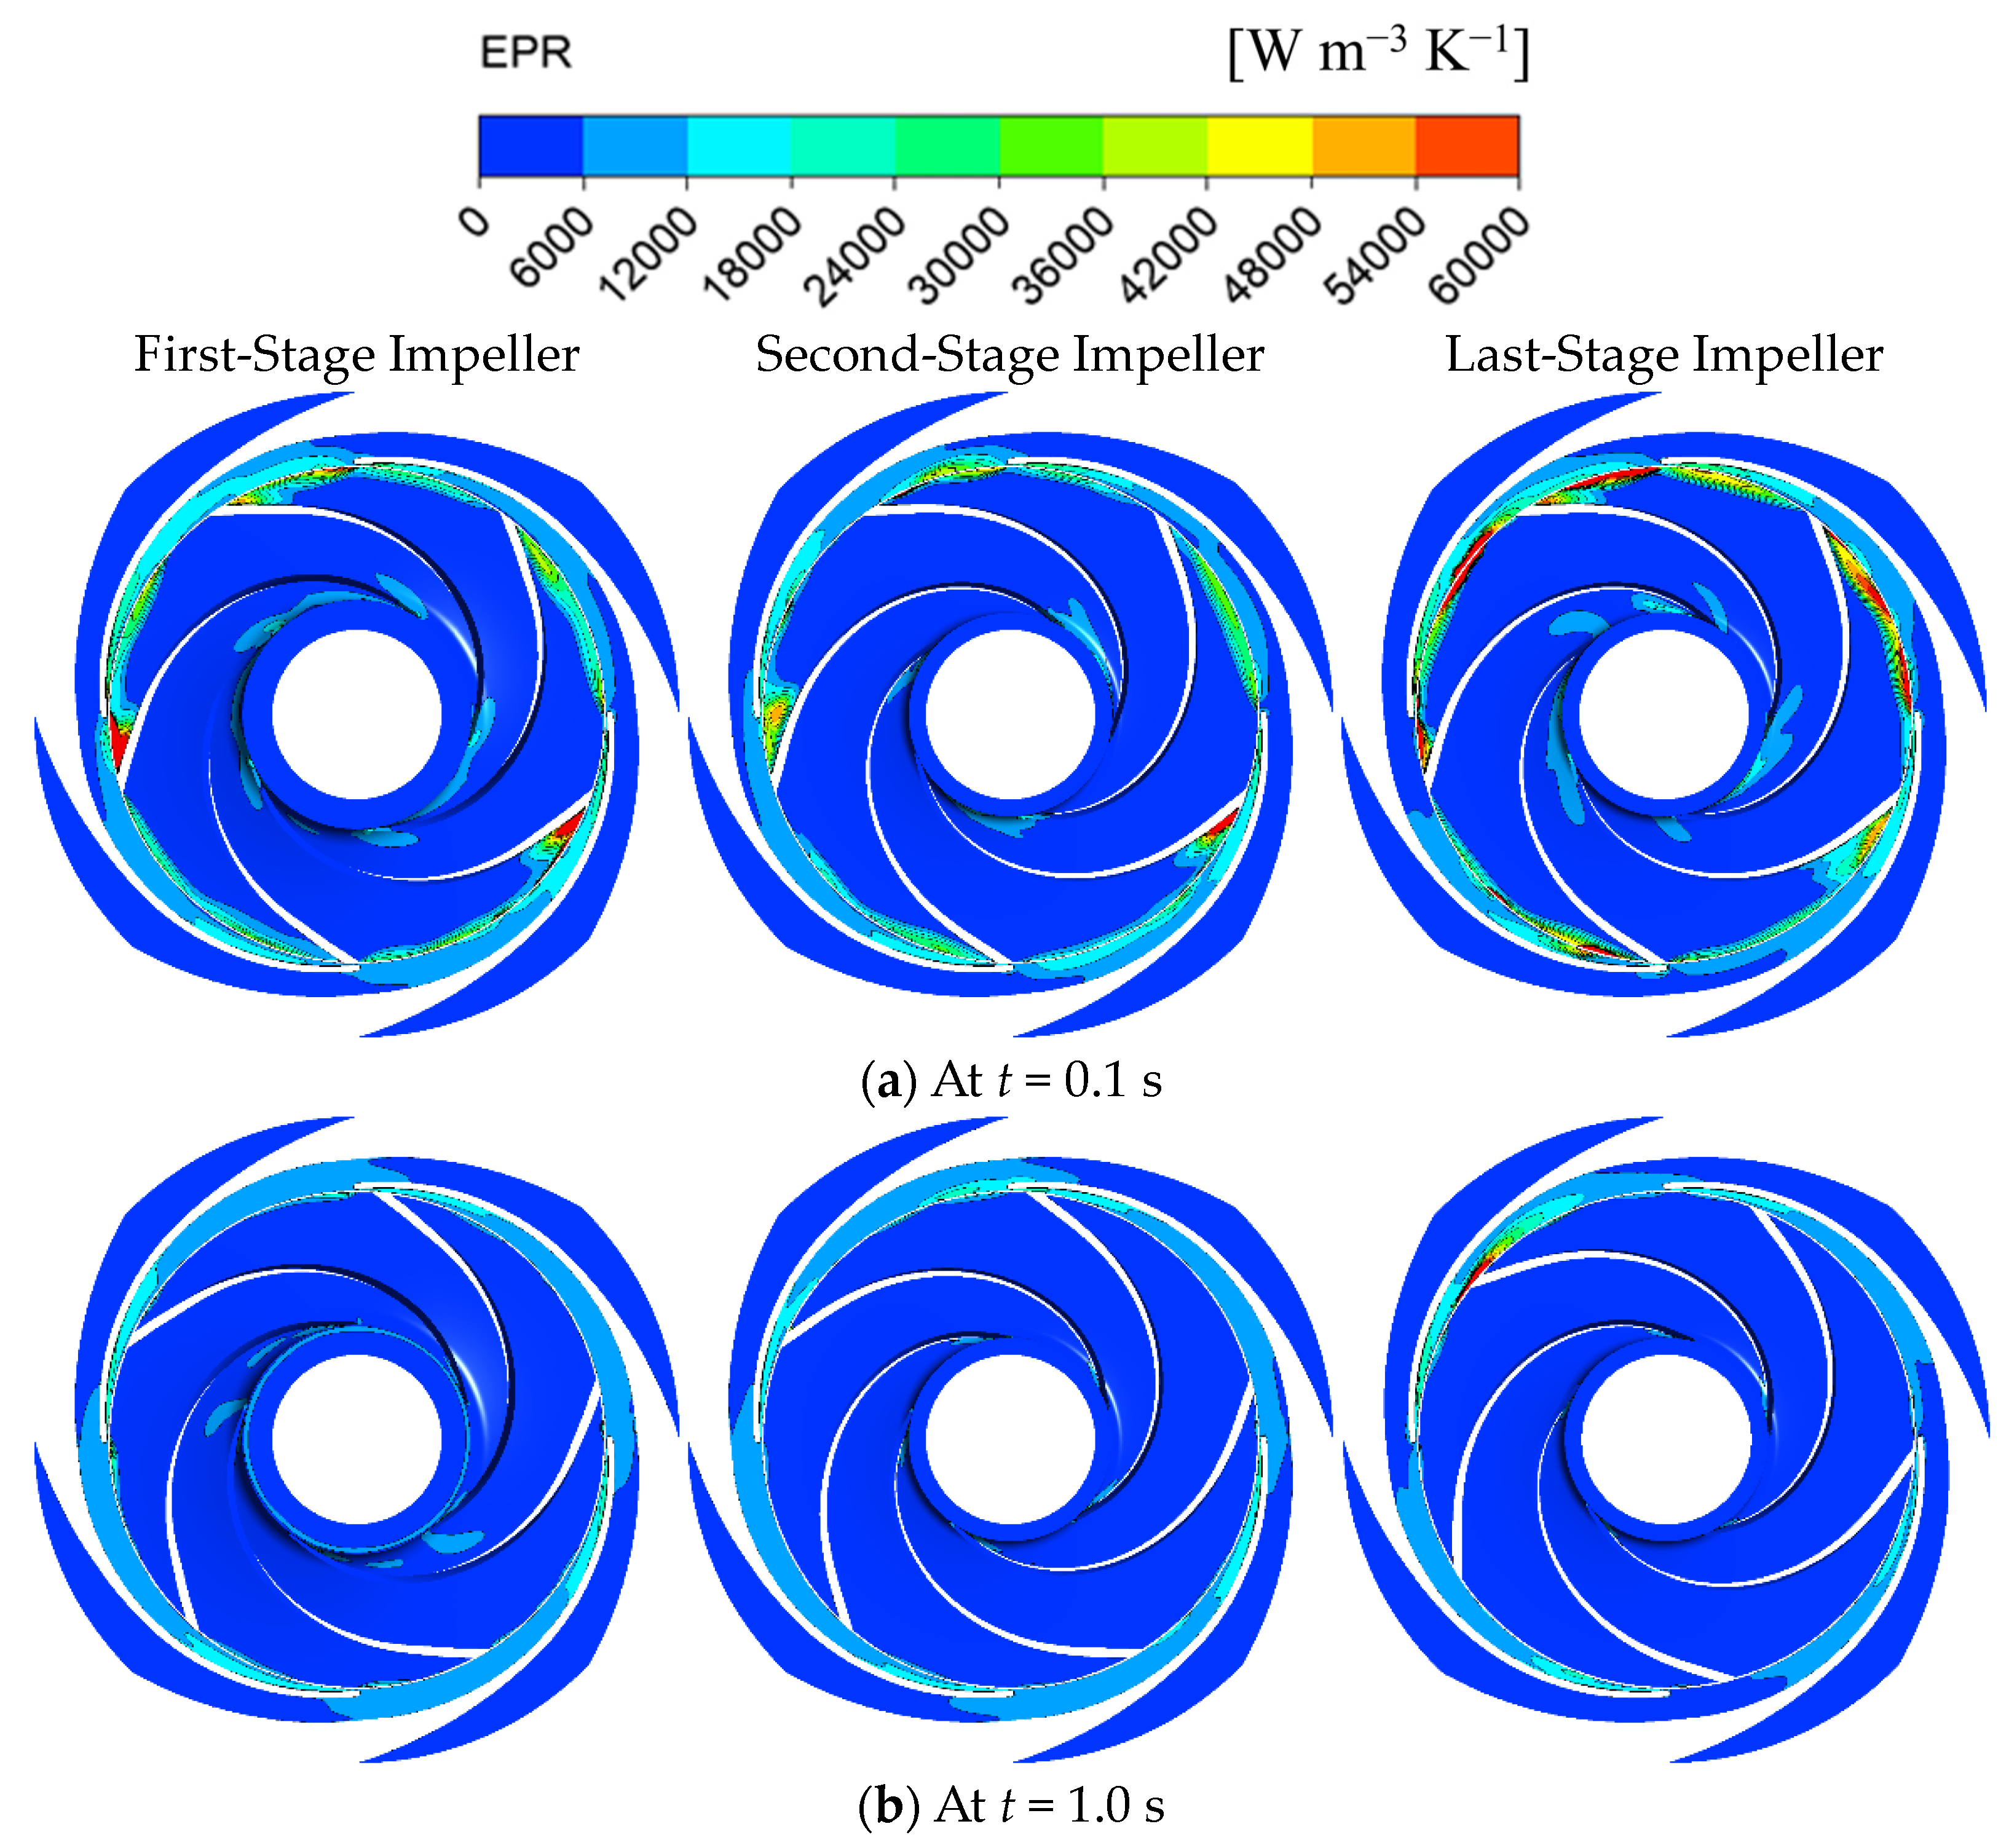
3.3.2. Entropy Production Diagnosis
3.3.3. Time–Frequency Analysis of the Pressure Pulsation
4. Conclusions
Author Contributions
Funding
Data Availability Statement
Conflicts of Interest
Nomenclature
| Head (m) | |
| Rotational speed (r/min) | |
| Pressure fluctuation coefficient | |
| Head variation rate | |
| Operational rotational speed (r/min) | |
| Current time (s) | |
| Total time (s) | |
| Head coefficient | |
| The circumferential velocity (m/s) | |
| The instantaneous pressure (Pa) | |
| Density (kg/m3) | |
| Direct dissipation entropy production (W/K) | |
| Turbulent dissipation entropy production (W/K) | |
| Wall entropy production (W/K) | |
| Total entropy production (W/K) | |
| Shaft frequency (Hz) | |
| Flow rate (m3/h) | |
| Efficiency (%) |
Abbreviations
| SST | Shear stress transport |
| GGI | General grid interface |
| VFD | Variable frequency drive |
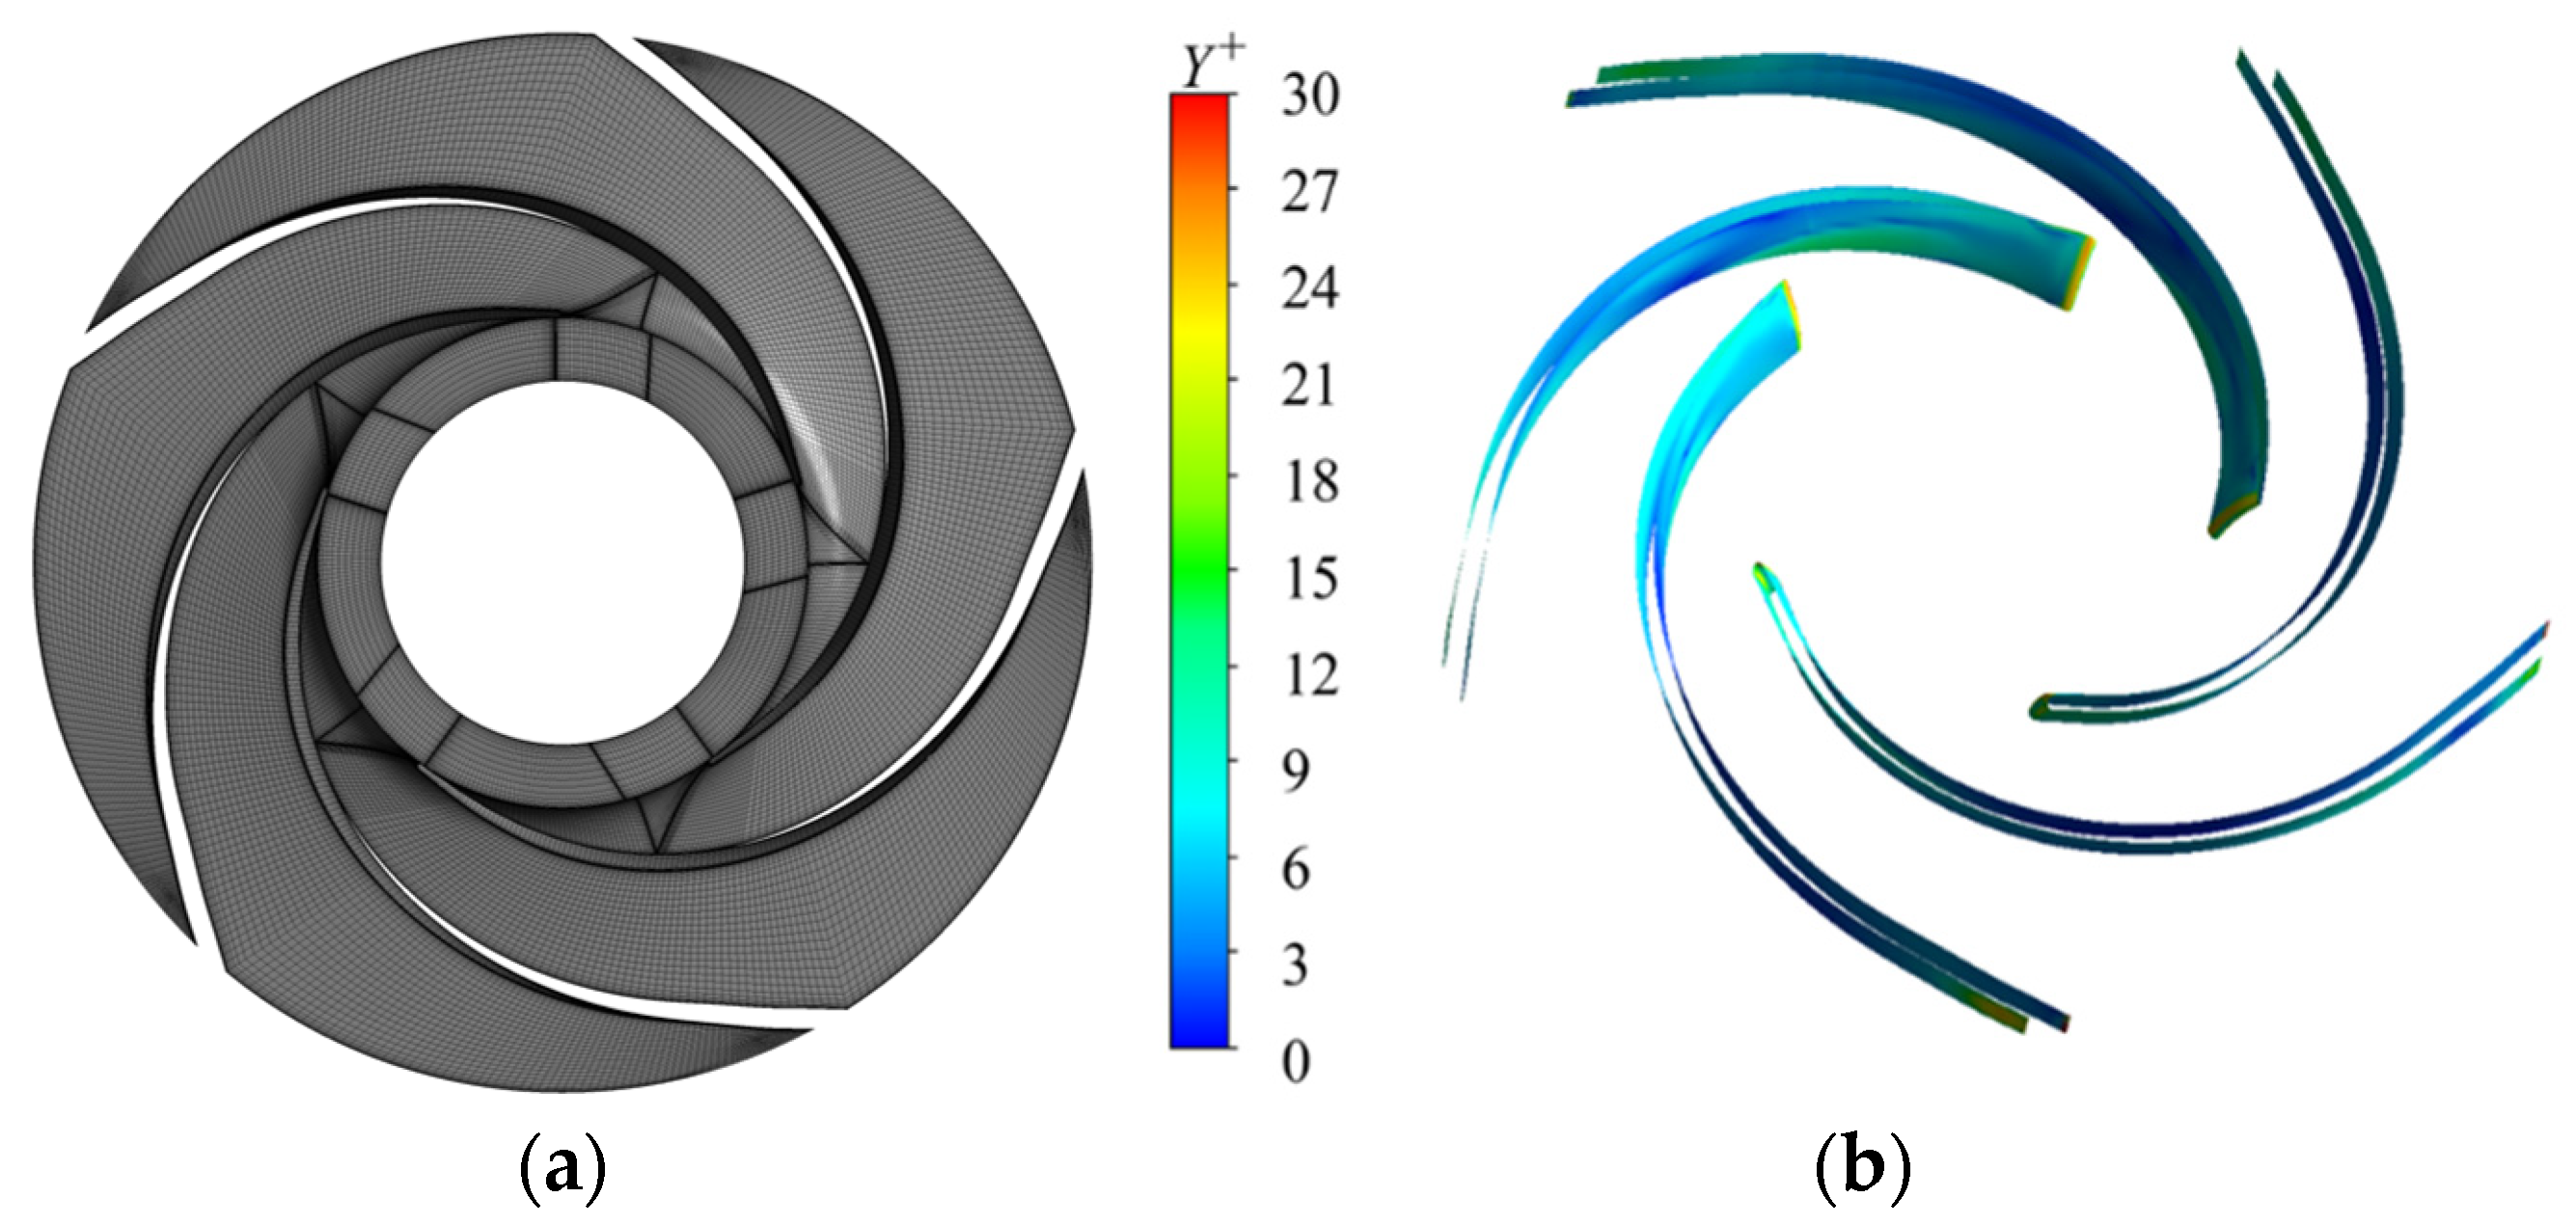
| Y+ | Dimensionless wall distance |
| SWMM | Storm water management model |
| PSO | Particle swarm optimization |
| CFD | Computational fluid dynamics |
References
- Wang, C.; He, X.; Shi, W.; Wang, X.; Wang, X.; Qiu, N. Numerical study on pressure fluctuation of a multistage centrifugal pump based on whole flow field. AIP Adv. 2019, 9, 035118. [Google Scholar] [CrossRef]
- Luna, T.; Ribau, J.; Figueiredo, D.; Alves, R. Improving energy efficiency in water supply systems with pump scheduling optimization. J. Clean. Prod. 2019, 213, 342–356. [Google Scholar] [CrossRef]
- Zhang, Y.L.; Zhu, Z.C.; Zhao, Y.J.; Wu, J.; Zhou, F.L. Comparative experiments on a self-priming pump delivering water medium during rapid and slow starting periods. Iran. J. Sci. Technol. Trans. Mech. Eng. 2021, 45, 1007–1019. [Google Scholar] [CrossRef]
- Li, Z.; Wu, D.; Wang, L.; Huang, B. Numerical simulation of the transient flow in a centrifugal pump during starting period. ASME J. Fluids Eng. 2010, 132, 081102. [Google Scholar] [CrossRef]
- Wang, H.; Lei, X.; Khu, S.-T.; Song, L. Optimization of pump start-up depth in drainage pumping station based on SWMM and PSO. Water 2019, 11, 1002. [Google Scholar] [CrossRef]
- Liu, M.; Han, Y.; Tan, L.; Lu, Y.; Ma, C.; Gou, J. Theoretical prediction model of transient performance for a mixed flow pump under fast start-up conditions. Phys. Fluids 2023, 35, 025125. [Google Scholar] [CrossRef]
- Li, W.; Huang, Y.; Ji, L.; Ma, L.; Agarwal, R.K.; Awais, M. Prediction model for energy conversion characteristics during transient processes in a mixed-flow pump. Energy 2023, 271, 127082. [Google Scholar] [CrossRef]
- Kan, K.; Zheng, Y.; Chen, H.; Cheng, J.; Gao, J.; Yang, C. Study into the improvement of dynamic stress characteristics and prototype test of an impeller blade of an axial-flow pump based on bidirectional fluid–structure interaction. Appl. Sci. 2019, 9, 3601. [Google Scholar] [CrossRef]
- Ren, Z.; Sun, M.; Zhang, J.; Wang, X.; Huang, Z.; Xu, J.; Huang, C. Start-up strategy of mixed-flow pump system with impulse operation. Ocean Eng. 2023, 277, 114058. [Google Scholar] [CrossRef]
- Fu, S.; Zheng, Y.; Kan, K.; Chen, H.; Han, X.; Liang, X.; Liu, H.; Tian, X. Numerical simulation and experimental study of transient characteristics in an axial flow pump during start-up. Renew. Energy 2020, 146, 1879–1887. [Google Scholar] [CrossRef]
- Kan, K.; Xu, Z.; Chen, H.; Xu, H.; Zheng, Y.; Zhou, D.; Muhirwa, A.; Maxime, B. Energy loss mechanisms of transition from pump mode to turbine mode of an axial-flow pump under bidirectional conditions. Energy 2022, 257, 124630. [Google Scholar] [CrossRef]
- Yang, Z.; Cheng, Y.; Xia, L.; Meng, W.; Liu, K.; Zhang, X. Evolutions of flow patterns and pressure fluctuations in a prototype pump-turbine during the runaway transient process after pump-trip. Renew. Energy 2020, 152, 1149–1159. [Google Scholar] [CrossRef]
- Yun, L.; Bin, L.; Jie, F.; Rongsheng, Z.; Qiang, F. Research on the transient hydraulic characteristics of multistage centrifugal pump during start-up process. Front. Energy Res. 2020, 8, 76. [Google Scholar] [CrossRef]
- Lu, Y.; Tan, L.; Han, Y.; Liu, M. Cavitation-vibration correlation of a mixed flow pump under steady state and fast start-up conditions by experiment. Ocean Eng. 2022, 251, 111158. [Google Scholar] [CrossRef]
- Zhu, G.; Xuan, Y.; Feng, J.; Tang, Z.; Li, Y.; Wang, L. Influence of start-up modes on the noise characteristics of mixed-flow pump during start-up process. Mech. Syst. Signal Process. 2024, 214, 111388. [Google Scholar] [CrossRef]
- Tang, Z.; Zhu, G.; Feng, J.; Wu, Y.; Liu, K.; Lu, Q. Influence of pump start-up mode on the stability of mixed-flow pumps. J. Mech. Sci. Technol. 2023, 37, 2949–2958. [Google Scholar] [CrossRef]
- Li, H.; Bai, C.; Wang, J. Experiments and numerical analysis of the dynamic flow characteristics of a pump−pipeline system with entrapped air during start-up. Eng. Appl. Comput. Fluid Mech. 2023, 17, 2238853. [Google Scholar] [CrossRef]
- Abdulkhaev, Z.E.; Abdurazaqov, A.M.; Sattorov, A.M. Calculation of the transition processes in the pressurized water pipes at the start of the pump unit. JournalNX 2021, 7, 285–291. [Google Scholar]
- Devolder, B.; Troch, P.; Rauwoens, P. Performance of a buoyancy-modified k-ω and k-ω SST turbulence model for simulating wave breaking under regular waves using OpenFOAM®. Coast. Eng. 2018, 138, 49–65. [Google Scholar] [CrossRef]
- Wang, C.; Sun, M.; Yang, Y.; Wang, H.; Liu, X.; Xiong, D.; Wang, Y. Improved SST turbulence model for supersonic flows with APG/separation. Comput. Fluids 2024, 274, 106237. [Google Scholar] [CrossRef]
- Iovănel, R.G.; Dunca, G.; Cervantes, M.J. Study on the accuracy of RANS modelling of the turbulent flow developed in a kaplan turbine operated at BEP. Part 2—Pressure fluctuations. J. Appl. Fluid Mech. 2019, 12, 1463–1473. [Google Scholar] [CrossRef]
- Smirnov, P.E.; Menter, F.R. Sensitization of the SST Turbulence Model to Rotation and Curvature by Applying the Spalart–Shur Correction Term. J. Turbomach. 2009, 131, 041010. [Google Scholar] [CrossRef]
- Huang, X.; Yang, W.; Li, Y.; Qiu, B.; Guo, Q.; Zhuqing, L. Review on the sensitization of turbulence models to rotation/curvature and the application to rotating machinery. Appl. Math. Comput. 2018, 341, 46–69. [Google Scholar] [CrossRef]
- Liu, C.; Gao, Y.-S.; Dong, X.-R.; Wang, Y.-Q.; Liu, J.-M.; Zhang, Y.-N.; Cai, X.-S.; Gui, N. Third generation of vortex identification methods: Omega and Liutex/Rortex based systems. J. Hydrodyn. 2019, 31, 205–223. [Google Scholar] [CrossRef]
- Liu, C.; Wang, Y.; Yang, Y.; Duan, Z. New omega vortex identification method. Sci. China Phys. Mech. Astron. 2016, 59, 1–9. [Google Scholar] [CrossRef]
- Zhou, L.; Hang, J.; Bai, L.; Krzemianowski, Z.; El-Emam, M.A.; Yasser, E.; Agarwal, R. Application of entropy production theory for energy losses and other investigation in pumps and turbines: A review. Appl. Energy 2022, 318, 119211. [Google Scholar] [CrossRef]
- Kock, F.; Herwig, H. Local entropy production in turbulent shear flows: A high-Reynolds number model with wall functions. Int. J. Heat Mass Transf. 2004, 47, 2205–2215. [Google Scholar] [CrossRef]
- DIN EN ISO 9906; Rotodynamic Pumps—Hydraulic Performance Acceptance Tests—Grades 1, 2 and 3 (ISO 9906: 2012). German Version EN ISO. Afnor Publishing: Saint-Denis, France, 2012.
- Lilly, J.M.; Olhede, S.C. Generalized morse wavelets as a superfamily of analytic wavelets. IEEE Trans. Signal Process. 2012, 60, 6036–6041. [Google Scholar] [CrossRef]


| Parameter | Value |
|---|---|
| Rotational speed, | 3800 r/min |
| Flow rate, | 36.0 m3/h |
| Single-stage head, | 107.1 m |
| Specific speed, | 41.6 |
| Number of impeller blades, | 5 |
| Number of guide vane blades, | 4 |
| Pump inlet diameter, | 80 mm |
| Pump outlet diameter, | 65 mm |
| Number | The Number of Mesh/Million | Head/m | Relative Error/% |
|---|---|---|---|
| 1 | 1.273 × 10⁷ | 337.25 | - |
| 2 | 1.342 × 10⁷ | 340.61 | 1 |
| 3 | 1.420 × 10⁷ | 342.79 | 0.64 |
| 4 | 1.487 × 10⁷ | 342.87 | 0.02 |
| 5 | 1.549 × 10⁷ | 342.92 | 0.015 |
Disclaimer/Publisher’s Note: The statements, opinions and data contained in all publications are solely those of the individual author(s) and contributor(s) and not of MDPI and/or the editor(s). MDPI and/or the editor(s) disclaim responsibility for any injury to people or property resulting from any ideas, methods, instructions or products referred to in the content. |
© 2024 by the authors. Licensee MDPI, Basel, Switzerland. This article is an open access article distributed under the terms and conditions of the Creative Commons Attribution (CC BY) license (https://creativecommons.org/licenses/by/4.0/).
Share and Cite
Chen, C.; Xu, H.; Deng, F.; Wu, K.; Zhang, Z.; Si, Q. Study on the Transient Flow Characteristics of Multistage Centrifugal Pumps during the Startup Process before System Operation. Water 2024, 16, 1876. https://doi.org/10.3390/w16131876
Chen C, Xu H, Deng F, Wu K, Zhang Z, Si Q. Study on the Transient Flow Characteristics of Multistage Centrifugal Pumps during the Startup Process before System Operation. Water. 2024; 16(13):1876. https://doi.org/10.3390/w16131876
Chicago/Turabian StyleChen, Chao, Hu Xu, Fanjie Deng, Kaipeng Wu, Zhen Zhang, and Qiaorui Si. 2024. "Study on the Transient Flow Characteristics of Multistage Centrifugal Pumps during the Startup Process before System Operation" Water 16, no. 13: 1876. https://doi.org/10.3390/w16131876
APA StyleChen, C., Xu, H., Deng, F., Wu, K., Zhang, Z., & Si, Q. (2024). Study on the Transient Flow Characteristics of Multistage Centrifugal Pumps during the Startup Process before System Operation. Water, 16(13), 1876. https://doi.org/10.3390/w16131876