Article

Extension Mechanism of Water-Conducting Cracks in the Thick and Hard Overlying Strata of Coal Mining Face

1
Shanxi Yanchang Petroleum and Mining Co., Ltd., Yulin 710054, China
2
College of Energy Engineering, Xi’an University of Science and Technology, Xi’an 710054, China
*
Author to whom correspondence should be addressed.
Water 2024, 16(13), 1883; https://doi.org/10.3390/w16131883
Submission received: 28 May 2024 / Revised: 25 June 2024 / Accepted: 26 June 2024 / Published: 1 July 2024

Abstract

:
It is of great significance for coal safety production and water resource protection in the Yuheng mining area to master the evolution law of water-conducting fractures under the condition of thick and hard overburden. This research focuses on the 2102 fully mechanized mining face in the Balasu Coal Mine as the research background. The fracture evolution and strata movement characteristics in thick and hard overlying strata are simulated and analyzed by combining numerical simulation with physical simulation, and the formation mechanism of a water-conducting fracture in the overlying strata is revealed and verified by field measurements of the development height of “two zones”. The results show that the anisotropy of fracture propagation in low-position overlying strata is high, and the fracture propagation in high-position overlying strata is mainly vertical, which indicates characteristics of leapfrog development. The number and development height of fractures undergo the change–growth process of “slow–rapid–uniform”. Multiple rock strata together form a complex force chain network with multiple strong chain arches. The local stress concentration leads to the initiation of micro-cracks in contact fractures, and the cracks gradually penetrate from bottom to top and then the strong chain arches are broken. The water-conducting cracks in overlying strata show a dynamic expansion process of “local micro-cracks–jumping cracks–through cracks–water-conducting cracks”. The fracture between the caving zone and fracture zone presents obvious layered characteristics, the overall shape of the water-conducting fracture zone is “saddle-shaped”, and the maximum development height lags behind the coal mining face by about 180 m. Through the observation of water injection leakage and borehole TV observation of three boreholes under underground construction, combined with the results of water pressure tests, it is comprehensively determined that the height of the water-conducting fracture zone is 103.68~107.58, and the fracture–production ratio is 31.42~32.60, which is basically consistent with the results of numerical simulation and physical simulation. This research provides theoretical guidance and a scientific basis for coal mine water disaster prevention under similar geological conditions.

1. Introduction

Mine water hazards, as one of the most dangerous disasters in coal mining, not only threaten the safety of miners but can also lead to severe economic losses and environmental damage [1,2]. Despite extensive research into the mechanisms and control technologies for mine water hazards over the past decades, the diversity and complexity of geological conditions, especially in regions like the Yuheng mining area in China, still pose significant challenges to water hazard prevention. The coal mining areas in Western China, particularly the Yuheng mining area, are critically important for the study of mine water hazards due to their complex hydrogeological characteristics and frequent human activities. In these areas, water hazards are influenced not only by natural geological factors but also by the mining methods, progress, and waterproofing measures employed within the mines. Current research and practice indicate that traditional methods for controlling water hazards are often ineffective under these complex conditions; hence, it is imperative to conduct more in-depth research to uncover the underlying causes and mechanisms of mine water hazards, particularly the evolution of water-conducting fractures in the overburden affected by mining activities. Understanding these fundamental scientific issues can provide a theoretical and technical basis for devising more effective prevention measures and response strategies, which are crucial for ensuring the safe production and sustainable development of mining areas [3].
Under the conditions of hard roof mining in a thick coal seam, a coal seam mining crack is the main channel of water inrush in a coal mining face. Engineering practice and research have shown that after mining, the overburden can be divided into caving zones, fracture zones, and bending subsidence zones, where the caving and fracture zones together form the water-conducting channels in the mining area [4,5,6]. Many scholars have studied the development characteristics and height calculation methods of water-conducting fracture zones in thick weakly cemented overburden. Y. Chen and S. Zhu [7] conducted specific studies on the “two soft and one hard” coal seams, determining the heights of the “two zones” in the overburden under these conditions. B. Hebblewhite [8] established a primary predictive model for the impact of rock layer displacement and fracturing on groundwater above longwall faces in the southern coalfields of New South Wales. Q. Ye et al. [9] experimentally determined the fracture evolution patterns in overburden under mining conditions. G. Wang et al. [10] studied the height of fracture zones in the overburden under mining conditions through physical simulation experiments. Xu et al. [11] used hierarchical analysis and fuzzy comprehensive evaluation methods to assess and zone the water resource carrying capacity in the Yushen mining area. Liu et al. [12], based on 203 borehole data from the Yushenfu mining area, developed a zoning method for the impact of mining on groundwater resources, categorizing the impact levels as severe, moderate, minor, and no leakage. Singh [13] and Coe [14] highlighted the importance of aquiclude rock groups located between water bodies and mined-out areas, concluding the impact of longwall mining on overlying strata. Booth [15] noted that changes in hydraulic parameters after mining primarily depend on the stratigraphic relationship between the rock layers and the mined-out areas. The complexity of these hydraulic changes is a significant factor in causing connectivity between aquifers and mined-out areas. In other research aspects of working face mining under the conditions of a hard roof in a thick coal seam, Jia [16] studied the stress distribution of an irregular island working face affected by a hard roof in a thick coal seam and the pressure relief control of surrounding rock in a roadway. Zhang [17] optimized the mixed materials and analyzed the mechanical failure of the filling materials effectively controlled by mining in his working face. Huang [18] analyzed the fracture instability characteristics and fracture mechanism of overlying strata in a large mining height section.
This paper takes the 2102 working face of the Balasu Coal Mine in the Yuheng mining area as the background, applying an integrated method of numerical and physical simulation to analyze the characteristics and expansion patterns of overburden fractures. It reveals the mechanisms of water-conducting fracture channels formed under the force chain action induced by mining activities. This study’s accuracy is validated through field measurements, aiming to provide a basis for safe coal mining and water resource protection in the Yuheng mining area.

2. Engineering Background

2.1. General Siruation of Work Face

The aforementioned studies provide substantial theoretical and technical guidance for addressing the intertwined challenges of coal mining and water resource protection in the Yuheng mining area. However, research has primarily focused on the morphology, height evolution, and sensitivity of controlling factors of water-conducting fractures, with minimal exploration into the mechanisms of overburden fracture expansion and the cross-scale formation processes of water-conducting fractures. Therefore, this paper uses the Balasu Coal Mine’s 2102 coal mining face in the Yuheng mining area as a case study, where the coal seam thickness is 3.64 m. During this process, both numerical and physical simulation methods were employed to analyze the patterns of fracture expansion in thick, hard overburden and the formation mechanisms of water-conducting fracture channels under mining influences, verified by field measurements to provide a foundation for safe coal mining and water resource protection in the Yuheng mining area.

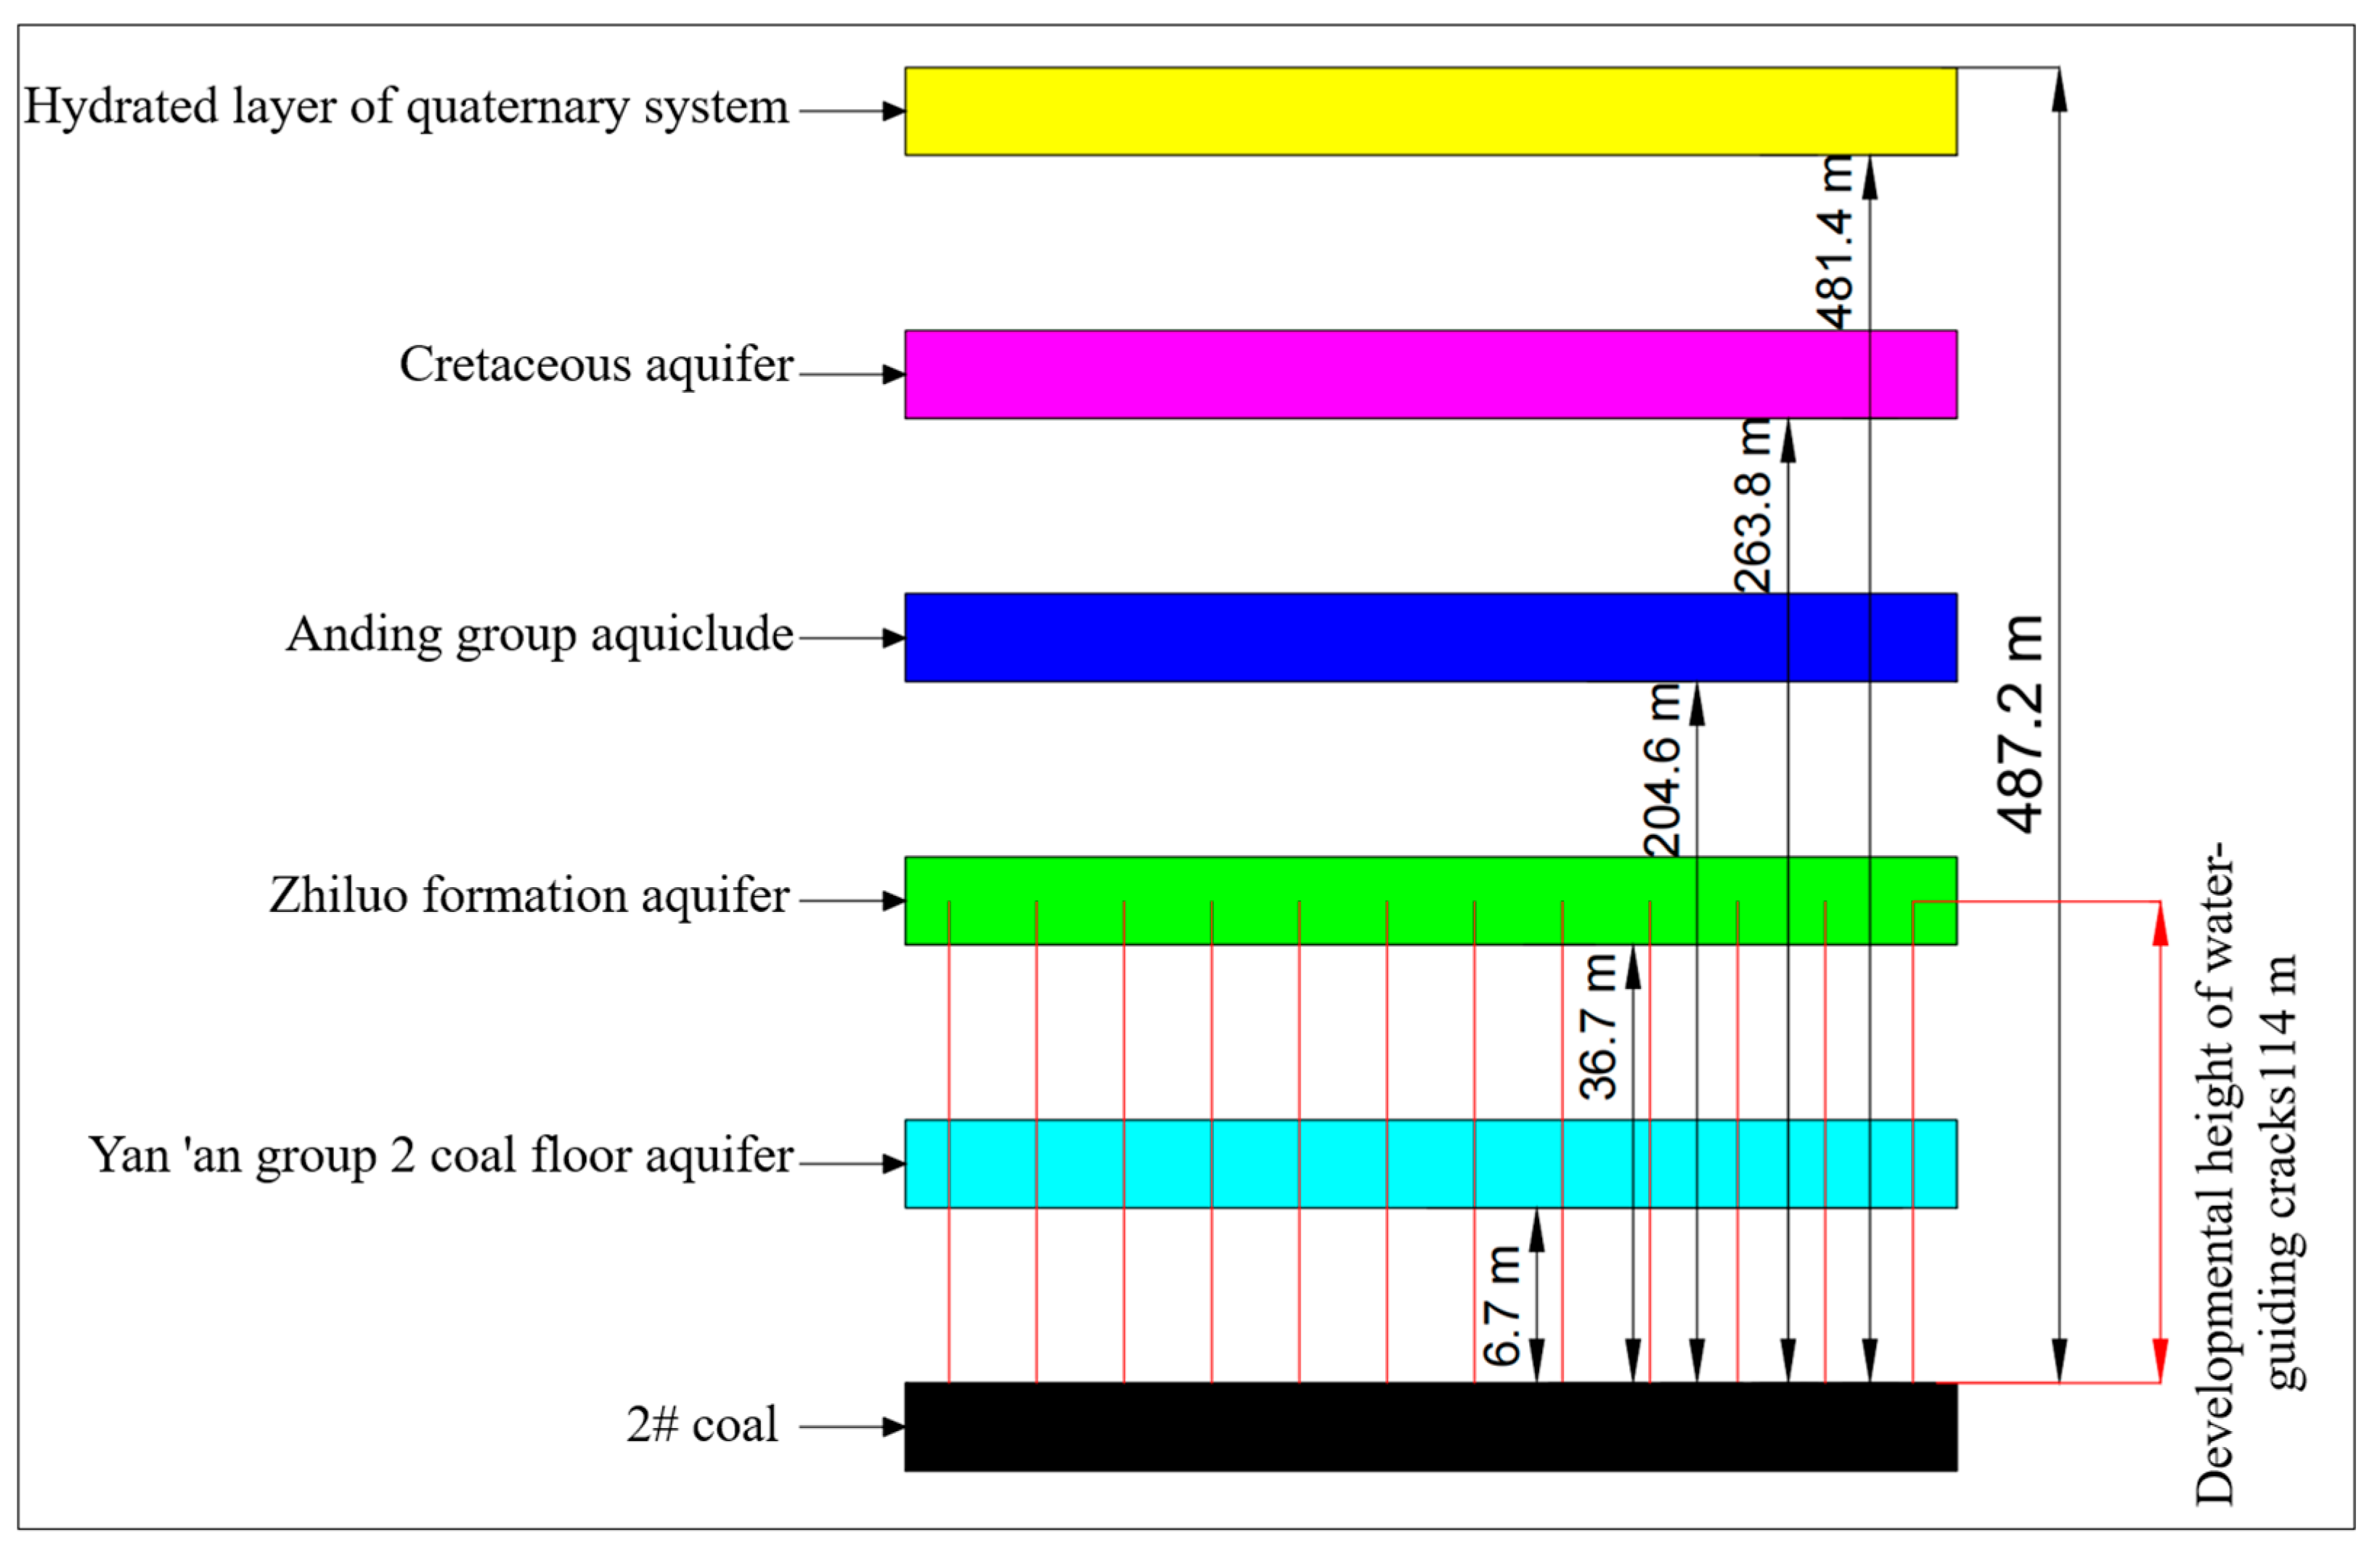
2.2. Mine Waterfiling Factors

According to the geological and hydrogeological data, the Balasu Coal Mine features a complex hydrogeological type. The aquifers in the mine, from top to bottom, are as follows: Quaternary unconsolidated rock pore and fracture aquifers, Cretaceous Luohe Formation sandstone pore and fracture aquifers, Jurassic Zhiruo Group, and Yan’an Formation clastic rock fracture-confined aquifers, as shown in Figure 1. The Quaternary and Cretaceous aquifers, which indirectly recharge the aquifer above Coal Seam No. 2, have a minor impact on coal mining. The Jurassic Zhiruo Group fracture-confined aquifers and the Yan’an Formation sandstone fracture aquifers, which directly recharge the aquifer above Coal Seam No. 2, allow groundwater to flow into the mine along the water-conducting fracture zone. These aquifers have weak water richness and low recharge intensity. When aquifers with moderate or higher water richness or other water bodies pose a threat to the coal seam roof, it is essential to measure the development height of the collapse zone and the water-conducting fracture zone. This research focuses on the development height and characteristics of the mining-induced water-conducting fracture zone in Coal Seam No. 2 of the Balasu Coal Mine.
Considering the geological conditions of the Balasu Coal Mine, the main source of water flooding the mine’s deposits is groundwater. The principal aquifers in the area are the Cretaceous Luohe sandstone pore and fracture water and the Quaternary Sarawusu Formation pore aquifers, which are widely distributed throughout the mine with substantial thickness and medium-to-strong water richness. Both the main and auxiliary shafts must penetrate these layers during development, posing the most significant water hazard during the construction of the Balasu Coal Mine. Seam No. 2 is the first coal seam to be mined in the various mines of the Yuheng North area, and its aquifer represents the unique hydrogeological conditions of the Yuheng North area. From what has been revealed in surrounding mines, both the Xiaojihan and Yuan Datian mines experienced sudden water inrushes when Seam No. 2 was exposed. Currently, these two mines still experience considerable water inflow during the advancement through Coal Seam No. 2, with the primary source of mine water inflow being from the coal seam during the driving phase, while the water output from the sandstone roof during the retreat mining phase is relatively smaller. According to hydrological survey results, the aquifers in the Yan’an Formation above Coal Seam No. 2 predominantly consist of fine to medium-grained feldspathic sandstone, which is often calcite cemented and dense, with underdeveloped fractures and poor permeability. The water table depth ranges from 22.91 to 31.28 m, with water table elevations between +1153.96 and +1184.95 m, borehole water inflow rates of 49.85 to 68.59 m3/day, specific inflow rates of 0.0091 to 0.0094 L/s·m, and permeability coefficients of 0.043 to 0.062 m/day. The aquifer has weak water richness; its hydrochemical type is predominantly SO4-Na, with pH values ranging from 8.38 to 8.88, indicating poor water quality. Consequently, the Balasu Coal Mine faces significant water hazard issues associated with highly water-rich aquifers during the exposure of Coal Seam No. 2 and the advancement of mine tunnels.

3. Evolution and Expansion Mechanism of Water-Conducting Fracture in Thick and Hard Overburden Rock

During the mining-induced instability and fracturing process, the overburden exhibits typical characteristics of discontinuous failure. The PFC2D particle flow discrete element software effectively overcomes the continuity assumptions of traditional continuous media, simulating the mechanical problems of discontinuous media accurately. It captures the discontinuous phenomena such as cracking, fracturing, and breaking of the coal rock mass, describing the dynamic evolution of microcrack generation, extension, and expansion during rock mass failure from a micro-viewpoint [19,20].

3.1. Numerical Modeling

In the PFC model, particle motion follows Newton’s second law, with interparticle forces transmitted via contact. The fundamental contact models are divided into the bonded contact model and the parallel bond model, the latter referred to here as the PB Model, which uses line contacts to transmit both forces and moments, making it particularly suitable for the mechanical analysis of rock-like materials [21,22]. The propagation of microcracks easily leads to the generation of acoustic emission/microseismic energy, and cracks penetrate and then form water channels [23,24]. As shown in Figure 2, in PFC, cracks form when the relative movement of particles alters the stress environment of the bonds, leading to fracture when the tensile and shear stresses exceed the normal and tangential bond strengths, resulting in tensile and shear cracks between particles. Before generating the model, it is necessary to scientifically convert the micro-parameters of particles and bonds to align with the real macroscopic mechanical parameters of the rock. The micro-parameters needed for calibrating the PB Model include contact modulus E*, stiffness ratio K*, normal cohesive strength c, tangential cohesive strength t, angle of internal friction φ, and friction coefficient μ. As the PB Model degrades to a linear model after bond failure, the model’s micro-parameters are simplified under the assumptions that: (1) the linear contact modulus between particles equals the parallel bond modulus; and (2) the ratio of tangential to normal stiffness between particles matches that of the parallel bonds. The micro-parameters for the PB Model are determined by trial and error, and calibration is considered successful if the deviation between the calculated rock stress–strain curve and laboratory values is within 5% [25,26,27,28,29]. The calibrated micro-parameters of the PB Model are listed in Table 1.
For the geological conditions of Balasu Coal Mine’s 2102 longwall face, a PFC2D numerical model for along-strike mining was constructed, measuring 420 m in length and 240 m in height. The model constrains the displacement at both sides and the bottom, with the top 250 m of overburden replaced by an equivalent load of 6.25 MPa, implemented via servo control of the top wall using Fish language. The model sets each stratum’s sequence, lithology, and thickness according to actual borehole exploration results. Considering computational efficiency and effectiveness, particle radii were set between 0.5 and 0.7 m, generating 77,686 particles with 197,262 contacts. The model equilibrium condition was set to cease calculations when the maximum unbalanced force reached 1 × 10⁻⁵. The actual advance rate of the 2202 working face was 8.0 m/day, with a single excavation step of 8 m, as shown in Figure 3. To represent the structural characteristics of bedding planes between different lithological layers, an unbonded Smooth Joint Model was implemented. After applying microparameters as shown in Table 1, the model reached equilibrium under a top overburden load of 6.25 MPa and gravitational force of 9.8 m/s2. The computation at equilibrium took 34,685 steps. The initial numerical model is shown in Figure 3, with particle contact strengths between 6 × 10⁶ and 26 × 106 N, and vertical stress increasing from 6.25 MPa at the top to 12.0 MPa.

3.2. Simulation Result Analysis

3.2.1. Overburden Rock Fracture Evolution Characteristics

As the coal mining face advances, the overburden fractures undergo an evolutionary process from “microcrack initiation to gradual coalescence to stable expansion”, as depicted in Figure 4. At 48 m of advancement, vertical through-going fractures appear on both sides of the goaf in the immediate roof layer, with a relatively higher number of fractures near the cut-eye side. Locally, four microcracks emerge in the rock layers 10 to 19 m above the mine floor, where fracture spatial distribution is more dispersed and fewer in number. At 80 m of advancement, microcracks above the goaf vertically expand and gradually penetrate the rock layers. Concurrently, the direction of fracture expansion at the rock layer interfaces shifts to lateral expansion, producing larger-scale delamination fractures 9 m above the mine floor (due to the use of the Smooth Joint (SJ) Model at different rock layer interfaces, these delamination fractures cannot be displayed as red short lines in the software). At this stage, vertical through-going fractures develop up to 19 m above the mining area, with multiple sets of through-going fractures segmenting the rock layers into blocks. The face also enters the abutment pressure phase, with nine microcracks developing in higher rock layers (32~40 m above the mining area). At an advancement of 112 m, vertical through-going fractures continue to propagate into higher rock layers, with fracture development on the sides of the goaf noticeably lagging behind the central part, displaying a distribution characteristic of higher fractures in the center and lower on the sides. A new delamination fracture appears at 18 m above the mine floor, and microcracks develop locally in even higher overlying rock. When the face advances to 144 m, the fracture morphology in the overburden shows distinct stratification characteristics. While fractures in lower rock layers penetrate vertically, some also extend laterally, whereas fractures in upper rock layers primarily extend vertically and exhibit leapfrog development, i.e., multiple rock layers internally exhibit vertical fractures but are not completely interconnected. The delamination fractures previously observed at 9 m and 19 m above the original mine floor close under the compacting action of the overlying rock layers, and a new delamination fracture appears at 28 m above the mine floor. At a 176 m advance of the coal mining face, the stratification characteristics of the overburden fractures become more pronounced, with anisotropy in fracture development directions increasing in the lower rock layers, resulting in a complex fracture network. The higher rock layers continue to be dominated by vertical fractures. At this stage, the leapfrog vertical fractures on the cut-eye side and in the central part of the goaf gradually interconnect to form through-going vertical fractures, with limited vertical extension of fractures above the mining area, displaying a leapfrog vertical fracture pattern. As mining continues, the spatial distribution characteristics and development height of the fractures remain essentially unchanged, achieving the full mining effect, with overburden fractures periodically extending laterally as the coal mining face advances. Given that through-going vertical fractures serve as the primary channels for overburden water to enter the mining area, the height of these through-going vertical fractures can be defined as the height of the water-conducting fracture zone. During the advancement from 176 m to 340 m, the height of this fracture zone remains essentially unchanged, with the maximum development height of the water-conducting fractures being 108 m.
A statistical analysis was conducted on the development of overburden fractures and the height of water-conducting fracture zones during the advancement of the coal mining face, with results shown in Figure 5. It reveals that the number of fractures and the height of the water-conducting fracture zones gradually increase as the mining area progresses forward, and there is a good correlation between the growth rates of fractures and the height of the water-conducting zones. Based on these rates, the process can be divided into three stages: slow growth, rapid growth, and steady growth. From 0 m to 64 m of advancement, the slow growth stage is characterized by a small goaf area and low mining disturbance, with fractures primarily distributed in the immediate and main roof layers. From 64 m to 176 m, the rapid growth stage occurs, with multiple sets of vertically through-going fractures interconnecting laterally in the immediate and main roof layers, and vertical fractures in the higher overburden layers rapidly developing and gradually interconnecting, significantly increasing the distribution range and number of overburden fractures. From 176 m to 340 m, the steady growth stage features lateral periodic expansion of fractures, with the height of fracture development remaining essentially unchanged, thus transitioning from nonlinear to linear growth in the number of fractures.

3.2.2. Evolution Characteristics of Overburden Rock Force Chain

Mining disturbances in the coal seam disrupt the equilibrium of the initial force chain system. Within the disturbed range, numerous force chains experience fracture and re-contact, forming a new network of force chains. The morphology and distribution characteristics of this network reflect the stress distribution in the overburden and can reveal the mechanisms of fracture formation and expansion through analysis of the overburden force chain network features. Figure 6 illustrates the evolution of the overburden force chain network at various distances of the coal mining face advancement. In the figure, black lines represent compression chains formed under particle compression, while yellow lines represent tension chains formed under particle tension; thicker lines indicate greater contact forces.
As shown in Figure 6, before coal mining, the force chain network was primarily oriented vertically under the influence of gravity. At 48 m into the coal mining face advancement, the force chain direction in a small overlying area of the goaf shifts, forming a horizontal bundle of strong force chains. Multiple rock layers together form a multi-layered strong force chain arch, with the feet of the arch on both sides of the goaf. The maximum contact force within the arch is 1616 KN. The overlying rock load is supported by this strong force chain arch and transferred to the coal layers in front of and behind the mined area. In areas further from the goaf, rock layer force chain deflection is less apparent, and chains primarily develop vertically. Inside the overburden, pressure chains are distributed in rock layers unaffected by mining disturbance and within the strong force arch, while tension chains are located in the middle to lower parts of the arch crown and the middle to upper sides of the arch feet.
At an 80 m advancement of the coal mining face, the strong force arch in the lower rock layers exceeds its own load-bearing limit due to the overlying load, leading to rock layer fracture and the formation of new load-bearing force chains through hinge jointing. After the rock layers fracture, the tension chains disappear, and pressure concentration points emerge at the hinged locations of the rock blocks, with a maximum contact force of 2113 KN. A new strong force arch appears in the higher rock layers, indicating that the height of the force arches increases with the expanded mining range, while the strong force chains in the collapsed rock bodies within the goaf disappear, degrading into unbonded weak chains. As the coal mining face progresses to 112 m, 144 m, and 176 m, the strong force arches gradually deteriorate from the bottom up along the middle of the arch crown and the outer sides of the arch feet. At these points of destruction, particles make secondary contact to form new load-bearing structures, with maximum contact forces increasing to 2925 KN, 4084 KN, and 5591 KN, respectively. The strong force arches in the higher rock layers have developed to the top of the model, gradually expanding the mining impact area.
As the coal mining face advances, the vertical structure of the overburden force chain remains essentially unchanged, consistent with the distribution of overburden fractures, and expands laterally in a periodic manner with the advancement of the mining area. The distribution of the force chain network also reveals the characteristics of the three zones of overburden: in the caving zone, the overall strength of the force chains is weak, with strong vertical force chains formed by the compaction of broken rock blocks; the fracture zone contains numerous load-bearing horizontal force chain bundles, with a few vertical strong force chains in the far area behind the mining field, where the contact strength is significantly stronger than in the caving zone, and there are many points of stress concentration; in the bending and sinking zone, rock layer fractures are not interconnected, the integrity of the rock layers is not completely lost, and the morphology of the force chains is that of multiple strong arches, with many tensile chains distributed below the arch crown and above the arch feet. The contact strength gradually increases with the advancement distance, reaching a maximum contact force of 9411 KN at 320 m.

3.3. The Propagation Mechanism of Water-Conducting Fracture in Overburden Rock

As shown in Figure 7, during the coal seam mining process, tensile stress concentrations appear in the lower middle area and the upper side areas of the suspended roof. Due to the characteristic of rock being strong in compression but weak in tension, the force chains in these areas are the first to break, creating tensile microcracks. In these microcrack areas, the strong force chains disappear or weaken, forming a weak force chain zone. After the appearance of microcracks, part of the stress is released while the remaining stress is transferred to the surrounding force chains. Under the combined effects of stress transfer and accumulation, the force chain strength at the ends of the microcracks increases, forming strong force chain zones. When the stress concentration in the strong force chain zones exceeds the contact strength limit between particles, fractures occur. At this point, multiple microcracks connect and penetrate the entire rock layer, forming through-going fractures with water-conducting properties.
The overburden above the mined-out area is composed of multiple layers of different rock types. However, the fracture expansion patterns within the individual rock layers of different lithologies are consistent. Therefore, during the advancement of the mining area, unconnected microcracks, termed leapfrog fractures, coexist simultaneously in multiple groups of rock layers. These fractures typically develop in higher rock strata and within a small range behind the coal mining face. As the coal mining face progresses, these leapfrog fractures gradually expand and interconnect to form water-conducting fracture channels. The rupture of the overburden typically lags behind the coal mining face, with higher strata showing more pronounced lag, resulting in the formation of the irregular water-conducting fracture channels shown in Figure 8. Overall, the analysis reveals that during coal mining, the formation process of the overburden water-conducting fracture channel progresses through stages of “local microfractures, leapfrog fractures, interconnected fractures, to water-conducting fractures”.

4. Physical Simulation of Water-Conducting Fracture Development Height

This experiment used a two-dimensional physical similarity simulation to model the destruction of overlying strata during the mining process of a moderately deep coal seam, calculating the development height of the “two zones” and summarizing their developmental patterns. Based on the actual mining conditions of the 2102 coal mining face in the 21 mining area of Balasu Coal Mine, a two-dimensional experimental model was constructed using similar materials to simulate the deformation patterns of the overlying rock mass affected by coal mining disturbances. The study analyzed the initial pressure step, periodic pressure step, and pressure distribution under the specific geological and mining conditions. Observations were made on the deformation patterns of the overburden as the coal seam advanced, analyzing the impact of base rock layer rupture instability and complete deformation of the overburden. The study also examined the relative relationships of development heights for different mining heights, stope ratios, and fracture ratios to determine the development heights of the “two zones”.

4.1. Physical Model Construction and Scheme Design

The experimental design was based on the borehole stratigraphic charts and physical and mechanical parameters of the rocks surrounding the coal seam at the 2102 coal mining face in the 21 mining area of the Balasu Coal Mine, as shown in Figure 9. Given constraints due to rock layer stability and model height, a frame measuring 2.80 m in length, 0.20 m in width, and 1.15 m in height was used. The experiment employed a geometric similarity constant of 1:200 to simulate the development of the “two zones” in a 220 m overburden layer of the 3.2 m high coal seam buried at 483.64 m. A three-dimensional speckle system was utilized for comprehensive monitoring of the model. Additionally, 36 observation lines were set in the vertical direction and 117 in the horizontal direction, totaling 4212 monitoring points to form a comprehensive observation network for the two-dimensional experimental model.

4.2. Overburden Rock Migration Characteristics and Development Height of Two Zones

The migration pattern of overlying strata at different advancing distances of the working face is shown in Figure 10. When the coal mining face advanced to 40 m, the coal seam roof first experienced collapse. At 50 m, a distinct caving zone emerged in the overlying rock layer of the coal seam roof, and the caving area developed forward and towards the surface along the mining direction. By 70 m, compared to the state at 50 m, the vertical development speed of the caving area slowed down. Influenced by mining disturbances and periodic pressure arches, there was significant horizontal expansion in the caving area along the mining direction of the coal seam. Additionally, subsidence deformation in the overlying rock layer of the caving area and visibly developing cracks indicated that a water-conducting fracture zone had formed and continued to develop with mining. At 140 m, an initial pressure-induced “saddle-shaped” caving area formed under the coal seam roof, with the caving zone reaching its maximum height and displaying a symmetrical distribution characteristic of an initial pressure arch. Additionally, the caving zone continued to develop toward the surface, forming an elastic expansion area. Within this area, the rock layers did not fracture, but clear stratification was evident in both the caving zone and the water-conducting fracture zone, indicating the distinctive development characteristics of the “two zones.” The vertical development height of the caving zone reached its maximum, with virtually no further vertical growth, while the water-conducting fracture zone expanded with coal seam mining. As the coal mining face advanced to 180 m, the initial pressure arch in the coal seam roof extended maximally in the mining direction, with the caving zone also reaching its maximum development height, particularly near the cutting face, marking the initial pressure arch. Additionally, horizontal fractures developed above the caving zone, extending the water-conducting fracture zone towards the surface and creating a distinct elastic expansion area in the overburden of the mined coal seam. At a 200 m advancement of the coal mining face, the caving zone and the water-conducting fracture zone exhibited pronounced stratification, indicating the developed characteristics of the “two zones”. The vertical development height of the caving zone reached its maximum, with virtually no vertical growth, while the water-conducting fracture zone predominantly expanded vertically. At this stage, the horizontal fractures (delamination zone) were primarily located above the caving zone and below the water-conducting fracture zone. When the coal mining face advanced to 280 m, the maximum vertical deformation at the top of the caving zone in the overlying rocks was 20 mm, with the water-conducting fracture zone almost reaching its maximum development height approximately 100 m from the coal seam roof, where the maximum vertical deformation within the water-conducting fracture zone was 14 mm. When the coal mining face advanced to 310 m, periodic pressure arches formed in the overlying strata of the coal seam roof, with a periodic pressure step distance of about 40 m. At this point, both the caving zone and the water-conducting fracture zone developed to their maximum heights, with the maximum height of the water-conducting fracture zone being 100 m from the coal seam roof, located near the cutting eye. The upper part of the water-conducting fracture zone in the mined overlying rock showed bending deformation, but no visible vertical or horizontal mining fractures were observed, indicating that the upper strata of the water-conducting fracture zone underwent integral bending deformation and collapse. When the entire simulation of the coal mining face reached 480 m, the water-conducting fracture zone developed laterally to its largest area, with the stable maximum height of the water-conducting fracture zone being about 100 m during the periodic destruction process of the mined overlying rock of the coal seam roof. The coal seam roof exhibited significant periodic pressure-induced collapse. The deformation within the mined overlying rock, particularly the subsidence towards the surface, shows a significant deceleration. The deformation of the mined overlying rock above the water-conducting fracture zone is predominantly characterized by bending and subsidence, without any noticeable mining-induced fractures.
Based on the similar material model experiment, with a coal seam mining height of 3.3 m and the coal mining face fully mined, the maximum development height of the “two zones” was determined to be approximately 100 m, with the periodic pressure mining step distance ranging from 30 m to 40 m. The critical threshold between fully mined and insufficiently mined conditions at the coal mining face is located within a coal seam advancement range of 280 m to 330 m. In the early stages of the water-conducting fracture zone formation, the development speed of the caving zone along the direction of the coal mining face’s advancement was significantly higher than its development speed toward the surface. This meant that the vertical development of the caving zone slowed down. The caving zone, influenced by mining disturbances and periodic pressure arches, exhibited significant horizontal expansion along the mining direction of the coal seam. Subsidence deformation and lateral fractures appeared in the overlying rock layers of the caving zone. As mining advanced, the height of the caving zone in the coal seam roof reached its maximum, forming an initial pressure-induced “saddle-shaped” caving area, with the maximum height of the caving zone displaying a symmetrical distribution, characteristic of the initial pressure arch. When distinct stratification appears in the caving zone and the water-conducting fracture zone, fully revealing the development characteristics of the “two zones”, the vertical development height of the caving zone reaches its maximum, and the vertical development speed approaches zero. As mining progresses, expansion of the water-conducting fracture zone occurs along with the coal seam being mined. Simultaneously, the initial pressure arch in the coal seam roof extends maximally in the direction of mining, and the height of the caving zone develops to its maximum, with the highest point located near the cutting eye, marking the initial pressure arch. Additionally, horizontal fractures develop above the caving area, the water-conducting fracture zone extends towards the surface, and a noticeable elastic expansion area appears in the overlying strata of the mined coal seam.

5. Field Measurement of Water-Conducting Fracture Development Height

5.1. Detection Scheme Design

Based on the geological conditions and the current mining status of the 2102 coal mining face, the surface subsidence basin within 600 m of the cutting eye has stabilized, providing suitable conditions for conducting exploratory measurements of the “water-conducting fracture zone”. Consequently, the exploration site for the fracture zone was chosen at a location 500 m from the cutting eye. Three different methods were selected for investigating the development height of the fracture zone: flush fluid consumption monitoring, borehole television imaging, and hydraulic testing. The borehole locations are shown in Figure 11, with two boreholes, LT-2 and LT-3, constructed above the 2102 goaf, at depths of 478 m and 475 m, respectively, serving as observation wells for the fracture zone. Borehole LT-1, located in the unmined area north of the 2102 coal mining face as a pre-mining comparison borehole, reaches a depth of 480 m. The hydraulic testing equipment used was the “Two Zone Height Tester”, independently developed by the Xi’an Research Institute, and the borehole television inspection used a SYKJ 17 model viewer.

5.2. Detection Scheme Design Detection Result Analysis

5.2.1. Flushing Fluid Leakage Observation

The results of the flush fluid loss and water level observations for each borehole are shown in Figure 12 and Figure 13. From the figures, it can be seen that:
(1)
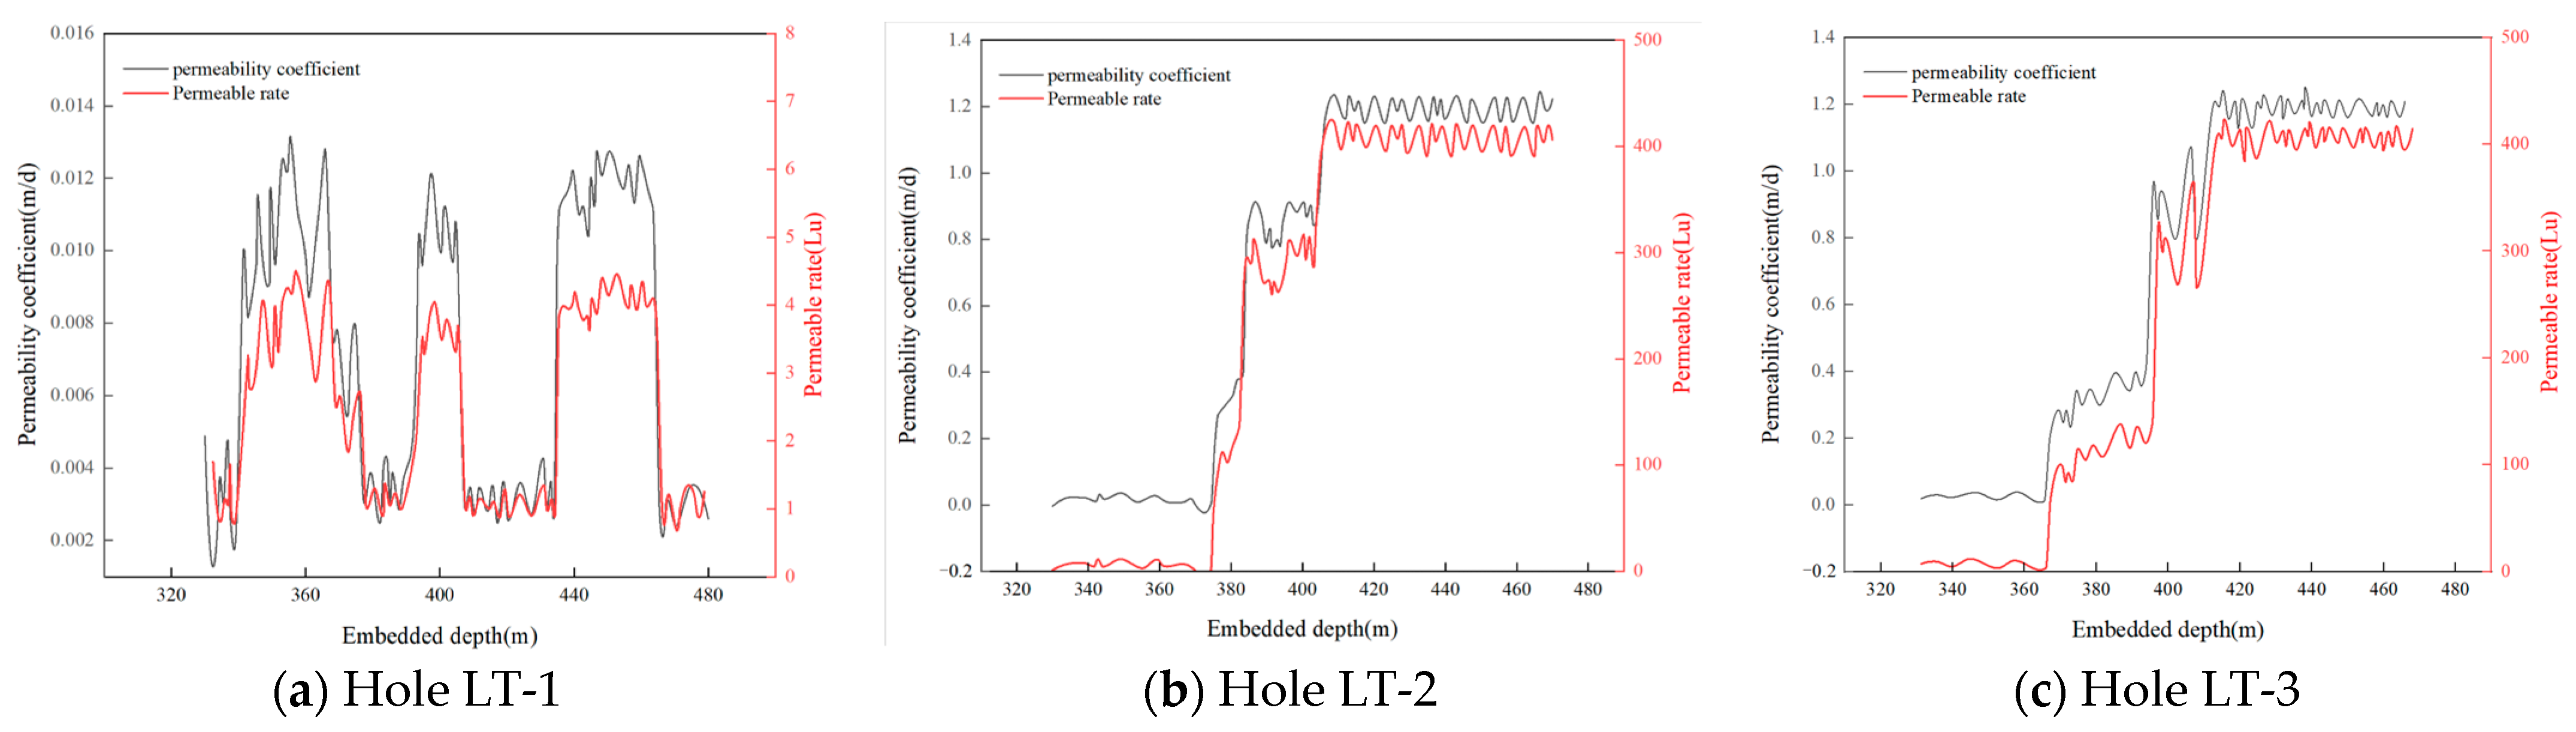
In borehole LT-1, the flush fluid loss per unit time in the bedrock section varied from 0.0080 to 0.093 L/s·m, with an average value of 0.036 L/s·m. Throughout the observation period, the flush fluid loss did not increase with the depth of the borehole, and the fluid circulation remained normal without any interruption or loss. The water level in this borehole gradually decreased with increasing depth, ranging from 0.42 to 23.98 m. The water level changes were normal throughout the entire borehole, with no sudden drops or instances of the borehole running dry.
(2)
In borehole LT-2, the flush fluid loss in the bedrock section varied from 0.0088 to 1.73 L/s·m, with an average value of 0.28 L/s·m. In the sand and soil layers, the fluid loss did not vary significantly. At a depth of 373.40 m, the consumption began to increase, and by 402 m, all the flush fluid was lost, with no further circulation. The water level in this borehole gradually decreased with increasing depth, ranging from 1.90 to 31.24 m. The water level remained relatively stable in the upper bedrock section, but after drilling through the 368.99–373.40 m section, the water level dropped from 31.24 m to 156.78 m, and the consumption rate increased from 0.071 L/s·m to 0.91 L/s·m. By the time drilling reached 402 m, all flush fluid was lost. Based on these characteristics, the top boundary of the water-conducting fracture zone in borehole LT-2 is determined to be at a depth of 373.40 m.
(3)
In borehole LT-3, the flush fluid loss in the bedrock section varied from 0.000593 to 2.10 L/s·m, with an average value of 0.297 L/s·m. At a depth of 365.10 m in the bedrock section, the consumption began to increase, and by 398 m, all the flush fluid was lost. The water level in this borehole gradually decreased with increasing depth, ranging from 1.13 to 39.40 m in the bedrock section. The water level remained relatively stable in the upper bedrock section, but after drilling through the 360.42–365.10 m section, the water level dropped from 39.40 m to 253.64 m, and the consumption rate increased from 0.048 L/s·m to 1.139 L/s·m. By the time drilling reached 398 m, all flush fluid was lost. Based on these characteristics, the top boundary of the water-conducting fracture zone in borehole LT-3 is determined to be at a depth of 365.10 m.

5.2.2. In-Hole TV Imaging Observation

Borehole inspection requires the borehole to remain dry or the borehole wall to be free of water flow. Therefore, during this drilling operation, water-stopping measures were implemented in the weathered bedrock and above. After the borehole completely lost fluid and became dry, borehole television inspection was conducted, as shown in Figure 13. In borehole LT-1, the borehole wall was generally intact, with no significant fractures observed. In borehole LT-2, local fractures were observed at a depth of 371.40 m, with small fracture width and distribution range. Significant destructive fractures began to develop below 373.70 m, mainly vertical fractures with some horizontal fractures. In borehole LT-3, vertical fractures appeared at a depth of 357.10 m, with a small fracture width and distribution range. Significant destructive fractures began to develop below 363.40 m, mainly vertical fractures. Compared to borehole LT−2, the fractures in borehole LT-3 were more developed and extensive, indicating more intense movement and higher degrees of overlying rock damage in the central goaf.

5.2.3. Pump-In Test

Based on the observations of flush fluid loss and borehole television results, there are no significant mining-induced fractures above a depth of 357.10 m. Therefore, the section from 330.00 m to the end of the borehole was selected for hydraulic testing, with a test conducted for every meter drilled. The permeability of the rock mass is typically indicated by the permeability coefficient (k) and the permeability rate (q). The variation in k and q values with depth for each borehole is shown in Figure 14.
The hydraulic test section of borehole LT-1 ranges from 330.00 m to 480.00 m, comprising a total of 150 test sections. As shown in Figure 14a, the permeability coefficient of the bedrock section in borehole LT-1 ranges from 0.0024 to 0.0134 m/d, with an average of 0.0073 m/d. The permeability rate ranges from 0.83 to 4.61 Lu, with an average of 2.51 Lu. Based on the classification of rock and soil permeability, the original rock mass permeability is determined to range from slightly permeable to weakly permeable.
The hydraulic test section of borehole LT-2 ranges from 330.00 m to 470.00 m, comprising a total of 140 test sections. As shown in Figure 14b, the k and q values of borehole LT-2 increase non-linearly with depth. The k and q value curves stabilize above a depth of 374 m, increasing to 0.97 m/d and 287.63 m/d at 374 m, and further to 1.33 m/d and 379.42 m/d at 408 m, before gradually stabilizing. The permeability grade of the overlying strata changes from weakly permeable to strongly permeable at a depth of 374 m.
The hydraulic test section of borehole LT-3 ranges from 330.00 m to 468.00 m, comprising a total of 138 test sections. As shown in Figure 14c, the k and q value curves for borehole LT-3 exhibit a similar non-linear growth trend to those of borehole LT-2. The k and q value curves stabilize above a depth of 366 m, increasing to 1.06 m/d and 308.26 m/d at 366 m, and further to 1.38 m/d and 386.34 m/d at 416 m, before gradually stabilizing. The permeability grade of the overlying strata changes from weakly permeable to strongly permeable at a depth of 366 m.

5.2.4. Comprehensive Determination of Height of Water Flowing Fractured Zone

The development heights of water-conducting fractures obtained by different observational methods and their comparisons are shown in Table 2 and Table 3. According to Table 2, the three methods provide closely aligning results for the height of the water-conducting fracture zone at the 2102 working face, ranging from 103.68 to 107.58 with a fracture ratio of 31.42 to 32.60. Table 3 presents the fracture zone heights obtained by different research methods, revealing that the maximum discrepancies between numerical simulations, physical simulations, and actual measurements are 4.2% and 7%, respectively. The field measurements confirm the validity and accuracy of the theoretical research described above.

6. Conclusions

(1)
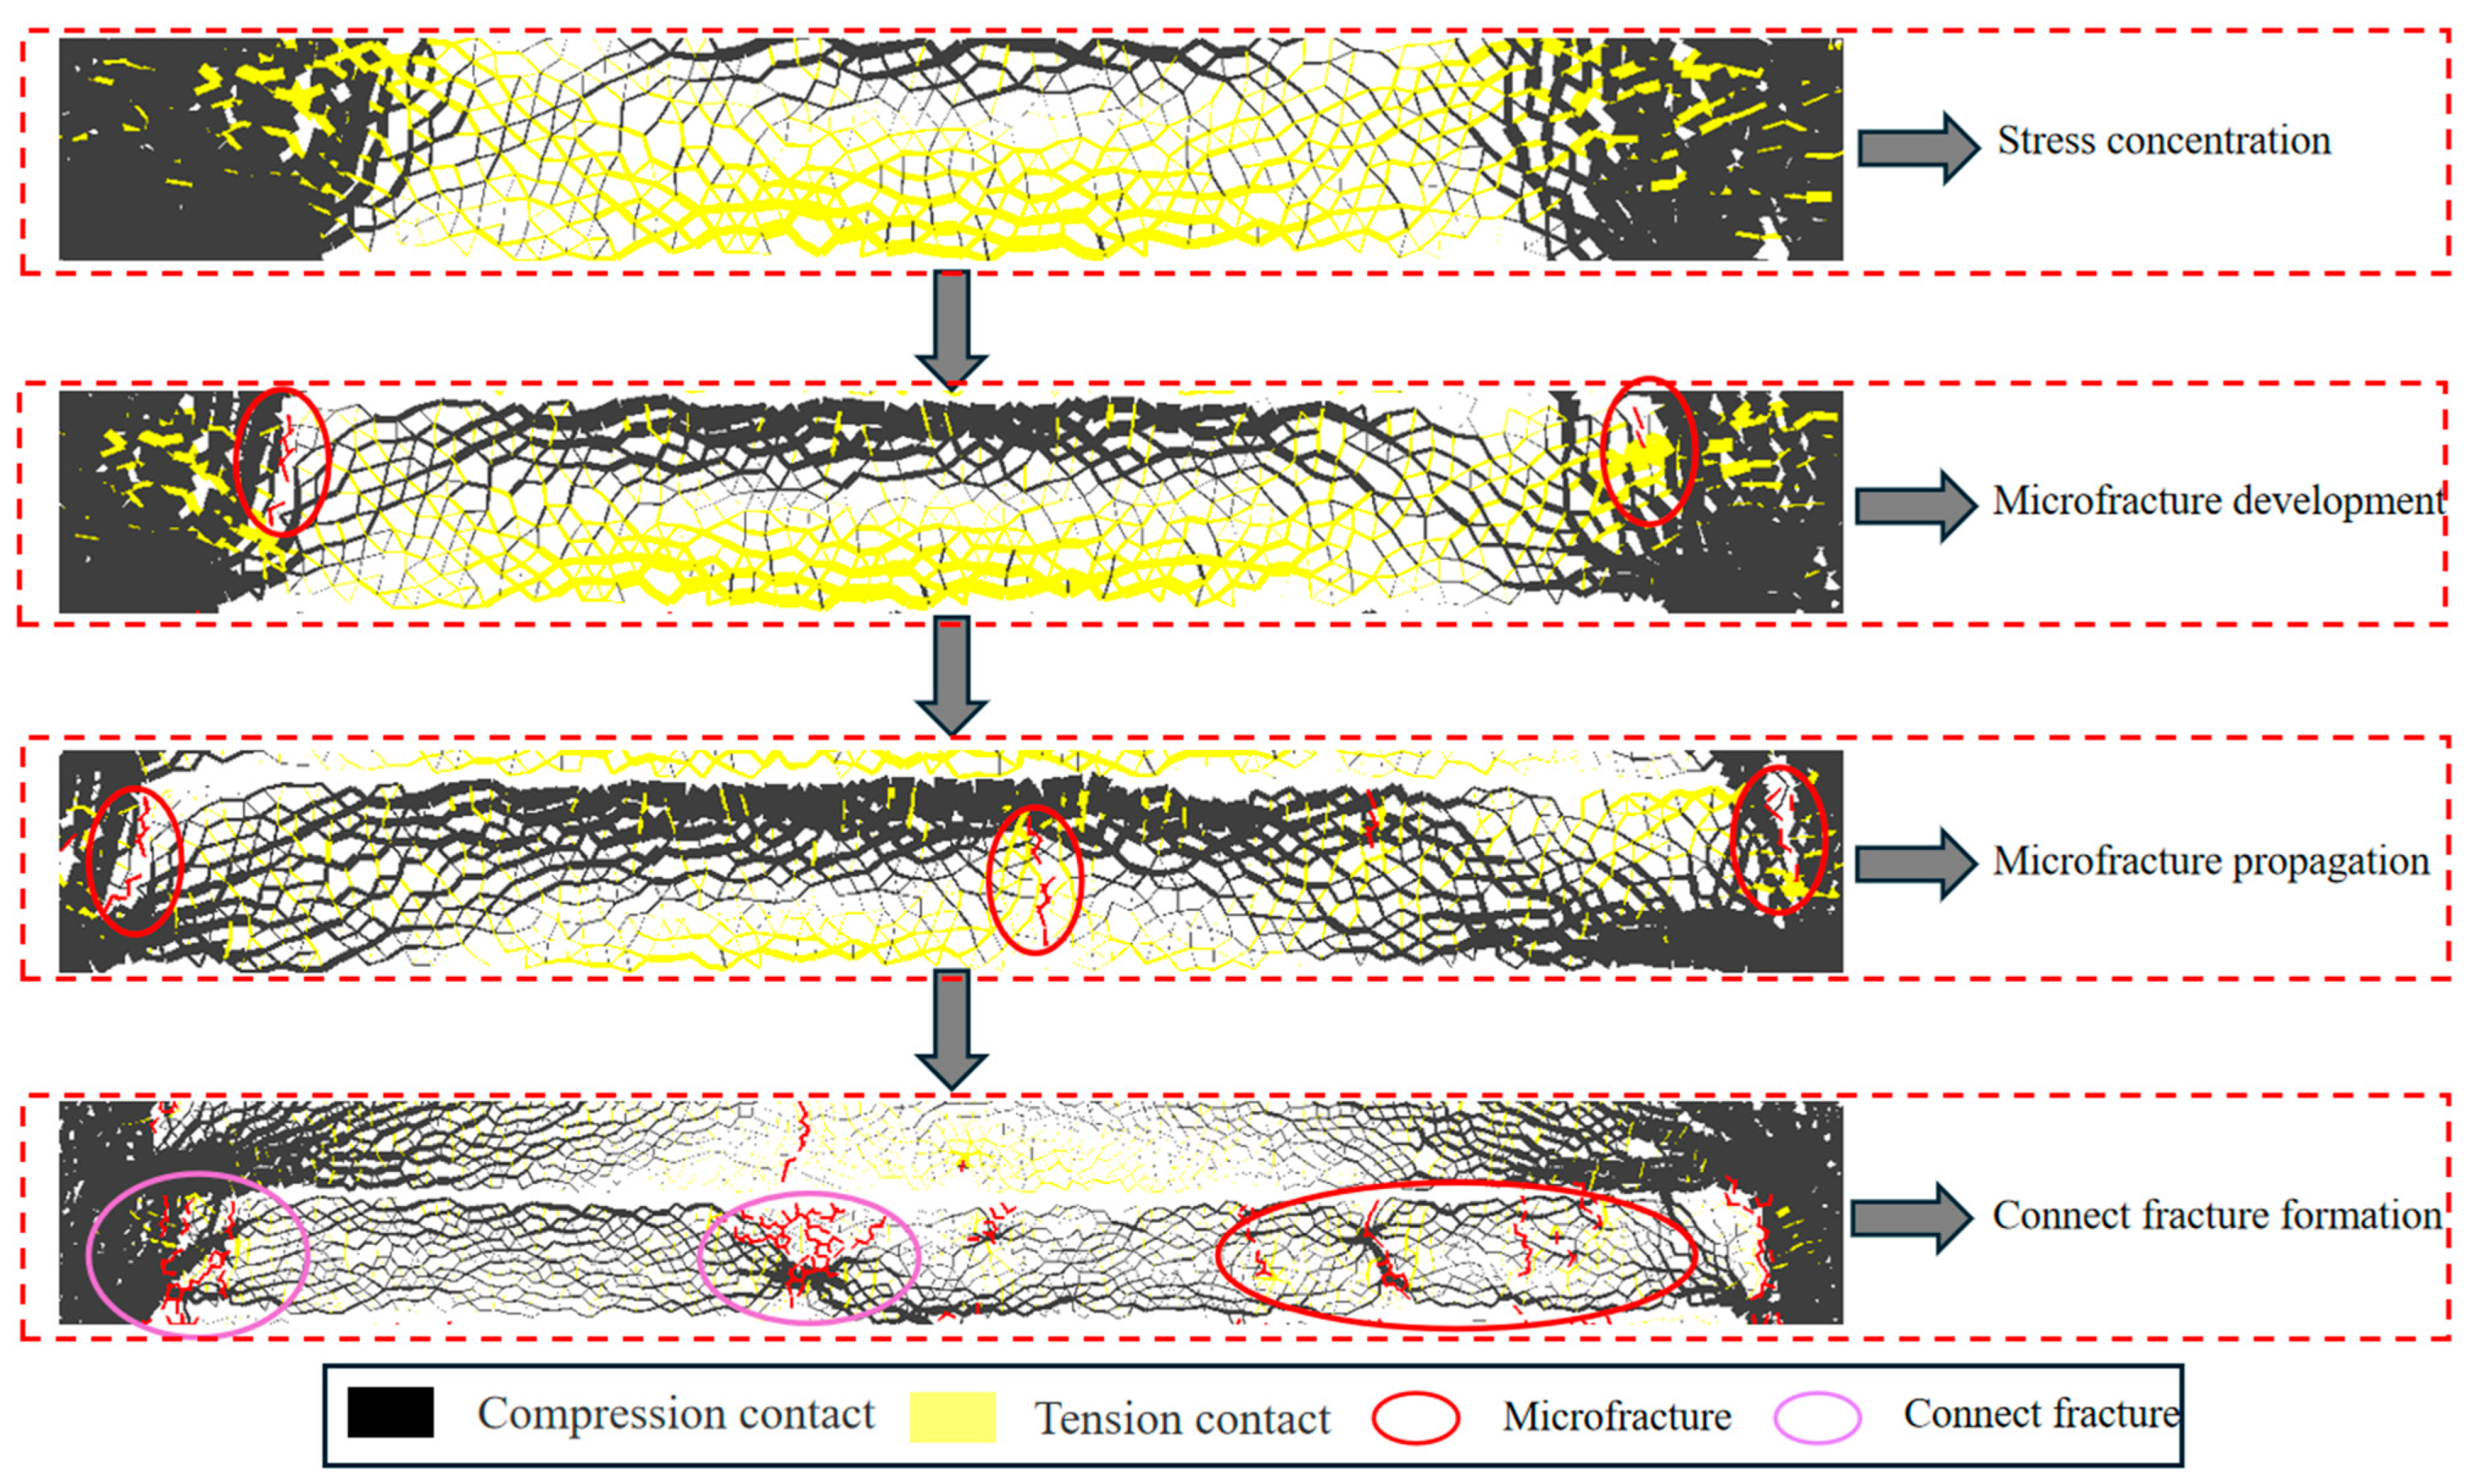
Within the range of mining influence, the direction of force chains in the rock strata undergoes horizontal deflection, with multiple layers forming multiple strong chain arches. Tensile stress concentration areas between layers first develop tensile cracks. Under the effect of stress transmission and superposition, the local stress concentration at the ends of tensile micro-cracks increases, leading to the development of jump fractures and through fractures. The formation process of water-conducting fractures is “local micro-fractures–jump fractures–through fractures–water-conducting fractures” with the maximum height of the water-conducting fracture zone being approximately 108 m.
(2)
By observing the water loss in three underground boreholes, conducting borehole television observations, and combining the results of hydraulic tests, the height of the water-conducting fracture zone was comprehensively determined to be 103.68–107.58 m, with a fracture-to-mining ratio of 31.42–32.60. These results are not significantly different from those obtained through numerical and physical simulations. The findings of this study can provide theoretical guidance and scientific basis for coal mine water hazard prevention and control under similar geological conditions.
(3)
By conducting water injection loss measurements, borehole television observations, and hydrostatic testing on three underground boreholes, the height of the water-conducting fracture zone was determined to range between 103.68 and 107.58, with a fracture ratio of 31.42 to 32.60, closely matching the numerical and physical simulation results. This research provides theoretical guidance and a scientific basis for the prevention of water hazards in coal mines under similar geological conditions.
(4)
The numerical and physical models developed in this paper simplify the actual geological conditions on-site. Future research can focus on developing more accurate simulation technologies to better reflect real situations under complex geological conditions.

Author Contributions

Conceptualization, D.W.; Software, H.G.; Investigation, C.W.; Resources, H.G.; Data curation, D.W. and C.W.; Writing—original draft, H.W., H.Z. and Y.G. All authors have read and agreed to the published version of the manuscript.

Funding

This research received no external funding.

Data Availability Statement

The original contributions presented in the study are included in the article, further inquiries can be directed to the corresponding author.

Conflicts of Interest

Authors Wei Dong and Chungang Wang were employed by Shanxi Yanchang Petroleum and Mining Co., Ltd. The remaining authors declare that the research was conducted in the absence of any commercial or financial relationships that could be construed as a potential conflict of interest.

References

  1. Li, W.; Qiao, W.; Li, X.; Sun, R. Chacteristics of water disaster, evaluation methods and exploration direction for control-ling ground water in deep mining. J. China Coal Soc. 2019, 44, 2437–2448. [Google Scholar]
  2. Wang, S. Reflections on the energy status of coal bodies and green mining in China. J. China Coal 2020, 46–48, 11–16. [Google Scholar]
  3. Wu, Q. Progress, problems and prospects of prevention and control technology of mine water and reutilization in China. J. China Coal Soc. 2014, 39, 795–805. [Google Scholar]
  4. Tan, Y.; Guo, W.; Yang, D.; Bai, E. Analysis on height of “two zones” under subcritical mining in shallow coal seam with hard roof. J. Min. Saf. Eng. 2017, 34, 845–851. [Google Scholar]
  5. Helong, G.; Xingping, L.; Ming, T.; Aliakbar, M.; Qunlei, Z. Dynamic mechanical mechanism and optimization approach of roadway surrounding coal water infusion for dynamic disaster prevention. Measurement 2023, 223, 113639. [Google Scholar] [CrossRef]
  6. Gao, B.; Liu, Y.; Pang, J.; Yuan, T. Detection and analysis of height of water flowing fractured zone in under water mining. Chin. J. Rock Mech. Eng. 2014, 33, 3384–3390. [Google Scholar]
  7. Chen, Y.; Zhu, S. Determination of caved and water-conducting fractured zones of “two soft and one hard” unstable coal seam. Acta Geod. Geophys. 2020, 55, 451–475. [Google Scholar] [CrossRef]
  8. Hebblewhite, B. Fracturing, caving propagation and influence of mining on groundwater above longwall panels—A review of predictive models. Int. J. Min. Sci. Technol. 2020, 30 (Suppl. S1), 49–54. [Google Scholar] [CrossRef]
  9. Ye, Q.; Wang, G.; Jia, Z.Z.; Zheng, C.; Wang, W. Similarity simulation of mining-crack-evolution characteristics of overburden strata in deep coal mining with large dip. J. Pet. Sci. Eng. 2018, 165, 477–487. [Google Scholar] [CrossRef]
  10. Wang, G.; Wu, M.; Wang, R.; Xu, H.; Song, X. Height of the mining-induced fractured zone above a coal face. Eng. Geol. 2017, 216, 140–152. [Google Scholar] [CrossRef]
  11. Xu, Y.; Ma, L.; Khan, N.M. Prediction and maintenance of water resources carrying capacity in mining area—A case study in the Yu-Shen mining area. Sustainability 2020, 12, 7782. [Google Scholar] [CrossRef]
  12. Liu, S.; Li, W. Zoning and management of phreatic water resource conservation impacted by underground coal mining: A cause study in arid and semiarid areas. J. Clean. Prod. 2019, 224, 677–685. [Google Scholar] [CrossRef]
  13. Singh, M.M.; Kendorski, F.S.T. The effects of longwall coal mining on overlying aquifers. In Mine Water Hydrogeology and Geochemistry; Geological Society Special Publication; Younger, P.L., Robins, N.S., Eds.; Geological Society of London: London, UK, 2022; Volume 198, pp. 17–45. [Google Scholar]
  14. Coe, C.J.; Stowe, S.M. Strata-movement concepts and the hydrogeological impact of underground coal mining. Ground Water 1986, 24, 507–515. [Google Scholar]
  15. Boothc, J. A reappraisal of investigations into strata permeability changes associated with longwall mining. Mine Water Environ. 1983, 2, 1–14. [Google Scholar]
  16. Jia, C.; Lai, X.; Cui, F.; Xu, H.; Zhang, S.; Li, Y.; Zong, C.; Luo, Z. Mining Pressure Distribution Law and Disaster Prevention of Isolated Island Working Face Under the Condition of Hard “Umbrella Arch”. Rock Mech. Rock Eng. 2024, 1–19. [Google Scholar] [CrossRef]
  17. Zhang, L.; Lai, X.; Pan, J.; Shan, P.; Zhang, Y.; Zhang, Y.; Xu, H.; Cai, M.; Xi, X. Experimental investigation on the mixture optimization and failure mechanism of cemented backfill with coal gangue and fly ash. Powder Technol. 2024, 440, 119751. [Google Scholar] [CrossRef]
  18. Huang, B.; Xie, P.; Wu, Y.; Lin, W.; Luo, S.; Wang, S.; Wen, Z.; Chen, J. The efect of overlying rock fracture and stress path evolution in steeply dipping and large mining height stope. Géoméch. Geophys. Geo-Energy Geo-Resour. 2024, 10, 1–19. [Google Scholar] [CrossRef]
  19. Wei, J.; Wang, S.; Song, S.; Sun, Q. Numerical simulation on evolution law of overburden fractures and surface cracks in crossing ditch miming of shallow coal seam. Coal Geol. Explor. 2022, 50, 67–75. [Google Scholar]
  20. Wang, C.; Zhang, C.; Zhao, X.; Liao, L.; Zhang, S. Dynamic structural evolution of overlying strata during shallow coal seam longwall mining. Int. J. Rock Mech. Min. Sci. 2018, 103, 20–32. [Google Scholar] [CrossRef]
  21. Li, X.F.; Li, X.; Li, H.B.; Zhao, J. Dynamic tensile behaviours of heterogeneous rocks: The grain scale fracturing characteristics on strength and fragmentation. Int. J. Impact Eng. 2018, 118, 98–118. [Google Scholar] [CrossRef]
  22. Li, X.F.; Zhang, Q.B.; Li, H.B.; Zhao, J. Grain-based discrete element method(gb-dem) modelling of multi-scale fracturing in rocks under dynamic loading. Rock Mech. Rock Eng. 2018, 51, 3785–3817. [Google Scholar] [CrossRef]
  23. Dai, J.; Liu, J.; Liu, C.; Yang, J.; Xue, F.; Tang, Y.; Liu, J.; Liu, D.; Dai, S. Regional Characteristics of Seismicity Associated with Hydraulic Fracturing in the Southern Sichuan Basin of China. Rock Mech. Rock Eng. 2024, 1–26. [Google Scholar] [CrossRef]
  24. Dai, J.; Liu, J.; Zhou, L.; He, X. Crack Pattern Recognition Based on Acoustic Emission Waveform Features. Rock Mech. Rock Eng. 2023, 56, 1063–1076. [Google Scholar] [CrossRef]
  25. Zhang, T.; Yu, L.; Xu, F.; Ju, M.; Pu, H.; Li, W.; Liu, J. Influence of Mesoscopic Defects on the Mechanical Behaviour of Granites Based on a Three-Dimensional Multilevel Force Chain Network. Rock Mech. Rock Eng. 2024, 1–21. [Google Scholar] [CrossRef]
  26. Chen, P.; Kong, Y.; Yu, H. Research on the Calibration Method of Microparameters of a Uniaxial Compression PFC2D Model for Rock. Chin. J. Undergr. Space Eng. 2018, 14, 1240–1249. [Google Scholar]
  27. Zhang, T.; Yu, L.Y.; Su, H.J.; Zhang, Q.; Chai, S. Experimental and numerical investigations on the tensile mechanical behavior of marbles containing dynamic damage. Int. J. Min. Sci. Technol. 2022, 32, 89–102. [Google Scholar] [CrossRef]
  28. Yang, S.; Tian, W.; Huang, Y.; Ranjith, P.G.; Ju, Y. An Experimental and numerical study on cracking behavior of brittle sandstone containing two non-coplanar fissures under uniaxial compression. Rock Mech. Rock Eng. 2016, 49, 1497–1515. [Google Scholar] [CrossRef]
  29. Xu, Y.; Dai, F.; Xu, N.W.; Zhao, T. Numerical investigation of dynamic rock fracture toughness determination using a semi-circular bend specimen in split hopkinson pressure bar testing. Rock Mech. Rock Eng. 2016, 49, 731–745. [Google Scholar] [CrossRef]
Figure 1. Strata lithology and aquifer distribution of 2102 coal mining face.
Water 16 01883 g001
Figure 2. PFC crack propagation principle.
Water 16 01883 g002
Figure 3. PFC numerical model construction.
Water 16 01883 g003
Figure 4. Damage development of coal mining face overburden rock with very different mining distances.
Water 16 01883 g004
Figure 5. Changes in the number and development height of overburden fractures.
Water 16 01883 g005
Figure 6. Evolution process of overburden force chain.
Water 16 01883 g006
Figure 7. Crack propagation mechanism of overburden rock.
Water 16 01883 g007
Figure 8. Formation process of water-conducting fracture channel in overburden rock.
Water 16 01883 g008
Figure 9. Physical simulation platform and model construction.
Water 16 01883 g009
Figure 10. Failure characteristics of overburden rock with different advancing distances.
Water 16 01883 g010
Figure 11. Exploration engineering and equipment for water flowing fractured zone in overlying strata.
Water 16 01883 g011
Figure 12. Flushing fluid leakage and water level varies with buried depths.
Water 16 01883 g012
Figure 13. The development of cracks in the hole.
Water 16 01883 g013
Figure 14. Results of water pressure test.
Water 16 01883 g014
Table 1. Stratigraphic mechanical parameters of the PFC2D numerical model.
Lithologic CharactersE*/GPaK*c/MPat/MPaφ/°μ
Fine sandstone10.51.612.88.539.40.7
Siltstone8.81.511.77.438.20.8
Medium sandstone7.41.76.25.635.20.7
Grit stone8.21.79.97.239.50.6
Coal seam2.81.93.22.129.80.4
Table 2. Detection results of development height of water flowing fractured zone.
DrillingElevation of Bore Hole/mBuried Depth of Floor/mFloor Level/mCritical Depth of Water -Conducting Fracture Zone/mHeight of Fractured Water-Conducting Zone/mHeight Mining/mCrack Production Ratio
LT-2+1185.3833477.08+705.00373.40103.683.3031.42
LT-3+1180.9764472.68+705.00365.10107.583.3032.60
Table 3. Comparison of water-conducting fracture development height results.
Research MethodHeight of Fractured Water-Conducting Zone/mCrack Production RatioError/%
Numerical simulation10831.424.2%
Physical simulation10032.607%
Field test103.68~107.58103.68~107.58/
Disclaimer/Publisher’s Note: The statements, opinions and data contained in all publications are solely those of the individual author(s) and contributor(s) and not of MDPI and/or the editor(s). MDPI and/or the editor(s) disclaim responsibility for any injury to people or property resulting from any ideas, methods, instructions or products referred to in the content.

