Article

Under the Strong Influence of Human Activities: The Patterns and Controlling Factors of River Water Chemistry Changes—A Case Study of the Lower Yellow River

1
School of Civil Engineering, Nanyang Institute of Technology, Nanyang 473004, China
2
Hebei Geological Environment Monitoring Institute, Shijiazhuang 050021, China
*
Author to whom correspondence should be addressed.
Water 2024, 16(13), 1886; https://doi.org/10.3390/w16131886
Submission received: 21 May 2024 / Revised: 22 June 2024 / Accepted: 26 June 2024 / Published: 1 July 2024
(This article belongs to the Special Issue Water Quality Assessment of River Basins)

Abstract

:
This study provides an in-depth analysis of the hydrochemical characteristics and their controlling factors in the lower reaches of the Yellow River. Through water quality sampling and analysis over two hydrological periods within a year, combined with hydrochemical methods and machine learning techniques, the study reveals the joint impact of natural factors and human activities on the spatiotemporal variations in hydrochemical constituents. The findings indicate that the water in the lower reaches of the Yellow River exhibits weak alkalinity (the pH is between 7 and 8), with the primary hydrochemical type being HCO3·SO4—Ca·Na·Mg. The temporal variation in the hydrochemical constituents is mainly influenced by rainfall, where nitrate levels are higher during the flood season due to the flushing effect of rainfall, whereas other hydrochemical constituents show an opposite temporal pattern due to the dilution effect of rainfall. The spatial variation in the Yellow River’s hydrochemistry is primarily controlled by a combination of human activities and rainfall. Using Gibbs diagram analysis, it is identified that rock weathering is the main source of ionic constituents, while agricultural fertilization, industrial emissions, and domestic wastewater discharge have significant impacts on the hydrochemical constituents. Compared to other rivers worldwide, the concentration of hydrochemical constituents in the lower reaches of the Yellow River is relatively high, especially nitrate and sulfate, which is closely related to the geological characteristics of the Yellow River basin and intense human activities in the middle and lower reaches. Principal component analysis reveals that the main controlling factors for hydrochemical constituents during the dry season in the lower reaches of the Yellow River are rock weathering dissolution and industrial activities, followed by domestic wastewater; during the flood season, the main controlling factors are rock weathering dissolution and industrial activities, followed by agricultural activities and domestic wastewater. The research findings provide theoretical support for water resource management and water quality protection in the lower reaches of the Yellow River.

1. Introduction

Rivers serve as a critical link between terrestrial ecosystems and the oceans, not only facilitating the transfer of materials and the exchange of energy but also playing a vital role in the socio-economic development within their basins [1,2]. However, in the wake of rapid industrial and urban growth, human activities have exerted a significant impact on the hydrochemical composition of rivers [3], which severely affects the ecological attributes and functions of rivers. Therefore, studying the patterns of river hydrochemical changes and their controlling factors can help us better understand the health of river ecosystems and predict and assess the potential impact of environmental changes on river ecosystems [4,5].
The patterns of variation in river hydrochemical components are influenced by a multitude of factors, including natural factors such as climatic conditions, topography, hydrological cycles, and geological background, as well as anthropogenic factors like land use changes, industrial discharges, agricultural activities, and urbanization processes. These factors interact through physical, chemical, and biological processes, collectively determining the chemical composition and evolutionary trends of river waters [6,7,8,9]. Previous studies have found that the temporal variation in surface water hydrochemical components is affected by the dilution and flushing effects of rainfall, exhibiting different seasonal patterns. For instance, rivers dominated by point source pollution are primarily influenced by the dilution effect of rainfall, showing that hydrochemical components have lower concentrations during the flood season than during the dry season [10]. In contrast, water bodies dominated by non-point source pollution have their hydrochemical components influenced by the flushing effect of rainfall, with higher concentrations during the flood season compared to the dry season [11]. The spatial variation in hydrochemical components in surface water is mainly affected by the intensity of human activities within the watershed, showing spatial heterogeneity. For example, Mbaye et al. [12] conducted a study on the spatiotemporal variation in nitrogen in Lake Senegal and found that the concentrations of NO3-N and TN were significantly higher in densely populated areas and downstream river sections with intensive agricultural development than in the upstream areas of the lake. Zhang et al. [13] found strong spatial differences in NO3-N and NH4+-N in the Fuyang River, with higher concentrations near urban areas and lower concentrations further away from the city. It can be seen that the spatiotemporal characteristics of surface water hydrochemical components are influenced by a combination of natural conditions and human activities. Due to the varying intensities of natural and human activities within different regions, there are differences in the spatiotemporal variations in the hydrochemical components. Therefore, to accurately identify the spatiotemporal variation patterns of hydrochemical components in rivers, comprehensive surveys and systematic research efforts are required.
The Yellow River Basin, as China’s second-longest river, has significant implications for regional water resource management and ecological and environmental protection [14]. Currently, hydrochemical research in the Yellow River Basin mainly focuses on water quality monitoring [15], identification of pollution sources [16], and the spatiotemporal variations in nutrients [17]. However, due to the Yellow River Basin spanning multiple climatic types and geological units, especially in the lower reaches of the Yellow River (the section from Henan Province to Shandong Province), where human activity is intense (with population densities as high as 577 and 638 people/km2) [14], the impact on the Yellow River’s hydrochemistry is profound, and its hydrochemical characteristics and evolutionary laws are more complex. In-depth research is needed to reveal the underlying control mechanisms.
This study focuses on the downstream section of the Yellow River from Zhengzhou City in Henan Province to the estuary area in Dongying City, Shandong Province, as the focus of the research. By integrating geochemical methods and machine learning techniques, it aims to deeply analyze the patterns and controlling factors of hydrochemical component variations in the downstream section of the Yellow River. The specific research content includes (1) analyzing the spatiotemporal variation characteristics of the hydrochemical composition of the main stream water in the lower reaches of the Yellow River; (2) identifying the mechanisms by which natural factors and human activities influence the spatiotemporal variations in hydrochemistry in the lower Yellow River; and (3) revealing the controlling factors of hydrochemical variation during different periods. The results of this study will provide a scientific basis for water resource management and protection in the downstream area of the Yellow River.

2. Materials and Methods

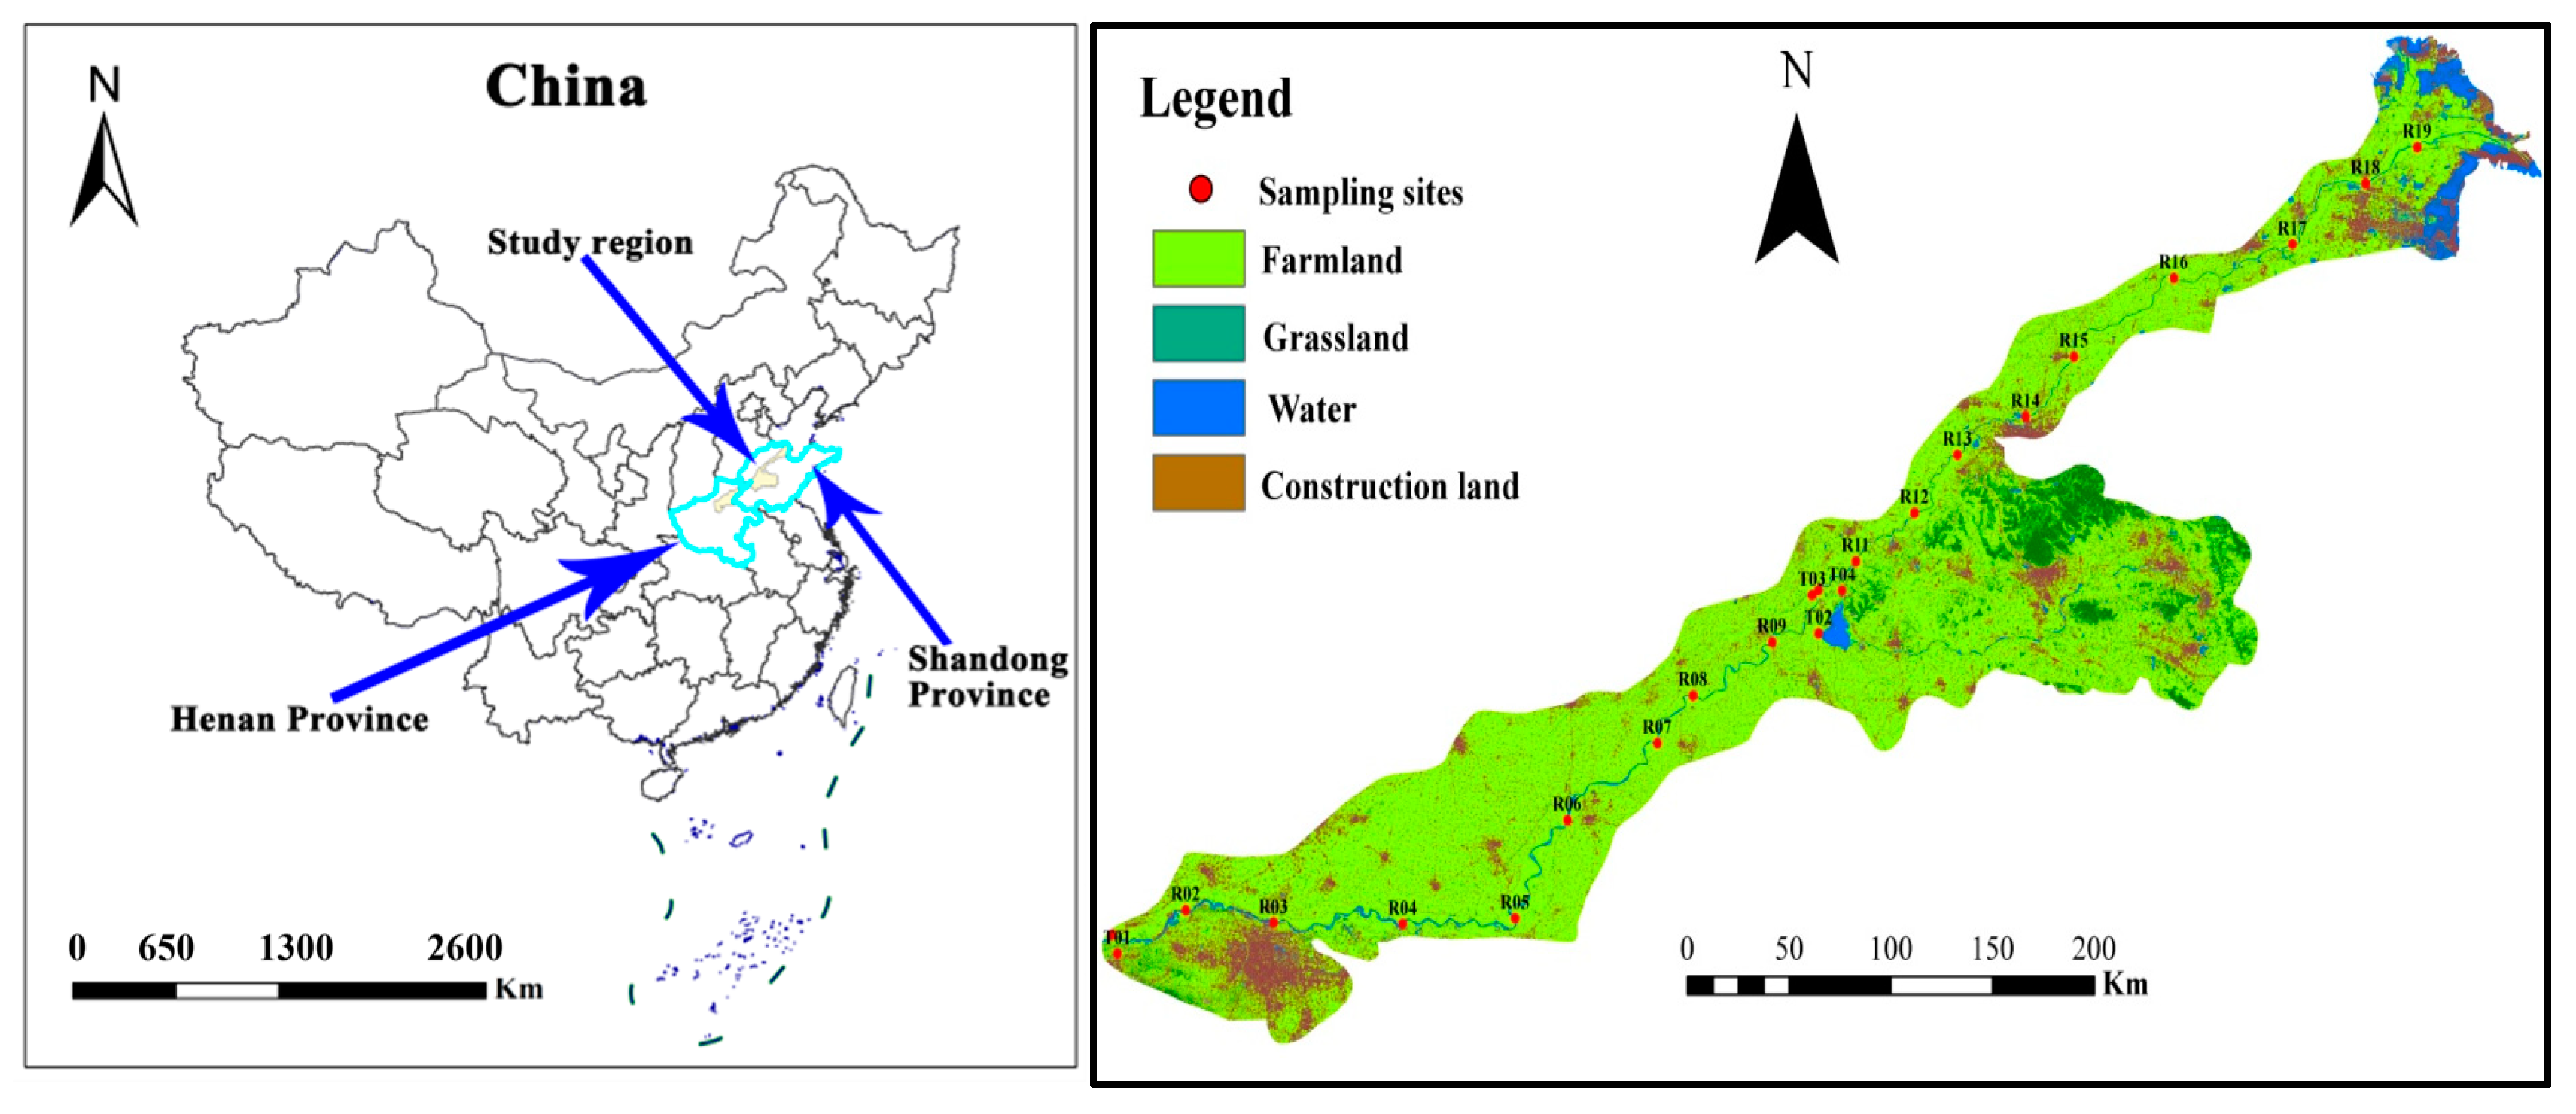
2.1. Overview of the Study Area

The Yellow River originates from the northern foothills of the Bayan Har Mountains on the Qinghai–Tibet Plateau, with a total length of 5464 km, making it the second-longest river in China [18]. This study primarily focuses on the downstream section of the Yellow River, starting from Zhengzhou city in Henan Province in the west to the estuary in Dongying City, Shandong Province, in the east (Figure 1), with a total length of approximately 750 km. The study area has a typical monsoon climate with distinct seasons, characterized by dry and windy conditions in spring with frequent sandstorms, hot and rainy summers, and uneven distribution of precipitation throughout the year, with rainfall concentrated in the months of July to October. The average annual rainfall of more than 900 mm, and mean annual temperature of 12–14 °C. The main soil types in the study area include fluvic soils, loess, and saline soils, while land use types comprise arable land (72.2%), construction land (16.1%), bare land (0.4%), lawn (2.5%), forest land (4.1%), and water bodies (4.7%).

2.2. Sample Collection and Testing

This study conducted water sampling during two hydrological periods in April 2021 (low flow season) and July 2021 (high flow season), with a total of 23 sampling sites, including 19 main stream sampling sites and 4 tributary sampling sites. The positions of the sampling sites are shown in Figure 1. A polyethylene surface water sampler was chosen for this study. Before sampling, polyethylene plastic bottles were cleaned with ultra-pure water, and then rinsed three times with river water samples. Water specimens were typically procured from the river’s core channel, specifically at depths exceeding 50 cm below the water’s surface. Each sample was divided into two portions: one for the determination of cations (Na+, K+, Ca2+, and Mg2+), acidified with reagent-grade nitric acid on-site to a pH < 2; the other for the determination of anions (HCO3, SO42−, Cl and NO3), without adding any reagents. All samples were filled to the top of the container without air bubbles and stored in a refrigerator, protected from light. Sample analysis and testing were completed by the Testing Center of the Institute of Hydrogeology and Environmental Geology, Chinese Academy of Geological Sciences. All samples were tested within one week after collection. pH was measured on-site using a Hach portable multi-parameter water quality meter (HACH HQ40d, Loveland, CO, USA). The concentration of total dissolved solids (TDS) was ascertained through the evaporative technique. For the quantification of sodium (Na+), potassium (K+), calcium (Ca2+), and magnesium (Mg2+), we employed atomic absorption spectrophotometry (Agilent7500ce, ICP-MS, Tokyo, Japan). Sulfate (SO42−), chloride (Cl), and nitrate (NO3) were quantified using ion chromatography (Perkin-ElmerLambda 35, Waltham, MA, USA), and HCO3 was determined by titration with hydrochloric acid.

2.3. Data Analysis

This study utilized SPSS 25.0 software for statistical calculations and analysis of the data, including mean, standard deviation, and principal component analysis. Origin 2022 was employed for plotting the ion ratio diagrams, and ArcGIS 10.5 was used for mapping the sampling sites in the study area.

3. Results and Analysis

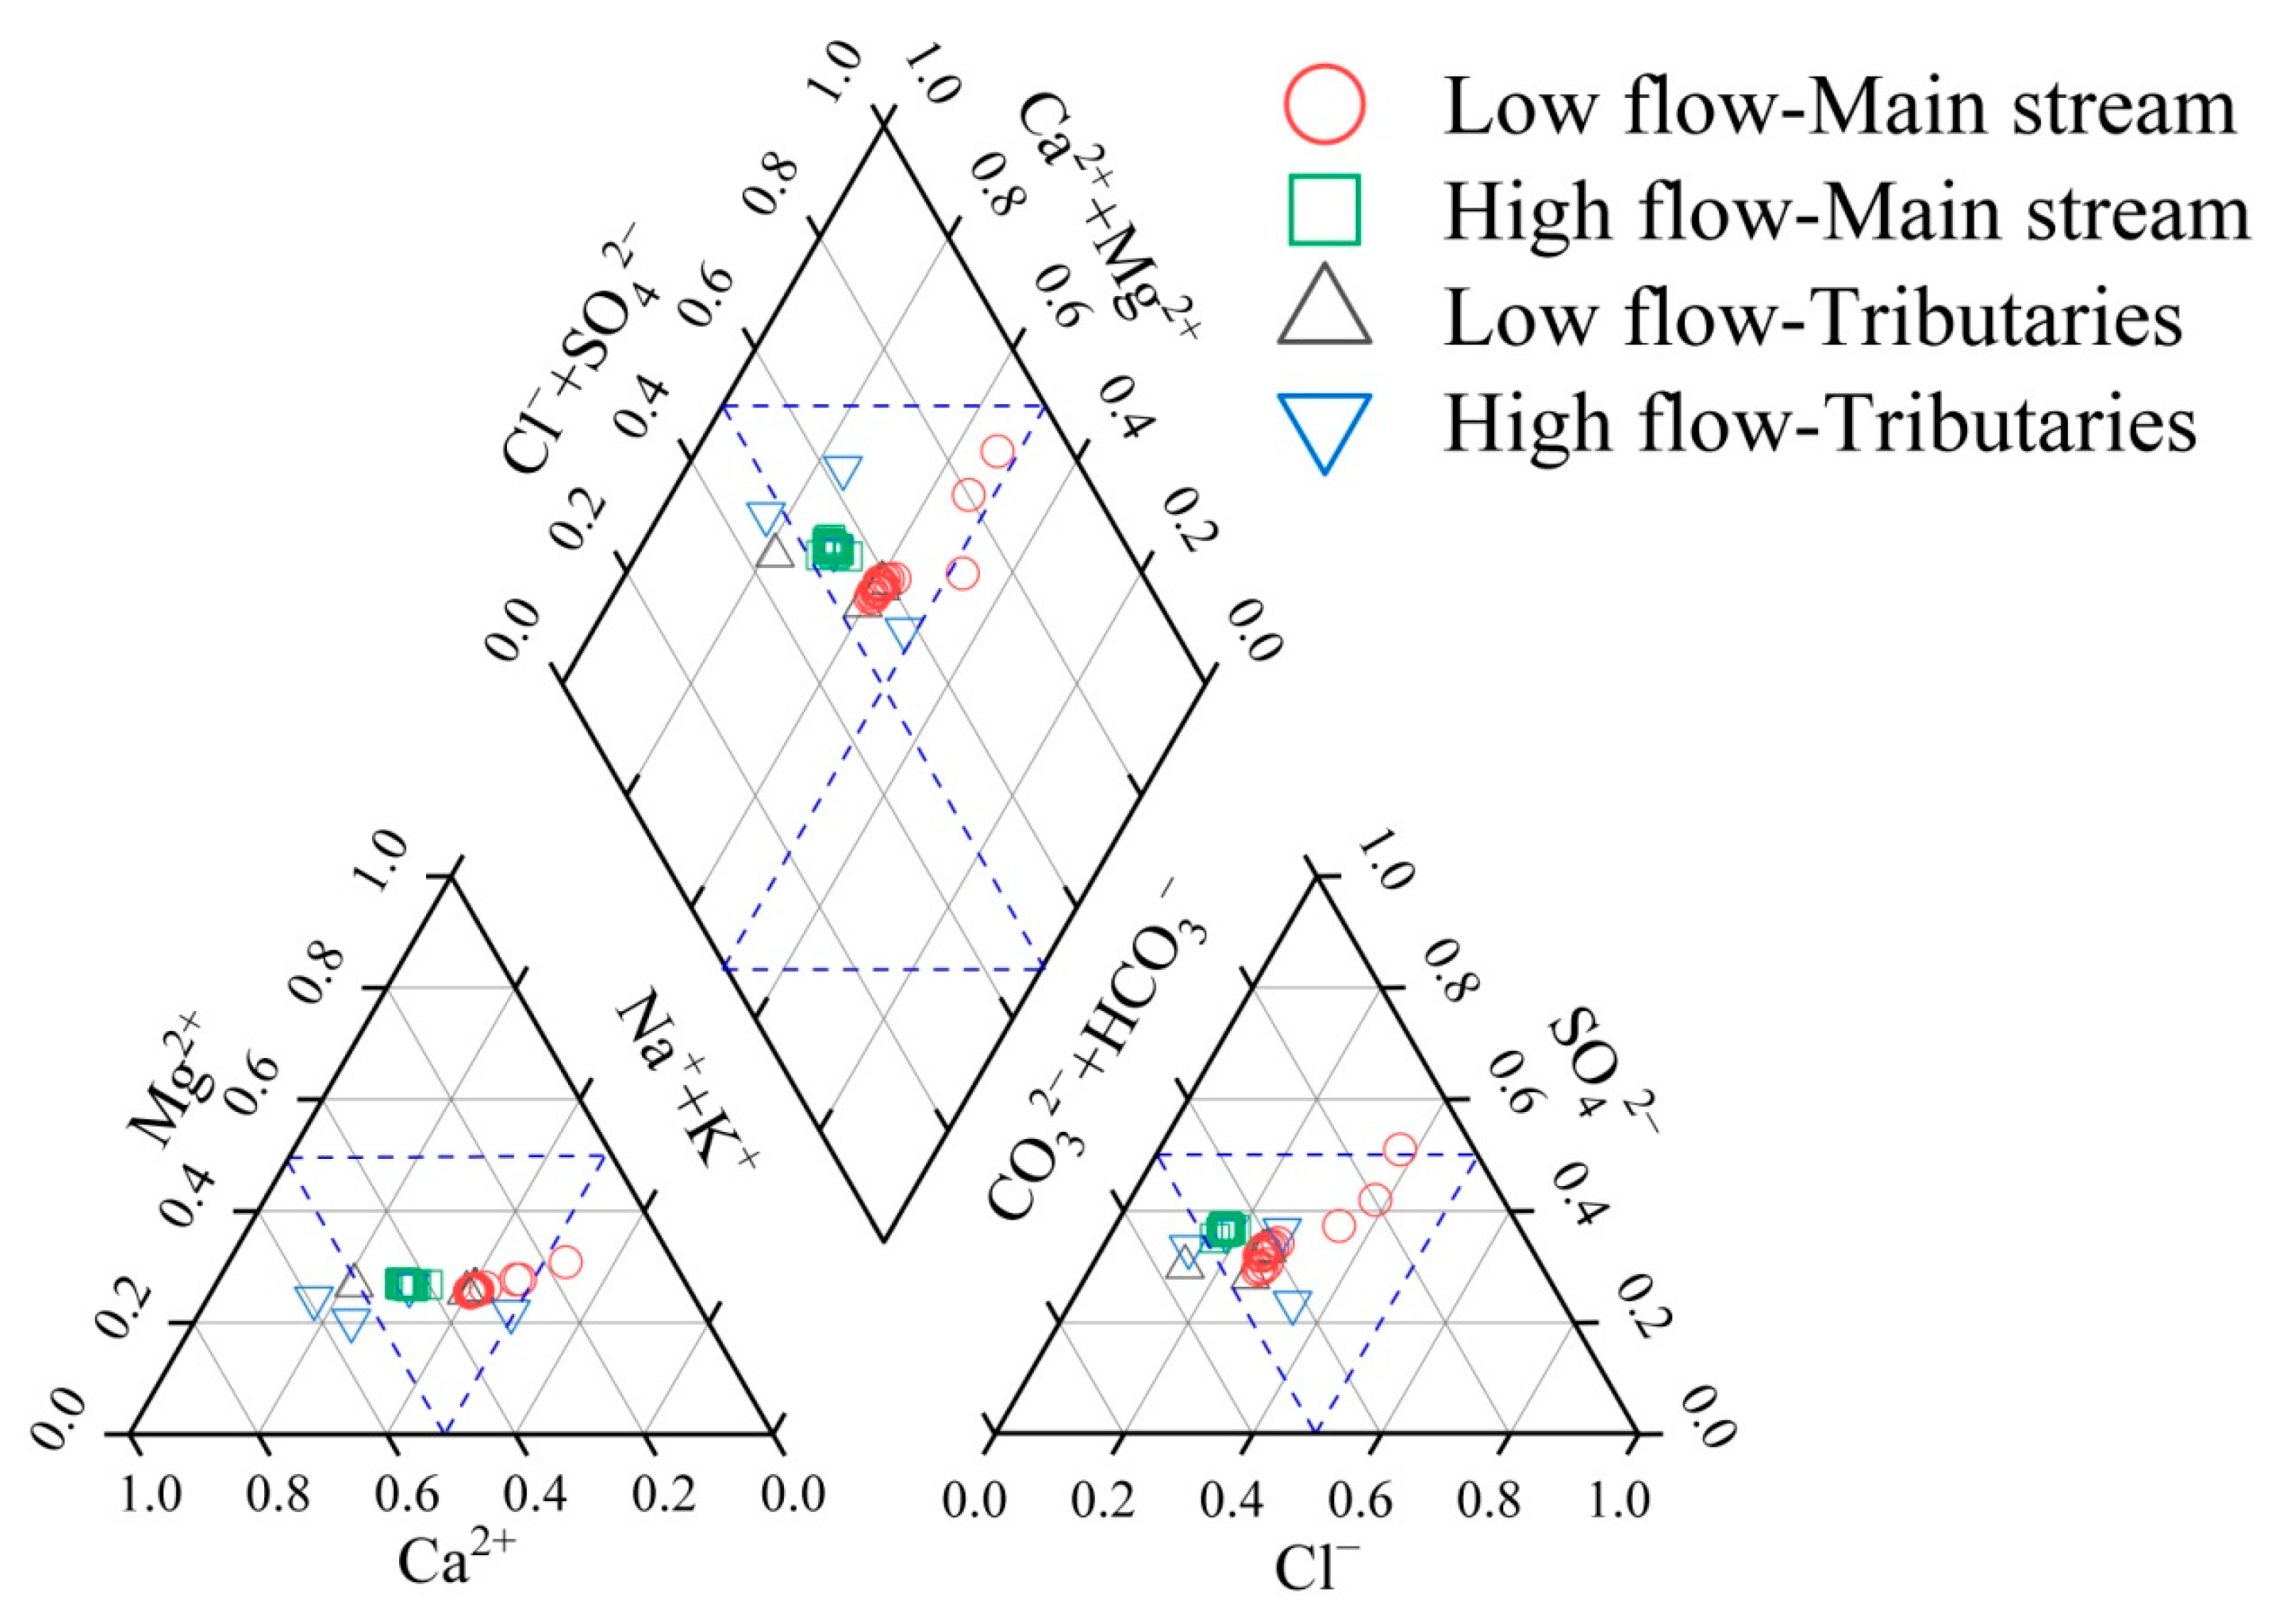
3.1. Characteristics of the Hydrochemical Components in the Lower Yellow River

The statistical analysis results of the hydrochemical components in the lower Yellow River are presented in Table 1. The results were checked using the ion balance method, and it was found that the inorganic ion balance constant [NICB = (TZ+ − TZ)/TZ+ × 100%] for all water samples was within ±5%. This suggests that the concentrations of dissolved cations and anions within the water are in equilibrium, validating the authenticity and dependability of the water quality analysis outcomes.
The pH range of the main stream of the Yellow River is between 7.09 and 8.10, with an average of 7.42 ± 0.313, showing weak alkalinity. The main cations are Na+ and Ca2+, with average values of 74.3 ± 20.7 mg/L and 66.8 ± 1.69 mg/L, respectively, while the main anions are HCO3 and SO42−, with average values of 230 ± 27.0 mg/L and 141 ± 14.5 mg/L, respectively. Among them, Cl and Na+ have a larger range of variation, while pH and K+ show less variation. The pH range of the Yellow River tributaries is similar to that of the main stream, between 7.09 and 8.14, with an average of 7.65, also showing weak alkalinity. The main cations and anions are consistent with the main stream, being Na+ and Ca2+ for cations and HCO3 and SO42− for anions, with concentrations similar to those in the main stream ions. However, the coefficient of variation for all hydrochemical components in the tributaries is greater than those in the main stream, indicating that the hydrochemical components of the tributaries are more influenced by human activities and different geological backgrounds. The predominant hydrochemical classifications for both the main stem and the tributaries of the Yellow River are characterized as HCO3·SO4—Ca·Na·Mg-type water (Figure 2).

3.2. Temporal Variation Characteristics of Hydrochemical Components in the Lower Yellow River

The temporal variation in hydrochemical components in the lower Yellow River mainly exhibits two patterns (Supplementary Figure S1). The first pattern is that the concentration of hydrochemical components during the low-flow season is greater than that during the high-flow season, with representative indicators being K+, Na+, Ca2+, Mg2+, Cl, SO42−, and HCO3. This variation is primarily influenced by the dilution effect of rainfall. The second pattern shows that the concentration during the high-flow season is greater than that during the low-flow season, with the representative indicator being NO3. This variation is mainly related to the flushing effect of rainfall, which is primarily attributable to the fact that rainfall runoff washes nitrogen fertilizer from the soil into the rivers, leading to an increase in the concentration of NO3 in the river during the high-flow season [1].

3.3. Spatial Variation Characteristics of Hydrochemical Components in the Lower Yellow River

During the low flow season, the spatial variation in hydrochemical components in the lower Yellow River is primarily influenced by human activities within the basin, showing a significant spatial fluctuation (Supplementary Figure S1). There are two specific patterns observed: The first pattern is that hydrochemical components show a fluctuating upward trend from upstream to downstream, with representative indicators being TDS, K+, Ca2+, HCO3, SO42−, and NO3. These indicators are significantly impacted by anthropogenic influences along the river’s course, such as the discharge of domestic sewage. The second pattern is that the concentration of hydrochemical components shows a slight downward trend from upstream to downstream, with representative indicators being Na+, Mg2+, and Cl.
During the high-flow season, the spatial variation in hydrochemical components in the lower Yellow River is influenced by a combination of human activities within the basin, rainfall-runoff, and the drainage and sediment flushing from the Xiaolangdi Reservoir. Overall, there is less spatial fluctuation, which is related to the large discharge volume of the Xiaolangdi Reservoir (1500 m3/s), which has a significant dilution effect on the spatial variation in hydrochemical components. There are two specific patterns observed: The first pattern is that hydrochemical components show a fluctuating slightly upward trend from upstream to downstream, with representative indicators being Ca2+, HCO3, and NO3. The second pattern is that hydrochemical components show a slight downward trend from upstream to downstream, with representative indicators being TDS, K+, Na+, SO42−, Mg2+, and Cl.

4. Discussion

4.1. Comparison of Hydrochemical Components between the Lower Yellow River and Other Major Rivers, Both Domestically and Internationally

The Yellow River is renowned for its unique high-sediment-laden flow, and its hydrochemical composition significantly differs from other rivers around the world. The water quality characteristics of the Yellow River are mainly influenced by the geological features of the Loess Plateau within its basin and intense human activities, leading to the particularity of its hydrochemical components [19]. Compared to the Yangtze River, Lancang River, and Yarlung Tsangpo River, which all also originate from the Qinghai–Tibet Plateau and share a similar geological background, the hydrochemical components of the Yellow River are generally higher than these three rivers, especially the concentrations of nitrate and sulfate, which are an order of magnitude higher (Table 2). This is mainly related to the intense human activities in the lower reaches of the Yellow River [14]. Chen et al. [20] found that the increase in nitrogen concentration in the Yellow River basin is closely related to regional population density, farmland area, and the degree of industrialization. The Yarlung Tsangpo River mainly flows through the Tibet Autonomous Region, and the Lancang River basin mainly flows through Qinghai Province, Tibet Autonomous Region, and Yunnan provinces in China. The population densities of these three provinces were 8, 3, and 123 people per square kilometer in 2021, respectively. However, the population densities in the downstream provinces of the Yellow River basin, such as Henan and Shandong Province, are respectively as high as 577 and 638 people/km2. Moreover, the development of industry and agriculture in the Lancang River and Yarlung Tsangpo River basins is significantly less than that in the Yellow River basin. In addition, although human activities in the Yangtze River basin are also intense, agricultural activities in the Yellow River basin are more intense than those in the Yangtze River basin. For example, the Yellow River flows through the Hetao Plain—an agricultural irrigation area, and the largest grain storage of China—Henan Province, whose agricultural activities have a stronger impact on the river’s hydrochemistry than those of the Yangtze River. Therefore, the concentrations of hydrochemical components in the Yellow River are higher than in these three rivers. Compared to the Nile Delta (20.1 mg/L) and the Thames River (21.9 mg/L), the concentration of nitrate in the Yellow River (2.15 mg/L) is slightly lower, but the concentration of sulfate in the Yellow River is significantly higher. This is mainly related to the high background of sulfate in the Yellow River basin (the strata contain a large amount of sulfide minerals) and the impact of industrial activities [20].

4.2. Identification of Hydrochemical Component Sources in the Lower Yellow River

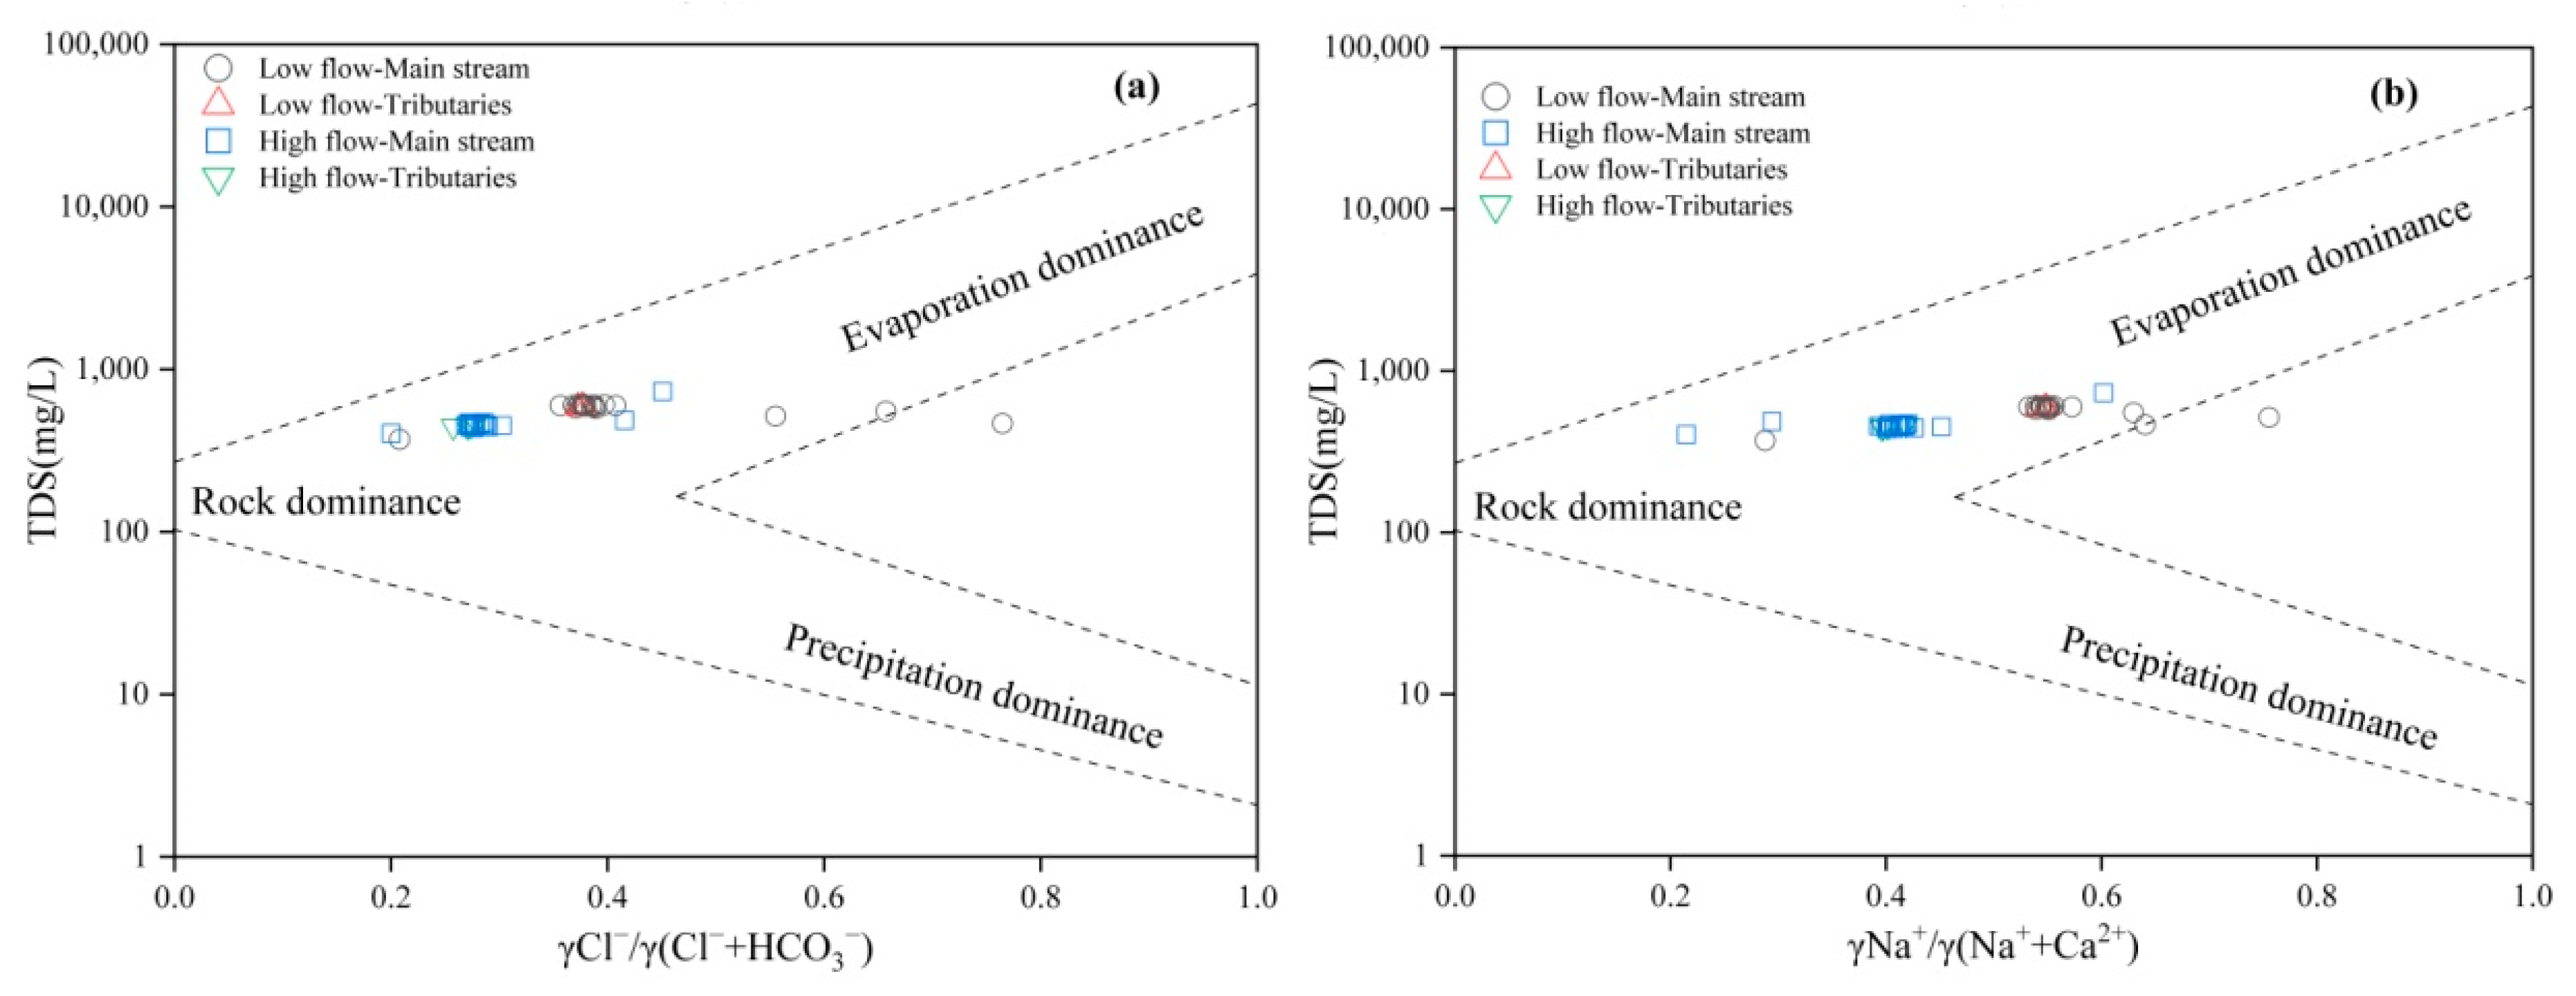
4.2.1. Identification of Hydrochemical Component Sources in the Lower Yellow River Using the Gibbs Diagram

The Gibbs diagram is a useful tool for reflecting the sources of various ions in natural waters (atmospheric precipitation, rock weathering, and evaporation concentration effects) and their evolutionary processes, and it has been widely applied [24]. As shown in Figure 3, in the relationships between TDS and [Cl]/([Cl] + [HCO3]) and TDS with [Na+]/([Na+] + [Ca2+]), most water samples from both the low- and high-flow seasons fall within the rock weathering and evaporation concentration control zones. During the low-flow season, three water samples are closer to the evaporation concentration control zone, and two points are outside the Gibbs diagram frame; during the high-flow season, one tributary and one main stream water sample are close to the evaporation concentration control zone. This indicates that rock weathering and evaporation concentration are the main controlling factors for the hydrochemical components in the lower Yellow River. Previous research has found that the ion components of surface water are basically located within the Gibbs diagram frame, but when influenced by human activities (such as industrial or mining development), water samples may also fall outside the frame [3], indicating that the variation in hydrochemical components in the lower Yellow River is also affected by human activities.

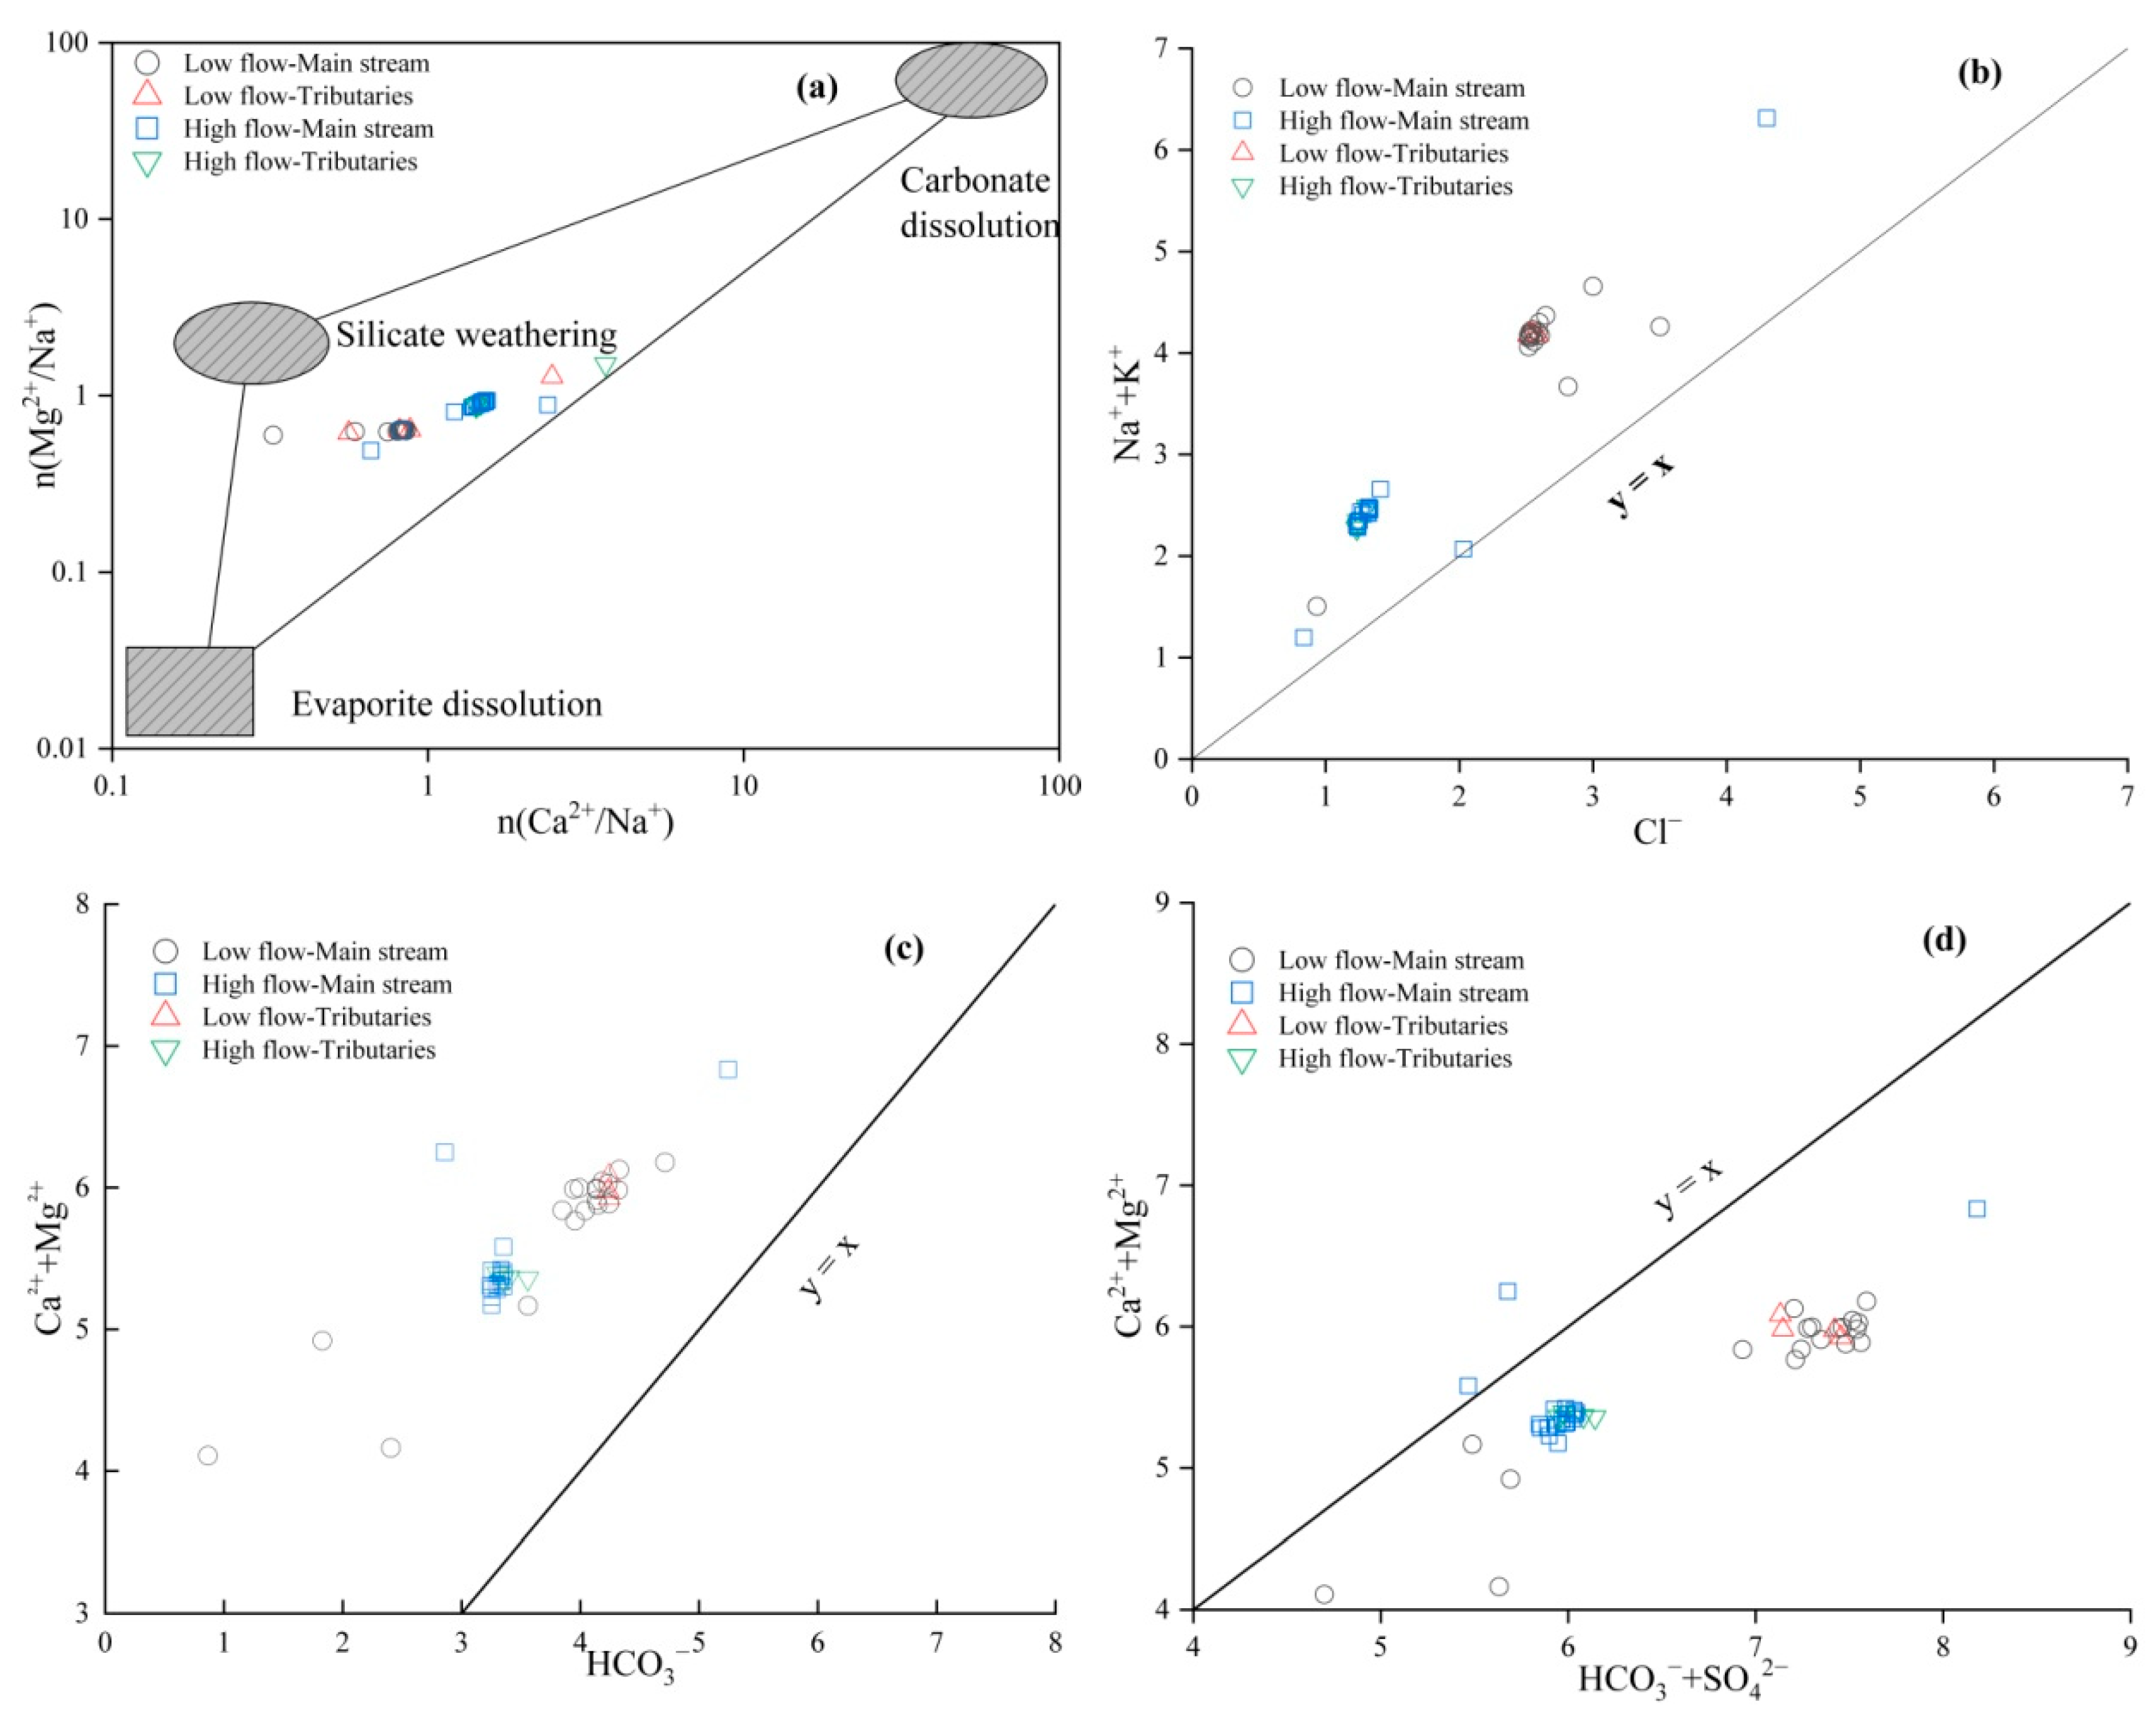
4.2.2. Sources of Hydrochemical Components in the Lower Yellow River—Ion Ratio Method

In natural river water, Ca2+, Mg2+, and HCO3 mainly originate from the dissolution of carbonate rocks, silicate rocks, and evaporite rocks; SO42− and Cl primarily come from the dissolution of evaporite rocks, and Na+ and K+ are primarily sourced from the dissolution of evaporite and silicate rocks [25]. Therefore, the source of each ion can be inferred based on their ratios.
Typically, the sources of Ca2+, Na+, and Mg2+ in water bodies are determined by the relationship between [Mg2+]/[Na+] and [Ca2+]/[Na+] [26]. As shown in Figure 4a, the main stream of the study area during both the low- and high-flow seasons is primarily located at the carbonate and silicate end-members, while the tributary water samples are close to the carbonate end-member. This is consistent with the geological background of increased carbonate and silicate rock content in the loess of the lower Yellow River region. This suggests that Ca2+, Na+, and Mg2+ in the river are predominantly a result of the weathering of carbonate and silicate rocks. Meanwhile, the process of evaporite rock dissolution is more pronounced in the regions of the river’s tributaries.
Through the ratio of [K+ + Na+]/[Cl], the sources of K+ and Na+ can be determined. As shown in Figure 4b, the [K+ + Na+]/[Cl] ratios of the Yellow River water downstream are all greater than one and exhibit a certain correlation, indicating that in addition to being sourced from the dissolution of evaporite rocks, the weathering and dissolution of silicate rocks may also be a source of K+ and Na+. According to the ratio of [Ca2+ + Mg2+]/[HCO3], the effects of carbonate and silicate minerals on the formation of hydrochemical constituents can be discerned [27]. Figure 4c demonstrates that the water samples collected from the study area predominantly plot above the 1:1 ratio line and have a good correlation, reflecting the dominant characteristic of carbonate rock weathering [28]. At the same time, Ca2+ and Mg2+ cannot be completely balanced by HCO3, and some Ca2+ and Mg2+ may come from the dissolution of silicate rocks or evaporite rocks. The ratio of [Ca2+ + Mg2+]/[HCO3 + SO42−] can reflect the source of SO42−. As shown in Figure 4d, the equivalent concentration of [HCO3 + SO42−] is higher than that of [Ca2+ + Mg2+], and the two are well correlated, indicating that SO42− and some Ca2+, Mg2+ are from the same source. In addition to being sourced from the dissolution of evaporite rocks, they may also be influenced by industrial activities.

4.3. Impact of Human Activities on Hydrochemical Components in the Lower Yellow River

The Cl, SO42−, and NO3 in the aquatic environment are often used as characteristic pollutants indicating anthropogenic inputs. SO42− primarily originates from industrial activities, while Cl and NO3 are influenced by agricultural activities and domestic sewage [29]. The source of NO3 can be determined based on the ratio of [NO3]/[Cl] to [Cl]. Generally, high Cl concentrations and low [NO3]/[Cl] indicate fecal and domestic sewage, low Cl concentrations and high [NO3]/[Cl] indicate agricultural activity, and low Cl concentrations with low [NO3]/[Cl] indicate the source of soil organic nitrogen [30]. As shown in Figure 5a, the low-flow season has a higher Cl concentration and a low [NO3]/[Cl], indicating that the river water is affected by domestic sewage during the low-flow season; the high-flow season has a lower concentration of Cl and a high [NO3]/[Cl], indicating a stronger influence of agricultural activities. In addition, Cl and NO3 show a clear positive correlation (Figure 5b), suggesting that the sources of the two are both different and the same. The nitrate in the Yellow River comes from domestic sewage and fertilizers, so the Cl may mainly come from manure.
Previous analysis has shown that the SO42− in the surface water of the study area mainly comes from the dissolution of evaporite rocks and is also affected by the discharge of industrial wastewater. The impact of different human activities on surface water can be further determined through the relationship between [SO42−]/[Ca2+] and [NO3]/[Ca2+]. Industrial activities have a higher [SO42−]/[Ca2+], while agricultural activities have a high [NO3]/[Ca2+] [21]. As shown in Figure 5c, overall, [SO42−]/[Ca2+] is significantly higher than [NO3]/[Ca2+], indicating that the SO42− in the Yellow River may be affected by industrial activities, and the influence of industrial activities is greater during the high-flow season than during the low-flow season.

4.4. Identification of Dominant Factors Controlling Hydrochemistry in the Lower Yellow River

This study applied principal component analysis (PCA) to further identify the dominant factors controlling the hydrochemistry of the lower Yellow River. Nine water-quality parameters (K+, Na+, Ca2+, Mg2+, Cl, SO42−, HCO3, NO3, and TDS) were selected for PCA analysis during the low- and high-water periods. Kaiser–Meyer–Olkin (KMO) and Bartlett’s test of sphericity were conducted on the study data. The KMO values for the low- and high-water periods were 0.767 and 0.788, respectively, and Bartlett’s test values were 228 (p < 0.001) and 361 (p < 0.001), indicating that the hydrochemical data of the Yellow River met the requirements for principal component analysis for both hydrological periods. Based on the eigenvalue > 1, two principal factors controlling the evolution of hydrochemistry during the low- and high-water periods were identified, which explained 79.5% and 95.1% of all variables, respectively, and could represent all the information of the nine hydrochemical indicators (Table 3 and Table 4).
During the low-flow season, the first principal component (PC1) explained 37.4% of the total variance (Table 3). The indicators showing a strong positive correlation with PC1 included K+, Cl, and SO42−, while those showing a strong negative correlation were Ca2+, TDS, and HCO3. As mentioned in Section 3, the Cl during the low-water period mainly comes from manure, and HCO3 mainly comes from the weathering and dissolution of carbonates, while SO42− primarily comes from the dissolution of evaporite rocks and industrial activities. Therefore, PC1 represents the control factors of hydrochemical components, which were carbonate weathering, evaporite dissolution, and industrial activities. The indicators showing a strong positive correlation with PC2 were NO3, Mg2+, and Na+. Generally, NO3 in the aquatic environment mainly comes from domestic sewage, fertilizers, soil nitrogen, rainfall, etc. [31]. In this study, it was confirmed that NO3 in the Yellow River during the low-flow season mainly comes from domestic sewage, while Na+ and Mg2+ mainly come from the weathering and dissolution of silicate rocks. Therefore, PC2 represents the control factors of hydrochemical components, which were silicate weathering and domestic sewage.
During the high-flow season, the PC1 explained 74.9% of the total variance (Table 4). The indicators showing a strong positive correlation with PC1 included SO42−, Mg2+, HCO3, TDS, K+, Cl, and Na+. As mentioned earlier, K+ and Na+ during the high-flow season mainly come from the weathering and dissolution of evaporite rocks, HCO3 mainly comes from carbonate dissolution, Cl during the high-flow season mainly comes from the discharge of manure, and SO42− primarily comes from the dissolution of evaporite rocks and industrial wastewater discharge. Therefore, PC1 represents the control factors of hydrochemical components, which were carbonate weathering, evaporite dissolution, and industrial activities. The indicators showing a strong positive correlation with PC2 were NO3 and Ca2+. In this study, it was confirmed that NO3 in the Yellow River during the high-flow season mainly comes from agricultural activities and domestic sewage. Therefore, PC2 represents the control factors of hydrochemical components, which were agricultural activities and domestic sewage.

5. Conclusions

This study, taking the lower reaches of the Yellow River as an example, deeply analyzed the patterns of change in river hydrochemical components and controlling factors under strong human disturbance, revealing the comprehensive impact of natural geological background and human activities on water quality. The study found that the river is influenced by a combination of rainfall and human activities, leading to significant seasonal variations in hydrochemical components between the low- and high-flow seasons. Compared with major rivers domestically and internationally, the concentration of hydrochemical components in the lower Yellow River is relatively high, which may be related to the weathering of evaporite rocks in the upper reaches, agricultural irrigation, and intense human activities in the middle and lower reaches. Through principal component analysis, this study identified the main factors controlling the evolution of hydrochemistry during the low- and high-flow seasons, providing a scientific basis for understanding hydrochemical processes. However, there are some limitations to the study, such as not fully considering the impact of seasonal climate changes on the river’s hydrochemical components, not using advanced source tracing methods (such as multiple isotopes combined source tracing technology to quantitatively analyze the sources of hydrochemical components, and not discussing the biogeochemical cycles of the elements). Future research needs to combine advanced isotopic tracing techniques and machine learning methods to conduct high-precision research on the evolution laws, and source identification of hydrochemical substances in the Yellow River Basin. This will provide more comprehensive scientific support for water resource management and ecological and environmental protection in the lower reaches of the Yellow River and the entire Yellow River Basin.

Supplementary Materials

The following supporting information can be downloaded at: https://www.mdpi.com/article/10.3390/w16131886/s1, Figure S1: The spatiotemporal variation of the hydrochemical composition of the lower Yellow River.

Author Contributions

C.R.: Investigation, Methodology, Software, Data curation, Writing—Original draft preparation. L.L.: Supervision, Methodology, Writing—Reviewing and Editing, Software, Supervision. All authors have read and agreed to the published version of the manuscript.

Funding

This work was supported by the Henan Province Science and Technology Development Plan Project (242102321117) and Nanyang Institute of Technology Doctoral Research Startup Fund Project (NGBJ-2023-35) and China Geological Survey, China (Grant No. DD20221773).

Data Availability Statement

The data are available from the authors upon reasonable request.

Acknowledgments

The authors gratefully acknowledge the editor and anonymous reviewers for their valuable comments on this manuscript. The authors also appreciate the financial support from the different organizations.

Conflicts of Interest

The authors declare no conflicts of interest.

References

  1. Zhang, Q.Q.; Zhang, J.; Wang, H.W.; Zhai, T.L.; Liu, L.; Li, G.; Xu, Z. Spatial Patterns in Water Quality and Source Apportionment in a Typical Cascade Development River in Southwestern China Using PMF Modeling and Multivariate Statistical Techniques. Chemosphere 2023, 311, 137139. [Google Scholar] [CrossRef] [PubMed]
  2. Nguyen, T.A.; Le, D.C.; Nguyen, T.N.; Britta, S.; Tran, L.L. Influences of key factors on river water quality in urban and rural areas: A review. Case Stud. Chem. Environ. Eng. 2023, 8, 100424. [Google Scholar]
  3. Ren, C.; Zhang, Q.Q. Groundwater Chemical Characteristics and Controlling Factors in a Region of Northern China with Intensive Human Activity. Int. J. Environ. Res. Public Health 2020, 23, 9126. [Google Scholar] [CrossRef] [PubMed]
  4. Liu, J.; Han, G.; Liu, M.; Zeng, J.; Liang, B.; Qu, R. Distribution, Sources and Water Quality Evaluation of the Riverine Solutes: A Case Study in the Lancangjiang River Basin, Tibetan Plateau. Int. J. Environ. Res. Public Health 2019, 16, 4670. [Google Scholar] [CrossRef] [PubMed]
  5. Wang, L.Q.; Han, X.X.; Zhang, Y.Y.; Zhang, Q.; Wan, X.M.; Liang, T.; Song, H.; Bolan, N.; Shaheen, S.M.; White, J.R.; et al. Impacts of land uses on spatio-temporal variations of seasonal water quality in a regulated river basin, Huai River, China. Sci. Total Environ. 2023, 857, 159584. [Google Scholar] [CrossRef] [PubMed]
  6. Ren, X.; Zhang, Z.; Yu, R.; Li, Y.; Li, Y.; Zhao, Y. Hydrochemical Variations and Driving Mechanisms in a Large Linked River-Irrigation-Lake System. Environ. Res. 2023, 225, 115596. [Google Scholar] [CrossRef] [PubMed]
  7. Zhang, H.Y.; Han, X.; Wang, G.C.; Mao, H.; Chen, X.L.; Zhou, L.; Huang, D.D.; Zhang, F.; Yan, X. Spatial distribution and driving factors of groundwater chemistry and pollution in an oil production region in the Northwest China. Sci. Total Environ. 2023, 875, 162635. [Google Scholar] [CrossRef] [PubMed]
  8. You, J.; Qi, Y.; Shao, G.; Ma, C. Geochemical Characteristics and Controlling Factors of Groundwater Chemical Composition in the Zihe River Source Area, Shandong, China. Water 2024, 16, 298. [Google Scholar] [CrossRef]
  9. Xie, C.; Liu, H.; Li, X.R.; Zhao, H.C.; Dong, X.Y.; Ma, K.K.; Wang, N.L.; Zhao, L.J. Spatial characteristics of hydrochemistry and stable isotopes in river and groundwater, and runoff components in the Shule River Basin, Northeastern of Tibet Plateau. J. Environ. Manag. 2024, 349, 119512. [Google Scholar] [CrossRef]
  10. Zhang, Q.; Zhang, D.; Zhang, F.; Xiao, J. Seasonal Variation in River Water Chemistry of the Middle Reaches of the Yellow River and Its Controlling Factors. J. Geochem. Explor. 2015, 156, 101–113. [Google Scholar] [CrossRef]
  11. Jiang, H.; Zhang, Q.; Liu, W.; Zhang, J.; Xu, Z. Climatic and Anthropogenic Driving Forces of the Nitrogen Cycling in a Subtropical River Basin. Environ. Res. 2021, 194, 110721. [Google Scholar] [CrossRef] [PubMed]
  12. Mbaye, M.L.; Gaye, A.T.; Spitzy, A.; Dähnke, K.; Gaye, B. Seasonal and Spatial Variation in Suspended Matter, Organic Carbon, Nitrogen, and Nutrient Concentrations of the Senegal River in West Africa. Limnologica 2016, 57, 1–13. [Google Scholar] [CrossRef]
  13. Zhang, W.; Jin, X.; Liu, D.; Lang, C.; Shan, B. Temporal and Spatial Variation of Nitrogen and Phosphorus and Eutrophication Assessment for a Typical Arid River—Fuyang River in Northern China. J. Environ. Sci. 2017, 55, 41–48. [Google Scholar] [CrossRef] [PubMed]
  14. Zhang, Q.Q.; Wang, H.W.; Liu, L.; Zhai, T.L.; Zhang, X.Q. Multiple Isotopes Reveal the Driving Mechanism of High NO3− Level and Key Processes of Nitrogen Cycling in the Lower Reaches of Yellow River. J. Environ. Sci. 2024, 138, 597–606. [Google Scholar] [CrossRef] [PubMed]
  15. Yue, F.J.; Li, S.L.; Liu, C.Q.; Zhao, Z.Q.; Ding, H. Tracing Nitrate Sources with Dual Isotopes and Long-Term Monitoring of Nitrogen Species in the Yellow River, China. Sci. Rep. 2017, 7, 506. [Google Scholar] [CrossRef] [PubMed]
  16. Wu, N.; Liu, S.M.; Zhang, G.L.; Zhang, H.M. Anthropogenic Impacts on Nutrient Variability in the Lower Yellow River. Sci. Total Environ. 2021, 755, 142488. [Google Scholar] [CrossRef] [PubMed]
  17. Wang, H.; Yang, Z.; Saito, Y.; Liu, J.P.; Sun, X.; Wang, Y. Stepwise Decreases of the Huanghe (Yellow River) Sediment Load (1950–2005): Impacts of Climate Change and Human Activities. Glob. Planet. Change 2007, 57, 331–354. [Google Scholar] [CrossRef]
  18. Zhang, Q.Q.; Wang, X.; Wan, W.; Hou, P.; Li, R.; Ouyang, Z. The Spatial-Temporal Pattern and Source Apportionment of Water Pollution in a Trans-Urban River. Pol. J. Environ. Stud. 2015, 24, 841–851. [Google Scholar]
  19. Chen, J.; Wang, F.; Xia, X.; Zhang, L. Major Element Chemistry of the Changjiang (Yangtze River). Chem. Geol. 2002, 187, 231–255. [Google Scholar] [CrossRef]
  20. Wang, H.W.; Zhang, Q.Q. Research Advances in Identifying Sulfate Contamination Sources of Water Environment by Using Stable Isotopes. Int. J. Environ. Res. Public Health 2019, 16, 1914. [Google Scholar] [CrossRef]
  21. Hu, M.; Wang, Y.; Du, P.; Shui, Y.; Cai, A.; Lv, C.; Bao, Y. Tracing the sources of nitrate in the rivers and lakes of the southern areas of the Tibetan Plateau using dual nitrate isotopes. Sci. Total Environ. 2019, 658, 132–140. [Google Scholar] [CrossRef] [PubMed]
  22. Taher, M.E.S.; Ghoneium, A.M.; Hopcroft, R.R.; ElTohamy, W.S. Temporal and spatial variations of surface water quality in the Nile River of Damietta Region, Egypt. Environ. Monit. Assess. 2021, 193, 1–18. [Google Scholar] [CrossRef] [PubMed]
  23. Neal, C.; Neal, M.; Hill, L.; Wickham, H. The water quality of the River Thame in the Thames Basin of south/south-eastern England. Sci. Total Environ. 2006, 360, 254–271. [Google Scholar] [CrossRef] [PubMed]
  24. Li, P.Y.; Wu, J.H.; Qian, H. Assessment of Groundwater Quality for Irrigation Purposes and Identification of Hydrogeochemical Evolution Mechanisms in Pengyang County, China. Environ. Earth Sci. 2013, 69, 2211–2225. [Google Scholar] [CrossRef]
  25. Jin, Z.; Qin, X.; Chen, L.; Jin, M.; Li, F. Using Dual Isotopes to Evaluate Sources and Transformations of Nitrate in the West Lake Watershed, Eastern China. J. Contam. Hydrol. 2015, 177–178, 64–75. [Google Scholar] [CrossRef] [PubMed]
  26. Wang, L.; Zhang, Q.Q.; Wang, H.W. Rapid Urbanization Has Changed the Driving Factors of Groundwater Chemical Evolution in the Large Groundwater Depression Funnel Area of Northern China. Water 2023, 15, 2917. [Google Scholar] [CrossRef]
  27. Wang, H.W.; Guo, X.J.; Zhang, Q.Q.; Li, B.Y. Evolution of Groundwater Hydrochemical Characteristics and Origin Analysis in Hutuo River Basin. Environ. Chem. 2021, 40, 3838–3845. (In Chinese) [Google Scholar]
  28. Mayo, A.L.; Loucks, M.D. Solute and Isotopic Geochemistry and Groundwater Flow in the Central Wasatch Range, Utah. J. Hydrol. 1995, 172, 31–59. [Google Scholar] [CrossRef]
  29. Zhang, Q.Q.; Wang, H.W. Assessment of Sources and Transformation of Nitrate in the Alluvial-Pluvial Fan Region of North China Using a Multi-Isotope Approach. J. Environ. Sci. 2020, 32, 9–22. [Google Scholar] [CrossRef]
  30. Liu, W.; Jiang, H.; Guo, X.; Li, Y.; Xu, Z. Time-Series Monitoring of River Hydrochemistry and Multiple Isotope Signals in the Yarlung Tsangpo River Reveals a Hydrological Domination of Fluvial Nitrate Fluxes in the Tibetan Plateau. Water Res. 2022, 225, 119098. [Google Scholar] [CrossRef]
  31. Xue, D.; Botte, J.; Baets, B.D.; Accoe, F.; Nestler, A.; Taylor, P.; Boeckx, P. Present Limitations and Future Prospects of Stable Isotope Methods for Nitrate Source Identification in Surface and Groundwater. Water Res. 2009, 43, 1159–1170. [Google Scholar] [CrossRef] [PubMed]
Figure 1. Distribution map of river sample sites.
Water 16 01886 g001
Figure 2. Piper map of river water in the Lower Yellow River Water.
Water 16 01886 g002
Figure 3. Gibbs diagram of water ions from sampling points in the study area: (a) Cl/(Cl + HCO3) vs. TDS; (b) Na+/(Na+ + Ca2+) vs. TDS.
Water 16 01886 g003
Figure 4. Relationship of Major Ion Concentrations in the Lower Yellow River Water: (a) (Ca2+/Na+) vs. (Mg2+/Na+); (b) Cl vs. (Na+ + K+); (c) [HCO3] vs. [Ca2+ + Mg2+]; (d) [HCO3 + SO42−] vs. [Ca2+ + Mg2+].
Water 16 01886 g004
Figure 5. Variational Relationships of [Cl] and [NO3]/[Cl] (a), and Variables [NO3]/[Na+] and [SO42−]/[Na+] (b), and [NO3]/[Ca2+] and [SO42−]/[Ca2+] (c) in the Lower Yellow River Water Body.
Water 16 01886 g005
Table 1. Statistical characteristics of the hydrochemical composition of the lower Yellow River.
ParameterspHK⁺Na⁺Ca2Mg2ClSO₄2−HCO₃NO₃TDS
MainstreamMin (mg/L)7.093.7450.162.124.143.812419811.1437
Max (mg/L)8.104.2998.171.531.994.016328818.2608
Mean (mg/L)7.423.9674.366.828.069.214123015.1529
SD (mg/L)0.3130.14820.71.693.3322.614.527.02.1570.8
CV (%)4.223.7527.82.5311.932.710.311.714.213.4
TributaryMin (mg/L)7.093.8024.929.319.629.892.652.87.94371
Max (mg/L)8.1414.2113791.334.815318632023.2731
Mean (mg/L)7.656.7470.962.526.183.014018015.7497
SD (mg/L)0.353.1136.720.25.4742.231.974.65.18103
CV (%)4.5746.151.832.420.950.922.841.533.120.8
Note: pH, dimensionless; Min = Minimum; Max= Maximum; SD = Standard deviation; CV = Coefficient of variation.
Table 2. Comparison of major ion concentrations in the lower Yellow River with other domestic and international Rivers.
RiverK+ + Na+Ca2+Mg2+SO42−ClNO3
This study60.164.1 26.2 106 64.215.1
Yangtze River [19]8.2034.17.6011.72.903.44
Lancang River [1]20.648.1710.7263.0124.82.52
Yarlung Tsangpo River [21]29.63.290.54
Nile Delta [22]44.840.016.630.136.420.1
Thames River [23]9.4039.01245.6073.321.9
Table 3. Principal component analysis of major ions during the low-flow season.
ParametersPC1PC2
K⁺0.966−0.137
Cl⁻0.9620.099
HCO₃⁻−0.957−0.255
Ca2−0.759−0.607
SO₄20.707−0.209
TDS−0.674−0.516
Na⁺0.2270.922
Mg2−0.1550.875
NO₃⁻0.0010.621
Eigenvalue4.812.34
Total variance (%)53.526.0
Cumulative (%)53.579.5
Table 4. Principal component analysis of major ions during the high-flow season.
ParametersPC1PC2
SO₄20.992−0.029
Mg20.9910.001
TDS0.9880.052
Cl⁻0.987−0.116
Na⁺0.983−0.167
HCO₃⁻0.9340.097
K⁺0.855−0.331
Ca20.2260.954
NO₃⁻−0.3660.898
Eigenvalue6.741.82
Total variance (%)74.920.2
Cumulative (%)74.995.1
Disclaimer/Publisher’s Note: The statements, opinions and data contained in all publications are solely those of the individual author(s) and contributor(s) and not of MDPI and/or the editor(s). MDPI and/or the editor(s) disclaim responsibility for any injury to people or property resulting from any ideas, methods, instructions or products referred to in the content.

