Article

Long-Term Performance Evaluation and Fouling Characterization of a Full-Scale Brackish Water Reverse Osmosis Desalination Plant

1
Higher Institute of Water Sciences and Techniques, University of Gabès, Gabès 6072, Tunisia
2
Department of Electronic Engineering and Automation, University of Las Palmas de Gran Canaria, Campus Universitario de Tafira, E-35017 Las Palmas de Gran Canaria, Spain
*
Author to whom correspondence should be addressed.
Water 2024, 16(13), 1892; https://doi.org/10.3390/w16131892
Submission received: 5 June 2024 / Revised: 19 June 2024 / Accepted: 27 June 2024 / Published: 1 July 2024
(This article belongs to the Topic Membrane Separation Technology Research)

Abstract

:
Water scarcity in Tunisia’s semi-arid regions necessitates advanced brackish water desalination solutions. This study evaluates the long-term performance and fouling characteristics of the largest brackish water reverse osmosis desalination plant in southern Tunisia over a period of 5026 days. The plant employs two-stage spiral-wound membrane elements to treat groundwater with a salinity of 3.2 g L−1. The pre-treatment process includes oxidation, sand filtration, and cartridge filtration, along with polyphosphonate antiscalant dosing. Membrane performance was assessed through the analysis of operational data, standardization of permeate flow (Qps) and salt passage (SPs), and the calculation of water (A), solute (B), and ionic (Bj) permeability coefficients. Over the operational period, there was an increase in operating pressure, pressure drop, and permeate conductivity, accompanied by a gradual increase in SPs as well as in the solute B and ionic Bj permeability coefficients. The average B increased by 82%, reflecting a decrease in solute rejection over time. Additionally, the ionic permeability coefficients for both SO42− and Cl ions increased, with Cl showing an 88% increase and SO42− showing an 87% increase. The produced water’s salinity increased by 67%, indicating a significant loss of membrane performance. To identify the cause of these problems, membrane characterization was analyzed using visual inspection, X-ray fluorescence (XRF), and Fourier transform infrared spectroscopy (FTIR). The characterization revealed the complex nature of the foulants, with a predominant presence of calcium sulfate, along with minor quantities of calcite, dolomite, and silica. The extent of CaSO4 deposition suggests poor antiscaling efficiency, highlighting the critical importance of selecting an effective antiscalant to mitigate membrane fouling.

1. Introduction

One of the most pressing issues facing the world today is freshwater scarcity, which affects around four billion people who live without water for at least one month of the year [1]. Population expansion and climate change contribute significantly to the freshwater scarcity problem [2], which is particularly severe in regions such as the Middle East, Southeast Asia, and North Africa [3,4]. In response to this crisis, membrane-based desalination technologies, notably reverse osmosis (RO), have become attractive solutions to balance freshwater supply and demand [5].
RO is the predominant technology for desalination of both brackish water and seawater due to its efficiency and reliability [6,7]. Despite its effectiveness, efforts are being made to improve RO technology in terms of efficiency [8,9], materials innovation for membrane manufacture [10,11,12], process optimization through modeling and simulation, and other strategies [13,14].
However, the main limiting factor affecting the performance of RO desalination plants, whether treating brackish water (BWRO) or seawater (SWRO), is membrane fouling [15,16]. Besides fouling, scaling is a limiting factor in BWRO, which significantly impacts membrane performance and requires costly maintenance or replacement. Maintaining RO performance requires addressing fouling with the right pretreatment techniques [17,18,19].
There are some authors who have studied the fouling impact on the performance of full-scale RO desalination plants over long-term operating periods. One of the ways to assess the impact of fouling on a desalination plant is through the decrease of the water permeability coefficient (A) or its reverse, the membrane resistance (Rm). For instance, Wilf and Klinko [20] observed a decrease in A ranging between 20 and 25% over three years of operation in different full-scale SWRO desalination plants, leading to the development of predictive models. Similarly, Abbas and Al-bastaki [21] observed a 25% decrease in A and a 1.9% decrease in solute rejection (Rej) in a full-scale BWRO desalination plant. Contrastingly, Belkacem et al. [22] reported a 20% increase over year in BWRO desalination plants employing recirculation.
Further research has published some studies reporting the long-term performance analysis of a full-scale BWRO desalination plant with notable declines in permeability coefficients [23,24] and increases in permeate conductivity observed over 10 and 15-year periods [23,24,25] Additionally, Adel et al. [26] investigated the performance of a full-scale SWRO desalination plant over 8 months, highlighting a gradual decline in performance and an increase in operational costs.
While membrane autopsy remains the most effective method for studying membrane fouling in full-scale reverse osmosis (RO) desalination plants, its use after long periods of operation is uncommon due to high costs and a lack of operational data. However, several studies have conducted membrane autopsies in both SWRO and BWRO desalination plants, highlighting the complex nature of fouling in RO desalination plants [26,27]. Tang et al. [28] conducted an autopsy of a full-scale BWRO membrane BW30LE-440DRY Filmtec™ (Filmtec Corporation, Minnetonka, MN, USA) after nearly a year of service, identifying organic–Al–P complexes, aluminum silicates, and polysaccharides as the main foulants. Similarly, Karime et al. [29] performed another autopsy of a full-scale BWRO membrane after 6 years of operation, revealing SiO2, clay, and calcium-based compounds attributed to antiscalant inefficiency. Yang et al. [30] and Kim et al. [31] further investigated the distribution and composition of foulants in BWRO membranes, highlighting the predominance of organic substances and inorganic deposits. Additionally, autopsies conducted by Ruiz-García et al. [32] revealed the presence of biofilm, calcium carbonate, and various inorganic substances as primary foulants. The primary foulants identified by Karmal et al. [33] were calcium carbonate crystals, specifically of the calcite variety (CaCO3). In a separate study by Tapiero et al. [34], the results of autopsies confirmed the existence of organic components such as polysaccharides and proteins, along with the presence of silica in the fouling layers.
Earlier work investigated the autopsy of RO membranes used in brackish or seawater desalination systems. However, this study is the first to present a membrane characterization with experimental data over a long operating period of 5026 days. The aim of this paper is to assess the performance of a specific full-scale BWRO under particular pretreatment conditions and varying feed water quality over time, with a focus on specific fouling potential during long-term operation.

2. Materials and Methods

2.1. Plant Description

The Dissa BWRO desalination plant (Figure 1), situated in Gabes, Tunisia, was established in 1995 to provide drinking water to Gabes city. Initially designed to produce around 937.5 m3 h−1, its capacity was increased to 1250 m3 h−1 in 2006. The desalination plant is supplied by a mix of two sources, the continental intercalary aquifer situated in the Chott El-Fejijj region and three groundwater wells near the station, which pump water from the North Gabes aquifer. The plant is designed for continuous operation 24 h a day, 7 days a week, throughout the year.
The plant’s pre-treatment, RO, and post-treatment stages are detailed below (Figure 2):
(1)
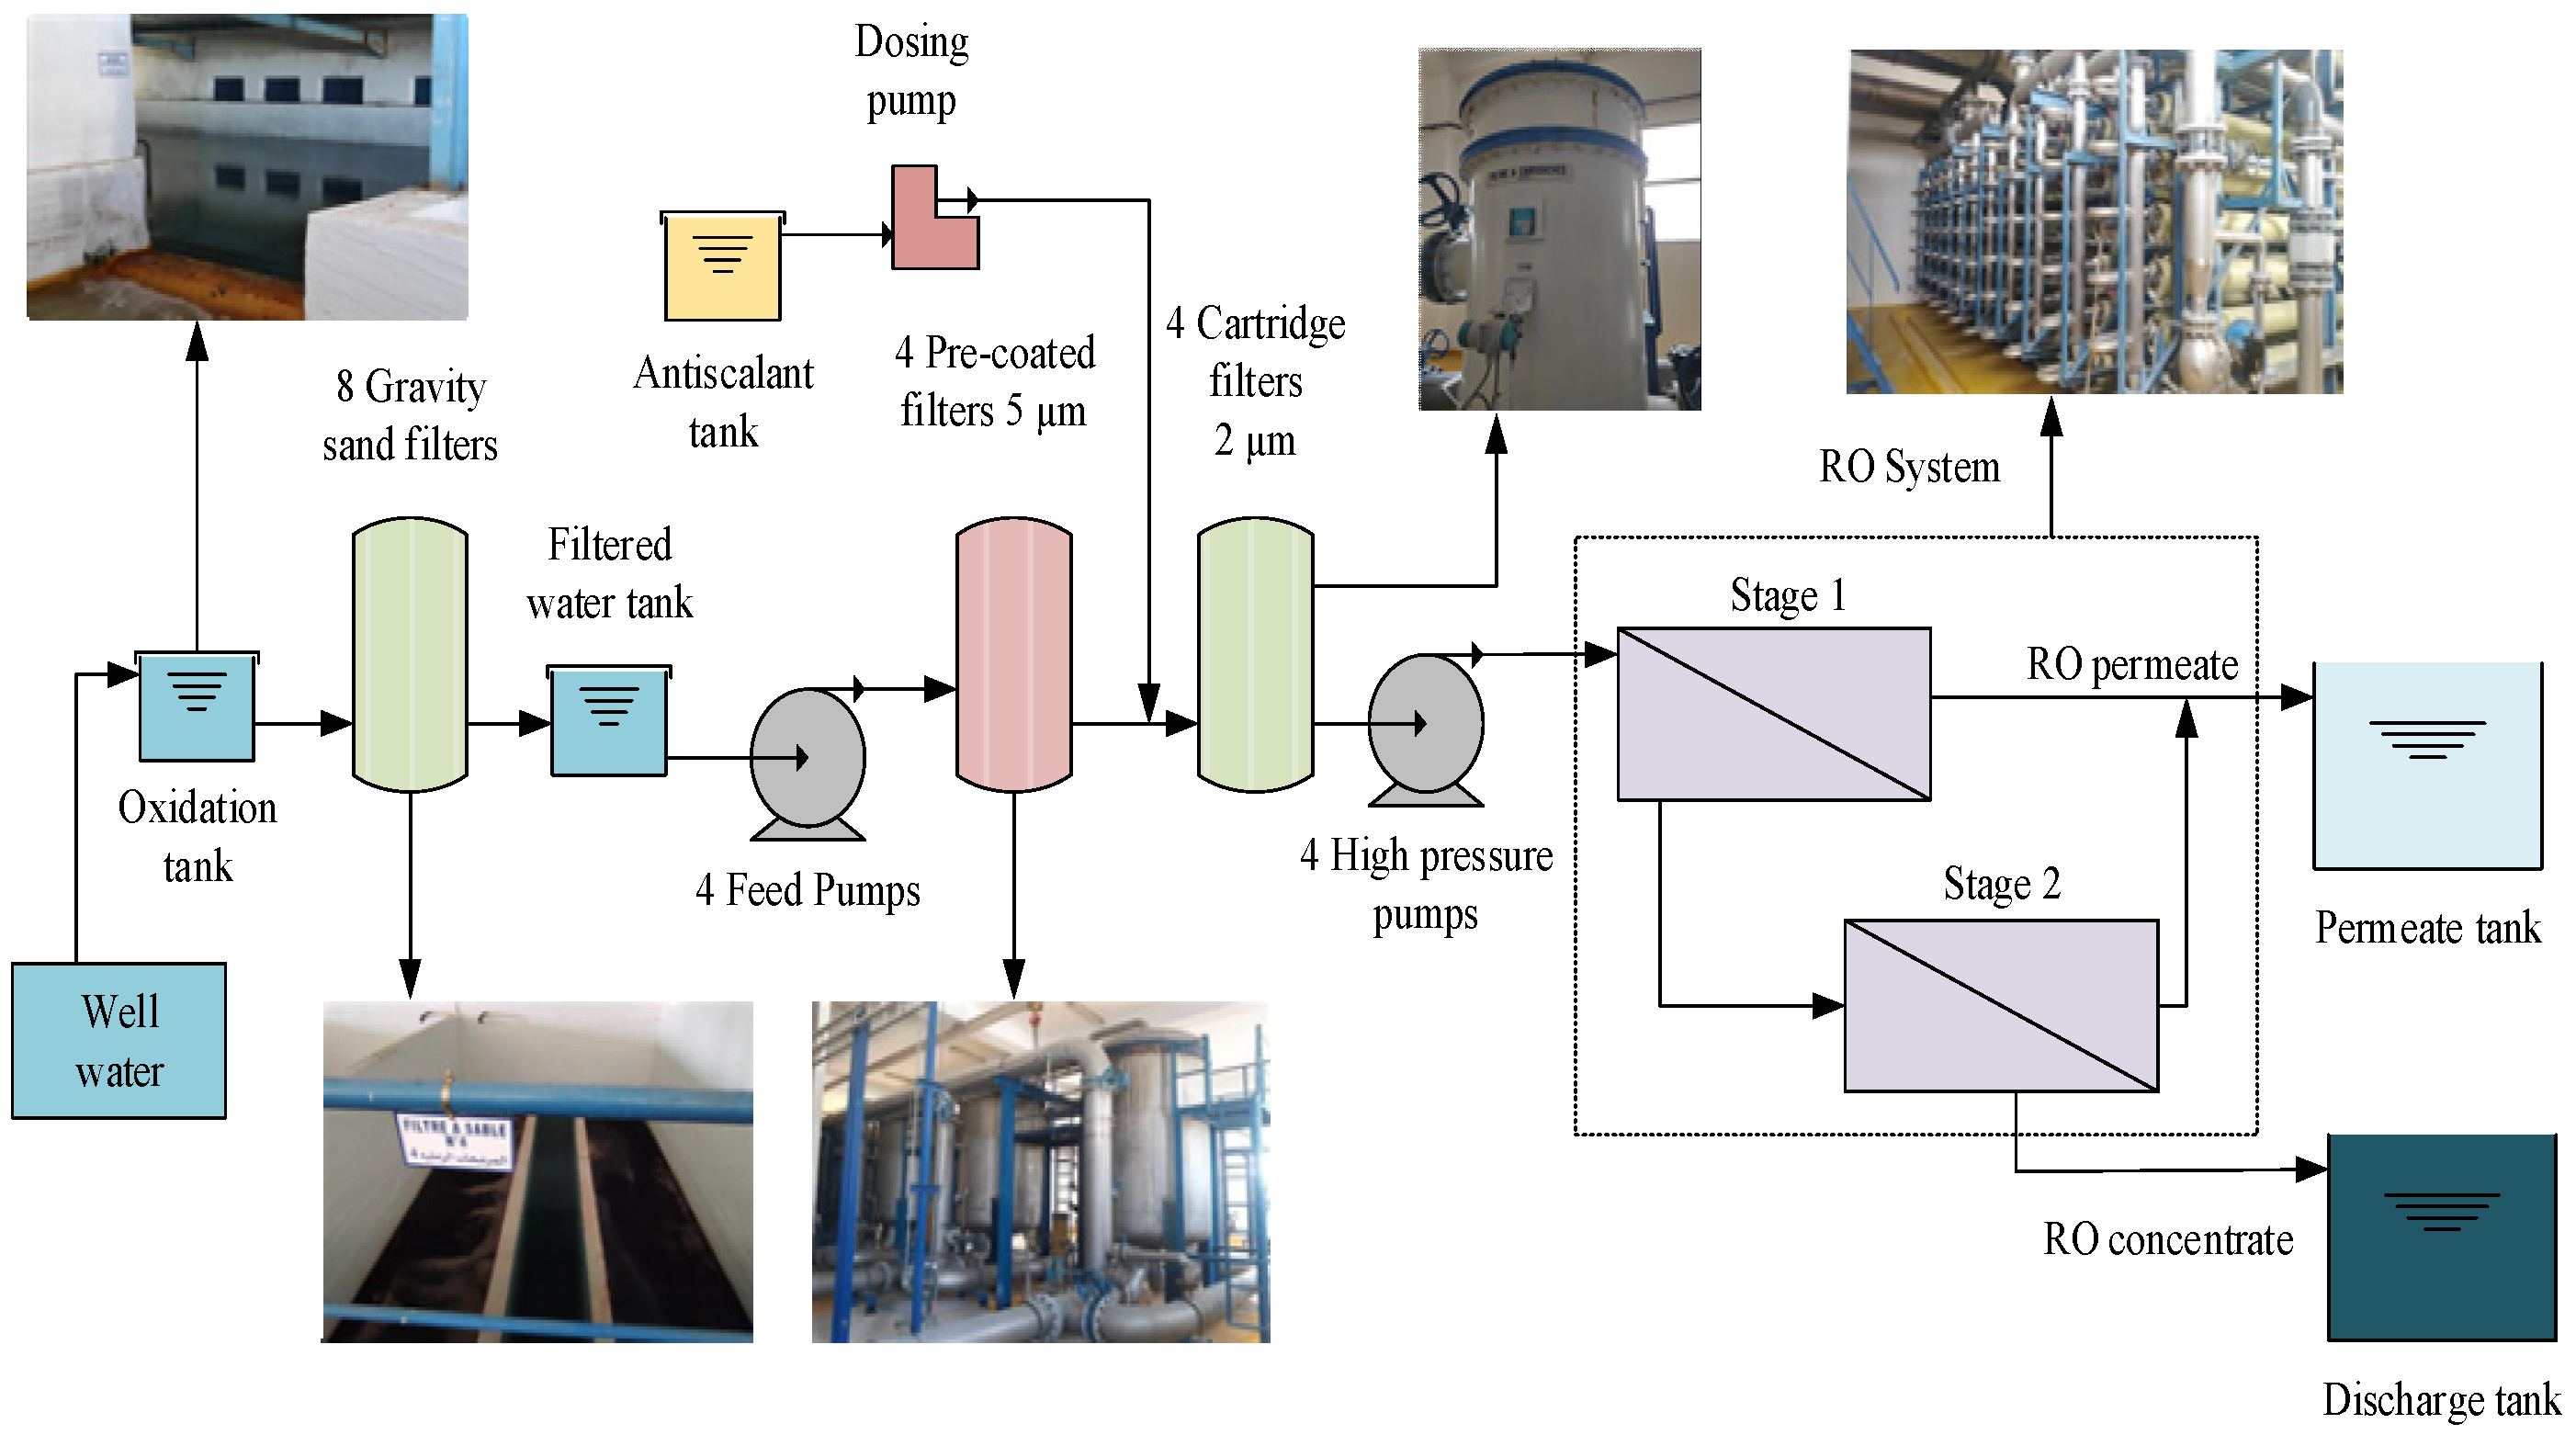
The pre-treatment phase begins with water oxidation in an aerated tank, followed by filtration through 8 slow sand filters. Each filter consists of two compartments fed by a central column from the oxidation basin, which retains suspended solids and iron oxides. After filtration, water is pumped through 4 pre-coated filters, at a flow rate of 480 m3 h−1, to eliminate impurities larger than 5 µm. Each vessel consists of 330 elements. Several types of antiscalants have been used to prevent scale formation (Polyphosphonate, Polyacroboxic, and Polyacrylate). The antiscalant dose corresponds to the dose at the feed. No additional chemical products have been added to this plant. The water is then subjected to micro-filtration by cartridge filters (1 µm), of which there are four. Each filter contains 102 cartridges, except for the fourth line, which contains 170 elements. Four high-pressure pumps, with an electric power motor with 350 kW for three lines and 200 kW for the fourth line, were installed to boost the filtered water through the BWRO system, with a feed flow ( Q f ) of 480 m3 h−1 each and a feed pressure ( p f ) of about 1.5 MPa.
(2)
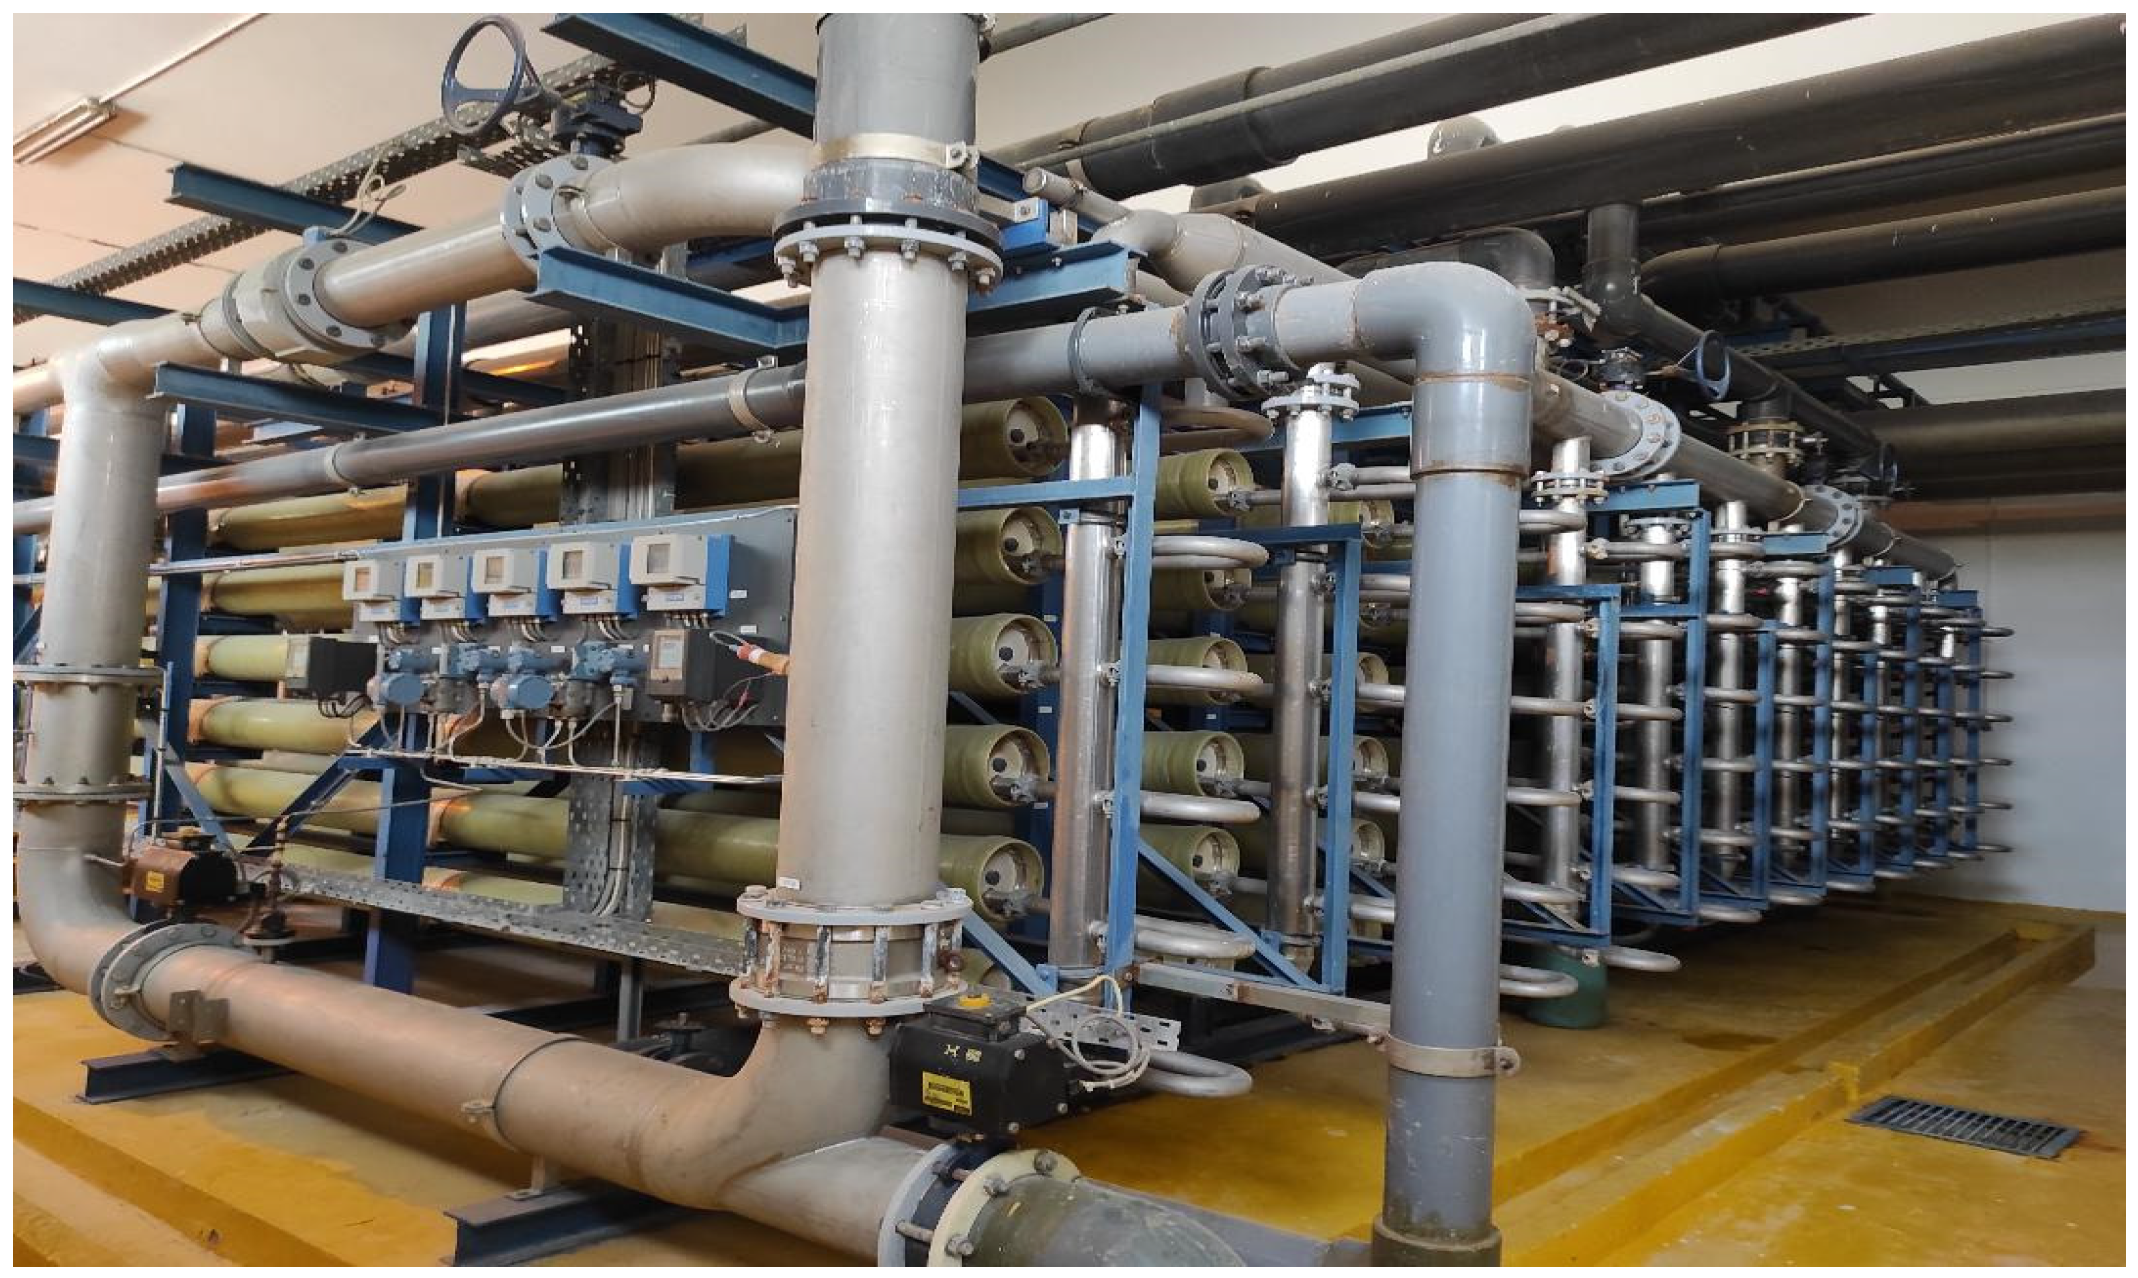
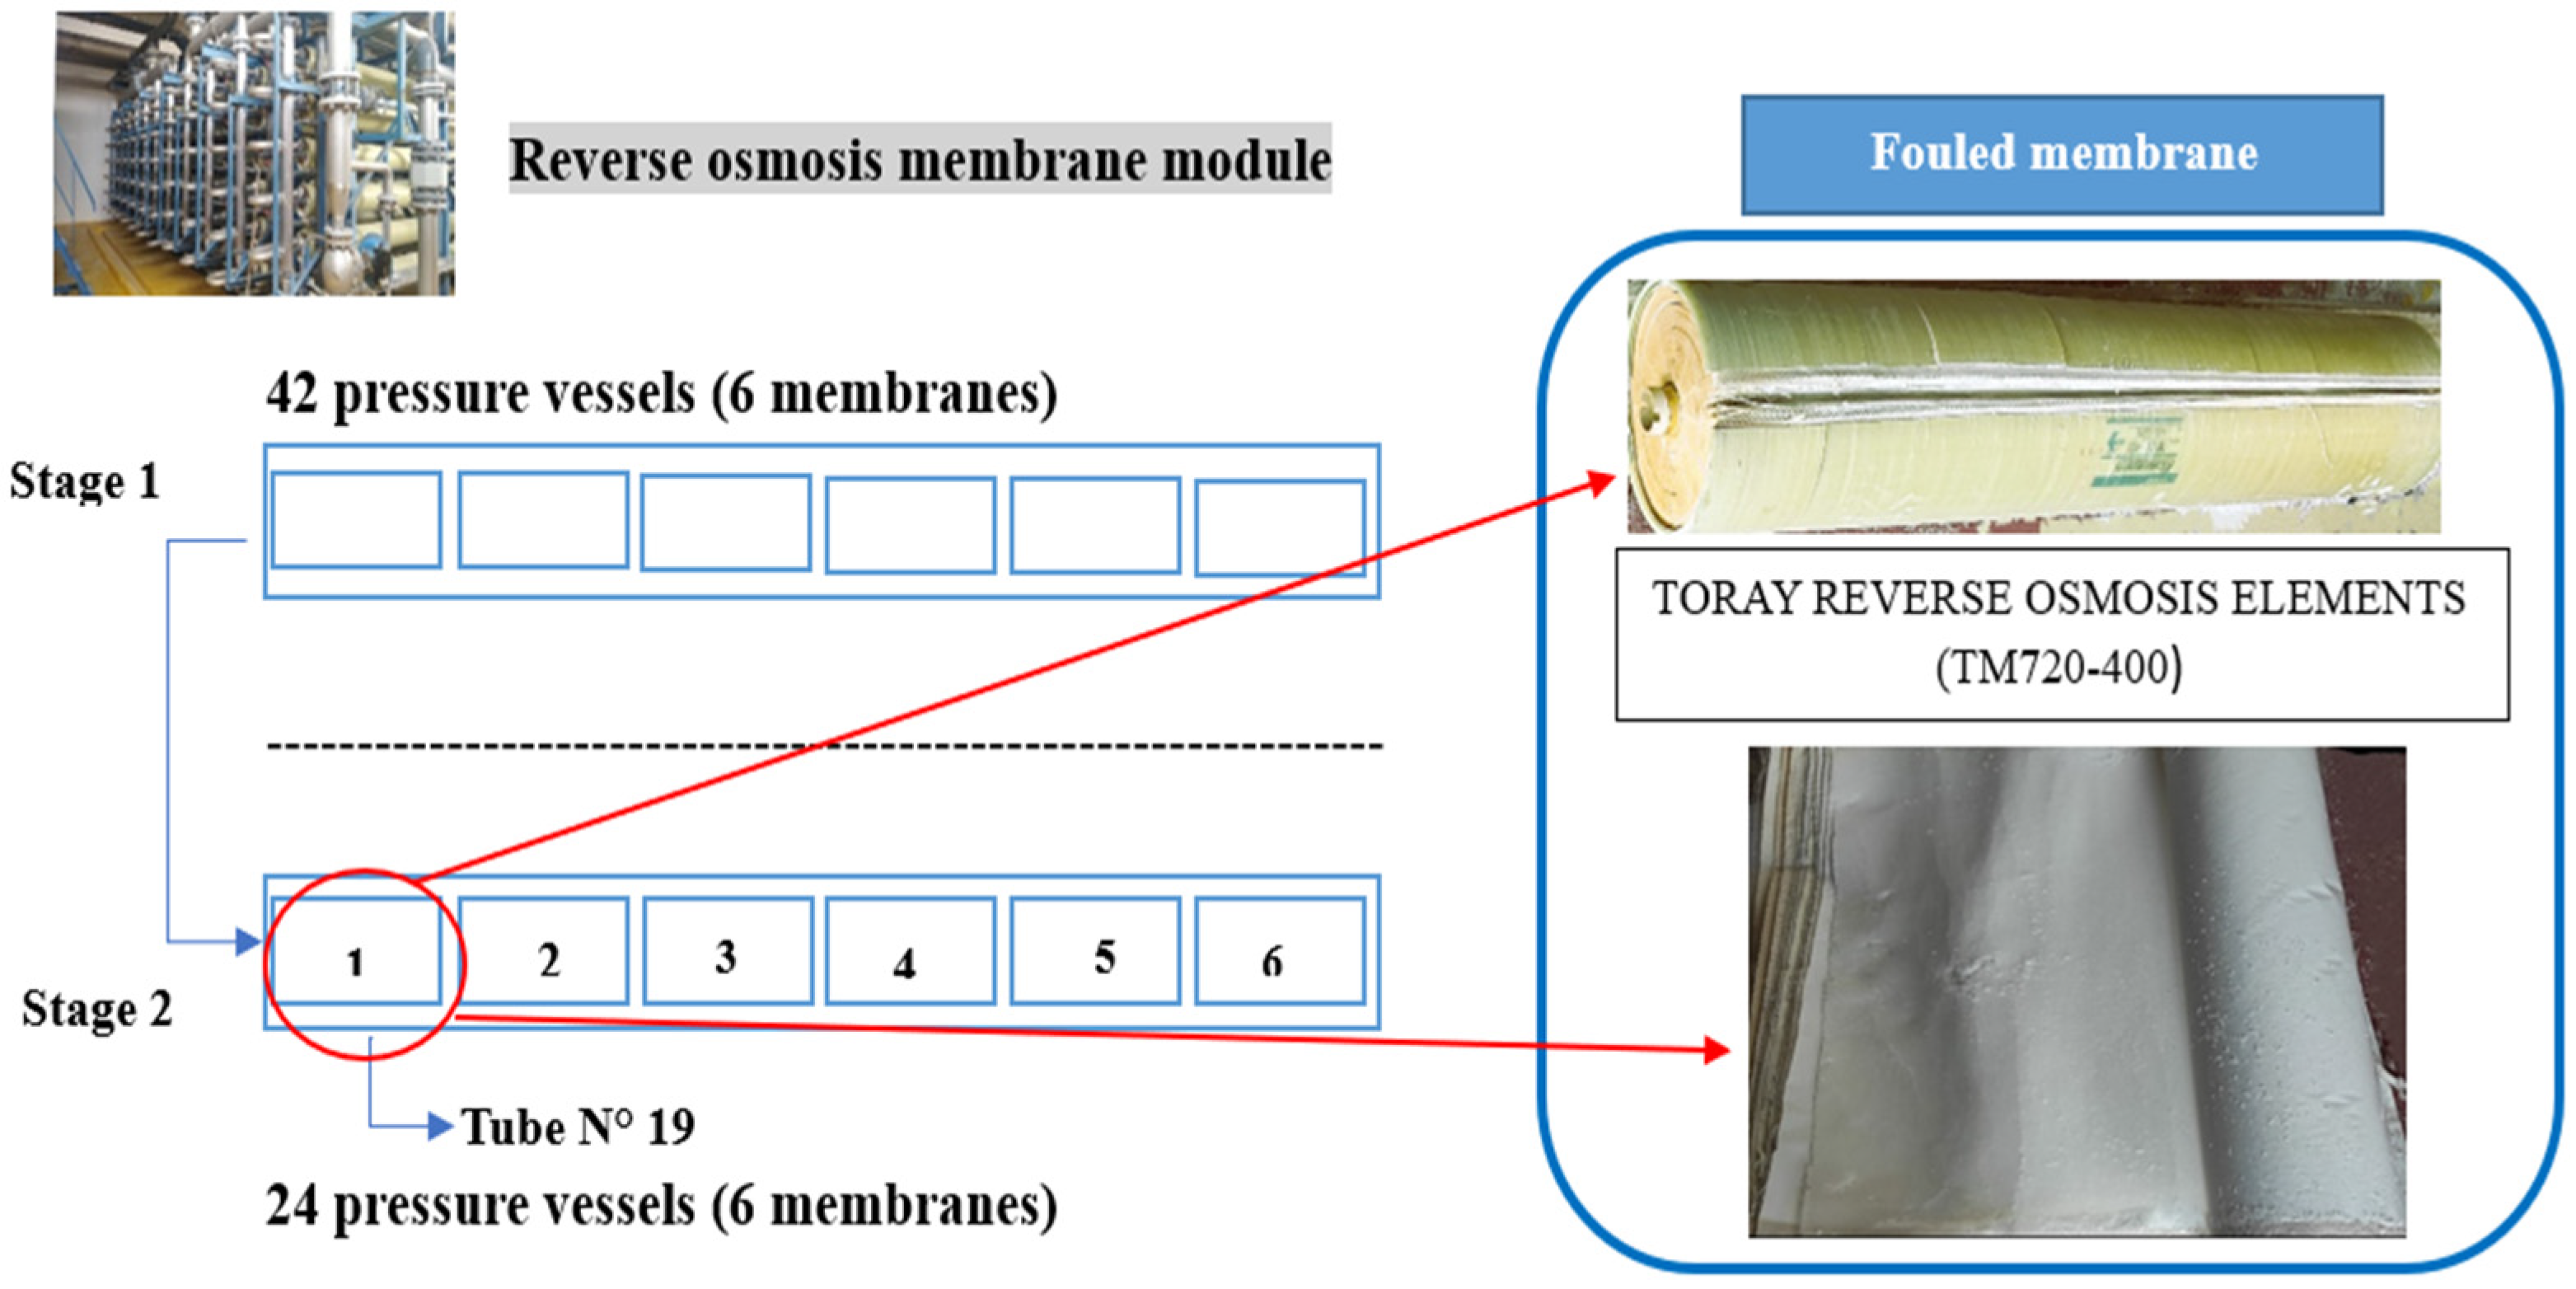
The BWRO system consists of four production lines with a total capacity of 1250 m3 h−1, the system uses spiral-wound BWRO membranes TORAY TM720-400 (Toray Industries, Inc., Tokyo, Japan) distributed over two stages. The first stage consists of 42 pressure vessels (PVs), and the rejection flow from this stage feeds the second stage, which consists of 24 PVs.
(3)
The final stage involves post-treatment, during which the pH of the permeate is adjusted by adding sodium hydroxide (NaOH) and removing CO2.
In this study only the second line was studied because it had a more continuous operation time (t). The operating data that were measured in the BWRO system of this line were C o n d f , T f , p f , Q f , Δ p , C o n d p , p p , and Q p , in both stages.

2.2. Method for Measuring Ion Species

pH is measured using a Consort pH meter. Turbidity is measured by a Micro 100 Th-Turbidity meter [35] and expressed in NTU. The determination of the concentrations of anions (chloride and sulfate) and cations (calcium, magnesium, sodium, and potassium) in water is carried out by liquid ion chromatography (Metrohm 850) [35]. Bicarbonate ions are determined by dosing with a solution of H2SO4 (0.02 N) in the presence of a colored indicator (methyl orange) [35]. The iron and silica concentrations are determined by a spectrophotometer of the HACH DR 3900 type [35]. Using a TOC-meter, total organic carbon (TOC) is measured in accordance with ISO 8245 (1999) [36].

2.3. Standardization of the Operating Data

Standardization of system performance is highly recommended, as it allows early identification of potential problems (e.g., scaling or fouling) if standardized data are checked daily. Corrective procedures are much more efficient when they are taken early [37]. Beside this, standardizing the operating data could be useful for comparing the performance of different RO desalination plants. The operating conditions of any RO desalination plant can vary, causing permeate flow rate ( Q p ) and salt passage ( S P ) to change. It is necessary to compare permeate flow and salt rejection data under the same operating conditions, so applying standardizing would allow us to achieve that. In the present study, the ASTM 4516-00 method [37] was employed to standardize the Q p , and S P [38,39].

2.3.1. Standardization of Q p

The Q ps refers to the permeate flow rate of a RO system that has been standardized with respect to changes in T , p and osmotic pressure ( π ) . Q ps was calculated using Equation (1) [38,39].
Q ps = Q pa p fs Δ p fbs 2 p ps π fbs + π ps p f Δ p fb 2 p p π fb + π p T C F s T C F
where p fs is the feed pressure (in bar), Δ p fbs the feed-brine pressure drop in both stages (in bar), p ps the permeate pressure (in bar), π fbs average feed-brine osmotic pressure (in bar), π ps the permeate osmotic pressure (in bar) and T C F s the temperature correction factor. All previous parameters at standard conditions respectively. The parameters in the denominator are those measured experimentally in the BWRO system. π fbs was obtained using the Equation (2) [37,39].
π fb = 0.2654 C fb T f + 273.15 1000 C fb 1000
where C fb is the feed-brine concentration in mg L−1 as NaCl and it was calculated using Equation (3) [37].
C fb = C f ln 1 1 Y Y
where Y is the fractional water flux recovery (it was determined from the operating data). Throughout t , 23 samples of the feedwater were taken to determine its inorganic composition and C f , however, the parameter that was actually measured was the C o n d f . The feed water samples allowed the creation of a relationship between C f and C o n d f , which allowed the estimation of C f for all operating points C f = 0.74 C o n d f . T C F was determined using Equations (4) and (5).
T C F = e 2640 1 298 1 273.15 + T ; T 25   ° C
T C F = e 3020 1 298 1 273.15 + T ; T 25   ° C

2.3.2. Standardization of S P

The standardized ( S P ) for RO process is calculated using Equation (6) [37,39].
S P s ( % ) = S P ( % ) Q p - ele Q ps - ele T C F T C F s C fb s C fb C f C fs
where Q ps - ele is the average element permeate flow.

2.4. Calculation of Permeability Coefficients and S E C

To assess the efficiency of the BWRO plant, the average A at 25 °C, the average B at 25 °C and the average ionic permeability coefficients ( B j ) at 25 °C were determined. These coefficients are described in the solution-diffusion model and were calculated using the Equations (7) and (8) [40,41].
S c = η ρ D
d h = 4 ε 2 h + ( 1 ε ) 8 h
with, S c denotes the Schmidt number, ρ represents density (kg m−3), D stands for the solute diffusivity (in m2 s−1), η represents the dynamic viscosity (in units of kg m−1 s−1), d h corresponds to the hydraulic diameter (m), and ε signifies the porosity of the cross-sectional area in the feed channel (with a value of 0.89 [42]), in addition, h represents the height of the feed channel, which was specifically 34 milli-inches, equivalent to 8.636 × 10⁴ m, for the BWRO membrane module TORAY TM720-400 (Toray Industries, Inc., Tokyo, Japan).
Equations (9)–(13) [43,44] were utilized to determine the values of η , ρ fb , and D for aqueous solutions of NaCl.
η fb = η w ( 1 + ( 5.185 × 10 5 T + 1.0675 × 10 4 ) ( ρ fb C fb / 1806.55 ) 0.5 + ( 3.300 × 10 5 T + 2.591 × 10 3 ) ( ρ fb / 1806.55 ) )
ρ fb = ρ w + ( 0.824493 4.0899 × 10 3 T + 7.6438 × 10 5 T 2 8.2467 × 10 7 T 3 + 5.3875 × 10 9 T 4 ) C fb + ( 5.72466 × 10 3 + 1.0227 × 10 4 T 1.6546 × 10 6 T 2 ) C fb 3 / 2 + 4.8314 × 10 4 C fb
ρ w = 999.842594 + 6.793952 × 10 2 T 9.09529 × 10 3 T 2 + 1.001685 × 10 4 T 3 1.120083 × 10 6 T 4 + 6.536336 × 10 9 T 5
log η w η 20 10 = 1.1709 ( 20 T ) 0.001827 ( T 20 ) 2 T + 89.93
D = 6.725 10 6 e 0.1546 C fb 2513 273.15 + T
where η fb (kg m−1 s −1) the dynamic viscosity, ρ fb (kg m−3) the feed-brine water density, C fb is the feed-brine concentration, ρ w is the density of pure water, and η w is the dynamic viscosity of pure water. The Sherwood number, S h , was calculated using Equation (14) [45].
S h = k d h D = 0.14 R e 0.64 S c 0.42
Re = ρ fb ν d h η fb
C m C p C f C p = exp J w / k
π = 0.0787 ( 273 + T ) m j
π m = π f C fb C f P F
P F = C m C fb
A = J w p f Δ p fb 2 p p π m + π p T C F
B = C p Q p C m C p S m T C F
where k , denoting the mass transfer coefficient of solute; Re, representing the Reynolds number; ν the average velocity (m s−1); C m , signifies the concentration at the membrane surface (mg L−1); J w , representing the permeate flux (expressed in m3 m−2 s−1); π p , is the permeate osmotic pressure (in bar); m j , is the molal concentration of the solution (mol L−1); π m , is the average osmotic pressure at the membrane surface (in bar); π f , is the feed pressure (in bar); P F , is the concentration polarization factor of the membrane element; Sm, is the membrane area (in m2); Δ p fb , representing the average feed-brine pressure drop in the feed channel (in bar); p f , is the feed pressure (in bar); p p , denoting the permeate pressure (in bar); and TCF, is the temperature correction factor, which was calculated using the previous Equations (4) and (5). Equations (15)–(17), (20), and (21) were adopted from the work of Ruiz-García et al. [46], and Equations (18) and (19) were taken from [41].
The average B j at 25 °C were calculated using Equation (22). In this calculation, we utilized the available inorganic composition data for both the feed water and permeate samples to establish a correlation with conductivity. Subsequently, this correlation was applied to estimate concentrations for the remaining operating data.
B j = C pj J w ( C mj C pj ) T C F
where C pj is the ionic concentration in the permeate (mg L−1), and C mj is the ionic concentration at the membrane surface (mg L−1). C pj was calculated by multiplying Condp by 0.65. The specific energy consumption ( S E C ) of the BWRO plant was also calculated (Equation (23)).
S E C = p f Q f ρ f g Q p η H P P
where ρ is the density of the water (1000 kg m−3); g is the acceleration of gravity (generally adopted: 9.81 m s−2); and η HPP is the performance of the high-pressure pump (HPP) (it was assumed to be 80%).

2.5. Fouling Characterization Methods

Fouling characterization is a procedure used to identify the cause of the RO failure [33]. A fouled membrane element selected for this study was removed from the second stage of line 2 (Figure 3). The BWRO membrane used to perform this operation was TORAY TM720-400 (Toray Industries, Inc., Tokyo, Japan). The characterization procedure includes selecting a representative membrane element, dissecting it, analyzing collected samples, identifying fouling constituents, and implementing corrective measures [45]. The sample was analyzed by visual inspection, X-ray diffraction (XRD), Fourier transform infrared spectroscopy (FTIR), and X-ray fluorescence spectrometry (XRF).
The crystallite structure of the collected foulant sample was obtained using a PANalytical X’PERT Diffractometer equipped with Cu-Kα radiation. The diffractogram was then analyzed using “Origin 2018 (64 bit)” processing software for further analysis and interpretation.
FTIR analysis was conducted using a PerkinElmer FTIR spectrometer (model 783) from the United States. Spectra were acquired in the range of 400 to 4000 cm−1, employing the co-addition of 64 scans, a resolution of 4 cm−1, and a mirror velocity of 0.6329 cm s−1. KBr pellets were prepared by mixing 1 wt.% of the sample with 99 wt.% KBr and pressing them. FTIR results were processed using the “Origin” software.
XRF analysis is a comprehensive elemental analysis technique that enables the identification and quantification of most chemical elements present in a sample. It was conducted employing the molten pearl technique, specifically PERLEX-2. This technique exposes the sample to an X-ray beam, causing the atoms to transition from their ground state to an excited state and emitting X-ray photons. By analyzing this secondary X-ray emission, we can identify and quantify the chemical elements present in the sample.

3. Results and Discussion

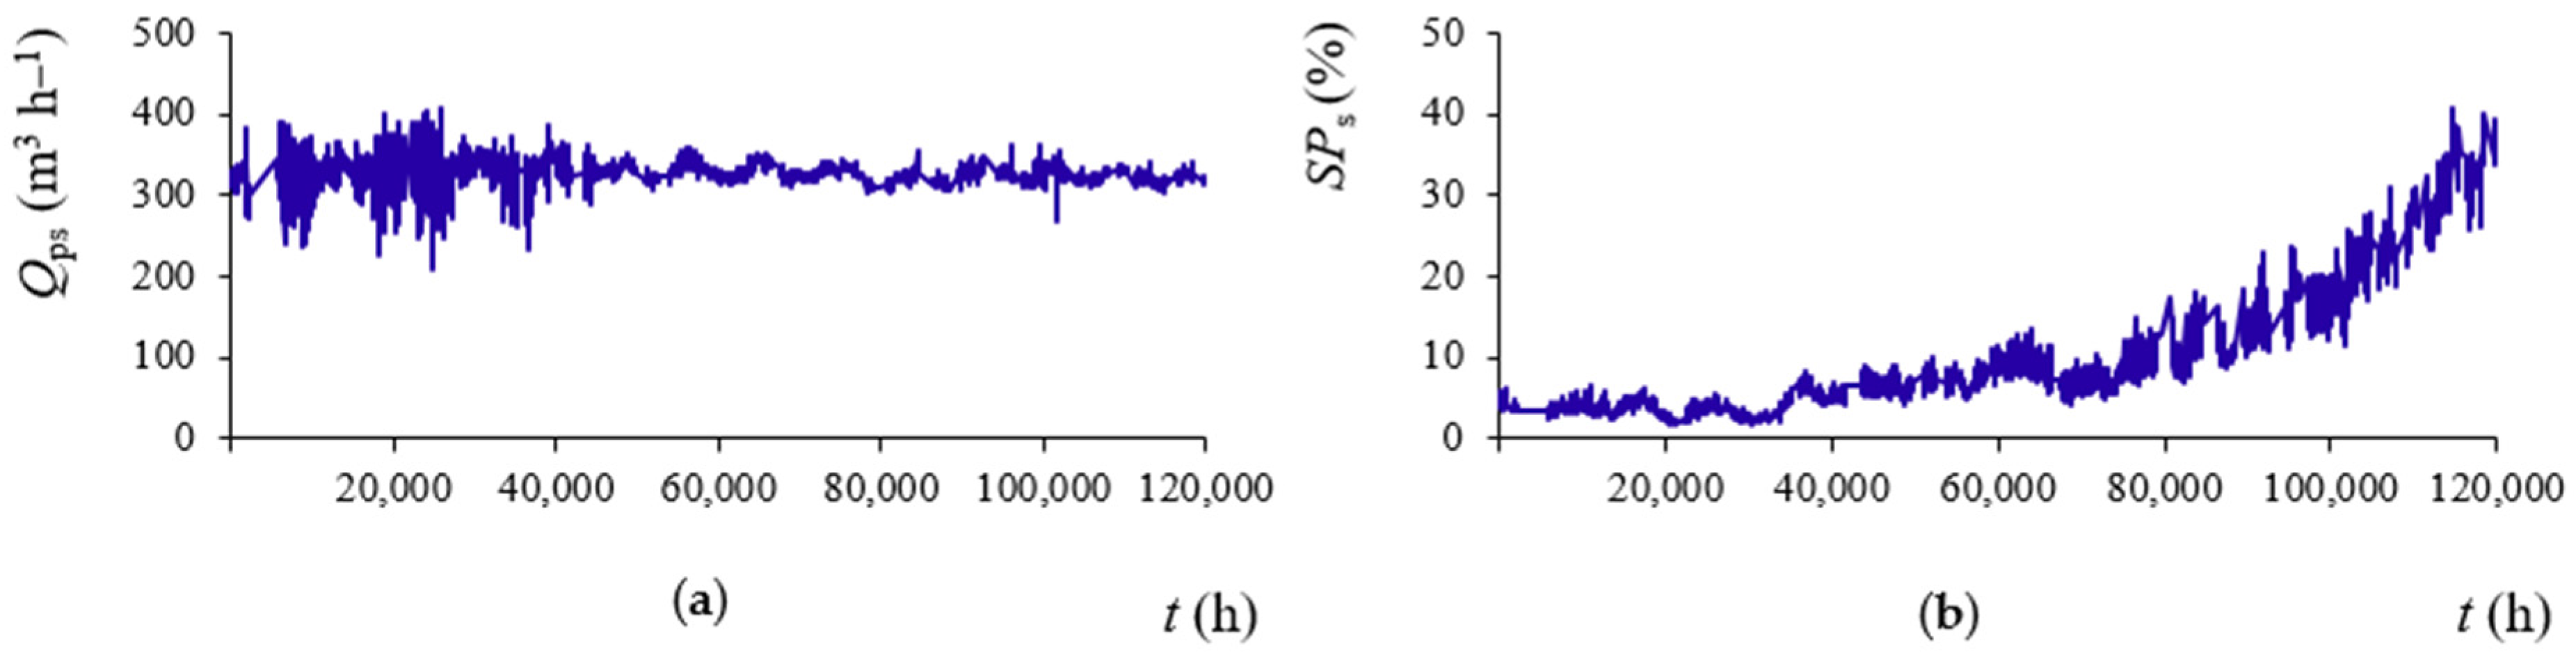
3.1. Operating Data Analysis

The results are presented in terms of operating time, which spans around 120,624 h. During this period, the BWRO operated with the same membranes. The membrane used for fouling characterization were changed during a period not included due to a lack of data. The feed water from the well contained between 2960 and 3350 mg L−1 of salinity. The composition ranges of the feed water are shown in Table 1. The distribution of cations and anions is as follows: SO42− > Cl > Na+ >Ca2+ >HCO3 > Mg2+. The feedwater has high levels of sulfate, calcium, magnesium, and chloride, which exceed the reference limits set by the Tunisian Standard NT09.14 (2013) [47].
During the initial 224 h, the BWRO desalination plant operated with a feed pressure ( p f ) of approximately 1.2 MPa. Over the observed period, p f fluctuated between 1.16 MPa and 1.6 MPa, reflecting the typical behavior of full-scale BWRO systems. This increase can be attributed to fouling, scaling, and membrane compaction, which are common in plants treating groundwater with low solubility solutes (Figure 4a) [23,25]. Variations in feed flow rate ( Q f ) can also influence the required p f to maintain a constant permeate flow rate ( Q p ) [48].
The pressure drop ( Δ p ) across both stages of the plant is shown in Figure 4b. Throughout the operating period, Δ p was consistently higher in the first stage compared to the second stage due to the higher feed-brine flow rate ( Q fb ) (higher feed-brine velocity). This higher Q fb , representing the concentrated brine leaving the first stage and entering the second stage, increases resistance to flow and results in the observed higher Δ p . This finding aligns with the results reported by Ruiz-Garcia and Nuez [49]. Specifically, Δ p in the first stage increased from 123 kPa to 255 kPa between 23,520 h and 75,000 h, probably due to the accumulation of impurities on the membrane surface. Fluctuations were observed later, with Δ p reaching a maximum of 330 kPa, possibly due to the presence of a small amounts of sand, anthracite, and other particles. In contrast, Δ p in the second stage remained relatively stable, averaging of 125 kPa. In this study, an increase in Δ p is mainly observed in the first stage, contrasting with the trend observed in other studies [23,25,49], which reported an incremental trends in Δ p in both stages, with particularly higher values in the first stage.
During the initial 45,112 h, the conversion rate, ( R ) , ranged from 47% to 91%, showing considerable variability before stabilizing around 74% (Figure 4c). Q p initially fluctuated between 227 m3 h−1 and 436 m3 h−1 before stabilizing at an average of 375 m3 h−1 (Figure 4d). This suggests a correlation between the stabilization of R and Q p , indicating a potential relationship between these variables.
Figure 4e shows that Condp gradually increases from 229.89 µS cm−1 to 700 µS cm−1, corresponding to a 67% increase in the salinity of the produced water. This increase is attributed to membrane degradation, compromising its ability to effectively reject solutes from the feedwater. The lack of chemical cleaning or membrane replacement during the study likely accelerated this degradation, resulting in higher Condp. The inorganic composition of the permeate water is shown in Table 2. Ruiz-García and Ruiz-Saavedra [24] reported a relatively constant Condp (~200 µS cm−1) over 80,000 h, whereas Ruiz-Garcia and Nuez [13] observed an increase from 250 µS cm−1 to 700 µS cm−1 due to membrane degradation, aligning closely with the observed trend. Farhat et al. [50] noted a more significant increase in Condp from 1000 µS cm−1 to 1750 µS cm−1.
During the first 40,000 h, the SEC fluctuated between 0.29 kWh m−3 and 0.62 kWh m−3 (Figure 4f). For the remainder of the operational period, the SEC stabilized at an average of 0.42 kWh m−3. The initial fluctuation could be attributed to adjustments or variable conditions, but the stabilization suggests a stable operational state, with consistent energy consumption. Greenlee et al. [51] discussed that the SEC in RO plants tends to increase as membranes foul and scales form, aligning with the observed increased energy consumption. Matin et al. [52] highlighted that effective pre-treatment and regular maintenance could mitigate the rise in energy consumption due to fouling, reinforcing the need for improved pre-treatment strategies.
In summary, as fouling progresses, higher operating pressures are required to maintain constant permeate flux due to the added resistance from the fouling layer. This also leads to a greater pressure drop across the membrane. Increased permeate conductivity indicates reduced membrane selectivity, as fouling can cause changes in the membrane structure, allowing more salts to pass through.

3.2. Standardization of Operating Data

The standardization of Qp and salt passage SP was performed to determine the observable differences in RO unit performance caused by problems such as fouling, scaling, etc. During the initial 46,856 h, Qps fluctuated between 208 m3 h−1 and 405 m3 h−1, with an average of 326 m3 h−1 (Figure 5a). During these years, Qps fluctuated significantly, but remained at its maximum of 405 m h−1 for the entire 120,624 h. From 46,856 h, the Qps remained quite stable (around 328 m3 h−1). Conversely to this finding, several studies found a decrease in permeate flux [24,26,32], which was attributed to the formation of a fouling layer on the membrane surfaces. The conventional method for assessing membrane fouling involves monitoring the decrease in flux over time. It has been shown that when the permeate flux is noticeably affected, the membrane is so severely fouled that restoration to its original permeability may become impossible [53].
The membranes exhibited a gradual increase in SPs, reaching a maximum of 15.5% (Figure 5b). This incremental trend in SPs through RO membranes is indicative of the progressive degradation of the membranes over time, a phenomenon commonly observed in long-term operation, considering that the replacement rate for membranes in other plants around the world is around 10% per year [54]. The prolonged operation of more than 120,624 h without membrane replacement or significant chemical cleaning may contribute to the observed increase in SPs. As membranes age, they are susceptible to various forms of fouling, including the accumulation of deposits on the membrane surface or within its pores, which can have a negative impact on permeation flux and salt rejection performance [55,56]. Therefore, the membrane could become less selective, leading to a higher proportion of salts passing through the membrane and ending in the permeate water. This phenomenon aligns with findings from previous studies by Hoek and Elimelech [57] and Adel et al. [26], which also reported a significant increase in the normalized salt passage rate of fouled RO membranes. One proposed mechanism for this increase is the formation of a cake-enhanced concentration layer on the membrane surface. As fouling progresses, this layer further impedes salt rejection and exacerbates the decline in membrane performance.
In summary, the observed increase in SPs highlights the importance of proactive maintenance and replacement strategies to mitigate membrane degradation and ensure the long-term efficiency of BWRO desalination plants. Regular cleaning and monitoring protocols are essential to preserve membrane selectivity and optimize salt rejection performance over extended operational durations.

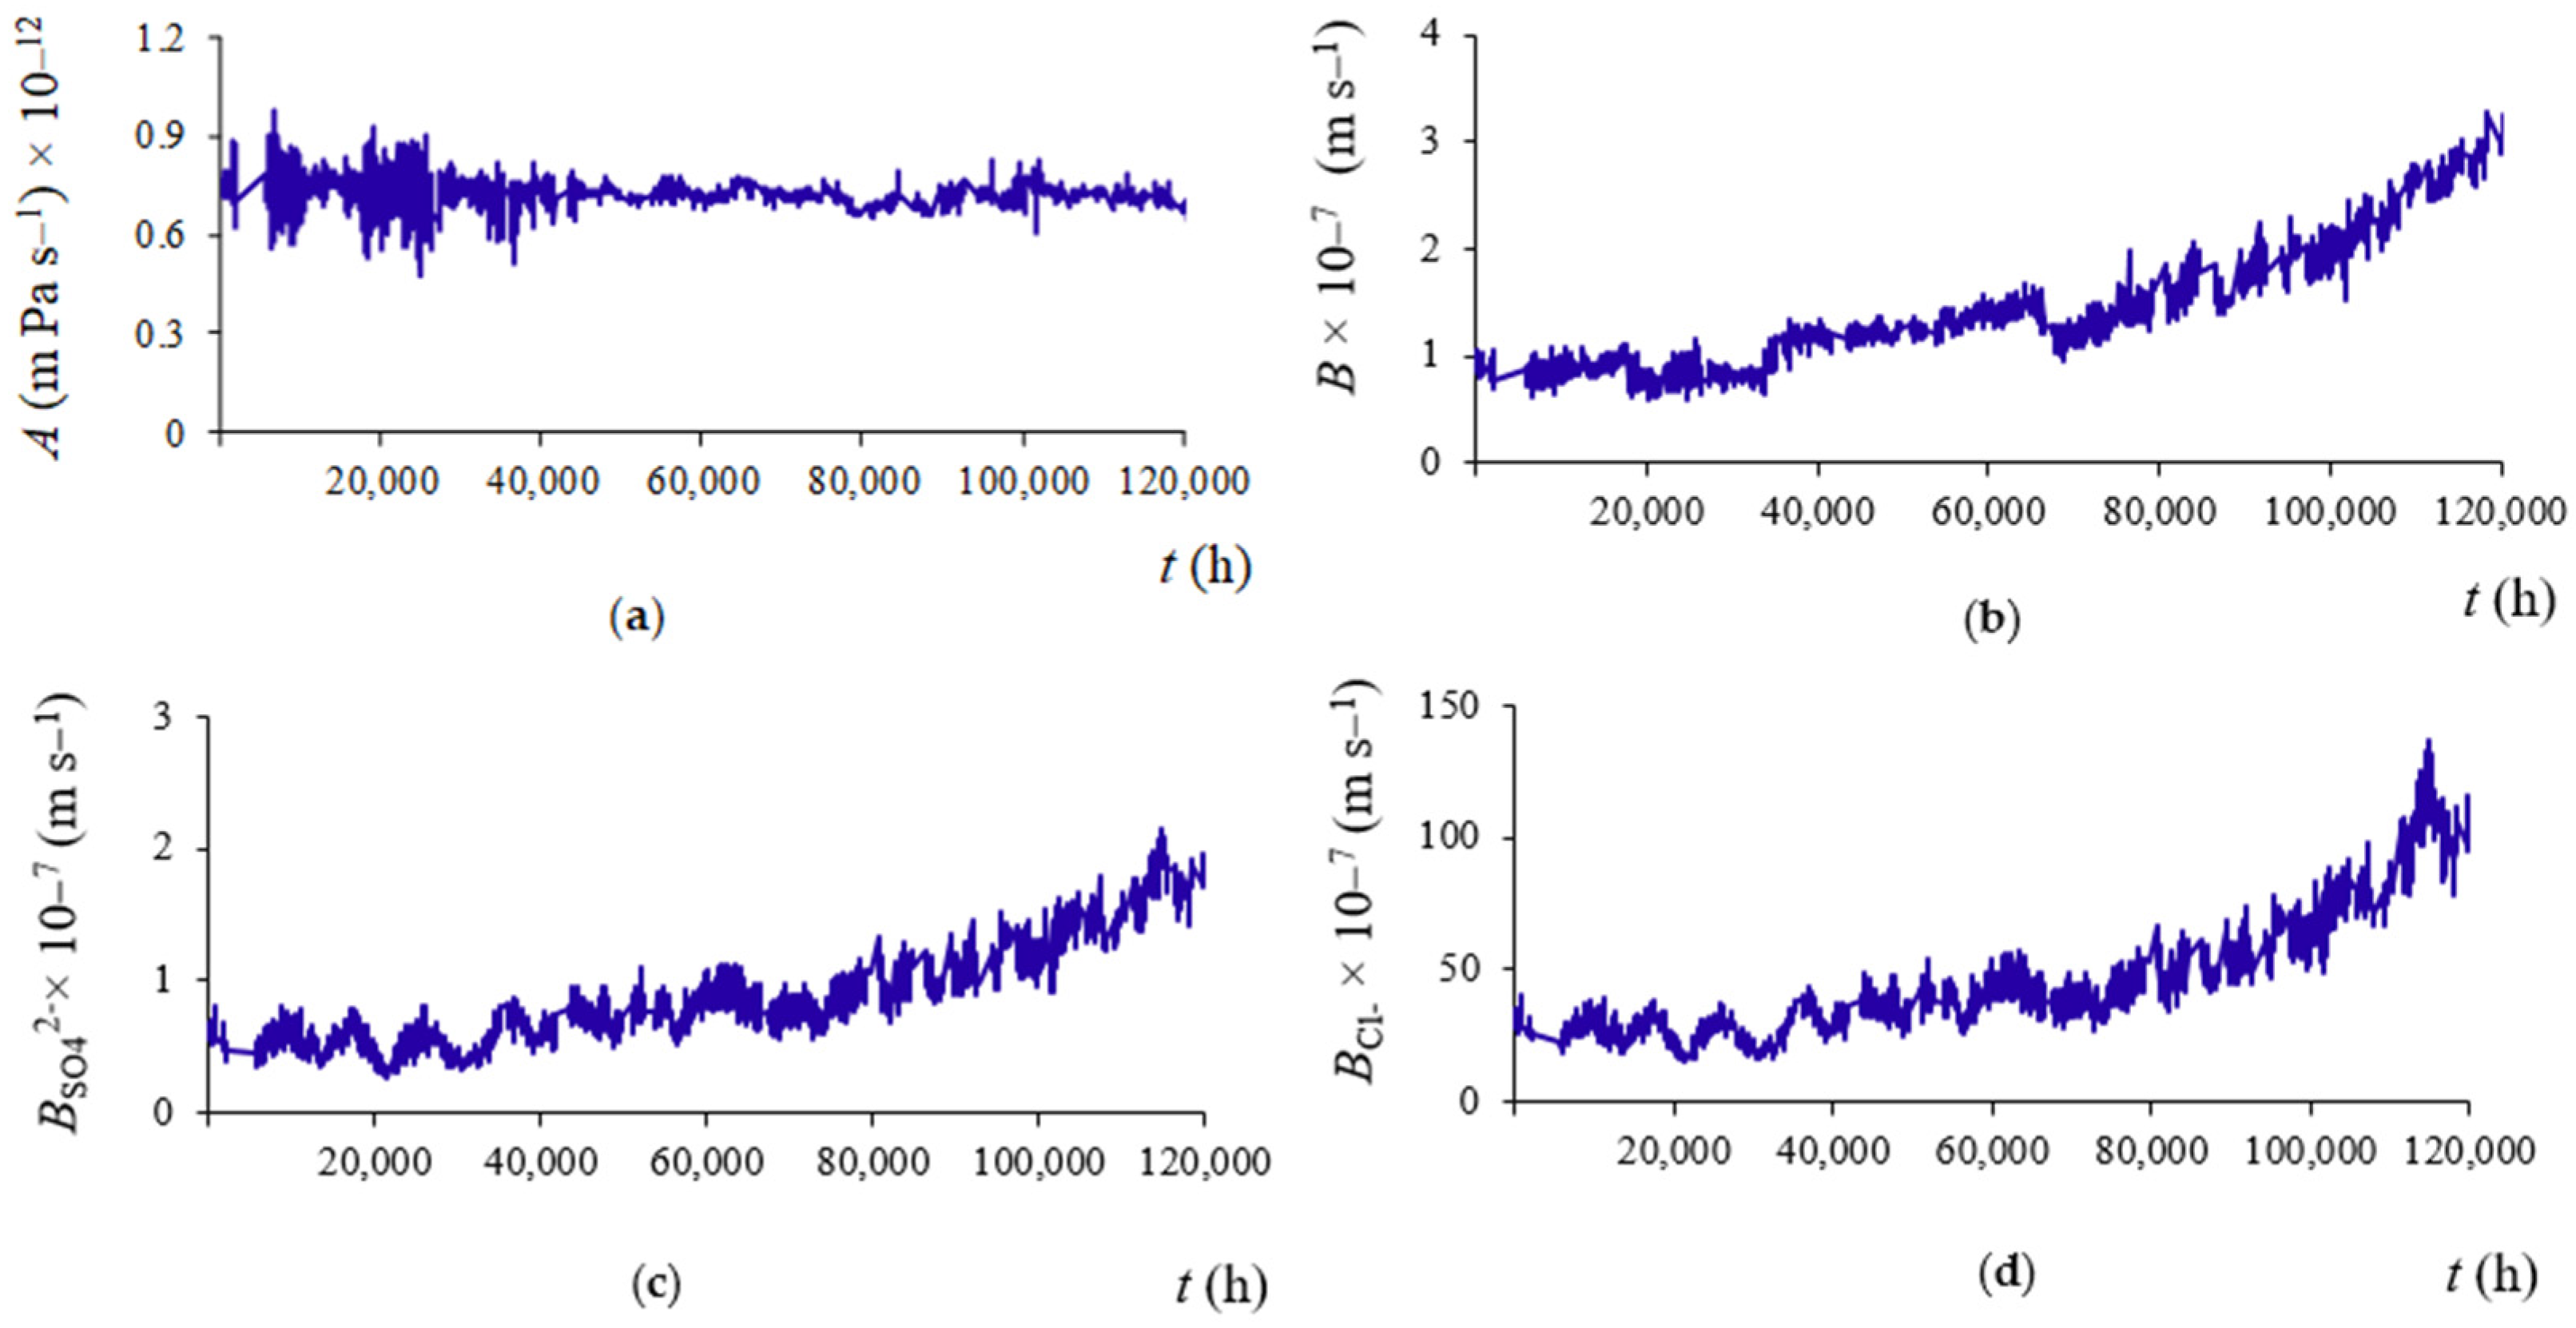
3.3. Permeability Coefficients

To evaluate the efficiency of the BWRO plant, the average A, the average B, and the average Bj at 25 °C were calculated. The results indicate that the average A remained relatively stable with an average of 0.72 × 10⁻¹² m Pa−1s−1 (Figure 6a), suggesting consistent membrane performance in terms of water flux over the operating period. This stability contrasts with studies by Abbas and Al-Bastaki [21] and Ruiz-García and Nuez [49], which reported a decline in A due to factors like fouling and membrane compaction.
The average B increased, reflecting a decrease in solute rejection over time. The observed values ranged from a minimum of 0.58 × 10⁻⁷ m s−1 to a maximum of 3.4 × 10⁻⁷ m s−1, representing an increase of 82% (Figure 6b). This trend aligns with the findings of Abbas and Al-Bastaki [21], Park et al. [58], and Ruiz-García and Nuez [49], who observed similar increases in B in long-term BWRO operations.
For sulfate (SO42−) ions, the average B was 0.81 × 10⁻⁷ m s−1(Figure 6c), while for chloride (Cl) ions, the average B was significantly higher at 41.42 × 10⁻⁷ m s−1 (Figure 6d). The higher retention of bivalent SO42− ions compared to monovalent Cl ions can be explained by their higher hydration energy and greater electrostatic interactions with the membrane, which make their permeation more difficult. These results align with Choi et al. [59] and Paugam et al. [60], who noted that ions with higher hydration energies and charges, such as SO42−, face greater resistance to membrane permeability. Saavedra et al. [61] and Ruiz-García et al. [23] also reported similar trends, showing that SO42− ions had lower B values that Cl ions due to these factors. Additionally, the long-term monitoring indicates that the ionic permeability coefficients for both SO42− and Cl ions increase over time, with Cl showing an 88% increase and SO42− showing an 87% increase. This suggests a gradual decrease in membrane selectivity and performance.
The increase in solute and ionic permeability coefficients indicates that more solutes and ions are passing through the membrane. This decline in performance necessitates an autopsy to determine the causes and appropriate remedies.

3.4. Fouling Characterization

Fouling was analyzed by visual inspection, Fourier transform infrared spectroscopy (FTIR), and X-ray fluorescence spectrometry (XRF).

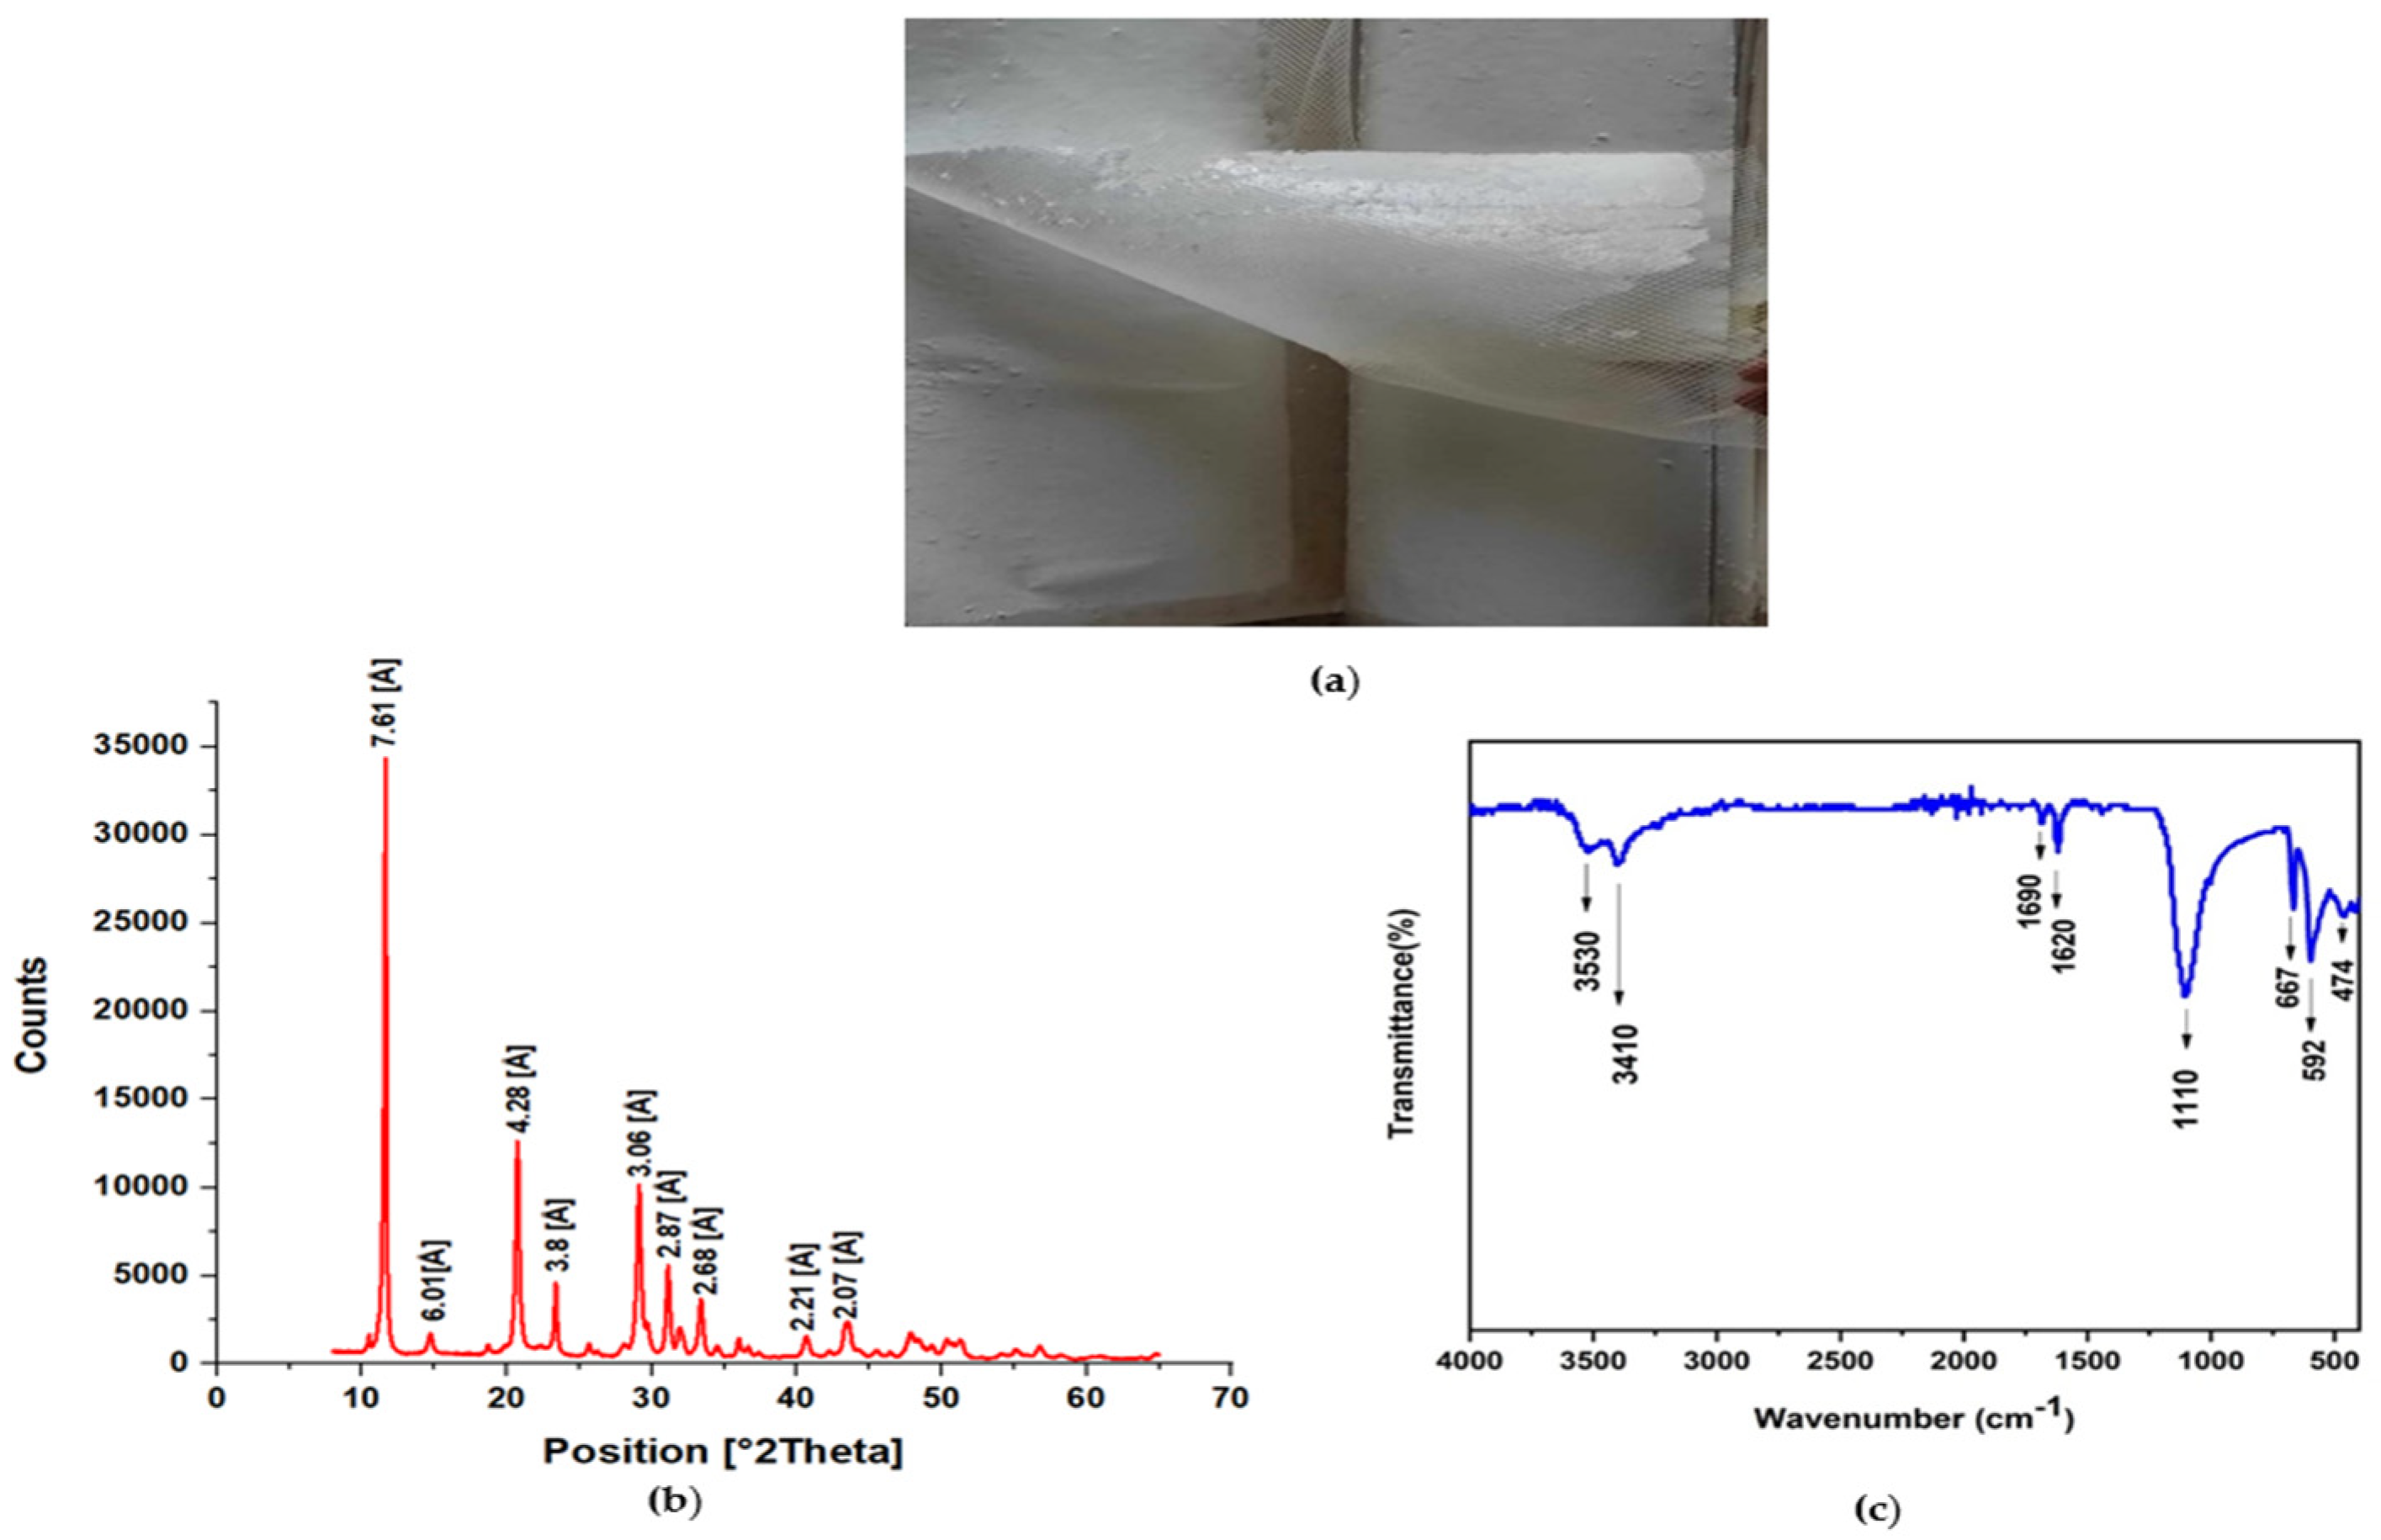
3.4.1. Visual Inspection

Visual inspection is one of the main ways of identifying the physical characteristics of the fouled membrane surface. It also helps to understand the nature of the fouling. For example, the presence of pollutants can be detected by seeing the color of the membrane surface [62].
Visual inspection of the membrane surface (Figure 7a) revealed signs of deterioration. The feed spacer was obstructed, and debris consisting of fragments and a white layer was observed.

3.4.2. X-ray Diffraction (XRD)

An XRD analysis was carried out to determine the scales’ crystal structure. The obtained XRD data from the foulant collected on the membrane surface is displayed in Figure 7b. The narrow peaks in the XRD patterns show a high degree of crystallization in the samples. The predominant crystal identified on the RO membrane was gypsum (CaSO4·2H2O). Specifically, peaks observed at 2θ values of 7.61, 4.28, 3.8, and 3.06 Å [63,64] indicate the presence of gypsum. These strong and intense peaks signify well-crystallized gypsum structures, particularly at higher concentrations. Additionally, peaks of lower intensity were discerned at 2θ values of 2.87, 2.21, and 2.07 Å, corresponding to traces of dolomite [26] and calcite [65], respectively.
The X-ray diffraction spectra indicated a higher deposition of gypsum compared to calcite on the membrane surface. Notably, research by Karmal et al. [33] and Balcik [66] found strong CaCO3 diffraction peaks, in contrast to our results.

3.4.3. FTIR Results

The spectrum obtained from the FTIR characterization of the fouled membrane is shown in Figure 7c. The peaks observed around 3530 cm−1, 3410 cm−1, as well as at 1620 cm−1 and 1690 cm−1 may be assigned to the hydrated components of gypsum, in particular hydroxyl groups and water [67,68]. The highest peak at around 1100 cm−1 is attributed to the presence of the SO42− functional group [69]. In addition, the spectrum shows two distinct peaks at 667 cm−1 and 596 cm−1, corresponding to the antisymmetric bending vibrations of SO42− [70,71]. The minor peak near 470 cm−1 suggests the presence of Si–O–Si, characteristic of silicon-based compounds [72]. As a result, FTIR analysis indicates that the fouling layer is composed of SO42− and hydroxyl functional groups. In addition, there are indications of silicon-based compounds, probably originated from feed water that contains high amount of silica. Based on the data provided, the peaks observed at wavelengths associated with hydrated components, such as hydroxyl groups and water, as well as the presence of antisymmetric bending vibrations characteristic of sulfate, suggest the presence of gypsum, which contains water in its crystalline structure.

3.4.4. X-ray Fluorescence Results

XRF was used to identify the main elements of the mineral particles on the RO membrane [73]. The results are shown in Table 3. Based on the presented results in the table, high percentages of sulphuric oxide (SO3) and calcium oxide (CaO) were observed in the sample (45.901% and 32.498%, respectively), which confirms that the composition of the samples was dominated by CaSO4 [71]. Silica (SiO2) was the next most abundant compound. Additionally, lower percentages of other elements such as magnesium oxide (MgO), potassium oxide (K2O), phosphorus pentoxide (P2O5), aluminum oxide (Al2O3), sodium oxide (Na2O), iron oxide (Fe2O3), titanium dioxide (TiO2), strontium oxide (SrO), and manganese oxide (Mn2O3) were detected.
XRF analysis provided elemental composition data, indicating significant levels of calcium and sulfur, which suggests the presence of calcium sulfate (CaSO4). This indication of CaSO4 as a major component of the fouling layer is further supported by both XRD and FTIR results. The XRD data confirmed the crystallographic presence of gypsum (CaSO4·2H2O), with distinct peaks corresponding to highly crystallized gypsum structures. Similarly, FTIR analysis corroborated these findings by revealing characteristic peaks associated with sulfate groups and hydroxyl components, which are indicative of gypsum. Therefore, the combined results of XRF, XRD, and FTIR analyses consistently indicate that CaSO4 is the main component of the fouling layer.
The predominant presence of CaSO4 in the fouling layer may indicate that the antiscalant is not functioning correctly or that the chosen type of antiscalant is not effective. This observation aligns with the results reported by Karime et al. [29], which similarly identified CaSO4 as the predominant scale layer component. The deposition of this layer may indeed be attributed to the antiscalant’s limited efficacy in preventing calcium sulfate scaling. Moreover, the low rejection rates of the reverse osmosis (RO) membranes could possibly contribute to the elevated levels of sulfate precipitation. Sachit and Veenstra [74] demonstrated that the high rejection rates of RO membranes for sulfate ions, coupled with the preferential passage of carbonate ions, may lead to minimal sulfur precipitation on fouled membranes despite the high sulfate concentration in the feedwater. This highlights the crucial role of RO membranes in mitigating fouling due to sulfate precipitation, thereby maintaining system efficiency. In contrast to our investigation, Karmal et al. [33] found that tartar is primarily composed of calcium carbonate. Specifically, their FTIR results revealed four significant peaks indicating the presence of inorganic carbonate (CO32−), while the XRF analysis detected a minor percentage of SO3 (3.72%) and a significant percentage of CaO (51.54%).
It should be noted that desalination plants using brackish groundwater often encounter the accumulation or precipitation of inorganic salts, as evidenced by previous research [75,76]. These salts typically comprise multivalent soluble ions such as calcium, aluminum, and sulfate ions. This consistent pattern underscores the importance of effective pretreatment strategies and membrane technologies in managing and minimizing fouling issues associated with inorganic salt precipitation in desalination systems using brackish groundwater sources.
Using scale inhibitors that are not disclosed is often the method used in commercial settings to prevent scale deposits, especially those that contain sulfate minerals like gypsum and barite. Studies by He et al. [77] and Pina et al. [78] have indicated that phosphonates, which have the functional group C-PO(OH)2, are commonly employed for this purpose. It has been suggested by research that phosphonates prevent the precipitation of sulfate minerals by enhancing adsorption onto gypsum surfaces [79]. Additionally, phosphonate additives affect gypsum crystal characteristics, including forms and diameters [80,81]. This suggests that phosphonates not only prevent the formation of scale deposits but also alter the morphology and size distribution of the crystals that are formed.
The low silica content (0.130%) observed in the inorganic composition of the foulant layer despite the high concentration of silica (SiO2) in the feed water indicates effective pretreatment of the water. This suggests that the pretreatment filters have successfully removed a substantial portion of silica from the water before it reaches the RO membranes. In contrast to findings from studies by Karime et al. [29] and Hamouda et al. [82], where the foulant layer contained a significant percentage of silica, the discrepancy here implies a potential anomaly in the pretreatment filters. This anomaly suggests that the filters might not be adequately removing silica or that there could be a bypass or malfunction in the filtration system, allowing silica to pass through and contribute to the fouling layer.

4. Conclusions

This study examined the performance decline of a full-scale BWRO desalination plant over 5026 days using destructive element characterization. The observed increase in operating pressures, pressure drops, and permeate conductivity, along with higher standardized salt passage and permeability coefficients, clearly underscores the significant impact of fouling on membrane efficiency. XRD, IR, and XRF analyses identified inorganic scaling primarily composed of calcium sulfate, with minor contributions from calcite, dolomite, and silica. This indicates the current antiscalant treatment is ineffective. However, the low silica content in the scale suggests that the water pretreatment process is effective despite the high silica levels in the feed water.
To address these issues, it is recommended to implement regular cleaning and monitoring to maintain membrane selectivity and optimize salt rejection. Additionally, using a more effective antiscalant based on water chemistry can inhibit calcium sulfate precipitation, potentially increasing the conversion rate to over 75%. These measures are crucial for protecting membrane functionality and enhancing overall system efficiency.

Author Contributions

Conceptualization, S.C., A.R.-G. and M.B.; methodology, S.C., A.R.-G. and S.F.; software, A.R.-G.; validation, A.R.-G., S.F. and M.B.; formal analysis, S.C. and A.R.-G.; investigation, S.C. and A.R.-G.; resources, S.C. and A.R.-G.; data curation, S.C., A.R.-G. and S.F.; writing—original draft preparation, A.R.-G.; writing—review and editing, S.C., A.R.-G., S.F. and M.B.; visualization, S.C. and A.R.-G.; supervision, A.R.-G. and M.B. All authors have read and agreed to the published version of the manuscript.

Funding

This research received no external funding.

Data Availability Statement

Data are included in the article.

Conflicts of Interest

The authors declare no conflicts of interest.

References

  1. Ghazi, Z.M.; Rizvi, S.W.F.; Shahid, W.M.; Abdulhameed, A.M.; Saleem, H.; Zaidi, S.J. An Overview of Water Desalination Systems Integrated with Renewable Energy Sources. Desalination 2022, 542, 116063. [Google Scholar] [CrossRef]
  2. Ayaz, M.; Namazi, M.A.; ud Din, M.A.; Ershath, M.I.M.; Mansour, A.; Aggoune, E.H.M. Sustainable Seawater Desalination: Current Status, Environmental Implications and Future Expectations. Desalination 2022, 540, 116022. [Google Scholar] [CrossRef]
  3. Najid, N.; Fellaou, S.; Kouzbour, S.; Gourich, B.; Ruiz-García, A. Energy and Environmental Issues of Seawater Reverse Osmosis Desalination Considering Boron Rejection: A Comprehensive Review and a Case Study of Exergy Analysis. Process Saf. Environ. Prot. 2021, 156, 373–390. [Google Scholar] [CrossRef]
  4. Belmehdi, F.; Otmani, S.; Taha-Janan, M. Global Trends of Solar Desalination Research: A Bibliometric Analysis during 2010–2021 and Focus on Morocco. Desalination 2023, 555, 116490. [Google Scholar] [CrossRef]
  5. Shahrim, N.A.; Abounahia, N.M.; El-Sayed, A.M.A.; Saleem, H.; Zaidi, S.J. An Overview on the Progress in Produced Water Desalination by Membrane-Based Technology. J. Water Process Eng. 2023, 51, 103479. [Google Scholar] [CrossRef]
  6. Voutchkov, N. Energy Use for Membrane Seawater Desalination—Current Status and Trends. Desalination 2018, 431, 2–14. [Google Scholar] [CrossRef]
  7. Abushawish, A.; Bouaziz, I.; Almanassra, I.W.; AL-Rajabi, M.M.; Jaber, L.; Khalil, A.K.A.; Takriff, M.S.; Laoui, T.; Shanableh, A.; Atieh, M.A.; et al. Desalination Pretreatment Technologies: Current Status and Future Developments. Water 2023, 15, 1572. [Google Scholar] [CrossRef]
  8. Lou, F.; Nie, S.; Yin, F.; Lu, W.; Ji, H.; Ma, Z.; Kong, X. Numerical and Experimental Research on the Integrated Energy Recovery and Pressure Boost Device for Seawater Reverse Osmosis Desalination System. Desalination 2022, 523, 115408. [Google Scholar] [CrossRef]
  9. Wang, C.; Meng, P.; Wang, S.; Song, D.; Xiao, Y.; Zhang, Y.; Ma, Q.; Liu, S.; Wang, K.; Zhang, Y. Comparison of Two Types of Energy Recovery Devices: Pressure Exchanger and Turbine in an Island Desalination Project Case. Desalination 2022, 533, 115752. [Google Scholar] [CrossRef]
  10. Baig, U.; Waheed, A. Fabrication of Polypyrrole-Graphitic Carbon Nitride Nanocomposite Containing Hyper-Cross-Linked Polyamide Photoresponsive Membrane with Self-Cleaning Properties for Water Decontamination and Desalination Applications. J. Water Process Eng. 2022, 47, 102721. [Google Scholar] [CrossRef]
  11. Thummar, U.G.; Jayalakshmi, J.; Saxena, M.; Suva, Y.; Nandha, N.; Kumar, P.; Aswal, V.K.; Singh, P.S. Highly Water Permeable ‘Reverse Osmosis’ Polyamide Membrane of Folded Nanoscale Film Morphology. J. Water Process Eng. 2023, 55, 104110. [Google Scholar] [CrossRef]
  12. Tong, Y.; Wei, Y.; Zhang, H.; Wang, L.; Li, L.; Xiao, F.; Gao, C.; Zhu, G. Fabrication of Polyamide Thin Film Nanocomposite Membranes with Enhanced Desalination Performance Modified by Silica Nanoparticles Formed In-Situ Polymerization of Tetramethoxysilane. J. Environ. Chem. Eng. 2023, 11, 109415. [Google Scholar] [CrossRef]
  13. Ruiz-García, A.; Nuez, I. Simulation-Based Assessment of Safe Operating Windows and Optimization in Full-Scale Seawater Reverse Osmosis Systems. Desalination 2022, 533, 115768. [Google Scholar] [CrossRef]
  14. Zubair, M.M.; Saleem, H.; Zaidi, S.J. Recent Progress in Reverse Osmosis Modeling: An Overview. Desalination 2023, 564, 116705. [Google Scholar] [CrossRef]
  15. Naji, O.; Al-juboori, R.A.; Khan, A.; Yadav, S.; Altaee, A.; Alpatova, A.; Soukane, S.; Ghaffour, N. Ultrasound-Assisted Membrane Technologies for Fouling Control and Performance Improvement: A Review. J. Water Process Eng. 2021, 43, 102268. [Google Scholar] [CrossRef]
  16. Najid, N.; Hakizimana, J.N.; Kouzbour, S.; Gourich, B.; Ruiz-García, A.; Vial, C.; Stiriba, Y.; Semiat, R. Fouling Control and Modeling in Reverse Osmosis for Seawater Desalination: A Review. Comput. Chem. Eng. 2022, 162, 107794. [Google Scholar] [CrossRef]
  17. Nikkola, J.; Liu, X.; Li, Y.; Raulio, M.; Alakomi, H.L.; Wei, J.; Tang, C.Y. Surface Modification of Thin Film Composite RO Membrane for Enhanced Anti-Biofouling Performance. J. Membr. Sci. 2013, 444, 192–200. [Google Scholar] [CrossRef]
  18. Goh, P.S.; Zulhairun, A.K.; Ismail, A.F.; Hilal, N. Contemporary Antibiofouling Modifications of Reverse Osmosis Desalination Membrane: A Review. Desalination 2019, 468, 114072. [Google Scholar] [CrossRef]
  19. Jarma, Y.A.; Thompson, J.; Khan, B.M.; Cohen, Y. Field Evaluation of UF Filtration Pretreatment Impact on RO Membrane Scaling. Water 2023, 15, 847. [Google Scholar] [CrossRef]
  20. Wilf, M.; Klinko, K. Performance of Commercial Seawater Membranes. Desalination 1994, 96, 465–478. [Google Scholar] [CrossRef]
  21. Abbas, A.; Al-Bastaki, N. Performance Decline in Brackish Water Film Tec Spiral Wound RO Membranes. Desalination 2001, 136, 281–286. [Google Scholar] [CrossRef]
  22. Belkacem, M.; Bekhti, S.; Bensadok, K. Groundwater Treatment by Reverse Osmosis. Desalination 2007, 206, 100–106. [Google Scholar] [CrossRef]
  23. Ruiz-García, A.; Ruiz-Saavedra, E.; Pérez Báez, S.O. Evaluation of the First Seven Years Operating Data of a RO Brackish Water Desalination Plant in Las Palmas, Canary Islands, Spain. Desalin. Water Treat. 2015, 54, 3193–3199. [Google Scholar] [CrossRef]
  24. Ruiz-García, A.; Ruiz-Saavedra, E. 80,000 h Operational Experience and Performance Analysis of a Brackish Water Reverse Osmosis Desalination Plant. Assessment of Membrane Replacement Cost. Desalination 2015, 375, 81–88. [Google Scholar] [CrossRef]
  25. Farhat, S.; Bali, M.; Kamel, F. Membrane Autopsy to Provide Solutions to Operational Problems of Jerba Brackish Water Desalination Plant. Desalination 2018, 445, 225–235. [Google Scholar] [CrossRef]
  26. Adel, M.; Nada, T.; Amin, S.; Anwar, T.; Mohamed, A.A. Characterization of Fouling for a Full-Scale Seawater Reverse Osmosis Plant on the Mediterranean Sea: Membrane Autopsy and Chemical Cleaning Efficiency. Groundw. Sustain. Dev. 2022, 16, 100704. [Google Scholar] [CrossRef]
  27. Wang, J.; Xing, J.; Li, G.; Yao, Z.; Ni, Z.; Wang, J.; Liang, S.; Zhou, Z.; Zhang, L. How to Extend the Lifetime of RO Membrane? From the Perspective of the End-of-Life RO Membrane Autopsy. Desalination 2023, 561, 116702. [Google Scholar] [CrossRef]
  28. Tang, F.; Hu, H.Y.; Sun, L.J.; Sun, Y.X.; Shi, N.; Crittenden, J.C. Fouling Characteristics of Reverse Osmosis Membranes at Different Positions of a Full-Scale Plant for Municipal Wastewater Reclamation. Water Res. 2016, 90, 329–336. [Google Scholar] [CrossRef]
  29. Karime, M.; Bouguecha, S.; Hamrouni, B. RO Membrane Autopsy of Zarzis Brackish Water Desalination Plant. Desalination 2008, 220, 258–266. [Google Scholar] [CrossRef]
  30. Yang, H.L.; Huang, C.; Pan, J.R. Characteristics of RO Foulants in a Brackish Water Desalination Plant. Desalination 2008, 220, 353–358. [Google Scholar] [CrossRef]
  31. Kim, S.J.; Oh, B.S.; Yu, H.W.; Kim, L.H.; Kim, C.M.; Yang, E.T.; Shin, M.S.; Jang, A.; Hwang, M.H.; Kim, I.S. Foulant Characterization and Distribution in Spiral Wound Reverse Osmosis Membranes from Different Pressure Vessels. Desalination 2015, 370, 44–52. [Google Scholar] [CrossRef]
  32. Ruiz-García, A.; Melián-Martel, N.; Mena, V. Fouling Characterization of RO Membranes after 11 Years of Operation in a Brackish Water Desalination Plant. Desalination 2018, 430, 180–185. [Google Scholar] [CrossRef]
  33. Karmal, I.; Mohareb, S.; El Housse, M.; Hafid, N.; Hadfi, A.; Belattar, M.; Ben-Aazza, S.; Addi, A.A.; Akbour, R.A.; Hamdani, M.; et al. Structural and Morphological Characterization of Scale Deposits on the Reverse Osmosis Membranes: Case of Brackish Water Demineralization Station in Morocco. Groundw. Sustain. Dev. 2020, 11, 100483. [Google Scholar] [CrossRef]
  34. Tapiero, Y.; Mery, F.; García, A. Understanding of Surface Fouling of Brackish Water Reverse Osmosis Spiral Wound Membrane Using an Integrated Analysis of Seawater Quality and Membrane Autopsy. Chem. Eng. Sci. 2023, 280, 119028. [Google Scholar] [CrossRef]
  35. Jean, R.; Bernard, L.; Nicole, M. L’Analyse de L’Eau: Eaux Naturelles, Eaux Residuaires, Eau de Mer; R. Jean: Paris, France, 2009; p. 1600. [Google Scholar]
  36. ISO 8245:1999; Water Quality—Guidelines for the Determination of Total Organic Carbon (TOC) and Dissolved Organic Carbon (DOC). International Organization for Standardization (ISO): Geneva, Switzerland, 1999.
  37. ASTM D4516-00(2010); Standards Practice for Standardizing Reverse Osmosis Performance Data. ASTM International: West Conshohocken, PA, USA, 2010.
  38. Gorenflo, A.; Brusilovsky, M.; Faigon, M.; Liberman, B. High PH Operation in Seawater Reverse Osmosis Permeate: First Results from the World’s Largest SWRO Plant in Ashkelon. Desalination 2007, 203, 82–90. [Google Scholar] [CrossRef]
  39. Zhao, Y.; Taylor, J.S. Assessment of ASTM D 4516 for Evaluation of Reverse Osmosis Membrane Performance. Desalination 2005, 180, 231–244. [Google Scholar] [CrossRef]
  40. Du, Y.; Xie, L.; Liu, J.; Wang, Y.; Xu, Y.; Wang, S. Multi-Objective Optimization of Reverse Osmosis Networks by Lexicographic Optimization and Augmented Epsilon Constraint Method. Desalination 2014, 333, 66–81. [Google Scholar] [CrossRef]
  41. Ruiz-García, A.; Nuez, I.; Carrascosa-Chisvert, M.D.; Santana, J.J. Simulations of BWRO Systems under Different Feedwater Characteristics. Analysis of Operation Windows and Optimal Operating Points. Desalination 2020, 491, 114582. [Google Scholar] [CrossRef]
  42. Schock, G.; Miquel, A. Mass transfer and pressure loss in spiral wound modules. Desalination 1987, 64, 339–352. [Google Scholar] [CrossRef]
  43. Taniguchi, M.; Kurihara, M.; Kimura, S. Behavior of a Reverse Osmosis Plant Adopting a Brine Conversion Two-Stage Process and Its Computer Simulation. J. Membr. Sci. 2001, 183, 249–257. [Google Scholar] [CrossRef]
  44. Sharqawy, M.H.; Lienhard, V.J.H.; Zubair, S.M. Thermophysical Properties of Seawater: A Review of Existing Correlations and Data. Desalin. Water Treat. 2010, 16, 354–380. [Google Scholar] [CrossRef]
  45. Koutsou, C.P.; Yiantsios, S.G.; Karabelas, A.J. A Numerical and Experimental Study of Mass Transfer in Spacer-Filled Channels: Effects of Spacer Geometrical Characteristics and Schmidt Number. J. Membr. Sci. 2009, 326, 234–251. [Google Scholar] [CrossRef]
  46. Ruiz-García, A.; Nuez, I.; Khayet, M. Performance Assessment and Modeling of an SWRO Pilot Plant with an Energy Recovery Device under Variable Operating Conditions. Desalination 2023, 555, 116523. [Google Scholar] [CrossRef]
  47. Guissouma, W.; Tarhouni, J. Fluoride in Tunisian Drinking Tap Water. J. Water Ressour. Prot. 2015, 7, 860–870. [Google Scholar] [CrossRef]
  48. Dudley, L.Y.; Darton, E.G. Pretreatment Procedures to Control Biogrowth and Scale Formation in Membrane Systems. Desalination 1997, 110, 11–20. [Google Scholar] [CrossRef]
  49. Ruiz-García, A.; Nuez, I. Long-Term Intermittent Operation of a Full-Scale BWRO Desalination Plant. Desalination 2020, 489, 114526. [Google Scholar] [CrossRef]
  50. Farhat, S.; Kamel, F.; Jedoui, Y.; Kallel, M. The Relation between the RO Fouling Membrane and the Feed Water Quality and the Pretreatment in Djerba Island Plant. Desalination 2012, 286, 412–416. [Google Scholar] [CrossRef]
  51. Greenlee, L.F.; Lawler, D.F.; Freeman, B.D.; Marrot, B.; Moulin, P. Reverse Osmosis Desalination: Water Sources, Technology, and Today’s Challenges. Water Res. 2009, 43, 2317–2348. [Google Scholar] [CrossRef] [PubMed]
  52. Matin, A.; Khan, Z.; Zaidi, S.M.J.; Boyce, M.C. Biofouling in Reverse Osmosis Membranes for Seawater Desalination: Phenomena and Prevention. Desalination 2011, 281, 1–16. [Google Scholar] [CrossRef]
  53. Tay, K.G.; Song, L. A More Effective Method for Fouling Characterization in a Full-Scale Reverse Osmosis Process. Desalination 2005, 177, 95–107. [Google Scholar] [CrossRef]
  54. Fethi, K.; Habib, C. Performances de La Station de Dessalement de Gabés (22,500 M3/j) Apres Cinq Ans de Fonctionnement. Desalination 2001, 136, 263–272. [Google Scholar] [CrossRef]
  55. Gryta, M. Influence of Polypropylene Membrane Surface Porosity on the Performance of Membrane Distillation Process. J. Membr. Sci. 2007, 287, 67–78. [Google Scholar] [CrossRef]
  56. He, F.; Gilron, J.; Lee, H.; Song, L.; Sirkar, K.K. Potential for Scaling by Sparingly Soluble Salts in Crossflow DCMD. J. Membr. Sci. 2008, 311, 68–80. [Google Scholar] [CrossRef]
  57. Hoek, E.M.V.; Elimelech, M. Cake-Enhanced Concentration Polarization: A New Fouling Mechanism for Salt-Rejecting Membranes. Environ. Sci. Technol. 2003, 37, 5581–5588. [Google Scholar] [CrossRef] [PubMed]
  58. Park, P.K.; Lee, S.; Cho, J.S.; Kim, J.H. Full-Scale Simulation of Seawater Reverse Osmosis Desalination Processes for Boron Removal: Effect of Membrane Fouling. Water Res. 2012, 46, 3796–3804. [Google Scholar] [CrossRef] [PubMed]
  59. Choi, S.; Yun, Z.; Hong, S.; Ahn, K. The Effect of Co-Existing Ions and Surface Characteristics of Nanomembranes of the Removal of Nitrate and Fluoride. Desalination 2001, 133, 53–64. [Google Scholar] [CrossRef]
  60. Paugam, L.; Diawara, C.K.; Schlumpf, J.P.; Jaouen, P.; Quéméneur, F. Transfer of Monovalent Anions and Nitrates Especially through Nanofiltration Membranes in Brackish Water Conditions. Sep. Purif. Technol. 2004, 40, 237–242. [Google Scholar] [CrossRef]
  61. Saavedra, E.R.; Gotor, A.G.; Pérez Báez, S.O.; Ramos, M.A.; Ruiz-García, A.; González, A.C. Evaluation of the Five Years Operating Data of a RO Brackish Water Desalination Plant in Las Palmas, Canary Islands, Spain: A Historic Case. Desalin. Water Treat. 2013, 51, 4785–4789. [Google Scholar] [CrossRef]
  62. Al-Abri, M.; Kyaw, H.H.; Al-Ghafri, B.; Myint, M.T.Z.; Dobretsov, S. Autopsy of Used Reverse Osmosis Membranes from the Largest Seawater Desalination Plant in Oman. Membranes 2022, 12, 671. [Google Scholar] [CrossRef]
  63. Farrah, H.E.; Lawrance, G.A.; Wanless, E.J. Gypsum-Anhydrite Transformation in Hot Acidic Manganese Sulfate Solution. A Comparative Kinetic Study Employing Several Analytical Methods. Hydrometallurgy 2004, 75, 91–98. [Google Scholar] [CrossRef]
  64. Ashfaq, M.Y.; Al-Ghouti, M.A.; Da’na, D.A.; Qiblawey, H.; Zouari, N. Effect of Concentration of Calcium and Sulfate Ions on Gypsum Scaling of Reverse Osmosis Membrane, Mechanistic Study. J. Mater. Res. Technol. 2020, 9, 13459–13473. [Google Scholar] [CrossRef]
  65. Hafid, N.; Belaatar, M.; Ben-Aazza, S.; Hadfi, A.; Ezahri, M.; Driouiche, A. Characterization of Scale Formed in Drinking Water and Hot Water Pipes in the Taliouine Downtown—Morocco. Am. J. Anal. Chem. 2015, 6, 677–686. [Google Scholar] [CrossRef]
  66. Balcik, C. Understanding the Operational Problems and Fouling Characterization of RO Membrane Used for Brackish Water Treatment via Membrane Autopsy. Water Sci. Technol. 2021, 84, 3653–3662. [Google Scholar] [CrossRef]
  67. Balan, E.; Fritsch, E.; Radtke, G.; Paulatto, L.; Juillot, F.; Petit, S. First-Principles Modeling of the Infrared Spectrum of Antigorite. Eur. J. Mineral. 2021, 33, 389–400. [Google Scholar] [CrossRef]
  68. Tang, F.; Hu, H.Y.; Sun, L.J.; Wu, Q.Y.; Jiang, Y.M.; Guan, Y.T.; Huang, J.J. Fouling of Reverse Osmosis Membrane for Municipal Wastewater Reclamation: Autopsy Results from a Full-Scale Plant. Desalination 2014, 349, 73–79. [Google Scholar] [CrossRef]
  69. Xu, Y.; Liao, Y.; Lin, Z.; Lin, J.; Li, Q.; Lin, J.; Jin, Z. Precipitation of Calcium Sulfate Dihydrate in the Presence of Fulvic Acid and Magnesium Ion. Chem. Eng. J. 2019, 361, 1078–1088. [Google Scholar] [CrossRef]
  70. Melliti, E.; Touati, K.; Van der Bruggen, B.; Elfil, H. Effect of Fe2+ Ions on Gypsum Precipitation during Bulk Crystallization of Reverse Osmosis Concentrates. Chemosphere 2021, 263, 127866. [Google Scholar] [CrossRef]
  71. Myka, A.; Łyszczek, R.; Zdunek, A.; Rusek, P. Thermal Analysis of Materials Based on Calcium Sulphate Derived from Various Sources. J. Therm. Anal. Calorim. 2022, 147, 9923–9934. [Google Scholar] [CrossRef]
  72. El-Zahhar, A.A.; Idris, A.M.; Fawy, K.F.; Arshad, M. SEM, SEM-EDX, µ-ATR-FTIR and XRD for Urban Street Dust Characterisation. Int. J. Environ. Anal. Chem. 2021, 101, 988–1006. [Google Scholar] [CrossRef]
  73. Xue, W.; Cheng, G.; Wu, Y.; Hou, X.; Wang, W.; Yin, J. Mineral Particles Fouling Analysis and Cleaning in Seawater Reverse Osmosis Desalination. Desalin. Water Treat. 2020, 198, 71–79. [Google Scholar] [CrossRef]
  74. Sachit, D.E.; Veenstra, J.N. Foulant Analysis of Three RO Membranes Used in Treating Simulated Brackishwater of the Iraqi Marshes. Membranes 2017, 7, 23. [Google Scholar] [CrossRef] [PubMed]
  75. Walha, K.; Amar, R.B.; Firdaous, L.; Quéméneur, F.; Jaouen, P. Brackish Groundwater Treatment by Nanofiltration, Reverse Osmosis and Electrodialysis in Tunisia: Performance and Cost Comparison. Desalination 2007, 207, 95–106. [Google Scholar] [CrossRef]
  76. Rukapan, W.; Khananthai, B.; Chiemchaisri, C.; Chiemchaisri, W.; Srisukphun, T. Short- and Long-Term Fouling Characteristics of Reverse Osmosis Membrane at Full Scale Leachate Treatment Plant. Water Sci. Technol. 2012, 65, 127–134. [Google Scholar] [CrossRef] [PubMed]
  77. He, S.; Oddo, J.E.; Tomson, M.B. The Inhibition of Gypsum and Barite Nucleation in NaCl Brines at Temperatures from 25 to 90 °C. Appl. Geochem. 1994, 9, 561–567. [Google Scholar] [CrossRef]
  78. Pina, C.M.; Putnis, C.V.; Becker, U.; Biswas, S.; Carroll, E.C.; Bosbach, D.; Putnis, A. An Atomic Force Microscopy and Molecular Simulations Study of the Inhibition of Barite Growth by Phosphonates. Surf. Sci. 2004, 553, 61–74. [Google Scholar] [CrossRef]
  79. Rabizadeh, T.; Peacock, C.L.; Benning, L.G. Investigating the Effectiveness of Phosphonate Additives in Hindering the Calcium Sulfate Dihydrate Scale Formation. Ind. Eng. Chem. Res. 2020, 59, 14970–14980. [Google Scholar] [CrossRef]
  80. Bosbach, D.; Hochella, M.F. Gypsum Growth in the Presence of Growth Inhibitors: A Scanning Force Microscopy Study. Chem. Geol. 1996, 132, 227–236. [Google Scholar] [CrossRef]
  81. Akyol, E.; Öner, M.; Barouda, E.; Demadis, K.D. Systematic Structural Determinants of the Effects of Tetraphosphonates on Gypsum Crystallization. Cryst. Growth Des. 2009, 9, 5145–5154. [Google Scholar] [CrossRef]
  82. Hamouda, S.B.; Akhtar, F.H.; Elfil, H. Diagnosis of Small Capacity Reverse Osmosis Unit for Desalinated Tap Water. Desalin. Water Treat. 2014, 52, 6976–6984. [Google Scholar] [CrossRef]
Figure 1. BWRO desalination plant.
Water 16 01892 g001
Figure 2. Process diagram of the BWRO desalination plant.
Water 16 01892 g002
Figure 3. Reverse osmosis membrane cut out for autopsy tests.
Water 16 01892 g003
Figure 4. Evolution of operating data over time. (a) Feed pressure over time; (b) Pressure drop over time; (c) Conversion rate over time; (d) Permeate flow over time; (e) Permeate conductivity over time; (f) Specific energy consumption.
Water 16 01892 g004
Figure 5. Standardization of operating data. (a) Standardization of permeate flow; (b) Standardization of salt passage.
Water 16 01892 g005
Figure 6. Evolution of permeability coefficients. (a) Water permeability coefficient; (b) Solute permeability coefficient; (c) Sulfate ion permeability coefficient; (d) Chloride ion permeability coefficient.
Water 16 01892 g006
Figure 7. Fouling characterization. (a) Visual inspection of membrane fouling; (b) X-ray diffraction spectra of deposit sample; (c) IR spectra of deposit sample.
Water 16 01892 g007
Table 1. Feed water analysis.
IonConcentration RangeLimit/Reference
[47]
pH7.02–7.84>6.5 and <8.5
Ca2+ (mg L−1)298–460200
Mg2+ (mg L−1)35–112100
Na+ (mg L−1)344–5002080
HCO3 (mg L−1)77–139-
SO42− (mg L−1)1060–1373500
Cl (mg L−1)638–1080500
SiO2 (mg L−1)13–27-
TDS (mg L−1)2960–3350>200 and <2000
TOC (mg L−1)<0.3-
Turbidity (NTU)0.26–1.13
SDI0.5–1.4-
Table 2. Permeate water inorganic composition.
IonConcentration Range (mg L−1)
Ca2+16–136
Mg2+3–78
Na+70–102
HCO39.5–36
SO42−45–132
Cl75–180
SiO21.8–18
TDS280–504
Table 3. Chemical Composition Analysis of Scale Deposits on RO Membranes in Brackish.
CompoundWeight %
Calcium oxide (CaO)32.498
Loss on ignition (LOI)21.56
Sulfur trioxide (SO3)45.901
Sodium oxide (Na2O)0.047
Magnesium oxide (MgO)0.034
Alumina (Al2O3)0.021
Silica (SiO2)0.130
Phosphorus pentoxide (P2O5)0.021
Potassium oxide (K2O)0.022
Titanium dioxide (TiO2)0.011
Iron oxide (Fe2O3)0.007
Strontium oxide (SrO)0.230
Manganese oxide (Mn2O3)0.004
Disclaimer/Publisher’s Note: The statements, opinions and data contained in all publications are solely those of the individual author(s) and contributor(s) and not of MDPI and/or the editor(s). MDPI and/or the editor(s) disclaim responsibility for any injury to people or property resulting from any ideas, methods, instructions or products referred to in the content.

