Article

Spatio-Temporal Dynamics of Center Pivot Irrigation Systems in the Brazilian Tropical Savanna (1985–2020)

by
Edson Eyji Sano
1,*,
Ivo Augusto Lopes Magalhães
2,
Lineu Neiva Rodrigues
1 and
Édson Luis Bolfe
3
1
Brazilian Agricultural Research Corporation, Embrapa Cerrados, Planaltina 73301-970, DF, Brazil
2
Institute of Geosciences, University of Brasília, Brasília 70297-400, DF, Brazil
3
Brazilian Agricultural Research Corporation, Embrapa Agricultura Digital, Campinas 13083-886, SP, Brazil
*
Author to whom correspondence should be addressed.
Water 2024, 16(13), 1897; https://doi.org/10.3390/w16131897
Submission received: 9 April 2024 / Revised: 14 June 2024 / Accepted: 23 June 2024 / Published: 2 July 2024
(This article belongs to the Topic Water and Energy Monitoring and Their Nexus)

Abstract

:
The 204-million-hectare Brazilian tropical savanna (Cerrado biome), located in the central part of Brazil, constitutes the main region of food and natural fiber production in the country. An important part of this production is based on center pivot irrigation. Existing studies evaluating the spatio-temporal dynamics of center pivots in Brazil do not consider their retraction. This study aimed to evaluate the expansion and retraction of center pivots in the Cerrado biome in the period 1985–2020. We relied on the data produced by the MapBiomas Irriga project. In this period, the area occupied by center pivots increased from 47 thousand hectares in 1985 to 1.2 million hectares in 2020, mostly concentrated in the states of Minas Gerais, Goiás, São Paulo, and Bahia, confirming previous reports available in the literature. Among the 13 irrigation poles recognized by the National Water Agency (ANA), the Oeste Baiano (Bahia State) and the São Marcos (Goiás State) presented the largest areas of center pivots (173,048 ha and 101,725 ha, respectively). We also found that 76% of the center pivots are concentrated in the regions with low water availability (0.01–0.45 mm day−1). Within this 16-year period (2005–2020), more than 10% of center pivots found in 2005 were either abandoned or converted into rain-fed crop production. The results of this study can provide an important foundation for public policies directed toward the sustainable use of water resources by different consumers.

1. Introduction

The Brazilian tropical savanna (Cerrado biome) occupies a large region (>204 million hectares) in the central part of the country and constitutes an important region of the country for grain production, especially soybean (Glycine max L.), corn (Zea mays L.), cotton (Gossypium L.), and coffee (Coffea sp.), with a clear trend of increasing productivity [1,2]. Different processes of land use dynamics occur in this region, such as expansion, retraction, diversification, and agricultural intensification. For example, the area planted with soybeans in this biome increased from 7.5 million ha in the 2000/01 crop growing season to 20.0 million ha in 2020/21 [3]. This area represents about 50% of the total area planted with soybeans in Brazil. Grain production in this biome occurs mostly in agricultural frontiers located in large and flat terrains, locally known as “chapada”, mostly covered by deep, low fertility, acidic Oxisols and with an annual average precipitation of more than 1000 mm.
The Cerrado’s climate is classified as tropical savanna (Aw) in the Köppen climate classification system [4]. The annual precipitation ranges from 600 mm to 2000 mm, with an average annual rainfall of 1431 mm (standard deviation of 254 mm) and roughly increases from the east (the border of semiarid Caatinga) to the west (the border of the tropical Amazon rainforest) [2,5]. One of the striking features of the Cerrado in terms of climate is its climatic seasonality, that is, a six-month dry season that goes from April to September and another six-month wet season that goes from October to March [6]. Almost 100% of rainfall occurs in the rainy season, which means that food production in the dry season relies almost entirely on irrigation. Although growth in irrigation means increasing demand for water resources, several benefits can be pointed out, such as increased productivity, mitigation of the impacts of climate variability, agricultural expansion to arid and semiarid regions, and higher stability in terms of food and nutritional security, among others [7,8,9].
Surface, subsurface, sprinkler, and localized irrigation are the current main irrigation methods in the Cerrado. In the first method, water is applied on the soil surface, while in the subsurface method, water is applied directly into the crop root zone. In sprinkler irrigation, water is applied under pressure above the ground using sprinklers. The localized method (or micro-irrigation) consists of water application in small volumes, low pressure, and high frequency [9]. The most common type of sprinkler irrigation that is found in the Cerrado is the center pivot. According to Althoff and Rodrigues [10], approximately 80% of central pivots are in the Brazilian Cerrado.
Since 1970, irrigated areas have been mapped by different countries in the world based on remote sensing data [11,12,13]. In Brazil, the National Water Agency (ANA), under the Ministry of Integration and Regional Development, conducts a non-systematic mapping of irrigated areas by center pivots in Brazil [14]. Current available vector-based maps are from 1985, 1990, 2000, 2005, 2010, 2014, 2017, 2019, and 2022. The methodology is based on visual interpretation of images mainly acquired by the Landsat and Sentinel-2 optical satellites that operate with spatial resolutions of 30 m and 10 m, respectively. The method is based on the visual identification of circular features, a procedure commonly adopted by several other authors [15,16,17]. The non-governmental MapBiomas Irriga project [18,19] also produces annual maps of irrigated areas for the entire country based on image segmentation and adapted U-Net convolutional neural network architecture [20]. The raster-based maps are available for the period 1985–2022. The feasibility of using deep learning architectures to map center pivots in Brazil has been demonstrated by Albuquerque et al. [21].
In this study, we analyzed the expansion of the center pivot irrigation systems over the Cerrado biome during the period 1985–2020 as well as their retraction during a 16-year period (2005–2020), based on the MapBiomas Irriga data sets. To our best knowledge, there is no data about the magnitude of retraction of center pivots in the Cerrado biome. Here, retraction means that an area previously occupied by center pivot irrigation system was abandoned and is undergoing regeneration of native vegetation or was converted into rain-fed agriculture. Therefore, these areas should be discounted in the systematic mapping of center pivots, which is the case of the MapBiomas Irriga project, if the magnitude of retraction is high.

2. Materials and Methods
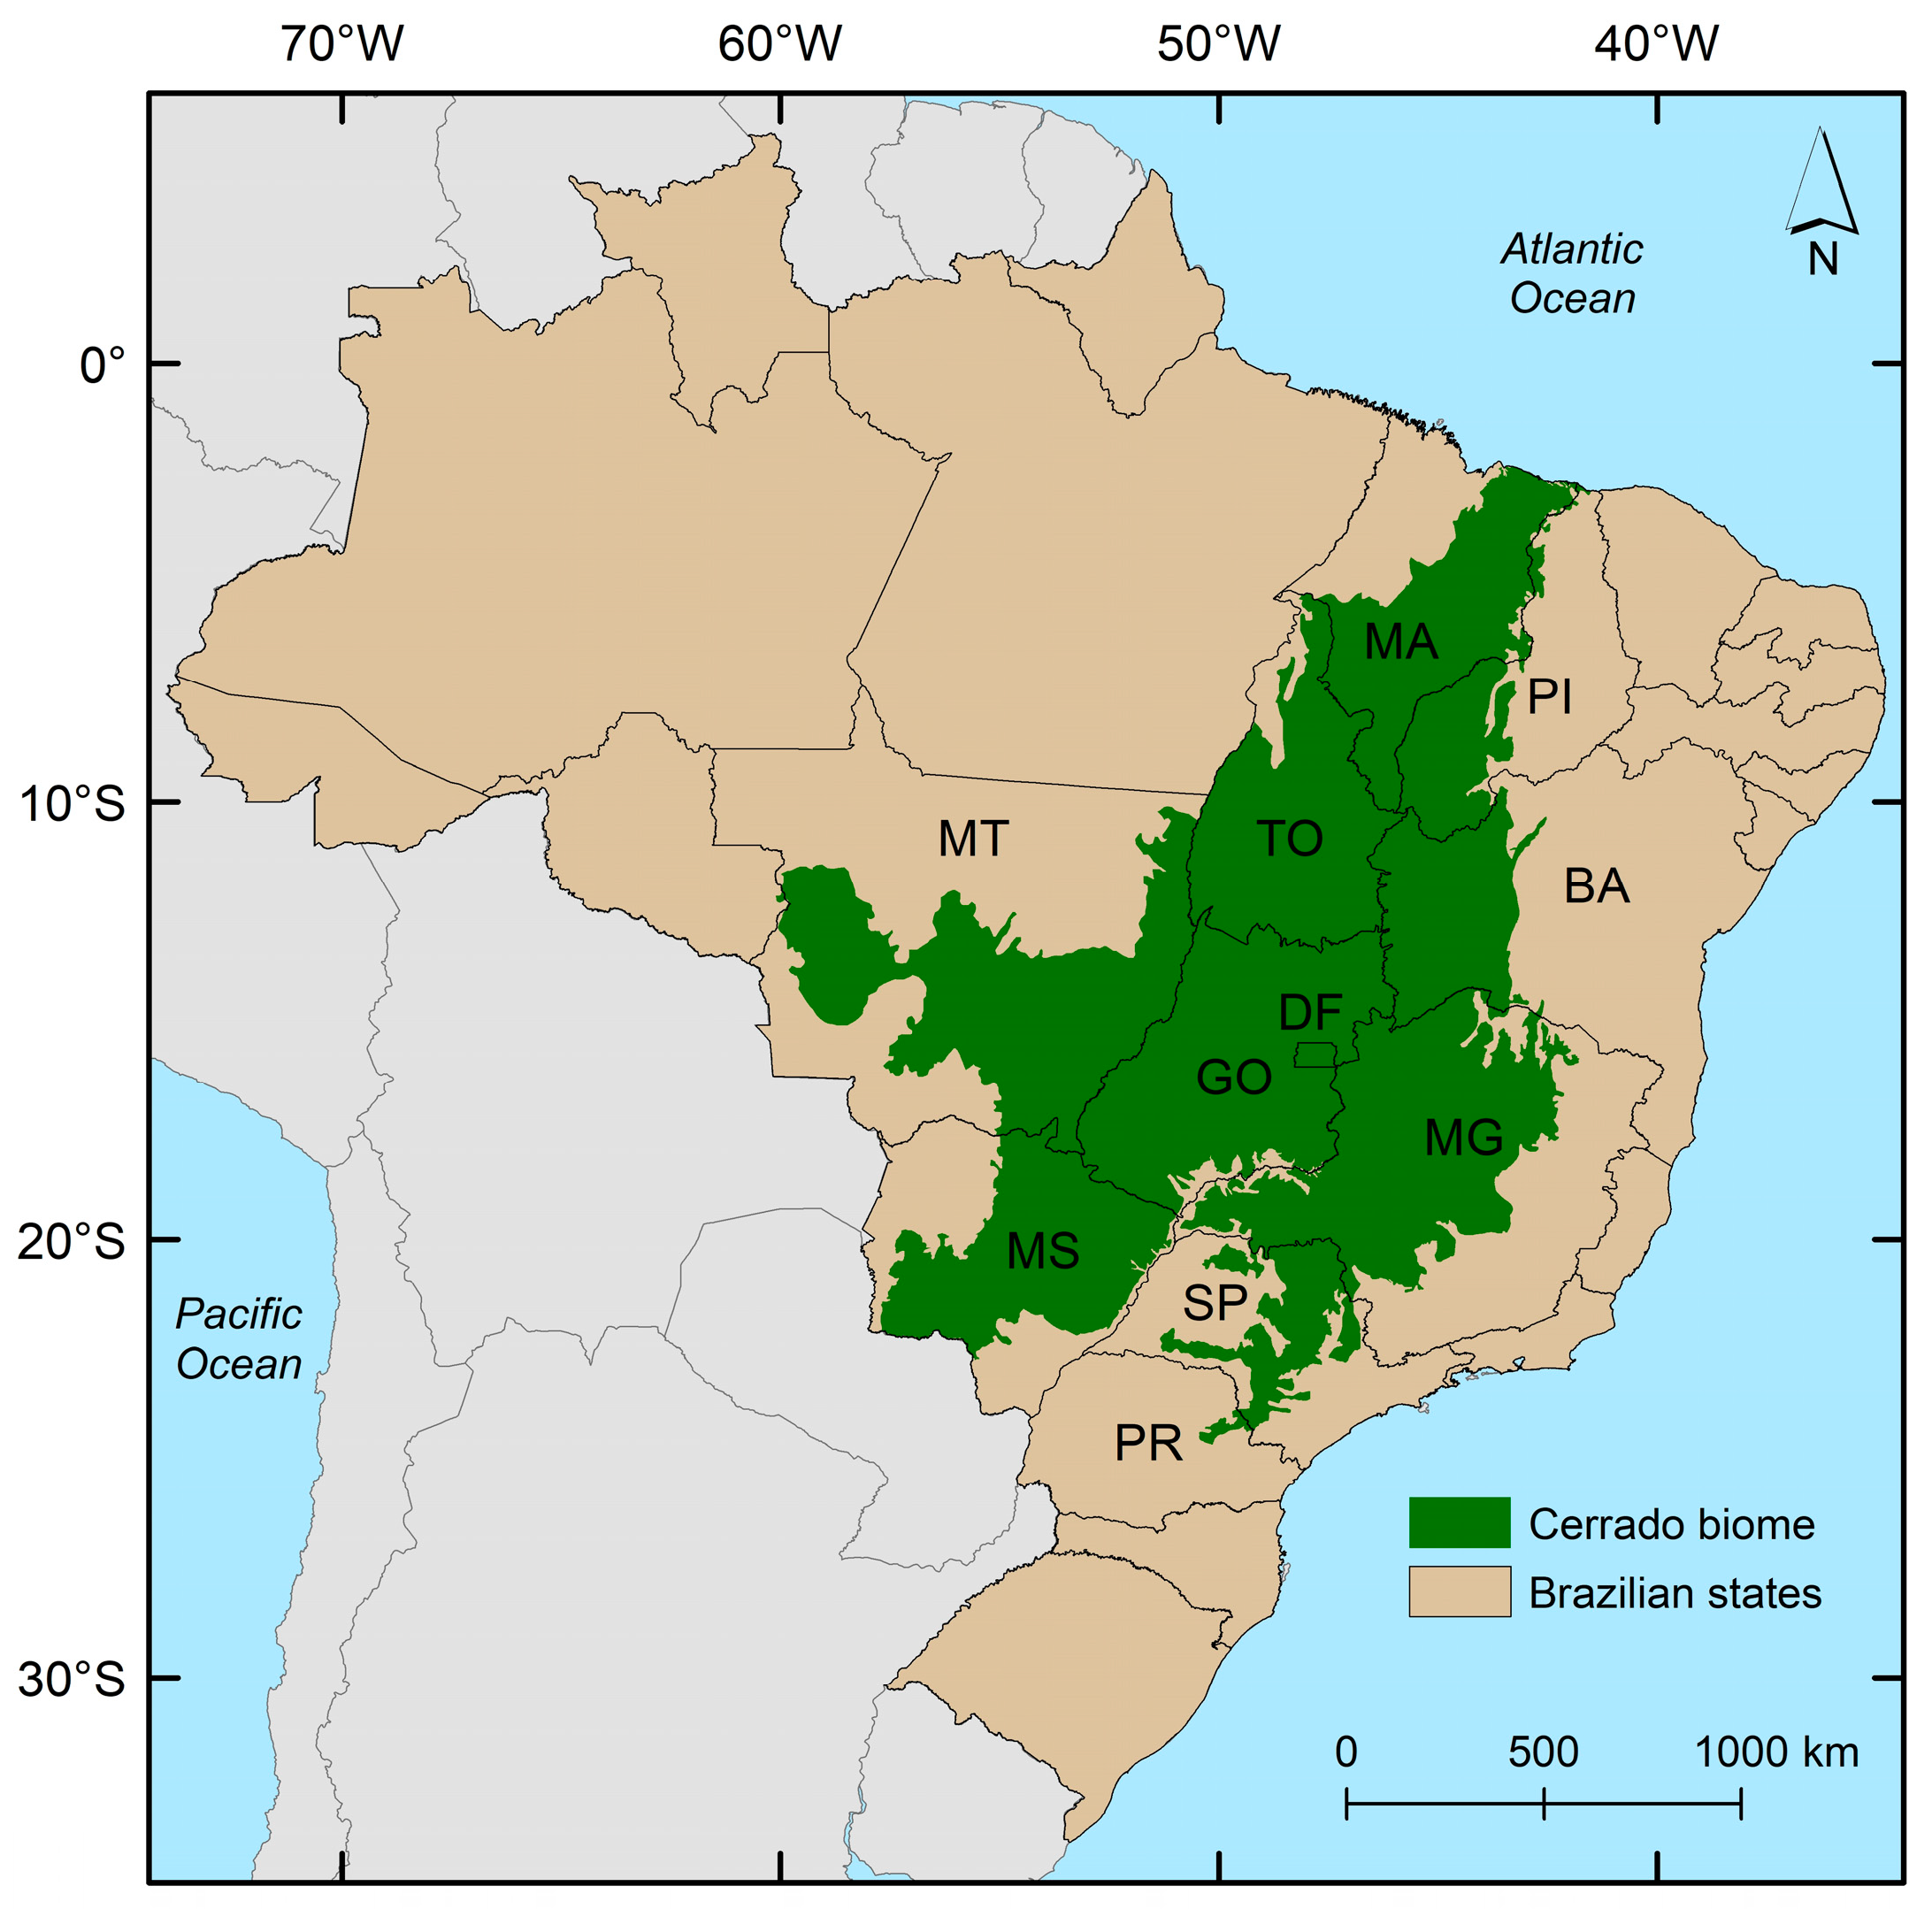
2.1. Study Area

The selected study corresponds to the Cerrado biome, which occupies approximately 21% of the Brazilian territory and extends from the coast of Maranhão State to the north of the Paraná State, a variation of more than 22° in latitude [22] (Figure 1). It covers more than 50% of the area of 1389 municipalities and encompasses a total of 110 microregions. Approximately 46% of the biome is currently covered by some type of land use, mainly cultivated pastures, annual crops, perennial crops, and semi-perennial sugarcane (Saccharum officinarum L.). Cultivated pastures, mostly by Brachiaria and Andropogon species, can be found throughout the biome, while rain-fed croplands are mainly concentrated in large plateaus that allow intensive mechanization [23].
The Cerrado shares ecological transition zones (ecotones) with four of the five biomes: the Amazon (tropical rainforest), Caatinga (semi-arid savanna), Atlantic Forest (tropical coastal rainforest), and Pantanal (wetland), hosting more than 12,800 plant species [24]. Only 3% of the biome is permanently protected by law as conservation units [25]. Therefore, this biome faces a constant conflict between environmental protection interests and food and energy production interests that may last for a long time [26]. The Cerrado has been the main region in the country for the installation of new center pivots for the last four decades, mainly in the parts of the states of Minas Gerais, Goiás, and São Paulo covered by this biome [27]. Such concentration is related to the expansion of agriculture into areas with high soil water deficiency and flat terrains.

2.2. Data

This study was based on the database of irrigated areas in Brazil that was produced by the MapBiomas Irriga project, Collection 8 [19]. In this database, there is a collection of raster-based, annual maps from the period 1985–2022 that show the areas irrigated by center pivots and other types of irrigation systems in the entire Brazilian territory. In our study, we selected the five-year interval time series of data (1985, 1990, 1995, 2000, 2010, 2015, and 2020) that were cropped to the Cerrado biome. Validation tests conducted by MapBiomas [18] showed a commission error of 84% and an omission error of 95%.
We also considered the geomorphological map of the Cerrado at the 1:250,000 scale, produced by the Brazilian Institute of Geography and Statistics (IBGE) [28], and the water availability map proposed by Althoff et al. [29]. The following major geomorphological units are found in the Cerrado biome: lowlands, depressions, tablelands, plateaus, platforms, highlands, and mountain ranges. Lowlands are flat or gently undulating landforms occurring at lower altitudes, where sedimentation processes overcome erosion. Depressions are flat or undulating terrains located at lower altitudes in relation to the surrounding geomorphological units. Tablelands and plateaus are marked by flat relief constituted by sedimentary rocks and limited by cliffs. Tablelands present relatively lower altitudes in relation to the plateaus. Platforms are flat or wavy terrains located in intermediate positions between topographically higher and lower areas. Highlands are flat or dissected landforms found at high altitudes and limited, at least at one side, by lower surfaces, while mountain ranges are rugged reliefs forming ridges.
The water availability map was produced based on data integration of gauged catchment, reference evapotranspiration, precipitation, and streamflow series. The streamflow series were simulated based on the regionalization of parameters calibrated against the GR5J rainfall-runoff hydrological model [30]. The data set used by these authors covered the period 2003–2014. Daily time series of precipitation (P) and Penman–Monteith reference evapotranspiration (ETo) were derived from the Integrated Multi-satellite Retrievals for Global Precipitation Measurement (IMERG) dataset [31].

2.3. Methods

The data set of the MapBiomas Irriga project for the period 1985–2020 was used to analyze the expansion of center pivots in the Cerrado in terms of total number and total area (unit of measurement in ha). First of all, we converted the raster-based data into vector-based shapefile format in the ArcGIS 10.8 software to allow calculation of the total number of pivots. Whenever the boundaries of two or more center pivots touch each other, they are counted as a single center pivot. To solve this type of omission error, we initially created the centroids in each polygon using the feature to point function available in the Toolbox of ArcGIS 10.8 software. Then, centroids were manually added to those pivots that were left without centroids. The data set from 2020 were also overlaid with the water availability map of the Cerrado, produced by Althoff and Rodrigues [10], to analyze the spatial correlation between these two parameters.
The retraction of center pivots in the Cerrado biome was analyzed based on the MapBiomas Irriga data from 2005 and 2020. Here, it is important to point out that the automatic extraction methods of delineating center pivots are quick and efficient. However, there are some misinterpretations that can only be solved by visual interpretation. This is the case of, for example, patches of native vegetation with an approximately circular appearance that can be confounded with center pivots (Figure 2). To correct such commission errors, we downloaded the Landsat images acquired in 2005 made available in the USGS’s earth explorer platform (114 images, one image per path/row, paths ranging from 217 to 229, and rows ranging from 62 to 77). The overpasses were mostly between August and September (the peak of the dry season in the Cerrado, with the lowest cloud cover conditions over the year). Then, the RGB color composites of red, near-infrared, and shortwave spectral bands were visually interpreted to exclude the false center pivots.
The mosaic of PlanetScope images from October 2020 were visually analyzed to select those center pivots from 2005 that were still active, that is, in operation, in 2020. The PlanetScope satellite constellation, launched by the Planet Labs Inc., is composed of more than 200 CubeSats that acquire daily images in four multispectral bands in the blue, green, red, and near-infrared spectral regions. The five-meter spatial resolution monthly PlanetScope mosaics, released by Norway´s International Climate & Forests Initiative [32], correspond to the combination of the best daily acquisitions during the month so that they are mostly cloud-free. Those polygons that were interpreted as inactive were further classified into rain-fed croplands and abandoned pivots (Figure 3) based on the high spatial resolution images available in the Google EarthTM platform for the period 2005–2020. In other words, whenever an active pivot in 2005 presents visual signs of regrowth of native vegetation with a much more unclear definition of circular or semi-circular shape that is characteristic of center pivots in 2020, we considered this pivot as abandoned. In addition, there is another possibility that the entire irrigation system is replaced by a much larger cropland without any sign of the previous existence of a pivot. In this case, we considered this pivot as replaced by rain-fed agriculture. A few polygons were also identified as reforestation, rural communities, and water reservoirs.

3. Results and Discussion

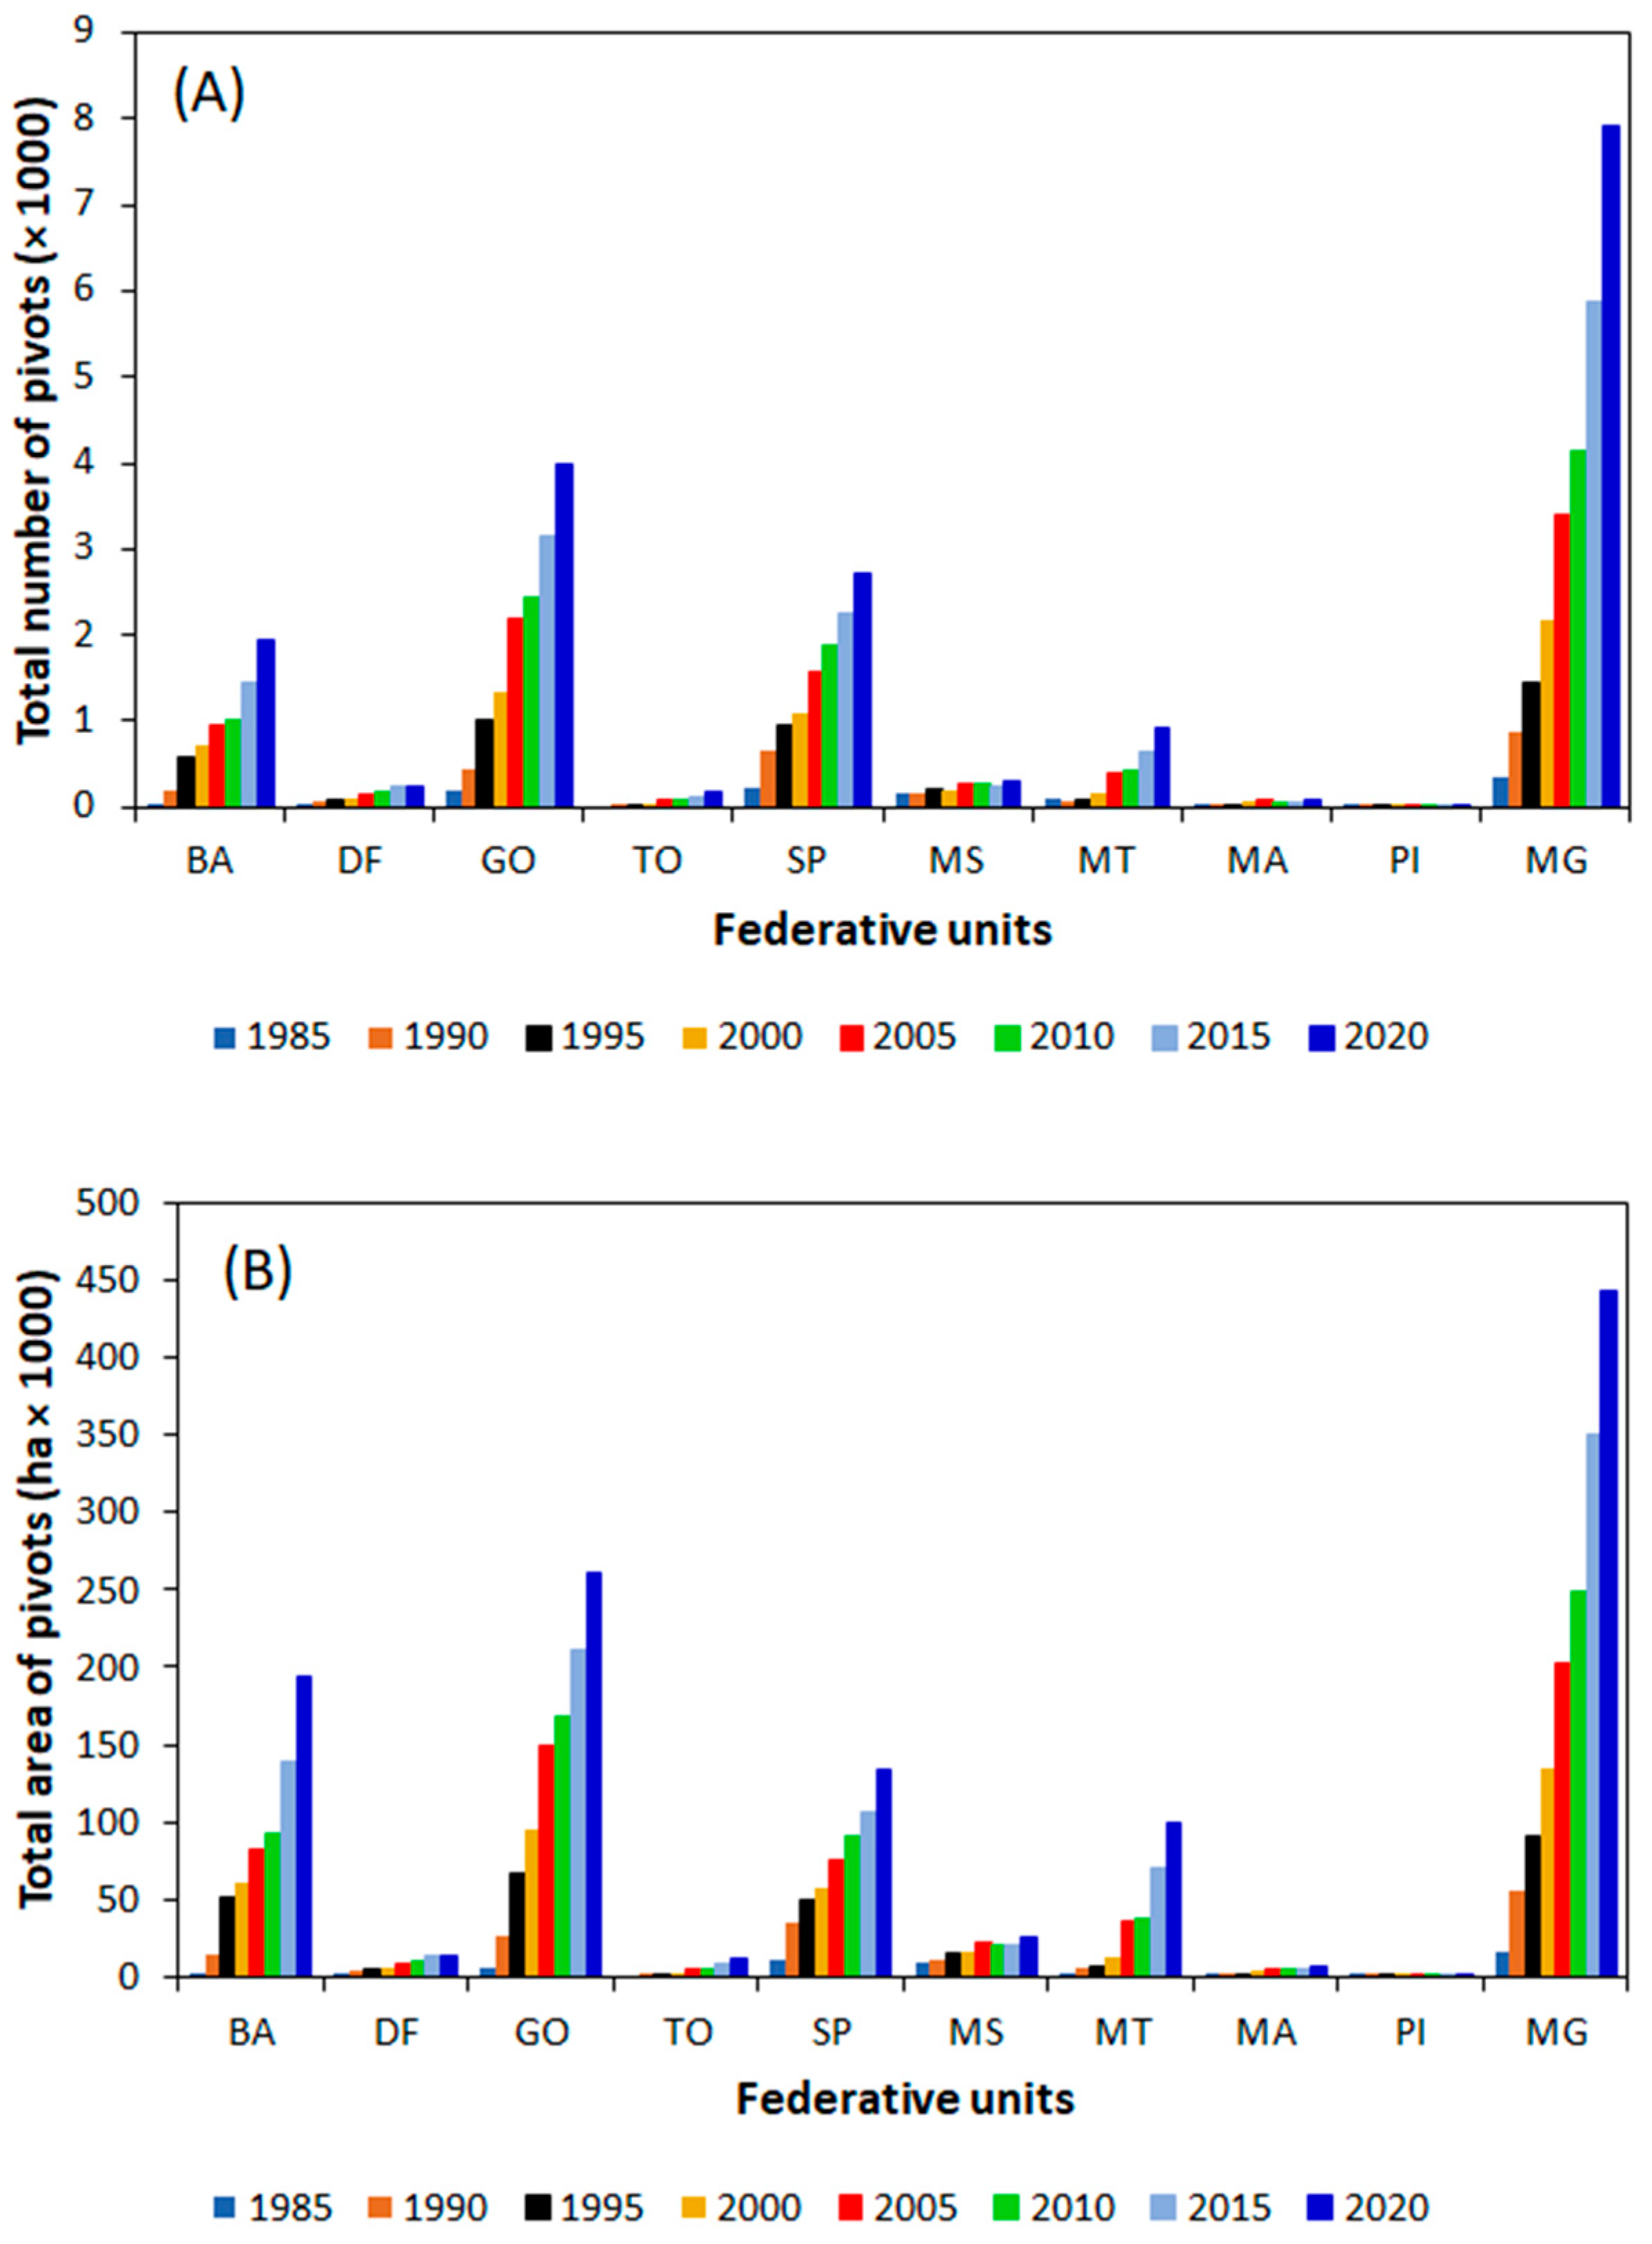
3.1. Expansion of Center Pivots

Table 1 shows the temporal dynamics of the number of center pivots and the corresponding irrigated area in the period 1985–2020. The magnitude of the increase in the number of pivots in this period was about 16 times, going from 1085 units in 1985 to 17,764 units in 2020. Regarding the total irrigated area, the magnitude of the increase was 25 times, going from 47,550 ha in 1985 to 1,191,887 ha in 2020. The growing trend in this period was relatively constant, with a slight tendency to accelerate in the last 10 years of the period. The 2020 estimates are close to the national-level surveys that have been produced by ANA and compiled for the Cerrado biome by Farias and Rodrigues [33]: total pivots of 18,820 and a total irrigated area of 1,253,792 ha. As already reported in the Methods section, ANA adopts the methodology of visual interpretation of images from the Landsat satellite to map Brazil’s center pivots, which should explain the differences found in these two studies. The Agricultural Census of the Brazilian Institute of Geography and Statistics [34] estimated a total area of 731,098 ha of center pivots in the Cerrado biome, which is lower than the estimations provided by MapBiomas Irriga project for the same year (964,452 ha).
The expansion of 25 times the irrigated area by center pivots over the Cerrado biome in the period 1985–2020 is even more impressive if compared with the expansion verified in the other five Brazilian biomes, that is, the Amazonia, Caatinga, Mata Atlântica, Pantanal, and Pampa (Table 2). In 1985, the Cerrado biome contributed to 57% of the total area of center pivots in Brazil, increasing to 76% in 2020, which agrees well with the percentage presented by Althoff and Rodrigues [27], that is, the Cerrado´s contribution of 80% in 2017. Excluding the Cerrado biome, the Mata Atlântica biome was the one that contributed the most in 2020, with 10% of the total area of center pivots in Brazil this year. According to these last authors, 3 million hectares of center pivot irrigation is expected by 2050 in the country.
Throughout the period considered in this study, we can note a prominent contribution of the states of Minas Gerais, Goiás, and São Paulo in terms of the total number of center pivots in the Cerrado biome (Figure 4; Supplementary Table S1). In 2020, Minas Gerais contributed with 43%. Practically all states presented a history of a consistent increase in the number of pivots, especially in the last 10 years (2010–2020). As highlighted by ANA [9], this trend was consistent regardless of national and international economic instability. As expected, Minas Gerais State continues to stand out in terms of total irrigated area, followed by the states of Goiás and São Paulo. In 2020, there were more than 444,000 ha of center pivots in Minas Gerais, followed by Goiás, with around 260,000 ha, and Bahia, with 194,000 ha. It is interesting to note that Bahia had a larger irrigated area than São Paulo despite having fewer pivots. This characteristic is due to the different types of agricultural crops that are irrigated in these two states, as well as the differences in topography, as discussed later in this paper. While Bahia predominates in coffee irrigation, in São Paulo, there is a predominance of vegetables and fruit trees.
The spectral pattern of irrigated coffees by center pivots presents a unique pattern in the RGB color composites of red, near-infrared, and shortwave-infrared spectral bands: a concentric circle with a yellowish color in the northwest/southeast direction and a reddish color in the northeast/southwest direction, as also pointed out by Nogueira and Macedo [35] (Figure 5). Such an effect is a consequence of the combination of the circular planting method and solar azimuth angle of about 75 degrees in September in western Bahia. In São Paulo, the most noticeable pattern is the varying size of center pivots. The semi-circular pivots are also commonly found in São Paulo (not shown in this last figure).
There is no study in Brazil that discriminates between the types of crops planted in each center pivot. This is a big challenge due to the large number of pivots distributed around different regions of the country, the frequent use of a triple-cropping system per year in each pivot, and the fluctuation in the costs of production in the national and international market, which directly affects the farmers’ decision to select what type of crop will be planted or even if they will plant or not. However, the remote sensing multispectral characteristics of different crops are shown in Figure 5, and with the advanced cloud computing capability, the perspectives to discriminate crops at the center-pivot scale may become possible soon.
The size of center pivots in Brazil can vary from around 2 ha to more than 200 ha [33]. We can roughly estimate the average size of the center pivots of the Brazilian Cerrado by dividing the total area of the center pivots by the corresponding total number of equipment. In this case, the average size for the Cerrado biome is 65 ha (Table 3). The data from 1985 was not considered because of the relatively small number of pivots. The states of Bahia, Mato Grosso do Sul, and Mato Grosso presented the highest sizes (89 ha, 79 ha, and 86 ha, respectively), while São Paulo State presented the lowest average size (50 ha). Western Bahia is well-known because of the intensive irrigated coffee production, while in Mato Grosso do Sul and Mato Grosso, the center pivots are used mostly for soybean and corn production. In São Paulo, the center pivots are quite irregular in terms of size.
Table 4 shows the average size of center pivots for each geomorphological unit in 2020. It varied from 81.3 ha in plateaus, locally known as chapadas, to 46.9 ha in platforms. Overall, large areas of flat terrains, especially plateaus, tend to present larger pivots, while more undulating terrains, especially depression, tend to present smaller pivots.

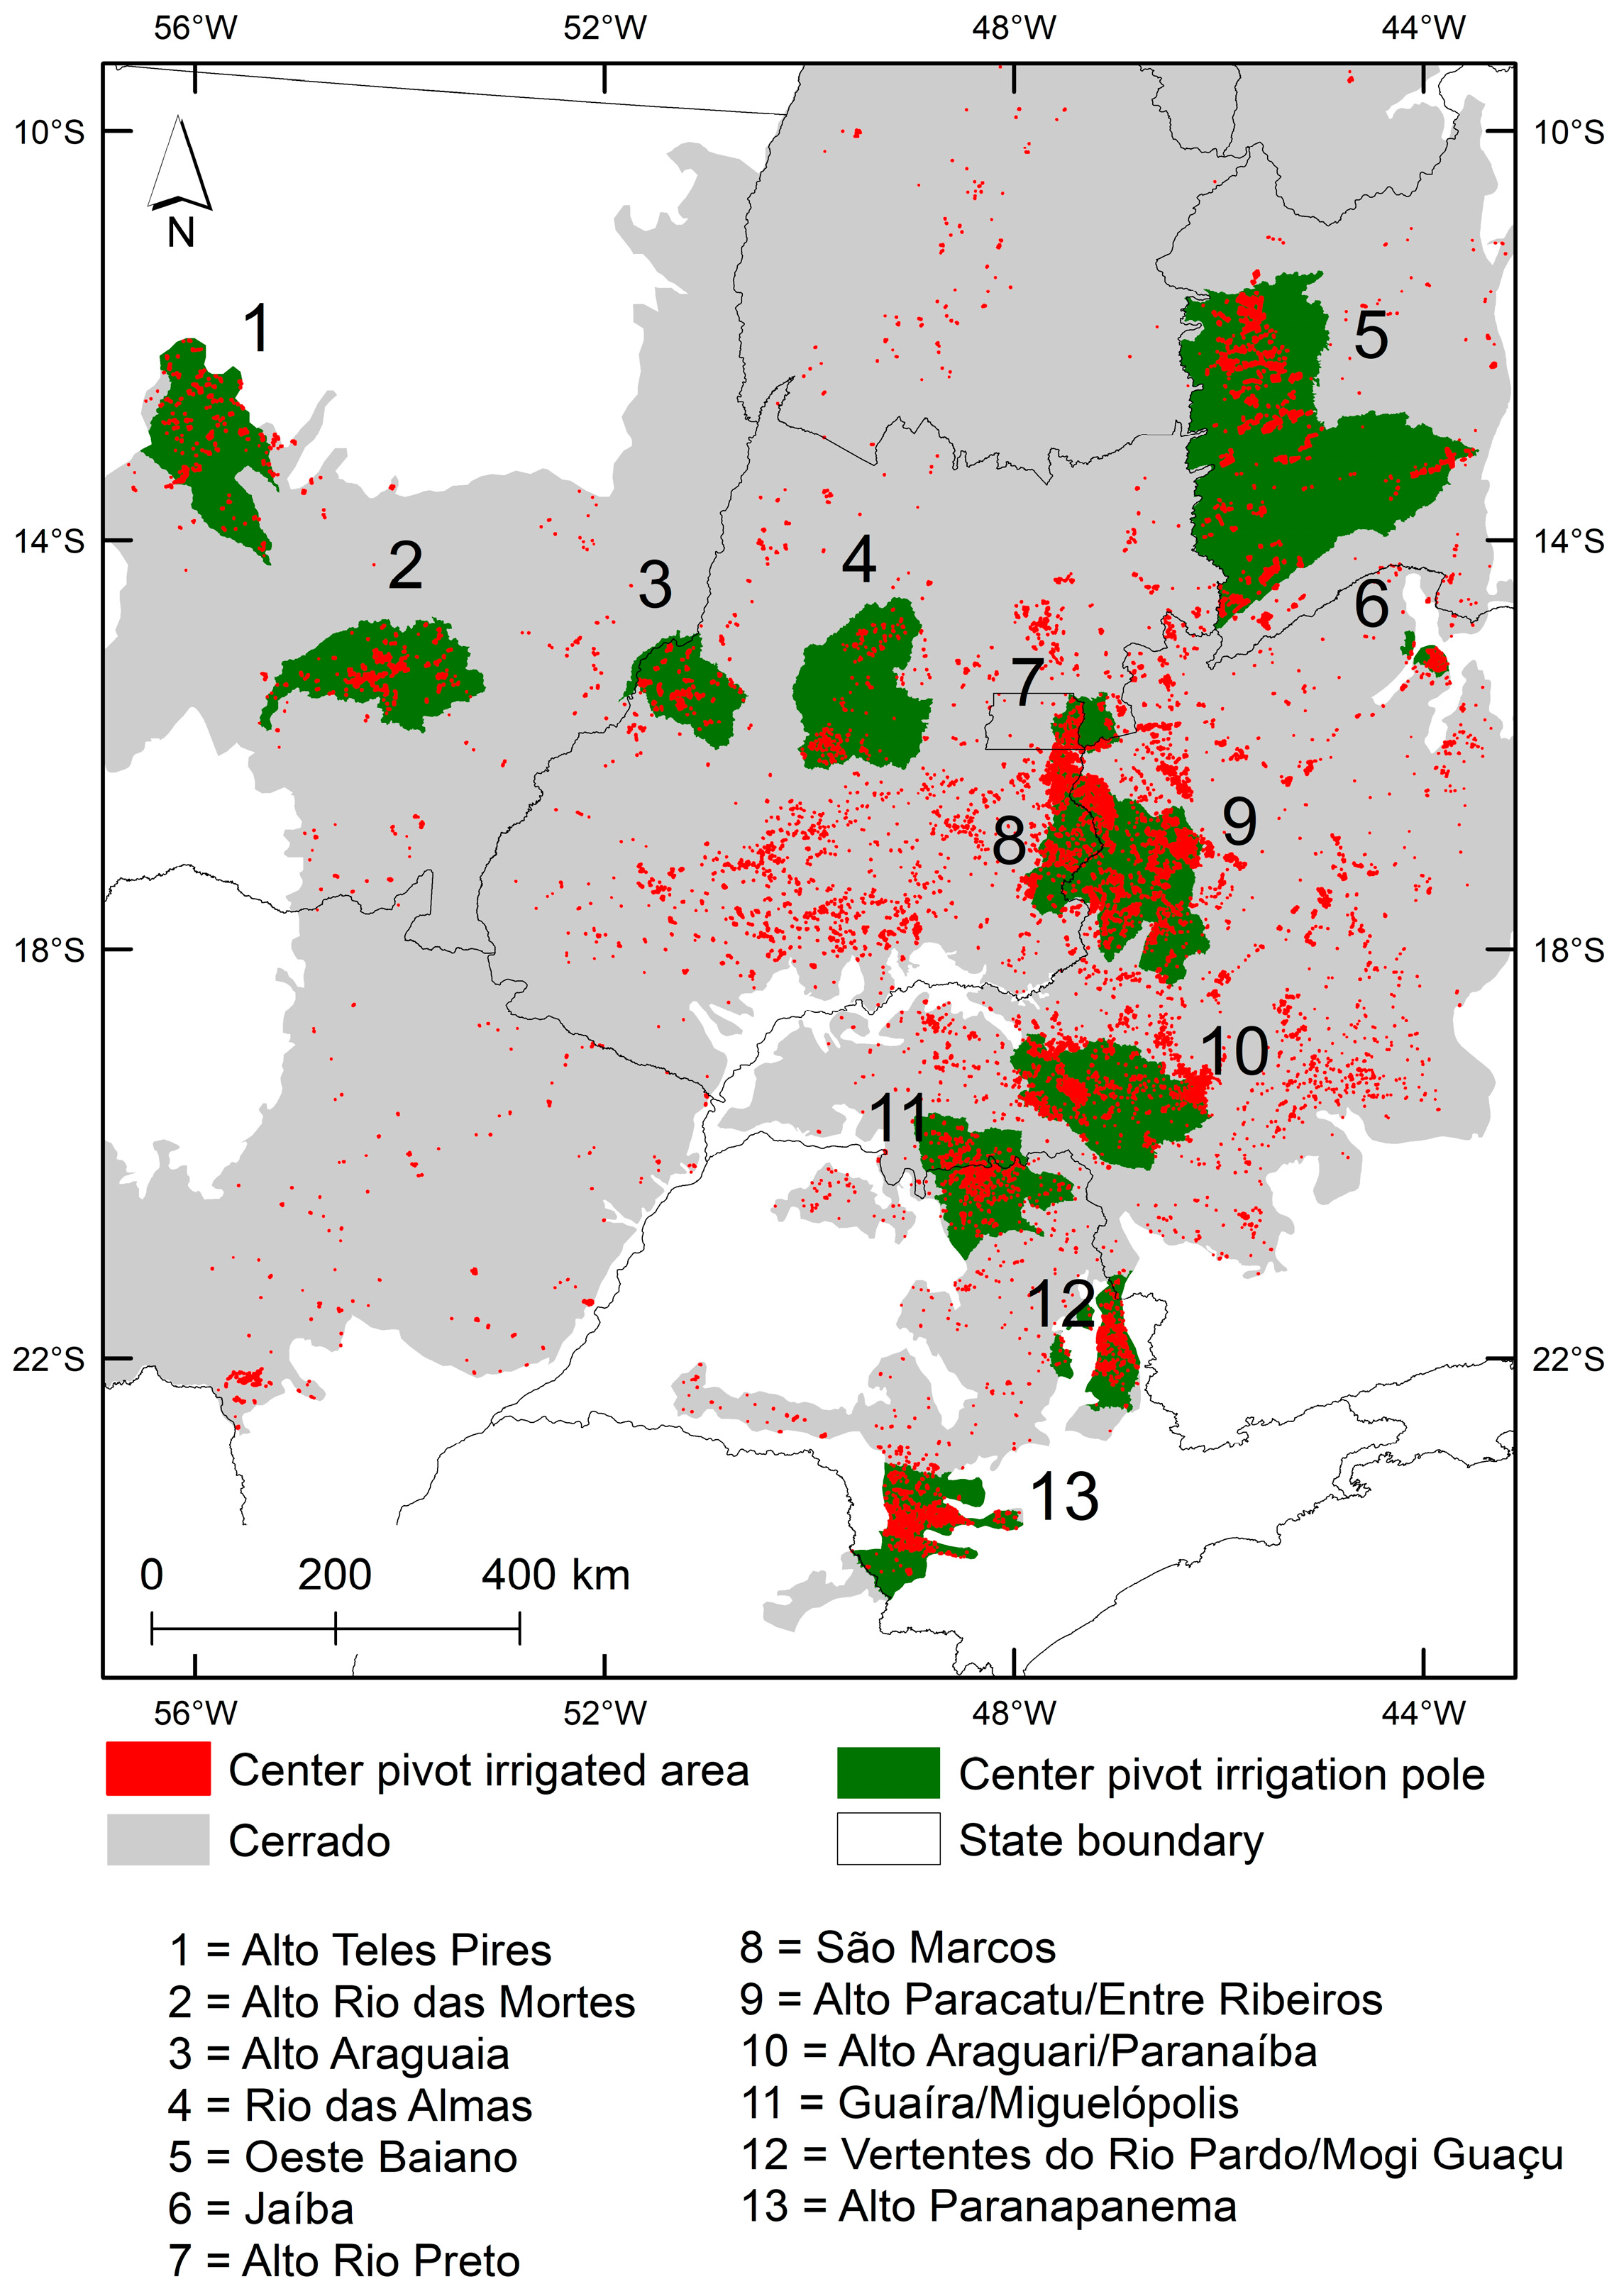
3.2. Cerrado´s Irrigation Poles

Most of the center pivots not only in the Cerrado biome but also in the whole country are concentrated in some hotspots that were named by ANA as irrigation poles [36]. The regulatory document that created the irrigation poles in Brazil was Decree No. 1082, dated 25 April 2019, by the Ministry of Rural Development, which establishes the irrigated agriculture poles initiative as an integral part of the actions for implementing the National Irrigation Policy and promoting regional development under this ministry “http://www.in.gov.br/en/web/dou/-/portaria-n%C2%BA-1.082-de-25-de-abril-de-2019-85958975 (accessed on 25 April 2024)”. In the Cerrado biome, there are 13 poles distributed in the central and southern parts of the biome (Figure 6). The average size of pivots varies significantly depending on the pole: from 50 ha in Vertentes do Rio Pardo/Mogi Guaçu, São Paulo State, to 127 ha in Alto Teles Pires, Mato Grosso State (Table 5).
The Oeste Baiano corresponds to the largest pole in terms of irrigated area (173,048 ha). The pivots in this pole present a trend of expansion towards the east direction, which is an opposite trend of annual average rainfall that tends to increase towards the west direction. In this pole, there is a big concern to avoid excessive water consumption for irrigation, as this region is quite important for underground water recharge of the 125,000-km2 nationally strategic Urucuia aquifer system [37]. The Paracatu/Entre Ribeiros pole, located in the Minas Gerais State, is the second largest in terms of the number of pivots (1259 pivots). This pole is related to the Entre Ribeiros irrigation project implemented in 1983 under the Prodecer (Programa de Desenvolvimento de Cerrados) program [38]. It’s most important irrigated crops are corn, second-crop bean, sugarcane, soybean, and cotton [36]. Alto Teles Pires pole, located in the Mato Grosso State, presents the largest pivots in size (average of 127 ha). Because it is located in a region with high levels of precipitation (>2000 mm of annual average) and well-distributed throughout the entire wet season, most of the water irrigation demand is for third-crop bean production.

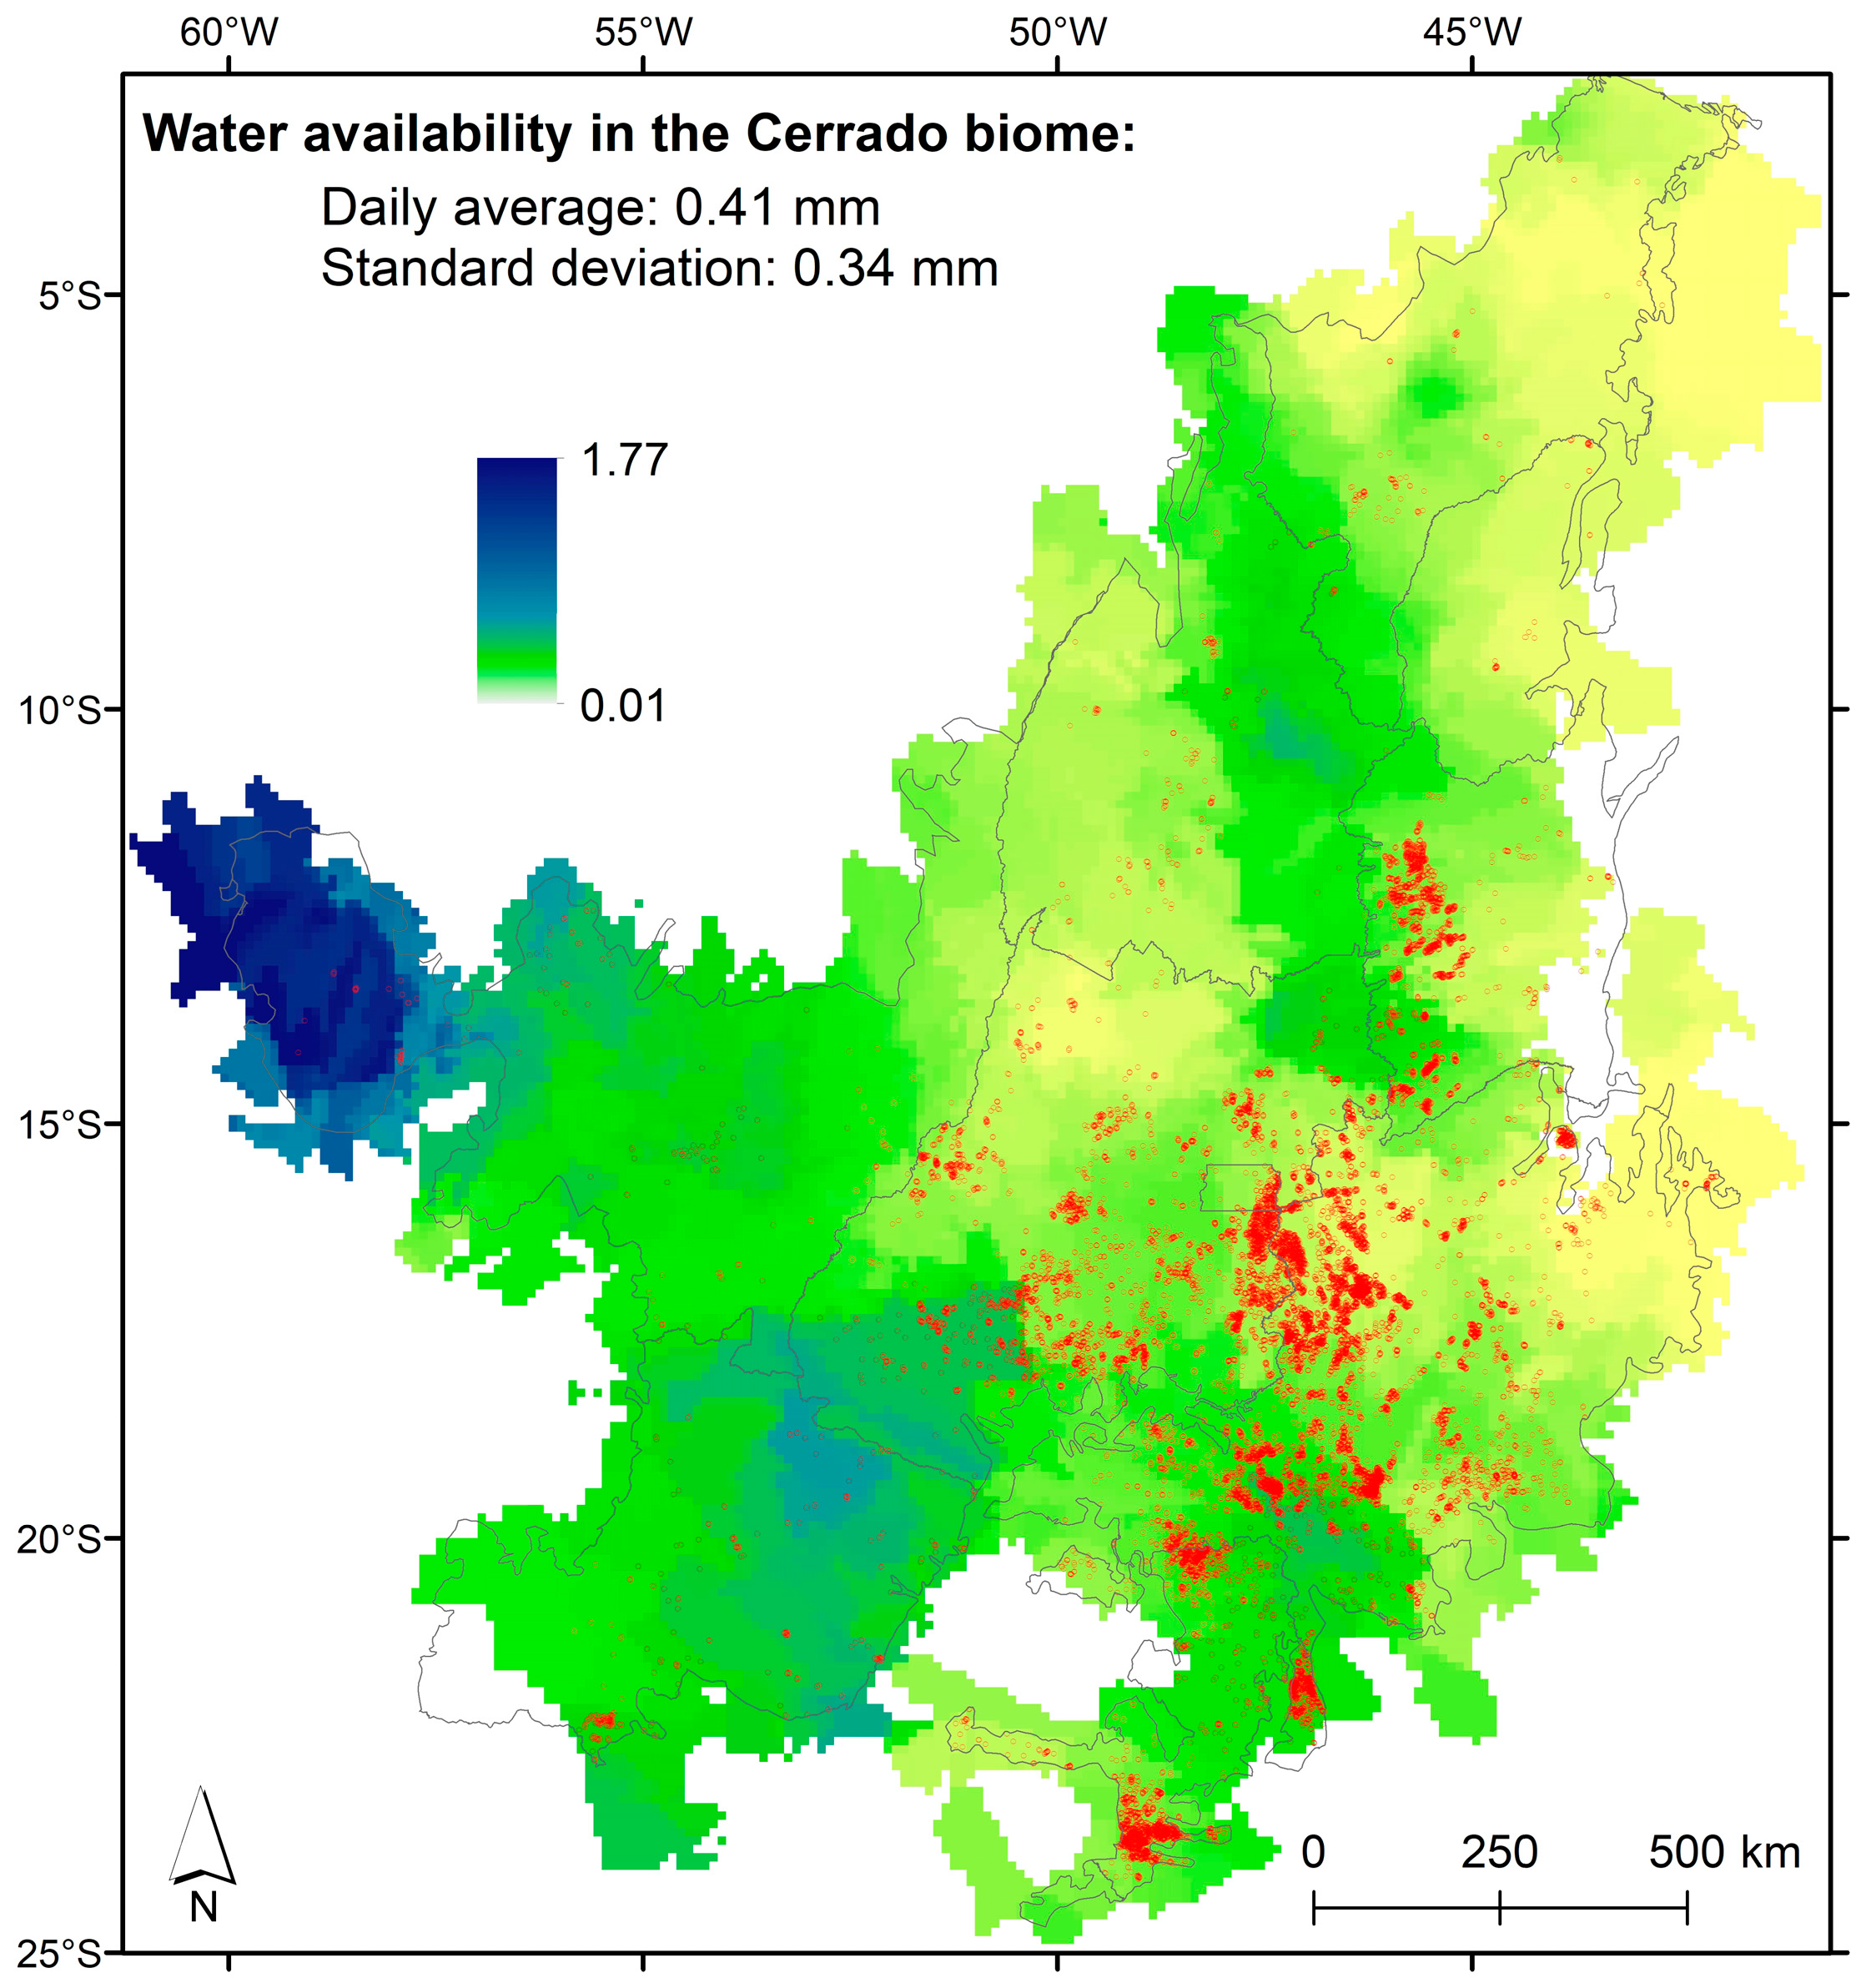
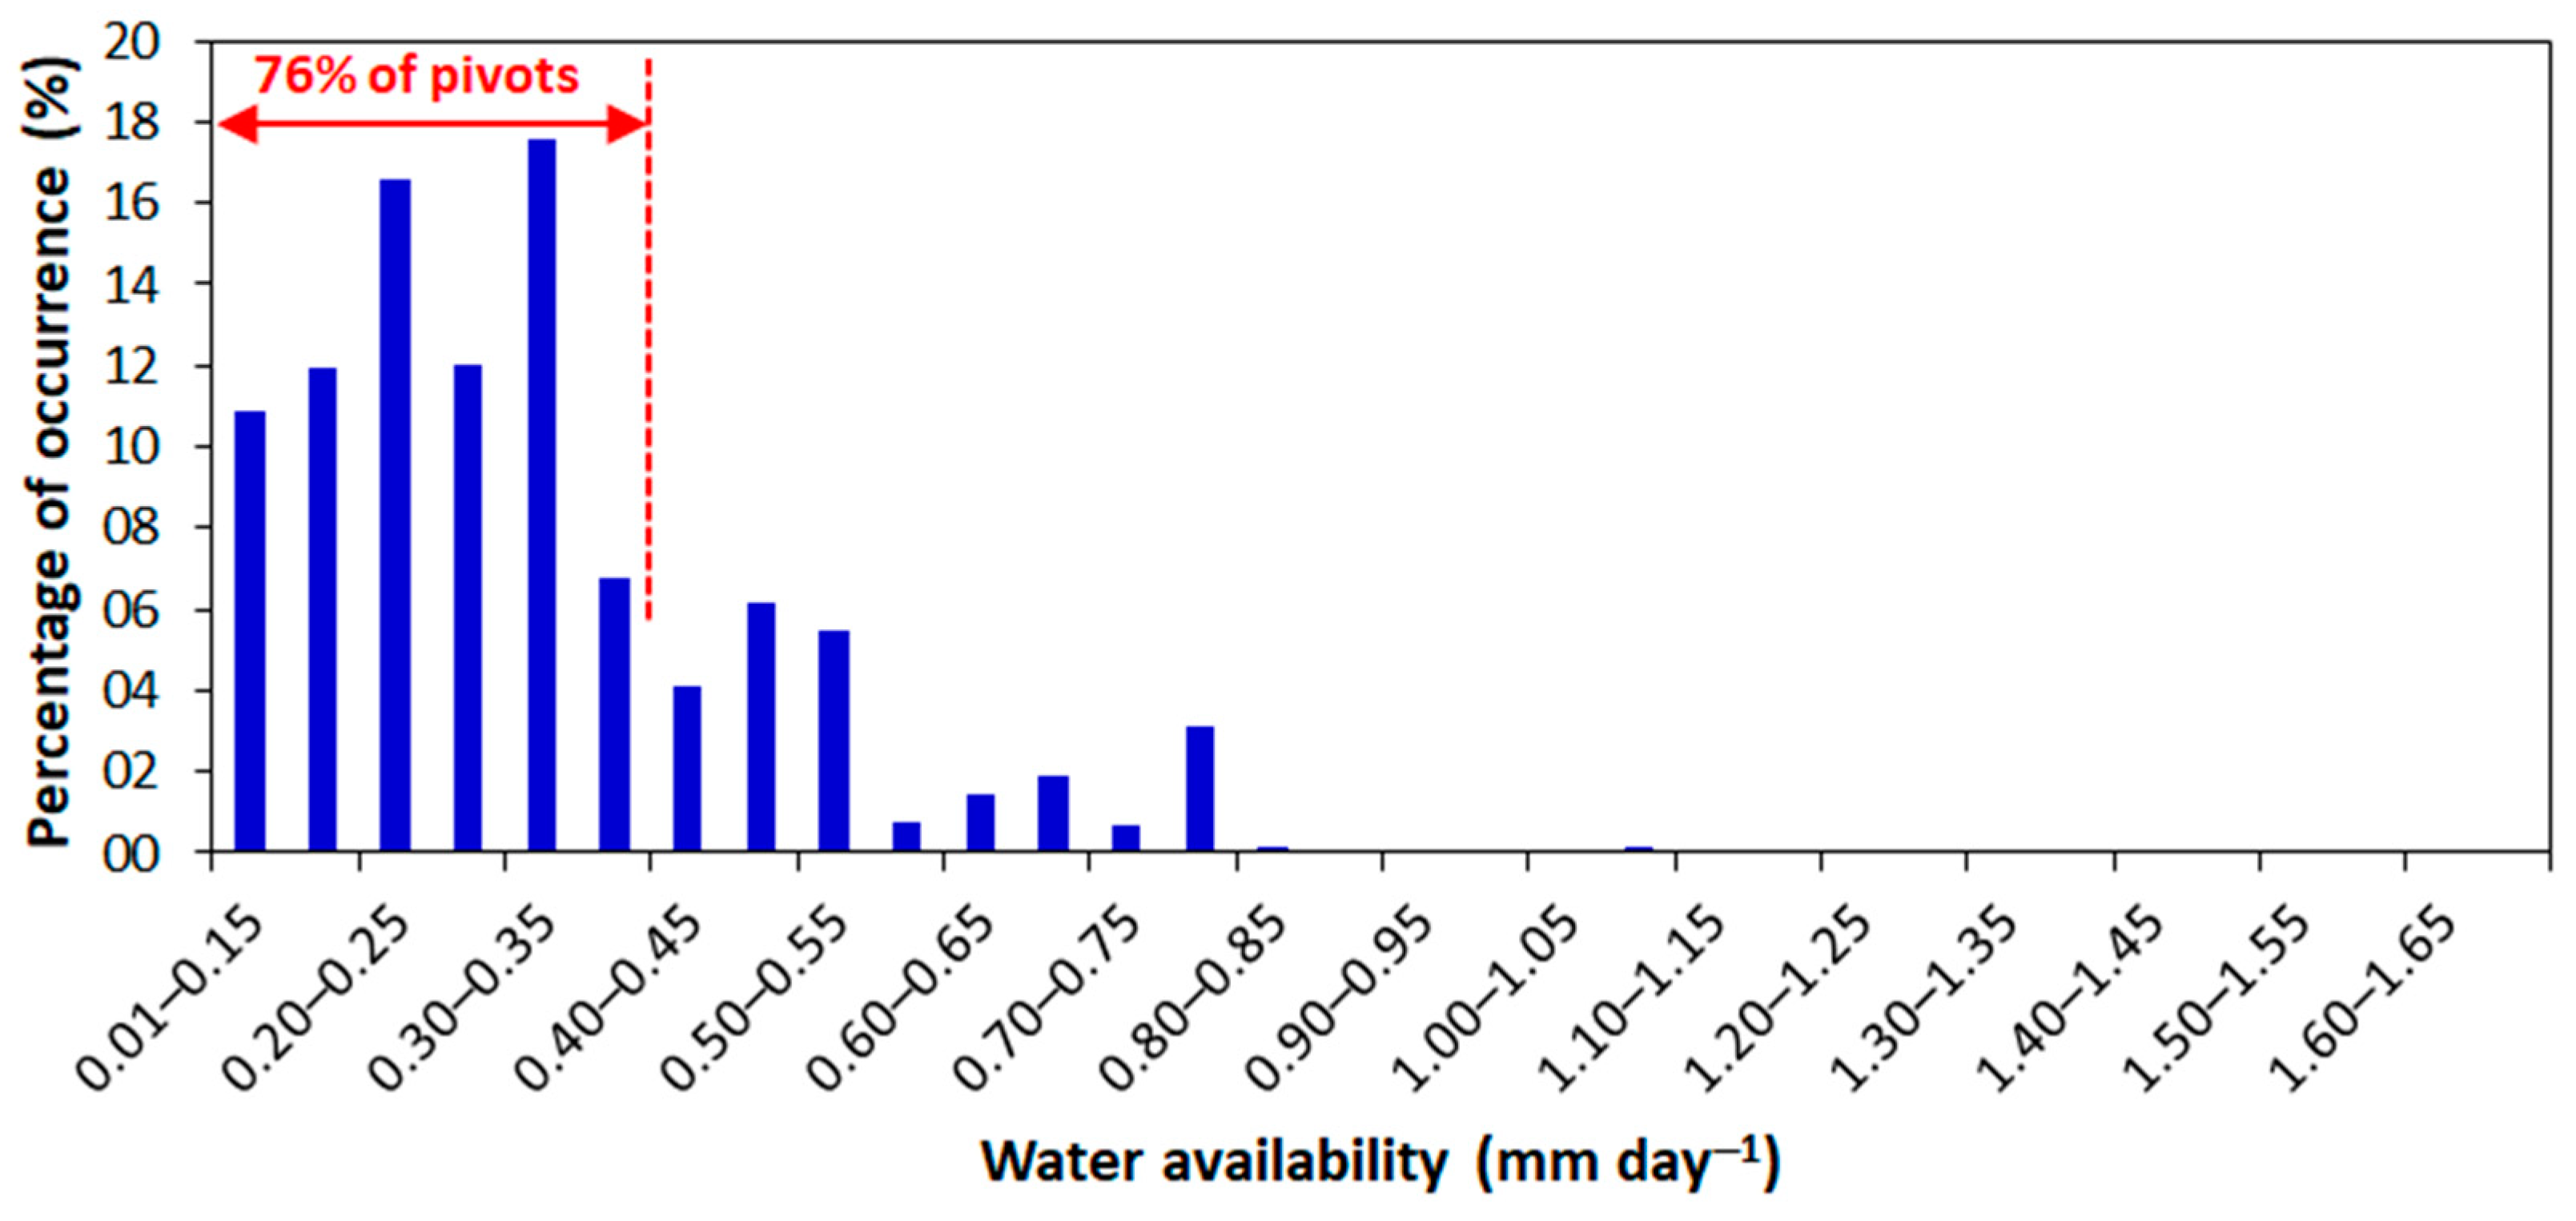
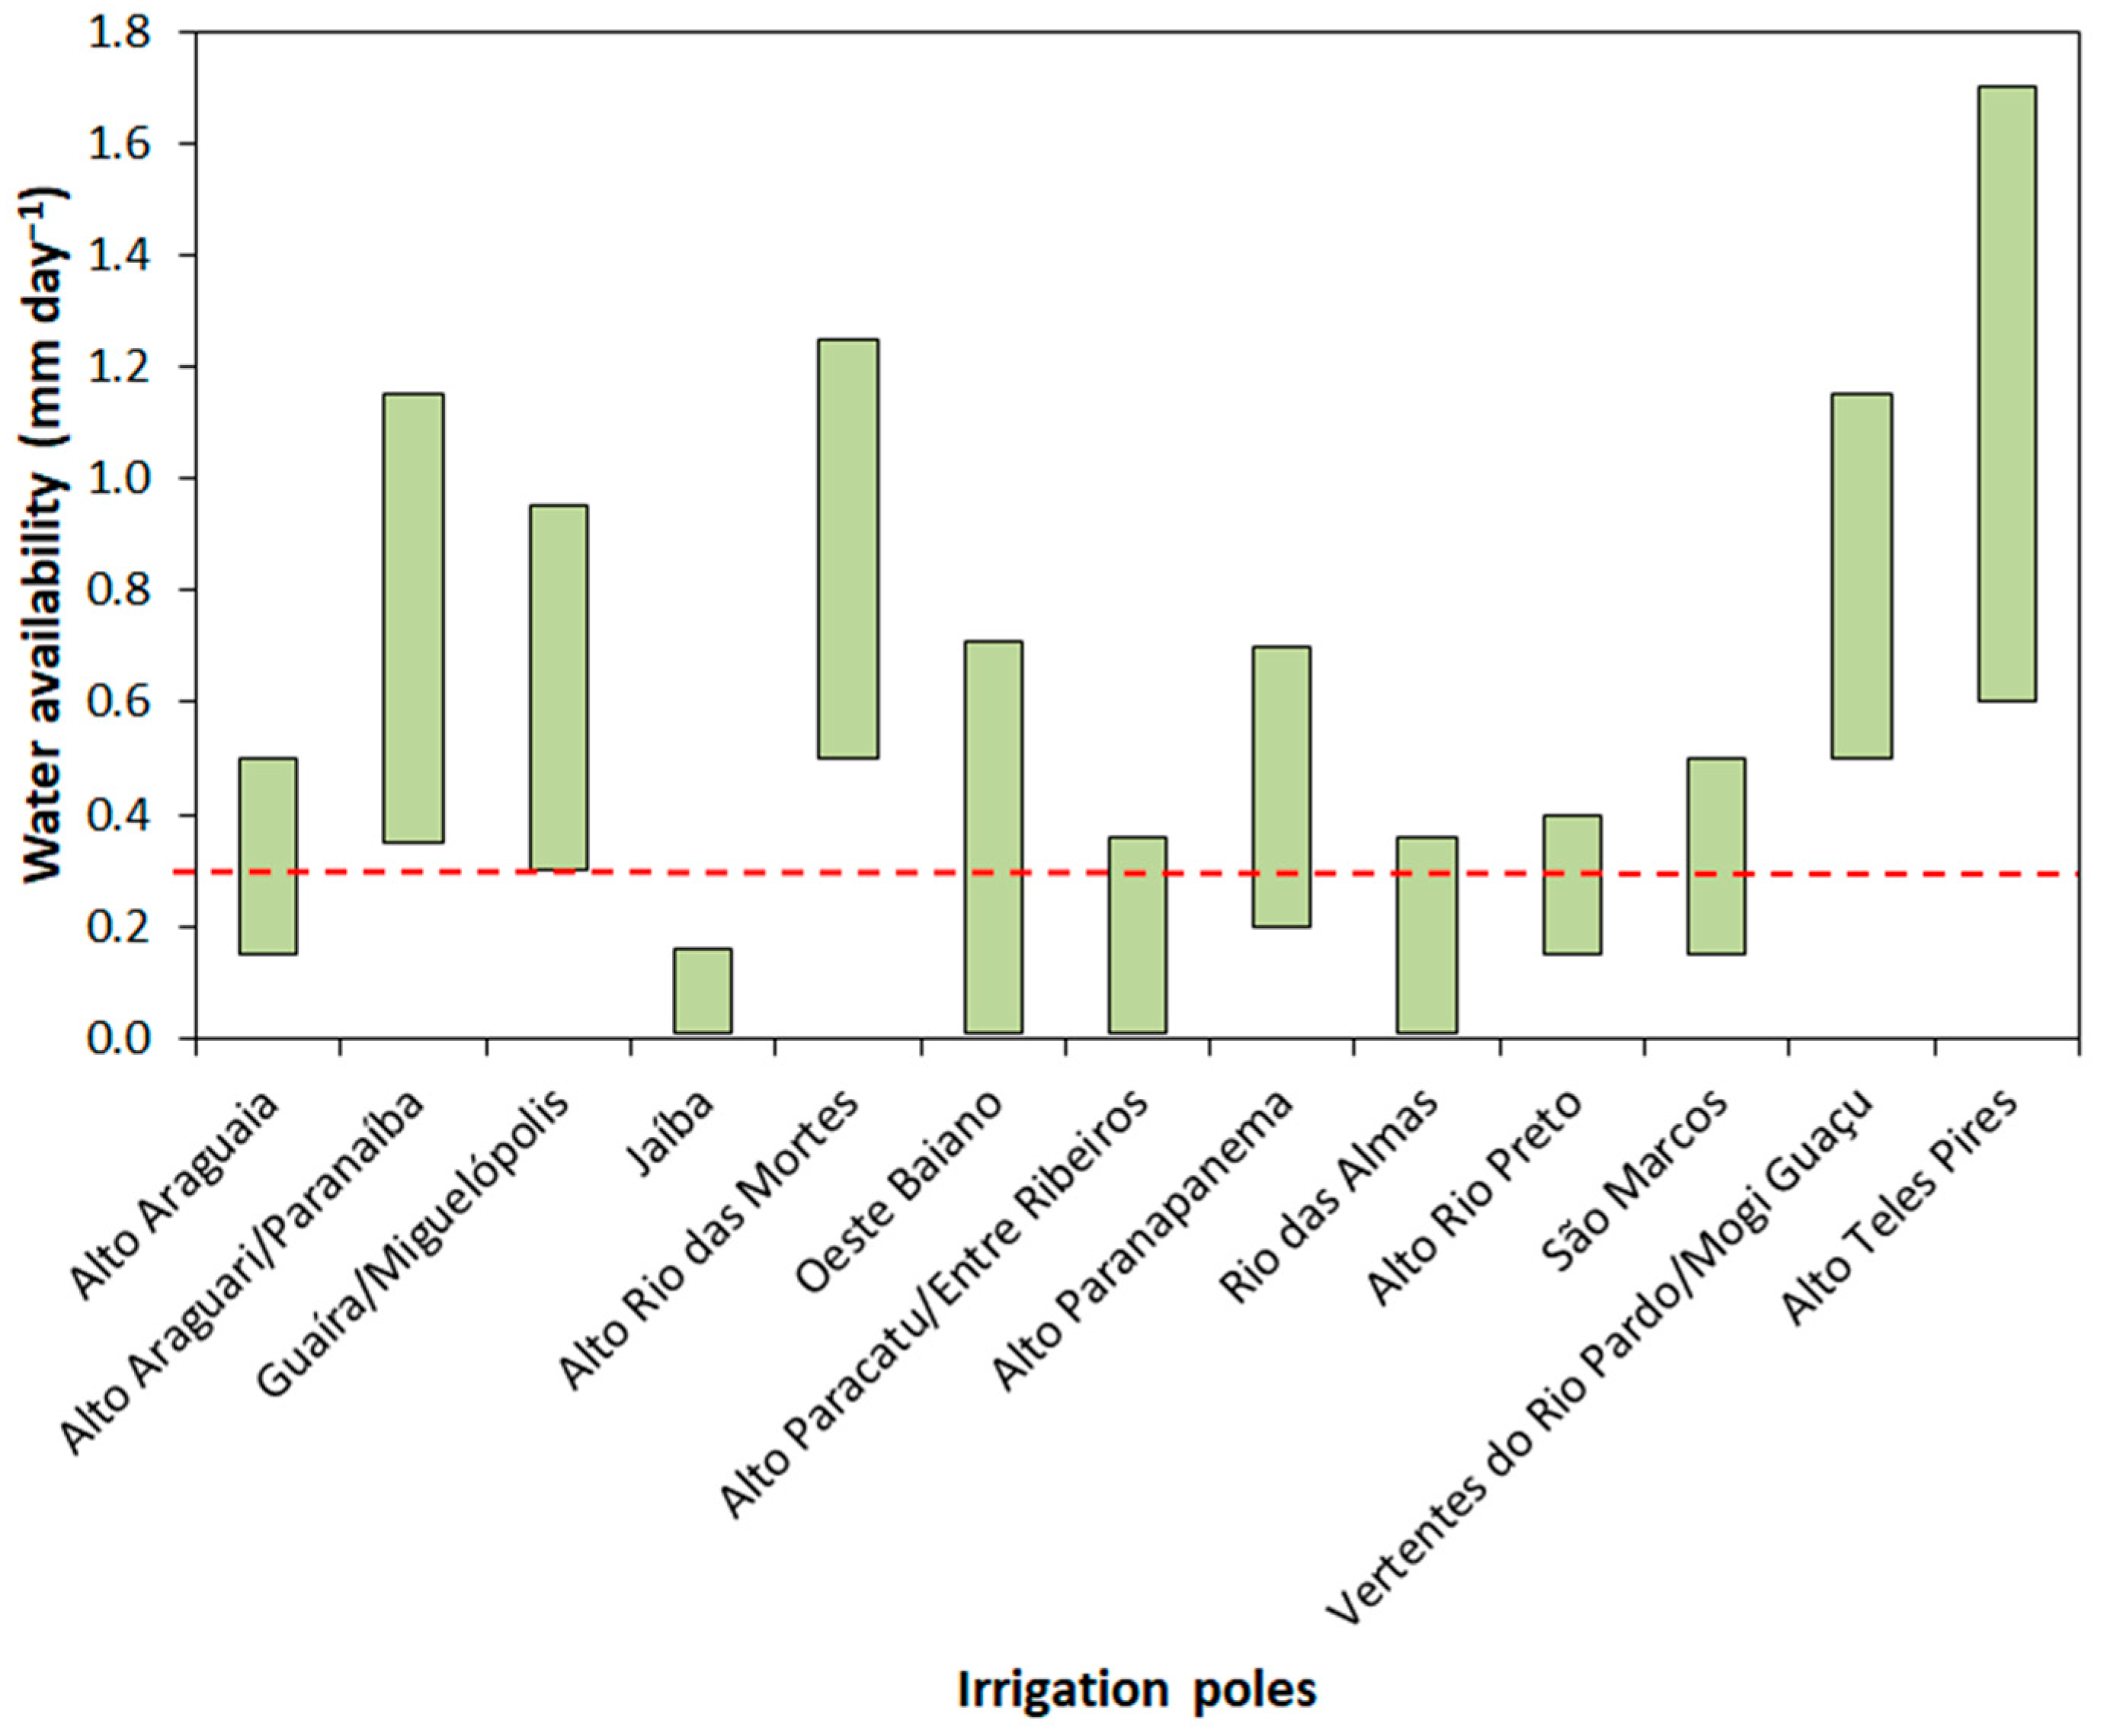
3.3. Water Availability

Analysis of the location of the central pivots mapped in 2020 by the MapBiomas Irriga project shows that most pivots are in areas with low water availability (Figure 7 and Figure 8). The states of Mato Grosso and Mato Grosso do Sul, which have the highest water availability values, had a low relative number of pivots (451 pivots). More specifically, 76% of the Cerrado pivots in 2020 were in areas with water availability below the biome average, which is 0.41 mm day−1. There is a tendency for this irrigation system to be used in areas with low water availability. In areas with high availability, the tendency is to practice rain-fed agriculture. It is important to note that more than 80% of the abstractions for irrigation in the Cerrado biome come from surface water [39]. This is mainly due to the overall insufficient water pressure from artesian wells, which causes improper functioning of the pivots. Therefore, the balance between water availability and irrigation consumption becomes important for strategic planning, economic development, and the establishment of effective water policies.
Four irrigation poles are located in the western and central regions of the Cerrado biome, presenting water availability below the biome´s average (0.41 mm day−1): Jaíba, Alto Paracatu/Entre Ribeiros, Rio das Almas, and Alto Rio Preto (Figure 9; Supplementary Table S2). Conversely, three poles (Alto Rio das Mortes, Vertentes do Rio Pardo/Mogi Guaçu, and Alto Teles Pires) are situated in the southern and western parts of the biome where water availability exceeds the average value of the Cerrado.

3.4. Retraction of Center Pivots

According to Table 6, 13.1% of center pivots in the Cerrado biome found in 2005 were abandoned or converted into other land use types, mostly rain-fed crop production, or even abandoned in 2020. This picture is quite similar in terms of the area occupied by center pivots: 12.2% of the total area occupied by center pivot irrigation systems in 1985 was converted into other land use types in 2020. This means that roughly 1% of center pivots in the Cerrado biome are becoming inactive every year.

4. Discussion

Comparing the data produced in 2017 by the three Brazilian institutions responsible for mapping center pivots at the national scale in Brazil, the Agricultural Census of IBGE, the multi-institutional MapBiomas Project, and the ANA, we noted that data from IBGE presented lower estimates. The data gathered by IBGE is based on direct interviews with the owners or responsible for the farmers and is compiled at the municipality level. As it is practically impossible to interview all owners who have center pivots, it is expected that there will be an underestimation of the number and area occupied by center pivots.
The time series of the MapBiomas Project showed that the average size of center pivots is controlled, to some extent, by the topography. Overall, large areas with flat terrains, as commonly found in the western Bahia State, for example, in the municipality of Barreiras and Luís Eduardo Magalhães or in the ecotone between the Cerrado and Amazonia in the central part of the Mato Grosso State, for example, the Alto Teles Pires irrigation pole in Mato Grosso State, tend to present large pivots (>100 ha). If the topography is undulating, the size of the pivots tends to be smaller (<60 ha), which is the case, for example, of the Vertentes do Rio Pardo/Mogi Guaçu irrigation pole in the São Paulo State. Although large center pivots can be installed in undulating terrains, farmers need to be aware of the necessity of continuous monitoring to maintain adequate and constant pumping pressure [40]. Scaloppi et al. [41] stated that the point of minimum pressure is constantly moving along the lateral line because it is influenced by the topography of the irrigated area.
The center pivots in the Cerrado biome present a trend of rapid expansion, much faster and more expressive than the other biomes in Brazil. In the Cerrado biome, the use of irrigation systems is important for farmers to increase production by adopting double or triple cropping and to reduce climatic risks associated with the six-month dry season over the Cerrado and with the frequent occurrences of dry spells during the rainy season [42]. Nevertheless, 51% of the water consumption in Brazil is related to irrigation, while domestic consumption, industry, and animal production demands represent 24%, 9%, and 8%, respectively [43].
Our study intended to provide reliable information to assist decision markers for adequate water resources management and to minimize future conflicts of water demand in the Cerrado biome. It allows for identifying critical regions in the biome with high water demand for irrigation and with low water availability. Irrigated areas are mostly found in regions with low water availability. However, the data analysis of the irrigated areas should be conducted based on the watershed scale, as pointed out by Lima et al. [44]. ANA provides vector-based data that discriminates the Brazilian hydrographic regions into different hierarchical ottobasins that can be used for such purposes. For example, the level 5 ottocoded hydrographic base for the Cerrado biome is composed of 4531 ottobasins [45]. The data analysis considering all sub-basins of different sizes was out-of-scope of this study because of the huge volume of data to be analyzed.
Because of its location in the highlands of the central portion of the country, the Cerrado biome is strategic for water resources in Brazil. This biome encompasses the headwaters and the largest portions of the major South American watersheds, including the Paraná-Paraguay, Araguaia-Tocantins, and São Francisco River basins, as well as the upper catchments of large Amazon tributaries, mainly the Xingu and Tapajós [46]. Our study revealed the presence of 1.2 million ha of center pivots in the Cerrado biome, representing approximately 10% of the total area suitable for irrigation in this biome (10 million ha), according to Christofidis [47]. This suggests that, depending on market conditions and bank financing, the practice of irrigation in this biome still has substantial potential for expansion. However, despite the numerous benefits associated with irrigated agriculture, it can lead to conflicts in certain regions because of its substantial water resource demands. Furthermore, the number of pivots operating illegally appears significant, although the exact number is unknown. For example, in the Goiás State, more than 2600 pivots (out of 3991 pivots identified in this study in 2020) are operating without the environmental licenses required by the state environmental agency [46], thereby posing a higher risk of disrupting water flows in creeks and rivers.
Some basins in the Cerrado biome are already experiencing increased disputes over water usage because of the rapid expansion of irrigated agriculture, which lacks long-term planning and monitoring of natural resource uses [48]. Particular attention should be given to irrigation poles located in the eastern part of the Cerrado biome, especially in the western regions of Bahia and Minas Gerais, where water availability is a critical concern. For instance, in the Oeste Baiano irrigation pole, 173,048 ha of center pivots were recorded in 2020. Assuming a water consumption rate of 1 L s−1 ha−1 per pivot, the water demand for this area would be approximately 173 m3 s−1 if all irrigation systems operated simultaneously. Given that 51% of the water consumption in Brazil is attributed to irrigation [39], the total water demand in the hydrographic basin where this pole is located should be at least 339 m3 s−1. The critical issue here is the lack of data on water flow in the main stream of this sub-basin (Formoso River sub-basin). Therefore, measuring the water flow in this river is essential for implementing effective water management practices in the region. In addition, it is important to note that, in the Cerrado biome, the primary water source for center pivots is surface water rather than groundwater.
Our data analysis showed that neither the monitoring of the expansion of center pivots in Brazil by using fully automated artificial intelligence procedures nor the initiatives based solely on visual interpretation is free of errors. Fully automated procedures tend to present commission errors, while visual interpretation tends to present omission errors. We believe that the results produced by both procedures should be complemented by a careful expert inspection. Therefore, the results obtained in this study can provide important assistance for decision-makers, especially in the expansion analysis and agro-environmental regional planning.

5. Conclusions

The objective of this study was to evaluate the expansion and retraction of irrigated areas by center pivots in the Cerrado biome in the period 1985–2020. The main findings are as follows:
(1)
The magnitude of expansion of the center pivots in the Cerrado during the period 1985–2020 was about 17 times in terms of number of pivots and even higher (26 times) in terms of total irrigated area.
(2)
Among the 13 irrigation poles located in the Cerrado biome, the Oeste Baiano, Bahia State, and the São Marcos, Goiás State, presented the largest areas of center pivots: approximately 173,000 ha and 102,000 ha, respectively.
(3)
Most of the center pivots are concentrated in regions with low water availability.
(4)
The retraction of center pivots in the Cerrado biome was, to some extent, significant over a 15-year period. More than 10% of active pivots in 2005 were inactive in 2020, mostly encompassed by a much larger rain-fed cropland or even abandoned.

Supplementary Materials

The following supporting information can be downloaded at https://www.mdpi.com/article/10.3390/w16131897/s1, Supplementary Table S1: Number and area of center pivots in the Brazilian states covered by the Cerrado biome; Supplementary Table S2: Percentage of occurrence of water availability classes per irrigation pole.

Author Contributions

Conceptualization and methodology, E.E.S.; validation, E.E.S. and I.A.L.M.; formal analysis, E.E.S. and I.A.L.M.; data curation, E.E.S.; writing—original draft preparation, E.E.S.; writing—review and editing, E.E.S., I.A.L.M., L.N.R. and É.L.B.; funding acquisition, E.E.S. and É.L.B. All authors have read and agreed to the published version of the manuscript.

Funding

This research was funded by the Fundação de Apoio à Pesquisa do Distrito Federal (FAPDF), grants # 00193.00002276/2022-90 “Demanda Espontânea” and 00193.00002586/2022-12 “AgroLearning”.

Data Availability Statement

The data presented in this study are available upon request to the corresponding author.

Acknowledgments

The authors would like to thank the associate editor and the anonymous reviewers for their important help in improving the original version of this paper.

Conflicts of Interest

The authors declare no conflicts of interest.

References

  1. Zalles, V.; Hansen, M.C.; Potapov, P.V.; Stehman, S.V.; Tyukavina, A.; Pickens, A.; Song, X.P.; Adusei, B.; Okpa, C.; Aguilar, R.; et al. Near doubling of Brazil´s intensive row crop area since 2000. Proc. Natl. Acad. Sci. USA 2019, 116, 428–435. [Google Scholar] [CrossRef] [PubMed]
  2. Sano, E.E.; Rodrigues, A.A.; Martins, E.S.; Bettiol, G.M.; Bustamante, M.M.C.; Bezerra, A.S.; Couto, A.F., Jr.; Vasconcelos, V.; Schuler, J.; Bolfe, E.L. Cerrado ecoregions: A spatial framework to assess and prioritize Brazilian savanna environmental diversity for conservation. J. Environ. Manag. 2019, 232, 818–828. [Google Scholar] [CrossRef]
  3. Agrosatélite. Análise Geoespacial da Expansão da Soja no Bioma Cerrado: 2001 a 2021; Agrosatélite: Florianópolis, SC, Brazil, 2021; p. 25. [Google Scholar]
  4. Alvares, C.A.; Stape, J.L.; Sentelhas, P.C.; Gonçalves, J.L.M.; Sparovek, G. Köppen’s climate classification map for Brazil. Meteorol. Z. 2013, 22, 711–728. [Google Scholar] [CrossRef] [PubMed]
  5. Spangler, K.R.; Lynch, A.H.; Spera, S.A. Precipitation drivers of cropping frequency in the Brazilian Cerrado: Evidence and implications for decision-making. Weather Clim. Soc. 2017, 9, 201–213. [Google Scholar] [CrossRef]
  6. Silva, F.A.M.; Assad, E.D.; Evangelista, B.A. Caracterização climática do bioma Cerrado. In Cerrado: Ecologia e Flora; Sano, S.M., Almeida, S.P., Ribeiro, J.F., Eds.; Embrapa Informação Tecnológica: Brasília, DF, Brazil, 2008; pp. 69–106. [Google Scholar]
  7. Grafton, R.Q.; Williams, J.; Perry, C.J.; Molle, F.; Ringler, C.; Stedutor, P.; Udall, B.; Wheeler, S.A.; Wang, Y.; Allen, R.G. The paradox of irrigation efficiency: Higher efficiency rarely reduces water consumption. Science 2018, 361, 748–750. [Google Scholar] [CrossRef] [PubMed]
  8. Santos, I.S.; Mantovani, E.C.; Venancio, L.P.; Cunha, F.F.; Aleman, C.C. Controlled water stress in agricultural crops in Brazilian Cerrado. Biosci. J. 2020, 36, 886–895. [Google Scholar] [CrossRef]
  9. ANA. Atlas Irrigação: Uso da Água na Agricultura Irrigada, 2nd ed.; ANA: Brasília, DF, Brazil, 2021; p. 130. [Google Scholar]
  10. Althoff, D.; Rodrigues, L.N. The expansion of center-pivot irrigation in the Cerrado biome. Irriga 2019, 1, 56–61. [Google Scholar] [CrossRef]
  11. Heller, R.C.; Johnson, K.A. Estimating irrigated land acreage from Landsat imagery. Photogramm. Eng. Remote Sens. 1979, 45, 1379–1386. [Google Scholar]
  12. Ozdogan, M.; Gutman, G. A new methodology to map irrigated areas using multi-temporal MODIS and ancillary data: An application example in the continental US. Remote Sens. Environ. 2008, 112, 3520–3537. [Google Scholar] [CrossRef]
  13. Chen, Y.; Lu, D.; Luo, L.; Pokhrel, Y.; Deb, K.; Huang, J.; Ran, Y. Detecting irrigation extent, frequency, and timing in a heterogeneous arid agricultural region using MODIS time series, Landsat imagery, and ancillary data. Remote Sens. Environ. 2018, 204, 197–211. [Google Scholar] [CrossRef]
  14. ANA. Levantamento da Agricultura Irrigada por Pivôs Centrais no Brasil (1985–2017), 2nd ed.; ANA: Brasília, DF, Brazil, 2019; p. 46. [Google Scholar]
  15. Rundquist, D.C.; Hoffman, R.O.; Carlson, M.P.; Cook, A.E. The Nebraska Center-Pivot Inventory: An example of operational satellite remote sensing on a long-term basis. Photogramm. Eng. Remote Sens. 1989, 55, 587–590. [Google Scholar]
  16. Schmidt, W.; Coelho, R.D.; Jacomazzi, M.A.; Antunes, M.A. Spatial distribution of center pivots in Brazil: I—Southeast region. Rev. Bras. Eng. Agríc. Ambient. 2004, 8, 330–333. [Google Scholar] [CrossRef]
  17. Sano, E.E.; Lima, J.E.; Silva, E.M.; Oliveira, E.C. Estimative variation in the water demand for irrigation by center pivot in Distrito Federal-Brazil, between 1992 and 2002. Eng. Agríc. 2005, 25, 508–515. [Google Scholar] [CrossRef]
  18. MapBiomas. Irrigation–Appendix, Collection 8. Available online: https://brasil.mapbiomas.org/wp-content/uploads/sites/4/2023/08/Irrigation-Appendix-C8.docx.pdf (accessed on 22 March 2024).
  19. MapBiomas. MapBiomas v. 8.0. Available online: https://plataforma.brasil.mapbiomas.org/irrigacao (accessed on 22 March 2024).
  20. Saraiva, M.; Protas, E.; Salgado, M.; Souza, C., Jr. Automatic mapping of center pivot irrigation systems from satellite images using deep learning. Remote Sens. 2020, 12, 558. [Google Scholar] [CrossRef]
  21. Albuquerque, A.O.; Carvalho Júnior, O.A.; Carvalho, O.L.F.; Bem, P.P.; Ferreira, P.H.G.; Moura, R.S.; Silva, C.R.; Gomes, R.A.T.; Guimarães, R.F. Deep semantic segmentation of center pivot irrigation systems from remote sensed data. Remote Sens. 2020, 12, 2159. [Google Scholar] [CrossRef]
  22. IBGE. Mapa de Biomas e de Vegetação; IBGE: Rio de Janeiro, RJ, Brazil, 2004. Available online: https://agenciadenoticias.ibge.gov.br/agencia-sala-de-imprensa/2013-agencia-de-noticias/releases/12789-asi-ibge-lanca-o-mapa-de-biomas-do-brasil-e-o-mapa-de-vegetacao-do-brasil-em-comemoracao-ao-dia-mundial-da-biodiversidade (accessed on 22 March 2024).
  23. Sano, E.E.; Rosa, R.; Brito, J.L.S.; Ferreira, L.G. Land cover mapping of the tropical savanna region in Brazil. Environ. Monit. Assess. 2010, 166, 113–124. [Google Scholar] [CrossRef]
  24. BFG. Brazilian Flora 2020: Leveraging the Power of a Collaborative Scientific Network; Taxon; BFG: Araquari, SC, Brazil, 2021; Available online: https://onlinelibrary.wiley.com/doi/epdf/10.1002/tax.12640 (accessed on 26 March 2024).
  25. Françoso, R.D.; Brandão, R.; Nogueira, C.C.; Salmona, Y.B.; Machado, R.B.; Colli, G.R. Habitat loss and the effectiveness of protected areas in the Cerrado biodiversity hotspot. Nat. Conserv. 2015, 13, 35–40. [Google Scholar] [CrossRef]
  26. Rodrigues, A.A.; Macedo, M.N.; Silvério, D.V.; Maracahipes, L.; Coe, M.T.; Brando, P.M.; Shimbo, J.Z.; Rajão, R.; Soares-Filho, B.; Bustamante, M.M.C. Cerrado deforestation threatens regional climate and water availability for agriculture and ecosystems. Glob. Chang. Biol. 2022, 28, 6807–6822. [Google Scholar] [CrossRef]
  27. Althoff, D.; Rodrigues, L.N. Recursos hídricos superficiais no Cerrado. In Agricultura Irrigada no Cerrado: Subsídios para o Desenvolvimento Sustentável; Rodrigues, L.N., Ed.; Embrapa: Brasília, DF, Brazil, 2023; Chapter 4; pp. 92–113. [Google Scholar]
  28. IBGE; Brazilian Institute of Geography and Statistics. Manual Técnico de Geomorfologia; IBGE: Rio de Janeiro, RJ, Brazil, 2009; p. 182. [Google Scholar]
  29. Althoff, D.; Rodrigues, L.N.; Silva, D.D. Assessment of water availability in the Cerrado. Appl. Water Sci. 2021, 11, 176. [Google Scholar] [CrossRef]
  30. Pushpalatha, R.; Perrin, C.; Le Moine, N.; Mathevet, T.; Andréassian, V. A downward structural sensitivity analysis of hydrological models to improve low-flow simulation. J. Hydrol. 2011, 411, 66–76. [Google Scholar] [CrossRef]
  31. Hufman, G.J.; Bolvin, D.T.; Braithwaite, D.; Hsu, K.; Joyce, R.; Kidd, C.; Nelkin, E.J.; Sorooshian, S.; Tan, J.; Xie, P. Integrated Multi-Satellite Retrievals for GPM (IMERG); Algorithm Theoretical Basis Document, National Aeronautics and Space Administration: Washington, DC, USA, 2019; p. 38. [Google Scholar]
  32. NICFI. Norway´s International Climate and Forest Initiative. Standing with the World’s Tropical Forests. 2021. Available online: https://www.nicfi.no/ (accessed on 22 March 2024).
  33. Farias, D.B.S.; Rodrigues, L.N. Agricultura Irrigada no Cerrado. In Agricutura Irrigada no Cerrado: Subsídios para o Desenvolvimento Sustentável; Rodrigues, L.N., Ed.; Embrapa: Cerrados, Planaltina, DF, Brazil, 2023; Chapter 7; pp. 176–200. [Google Scholar]
  34. IBGE; Brazilian Institute of Geography and Statistics. Censo Agro 2017. Available online: https://censoagro2017.ibge.gov.br/ (accessed on 22 March 2024).
  35. Nogueira, S.M.C.; Macedo, C.R. Mapeamento de lavouras de café irrigado por pivô central no extremo oeste baiano por meio de imagens do satélite ResourceSat-1. In Proceedings of the XVI Simpósio Brasileiro de Sensoriamento Remoto, Foz do Iguaçu, PR, Brazil, 13–18 April 2013. [Google Scholar]
  36. ANA. Agência Nacional de Águas. Polos nacionais de agricultura irrigada. In Mapeamento de Áreas Irrigadas com Imagens de Satélite; ANA: Brasília, DF, Brazil, 2020; p. 46. [Google Scholar]
  37. Gonçalves, R.D.; Stollberg, R.; Weiss, H.; Chang, H.K. Using GRACE to quantify the depletion of terrestrial water storage in Northeastern Brazil: The Urucuia aquifer system. Sci. Total Environ. 2020, 705, 135845. [Google Scholar] [CrossRef]
  38. Hosono, A.; Hamaguchi, N.; Bojanic, A. The spatial economics of agricultural development and the formation of agro-industrial value chains: The Brazilian Cerrado. In Innovation with Spatial Impact: Sustainable Development of the Brazilian Cerrado; Hosono, A., Hamaguchi, N., Bojanic, A., Eds.; Springer: Singapore, 2019; Chapter 1; pp. 1–17. [Google Scholar]
  39. Rodrigues, L.N. Quantidade de água utilizada na agricultura irrigada: Certezas e incertezas nas estimativas. Item 2017, 114, 47–53. [Google Scholar]
  40. Barbosa, B.D.S.; Colombo, A.; Souza, J.G.N.; Baptista, V.B.; Araújo, A.C.S. Energy efficiency of a center pivot irrigation system. Eng. Agrícola 2018, 38, 284–292. [Google Scholar] [CrossRef]
  41. Scaloppi, E.J.; Allen, R.G. Hydraulics of center pivot laterals. J. Irrig. Drain. Eng. 1993, 119, 554–567. [Google Scholar] [CrossRef]
  42. Assad, E.D.; Sano, E.E.; Masutomo, R.; Castro, L.H.R.; Silva, F.A.M. Veranicos na região dos Cerrados brasileiros: Frequência e probabilidade de ocorrência. Pesq. Agrop. Bras. 1993, 28, 993–1003. [Google Scholar]
  43. ANA. Agência Nacional de Águas e Saneamento Básico. In Conjuntura dos Recursos Hídricos no Brasil 2023; Informe anual.: Brasília, DF, Brazil, 2024. [Google Scholar]
  44. Lima, J.E.F.W.; Sano, E.E.; Silva, E.M.; Lopes, T.S.S. Levantamento da área irrigada por pivõ-central no Cerrado por meio da análise de imagens de satélite: Uma contribuição para a gestão dos recursos hídricos. In XVII Simpósio Brasileiro de Recursos Hídricos; ABRH: São Paulo, SP, Brazil, 2007. [Google Scholar]
  45. Ferreira, F.L.V.; Rodrigues, L.N.; Althoff, D.; Amorim, R.S.S. Spatial-temporal variability of climatic water balance in the Brazilian savannah region river basins. Water 2023, 15, 1820. [Google Scholar] [CrossRef]
  46. Latrubesse, E.M.; Arima, E.; Ferreira, M.E.; Nogueira, S.H.; Wittmann, F.; Dias, M.S.; Dagosta, F.C.P.; Bayer, M. Fostering water resource governance and conservation in the Brazilian Cerrado biome. Conserv. Sci. Pract. 2019, 1, e77. [Google Scholar] [CrossRef]
  47. Christofidis, D. Oportunidades de irrigação no Cerrado: Recursos hídricos dos Cerrados e seu potencial de utilização na irrigação. Item 2006, 69/70, 87–97. [Google Scholar]
  48. ANA. Agência Nacional de Águas e Saneamento Básico. In Subsídios para a DISCUSSÃO da compatibilização da Geração de Energia Hidrelétrica com Expansão da Agricultura Irrigada na Bacia do Rio São Marcos; ANA: Brasília, DF, Brazil, 2014; p. 64. [Google Scholar]
Figure 1. Location of the study area (Cerrado biome) in the central part of Brazil. Federative unit identification: BA = Bahia; DF = Federal District; GO = Goiás; MA = Maranhão; MG = Minas Gerais; MS = Mato Grosso do Sul; MT = Mato Grosso; PI = Piauí; PR = Paraná; SP = São Paulo; and TO = Tocantins. In Brazil, the federative units are composed of 26 states, the Federal District, and 5571 municipalities.
Water 16 01897 g001
Figure 2. Examples of misinterpretations in the fully automated procedure of center pivot delineation by the MapBiomas Irriga project in Brazil for the year 2005: (A) near circular-shaped native vegetation in the municipality of Brasilândia, Mato Grosso do Sul State; and (B) nearly circular boundaries of cultivated pastures in the municipality of João Pinheiro, Minas Gerais State.
Water 16 01897 g002
Figure 3. Examples of retractions of center pivots disregarded by the fully automated procedure of pivot delineation by the MapBiomas Irriga project: one center pivot delineated by the MapBiomas Irriga in 2005 and in the municipality of Campo Florido, Minas Gerais State, Brazil (A) and erroneously considered as irrigated in 2020 (B). In (C,D), two center pivots in operation in 2005 that were abandoned in 2020. The RGB false-color composites of (A,C) correspond to the Landsat 5 Thematic Mapper (TM) from 2005; The RGB true-color composites of (B,D) were obtained from the Google Earth images acquired in November 2018 and May 2021, respectively.
Water 16 01897 g003
Figure 4. Total number of pivots (A) and total area of pivots (B) per federative unit of the Cerrado biome during the period 1985–2020. Federative unit identification: BA = Bahia; DF = Federal District; GO = Goiás; MA = Maranhão; MG = Minas Gerais; MS = Mato Grosso do Sul; MT = Mato Grosso; PI = Piauí; SP = São Paulo; and TO = Tocantins.
Water 16 01897 g004
Figure 5. Illustration of central pivots typically found in the western Bahia, Brazil (A) and São Paulo State, Brazil (B). In (A), we can note the yellowish/reddish concentric circles due to the combination of the circular coffee plantations and shadowing caused by the solar azimuth angle of about 75 degrees. In (B), we find different noticeable changes in the size of central pivots, mostly cultivated by vegetables and fruit trees.
Water 16 01897 g005
Figure 6. Location of 13 central pivot irrigation poles (in green color) in the Cerrado biome.
Water 16 01897 g006
Figure 7. Location of central pivots in the Cerrado biome identified by the MapBiomas Irriga Project in 2020 over the Cerrado water availability map. Red dots correspond to the center pivot irrigated areas. Source of water availability data: Althoff and Rodrigues [27].
Water 16 01897 g007
Figure 8. Percentage of occurrence of central pivots in the Cerrado biome identified by the MapBiomas Irriga Project in 2020 across different classes of annual water availability.
Water 16 01897 g008
Figure 9. Minimum and maximum values of water availability for each irrigation pole located in the Cerrado biome. The dashed reddish line corresponds to the average value for the Cerrado biome.
Water 16 01897 g009
Table 1. Total number of central pivots and the corresponding total irrigated area in the Cerrado biome for the period 1985–2020.
YearNumber of
Pivots
Total Area
(ha)
1985108547,550
19902506155,139
19954444288,484
20005889388,631
20059104584,012
201010,539678,088
201514,117925,191
202017,7641,191,887
Table 2. Total area of central pivots occupied in each of the six Brazilian biomes in the period 1985–2020.
YearBiomes
AmazoniaCaatingaCerradoMata AtlânticaPampaPantanalTotal
1985858754937,96216,1864187066,742
199088722,883120,54944,286403231192,668
199588932,416246,87056,857519368342,293
2000217436,080348,43168,056853723463,301
2005820246,516537,42194,19723,7570710,093
2010916167,832625,877101,98335,5180840,371
201521,94389,430863,539117,47448,88801,141,274
202042,06593,7161,117,446150,50176,114191,479,861
Table 3. Average size of center pivots in the federative units of the Cerrado biome for the period 1990–2020. The data from 1985 were disregarded because of the relatively small number of pivots. Brazilian federative unit identification: BA = Bahia; DF = Federal District; GO = Goiás; MA = Maranhão; MG = Minas Gerais; MS = Mato Grosso do Sul; MT = Mato Grosso; PI = Piauí; SP = São Paulo; and TO = Tocantins.
YearFederative UnitCerrado
BADFGOMAMGMSMTPISPTO
19907963624763716458544262
19958762666862766347526965
20008664706062847747525566
20058661685860779044485764
20109060686860769258485665
201596566770598410855476766
2020100566564568410866497465
Average8960676260798654506065
Table 4. Average size and corresponding standard deviation of center pivots found in 2020 in different geomorphological units of the Brazilian Cerrado.
Gemorphological UnitAverage Size
(ha)
Standar Deviation (ha)
Plateau81.347.8
Tableland71.933.6
Highland65.841.0
Mountain range61.943.4
Depression61.340.2
Lowland48.040.6
Platform46.931.4
Table 5. Quantitative data of center pivot irrigation poles found in the Cerrado biome.
Irrigation PoleStateNumber of PivotsTotal Area (ha)Average Size
(ha)
Alto Teles PiresMato Grosso26634,001127
Oeste BaianoBahia1402173,048123
Alto AraguaiaGoiás18321,958119
JaíbaMinas Gerais10311,565112
São MarcosGoiás1060101,72595
Alto Rio PretoFederal District and Goiás23319,14482
Alto Paracatu/Entre RibeirosMinas Gerais125997,37977
Alto ParanapanemaSão Paulo87765,83275
Guaíra/MiguelópolisMinas Gerais and São Paulo59042,74272
Alto Rio das MortesMato Grosso97969,58371
Alto Araguari/ParanaíbaMinas Gerais97969,58371
Rio das AlmasGoiás26214,32354
Vertentes do Rio Pardo/Mogi GuaçuSão Paulo48324,25350
Table 6. Number of center pivots and total area (ha) in the Cerrado biome in 2005 that remained as center pivots and were converted into other land use types in 2020.
Land ConversionNumber of Center PivotsTotal Area (ha)
2005202020052020
Center pivot83827262581,280510,232
Abandoned pivot39527,050
Rainfed cropland70943,384
Others (reforestation, urban area, rural community, water reservoir)16614
Disclaimer/Publisher’s Note: The statements, opinions and data contained in all publications are solely those of the individual author(s) and contributor(s) and not of MDPI and/or the editor(s). MDPI and/or the editor(s) disclaim responsibility for any injury to people or property resulting from any ideas, methods, instructions or products referred to in the content.

