Article

Performance Assessment of Rural Decentralized Domestic Wastewater Treatment Facilities in Foshan, China

1
Guangzhou Institute of Energy Conversion, Chinese Academy of Sciences, Guangzhou 510640, China
2
CAS Key Laboratory of Renewable Energy, Guangzhou 510640, China
3
Guangdong Provincial Key Laboratory of New and Renewable Energy Research and Development, Guangzhou 510640, China
4
Energy Conservation and Environmental Protection Research Center of Ronggui Street, Shunde District, Foshan 528000, China
*
Authors to whom correspondence should be addressed.
Water 2024, 16(13), 1901; https://doi.org/10.3390/w16131901
Submission received: 7 May 2024 / Revised: 26 June 2024 / Accepted: 28 June 2024 / Published: 3 July 2024
(This article belongs to the Section Wastewater Treatment and Reuse)

Abstract

:
Rural decentralized domestic wastewater treatment (DDWT) facilities, as an alternative to centralized sewage treatment plants, have been rapidly developed in rural areas worldwide. However, the lack of performance evaluations and operational status assessments of these facilities poses a significant obstacle to advancements in rural domestic wastewater treatment strategies. In the present study, 30 rural DDWT facilities with AO (anoxic/oxic) and AAO (anaerobic/anoxic/oxic) processes were investigated. The results revealed that only two facilities reached the first A-grade discharge standards of China, and twelve facilities met the first B-grade discharge standards for all ten wastewater quality indicators. Low standard-achieving ratios for biochemical oxygen demand (BOD5) (63.3%), total nitrogen (TN) (60.0%), ammonia nitrogen (NH3-N) (63.3%), total phosphorus (TP) (30.0%), suspended solids (SS) (46.7%), and fecal coliforms (FC) (26.7%) were calculated. Thus, it is essential to improve the treatment efficiency for BOD5, TN, NH3-N, TP, SS, and FC for rural wastewater treatment facilities. In addition, the AAO process had a median weighted average removal efficiency of 82.02%, which was better than that of the AO process (72.48%). Minor equipment failure rates, i.e., less than 20%, did not affect the operation of the rural DDWT facilities, since most equipment in the DDWT facilities was backed up. Notably, problems in several areas, e.g., process design, equipment selection, construction, and especially operations, influencing treatment performance should be investigated and proactively addressed. These findings provide specific suggestions for improvements that could benefit the long-term operation and management of rural DDWT facilities.

1. Introduction

In recent years, the rapid development of modern industry and agriculture, coupled with a burst in population growth has come to pose a serious challenge to the control of environmental pollution, especially in terms of treating increasing amounts of wastewater [1,2]. In the past 20 to 30 years, a large number of urban sewage treatment plants have been built in China [3]. At the end of 2020, urban sewage treatment plants in China had a processing capacity of 0.19 billion m3/d, with a total annual sewage treatment volume of 55.92 billion m3 and a sewage treatment rate of 97.08% [4]. However, in contrast to the advancements in urban sewage treatment, as of 2020, only 63.5% of towns and 34.87% of townships had built rural decentralized domestic wastewater treatment (DDWT) facilities [5]. Consequently, with the proposal of the rural vitalization strategy, the attention of the Chinese government has turned to improving treatment coverage in rural areas where nearly 500 million people live [6], which will lead to a huge increase in rural DDWT facilities.
Unlike cities, where centralized wastewater treatment plants are common, rural areas, especially those in developing countries and undeveloped countries, face difficulties in setting up centralized wastewater treatment plants due to restricted local budgets, lack of local expertise, and lower wastewater collection rates [7,8]. In areas with sparse populations or scattered residents, DDWT facilities have become a preferred alternative to centralized sewage treatment plants [9,10]. In addition to being used in many developed countries, including various European countries, America, and Japan, DDWT facilities have been established in developing countries such as China, where they are particularly suitable due to their ability to operate at small scales, their flexible management requirements, and their cost effectiveness [10,11,12].
Currently, around 20 provinces in China have enacted policies to promote the installation of rural DDWT facilities [13]. The number of DDWT facilities under construction has increased significantly [14]. For example, as of December 2018, 26,918 treatment facilities had been constructed in Jiaxing, Zhejiang province [15]. With the increasing number of DDWT facilities, treatment technologies such as anoxic/oxic (A/O) processing, anaerobic/anoxic/oxic (A/A/O) processing, membrane bioreactor (MBR), and constructed wetland (CW) have received considerable attention [9,16]. However, the applicability of each technology depends not only on the characteristics and climate of the proposed location, but also on the treatment efficiency, low operation and management requirements, operational reliability, gradual expansion possibilities, and favorable economics [17].
During the construction and operation of DDWT facilities, many problems in the design and operational processes are exposed [18]. Based on the performance of DDWT facilities observed over the past few years, some DDWT facilities have exhibited the phenomenon of “emphasizing construction and neglecting operation”. Due to the issues such as sub-standard technical levels, weak supervision, and a lack of operating budget, the operation of some existing facilities has been unsatisfactory, in some cases resulting in stoppages. For instance, one study found that 24% of the 231 village-level sewage treatment stations of 13 towns in the Miyun District of Beijing were idle due to issues with technology and management [19]. To the best of our knowledge, Johkasou is praised as an effective integrated decentralized treatment biotechnology and has been extensively applied in rural areas in Japan, but it may be unaffordable for the treatment of rural wastewater in developing and undeveloped countries given its high maintenance cost [20]. Clearly, the design, construction, operation, and maintenance of DDWT facilities ought to be low-cost and affordable, especially for rural wastewater treatment in developing and undeveloped countries. Currently, numerous studies exist that have focused on the effects of rural domestic sewage discharge on aquatic ecosystems, as well as on sewage treatment methods and technologies, but studies on the operation and maintenance of rural DDWT facilities have been ignored [13,21]. Therefore, it is necessary to investigate and evaluate the operational statuses of DDWT facilities to help formulate successful wastewater treatment procedures and refine management practices.
In this paper, we investigated 30 rural DDWT facilities utilizing AO and AAO technologies in Foshan, Guangdong province, which is one of the most highly developed regions in China. Since surface water pollution mainly includes suspended matter, organic compounds, ammonia, nutritional salts, and pathogenic microorganisms [22], ten wastewater quality indicators including chemical oxygen demand (CODCr), biochemical oxygen demand (BOD5), total nitrogen (TN), ammonia nitrogen (NH3-N), total phosphorus (TP), suspended solids (SS), chroma, pH, anionic surfactant (AS), and fecal coliforms (FC) were investigated to evaluate the influent and effluent water quality. In China, most of the existing rural sewage discharge standards are similar to urban discharge standards [23], and the concentrations of contaminants in tailwaters are divided into I A, I B, II, III, and more than III. With the growing emphasis given to lowering pollutant concentrations in effluent to meet the discharge standards, class I A has been established as the basic requirement for many DDWT facilities. Moreover, in addition to the indicators of the influent and effluent water quality, equipment failure rates and operational management ability should be also considered for evaluating the running status of each facility. Thus, the goals of this study were to: (1) comprehensively evaluate the effluent standard-achieving ratio of the facilities; (2) investigate the influent and effluent water quality and characterize the removal efficiency for different contaminants; (3) use the weighted averages to classify the DDWT facilities utilizing AO and AAO technologies; and (4) explore the correlation between the contaminant removal efficiency and equipment failure rate. This investigation will provide specific suggestions for improvement and could benefit the long-term operation and management of rural DDWT facilities.

2. Materials and Methods

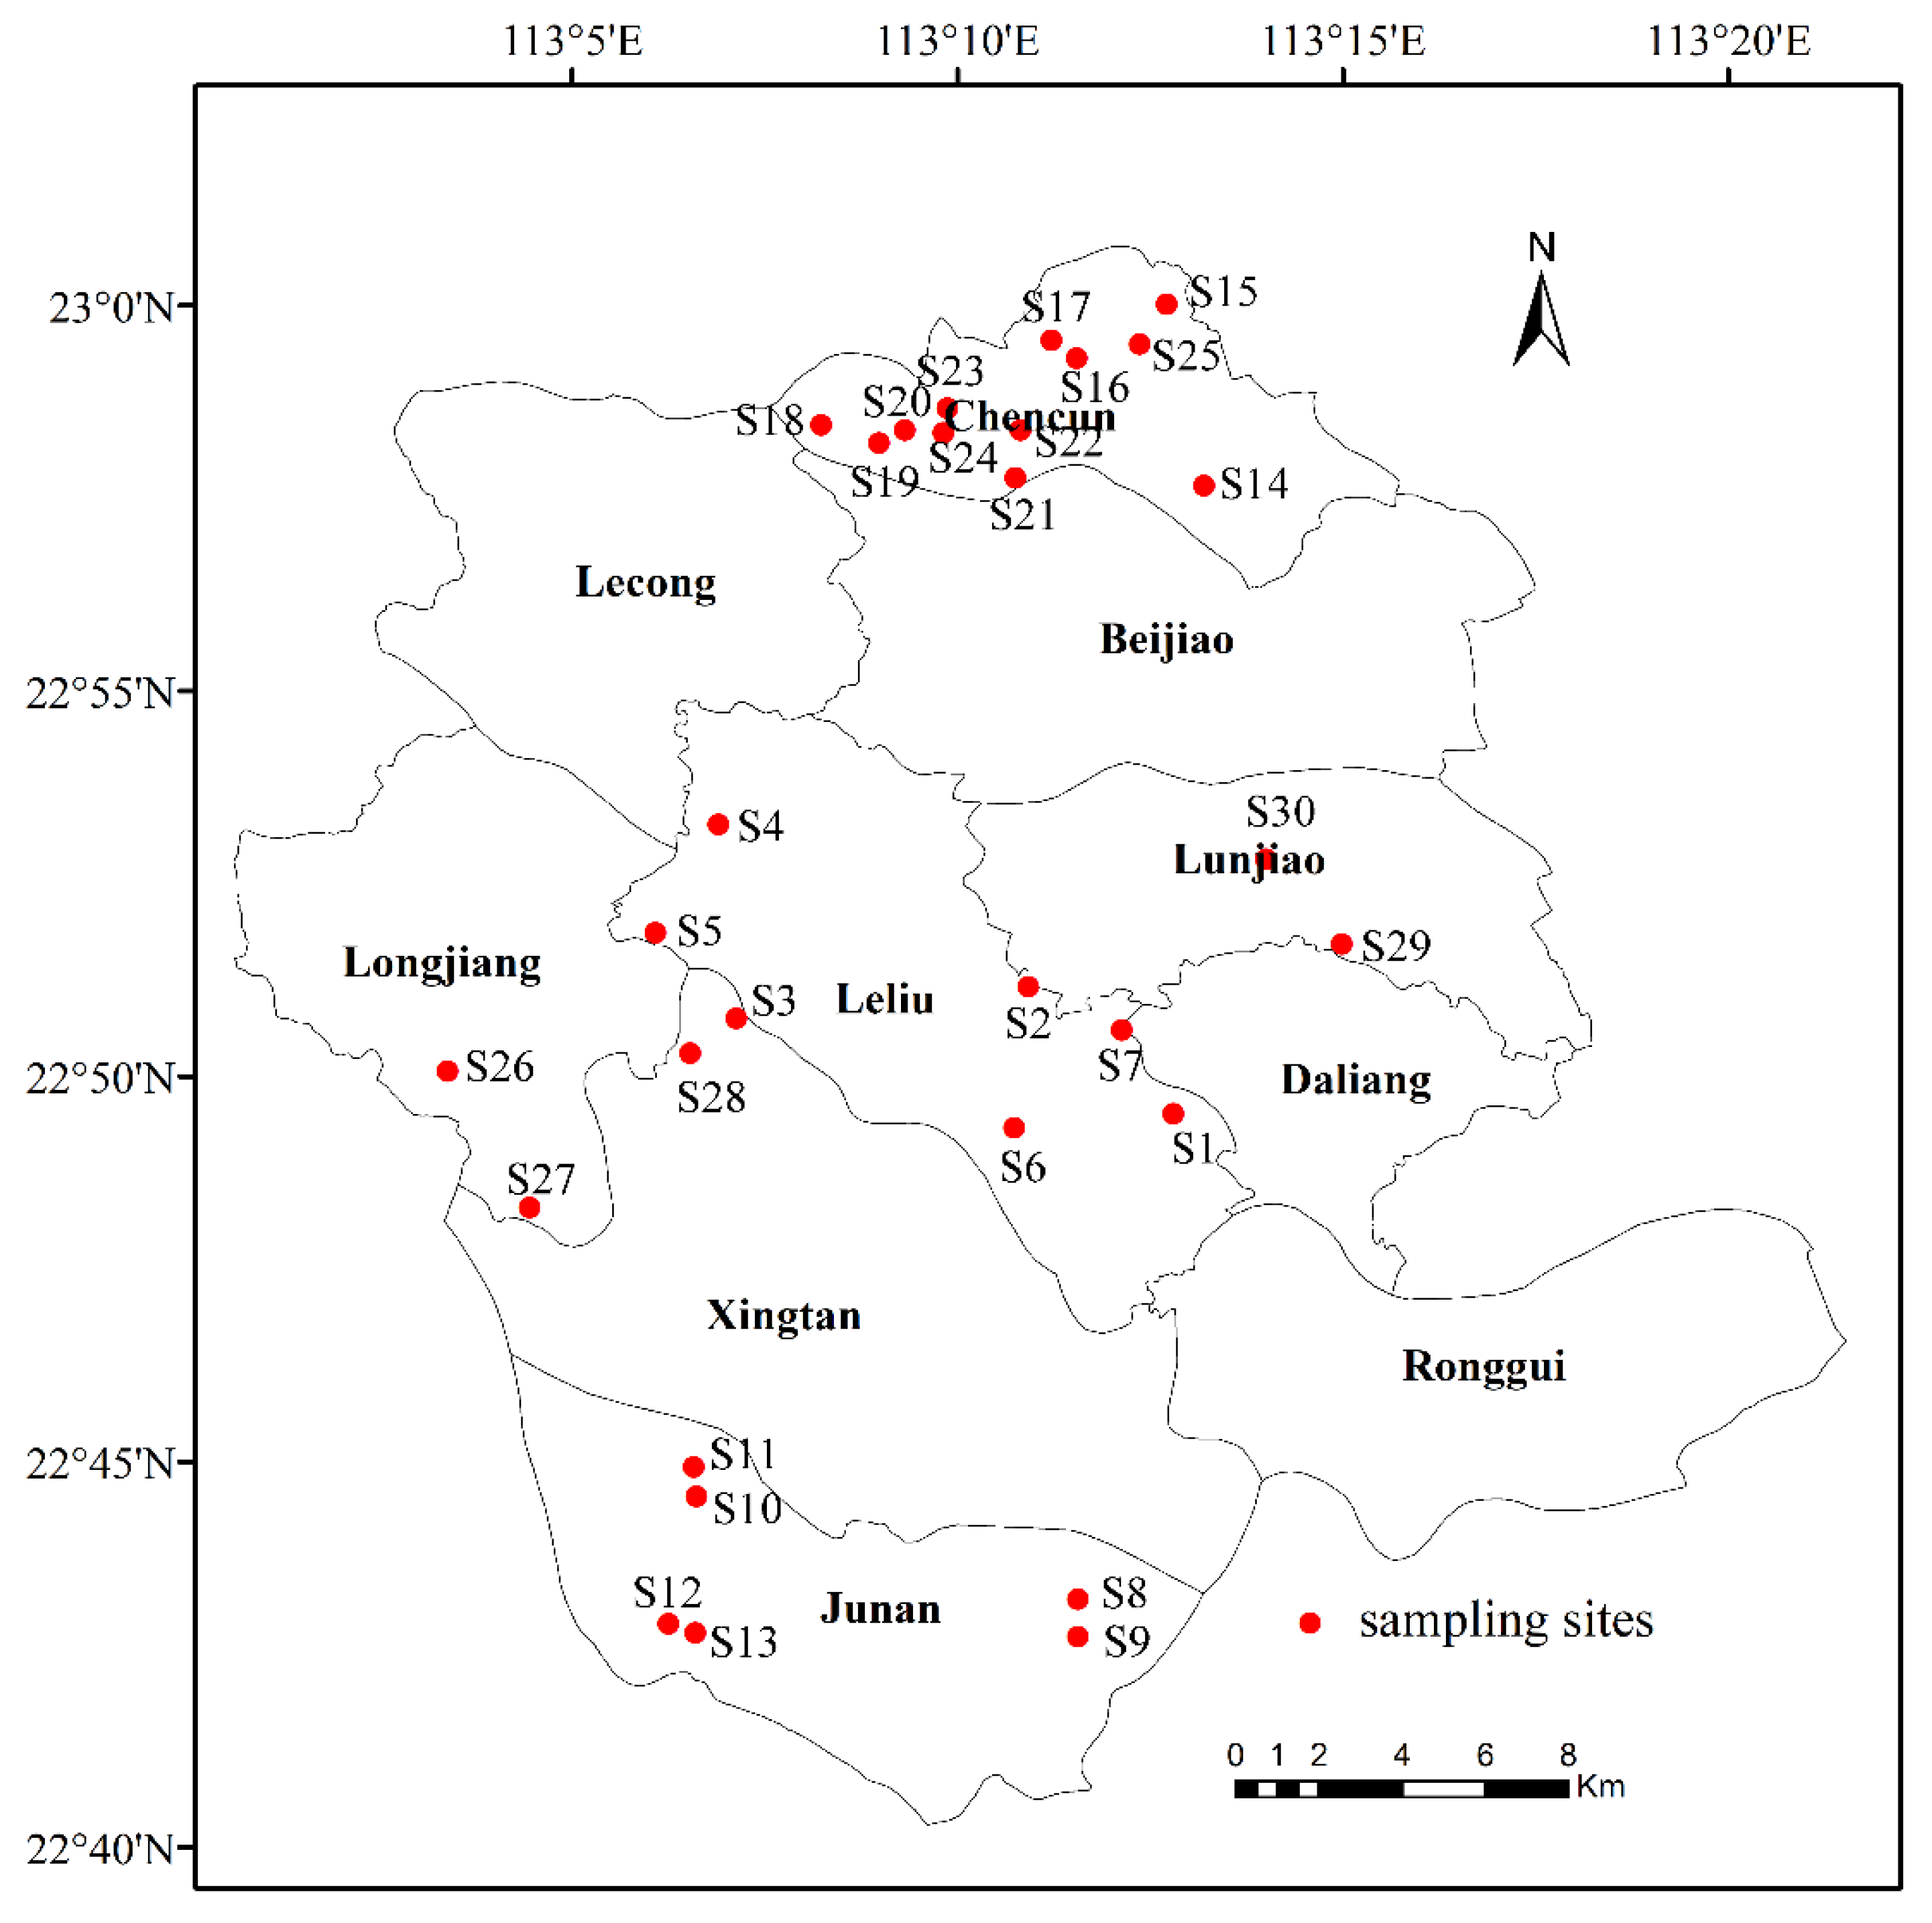
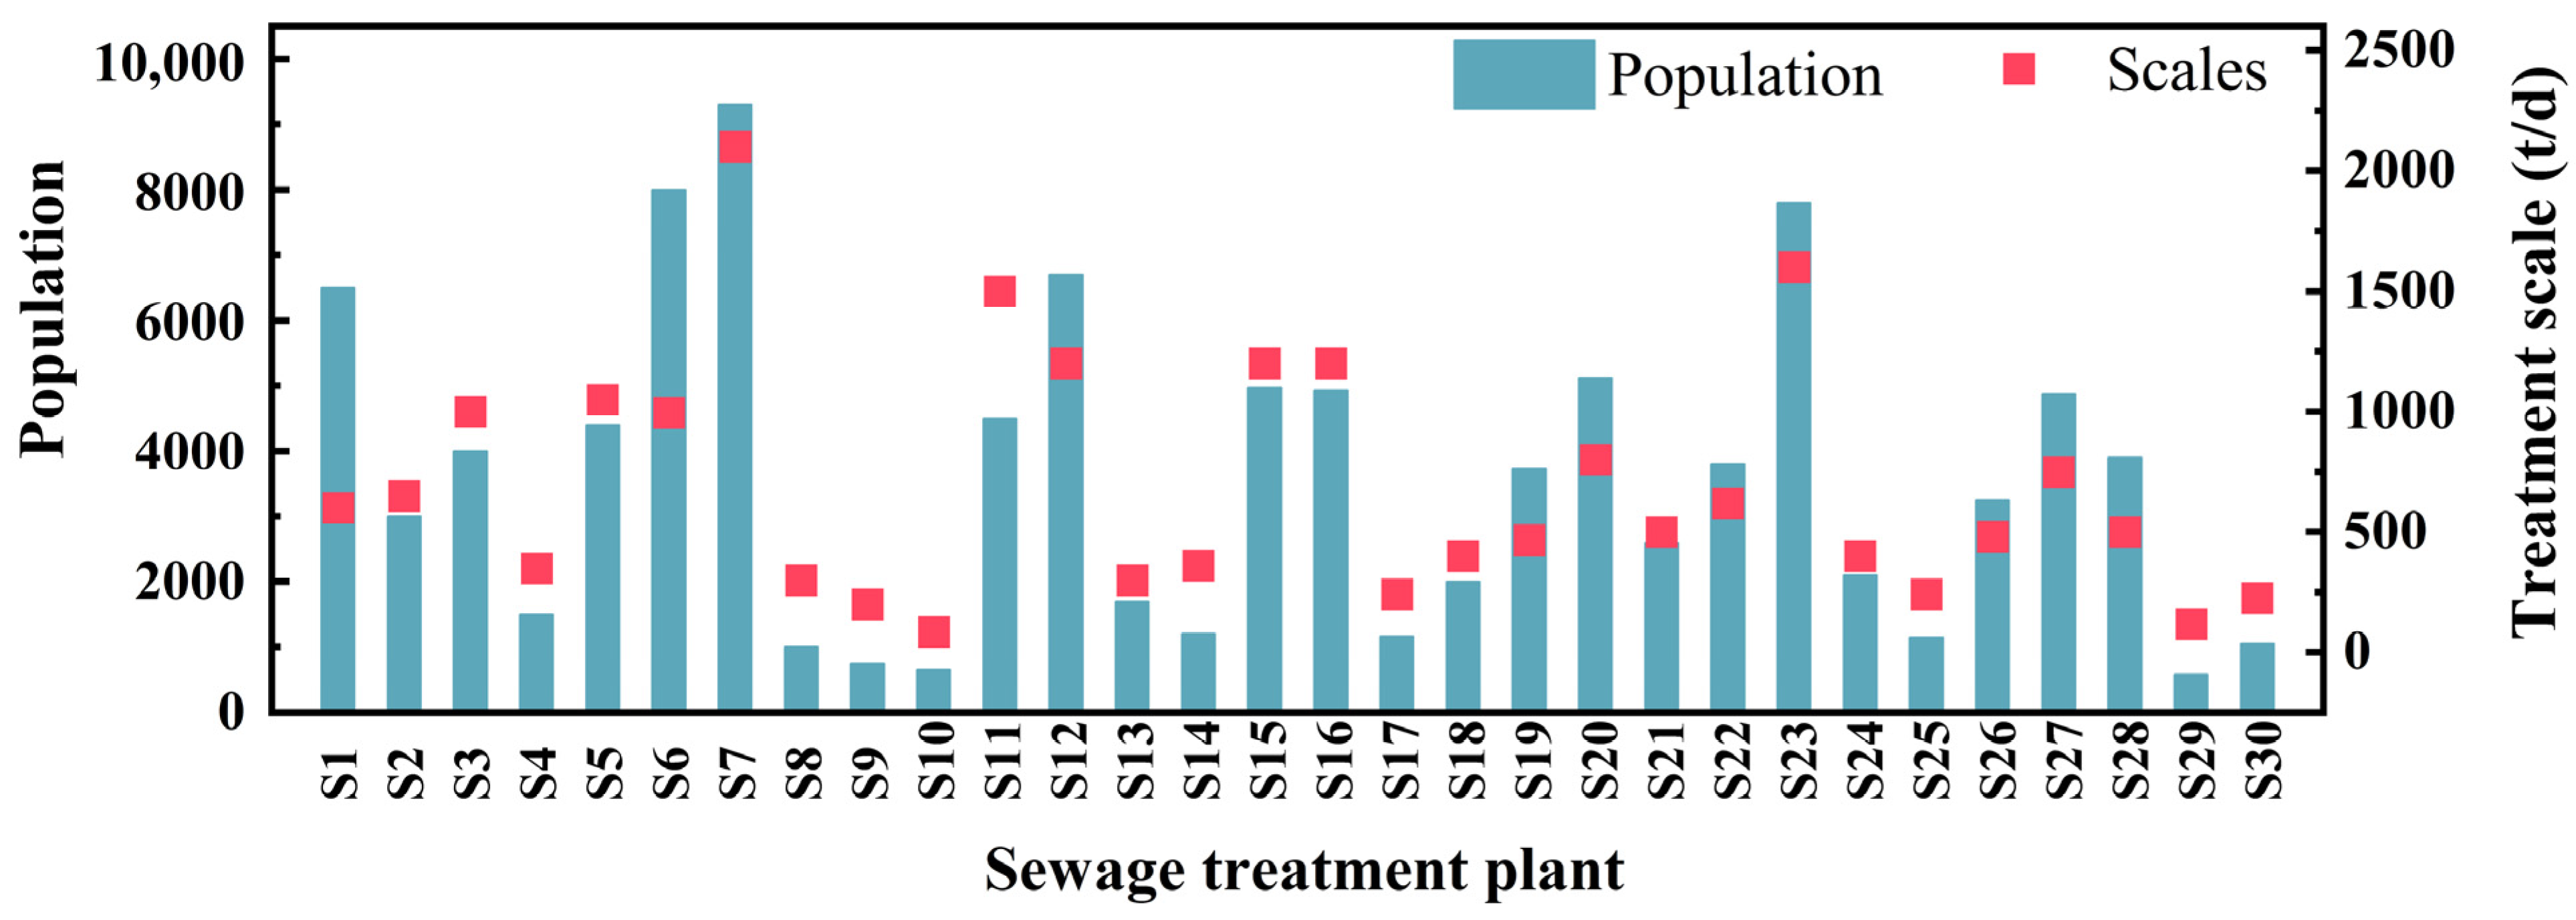
2.1. Site Description and Sampling

Foshan is a typical delta river network area, with the Xijiang and Beijiang tributaries of the Pearl River system running through the entire territory. In order to prevent pollution from rural domestic sewage, a number of DDWT facilities have been constructed in the area. This study investigated 30 rural DDWT facilities in Foshan (Figure 1), which included 13 anoxic/oxic (AO) facilities and 17 anaerobic/anoxic/oxic (AAO) facilities (detailed introductions to the AO and AAO processes are shown in Figure S1). The facilities ranged in capacity from 85 t/d to 2100 t/d, and served approximately 110,000 people in the region (Figure 2). The quality of the influent and effluent were surveyed two times, and the operating conditions of all facilities were evaluated from August 2020 to July 2021.

2.2. Monitoring Methods

The CODCr, BOD5, TN, NH3-N, TP, SS, chroma, pH, AS, and FC were analyzed according to China’s standard methods [7,22]. Since the quality of the influent and effluent were surveyed two times, the mean values of each wastewater quality indicator were utilized in this study. The specific methods are shown in Table 1.

2.3. Parameters Calculation

The removal efficiency of the pollutant k can be calculated via the following equation [7]:
E f k = C i C e C i × 100 %
where E f k is removal efficiency of the pollutant k , %; C i is the contaminant influent concentration, mg/L; and C e is the contaminant effluent concentration, mg/L.
A weighted average of the efficiencies of removing n pollutants can be estimated using the following equation [34]:
E f w = 1 k = 1 n w k k = 1 n ( E f k ¯ × w k )
where E f w is a weighted average of the efficiencies of removing n pollutants, %; n is the number of pollutants; E f k ¯ is the average removal efficiency of the pollutant k , %; and w k is the weight assigned to pollutant k .
CODCr, BOD5, NH3-N, TN, TP, SS, AS, and FC were selected to calculate E f w . The weights were assigned to each pollutant as a function of their importance, as suggested by [34,35,36,37]: 4 for COD, 3 for BOD5, 3 for NH3-N, 1 for TP, 2 for SS, 4 for AS, and 3 for FC. Since there was no weight provided by the above publications for TN, a weight of 2 was assigned to TN after considering the weights of nitrate and nitrite [34,37]. Treatment facilities were classified as Excellent, Good, Fair, Marginal, or Poor based on whether the weighted average removal efficiencies of contaminants were in the intervals 95–100%, 80–94%, 65–79%, 45–64%, or 0–44%, respectively [34].
The equipment failure rates at the DDWT facilities were calculated by the following equation:
R e q = E f a i l u r e E t o t a l × 100 %
where R e q is the equipment failure rate at DDWT facilities, %; E f a i l u r e is the quantity of the equipment that was not operating normally; and E t o t a l is the total quantity of equipment.

2.4. Analysis Methods

2.4.1. Linear Regression Analysis

Generally, linear regression analysis of one-order function is used to study the relationship between two variables. This method can determine whether there is a strong linear relationship between the variables by using the coefficient value (R2) of the fitting results [7]. In this study, linear regression analysis was used to evaluate the influence of the influent concentrations of CODCr, BOD5, TN, NH3-N, TP, SS, AS, and FC on their respective effluent concentrations by origin 2021.

2.4.2. Correlation Analysis

Correlation analysis is a mathematical statistical method used to study the correlations between variables, which enables us to judge how variables influence one another [38]. In this study, a Pearson correlation matrix with E f (CODCr) (removal efficiency of CODCr), E f (BOD5) (removal efficiency of BOD5), E f (TN) (removal efficiency of TN), E f (NH3-N) (removal efficiency of NH3-N), E f (TP) (removal efficiency of TP), E f (SS) (removal efficiency of SS), E f (AS) (removal efficiency of anionic surfactant), E f (FC) (removal efficiency of FC), and E f w and R e q (equipment failure rates) was conducted to identify any statistically significant correlations among the variables using SPSS v. 19.0 statistical software according to previously described methods [39].

3. Results and Discussion

3.1. Standard-Achieving Ratio of Effluent

In 2002, the “discharge standard of pollutants for municipal wastewater treatment plants” (GB18918-2002) (Ministry of Environmental Protection of the People’s Republic of China (MEP)) was promulgated, and this standard is applied in all parts of the country without distinction. Achieving the first A-grade discharge standard has been established as the basic requirement for many DDWT facilities [23]. To gain comprehensive insight into the standard-achieving ratio of effluents, ten wastewater quality indicators, including physical and chemical (SS, chroma, and pH), organic (CODCr and BOD5), nutrient (TN, NH3-N, and TP), and other indicators (AS and FC), were determined in the effluents of 30 rural DDWT facilities. As shown in Figure 3a, only fourteen facilities met the first grade discharge standards of China [28] (two met the first A-grade discharge standards of China and twelve met the first B-grade discharge standards of China) for all ten wastewater quality indicators. The remaining facilities were found to fail to meet the first grade discharge standards of China based on one or several indicators, e.g., exceeding the limits for NH3-N, TP, FC, etc. In fact, many rural DDWT facilities in China showed obvious discrepancies between the standard concentrations and their actual effluent concentrations. For instance, Yang et al. [7] surveyed 146 rural decentralized wastewater treatment facilities surrounding the Erhai Lake and found that the effluent concentrations treated by most facilities failed to meet the first A-grade discharge standards of China [28]. Consistently, a performance survey of four secondary treatment processes at the county level in eastern China also showed that the expected probabilities of compliance with the second grade discharge standards of GB 18918-2002 were unsatisfactory for most of the water quality parameters examined [18]. In general, the main reasons for sub-standard effluent in China are as follows: inappropriate system design and selection processes, sub-standard technical levels, weak supervision, lack of trained staff, and irregular operation and maintenance [1,40]. However, the reasons for sub-standard effluent in this study need further analysis.
The standard-achieving ratio of each indicator was also investigated. As can be observed in Figure 3b, the standard-achieving ratios of class 1A were CODCr 90.0%, BOD5 63.3%, TN 60.0%, NH3-N 63.3%, TP 30.0%, SS 46.7%, chroma 100.0%, pH 100.0%, AS 90.0%, and FC 26.7%, respectively. Generally, pH, chroma, and SS were chosen as the main physical indicators due to their low measurement cost and simple analysis method. In this study, the pH values of all effluents fell between 6.0~9.0, which is the range that is adequate for maintenance of aquatic life. Chroma is an indicator of the aesthetic quality of water [23]. As we know, influent color in rural domestic sewage is commonly low, and conventional precipitation methods can be used to easily meet the standard requirements. Thus, it was not surprising that all the effluents met the chroma standards, suggesting that color should not be a mandatory requirement for rural DDWT facilities. Poor sedimentation effects were observed in the majority of facilities, with only 46.7% meeting the standard-achieving ratio for class 1A. According to our survey, inappropriate hydraulic retention time and poor sludge quality may be the main reasons for this. Since CODCr and BOD5 consume dissolved oxygen that is necessary for maintaining aquatic life, and nitrogen and phosphorus nutrients produce surface water eutrophication, it is important to control these contaminants in discharge. The results showed a higher CODCr standard-achieving ratio of 90.0% and a lower BOD5 standard-achieving ratio of 63.3%. The TN and NH3-N standard-achieving ratios were almost the same, at ~60.0%, but the TP standard-achieving ratio was notably low, at 30%. This was probably because most facilities do not add phosphorus removal agent. According to [41], when discharged without proper treatment, the toxicity of AS will pose a long-term threat to aquatic environments. This research revealed a 90% AS standard-achieving ratio, suggesting high consistency in the removal of AS. FC is generally controlled as an important biological indicator. In this study, ultraviolet radiation and chlorine-based disinfectants were used in the wastewater disinfection process. However, due to the high operating costs of the disinfection equipment and the lack of funding, continuous and regular disinfection is impossible in most rural areas, resulting in an FC standard-achieving ratio for class 1A of only 26.7%.
Tailwater reuse is an important way to alleviate shortages of water resources [42]. Thus, reuse potential is also one of the key indicators for project planning using a decentralized approach [43]. In China, the reuse of effluent from DDWT facilities for agricultural irrigation may be a feasible way. In this study, according to the standards for irrigation water quality of China [44], the effluent indicators, including CODCr, BOD5, SS, and pH, of all 30 facilities met the requirements for irrigation of both dryland crops and paddy crops. However, when it came to FC, only 13 facilities managed to meet the standards. Despite the fact that the reuse of effluent from DDWT facilities has not been implemented in Foshan, the effective treatment and reuse of effluent from DDWT facilities will certainly become an important task for the development and utilization of water resources in the future [42].

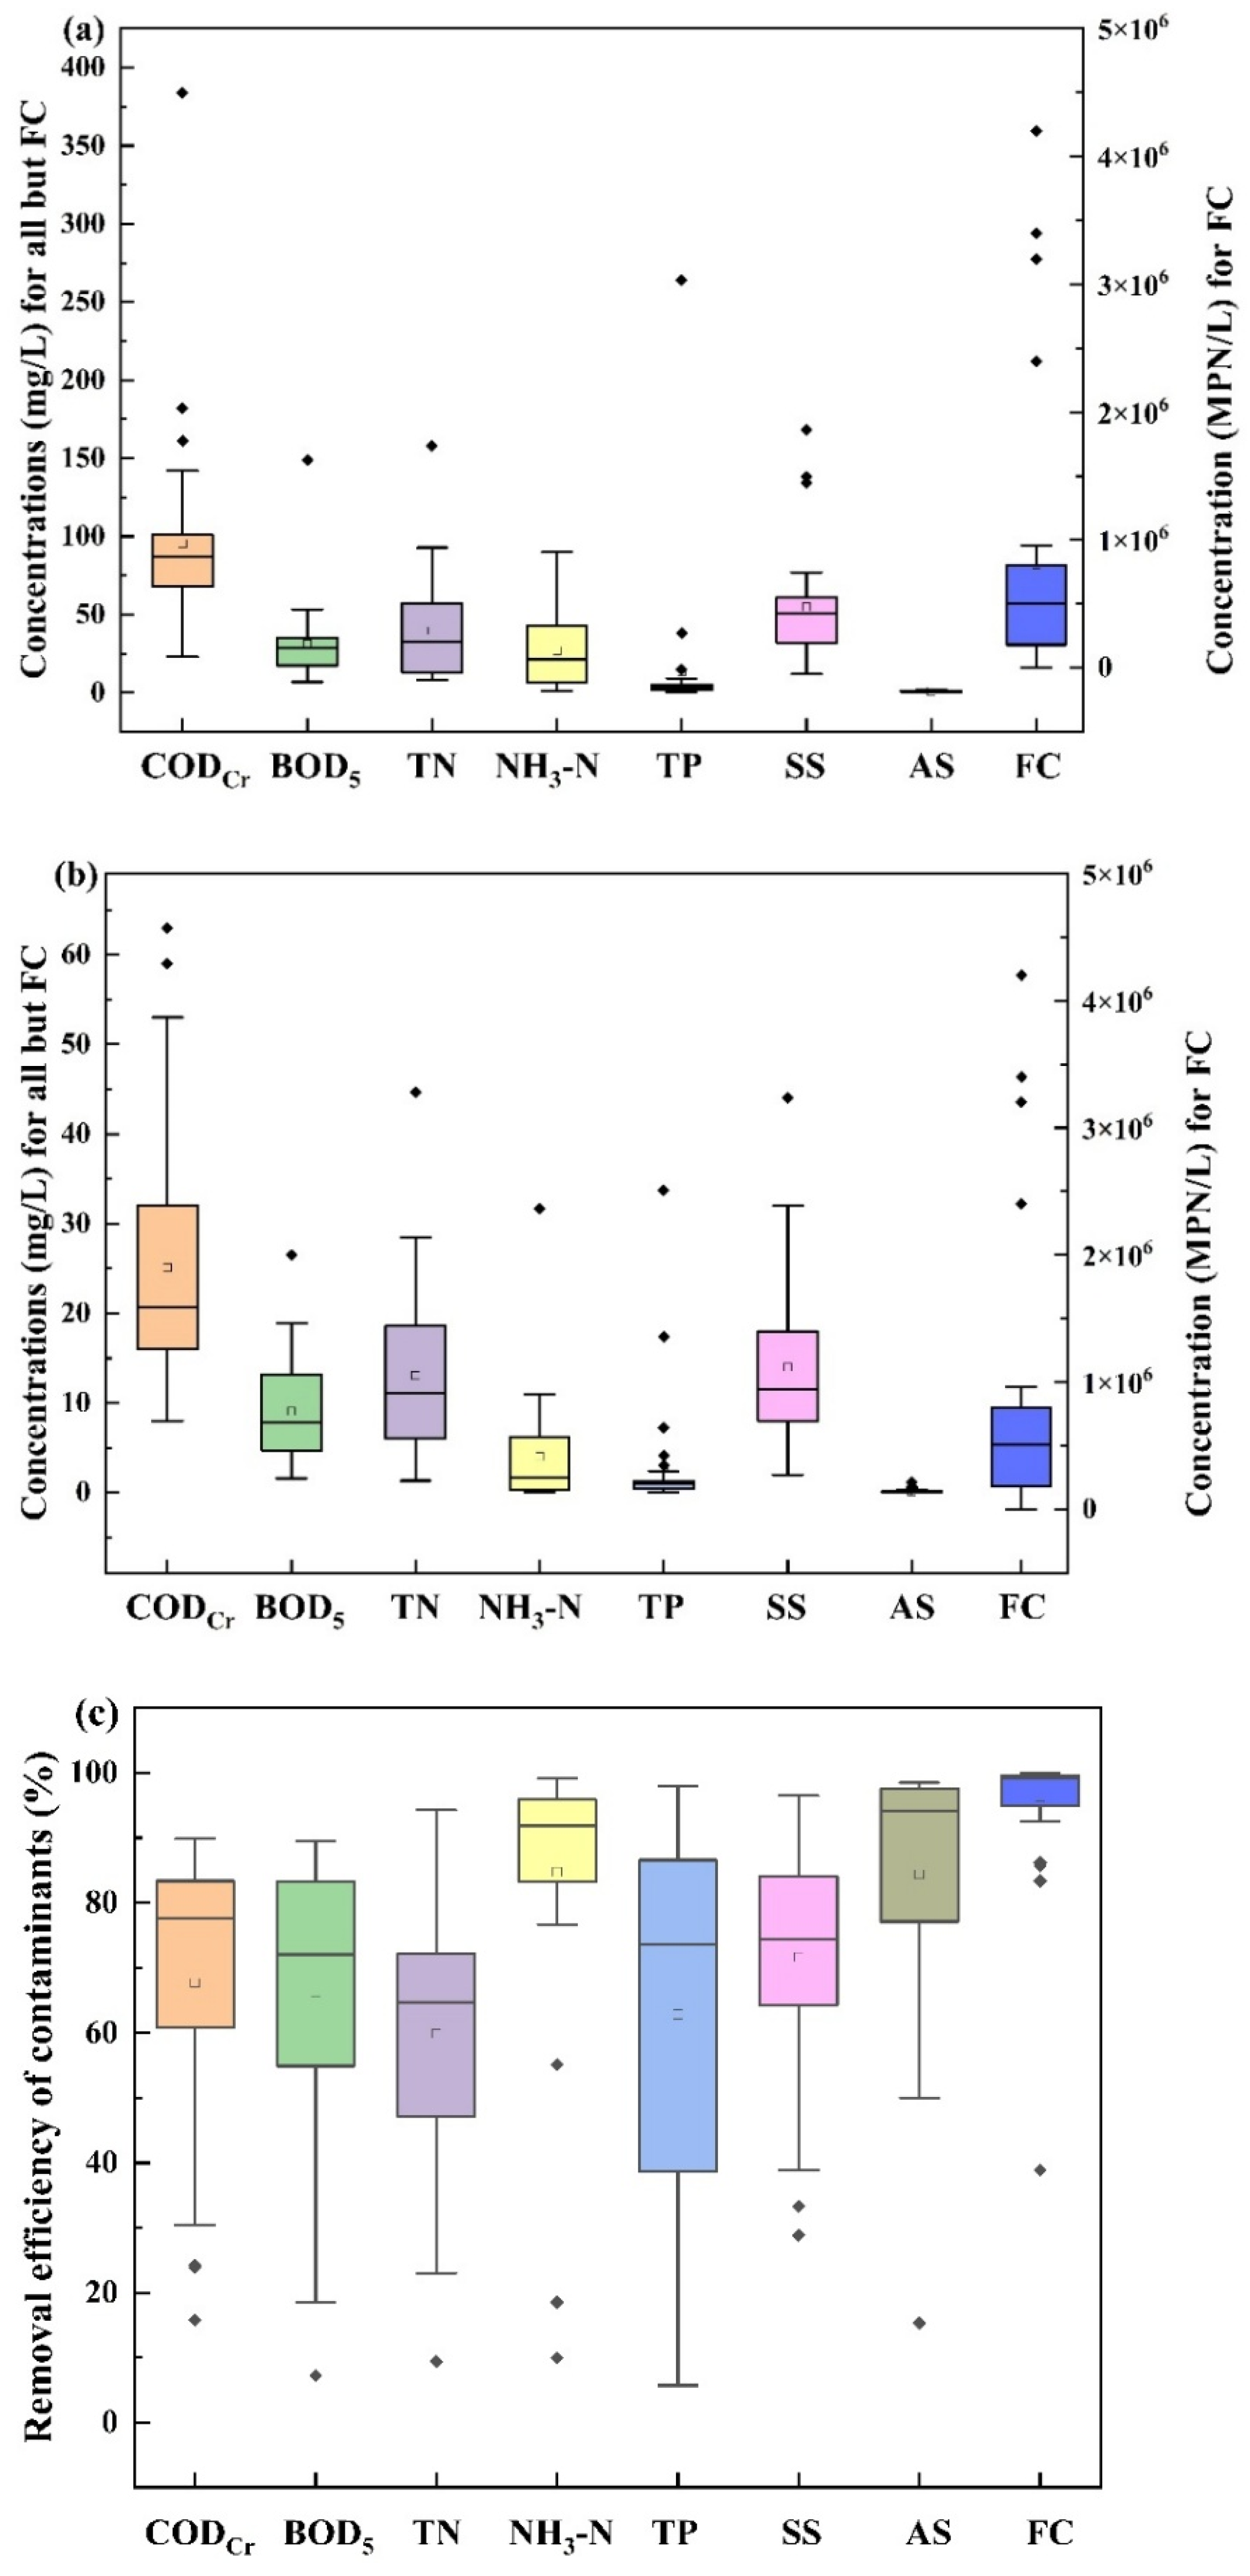
3.2. Removal Efficiency of Contaminants

It is common to evaluate the operational state of a treatment facility according to whether the effluent indicators meet the discharge standards. However, this method may be relatively one-sided, particularly when the pollutant concentration levels in the influent are low [10]. For instance, if the influent pollutant concentrations are extremely low, and only effluent concentrations are assessed, the actual treatment efficiency of the facility will be unknown, as it is assumed that they have already met the discharge standard. Therefore, it is necessary to take influent quality, effluent quality, and the removal efficiency of contaminants into account when assessing the capabilities of a treatment facility.
Since the pH and chroma indicators of all the facilities met the class 1A standards, only CODCr, BOD5, TN, NH3-N, TP, SS, AS, and FC were analyzed here. The influent and effluent concentrations of contaminants are shown in Figure S2, except for indicators in some facilities, such as TN and TP in S11, which were remarkably high. All other indicators were similar to general rural domestic sewage levels in that wider ranges of influent concentrations were observed [13,21]. The very high levels of some indicators may be related to the chemical factories situated in the research vicinity which illegally discharge, resulting in higher TP and TN concentrations in the influent sewage. Consequently, the rural DDWT facilities do not always operate under normal pollutant loads and can gradually experience abnormal operation as a consequence.
Influent concentrations may affect the removal efficiency of pollutants, which in turn affects the effluent concentrations. In order to explore the relationships between the influent concentrations and effluent concentrations, a linear regression analysis was used to obtain the influence of the influent concentrations on the effluent concentrations. As shown in Table 2 and Figure S3, the correlations between influent and effluent CODCr, BOD5, SS, AS, and FC were low, with R2 values of 0.25, 0.23, 0.22, 0.21, and 0.03, respectively. The R2 values calculated for CODCr and BOD5 were similar to those reported by Yang et al. [7], suggesting that the changes in influent COD and BOD concentrations had relatively marginal effects on effluent concentrations. In contrast, unlike the COD and BOD, influent TN and NH3-N had stronger correlations with their effluent concentrations, with R2 values of 0.46 and 0.38, respectively. Additionally, influent TP had a strong correlation with effluent TP, with an R2 value of 0.86. A similar phenomenon was reported by Yang et al. [7], who proposed that the reason for this strong correlation was the high influent phosphorus concentrations caused by livestock and poultry breeding wastewater, wherein organic and condensed phosphorus were converted to soluble phosphorus.
The removal efficiencies of the contaminants are shown in Figure 4. It was observed that the facilities for rural wastewater treatment exhibited different capabilities and large ranges of removal efficiencies. Specifically, the removal efficiencies ranged from 15.8% to 89.9% for CODCr, 7.2% to 89.4% for BOD5, 9.4% to 94.3% for TN, 18.5% to 99.2% for NH3-N, 5.7% to 98.0% for TP, 28.9% to 96.5% for SS, 50% to 98.5% for AS, and 38.9% to 99.9% for FC. The S10, S23, and S27 facilities demonstrated extremely low removal efficiencies for most indicators, suggesting that despite the fact that these three facilities are still in operation, they have become ineffective. This applied especially to the S10 facility which, while meeting class I B standards (Figure 3), had very low removal efficiencies for many contaminants, further illustrating the unreliability of evaluating operational states of treatment facilities based solely on whether effluents meet discharge standards. All of the rural DDWT facilities were designed according to their influent quality and quantity, and prior to their operational debut, a comprehensive final inspection was mandatory. Consequently, aside from variations in influent concentrations induced by human lifestyle habits, operational and maintenance practices account for the majority of effluent deterioration.
The boxplots of influent concentrations, effluent concentrations, and removal efficiencies of contaminants directly reflect the distribution of data. As shown in Table S1 and Figure 5, the median values of the influent concentrations were recorded as follows: CODCr at 87.00 mg/L, BOD5 at 28.67 mg/L, TN at 32.70 mg/L, NH3-N at 21.25 mg/L, TP at 3.35 mg/L, SS at 50.50 mg/L, AS at 1.04 mg/L, and FC at 5.05 × 10⁵ MPN/L. After treatment by the facilities, the median values of effluent concentration were CODCr at 20.65 mg/L, BOD5 at 7.80 mg/L, TN at 11.10 mg/L, NH3-N at 1.71 mg/L, TP at 2.42 mg/L, SS at 11.50 mg/L, AS at 0.14 mg/L, and FC at 2.4 × 10⁴ MPN/L, with the median removal efficiency values of CODCr 77.56%, BOD5 72.04%, TN 64.79%, NH3-N 91.83%, TP 73.56%, SS 74.41%, AS 94.12%, and FC 99.13%. These results suggest that AO and AAO technologies could effectively remove contaminants. The mean values of the contaminant removal efficiencies were CODCr 67.66%, BOD5 64.97%, TN 59.87%, NH3-N 84.74%, TP 62.86%, SS 71.64%, AS 84.36%, and FC 94.94%, respectively. This can be compared with other rural wastewater technologies reported in the literature. For example, Yang et al. [7] reported that the mean removal efficiencies of rural decentralized wastewater treatment facilities utilizing an anaerobic-anoxic-oxic membrane bio-reactor (AAO/MBR) were CODCr 72.79%, BOD5 83.81%, TN 75.48%, NH3-N 89.37%, and TP 64.14%, which were higher than our research. The main reason for this may be increasing membrane filtration, which ensures the effective removal of contaminants, as well as differences in the operation of the facilities, which should not be ignored.

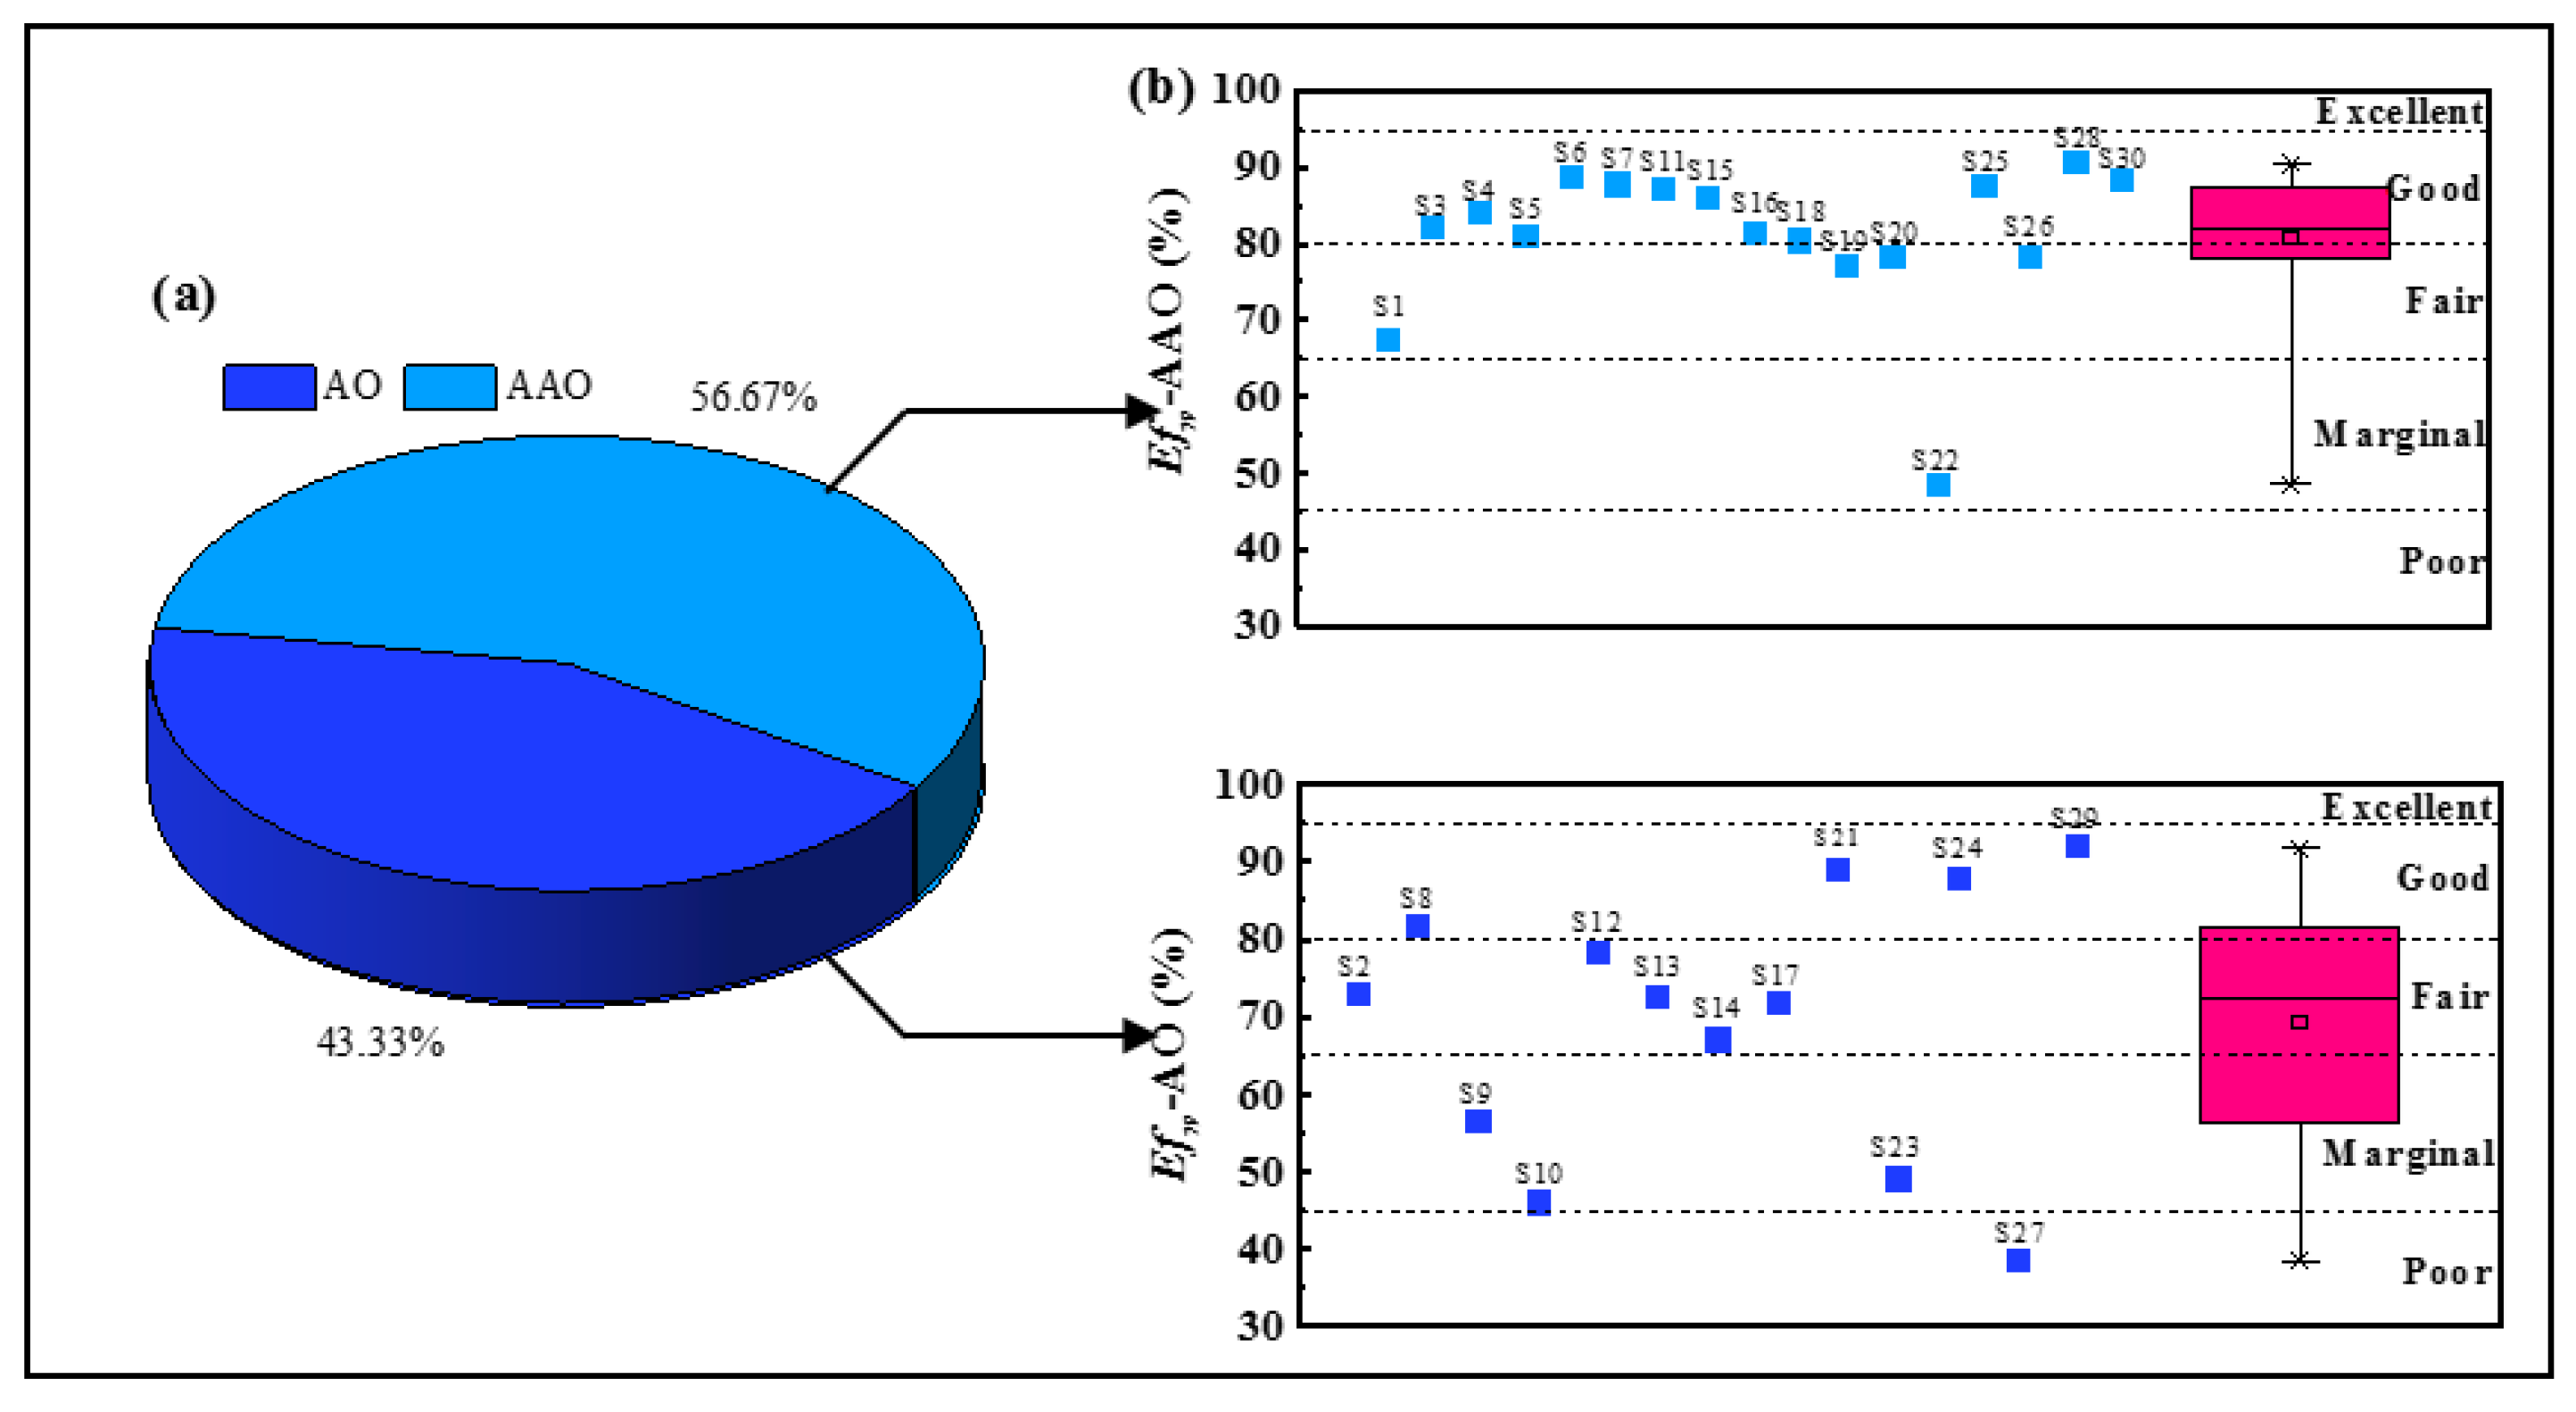
3.3. AO and AAO Treatment Performance

It has been shown that AO processes have poor removal performance in rural domestic wastewater treatment, and AAO processes exhibit high variation in different cases [13]. The differences in performance of the AO and AAO processes may be induced by process design, equipment selection, or simply from differences in operating capacities. In order to further evaluate and compare the performances of the different treatment technologies, the 30 rural DDWT facilities were categorized into two treatment technologies, with 13 facilities utilizing AO and 17 facilities utilizing AAO. The weighted average removal efficiencies of contaminants were calculated to evaluate the differences between the two technologies. According to Bărbulescu and Barbeş [34], the weighted average removal efficiencies of contaminants were classified as Excellent, Good, Fair, Marginal, or Poor if their removal efficiencies were in the intervals of 95–100%, 80–94%, 65–79%, 45–64%, or 0–44%, respectively. As can be observed in Figure 6 and Table S2, twelve rural DDWT facilities were classified as Good, four rural DDWT facilities were classified as Fair, and one rural DDWT facility was classified as Marginal with AAO technology. For the AO process, only four rural DDWT facilities were classified as Good, five rural DDWT facilities were classified as Fair, three rural DDWT facilities were classified as Marginal, and one rural DDWT facility was classified as Poor. This shows that the treatment performance of AAO facilities was generally better than that of AO facilities, which was likely related to the additional anoxic pool in the AAO process resulting in higher removal efficiencies of organic compounds and nutrient matter, which was especially apparent in their excellent denitrification and phosphorus removal abilities.
The interquartile range box represents the data interval that is 50% concentrated (25%~75%), which can show the degree of concentration of the data. As shown in Figure 6, the interquartile range box of the AAO process is lower than that of the AO process, indicating that the water quality status of the rural DDWT facilities using AAO technology was relatively concentrated and consistent, and thus AAO technology has better stability. In addition, the median value of the weighted average removal efficiencies of AAO was 82.02%, higher than that of the AO at 72.48%, further suggesting that rural DDWT facilities treated using the AAO process were better than those using the AO process. Nonetheless, some facilities performed poorly regardless of which process was utilized. In the survey, the performance of the AAO and AO processes was largely influenced by process design and equipment selection. Issues including the design of redundant grit settling equipment, over-configuration of the influent pumps, and inappropriate selection of equipment contribute to inflated system complexity and lead to a series of operational problems. Furthermore, it is widely acknowledged that microorganisms, notably heterotrophic bacteria, are the key to pollutant removal [45]. However, our investigation revealed that the lack of activated sludge and the sparse formation of biofilm on biological carriers led to unhealthy microbial communities, caused by either insufficient COD concentrations or the use of oversized influent pumps and blowers, both of which can hinder microbial growth. This, in turn, was responsible for the poor treatment performance in some facilities.
Although most of the AAO and AO processes exhibited good pollutant removal capabilities in this study, their construction costs can be prohibitively high for economically poor rural areas. Thus, according to the differences in economic conditions, geographical environment, natural resources, and access to technology in various regions, each rural area should formulate a customized policy to maximize wastewater treatment potential [2]. For example, wetland sewage treatment systems may be an affordable alternative for poor areas. These systems are simple to construct, have low basic investment, require no power or personnel management, and have low maintenance costs [46]. On the contrary, for economically developed regions, in order to further improve the removal efficiencies of contaminants, additional constructed wetlands process sections following AO and AAO processes could be an effective method [13]. In addition, the condition of influent and treated effluent discharge should be taken into account [47]. Wastewater arrives at treatment facilities very unevenly, and at night their quantity can be practically equal to zero. Additionally, the requirements for water bodies receiving treated effluent are also different. Thus, the development of DDWT facilities should consider measures suiting local conditions. Similar opinions were also expressed by Starkl et al. [48], who proposed a flexible BAT (best available technologies) approach, which would allow for less strict standards in economically disadvantaged areas.

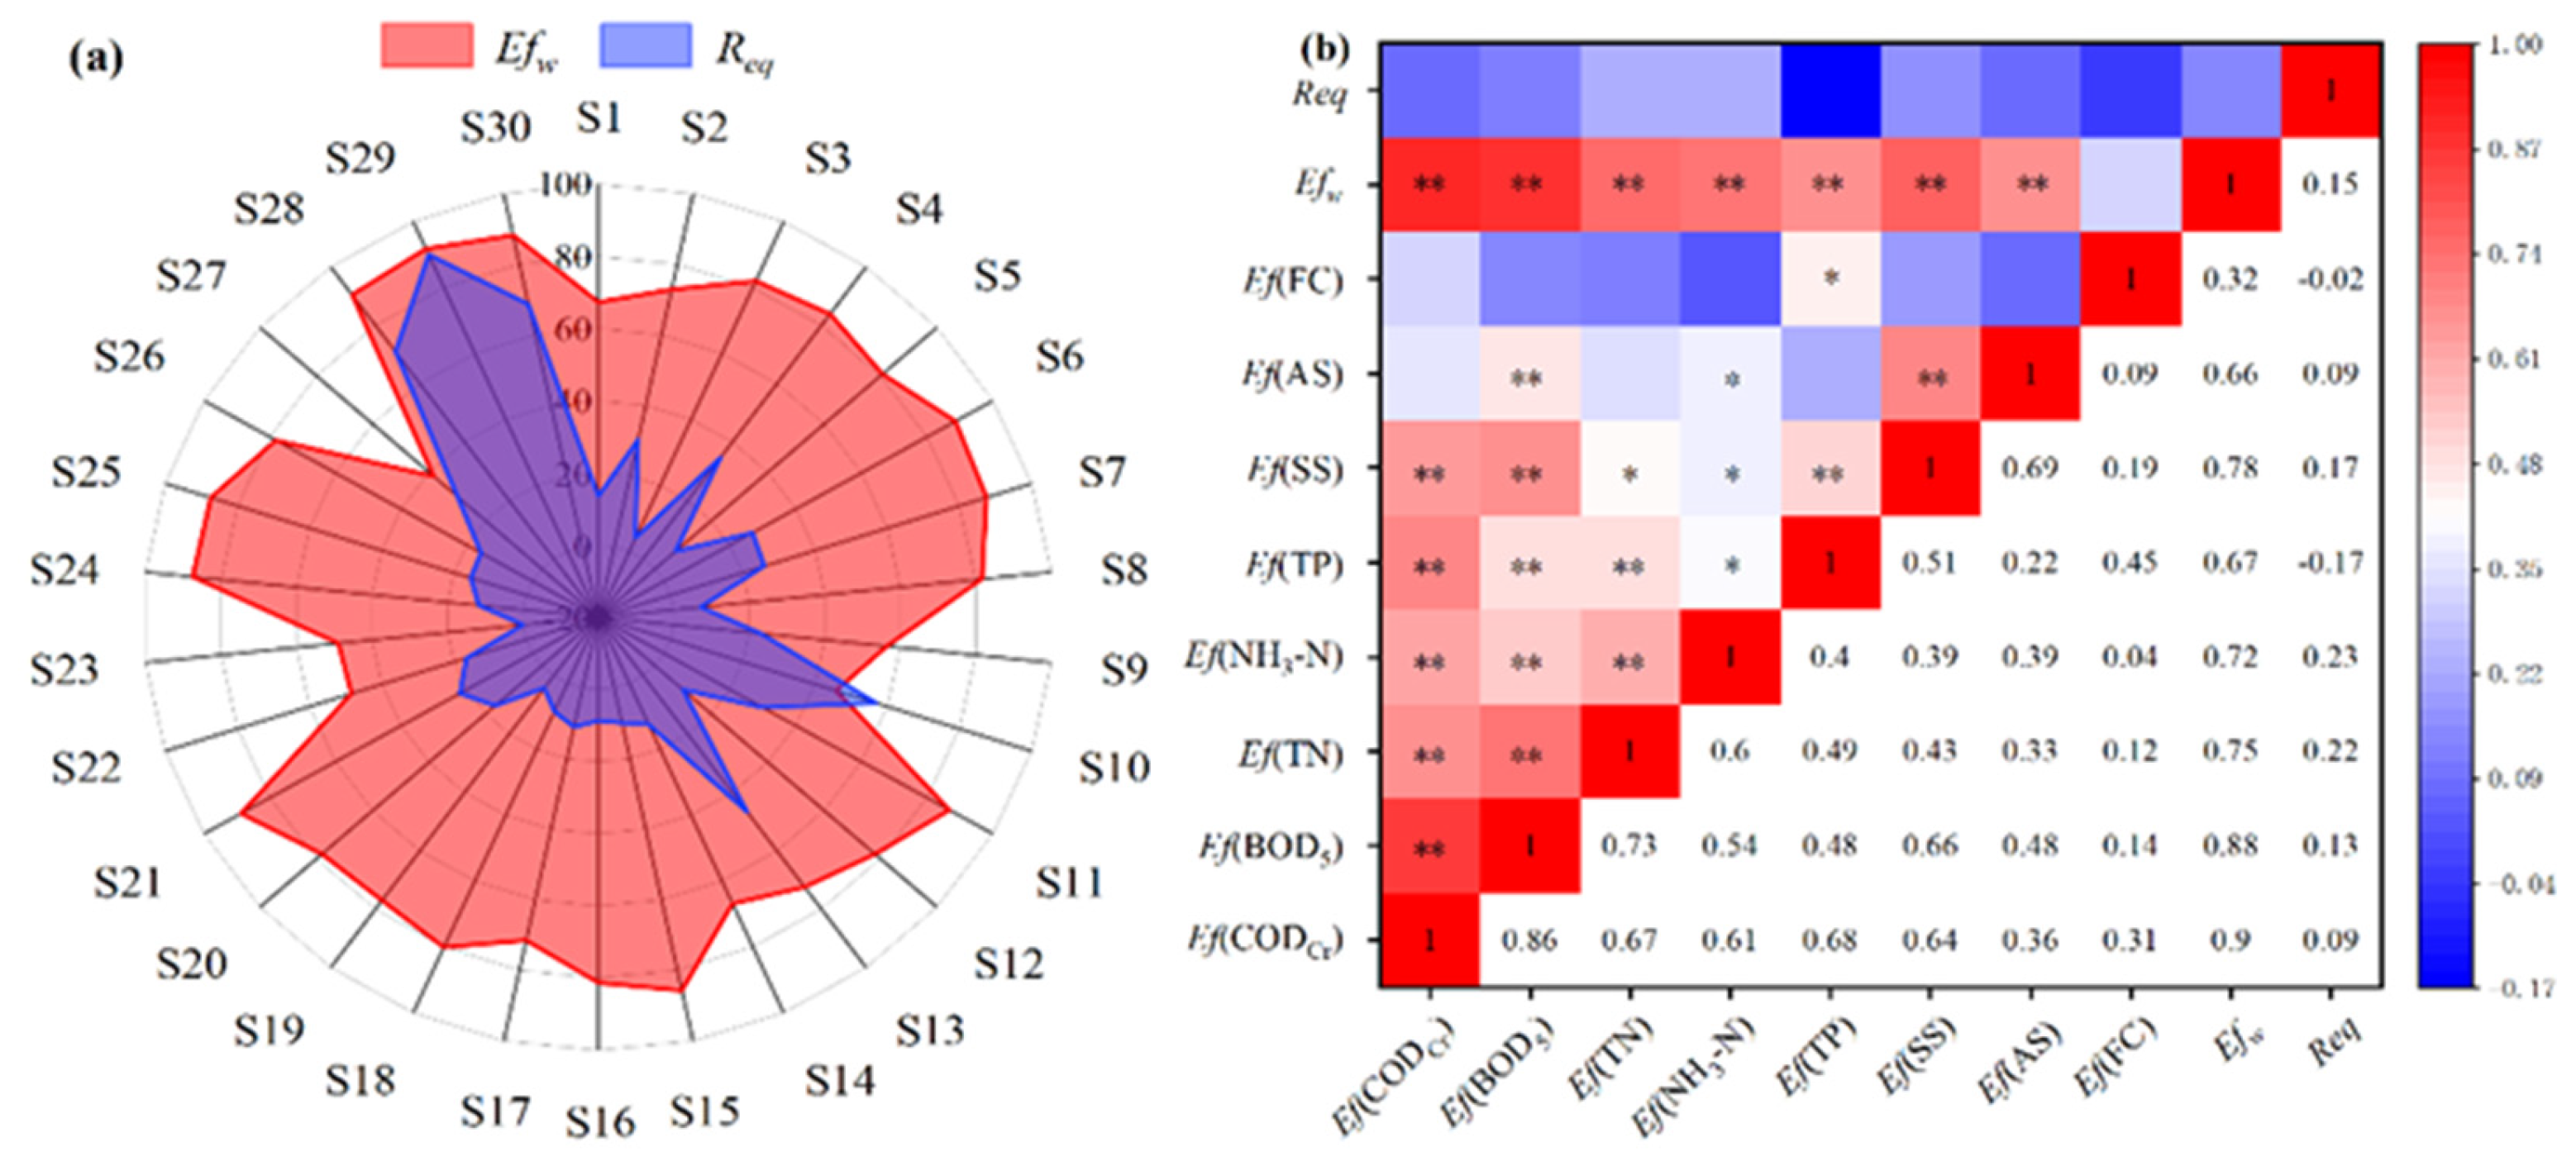
3.4. Equipment Failure Rates of Wastewater Treatment Facilities

The construction of the different rural DDWT facilities was carried out by a number of different construction entities. This means that construction quality was uneven among facilities, inapplicable designs may have been used, and equipment selection was also significantly different. A comprehensive investigation and analysis of all mechanical equipment (in-use equipment and backup equipment) of the sewage treatment facilities, including lifting pumps, stirring pumps, aeration equipment, deodorization equipment, and disinfection equipment, was carried out. As shown in Figure 7, the equipment failure rates at the majority of rural DDWT facilities was less than 20%, which did not affect the normal operation of the facilities because most vital equipment, including lifting pumps, stirring pumps, and aeration equipment in the DDWT facilities had backups. This implies that in the event of a malfunction with a device, the operator is promptly empowered to seamlessly transition to a reliable backup, ensuring uninterrupted functionality. However, it should be noted that the equipment failure rates at S10, S13, S28, S29, and S30 were higher than 50%, and with this level of equipment failure the rural DDWT facilities could no longer operate as designed, and although their effluents still met the discharge standards, this was solely due to low concentrations in the influent water. This clearly demonstrated that evaluating the operational state of a treatment facility according to discharge standards only provides only one side. Furthermore, in this survey, the deodorization equipment and disinfection equipment did not have backups. Frequent incidents included partial destruction of the ultraviolet disinfection lamps and malfunctioning of the disinfectant dosing pump, which potentially caused excessive FC in the effluent. While the damage to the deodorization equipment did not affect the operation of the rural DDWT facilities, it should be closely monitored, as it can lead to air pollution and adversely affect worker health [49].
Furthermore, this study explored the correlations between the removal efficiencies of indicators and the equipment failure rates. It was unsurprising that there were strong correlations between many of these variables, such as E f (CODCr) and E f (BOD5), E f (TN) and E f (NH3-N), E f (TN) and E f (TP), etc. However, there were no significant correlations between R e q and other indicators. This may be explained by the fact that the equipment in the sewage treatment facilities is generally backed up, so even if some equipment breaks, it does not affect the performance of the rural DDWT facility. The backup equipment increased the treatment system resilience, which enables it to prevail against crises generated by poor equipment quality.
Generally speaking, a lack of budget makes continuous operation and regular monitoring impossible in most rural areas, which poses a big challenge for the stable operation of decentralized wastewater treatment facilities. For example, due to lack of budget, some damaged equipment in rural DDWT facilities cannot be repaired in time, and when the backup equipment also fails, the wastewater treatment facility becomes ineffective. Additionally, in order to save on the use of phosphorus removal agents and disinfectants, drug delivery devices are not often operated, which further reduces the effectiveness of rural DDWT facilities. Similar issues also exist in other regions of China; for instance, Ren et al. [11] reported that the rural sewage treatment facilities in the Pinggu District of Beijing run at a rate of lower than 20% due to the lack of appropriate operational control. In recent years, the construction of remote monitoring platforms has become a feasible way to improve the efficiency and reduce the costs of operating and supervising these facilities. One of the benefits of such a platform is that equipment at facilities is monitored in real time and any problems can be identified remotely and responded to accordingly, thus reducing operating costs [15].

4. Conclusions

The performance of the 30 rural DDWT facilities examined in this study exhibited obvious removal efficiency of some contaminants. However, issues in process design, equipment selection, construction, operation, etc. influenced the treatment performance, resulting in a low standard-achieving ratios for class 1A (GB, 18918-2002) for some indicators. Since most rural areas still use urban sewage discharge standards, further research to guide the formulation and revision of standards in rural areas should be conducted. In fact, the issues of operation of DDWT facilities and unclear discharge standards are common in developing countries. Thus, in order to maintain the sustainability of rural DDWT facilities, the management strategies of each country should also be scalable and long-efficient. In regards to the economic and institutional aspects, system operation and maintenance costs and treatment system investment costs should be considered, as well as institutional and political support. In addition, the construction of remote monitoring platforms may be a feasible way to improve efficiency and reduce the costs for operating and supervising these facilities in the future, and therefore should be paid more attention. In conclusion, increasing investment in the management of DDWT facilities is necessary, and the management strategies should also be site-specific and sustainable.

Supplementary Materials

The following supporting information can be downloaded at: https://www.mdpi.com/article/10.3390/w16131901/s1, Figure S1: Schematic diagrams of the AO and AAO treatment technologies; Figure S2: The influent and effluent concentrations of CODCr, BOD5, TN, NH3-N, TP, SS, AS, and FC; Figure S3: Linear regression analysis of influent-effluent concentrations for CODCr, BOD5, TN, NH3-N, TP, SS, AS, and FC; Table S1: Values of the boxplots of the influent and effluent concentrations and the removal efficiencies; Table S2: The weighted average removal efficiency of contaminants computed using 8 parameters (CODCr, BOD5, NH3-N, TN, TP, SS, AS, and FC) with AO and AAO.

Author Contributions

M.L.: Methodology, Data curation, Writing: original draft, Writing: review and editing, Visualization. Z.L.: Resources and Supervision. M.Z.: Data curation. J.L.: Writing: review and editing. Z.T.: Data curation. K.L.: Data curation, Writing: review and editing. All authors have read and agreed to the published version of the manuscript.

Funding

This research was funded by the Energy Bureau of Guangdong Province (grant number GZYL21FC051456 and GZYL20FC04972).

Data Availability Statement

The original contributions presented in the study are included in the article/Supplementary Materials, further inquiries can be directed to the corresponding author/s.

Conflicts of Interest

The authors declare that they have no known competing financial interests or personal relationships that could have appeared to influence the work reported in this paper.

References

  1. Yu, Q.; Liu, R.; Chen, J.; Chen, L. Electrical conductivity in rural domestic sewage: An indication for comprehensive concentrations of influent pollutants and the effectiveness of treatment facilities. Int. Biodeterior. Biodegrad. 2019, 143, 104719. [Google Scholar] [CrossRef]
  2. Shi, Z.; She, Z.; Chiu, Y.-H.; Qin, S.; Zhang, L. Assessment and improvement analysis of economic production, water pollution, and sewage treatment efficiency in China. Socio-Econ. Plan. Sci. 2021, 74, 100956. [Google Scholar] [CrossRef]
  3. Liu, Z. Urban sewage treatment odor gas release characteristics and regional differences. Environ. Technol. Innov. 2021, 21, 101190. [Google Scholar] [CrossRef]
  4. Ministry of Ecology and Environment of the People’s Republic of China. Bulletin on China’s Ecological Environment; Ministry of Ecology and Environment of the People’s Republic of China: Beijing, China, 2020. [Google Scholar]
  5. Ministry of Housing and Urban-Rural Development of the People’s Republic of China. Urban-Rural Construction Statistical Yearbook; Ministry of Housing and Urban-Rural Development of the People’s Republic of China: Beijing, China, 2020. [Google Scholar]
  6. Qu, J.; Dai, X.; Hu, H.-Y.; Huang, X.; Chen, Z.; Li, T.; Cao, Y.; Daigger, G.T. Emerging Trends and Prospects for Municipal Wastewater Management in China. ACS EST Eng. 2022, 2, 323–336. [Google Scholar] [CrossRef]
  7. Yang, F.; Zhang, H.; Zhang, X.; Zhang, Y.; Li, J.; Jin, F.; Zhou, B. Performance analysis and evaluation of the 146 rural decentralized wastewater treatment facilities surrounding the Erhai Lake. J. Clean. Prod. 2021, 315, 128159. [Google Scholar] [CrossRef]
  8. Geetha Varma, V.; Jha, S.; Himesh Karthik Raju, L.; Lalith Kishore, R.; Ranjith, V. A review on decentralized wastewater treatment systems in India. Chemosphere 2022, 300, 134462. [Google Scholar] [CrossRef] [PubMed]
  9. Hube, S.; Wu, B. Mitigation of emerging pollutants and pathogens in decentralized wastewater treatment processes: A review. Sci. Total Environ. 2021, 779, 146545. [Google Scholar] [CrossRef] [PubMed]
  10. Massoud, M.A.; Tarhini, A.; Nasr, J.A. Decentralized approaches to wastewater treatment and management: Applicability in developing countries. J. Environ. Manag. 2009, 90, 652–659. [Google Scholar] [CrossRef] [PubMed]
  11. Ren, G.; Zhou, M.; Zhang, Q.; Xu, X.; Li, Y.; Su, P. A novel stacked flow-through electro-Fenton reactor as decentralized system for the simultaneous removal of pollutants (COD, NH3-N and TP) and disinfection from domestic sewage containing chloride ions. Chem. Eng. J. 2020, 387, 124037. [Google Scholar] [CrossRef]
  12. Singh, A.; Sawant, M.; Kamble, S.J.; Herlekar, M.; Starkl, M.; Aymerich, E.; Kazmi, A. Performance evaluation of a decentralized wastewater treatment system in India. Environ. Sci. Pollut. Res. 2019, 26, 21172–21188. [Google Scholar] [CrossRef] [PubMed]
  13. Sheng, X.; Qiu, S.; Xu, F.; Shi, J.; Song, X.; Yu, Q.; Liu, R.; Chen, L. Management of rural domestic wastewater in a city of Yangtze delta region: Performance and remaining challenges. Bioresour. Technol. Rep. 2020, 11, 100507. [Google Scholar] [CrossRef]
  14. Han, Y.; Ma, J.; Xiao, B.; Huo, X.; Guo, X. New Integrated Self-Refluxing Rotating Biological Contactor for rural sewage treatment. J. Clean. Prod. 2019, 217, 324–334. [Google Scholar] [CrossRef]
  15. Song, X.; Liu, R.; Yu, Q.; Sheng, X.; Chen, L. Management mode construction for operation and supervision of rural sewage treatment facilities: Towards the information-to-intelligence strategy. Bioresour. Technol. Rep. 2020, 11, 100481. [Google Scholar] [CrossRef]
  16. Oliveira, G.A.; Colares, G.S.; Lutterbeck, C.A.; Dell’Osbel, N.; Machado, Ê.L.; Rodrigues, L.R. Floating treatment wetlands in domestic wastewater treatment as a decentralized sanitation alternative. Sci. Total Environ. 2021, 773, 145609. [Google Scholar] [CrossRef] [PubMed]
  17. Capodaglio, A.; Callegari, A.; Cecconet, D.; Molognoni, D. Sustainability of decentralized wastewater treatment technologies. Water Pract. Technol. 2017, 12, 463–477. [Google Scholar] [CrossRef]
  18. Dong, H.-Y.; Qiang, Z.-M.; Wang, W.-D.; Jin, H. Evaluation of rural wastewater treatment processes in a county of eastern China. J. Environ. Monit. 2012, 14, 1906–1913. [Google Scholar] [CrossRef] [PubMed]
  19. Luo, T.; Qi, L.; Yang, Y.Q.; Wang, H.C. Research on technical problems and countermeasures of rural sewage treatment in China. Construct. Sci. Technol. 2017, 1, 45–47. (In Chinese) [Google Scholar] [CrossRef]
  20. Zhang, X.; Ma, G.; Chen, T.; Yan, C.; Chen, Y.; Wang, Q.; Peng, X.; Xu, W.; Hao, T.; Zhang, T.; et al. Towards carbon-neutral biotechnologies for rural wastewater: A review of current treatment processes and future perspectives. J. Water Process Eng. 2024, 58, 104773. [Google Scholar] [CrossRef]
  21. Wang, C.; Feng, B.; Wang, P.; Guo, W.; Li, X.; Gao, H.; Zhang, B.; Chen, J. Revealing factors influencing spatial variation in the quantity and quality of rural domestic sewage discharge across China. Process Saf. Environ. Prot. 2022, 162, 200–210. [Google Scholar] [CrossRef]
  22. Zhang, H.; Li, H.; Gao, D.; Yu, H. Source identification of surface water pollution using multivariate statistics combined with physicochemical and socioeconomic parameters. Sci. Total Environ. 2022, 806, 151274. [Google Scholar] [CrossRef] [PubMed]
  23. Xie, Y.D.; Zhang, Q.H.; Dzakpasu, M.; Zheng, Y.C.; Tian, Y.; Jin, P.K.; Yang, S.J.; Wang, X.C. Towards the formulation of rural sewage discharge standards in China. Sci. Total Environ. 2021, 759, 143533. [Google Scholar] [CrossRef] [PubMed]
  24. HJ 828-2017; Water Quality-Determination of the Chemical Oxygen Demand-Dichromate. Ministry of Environmental Protection of China: Beijing, China, 2017. Available online: https://www.mee.gov.cn/ywgz/fgbz/bz/bzwb/jcffbz/201704/t20170410_409547.shtml (accessed on 26 June 2024). (In Chinese)
  25. HJ 505-2009; Water Quality-Determination of Biochemical Oxygen Demand after 5 Days (BOD5)-Dichromate for Dilution and Seed Method. Ministry of Environmental Protection of China: Beijing, China, 2009. Available online: https://www.mee.gov.cn/ywgz/fgbz/bz/bzwb/jcffbz/200911/t20091106_181277.shtml (accessed on 26 June 2024). (In Chinese)
  26. HJ 636-2012; Water Quality-Determination of Total Nitrogen-Alkaline Potassium Persulfate Digestion UV Spectrophotometric Method. Ministry of Environmental Protection of China: Beijing, China, 2012. Available online: https://www.mee.gov.cn/ywgz/fgbz/bz/bzwb/jcffbz/201203/t20120307_224383.shtml (accessed on 26 June 2024). (In Chinese)
  27. HJ 535-2009; Water Quality-Determination of Ammonia Nitrogen-Nessler’s Reagent Spectrophotometry. Ministry of Environmental Protection of China: Beijing, China, 2009. Available online: https://www.mee.gov.cn/ywgz/fgbz/bz/bzwb/jcffbz/201001/t20100112_184155.shtml (accessed on 26 June 2024). (In Chinese)
  28. GB/T 11893-1989; Water Quality-Determination of the Total Phosphrous-Ammonium Molybdate Spectrophotometric Method. Ministry of Environmental Protection of China: Beijing, China, 1989. (In Chinese)
  29. GB/T 11901-1989; Water Quality-Determination of Suspended Solids-Weight Method. Ministry of Environmental Protection of China: Beijing, China, 1989. (In Chinese)
  30. GB/T 11903-1989; Water Quality-Determination of Chroma. Ministry of Environmental Protection of China: Beijing, China, 1989. (In Chinese)
  31. HJ 1147-2020; Water Quality-Determination of pH-Electrode Method. Ministry of Environmental Protection of China: Beijing, China, 2020. (In Chinese)
  32. GB/T 7494-1987; Water Quality-Determination of Anionic Surfactant-Methylene Blue Spectrophotometry. Ministry of Environmental Protection of China: Beijing, China, 1987. (In Chinese)
  33. HJ 755-2015; Water Quality-Determination of Total Coliform and Fecal Coliform-Fast Paper Method. Ministry of Environmental Protection of China: Beijing, China, 2015. (In Chinese)
  34. Bărbulescu, A.; Barbeş, L. Statistical methods for assessing water quality after treatment on a sequencing batch reactor. Sci. Total Environ. 2021, 752, 141991. [Google Scholar] [CrossRef]
  35. Bascaran, M. Establishment of a methodology for the determination of water quality. Bol. Inf. Medio Ambiente 1979, 9, 30–51. [Google Scholar]
  36. Sutadian, A.D.; Muttil, N.; Yilmaz, A.G.; Perera, B.J.C. Development of river water quality indices—A review. Environ. Monit. Assess. 2015, 188, 58. [Google Scholar] [CrossRef] [PubMed]
  37. Pesce, S.F.; Wunderlin, D.A. Use of water quality indices to verify the impact of Córdoba City (Argentina) on Suquía River. Water Res. 2000, 34, 2915–2926. [Google Scholar] [CrossRef]
  38. Oliveira, J.F.d.; Fia, R.; Fia, F.R.L.; Rodrigues, F.N.; Matos, M.P.d.; Siniscalchi, L.A.B. Principal component analysis as a criterion for monitoring variable organic load of swine wastewater in integrated biological reactors UASB, SABF and HSSF-CW. J. Environ. Manag. 2020, 262, 110386. [Google Scholar] [CrossRef] [PubMed]
  39. Tang, Z.; Liu, M.; Yi, L.; Guo, H.; Ouyang, T.; Yin, H.; Li, M. Source Apportionment and Health Risk Assessment of Heavy Metals in Eastern Guangdong Municipal Solid Waste. Appl. Sci. 2019, 9, 4755. [Google Scholar] [CrossRef]
  40. Guo, X.; Liu, Z.; Chen, M.; Liu, J.; Yang, M. Decentralized wastewater treatment technologies and management in Chinese villages. Front. Environ. Sci. Eng. 2014, 8, 929–936. [Google Scholar] [CrossRef]
  41. Kim, S.; Park, C. Potential of ceramic ultrafiltration membranes for the treatment of anionic surfactants in laundry wastewater for greywater reuse. J. Water Process Eng. 2021, 44, 102373. [Google Scholar] [CrossRef]
  42. Fengle, Y.; Xianzhi, Z.; Jinhua, L.; Hongfeng, Z.; Fangming, J.; Zhou, B. Analysis and evaluation of the treatment and reuse of tailwater: A case study in Erhai Lake. J. Clean. Prod. 2021, 327, 129435. [Google Scholar] [CrossRef]
  43. Bernal, D.; Restrepo, I.; Grueso-Casquete, S. Key criteria for considering decentralization in municipal wastewater management. Heliyon 2021, 7, e06375. [Google Scholar] [CrossRef] [PubMed]
  44. GB 5084-2021; Standards for Irrigation Water Quality. Ministry of Environmental Protection of China: Beijing, China, 2015. (In Chinese)
  45. Sheng, X.; Liu, R.; Chen, L.; Yin, Z.; Zhu, J. Enrichment and application of nitrifying activated sludge in membrane bioreactors. Water Sci. Technol. 2017, 76, 2888–2894. [Google Scholar] [CrossRef] [PubMed]
  46. Li, Z.; Hu, K.; Zhang, X.; Gong, L.; Jiang, Z.; Xing, Y.; Ding, J.; Tian, J.; Huang, J. Distributed treatment of rural environmental wastewater by artificial ecological geographic information system. J. King Saud Univ. Sci. 2022, 34, 101806. [Google Scholar] [CrossRef]
  47. Kolpakova, V.; Yeremeyeva, Y.; Anapyanova, S.; Shevtsov, M.; Utepbergenova, L.; Abdukalikova, G.; Abduova, A.; Sarypbekova, N.; Shakhmov, Z. Design and construction of wastewater treatment facilities for small sewerage facilities. Case Stud. Chem. Environ. Eng. 2024, 9, 100774. [Google Scholar] [CrossRef]
  48. Starkl, M.; Anthony, J.; Aymerich, E.; Brunner, N.; Chubilleau, C.; Das, S.; Ghangrekar, M.M.; Kazmi, A.A.; Philip, L.; Singh, A. Interpreting best available technologies more flexibly: A policy perspective for municipal wastewater management in India and other developing countries. Environ. Impact Assess. Rev. 2018, 71, 132–141. [Google Scholar] [CrossRef]
  49. Li, P.; Li, L.; Wang, Y.; Zheng, T.; Liu, J. Characterization, factors, and UV reduction of airborne bacteria in a rural wastewater treatment station. Sci. Total Environ. 2021, 751, 141811. [Google Scholar] [CrossRef] [PubMed]
Figure 1. Sampling sites of the 30 rural decentralized domestic wastewater treatment facilities.
Water 16 01901 g001
Figure 2. Population and treatment scales of the 30 rural decentralized domestic wastewater treatment facilities.
Water 16 01901 g002
Figure 3. (a) Classification of water quality of the 30 rural decentralized domestic wastewater treatment facilities based on the discharge standard of pollutants for municipal wastewater treatment plants (GB 18918-2002). (b) Percentage of each classification of water quality parameters.
Water 16 01901 g003
Figure 4. The removal efficiency of contaminants.
Water 16 01901 g004
Figure 5. Boxplot of the influent concentrations (a), effluent concentrations (b), and the removal efficiency of contaminants (c).
Water 16 01901 g005
Figure 6. (a) Percentage of AO and AAO treatment processes. (b) A weighted average of the efficiencies ( E f w ) of removing CODCr, BOD5, NH3-N, TN, TP, SS, AS, and FC by AAO and AO processes, and boxplots of the E f w .
Water 16 01901 g006
Figure 7. (a) Distribution of equipment failure rates of the 30 rural decentralized domestic wastewater treatment facilities. (b) Pearson correlation matrix between the removal efficiencies of indicators and the equipment failure rates. Note: * was significantly correlated at the 0.05 level (bilateral); ** was significantly correlated at 0.01 level (bilateral).
Water 16 01901 g007
Table 1. The monitoring methods of wastewater quality indicators.
Wastewater Quality IndicatorMonitoring MethodsReference
CODCrwater quality determination of the chemical oxygen demand: dichromate[24]
BOD5water quality determination of biochemical oxygen demand after 5 days (BOD5): dichromate for dilution and seed method[25]
TNwater quality determination of total nitrogen: alkaline potassium persulfate digestion UV spectrophotometric method[26]
NH3-Nwater quality determination of ammonia nitrogen: Nessler’s reagent spectrophotometry[27]
TPwater quality determination of the total phosphorus: ammonium molybdate spectrophotometric method[28]
SSwater quality determination of suspended solids: weight method[29]
Chromawater quality determination of chroma[30]
pHwater quality determination of pH: electrode method[31];
ASwater quality determination of anionic surfactant: methylene blue spectrophotometry[32]
FCwater quality determination of total coliform and fecal coliform: fast paper method[33]
Table 2. Linear fitting results for regression analysis of the influent concentrations on the effluent concentrations for CODCr, BOD5, TN, NH3-N, TP, SS, AS, and FC.
ContaminantsSlopeInterceptDetermination Coefficient (R2)
CODCr0.108314.74630.2497
BOD50.10735.68620.2340
TN0.18675.67050.4551
NH3-N0.1655−0.41840.3820
TP0.12951.08180.8575
SS0.14236.15830.2173
AS0.2164−0.06440.2089
FC0.002611,675.19730.0251
Disclaimer/Publisher’s Note: The statements, opinions and data contained in all publications are solely those of the individual author(s) and contributor(s) and not of MDPI and/or the editor(s). MDPI and/or the editor(s) disclaim responsibility for any injury to people or property resulting from any ideas, methods, instructions or products referred to in the content.

